the Creative Commons Attribution 4.0 License.
the Creative Commons Attribution 4.0 License.
 | 14 Jun 2024
From simple labels to semantic image segmentation: leveraging citizen science plant photographs for tree species mapping in drone imagery
Salim Soltani
Olga Ferlian
Nico Eisenhauer
Hannes Feilhauer
Teja Kattenborn
Knowledge of plant species distributions is essential for various application fields, such as nature conservation, agriculture, and forestry. Remote sensing data, especially high-resolution orthoimages from unoccupied aerial vehicles (UAVs), paired with novel pattern-recognition methods, such as convolutional neural networks (CNNs), enable accurate mapping (segmentation) of plant species. Training transferable pattern-recognition models for species segmentation across diverse landscapes and data characteristics typically requires extensive training data. Training data are usually derived from labor-intensive field surveys or visual interpretation of remote sensing images. Alternatively, pattern-recognition models could be trained more efficiently with plant photos and labels from citizen science platforms, which include millions of crowd-sourced smartphone photos and the corresponding species labels. However, these pairs of citizen-science-based photographs and simple species labels (one label for the entire image) cannot be used directly for training state-of-the-art segmentation models used for UAV image analysis, which require per-pixel labels for training (also called masks). Here, we overcome the limitation of simple labels of citizen science plant observations with a two-step approach. In the first step, we train CNN-based image classification models using the simple labels and apply them in a moving-window approach over UAV orthoimagery to create segmentation masks. In the second phase, these segmentation masks are used to train state-of-the-art CNN-based image segmentation models with an encoder–decoder structure. We tested the approach on UAV orthoimages acquired in summer and autumn at a test site comprising 10 temperate deciduous tree species in varying mixtures. Several tree species could be mapped with surprising accuracy (mean F1 score =0.47). In homogenous species assemblages, the accuracy increased considerably (mean F1 score =0.55). The results indicate that several tree species can be mapped without generating new training data and by only using preexisting knowledge from citizen science. Moreover, our analysis revealed that the variability in citizen science photographs, with respect to acquisition data and context, facilitates the generation of models that are transferable through the vegetation season. Thus, citizen science data may greatly advance our capacity to monitor hundreds of plant species and, thus, Earth's biodiversity across space and time.
- Article
(27903 KB) - Full-text XML
- Companion paper
- BibTeX
- EndNote


Spatially explicit information on plant species is crucial for various domains and applications, including nature conservation, agriculture, and forestry. For instance, species information is required for the identification of threatened or invasive species, the location of weeds or crops in precision farming, or tree species classification for forest inventories.
Remote sensing has emerged as a promising tool for mapping plant species (Müllerová et al., 2023; Bouguettaya et al., 2022; Fassnacht et al., 2016). Thereby, supervised machine learning algorithms are commonly used to identify species-specific features in spatial, temporal, or spectral patterns of remotely sensed signals (Sun et al., 2021; Maes and Steppe, 2019; Lopatin et al., 2019; Curnick et al., 2021; Wagner, 2021). In recent years, remote sensing imagery from drones, also known as unoccupied air vehicles (UAVs), has emerged as an effective source of information for mapping plant species (Kattenborn et al., 2021; Fassnacht et al., 2016; Schiefer et al., 2020). By means of mosaicking a series of individual image frames, UAVs enable the creation of georeferenced orthoimagery of relatively large areas with extremely high spatial resolution, e.g., in the millimeter or centimeter range. The fine spatial grain of such imagery can reveal distinctive morphological plant features to identify specific plant species. Such plant features include the leaf shape, flowers, branching patterns, or crown structures (Sun et al., 2021; Kattenborn et al., 2019a). An effective way to harness this spatial detail is provided by deep-learning-based pattern-recognition techniques, in particular by convolutional neural networks (CNNs). A series of studies have demonstrated that CNNs allow one to precisely segment plant species' canopies in high-resolution UAV imagery (Kattenborn et al., 2021; Hoeser and Kuenzer, 2020; Brodrick et al., 2019). Such CNN models learn the characteristic spatial features of the target (here, plant species) through a cascade of filter operations (convolutions). Given these high-dimensional computations, efficiently applying these models to UAV orthoimagery, which often have large spatial extents and high resolution, requires training and applying them sequentially using smaller subregions of an orthoimage (e.g., image tiles of 512 pixels × 512 pixels; Fig. 1c).
However, generating models that are transferable across various landscapes and remote sensing data characteristics requires a large number of training data (Kattenborn et al., 2021; Galuszynski et al., 2022). In particular, when neighboring plant species bear a resemblance, a wealth of training data becomes essential, allowing the model to discern the subtle distinctions between these species (Kattenborn et al., 2021; Schiefer et al., 2020). Commonly, the generation of training data is costly, as training data are usually derived from field surveys or visual interpretation of remote sensing images, also known as annotation or labeling. Both methods have limitations. For example, field surveys are often logistically challenged by site accessibility or travel costs. Moreover, they commonly only enable the acquisition of point observations or relative cover fractions of the target species (Leitão et al., 2018). Visual image interpretation is often much more effective (Kattenborn et al., 2019b; Schiefer et al., 2023); however, for some species, precise visual identification of species can be challenging due to subtle indicative morphological features, the variability in these features in the landscape, or the complexity of vegetation communities (e.g., smooth transitions of canopies of different species). Moreover, the representativeness of data derived from field surveys and visual interpretation is often limited to the location and time at which the data were acquired. This can reduce a model's generalizability to new regions or time periods (Cloutier et al., 2023; Kattenborn et al., 2022). Therefore, the number and quality of training data obtained can be critical with respect to the performance and transferability of CNN models (Bayraktar et al., 2020; Rzanny et al., 2019; Brandt et al., 2020).
The challenge of limited training data for UAV-based plant species identification may be alleviated by the collective power of scientists and citizens openly sharing their plant observations on the web (Ivanova and Shashkov, 2021; Fraisl et al., 2022; Di Cecco et al., 2021). A particular data treasure in this regard is generated by citizen science projects for plant species identification. Examples are the iNaturalist and Pl@ntNet projects, which encourage tens of thousands of individuals to capture, share, and annotate photographs of global plant life (Boone and Basille, 2019; Di Cecco et al., 2021). The quantity of such citizen science observations is rapidly growing due to the increasing number of volunteers participating in such projects (Boone and Basille, 2019; Di Cecco et al., 2021).
Currently, the iNaturalist project contains over 26 million globally distributed and annotated photographs of vascular plant species. The iNaturalist platform allows users to identify plant species manually or using a computer vision model integrated into the platform. The submitted observations are then evaluated by the community, and a research-grade classification is assigned if over two-thirds of the community agrees on the species identification. The Pl@ntNet project includes over 20 million observations of globally distributed vascular plants. Pl@ntNet requires users to photograph their observations and select an organ tag (e.g., leaf, flower, fruit, or stem). Pl@ntNet features an image-recognition algorithm to analyze the tagged photograph and suggest a plant species. Pl@ntNet's validation process uses a dynamic approach, combining automated algorithm confidence with community consensus (Joly et al., 2016). The validated observations of iNaturalist and Pl@ntNet are shared via the Global Biodiversity Information Facility (GBIF), a global network that provides open access to biodiversity data (GBIF, 2019).
Citizen-science-based plant photographs with species annotations provide a valuable, large, and continuously growing data source for training pattern-recognition models, such as CNNs (Van Horn et al., 2018; Joly et al., 2016). However, such citizen science data have a cardinal limitation: they only provide a simple species annotation for a plant photograph (the image i shows species j). Hence, these labels enable one to train image classification models that predict the likelihood of a species being present in an image, but they do not specify where the species is present in the image. Ideally, for species-mapping applications, the species labels would delineate the regions or pixels belonging to a species (e.g., the pixels in the right corner of image i represent species j). Such labels (known as masks) could be used to train CNN-based segmentation models, which can predict a species probability for each individual pixel of an image (or tile of an orthoimage) (Galuszynski et al., 2022; Schiefer et al., 2020).
In a pioneering study by Soltani et al. (2022), the limitation of the simple labels that come with citizen science photographs was overcome by a workaround. At first, image classification models were trained with citizen science data and simple labels to predict a species per image. The trained image classification models were then applied sequentially on tiles of UAV-based orthomosaics in a moving-window-like fashion with very high overlap (Fig. 1a). Lastly, the individual predictions derived from the moving-window steps were rasterized to a seamless segmentation map (Fig. 1b). However, this workaround is computationally intense and inefficient for large or multiple UAV orthomosaics, as segmentation maps can only be derived from many overlapping prediction steps. In contrast, the state-of-the-art CNN-based segmentation methods (typically an encoder–decoder structure) used in remote sensing applications are trained with reference data in the form of masks with dimensions (pixels) corresponding to the extent of the input imagery, where each pixel of the mask defines the absence or presence of a class (here, plant species) in the imagery (Kattenborn et al., 2021). Respective segmentation models are more efficient, as they segment multiple classes in a single prediction step. Moreover, they enable more detailed class representations in situations where multiple classes are arranged in complex patterns.
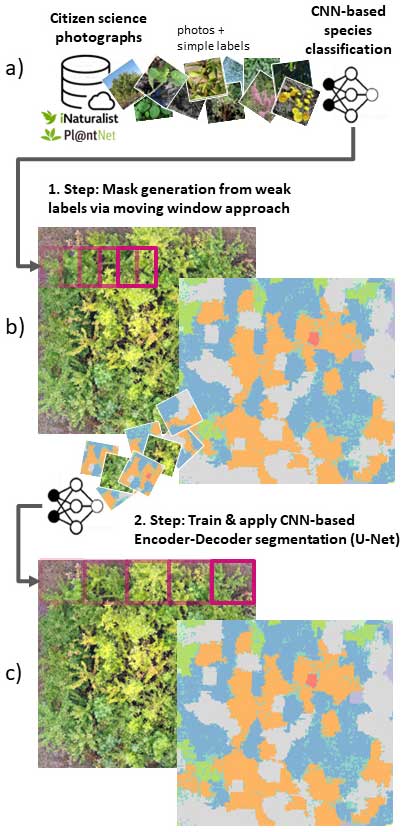
Figure 1Schematic representation of the proposed workflow, including (a, b) the moving-window approach by Soltani et al. (2022) and (c) the use of state-of-the-art encoder–decoder segmentation algorithms. The photographs in panel (a) are sourced from iNaturalist (2023).
Here, we propose a solution to overcome the limitation of simple annotations of citizen science plant observations with a two-step approach. In the first step, we apply the procedure of Soltani et al. (2022), involving CNN-based image classification models trained on citizen science photographs and simple species labels to predict plant species in UAV orthoimages using the moving-window approach described above (Fig. 1a, b). Although computationally demanding, this serves to create segmentation masks for UAV orthoimages. In the second step, these segmentation masks are used to train more efficient CNN-based image segmentation models with an encoder–decoder structure (Fig. 1c). These more efficient models could then be applied to larger spatial extents or to new UAV orthomosaics (e.g., of different sites or time steps).
Hence, the present study addresses the following research questions:
-
Can we harness weak labels from citizen science plant observations to train efficient state-of-the-art semantic segmentation models?
-
Do those segmentation models also increase the accuracy compared with the simple moving-window approach?
These questions are evaluated on a tree species dataset acquired at an experimental site (MyDiv experiment, Bad Lauchstädt, Germany), where 10 temperate deciduous tree species were planted in stratified and complex mixtures. The selection of this location is attributed to its harmonious coexistence of various plant species within a compact area.
2.1 Data acquisition and preprocessing
2.1.1 Study site and drone data acquisition
The MyDiv experimental site is located in Bad Lauchstädt, Saxony-Anhalt, Germany (51°23′ N, 11°53′ E). It comprises 80 plots with different configurations of 10 deciduous tree species, including Acer pseudoplatanus, Aesculus hippocastanum, Betula pendula, Carpinus betulus, Fagus sylvatica, Fraxinus excelsior, Prunus avium, Quercus petraea, Sorbus aucuparia, and Tilia platyphyllos (Ferlian et al., 2018). Each plot measures 12 m × 12 m and contains 140 trees planted at a distance of 1 m from one another (Fig 2). In total, all plots combined accommodate a total of 11 200 individual trees. Each plot contains varying tree species compositions, including one, two, and four tree species. This species variety, the balanced species composition, and plots of different canopy complexity (species mixtures) provide an ideal setting to test the proposed species segmentation approach.
We collected UAV-based RGB aerial imagery over the MyDiv experimental site using a DJI Mavic 2 Pro and the DroneDeploy (version 5.0, USA) flight planning software. Two flights were conducted in 2022 in July and September; July corresponds to the peak of the growing season, whereas September corresponds to the senescence stage (Fig 2). The flight plan was set up with a forward overlap of 90 % and a side overlap of 70 % at an altitude of 16 m (ground sampling distance of approximately 0.22 cm per pixel). We used the generated images and Metashape (version 1.7.6, Agisoft LLC) to create orthoimages for both flight campaigns. Hereafter, the orthoimages for July and September are referred to as OrthoJuly and OrthoSeptember, respectively.
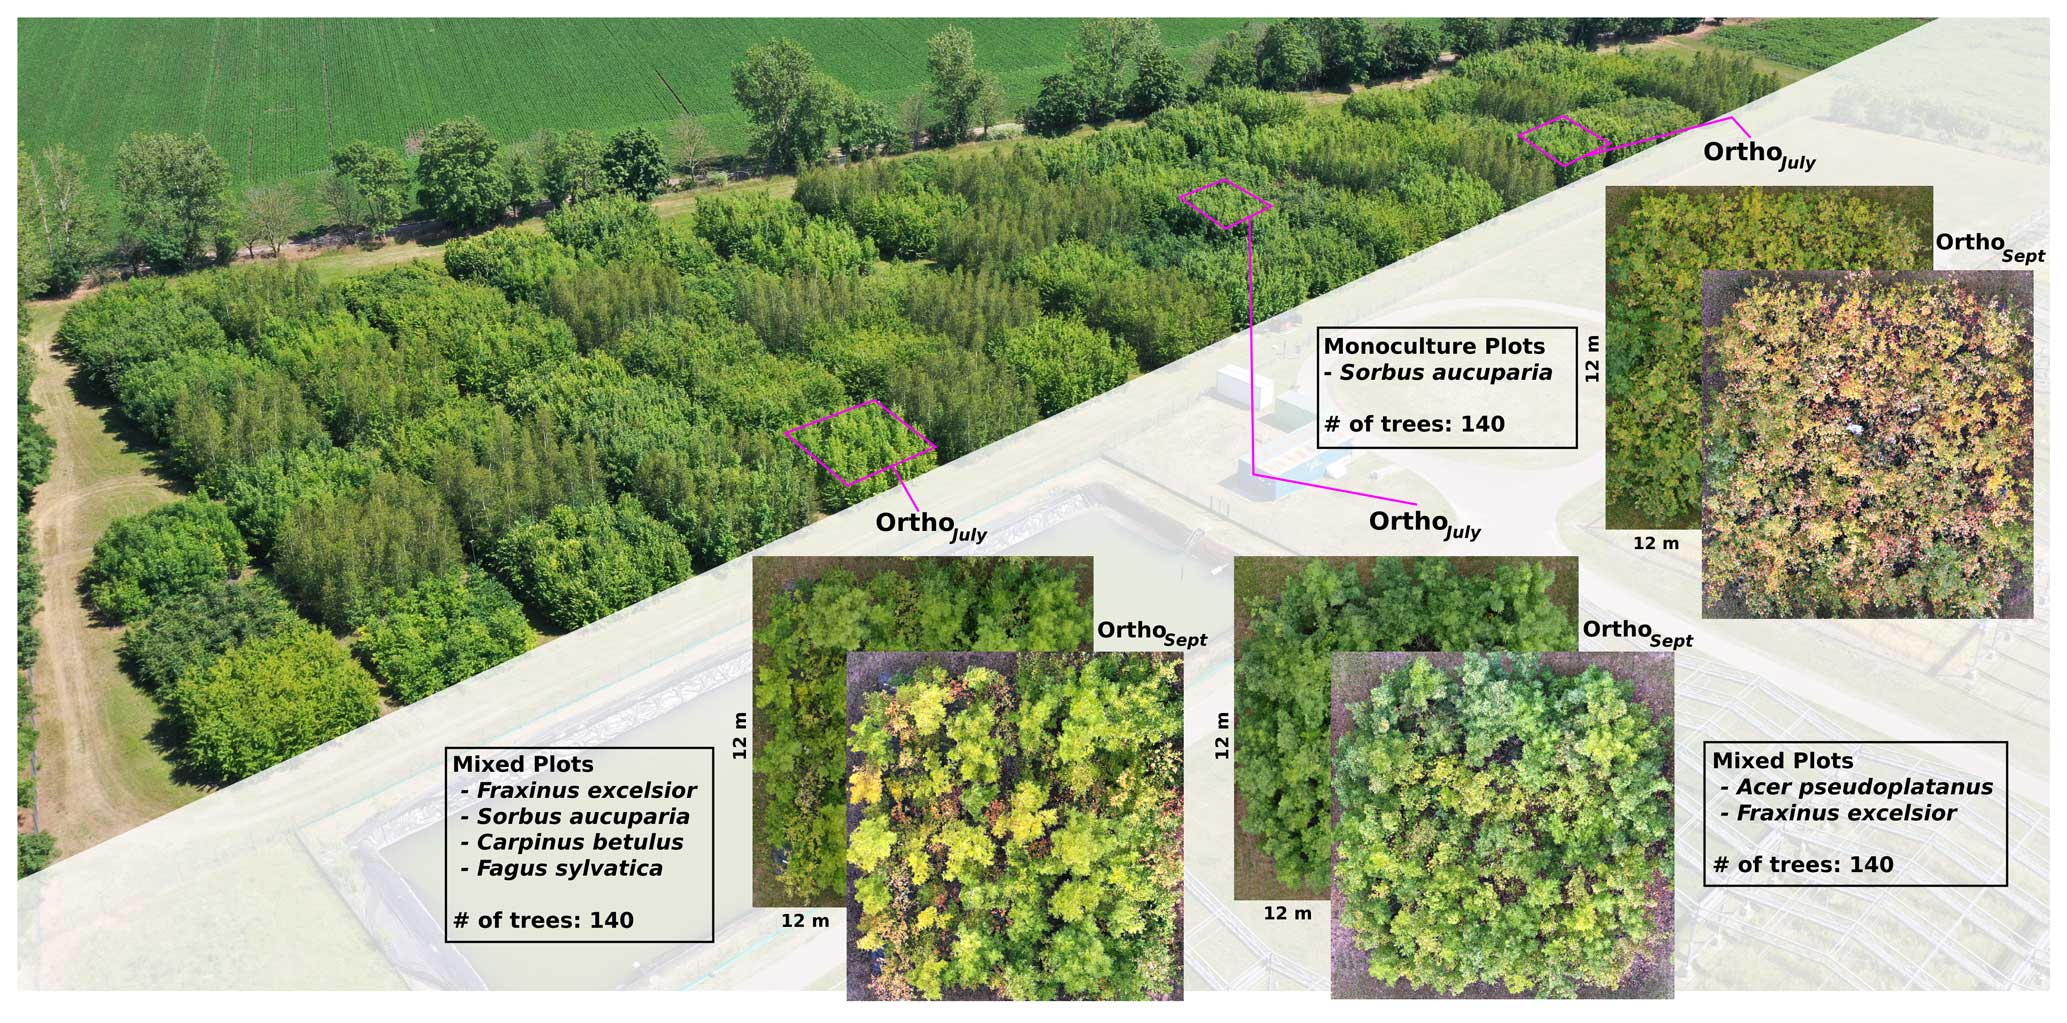
Figure 2Overview of the MyDiv experimental site with close-ups of three plots with different species compositions. The MyDiv site is located at 51.3916° N, 11.8857° E.
To evaluate the performance of the CNN models for tree species mapping, we created reference data by manually delineating the tree species in the UAV orthoimages in QGIS (version 3.32.3). To reduce the workload, we did not delineate the species for the entire plot; rather, they were specified for diagonal transects with a 20 m length and a 2 m width.
2.1.2 Citizen science training data
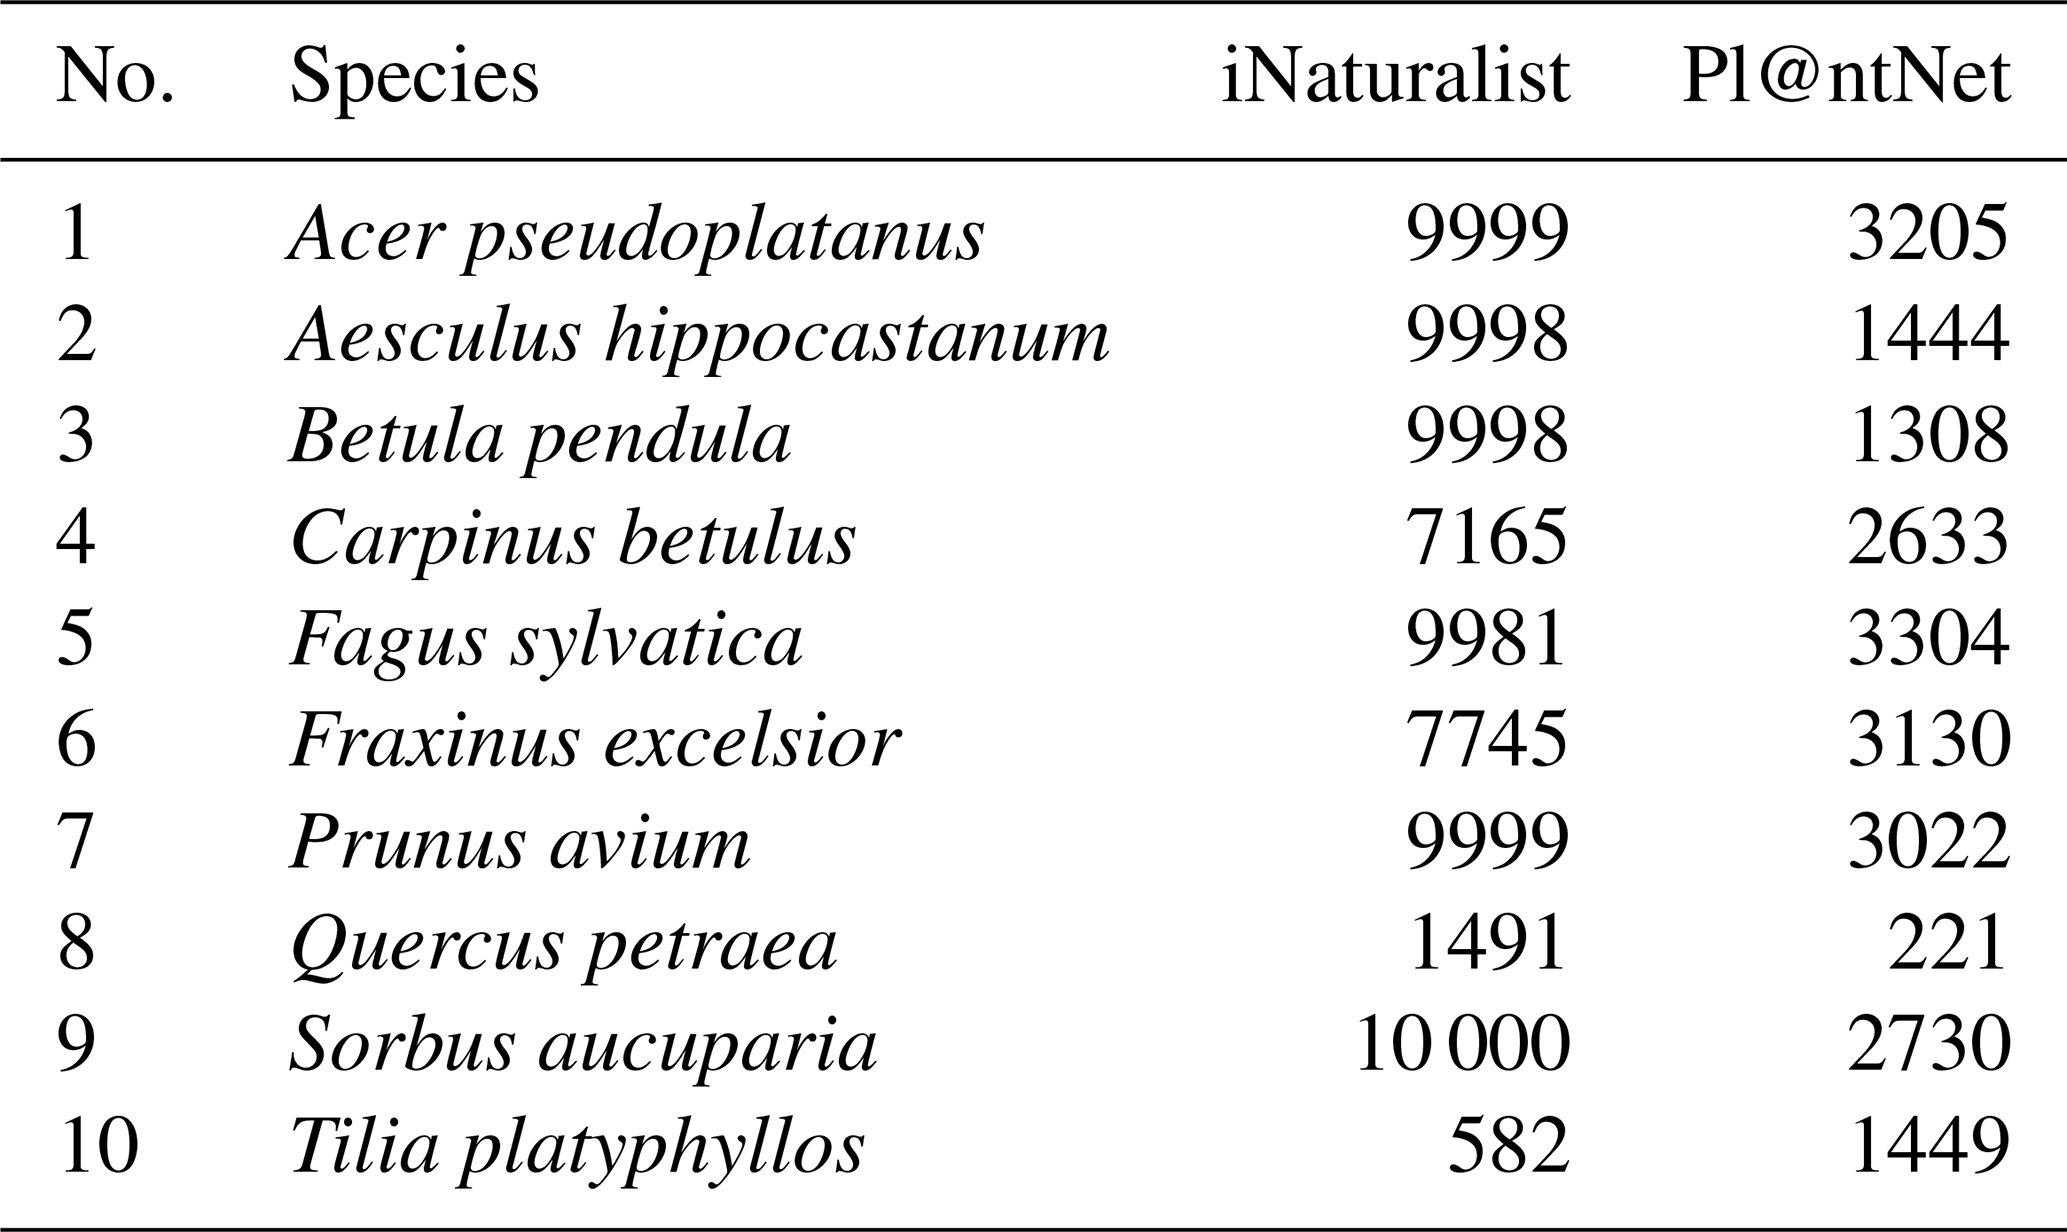
We queried citizen science plant observations of the iNaturalist and Pl@ntNet datasets via the GBIF database for our target tree species using scientific names. For the iNaturalist data, we used the R package rinat (version 0.1.8), an application programming interface (API) for iNaturalist. The Pl@ntNet data for the selected tree species were acquired using the tabulated observation data from GBIF and the integrated uniform resource locators (URLs) for the images. The number of photographs available from iNaturalist and Pl@ntNet varied for the different tree species. Per species, we were able to acquire between 582 and 10 000 photographs (mean 7696) from the iNaturalist dataset and between 221 and 3304 images (mean 2238) from the Pl@ntNet dataset (see Table A1 in the Appendix for details ).
In addition to the tree species, we added a background class to consider canopy gaps between trees. Training data for this background class were obtained using the Google Images API and queries of different keywords, e.g., “grass”, “forest floor”, and “forest ground”. After cleaning the obtained images for nonmeaningful results, the background class included 1100 photographs.
We converted all photographs to a rectangular shape, by cropping them to the shorter side, and resampled them to a common size of 512 pixels × 512 pixels (the tile size used later for the CNN model generation). Figure 3 shows examples of the downloaded photographs for the different tree species and a comparison with their appearance in OrthoJuly.
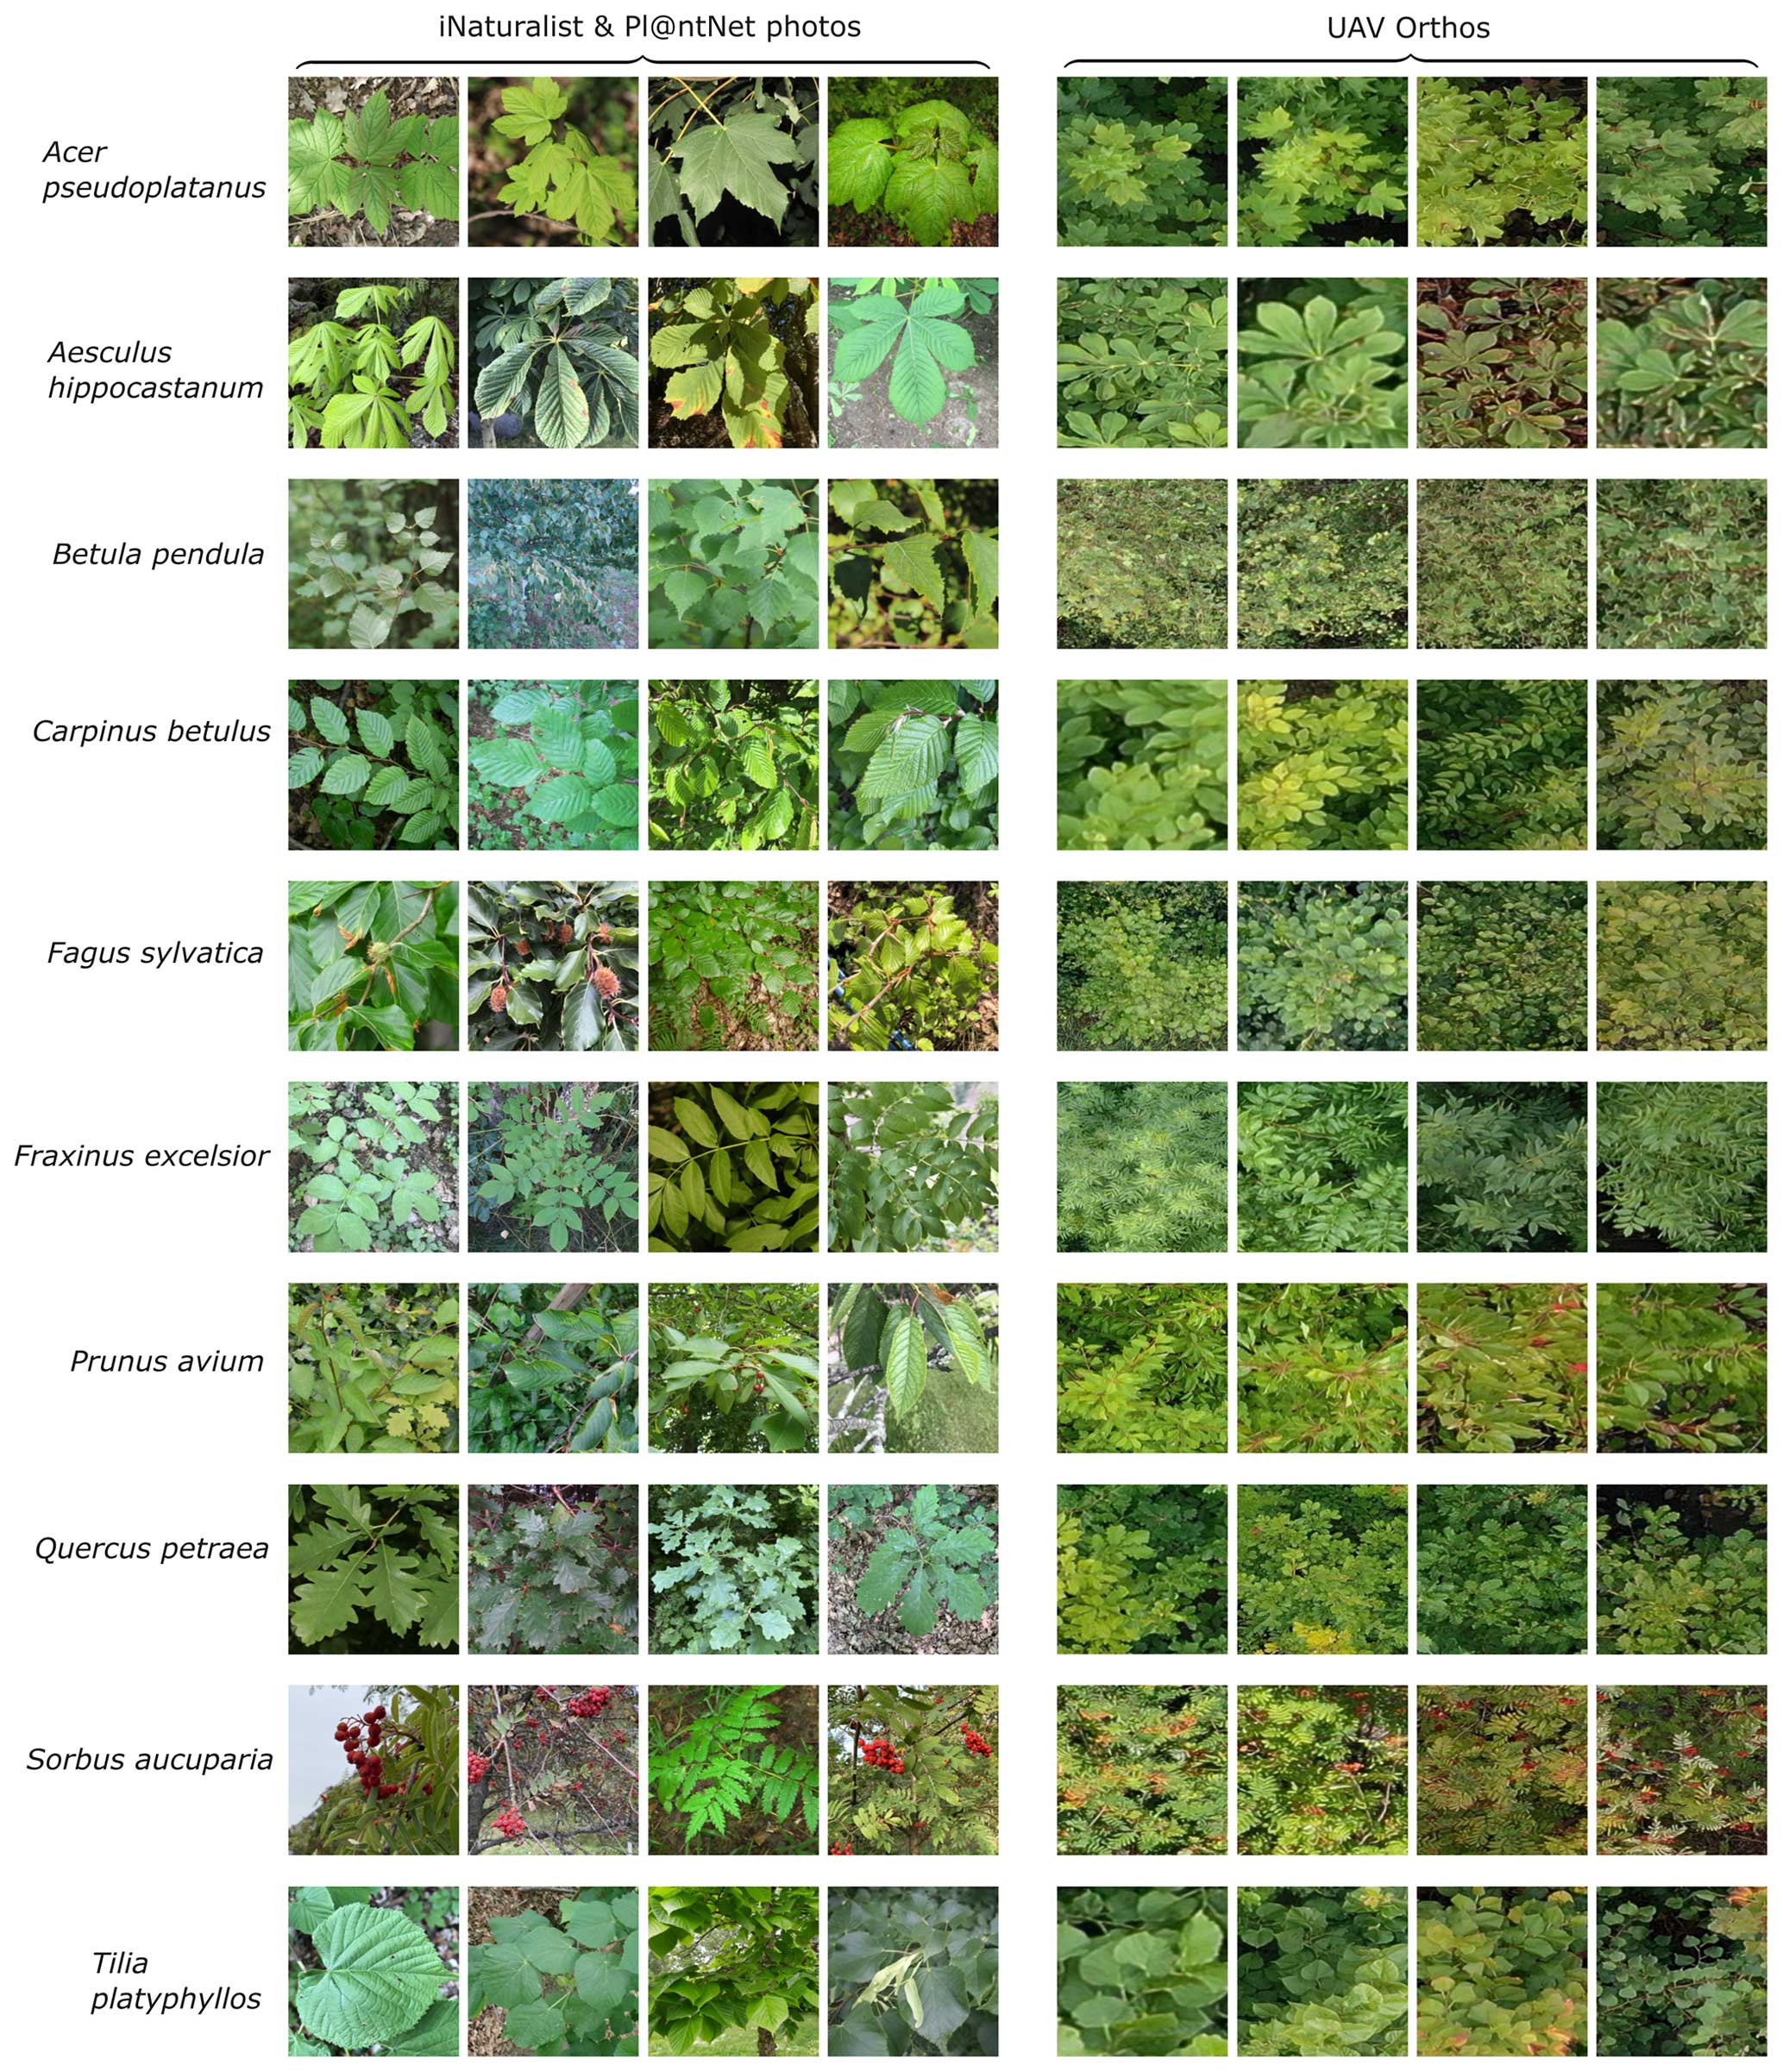
Figure 3Example citizen-science-based photographs derived from iNaturalist and tiles of UAV orthoimages (512 pixels × 512 pixels) for the 10 tree species in the MyDiv experiment. Photographs in the left column are sourced from iNaturalist (2023).
The acquisition settings of citizen science plant photographs are heterogeneous and differ considerably from the typical bird's-eye perspective of UAV orthoimages (Fig. 3). For instance, from the UAV perspective, canopies are mostly viewed from a relatively homogeneous distance, and the photographs represent mostly leaves and other crown components. In contrast, the citizen science data include a lot of close-ups, landscape imagery, or horizontal photographs of trunks. Soltani et al. (2022) demonstrated that species recognition in UAV images can be improved by excluding crowd-sourced photographs that are exceptionally close (e.g., showing individual leaf veins) or too far away from the plant (e.g., landscape images). Therefore, we filtered the citizen-science-based training photos according to the camera–plant distance. Moreover, we filtered photos that exclusively contained tree stems. Because such information is unavailable in the citizen science datasets, we trained CNN-based regression and classification models to predict acquisition distance and tree trunk presence for each downloaded photograph. To train these CNN-based models, we visually estimated the acquisition distance (4500 photographs) and labeled tree trunk presence (1000 photographs). To ease the labeling process, we used previously labeled training data from Soltani et al. (2022) and added 150 additional tree photographs from the tree species present at the MyDiv experimental site.
To evaluate the models with respect to predicting the acquisition distance and trunk presence, we randomly split the citizen-science-based plant photographs into training and validation sets, with 80 % for training and 20 % for validation.
For the distance regression and the trunk classification, we used the EfficientNetB7 backbone (Tan and Le, 2019). For the distance regression, we used the following top-layer settings: global average pooling, batch normalization, drop out (rate 0.1), and a final dense layer with one unit and linear activation function. We used the Adam optimizer (learning rate of 0.0001) and a mean-squared error (MSE) loss function. For the trunk classification, we used the following top-layer settings: global max pooling, a final dense layer with two units, and a softmax activation function. We used the Adam optimizer (learning rate of 0.0001) and the categorical cross-entropy loss function. Both models were trained using a batch size of 20 and 50 epochs.
We used the model with the lowest loss from these epochs (details on the model performance are given in Appendix A3) to predict the acquisition distance and tree trunk presence in all downloaded photographs for our target species. We filtered training photographs prior to training CNN-based species classification (see Sect. 2.2) with acquisition distances less than 0.2 m and greater than 15 m as well as photographs classified as trunk (probability threshold of 0.5). Following this process, 82 628 of the 101 574 downloaded citizen science photographs remained.
2.2 CNN-based creation of plant species segmentation masks using a moving-window approach
The segmentation masks were obtained using a CNN image classification model trained on crowd-sourced plant photographs and simple species labels using a moving-window method (hereafter CNNwindow; Fig. 1b). Based on the results of previous studies, we chose a generic image size of 512 pixels × 512 pixels for the CNN classification model (Schiefer et al., 2020; Soltani et al., 2022). Using the moving-window approach, the orthoimage is sequentially cropped into tiles of 512 pixels × 512 pixels; the image classification is then applied to these tiles to predict the species for each location. This procedure is applied with a dense overlap between tiles defined by a step size, resulting in a dense, regular grid of species predictions. We chose a vertical and horizontal distance of 51 pixels as the step size. The resulting predictions were then rasterized to a continuous species distribution grid with a spatial resolution of 8.31 cm per pixel (see Soltani et al., 2022, for details). The CNNwindow model was implemented as a classification task with 11 classes, including the 10 tree species and the background class.
The number of available photographs varied widely across tree species (see Sect. 2.1.2), potentially biasing the model towards classes with more photographs. To address this imbalance, we equally sampled 4000 photographs for each class with replacement. Sampling with replacement randomly duplicates the existing photographs for underrepresented classes – in this case, classes with fewer than 4000 photographs. We applied data augmentation to increase the variance of the duplicated images. The augmentation consisted of random vertical and horizontal flips, random brightness with a maximum delta of 10 % (±0.1), and contrast alteration within a range of 90 % to 110 % (0.9 to 1.1) of training photographs. We randomly partitioned the training data into validation and training sets to ensure unbiased evaluation. From the training set, we allocated a holdout of 20 % for model selection, while the remaining 80 % was used for model training. Subsequently, we assessed the accuracy of the selected model using the validation set.
After testing different architectures as model backbones, including ResNet50V2, EfficientNetB07, and EfficientNetV2L, we selected EfficientNetV2L because it resulted in the highest classification accuracies. The following layers were added on top of the EfficientNetV2L backbone: dropout with a ratio of 0.5, average pooling, dropout with a ratio of 0.5, a dense layer with 128 units, L2 kernel regularizer (0.001), a rectified linear unit (ReLU) activation function, and a final dense layer with a softmax activation function and 11 units (corresponding to the 10 tree species and the background class). We used root-mean-square propagation (RMSprop) as the optimizer with a learning rate of 0.0001 and categorical cross-entropy as a loss function. We trained the configured model with a batch size of 15 over 150 epochs. The model with the lowest loss (based on the 20 % holdout) was selected as the final model. This model was used to predict the tree species (probabilities) in the UAV orthoimages using the abovementioned CNNwindow method (Fig. 1b). To filter uncertain predictions (predominantly in canopy gaps or at crown shadows), we only considered a tree species as predicted above a threshold higher than 0.6; otherwise, it was assigned to NA (not available), which accounted for approximately 7.8 % of the UAV orthoimages. To smooth the predictions and remove noise, we applied a sieve operation on the output of the CNNwindow (threshold =50, considering horizontal, vertical, and diagonal neighbors, using the R package terra, version 1.7).
2.3 CNN-based plant species segmentation using an encoder–decoder architecture
As the encoder–decoder segmentation architecture (hereafter CNNsegment), we chose U-Net (Ronneberger et al., 2015), which is the most widely applied segmentation method in remote sensing image segmentation (Kattenborn et al., 2021). The U-Net architecture is a CNN-based algorithm that performs semantic segmentation by predicting a class for each pixel of the input image. The architecture consists of an encoder–decoder structure with skip connections. The configured architecture has four levels of convolutional blocks. Each convolutional block consists of two convolutional layers and is followed by batch normalization and ReLU activation. The encoder gradually compresses feature maps and reduces their spatial dimensions via max pooling operations, while the decoder increases the feature map resolution by transposed convolution. The encoder and decoder blocks are connected through skip connections, which transfer the spatial context of the encoder feature maps to the decoder, enabling a segmentation at the resolution of the input imagery in the last layer. The final layer has 11 units (corresponding to the 10 tree species and a background class). A corresponding softmax activation function maps the features to class probabilities. Using a max function, the pixels of the segmentation output are assigned to the class with the highest probability (Fig. A12).
The segmentation masks for training CNNsegment were obtained from the predictions of the CNNwindow method applied to both UAV orthoimages (OrthoJuly and OrthoSeptember; Sect. 2.2). At first, we resampled the CNNwindow prediction maps to the original spatial resolution of the orthoimages (0.22 cm pixel size). Afterward, we cropped the orthoimages and the prediction maps into nonoverlapping tiles, each with a size of 512 pixels × 512 pixels, resulting in a total of 44 980 and 37 113 tiles from OrthoJuly and OrthoSeptember, respectively.
The training data obtained from the CNNwindow approach were filtered to avoid training the CNNsegment model with uncertain predictions. Thereby, we assumed that predictions for a tile are uncertain when the model predicts multiple classes with low relative cover. Thus, after initial tests, we included only those tiles in which the cover of at least one class exceeded 30 %. The number of training tiles per class after filtering varied between 1257 and 16 894 samples: Acer pseudoplatanus (6581), Aesculus hippocastanum (2054), Betula pendula (4955), Carpinus betulus (1535), Fagus sylvatica (16 894), Fraxinus excelsior (7901), Prunus avium (1257), Quercus petraea (1302), Sorbus aucuparia (5473), Tilia platyphyllos (1982), and background (5408).
Similar to the previous CNNwindow classification task, the availability of training tiles varied greatly across the tree species. This class imbalance may have partially stemmed from the more systematic misclassification of certain classes during the CNNwindow prediction. To reduce the unfavorable effects of a class imbalance on model training, we sampled 4000 tiles per class with replacement (similar to the CNNwindow procedure). We applied the same data augmentation strategy as that used for the CNNwindow workflow to increase variance among duplicates. A total of 20 % of the training data were withheld for model selection.
We trained the U-Net architecture (CNNsegment) using RMSprop as the optimizer with a learning rate of 0.0001 and an adapted Dice loss function. We adapted the Dice loss to ignore the weights coming from pixels with NA mask values. The models were trained with a batch size of 20 over 150 epochs.
The CNNsegment was then applied to OrthoJuly and OrthoSeptember. To reduce uncertain predictions of CNNsegment, we assigned the pixels where predicted probabilities for any of the tree species did not exceed 30 % to the background class. Thereby, we assumed that uncertain predictions predominantly occur in canopy gaps. As image segmentation typically suffers from increased uncertainty at tile edges, we repeated the predictions with horizontal and vertical shifts of 256 pixels, which were subsequently aggregated using a majority vote.
The final model performance of CNNsegment was assessed and compared to CNNwindow using the independent reference data (transects) obtained from the visual interpretation of the UAV orthoimages.
For the CNNwindow method, F1 scores differed considerably across the tree species, although these differences were relatively consistent across the two orthoimages, i.e., OrthoJuly and OrthoSeptember (Fig. 4a, b). At the plot level, comparably high model performance (mean F1 >0.6) was found for Acer pseudoplatanus and Fraxinus excelsior; followed by intermediate performance (mean F1 score 0.35–0.55) for Aesculus hippocastanum, Sorbus aucuparia, Tilia platyphyllos, Betula pendula, and Carpinus betulus; and low performance (mean F1 score <0.35) for Quercus petraea, Fagus sylvatica, and Prunus avium. Averaged across species, there was a slight decrease in model performance from OrthoJuly, with a mean F1 score of 0.44, to OrthoSeptember, with a mean F1 score of 0.4 (Fig. 4a, b). Note that OrthoJuly corresponded to the peak of the season, where leaves and canopies were still fully developed.
The CNNsegment model performance across species was similar but generally higher compared with the CNNwindow method. For OrthoJuly, F1 scores increased from 0.44 to 0.48 (Fig. 4a vs. c), while F1 scores increased from 0.40 to 0.46 for OrthoSeptember (Fig. 4b vs. d).
We observed notable differences in model performance (mean F1) across different species mixtures: plots with one, two, or four species per plot (Fig. 5). For both CNNwindow and CNNsegment, the model performance strongly increased for a lower number of species per plot (Fig. A13; the results for CNNwindow are given in the Appendix).
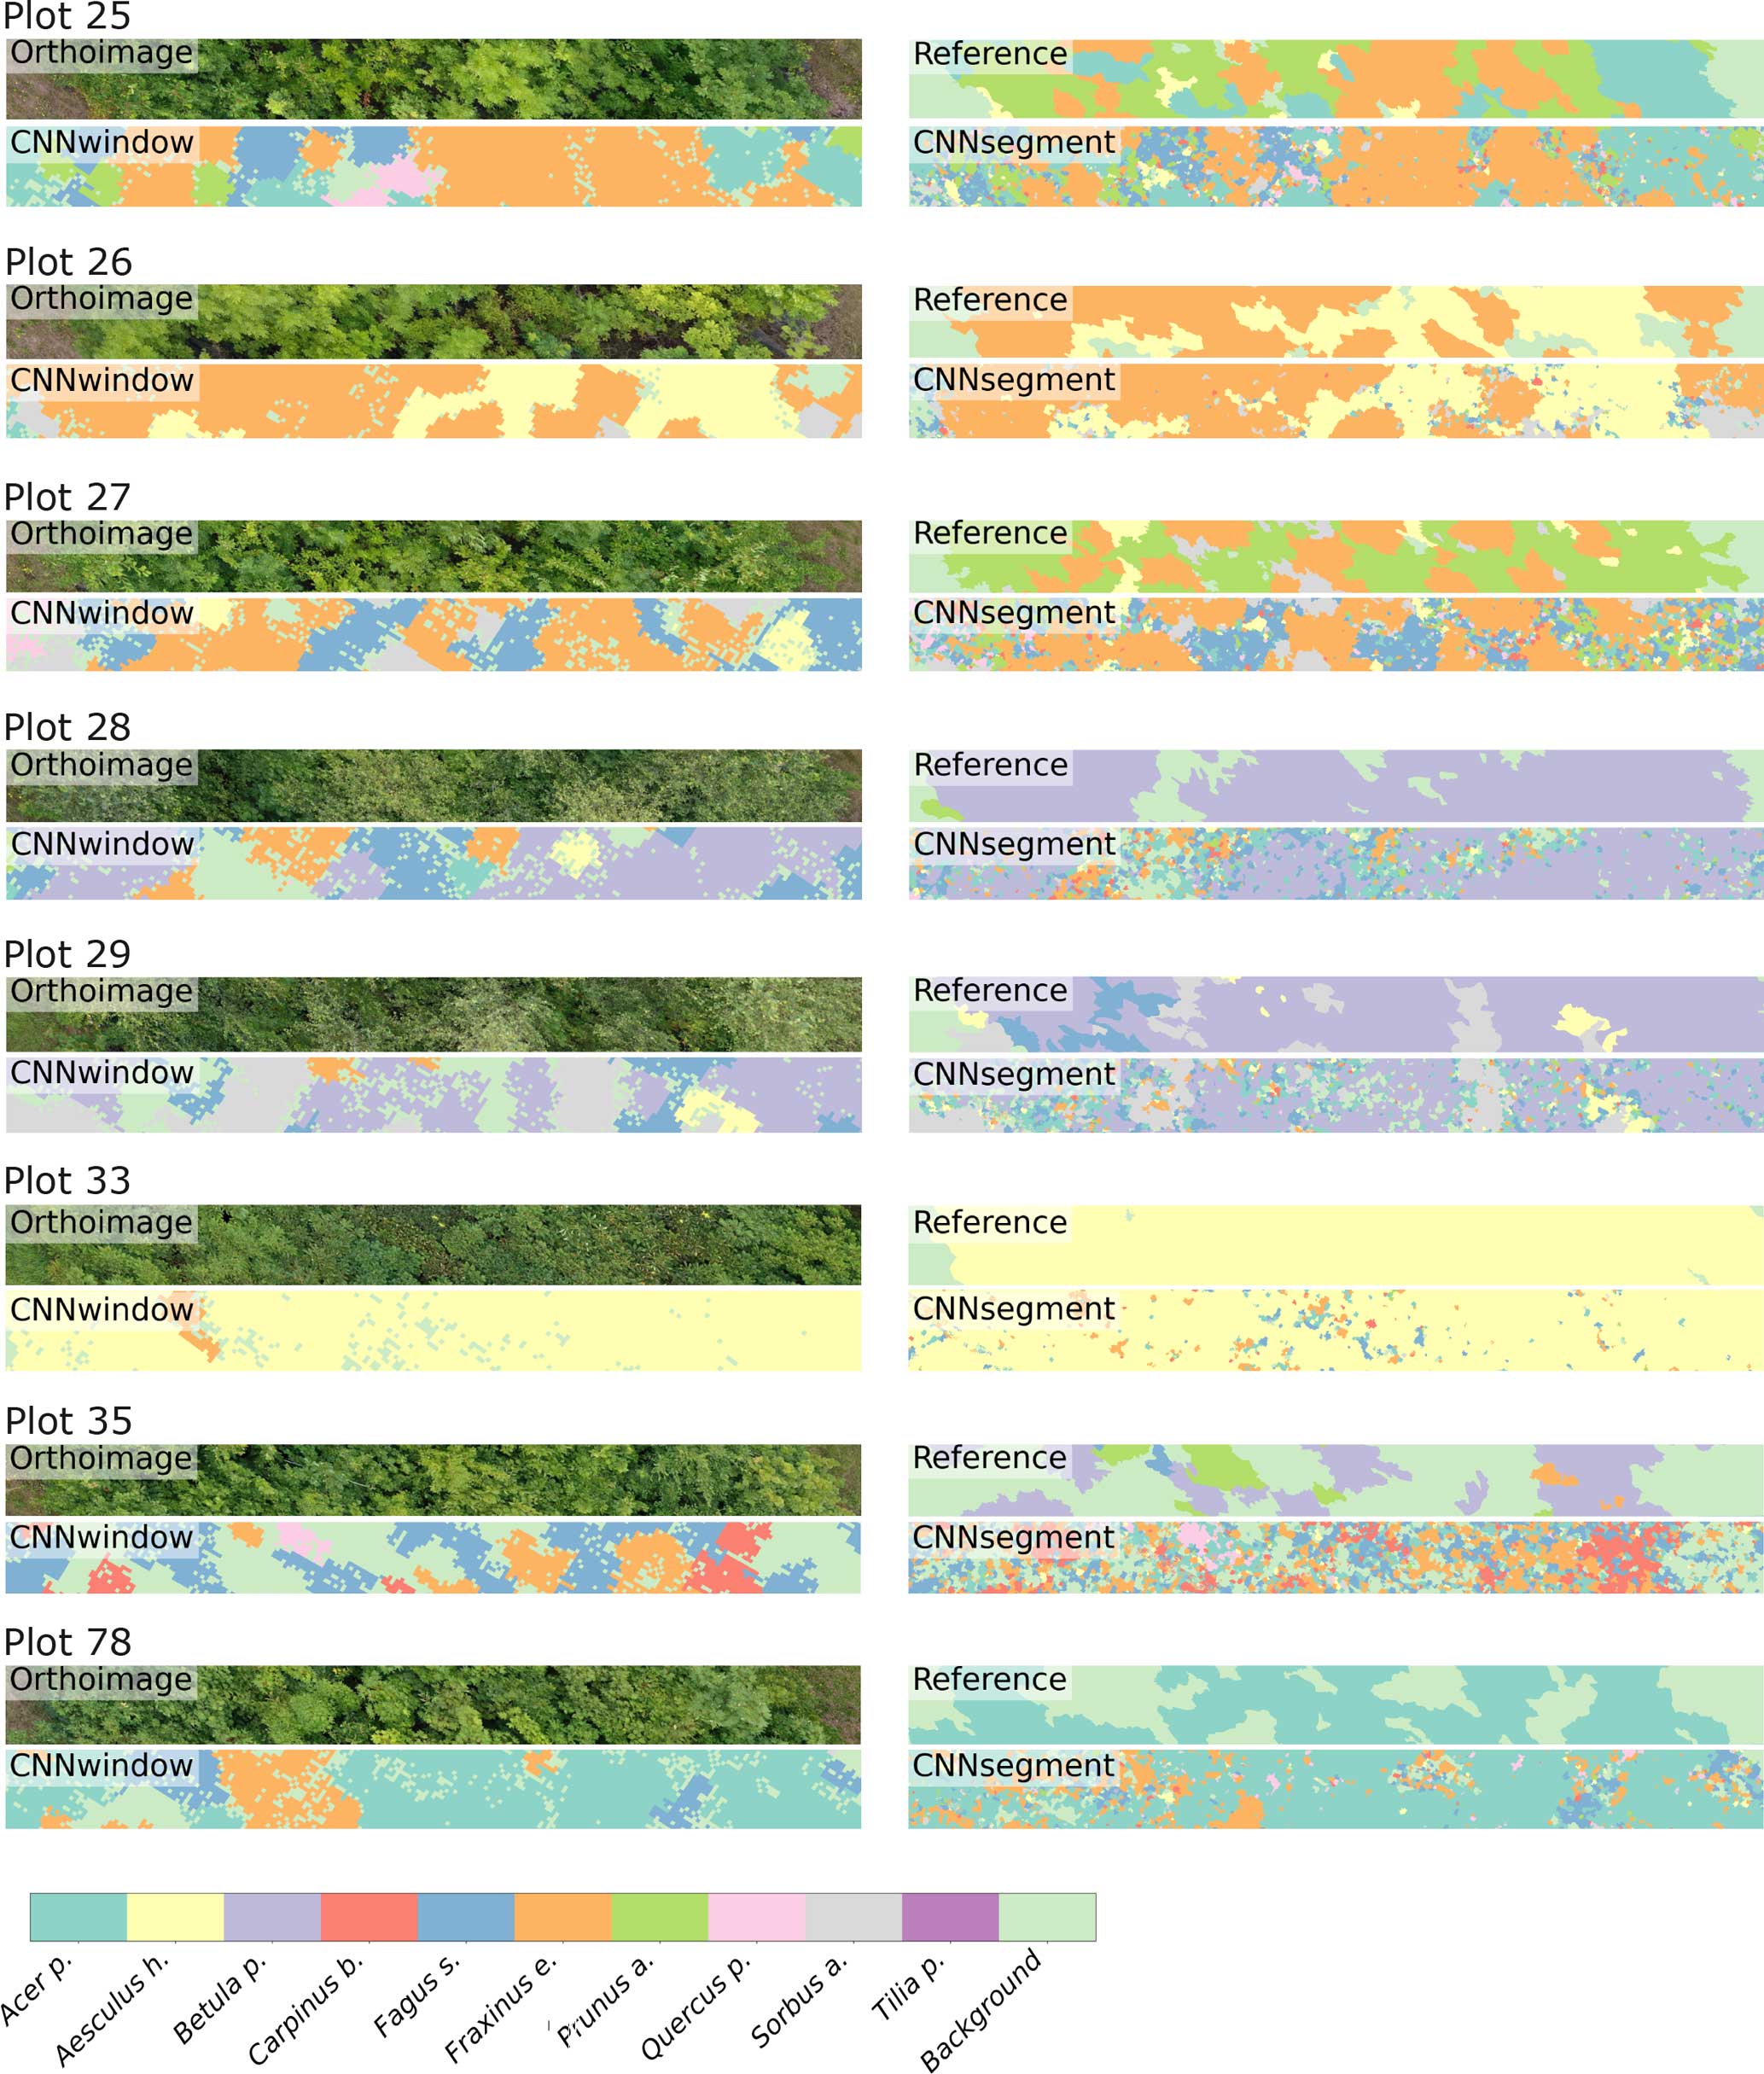
The model performance of CNNsegment exceeded the model performance of CNNwindow, particularly in plots with an increased number of species: for monocultures, the relative increase in model performance (F1 score) amounted to 2.5 %; for two species plots, the relative increase in model performance amounted to 6.9 %; and in plots with four species, the relative increase in model performance amounted to 20.9 % (averaged for OrthoJuly and OrthoSeptember). This increased performance can be attributed to the advantages of the encoder–decoder principle of the CNNsegment method, enabling a pixel-wise and contextual prediction at the original resolution of the orthomosaics. These advantages are also visible in Fig. 6, where CNNsegment resulted in more detailed and accurate tree species segmentation (particularly for plots 26 and 29).
The highest model performance for CNNsegment was found in monoculture plots, where F1 scores >0.5 were found for 8 out of 10 species for both OrthoJuly and OrthoSeptember. A considerably lower performance for the July and September acquisition was found for Prunus avium, which may correspond to similarities in leaf and canopy structure with Fagus sylvatica and Fraxinus excelsior (a confusion matrix is given Fig. A11 in the Appendix). The decreased performance for Carpinus betulus and Prunus avium in OrthoSeptember can be attributed to the very advanced senescence and leaf loss.
In addition to the increase in model performance, our analysis revealed that the prediction on orthoimagery using CNNsegment only required 10 % of the computation time compared with CNNwindow. The duration of applying the models to the whole MyDiv orthomosaics covering an area of (3.02 ha; 0.22 cm ground sampling distance) took approximately 27.05 h with CNNsegment and 264.88 h with CNNwindow (NVIDIA A6000 with 48 GB RAM).
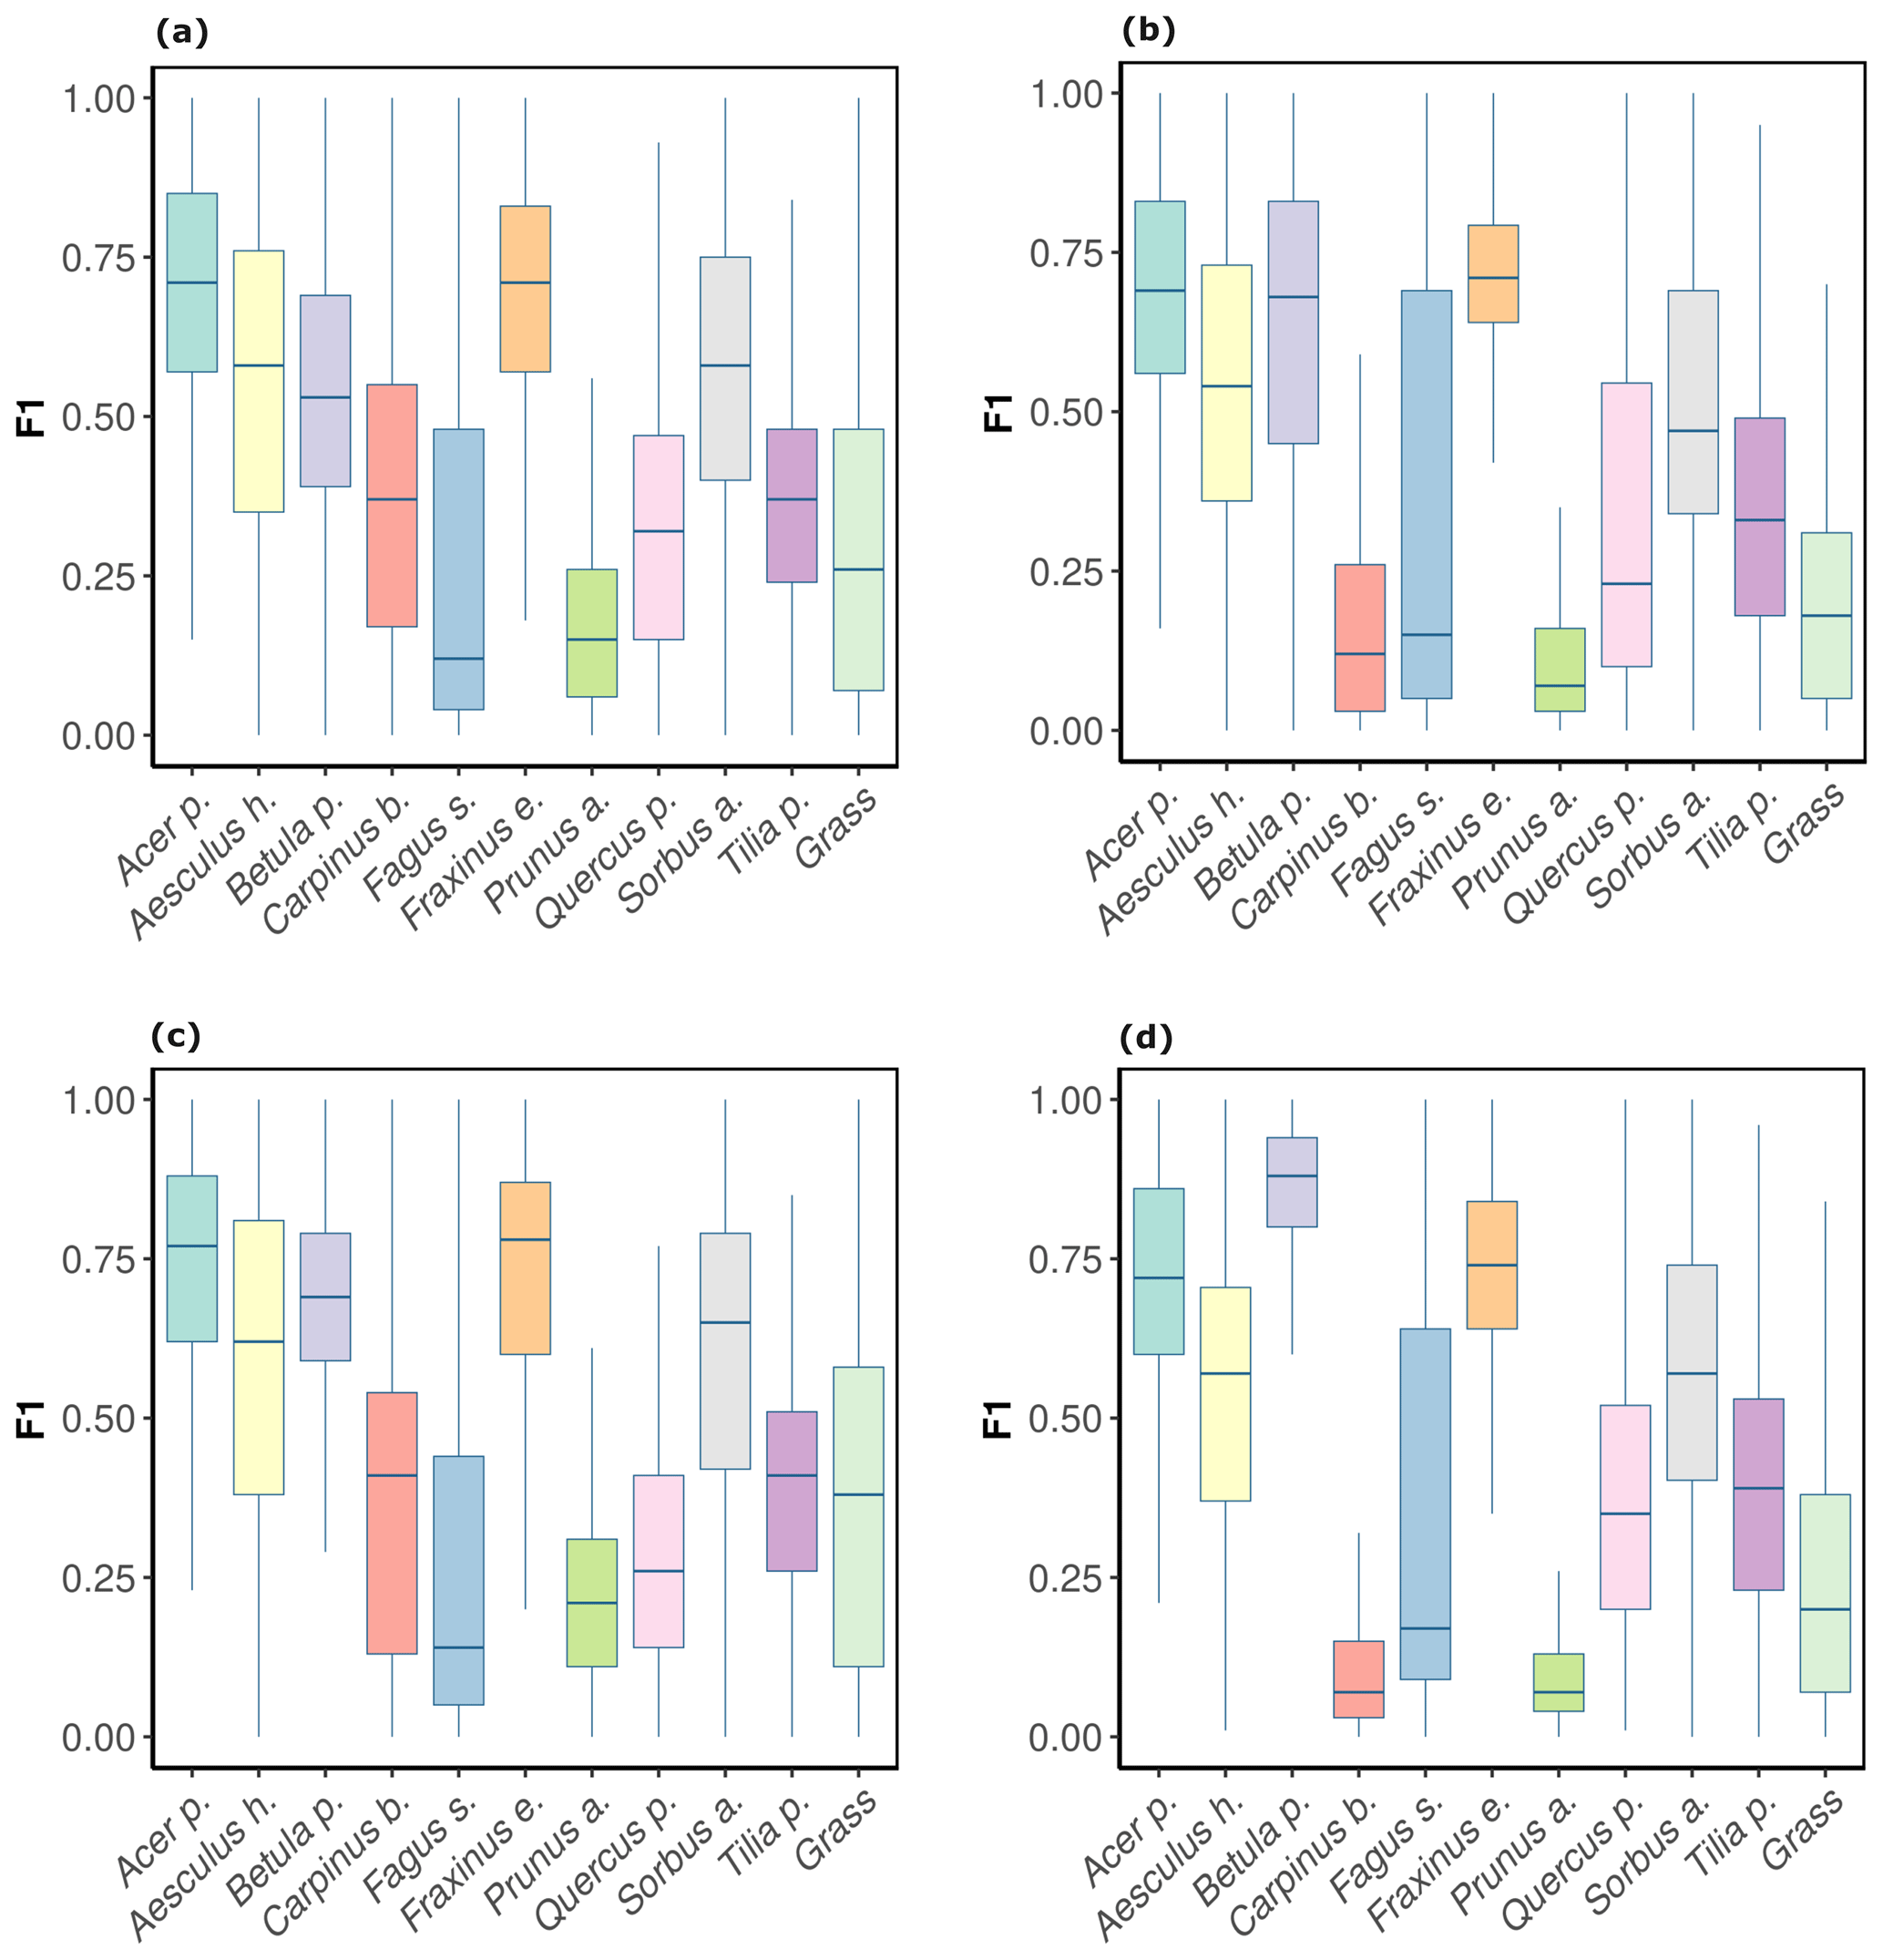
Figure 4F1 scores by tree species and background class for OrthoJuly and OrthoSeptember derived from CNNwindow and CNNsegment: (a) CNNwindow on OrthoJuly, with a mean F1 score of 0.44; (b) CNNwindow on OrthoSeptember, with a mean F1 score of 0.42; (c) CNNsegment on OrthoJuly, with a mean F1 score of 0.48; (d) CNNsegment on OrthoSeptember, with a mean F1 score of 0.46.
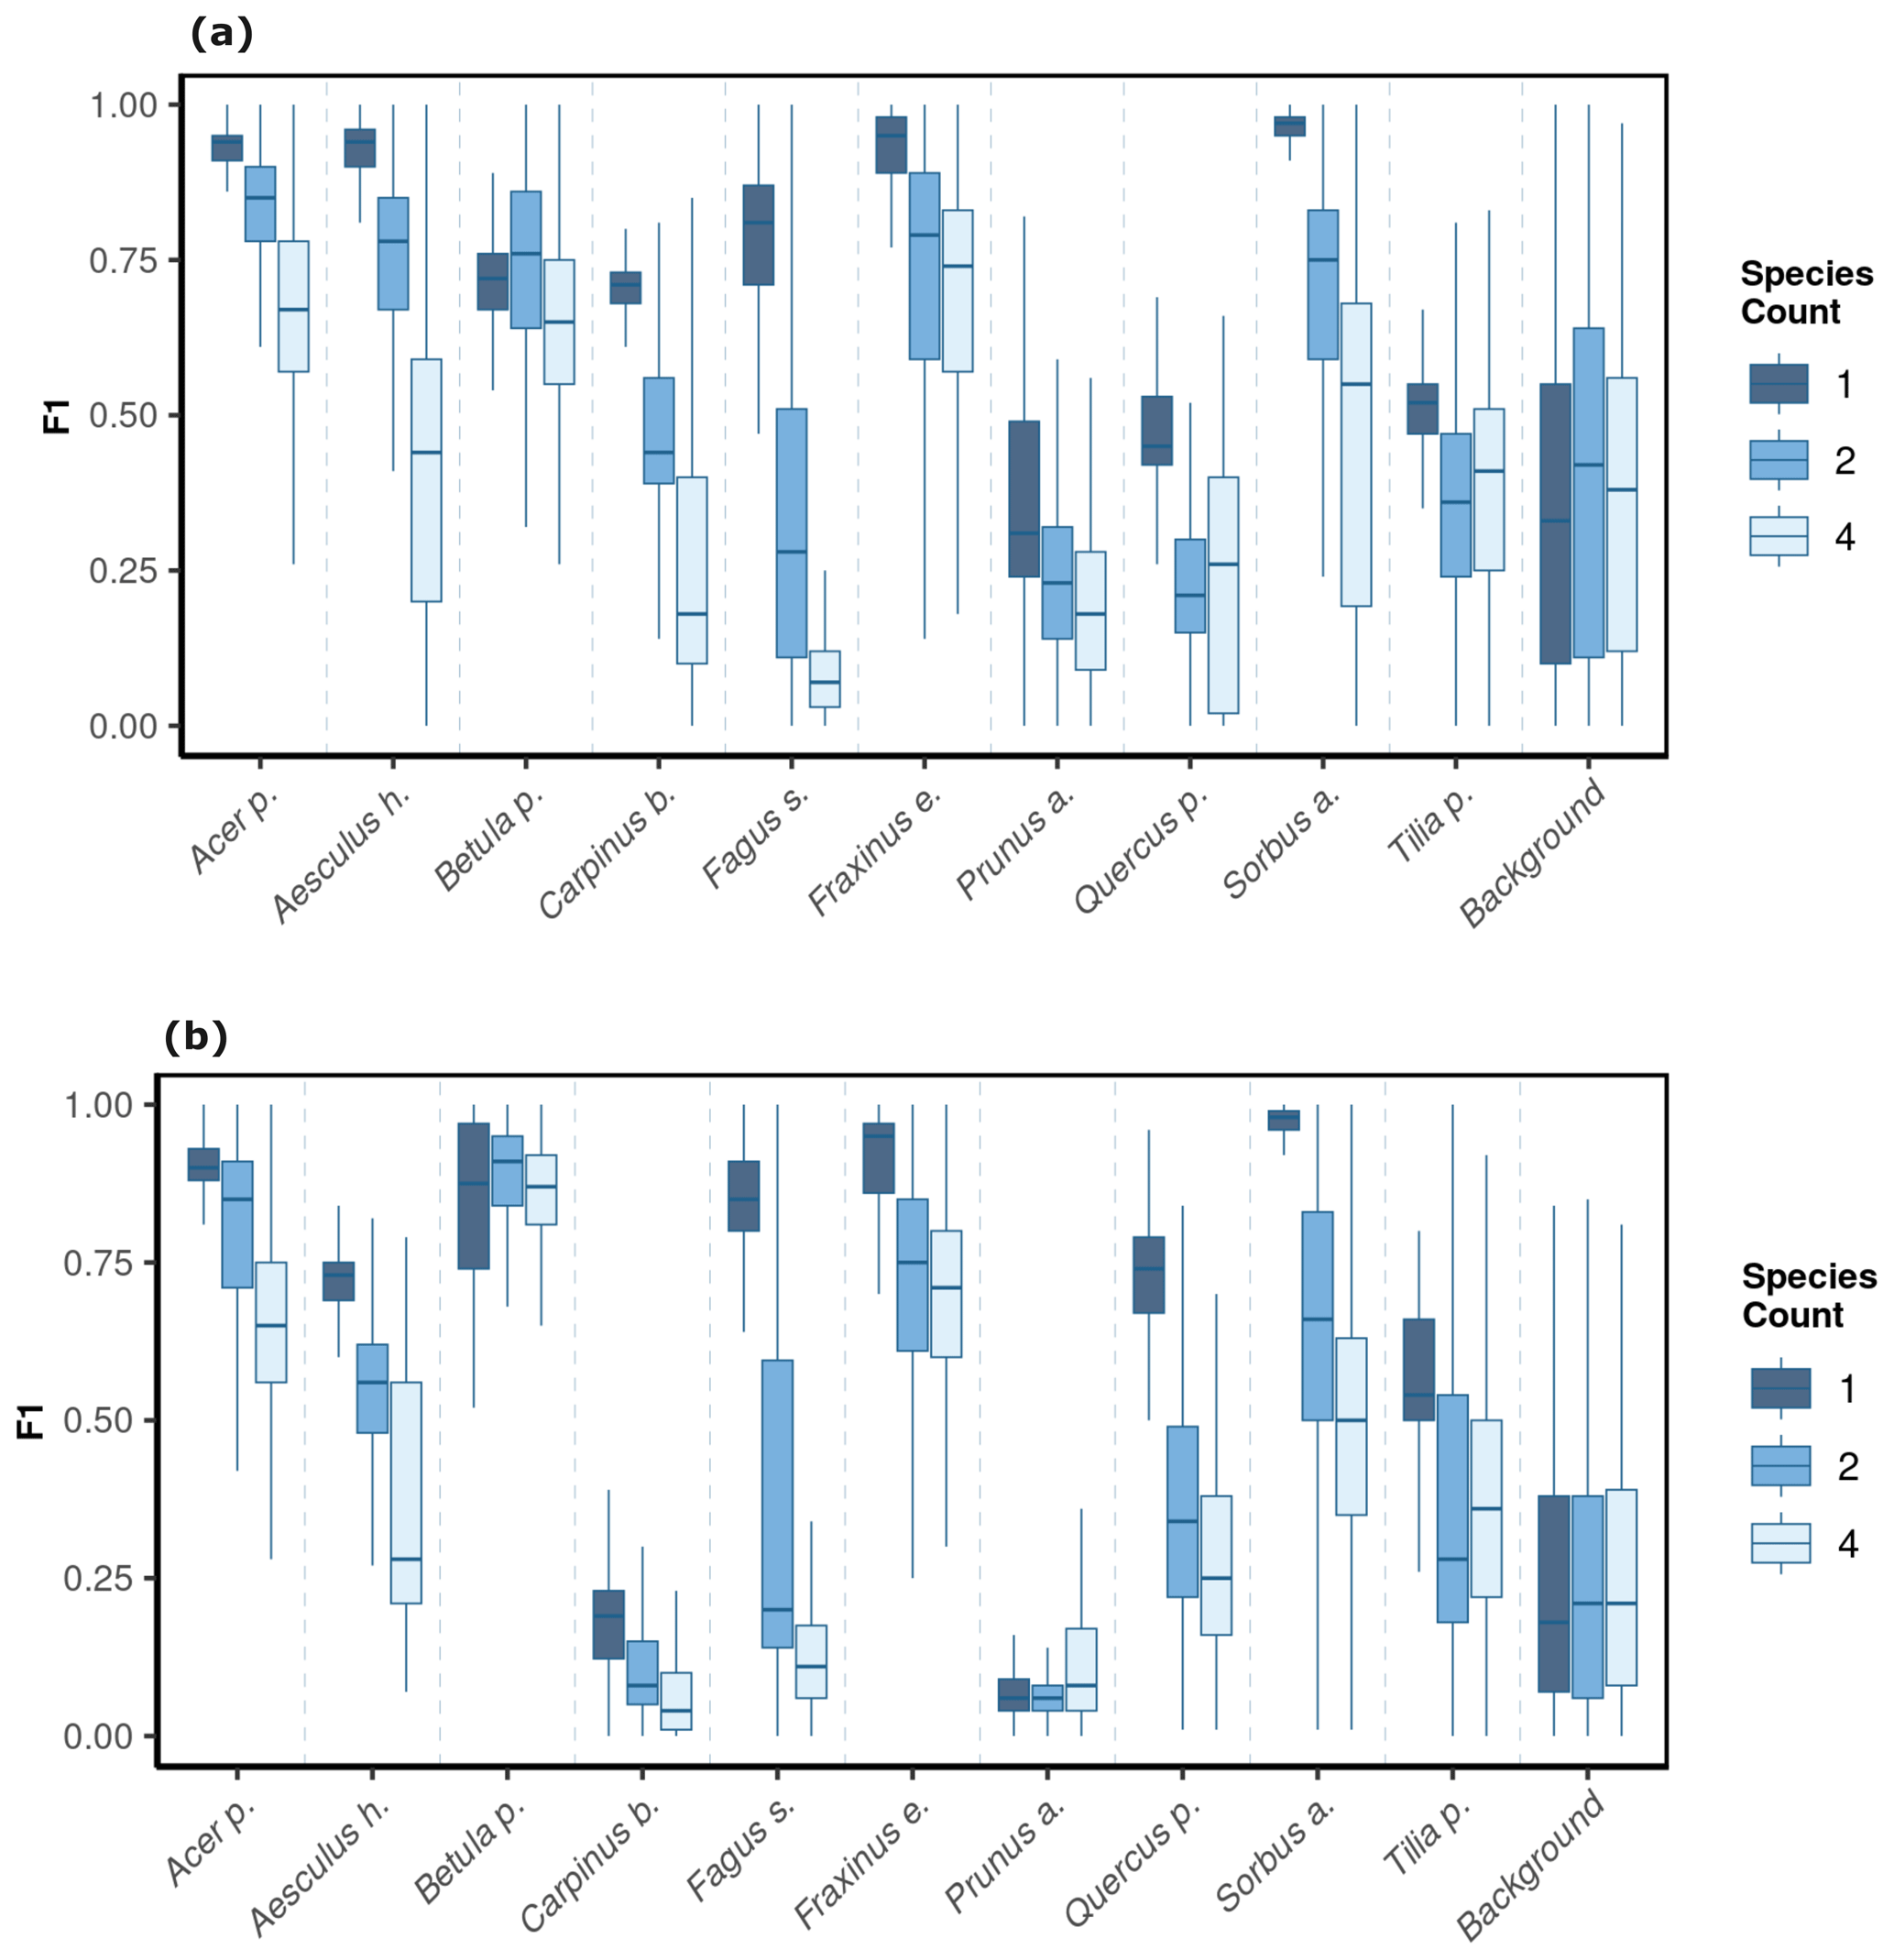
Figure 5The model performance (F1 score) of the CNNsegment model across a gradient of canopy complexity in OrthoJuly and OrthoSeptember. F1 scores decrease with increasing canopy complexity in plots. Panel (a) shows performance across species mixtures on OrthoJuly with mean F1 scores for one species (0.51), two species (0.44), and four species (0.41). Panel (b) displays performance across species mixtures on OrthoSeptember with mean F1 scores for one species (0.58), two species (0.51), and four species (0.42).
4.1 Filtering of citizen science data for drone-related applications
To achieve better correspondence between plant features visible in the citizen science photographs and the UAV images, we filtered the crowd-sourced photographs based on their acquisition distance (less than 0.3 m or greater than 15 m) to exclude macro and landscape photographs. Moreover, we excluded photographs that predominantly displayed tree stems, facilitating a foliage-centric perspective, as intrinsic to high-resolution UAV images (Fig. 3). In the future, more criteria may be considered for filtering citizen science imagery, including metadata (labels) on the presence of specific plant organs within an image (e.g., fruits and flowers), which are provided as a by-product by some citizen science plant identification apps (e.g., Pl@ntNet).
4.2 The creation of segmentation masks from simple image labels
One of the challenges of generating segmentation masks for the encoder–decoder method (CNNsegment) with the proposed workflow may be error propagation between the different steps. Firstly, the CNN image classification trained on the citizen science data has varying uncertainty for the different species, resulting from noisy citizen science observations or limitations with respect to the identification of some species solely by photographs (Van Horn et al., 2018). Secondly, the moving-window approach (CNNwindow), which predicts one species for an entire tile, may be too coarse to resemble very complex canopies (e.g., in highly diverse plant communities). However, although the fact that the segmentation labels created with the CNNwindow approach are partially inaccurate (Figs. 4a, 6), we found that the CNNsegment procedure indeed resulted in higher performance than the CNNwindow procedure. This is in line with other studies (Kattenborn et al., 2021; Cloutier et al., 2023; Schiller et al., 2021) which have reported that deep-learning-based pattern recognition can partially overcome noisy labels, whereas the intentional use of noisy reference data, also known as weakly supervised learning, is generally very promising in the absence of high-quality labels (Cherif et al., 2023; Zhou, 2018; Schiller et al., 2021). Here, we filtered the training data (masks) for regions where we expected extreme noise levels – that is, for tiles where none of the classes exceeded a relative cover of 30 %. These regions were, according to our observation, often canopy gaps and shadowed areas, where one naturally expects lower model performance, as species-specific textures are less visible (Lopatin et al., 2019; Milas et al., 2017; De Sa et al., 2018).
The enhanced segmentation performance of the CNNsegment approach compared with CNNwindow can be attributed to the spatially explicit and more finely resolved predictions of the U-Net segmentation algorithm (encoder–decoder principle), enabling a segmentation of the tree species at the native resolution of the orthoimagery. The CNNsegment approach resulted in improved prediction results compared with the CNNwindow method in plots with more species and, hence, more complex canopies. Thus, the presented two-step approach of creating segmentation masks from simple class labels (CNNwindow), as provided by iNaturalist and Pl@ntNet platforms, can indeed be used to create segmentation masks required for state-of-the-art image analysis methods (CNNsegment) and, thereby, result in high value for remote sensing applications. The increased value of these segmentation masks enables the training of algorithms with higher performance in species recognition. It greatly enhances the computational efficiency of applying the models on orthoimagery (approximately 10 times faster). Especially for recurrent applications, such as monitoring or large-scale undertakings, the two-step approach involving the creation of segmentation masks and encoder–decoder architectures is recommended.
4.3 The role of canopy complexity
Overall, the segmentation performance declined with increasing species richness per plot. We expect that this can mainly be attributed to the small size of individual trees at the MyDiv site, where there is a lower chance that a 512 pixel × 512 pixel tile includes clearly visible species-specific leaf and branching patterns in species-rich mixtures. This also explains why, in particular, trees with lower relative canopy height (e.g., Quercus petraea and Fagus sylvatica) were less likely to be accurately segmented in species mixtures. The observed effect of canopy complexity is in line with previous findings from Soltani et al. (2022), Lopatin et al. (2017), Fassnacht et al. (2016), and Fricker et al. (2019), who reported that smaller patches of individual species were less likely to be accurately detected. Visual inspection also confirmed that false predictions were more likely at canopy edges between different tree species (Fig. 6). However, it should be noted that the small-scale canopy complexity of the plots used here is exceptionally high (Fig. 3). Most tree crowns in the MyDiv experiment do not exceed a diameter of 1.5 m, and the transition among tree crowns of multiple species is often very fuzzy. Thus, we expect reduced performance in canopy transitions to be less relevant in real-world settings, where tree species appear in more extensive, homogeneous patches and where individual crowns are commonly larger. Thus, the model performance in these species mixtures can be interpreted as a rather conservative estimate. The results obtained for the monocultures might be more representative in terms of real-world applications, as mature trees in temperate forests typically have crown diameters 5–20 times larger. Application tests of the presented approach in real forests are desirable. However, acquiring such a dataset is a logistical challenge because temperate forest stands commonly do not feature a comparably high and balanced occurrence of that many tree species.
4.4 Spatial resolution of the UAV imagery is key
According to the results obtained in the monocultures, the CNNsegment model successfully classified 7 out of 10 tree species (F1 >0.7). The lower F1 scores for Quercus petraea (mean F1 0.57), Prunus avium (mean F1 0.2), and Tilia platyphyllos (mean F1 0.53) may result from the spectral and morphological similarity at the current spatial resolution of the UAV imagery (0.22 cm) (Fig. 3). Hence, these species were often confused with each other (see confusion matrices in Appendix A2). Such confusion among plants with a similar appearance has been confirmed by other studies (e.g., Cloutier et al., 2023; Schiefer et al., 2020) and matches our experience based on the generation of reference data via visual interpretation, where a separation between these species was sometimes challenging. Initial CNN-based segmentation attempts (results not shown) in the preparation of this study were based on an orthoimage with a resolution of 0.3 cm, instead of a 0.22 cm resolution, resulting in clearly lower model performance. This aligns with the reported importance of the spatial resolution of UAV imagery for CNN segmentation found earlier studies (Schiefer et al., 2020; Schmitt et al., 2020; Ma et al., 2019; Braga et al., 2020). Thus, while the current orthoimages with a 0.22 cm resolution delivered promising results, further increasing the spatial resolution might be very promising for species in which characteristic leaf forms are only visible at fine spatial resolutions.
4.5 Model transferability across seasons and orthoimage acquisition properties
The variability in human behavior and electronic devices makes citizen-science-based plant photographs very heterogeneous. This can be a challenge for deep learning applications, such as species recognition or plant trait characterization (Schiller et al., 2021; Van Horn et al., 2021; van Der Velde et al., 2023; Affouard et al., 2017), in which models have to identify features that hold across various viewing angles, distances, or illumination conditions. However, this heterogeneity might also be of great value, given that citizens depict the appearance of plants under various site, environmental, and phenological conditions. This, in turn, offers a unique setting for training models that are generic and transferable across these conditions. Here, we evaluated the transferability of our models across different datasets by applying them to two orthoimages acquired in different seasons (peak growing season and autumn). Both the CNNwindow and CNNsegment models could identify deciduous tree species in the orthoimages with surprising accuracy, suggesting that the models are transferable to different conditions.
4.6 Outlook
Overall, our results indeed highlight the value of citizen science photographs with simple class labels to create training data for state-of-the-art segmentation approaches. A great advantage of this citizen-science-based approach is that it often does not require costly training data obtained from visual interpretation or field surveys (here, reference data were only used to validate the models). This particularly highlights the potential of citizen science data for applications in which many species are of interest, such as biodiversity-related monitoring (Chandler et al., 2017; Johnston et al., 2023). In this regard, data or models of species-recognition platforms that incorporate excessive numbers of plant species and respective imagery are very promising, including iNaturalist (Boone and Basille, 2019), Pl@ntNet (Affouard et al., 2017), ObsIdentify (Molls, 2021), or Flora Incognita (Mäder et al., 2021). However, based on the current work and an aforementioned precursor study (Soltani et al., 2022), we expect that a preselection of citizen science photograph databases considering images more representative of the common UAV-based perspective is required to unleash the potential of these heterogeneous data.
The transfer learning approach presented here demonstrates the value of freely available crowd-sourced plant photographs for remote sensing studies. This heterogeneous dataset can provide valuable training data for transferable CNN-based segmentation models. Here, this potential was highlighted via a very complex task, i.e., the differentiation of 10 temperate deciduous tree species in mixed-vegetation stands with a complex structure. The presented two-step approach demonstrated how we can transfer and harness generic knowledge gathered by citizens on how plants “look” to the bird's-eye perspective of high-resolution drone imagery. The presented moving-window approach overcomes the limitation of citizen-science-based photographs having only simple species labels. The segmentation maps derived from an image classification model applied in a moving-window setting can be harnessed to create segmentation masks for encoder–decoder-type segmentation models. The latter not only allows higher accuracy with respect to species segmentation but is also considerably more efficient. By building on the effort of thousands of citizens, this framework enables the mapping of plant species without any training data obtained from visual interpretation or ground-based field surveys. Due to the large number of plant photographs acquired under different conditions, such models can be assumed to have good transferability.
A1 Prediction maps
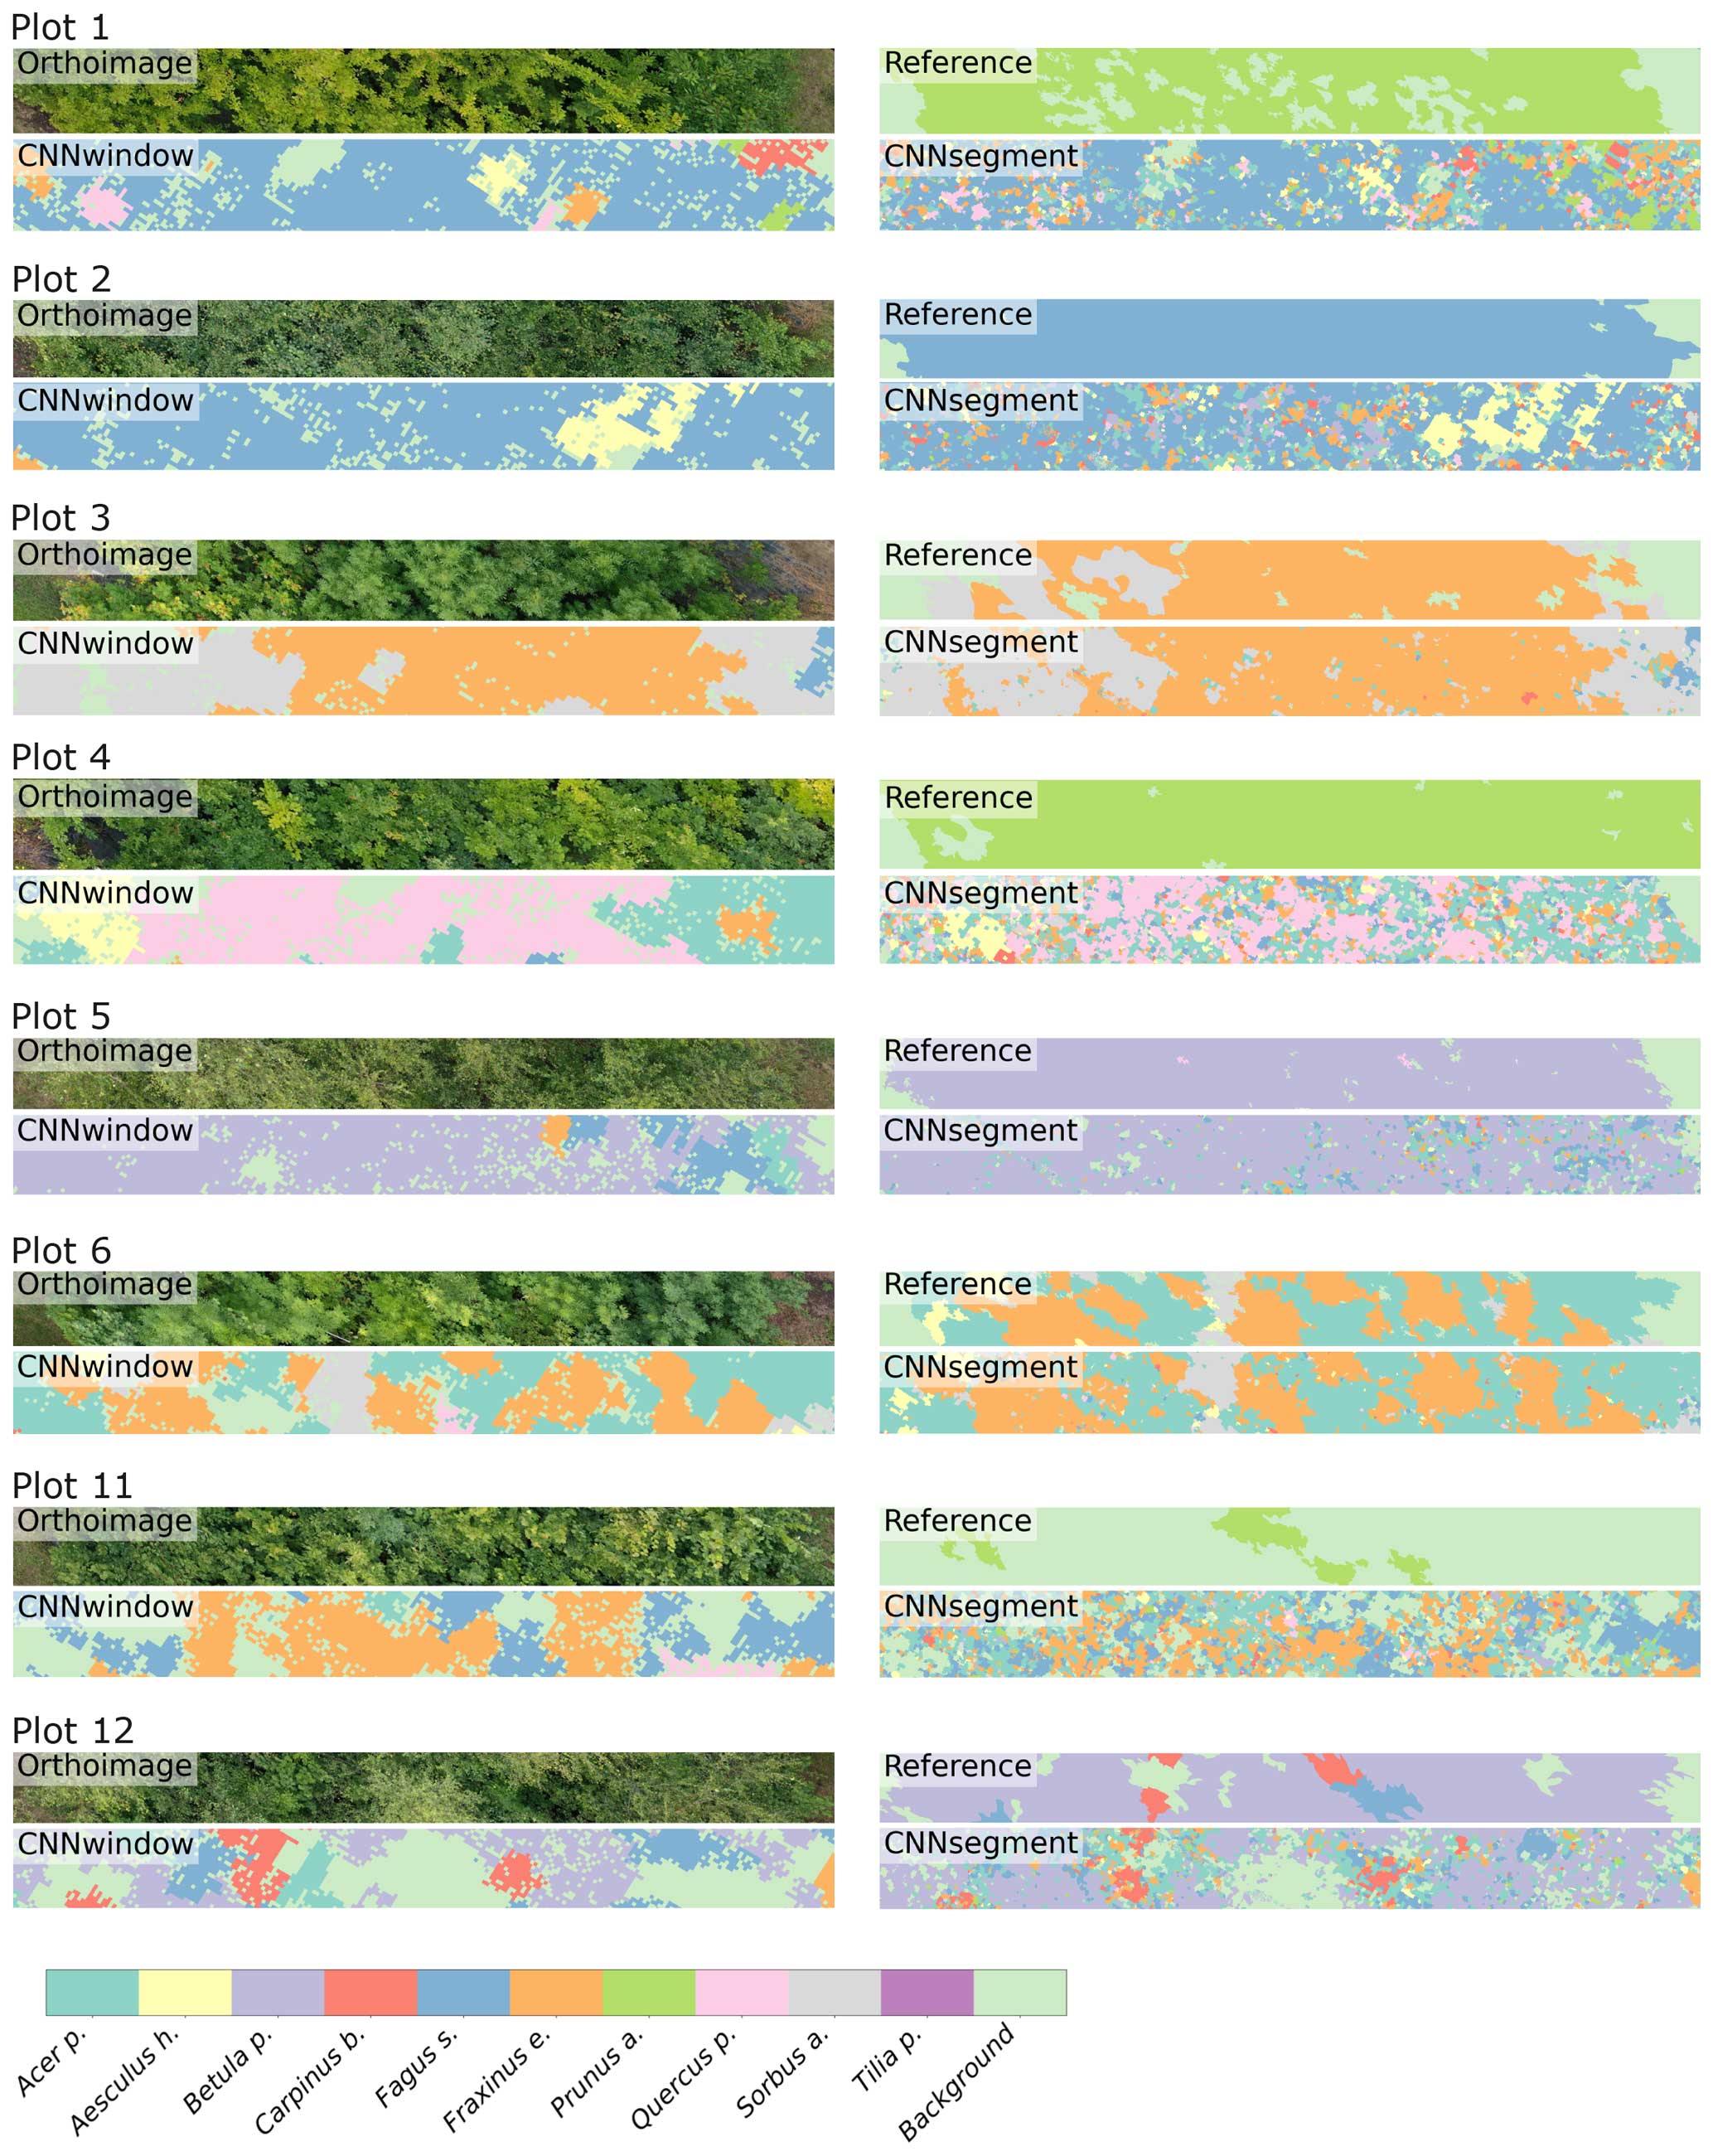
Figure A1The 2 m × 20 m transects of selected plots, including the orthoimage, the reference, CNNwindow predictions, and CNNsegment predictions.
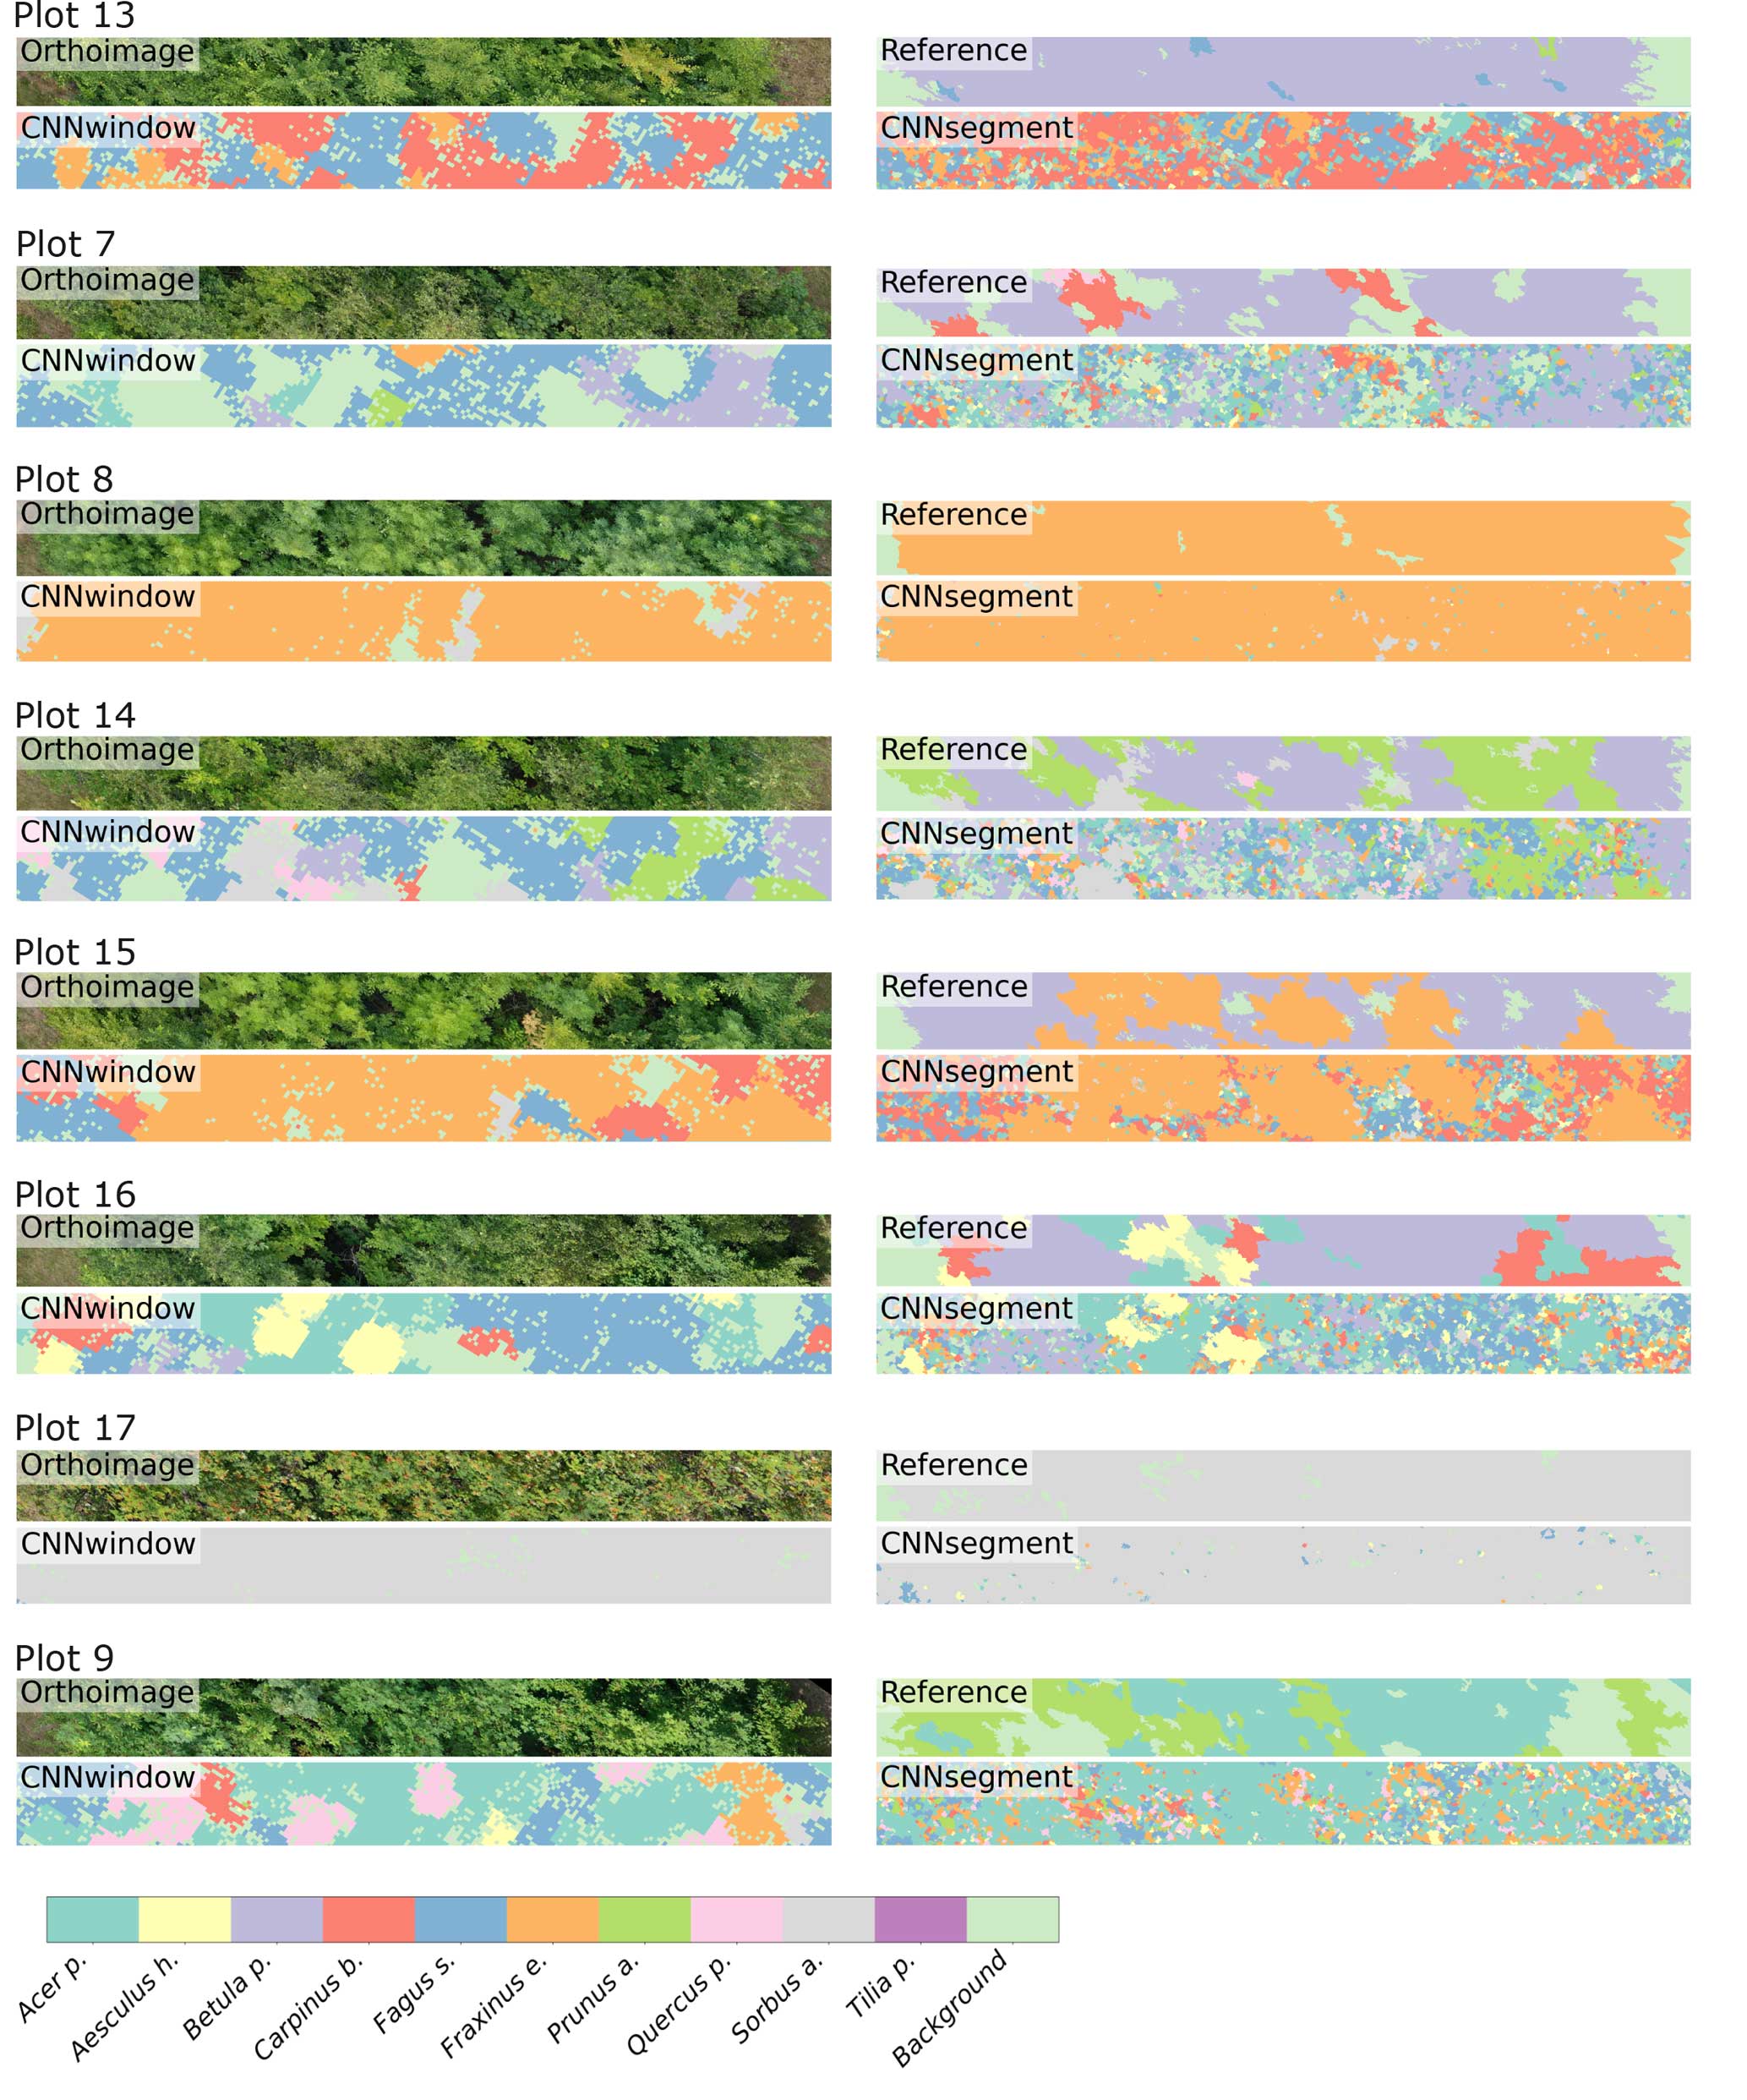
Figure A2The 2 m × 20 m transects of selected plots, including the orthoimage, the reference, CNNwindow predictions, and CNNsegment predictions.
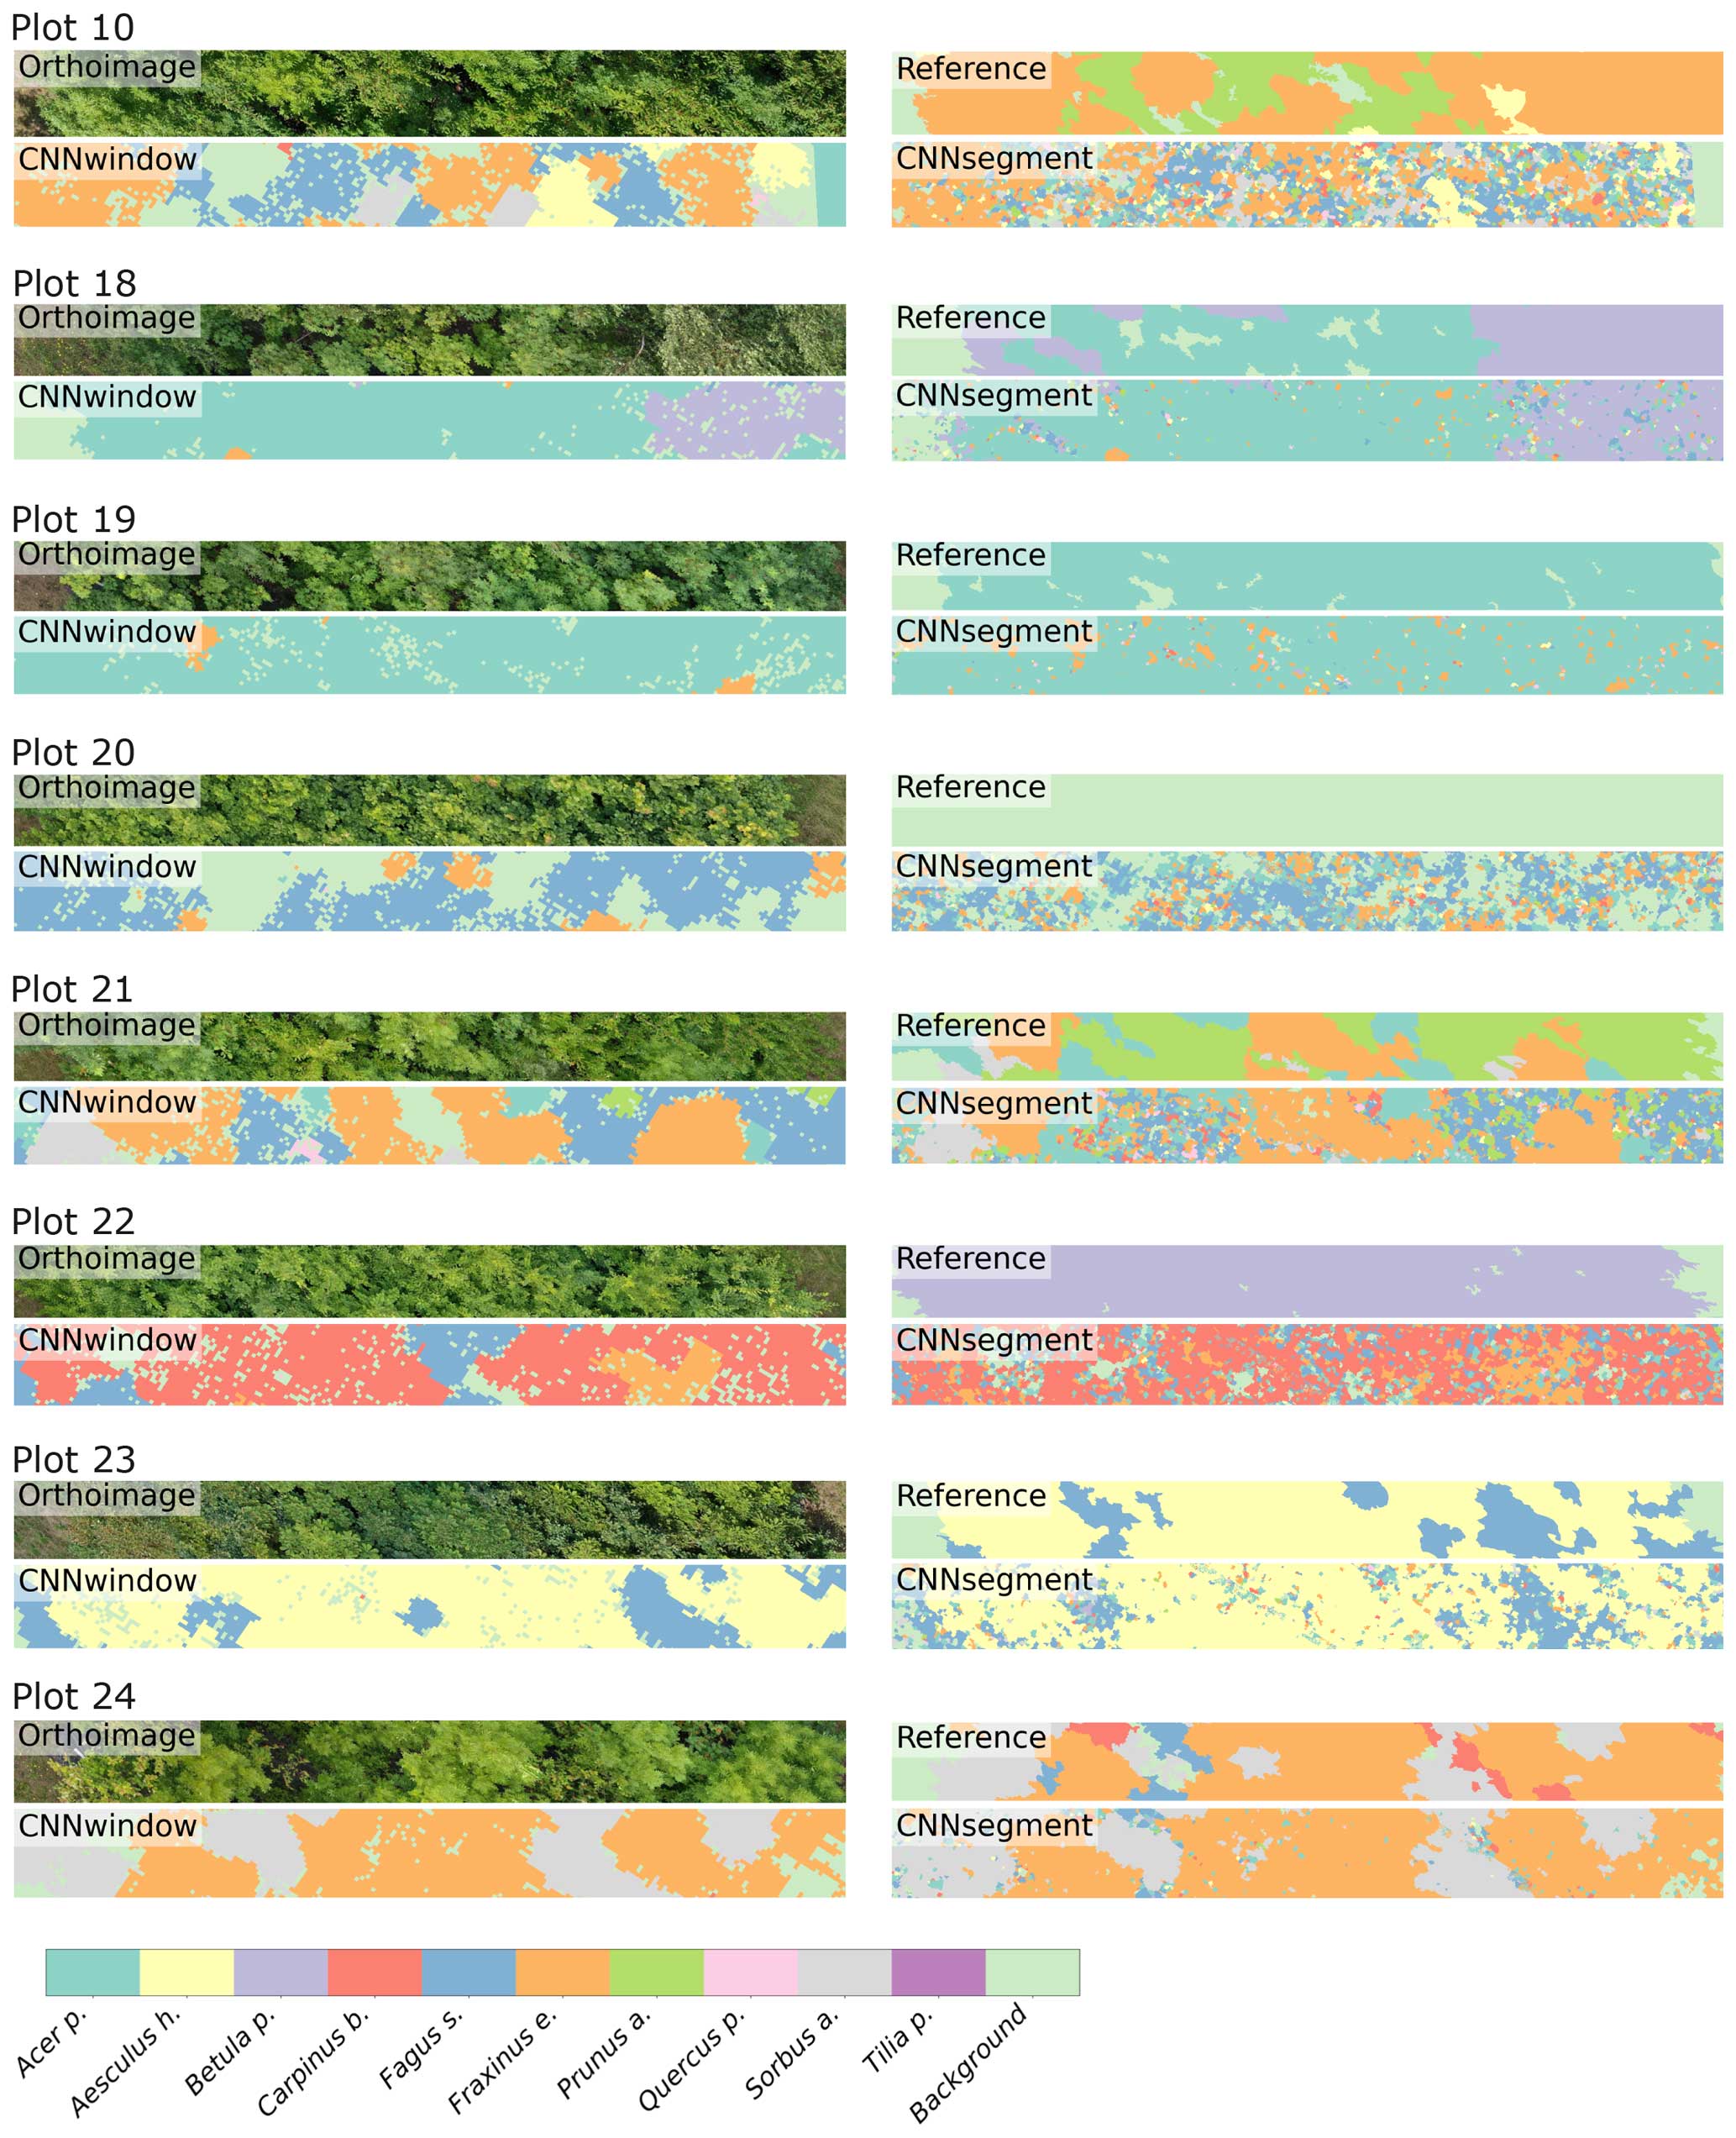
Figure A3The 2 m × 20 m transects of selected plots, including the orthoimage, the reference, CNNwindow predictions, and CNNsegment predictions.
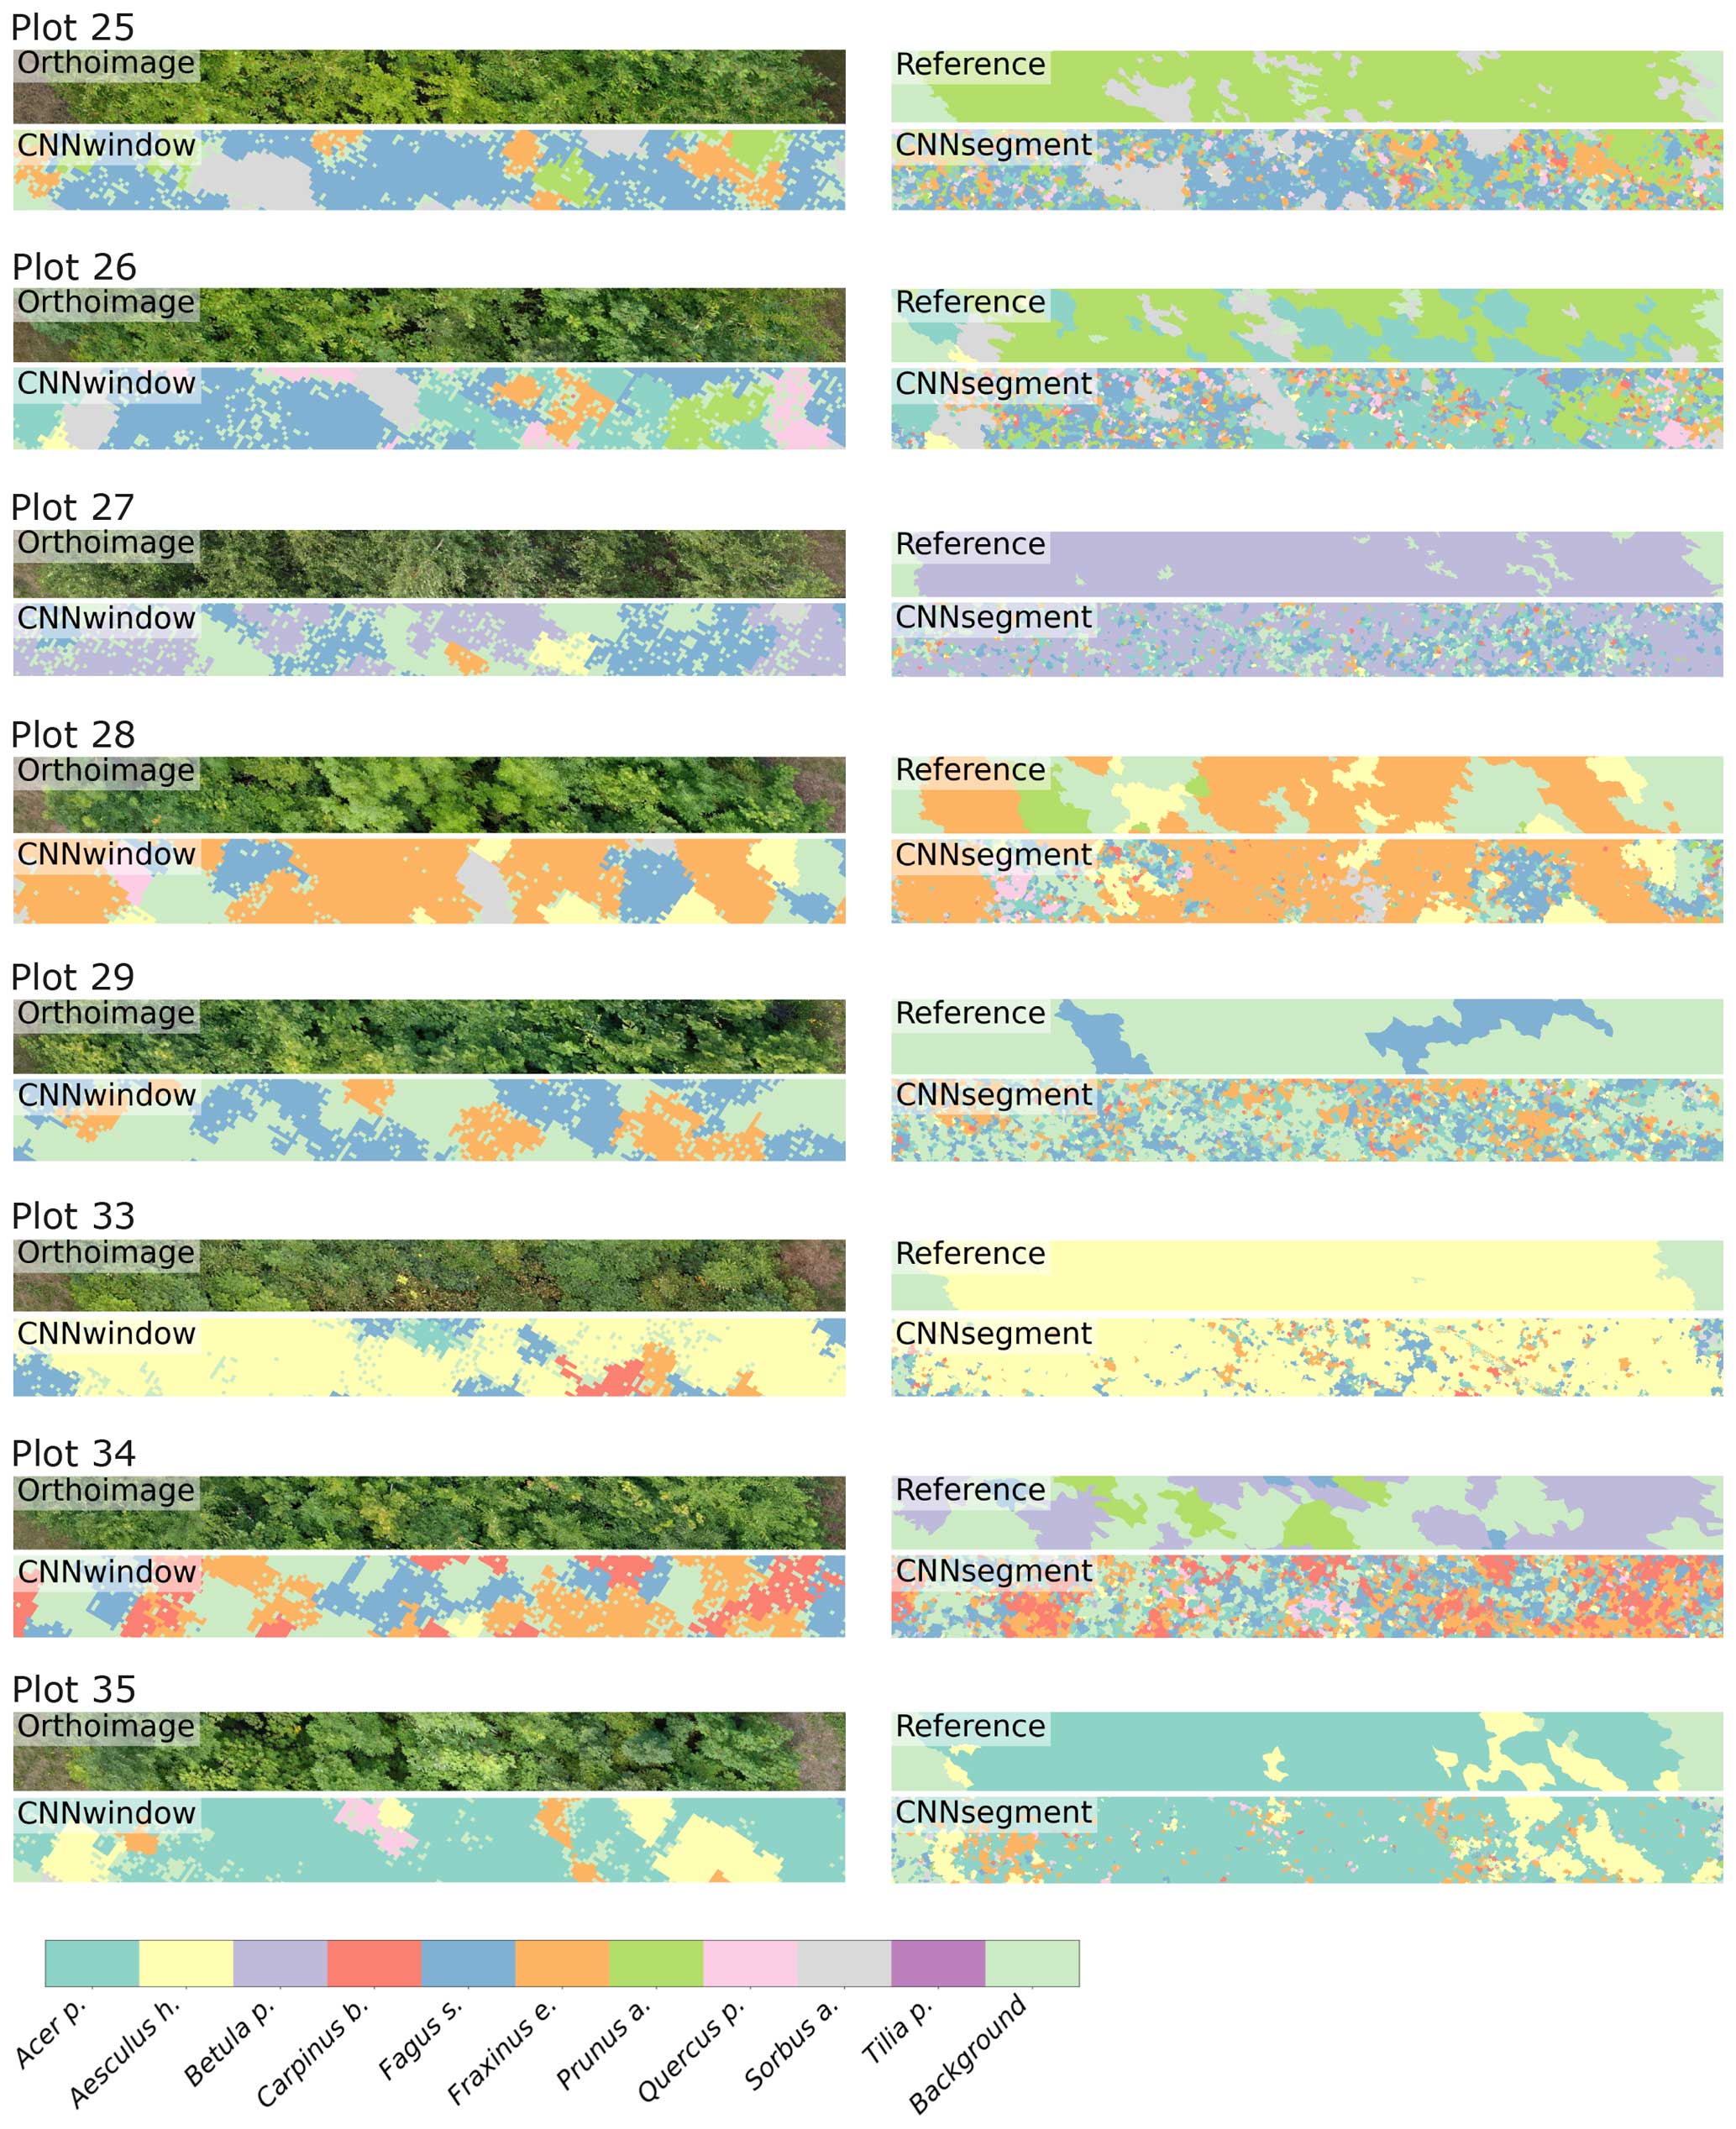
Figure A4The 2 m × 20 m transects of selected plots, including the orthoimage, the reference, CNNwindow predictions, and CNNsegment predictions.
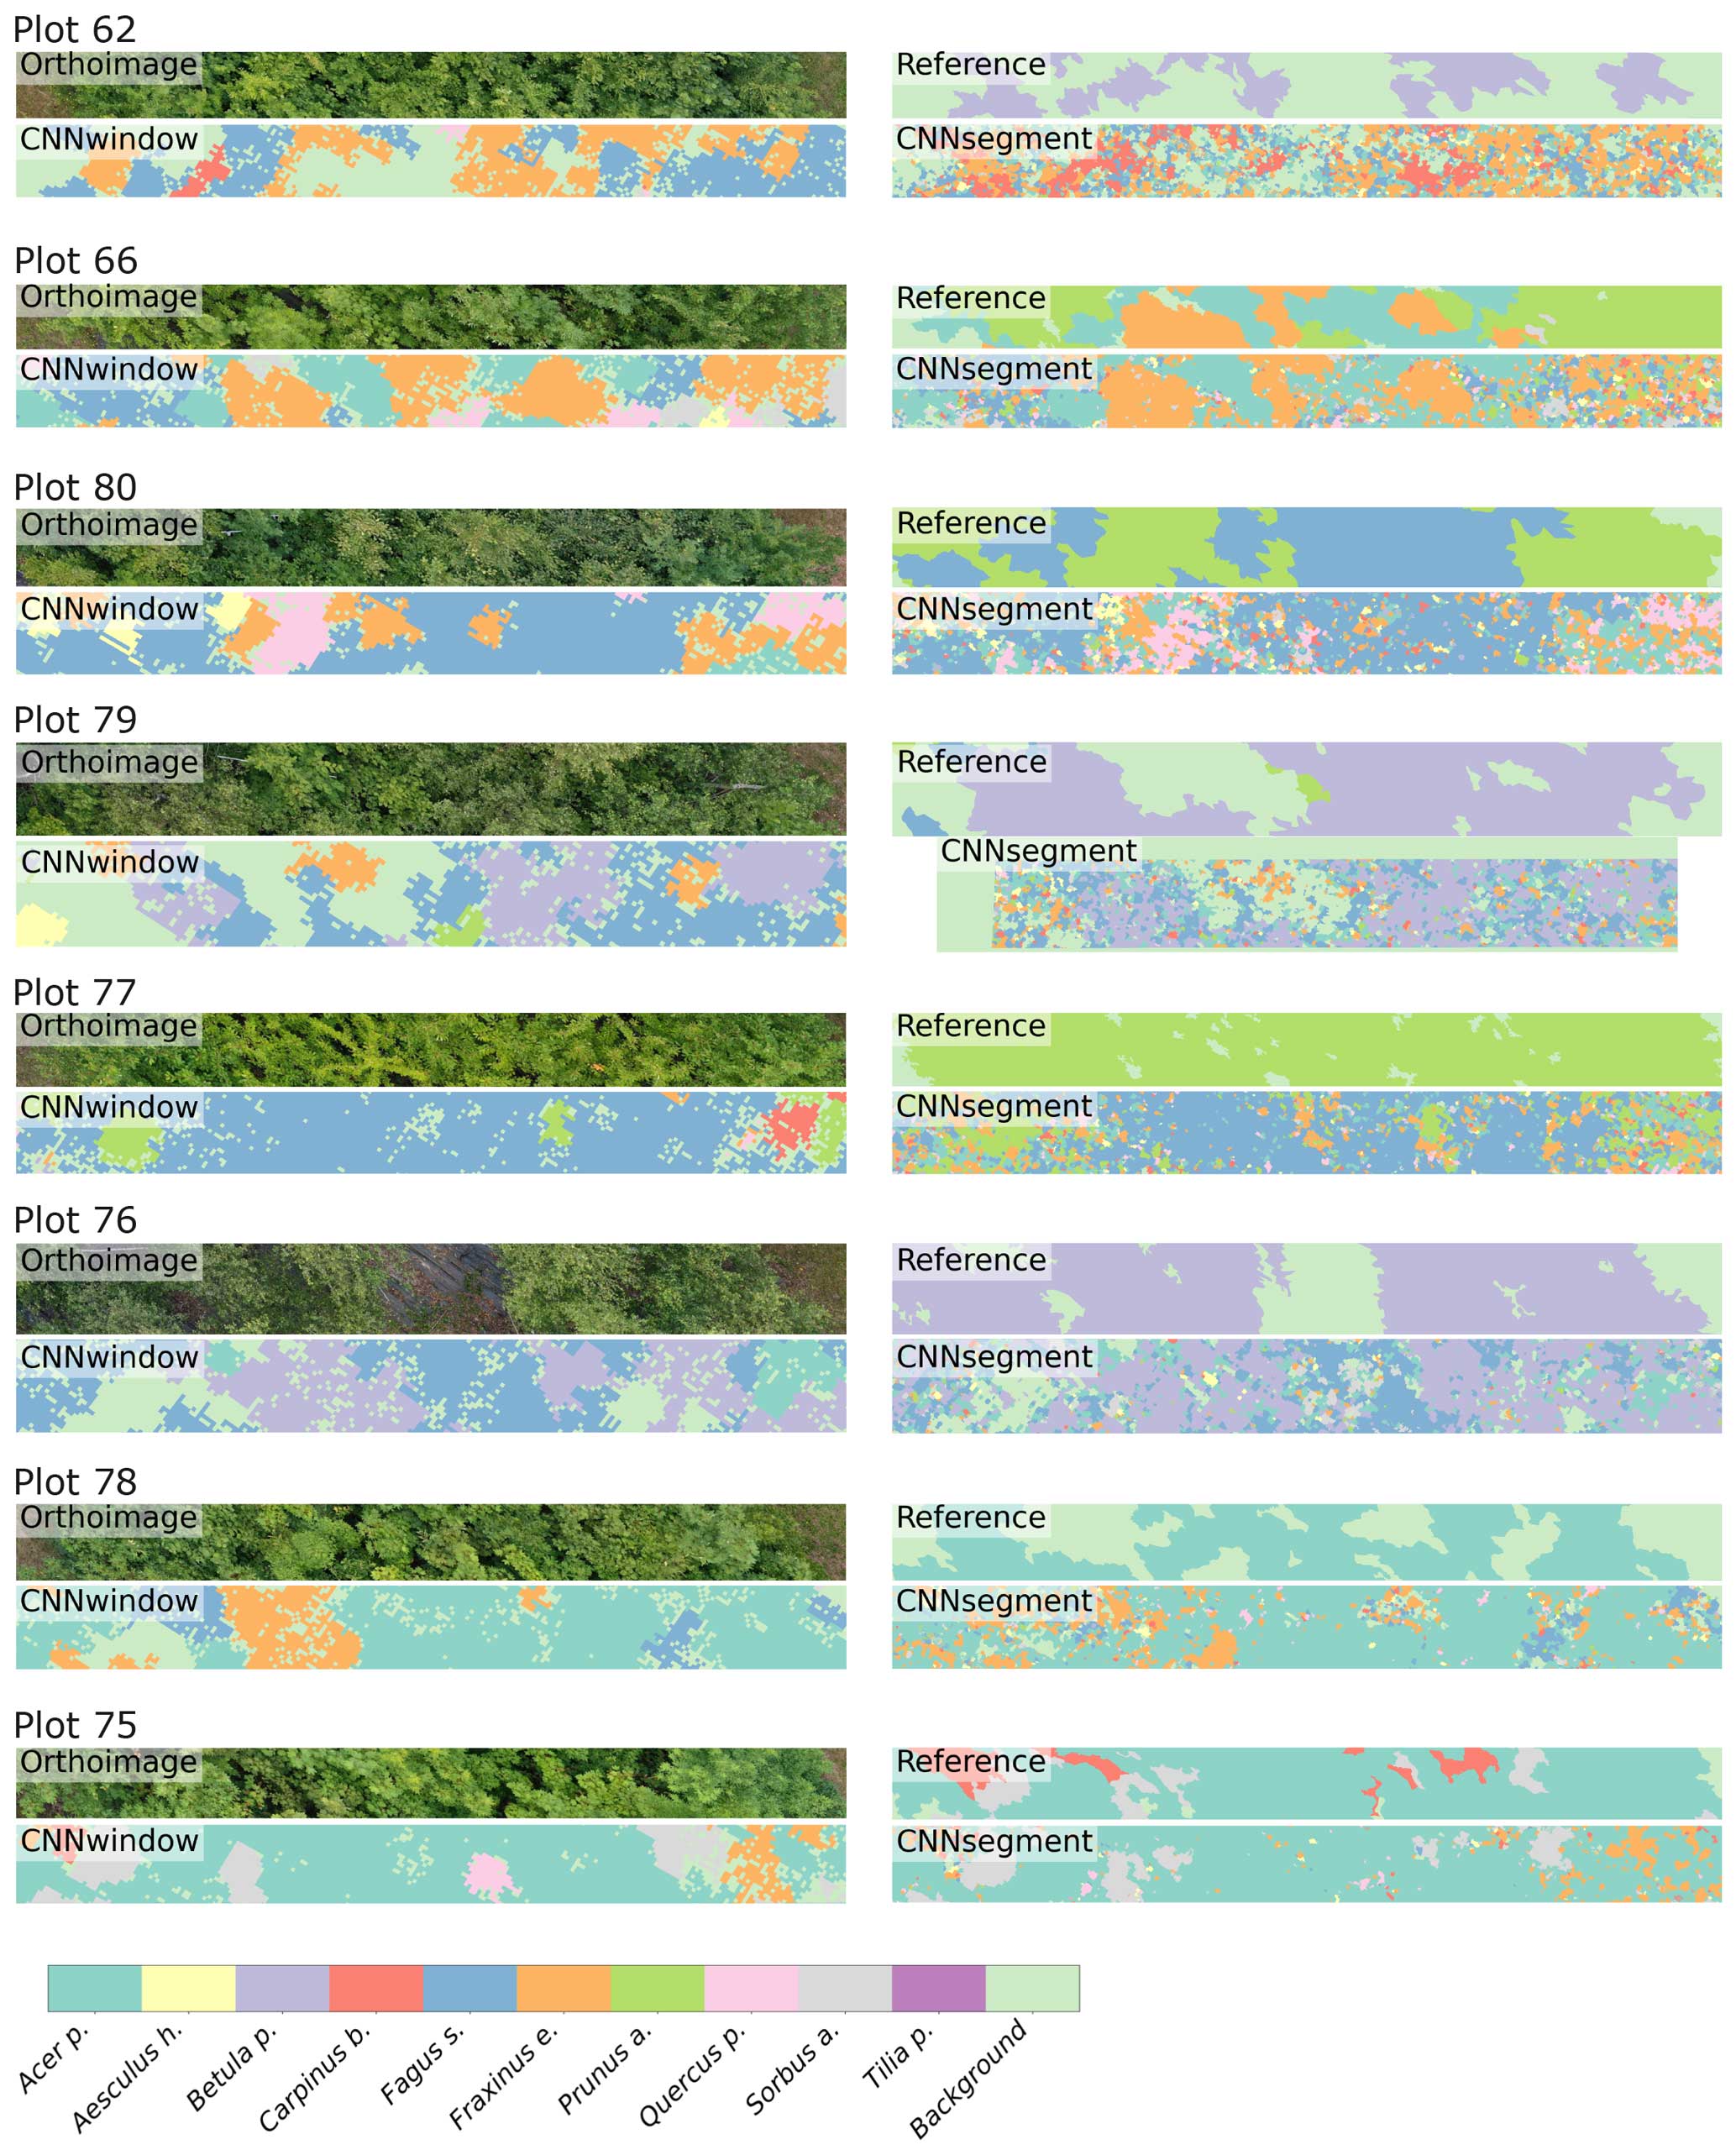
Figure A5The 2 m × 20 m transects of selected plots, including the orthoimage, the reference, CNNwindow predictions, and CNNsegment predictions.
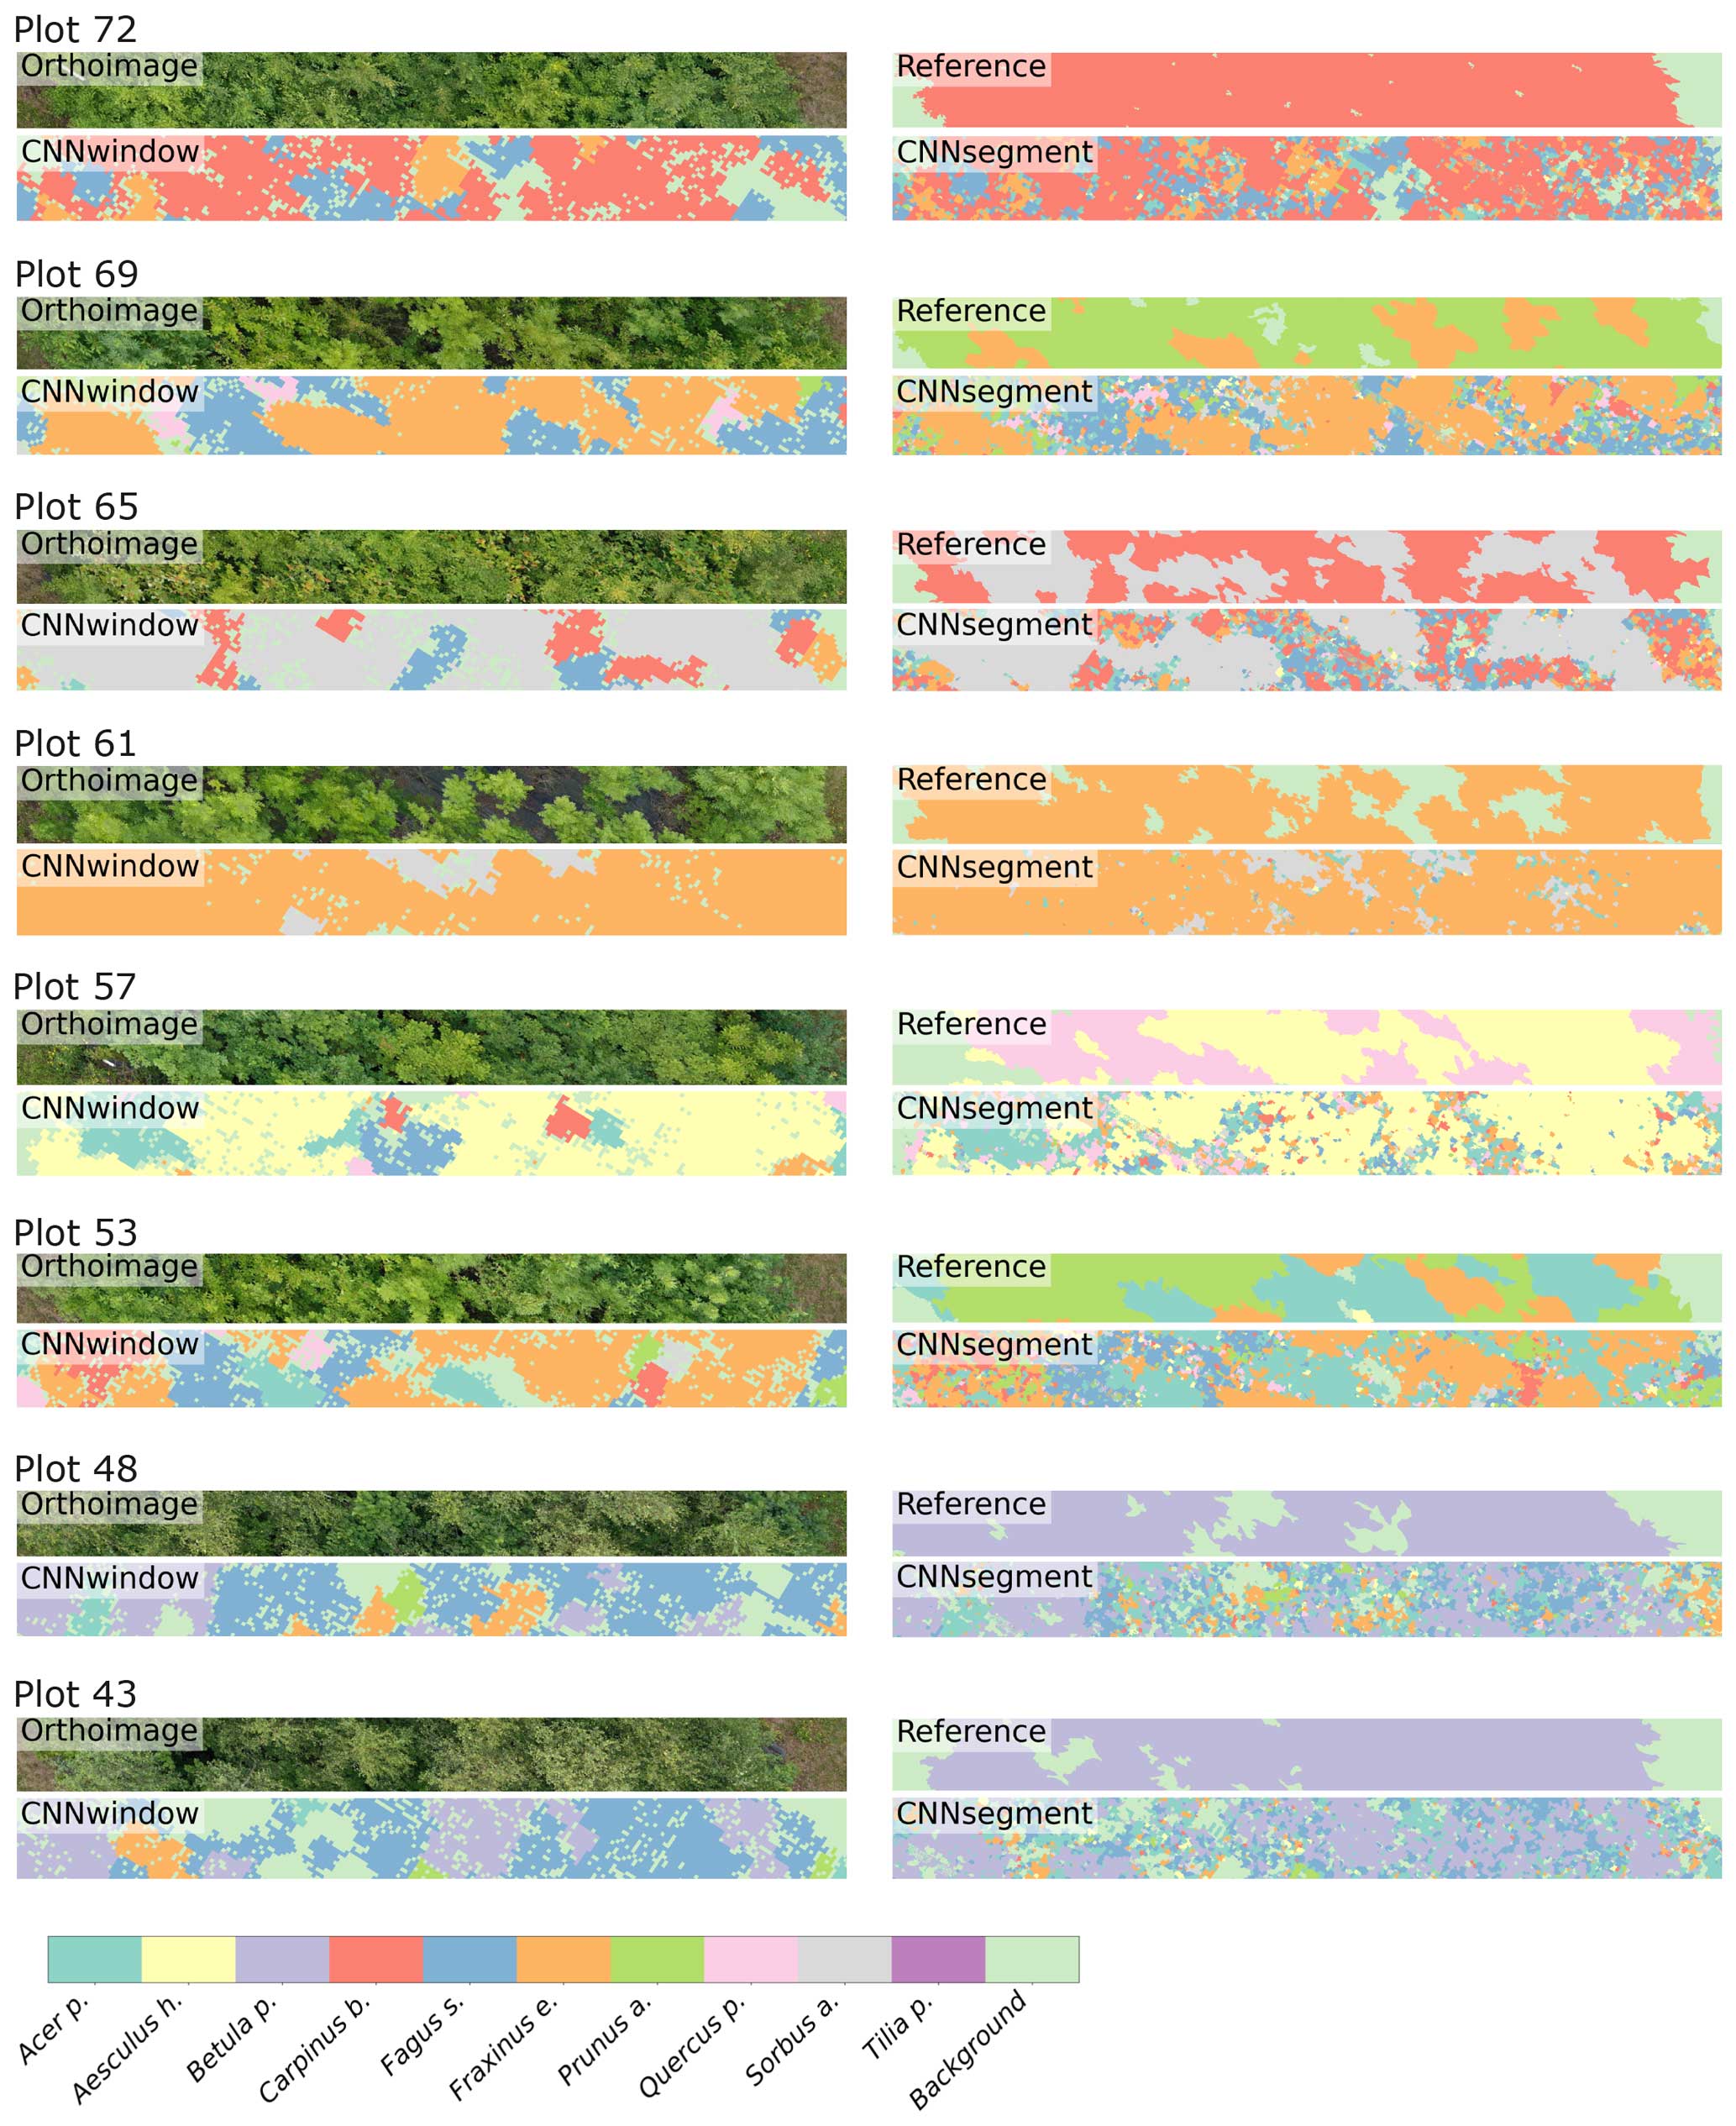
Figure A6The 2 m × 20 m transects of selected plots, including the orthoimage, the reference, CNNwindow predictions, and CNNsegment predictions.
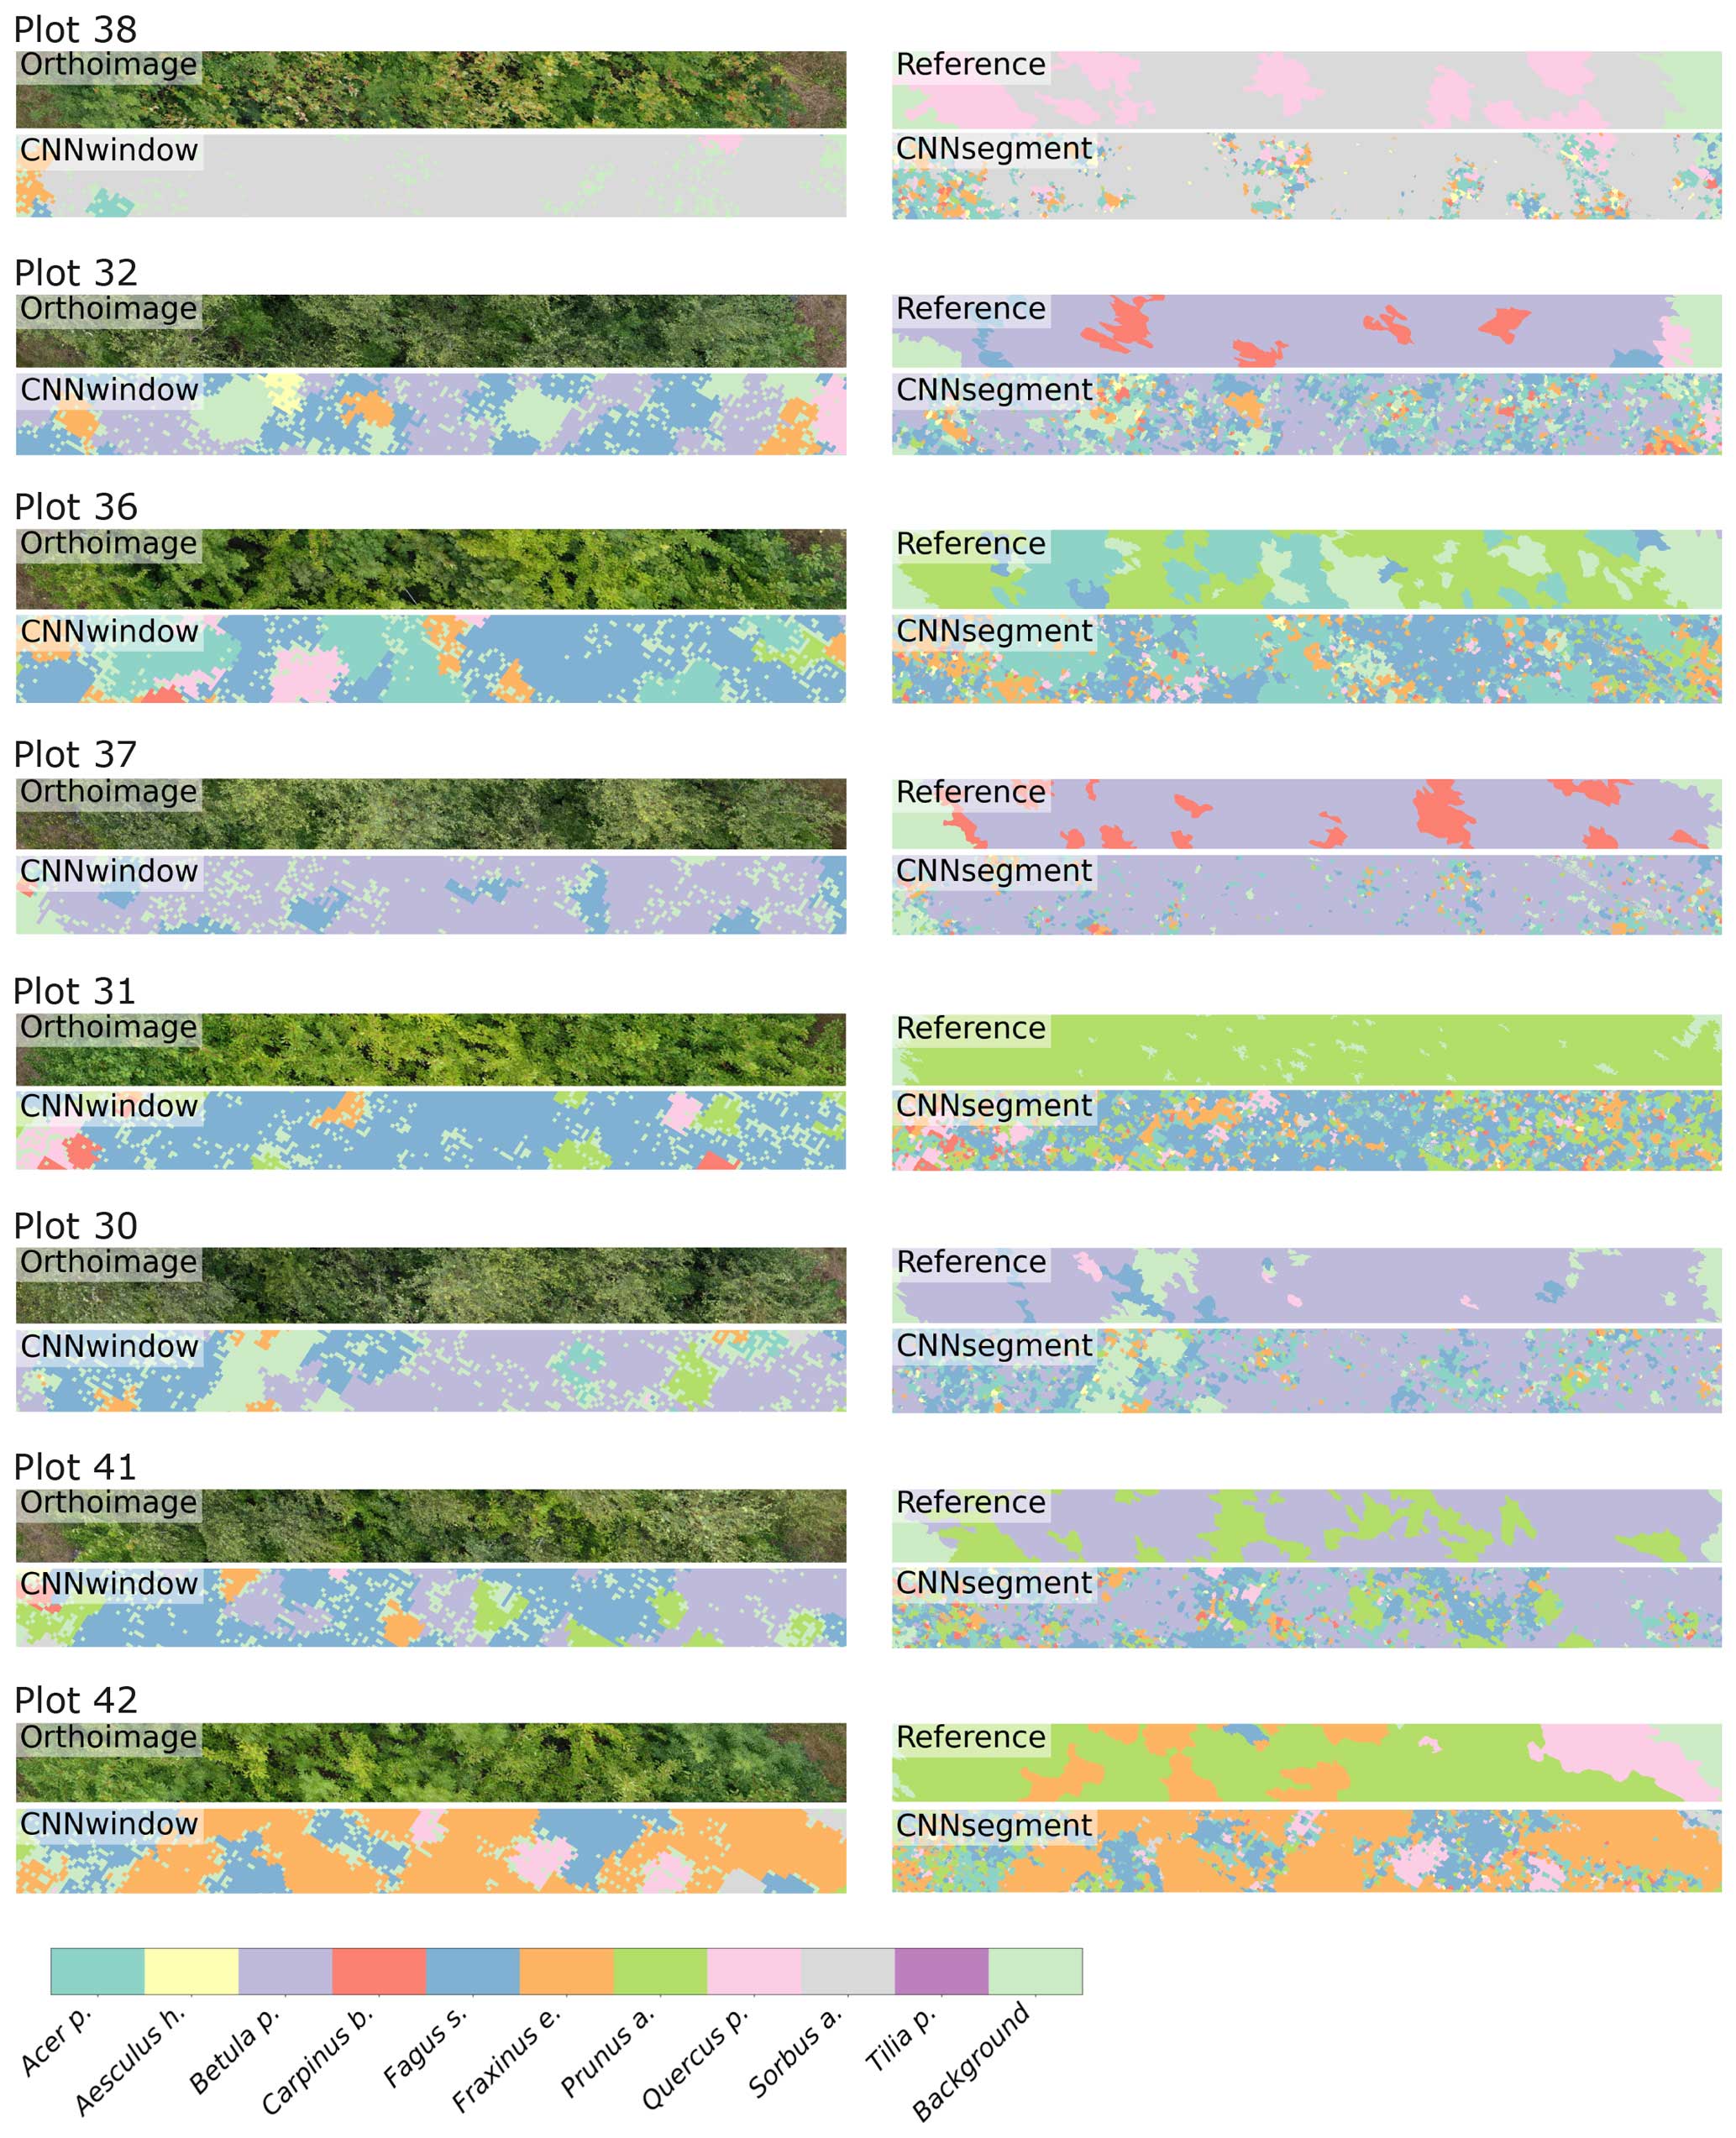
Figure A7The 2 m × 20 m transects of selected plots, including the orthoimage, the reference, CNNwindow predictions, and CNNsegment predictions.
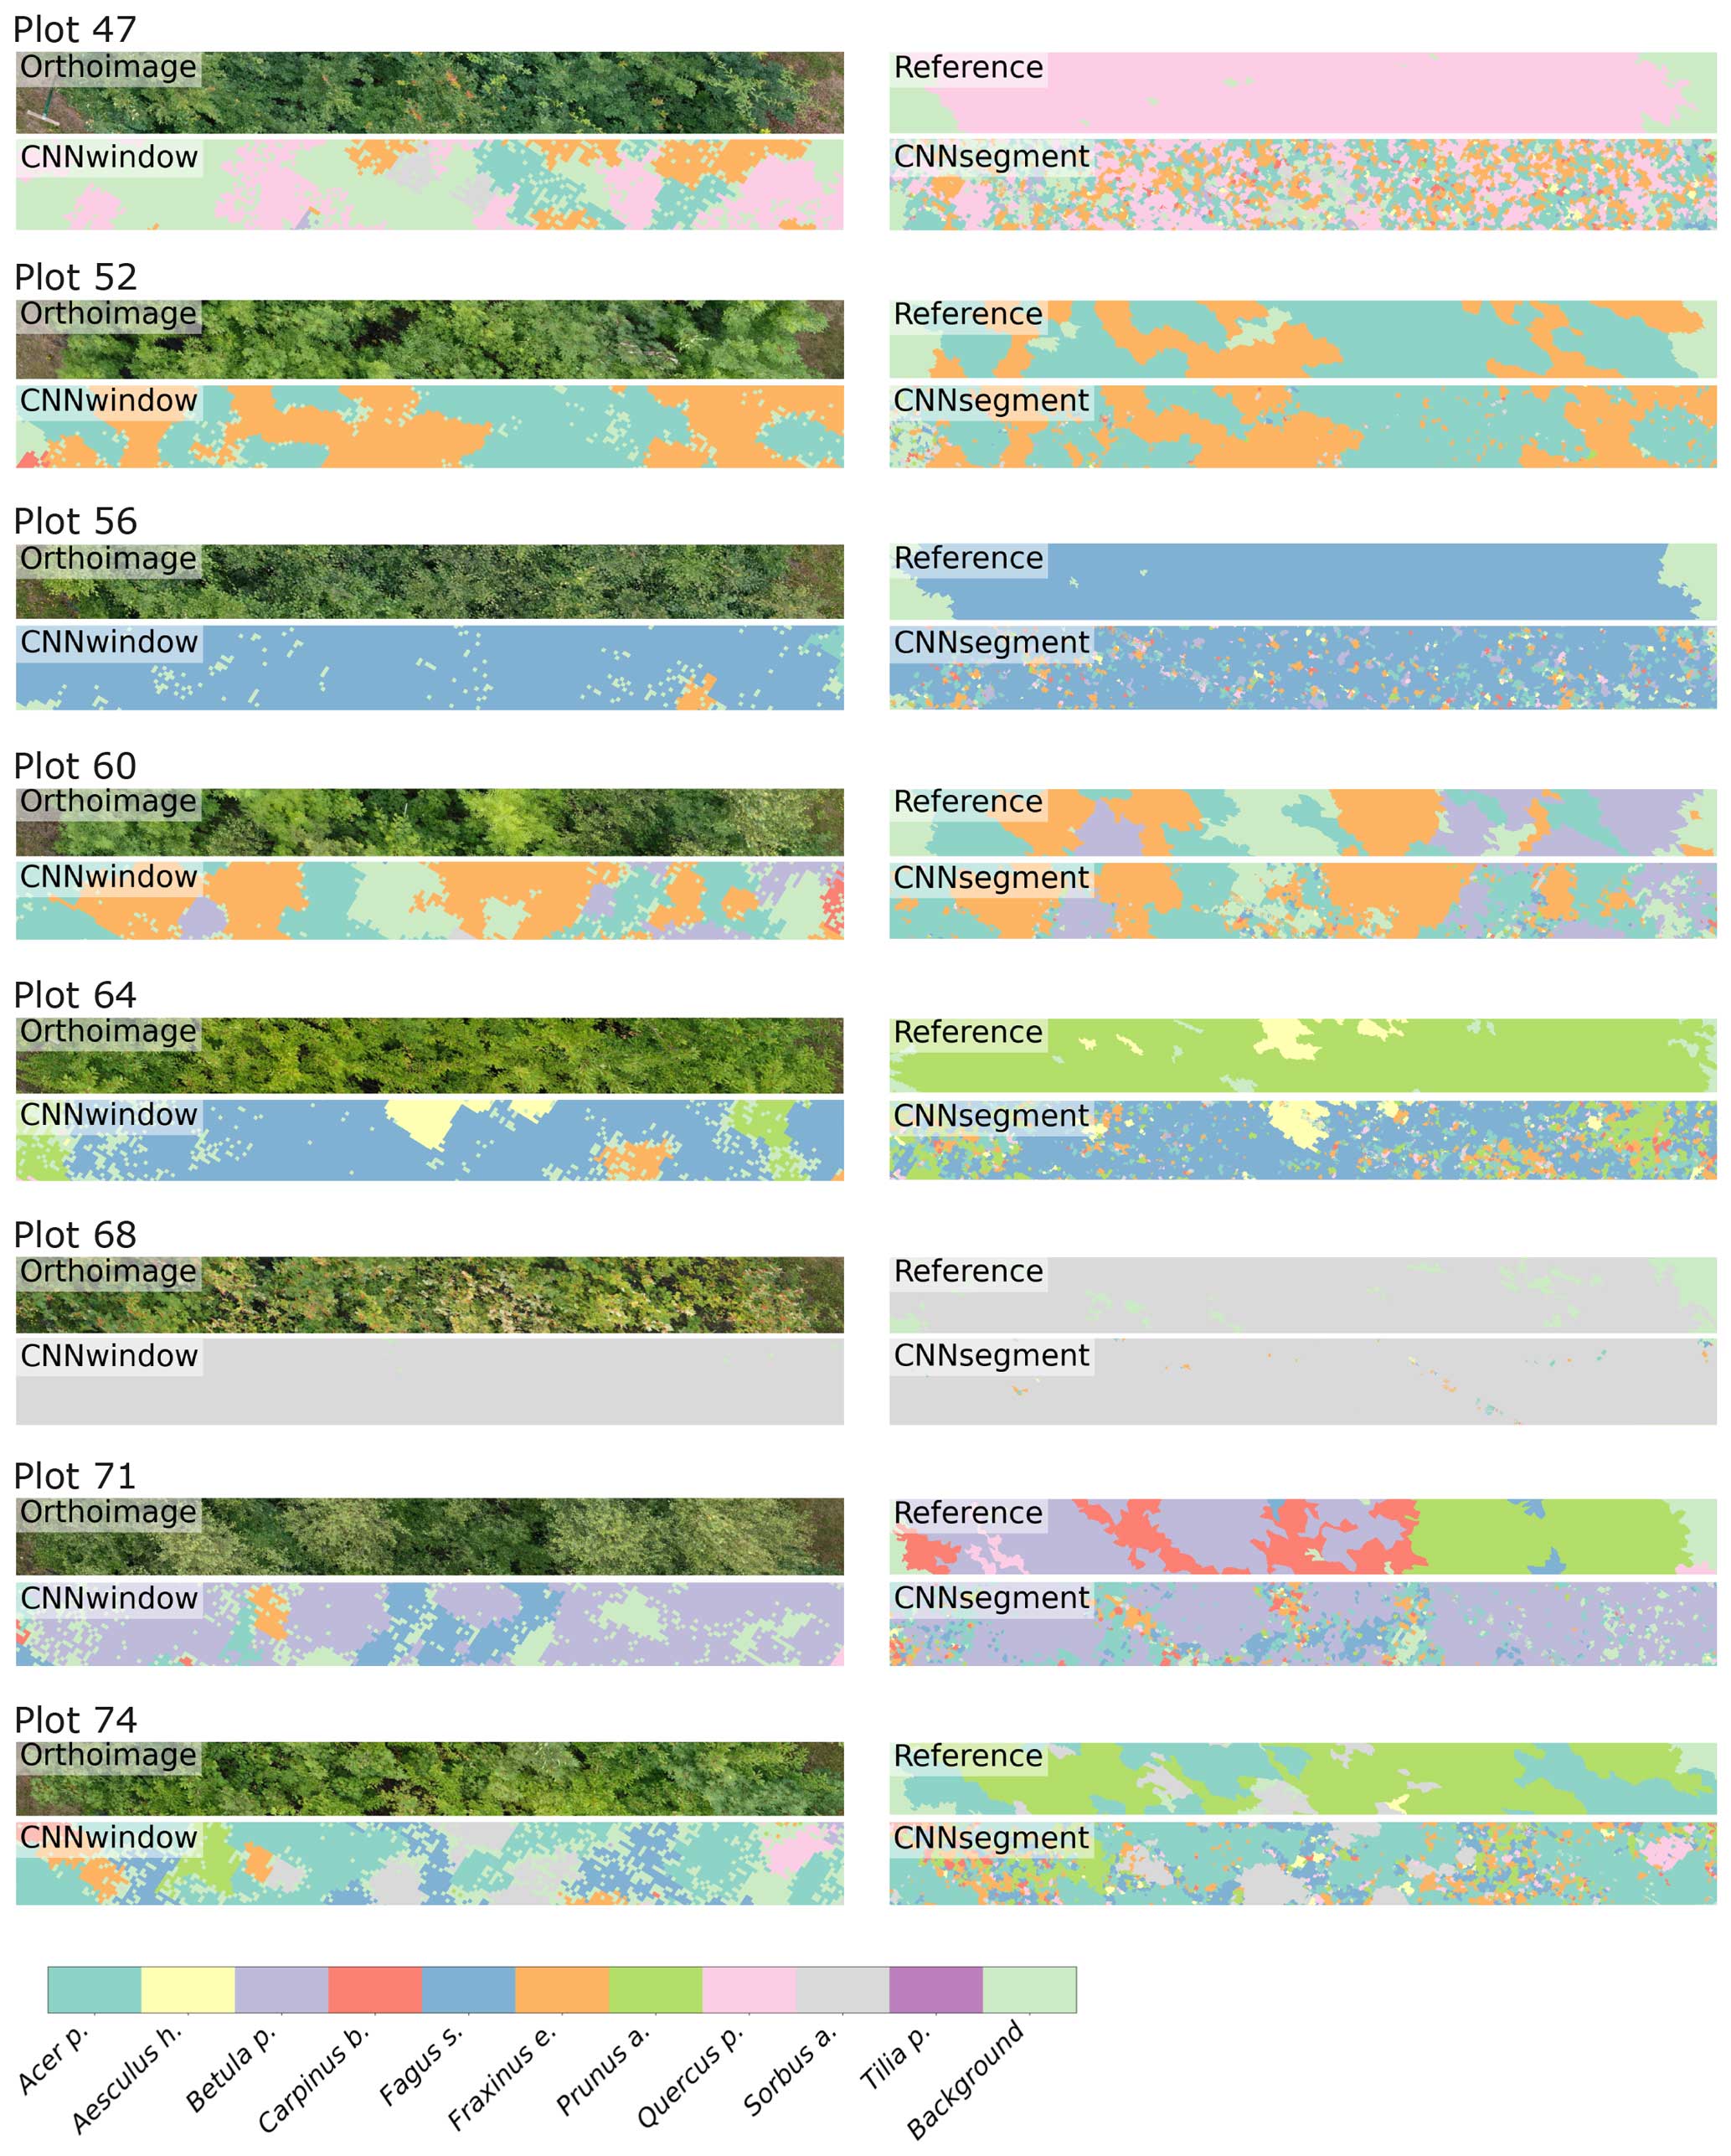
Figure A8The 2 m × 20 m transects of selected plots, including the orthoimage, the reference, CNNwindow predictions, and CNNsegment predictions.
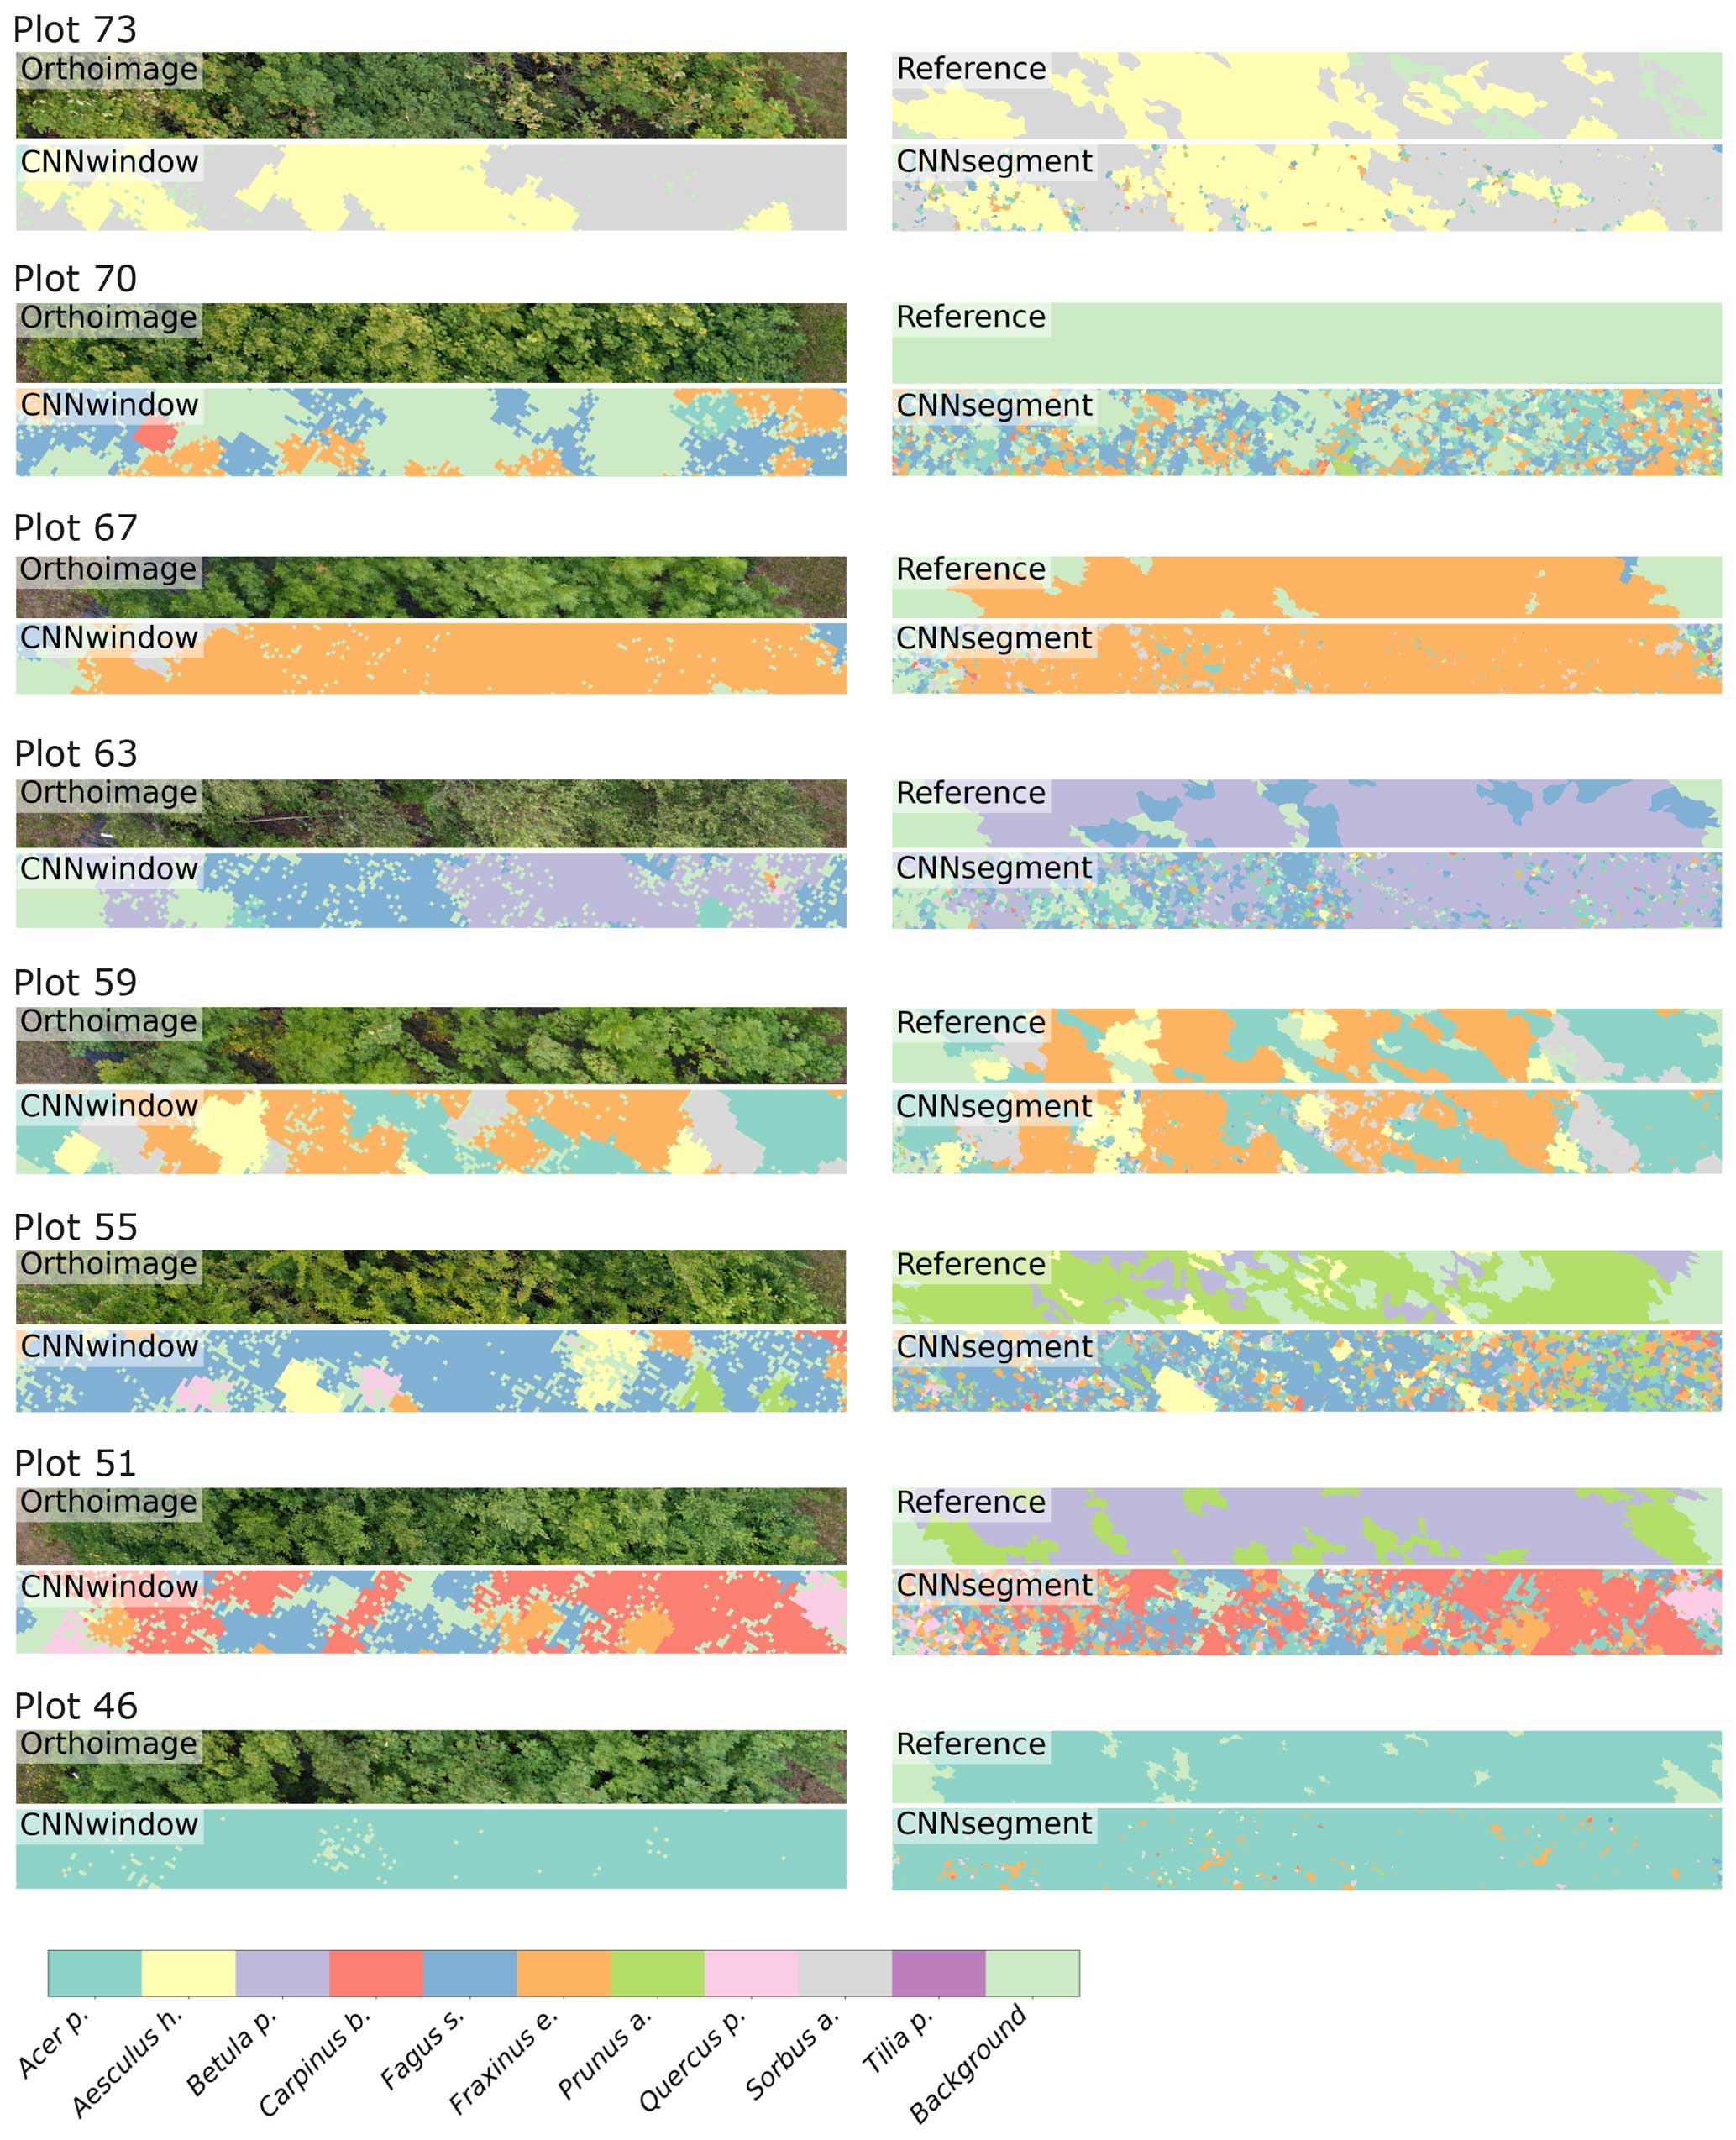
Figure A9The 2 m × 20 m transects of selected plots, including the orthoimage, the reference, CNNwindow predictions, and CNNsegment predictions.
A2 Confusion matrix
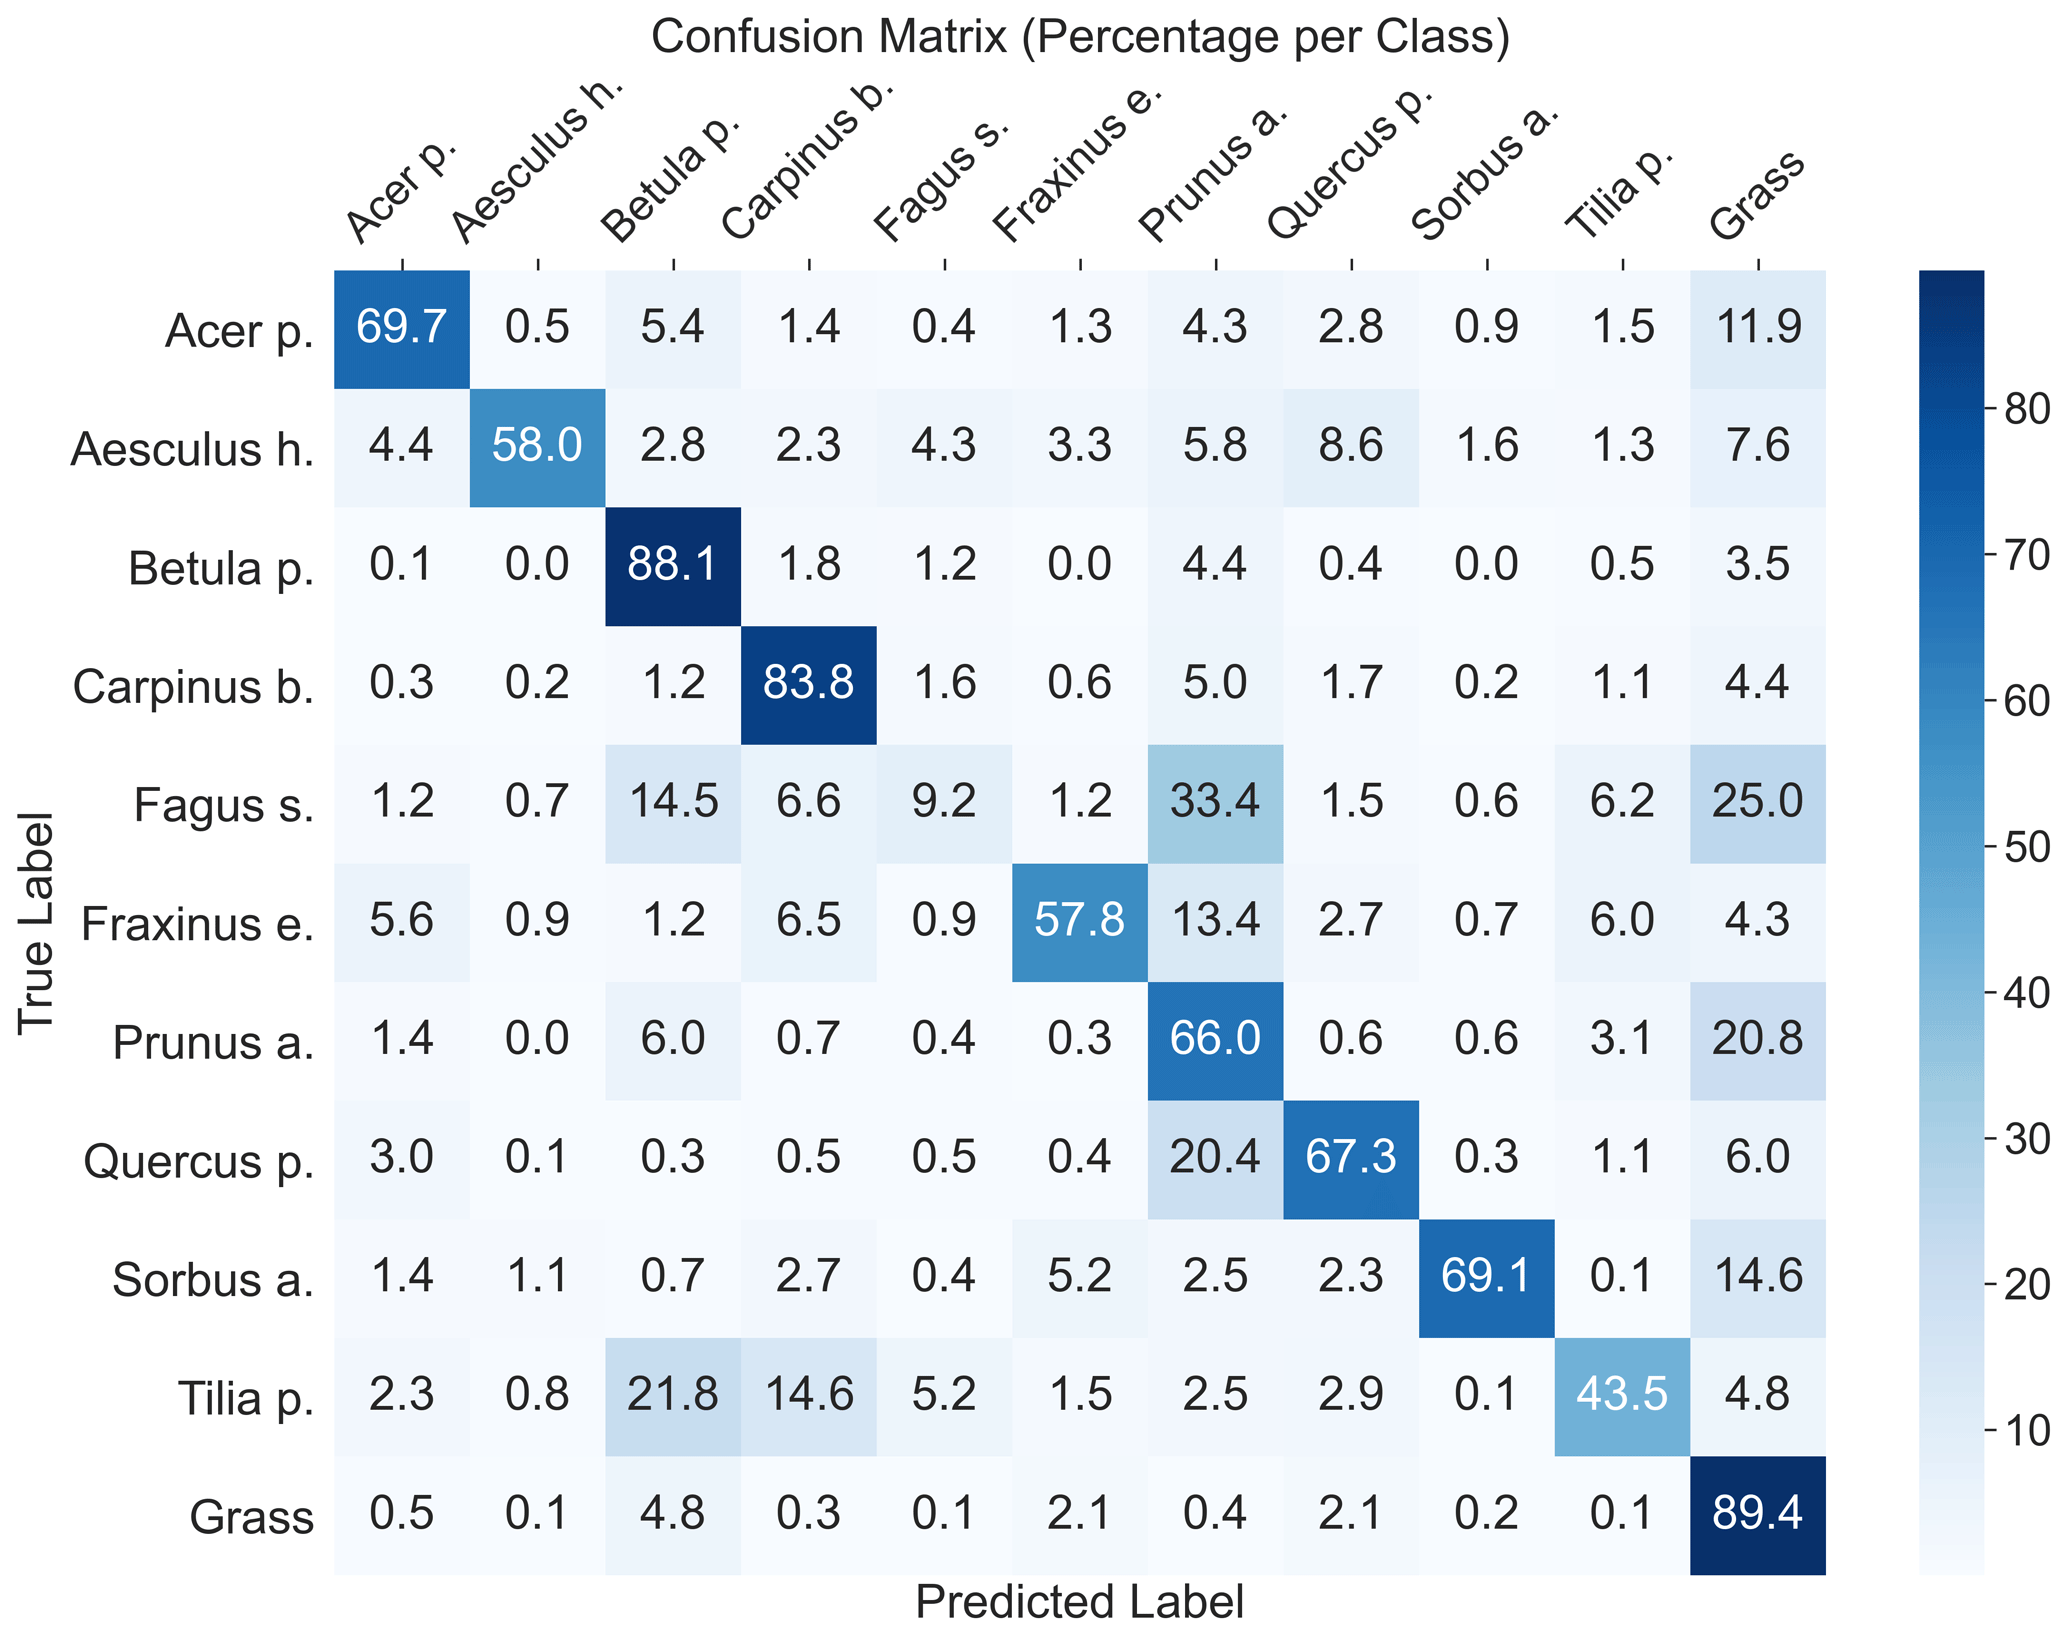
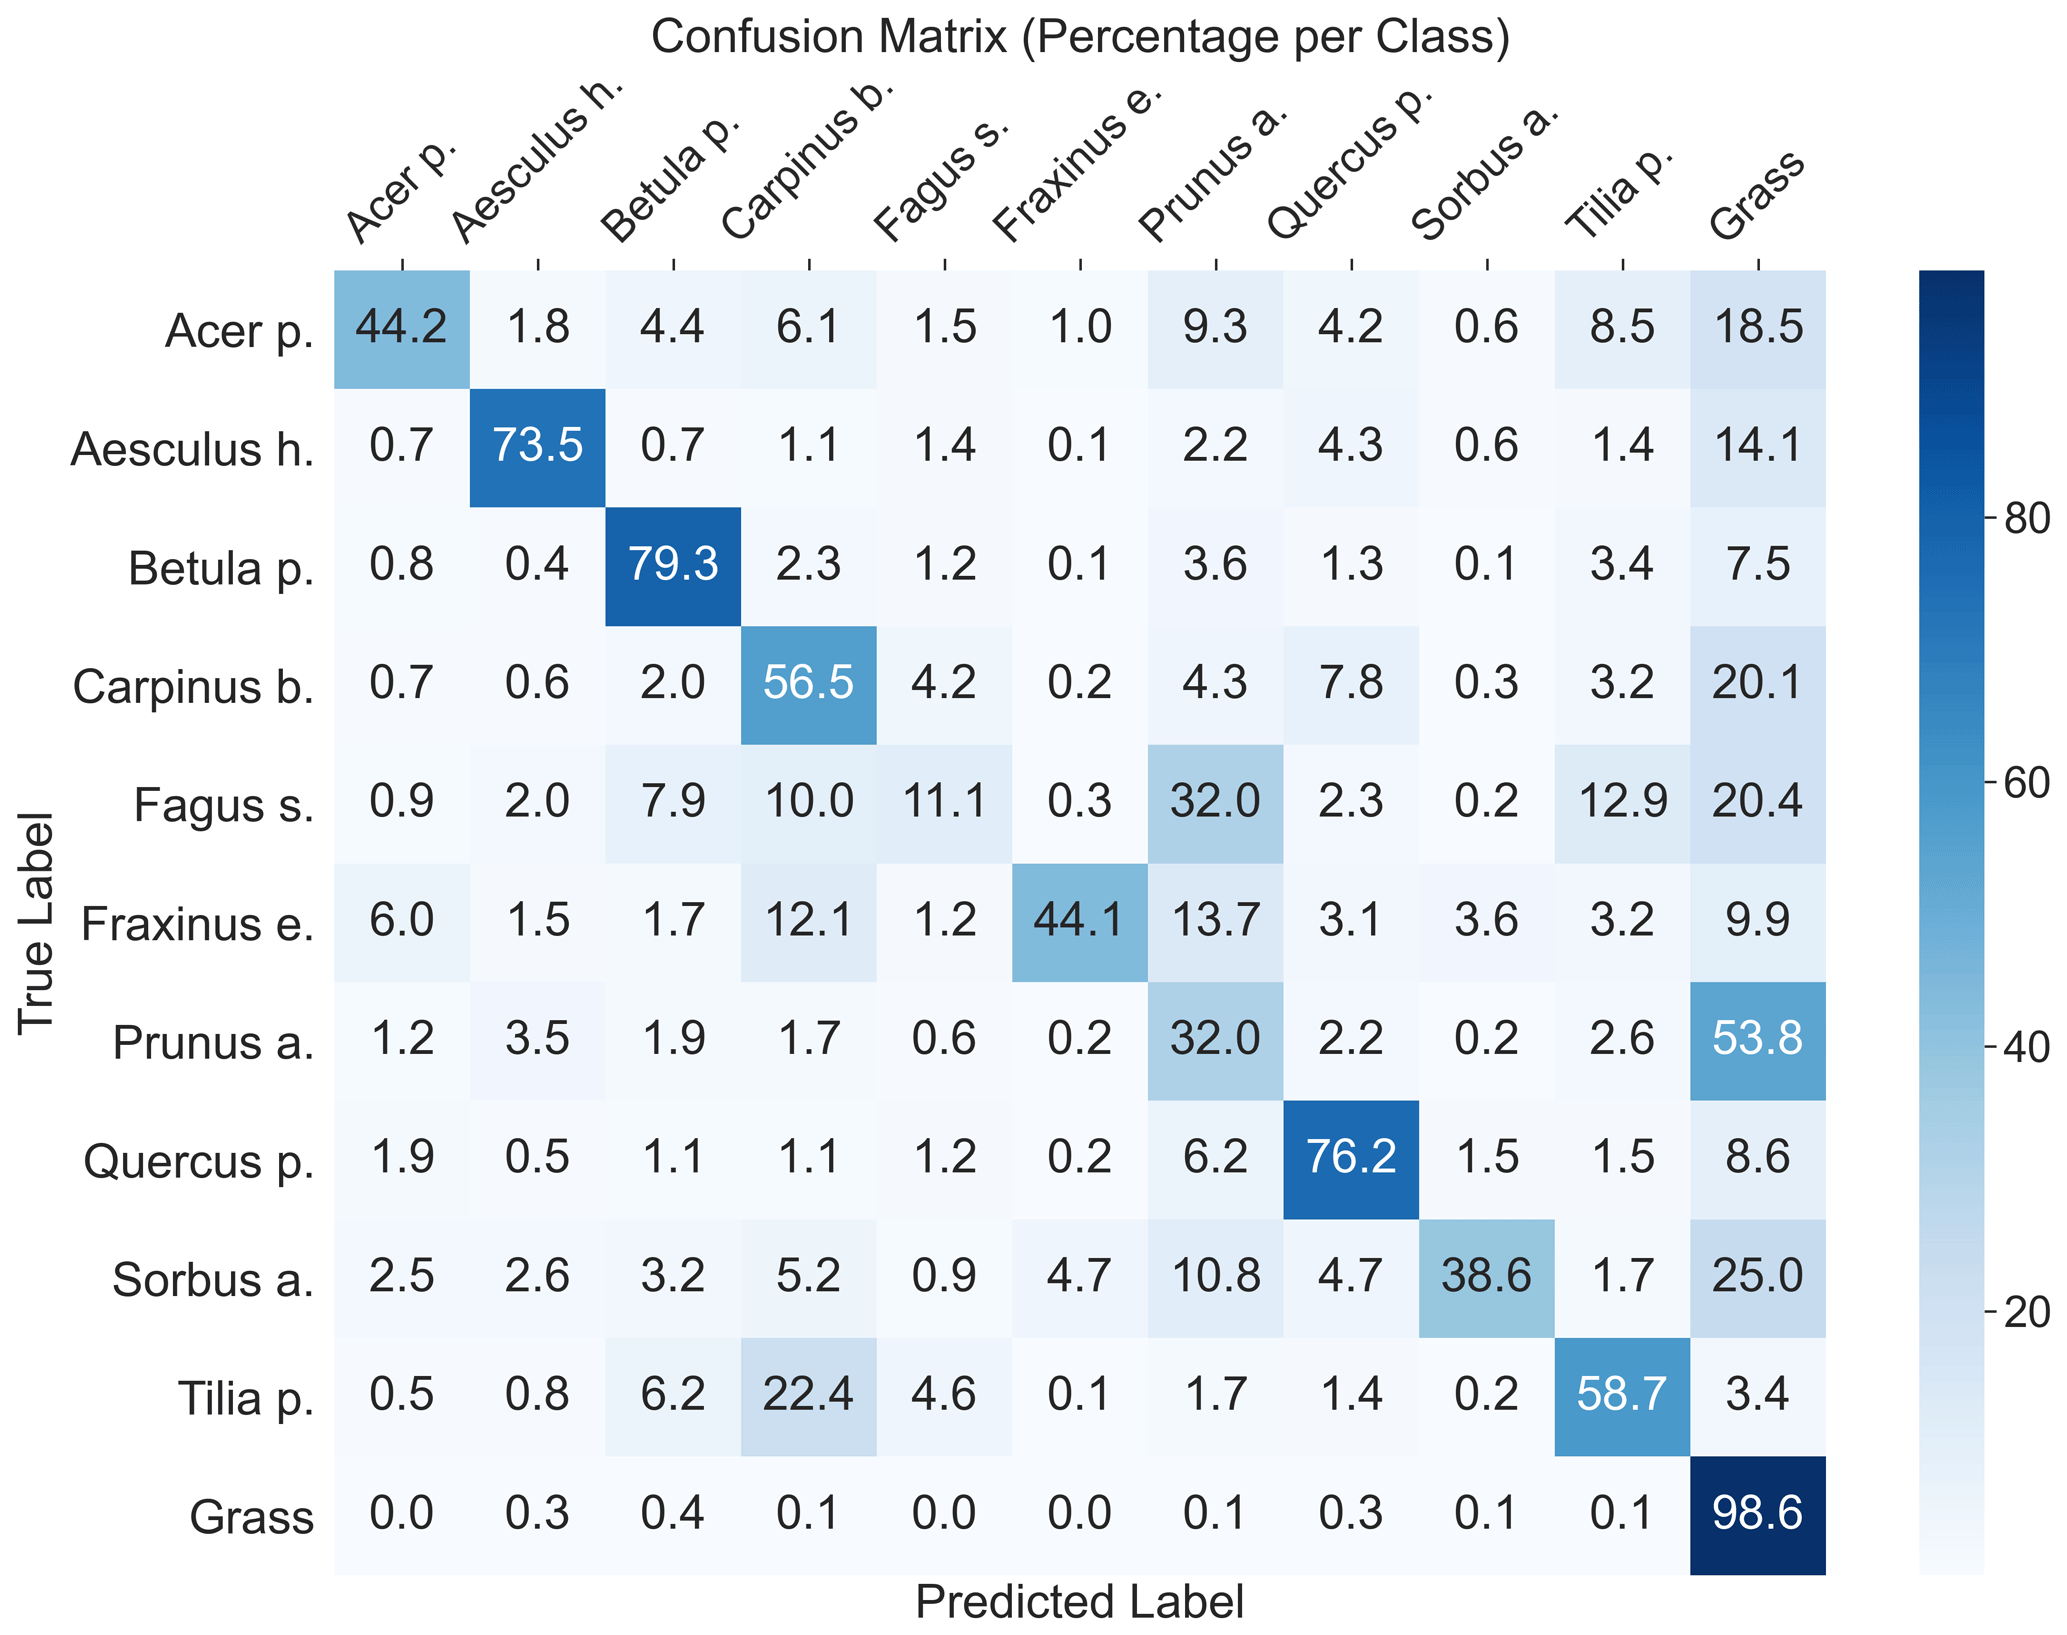
Figure A11Normalized confusion matrix of the CNN segment model applied to the OrthoSeptember.
A3 Data preprocessing
To reduce the heterogeneity of crowd-sourced photographs and match them with the UAV perspective, we filtered the photographs based on their acquisition distance and plant leaf visibility. The model achieved an R2=0.7 and F1 =0.8 on independent test data for both variables. Using predicted acquisition distance and tree trunk presence information for each photograph, we tested different filtering thresholds and combinations prior to training the CNNwindow model for plant species classification. The best result was achieved by filtering out photographs taken from distances outside the range of 0.3–15 m and excluding photographs that were identified by the trained CNN classifier as containing tree trunks with a probability >0.5.
A4 Citizen science data availability
Table A1Number of downloaded photographs for selected tree species from the iNaturalist and Pl@ntNet datasets.
A5 Segmentation model architecture
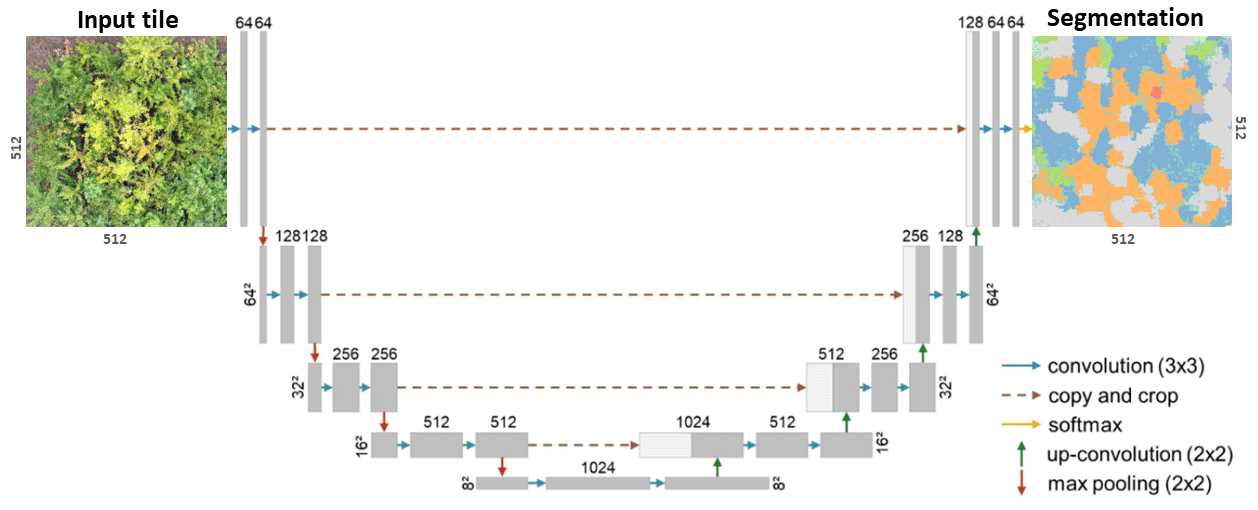
Figure A12A modified version (adapted from Schiefer et al., 2020) of the U-Net CNN architecture for segmenting plant species from UAV orthoimages (Ronneberger et al., 2015).
A6 CNN window species mixture box plot
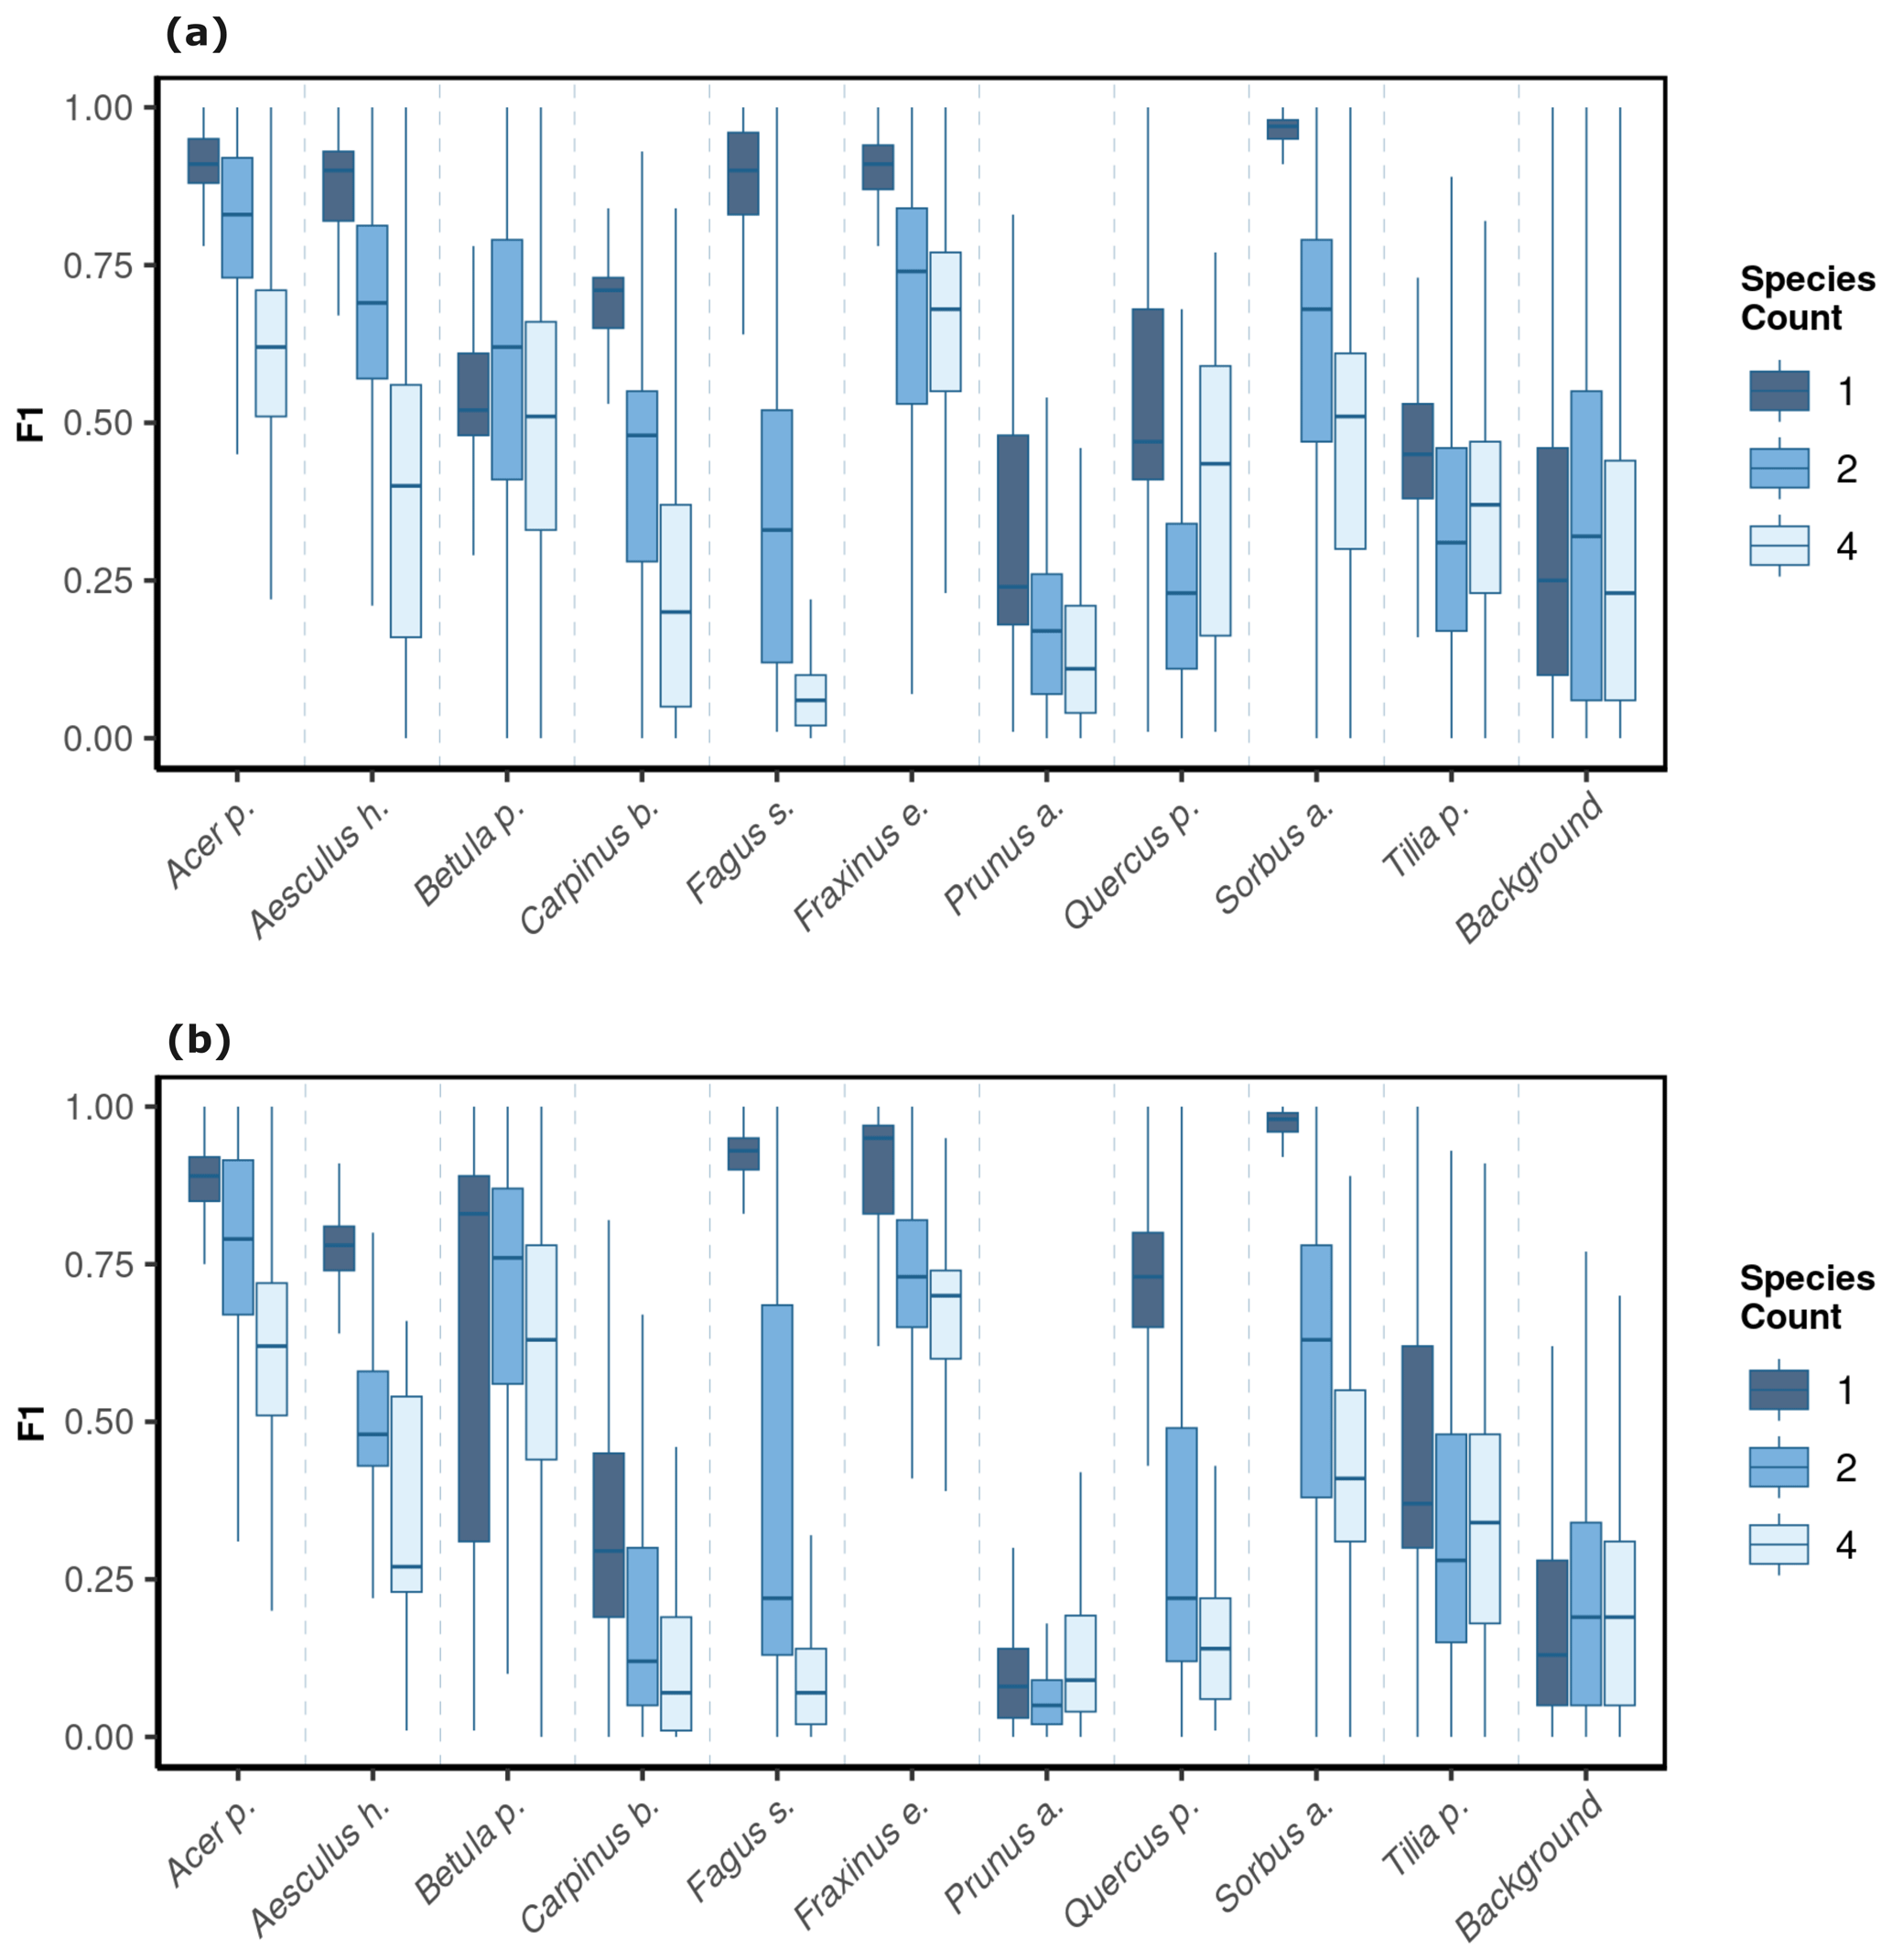
Figure A13The model performance (F1 score) of the CNNwindow model across a gradient of canopy complexity in OrthoJuly (a) and OrthoSeptember (b).
The code used in this study is publicly accessible via the GitHub repository at https://github.com/salimsoltani28/CrowdVision2TreeSegment (Kattenborn and Soltani, 2023). The data supporting the findings of this research are available on Zenodo at https://doi.org/10.5281/zenodo.10019552 (Kattenborn and Soltani, 2023).
SS contributed to the conceptualization, methodology, formal analysis, data curation, visualization, and writing – original draft preparation. OF provided resources and contributed to writing – review and editing. NE also provided resources and contributed to writing – review and editing. HF contributed to funding acquisition, supervision, and writing – review and editing. TK contributed to conceptualization, data collection, funding acquisition, data curation, resource acquisition, supervision, and writing – original draft preparation.
The contact author has declared that none of the authors has any competing interests.
Publisher's note: Copernicus Publications remains neutral with regard to jurisdictional claims made in the text, published maps, institutional affiliations, or any other geographical representation in this paper. While Copernicus Publications makes every effort to include appropriate place names, the final responsibility lies with the authors.
Salim Soltani and Teja Kattenborn acknowledge funding from the German Research Foundation (DFG) within the framework of BigPlantSens (Assessing the Synergies of Big Data and Deep Learning for the Remote Sensing of Plant Species; project no. 444524904) and PANOPS (Revealing Earth's plant functional diversity with citizen science; project no. 504978936). Salim Soltani and Hannes Feilhauer acknowledge financial support from the Federal Ministry of Education and Research of Germany (BMBF) and the Sächsische Staatsministerium für Wissenschaft, Kultur und Tourismus within the framework of the Center of Excellence for AI Research “Center for Scalable Data Analytics and Artificial Intelligence Dresden/Leipzig” program (project ID ScaDS.AI). Nico Eisenhauer and Olga Ferlian acknowledge funding from the DFG (German Centre for Integrative Biodiversity Research, FZT118, and Gottfried Wilhelm Leibniz Prize, Ei 862/29-1). Moreover, the authors acknowledge support from University of Freiburg with respect to open-access publishing.
This research has been supported by the German Research Foundation (DFG) within the framework of BigPlantSens (grant no. 44452490) and PANOPS (grant no. 04978936).
This paper was edited by Paul Stoy and reviewed by two anonymous referees.
Affouard, A., Goëau, H., Bonnet, P., Lombardo, J.-C., and Joly, A.: Pl@ntnet app in the era of deep learning, in: ICLR: International Conference on Learning Representations, April 2017, Toulon, France, ffhal-01629195f, 2017. a, b
Bayraktar, E., Basarkan, M. E., and Celebi, N.: A low-cost UAV framework towards ornamental plant detection and counting in the wild, ISPRS J. Photogramm., 167, 1–11, https://doi.org/10.1016/j.isprsjprs.2020.06.012, 2020. a
Boone, M. E. and Basille, M.: Using iNaturalist to contribute your nature observations to science, EDIS, 2019, 5–5, 2019. a, b, c
Bouguettaya, A., Zarzour, H., Kechida, A., and Taberkit, A. M.: Deep learning techniques to classify agricultural crops through UAV imagery: A review, Neural Comput. Appl., 34, 9511–9536, 2022. a
Braga, G., J. R., Peripato, V., Dalagnol, R., P. Ferreira, M., Tarabalka, Y., OC Aragão, L. E., F. de Campos Velho, H., Shiguemori, E. H., and Wagner, F. H.: Tree crown delineation algorithm based on a convolutional neural network, Remote Sens., 12, 1288, https://doi.org/10.3390/rs12081288, 2020. a
Brandt, M., Tucker, C. J., Kariryaa, A., Rasmussen, K., Abel, C., Small, J., Chave, J., Rasmussen, L. V., Hiernaux, P., Diouf, A. A., Kergoat, L., Mertz, O., Igel, C., Gieseke, F., Schöning, J., Li, S., Melocik, K., Meyer, J., Sinno, S., Romero, E., Glennie, E., Montagu, A., Dendoncker, M., and Fensholt, R.: An unexpectedly large count of trees in the West African Sahara and Sahel, Nature, 587, 78–82, https://doi.org/10.1038/s41586-020-2824-5, 2020. a
Brodrick, P. G., Davies, A. B., and Asner, G. P.: Uncovering ecological patterns with convolutional neural networks, Trends Ecol. Evol., 34, 734–745, https://doi.org/10.1016/j.tree.2019.03.006, 2019. a
Chandler, M., See, L., Copas, K., Bonde, A. M., López, B. C., Danielsen, F., Legind, J. K., Masinde, S., Miller-Rushing, A. J., Newman, G., Rosemartin, A., and Turak, E.: Contribution of citizen science towards international biodiversity monitoring, Biol. Conserv., 213, 280–294, https://doi.org/10.1016/j.biocon.2016.09.004, 2017. a
Cherif, E., Feilhauer, H., Berger, K., Dao, P. D., Ewald, M., Hank, T. B., He, Y., Kovach, K. R., Lu, B., Townsend, P. A., and Kattenborn, T.: From spectra to plant functional traits: Transferable multi-trait models from heterogeneous and sparse data, Remote Sens. Environ., 292, 113580, https://doi.org/10.1016/j.rse.2023.113580, 2023. a
Cloutier, M., Germain, M., and Laliberté, E.: Influence of Temperate Forest Autumn Leaf Phenology on Segmentation of Tree Species from UAV Imagery Using Deep Learning, bioRxiv, 2023–08, https://doi.org/10.1101/2023.08.03.548604, 2023. a, b, c
Curnick, D. J., Davies, A. J., Duncan, C., Freeman, R., Jacoby, D. M., Shelley, H. T., Rossi, C., Wearn, O. R., Williamson, M. J., and Pettorelli, N.: SmallSats: a new technological frontier in ecology and conservation?, Remote Sensing in Ecology and Conservation, 8, 139–150, https://doi.org/10.1002/rse2.239, 2021. a
De Sa, N. C., Castro, P., Carvalho, S., Marchante, E., López-Núñez, F. A., and Marchante, H.: Mapping the flowering of an invasive plant using unmanned aerial vehicles: is there potential for biocontrol monitoring?, Front. Plant Sci., 9, 293, https://doi.org/10.3389/fpls.2018.00293, 2018. a
Di Cecco, G. J., Barve, V., Belitz, M. W., Stucky, B. J., Guralnick, R. P., and Hurlbert, A. H.: Observing the observers: How participants contribute data to iNaturalist and implications for biodiversity science, BioScience, 71, 1179–1188, https://doi.org/10.1093/biosci/biab093, 2021. a, b, c
Fassnacht, F. E., Latifi, H., Stereńczak, K., Modzelewska, A., Lefsky, M., Waser, L. T., Straub, C., and Ghosh, A.: Review of studies on tree species classification from remotely sensed data, Remote Sens. Environ., 186, 64–87, https://doi.org/10.1016/j.rse.2016.08.013, 2016. a, b, c
Ferlian, O., Cesarz, S., Craven, D., Hines, J., Barry, K. E., Bruelheide, H., Buscot, F., Haider, S., Heklau, H., Herrmann, S., Kühn, P.,Pruschitzki, U., Schädler, M., Wagg, C., Weigelt, A., Wubet, T., and Eisenhauer, N.: Mycorrhiza in tree diversity–ecosystem function relationships: conceptual framework and experimental implementation, Ecosphere, 9, e02226, https://doi.org/10.1002/ecs2.2226, 2018. a
Fraisl, D., Hager, G., Bedessem, B., Gold, M., Hsing, P.-Y., Danielsen, F., Hitchcock, C. B., Hulbert, J. M., Piera, J., Spiers, H., Thiel, M., and Haklay, M.: Citizen science in environmental and ecological sciences, Nature Reviews Methods Primers, 2, 64, https://doi.org/10.1038/s43586-022-00144-4, 2022. a
Fricker, G. A., Ventura, J. D., Wolf, J. A., North, M. P., Davis, F. W., and Franklin, J.: A convolutional neural network classifier identifies tree species in mixed-conifer forest from hyperspectral imagery, Remote Sens., 11, 2326, https://doi.org/10.3390/rs11192326, 2019. a
Galuszynski, N. C., Duker, R., Potts, A. J., and Kattenborn, T.: Automated mapping of Portulacaria afra canopies for restoration monitoring with convolutional neural networks and heterogeneous unmanned aerial vehicle imagery, PeerJ, 10, e14219, https://doi.org/10.7717/peerj.14219, 2022. a, b
GBIF: GBIF: the global biodiversity information facility, 2019. a
Hoeser, T. and Kuenzer, C.: Object detection and image segmentation with deep learning on earth observation data: A review-part i: Evolution and recent trends, Remote Sens., 12, 1667, https://doi.org/10.3390/rs12101667, 2020. a
iNaturalist: iNaturalist, https://www.inaturalist.org, last access: 4 September 2023. a, b
Ivanova, N. and Shashkov, M.: The possibilities of GBIF data use in ecological research, Russ. J. Ecol., 52, 1–8, 2021. a
Johnston, A., Matechou, E., and Dennis, E. B.: Outstanding challenges and future directions for biodiversity monitoring using citizen science data, Methods in Ecol. Evol., 14, 103–116, https://doi.org/10.1111/2041-210X.13834, 2023. a
Joly, A., Bonnet, P., Goëau, H., Barbe, J., Selmi, S., Champ, J., Dufour-Kowalski, S., Affouard, A., Carré, J., Molino, J. F., Boujemaa, N., and Barthélémy, D.: A look inside the Pl@ ntNet experience: The good, the bias and the hope, Multimedia Syst., 22, 751–766, 2016. a, b
Kattenborn, T. and Soltani, S.: CrowdVision2TreeSegment, Zenodo [data set], https://doi.org/10.5281/zenodo.10019552, 2023. a, b
Kattenborn, T., Eichel, J., and Fassnacht, F. E.: Convolutional Neural Networks enable efficient, accurate and fine-grained segmentation of plant species and communities from high-resolution UAV imagery, Sci. Rep., 9, 1–9, https://doi.org/10.1038/s41598-019-53797-9, 2019a. a
Kattenborn, T., Lopatin, J., Förster, M., Braun, A. C., and Fassnacht, F. E.: UAV data as alternative to field sampling to map woody invasive species based on combined Sentinel-1 and Sentinel-2 data, Remote Sens. Environ., 227, 61–73, https://doi.org/10.1016/j.rse.2019.03.025, 2019b. a
Kattenborn, T., Leitloff, J., Schiefer, F., and Hinz, S.: Review on Convolutional Neural Networks (CNN) in vegetation remote sensing, ISPRS J. Photogramm., 173, 24–49, https://doi.org/10.1016/j.isprsjprs.2020.12.010, 2021. a, b, c, d, e, f, g
Kattenborn, T., Schiefer, F., Frey, J., Feilhauer, H., Mahecha, M. D., and Dormann, C. F.: Spatially autocorrelated training and validation samples inflate performance assessment of convolutional neural networks, ISPRS Open Journal of Photogrammetry and Remote Sensing, 5, 100018, https://doi.org/10.1016/j.ophoto.2022.100018, 2022. a
Leitão, P. J., Schwieder, M., Pötzschner, F., Pinto, J. R., Teixeira, A. M., Pedroni, F., Sanchez, M., Rogass, C., van der Linden, S., Bustamante, M. M. and Hostert, P.: From sample to pixel: multi-scale remote sensing data for upscaling aboveground carbon data in heterogeneous landscapes, Ecosphere, 9, e02298, https://doi.org/10.1002/ecs2.2298, 2018. a
Lopatin, J., Fassnacht, F. E., Kattenborn, T., and Schmidtlein, S.: Mapping plant species in mixed grassland communities using close range imaging spectroscopy, Remote Sens. Environ., 201, 12–23, https://doi.org/10.1016/j.rse.2017.08.031, 2017. a
Lopatin, J., Dolos, K., Kattenborn, T., and Fassnacht, F. E.: How canopy shadow affects invasive plant species classification in high spatial resolution remote sensing, Remote Sens. Ecol. Conserv., 5, 302–317, https://doi.org/10.1002/rse2.109, 2019. a, b
Ma, L., Liu, Y., Zhang, X., Ye, Y., Yin, G., and Johnson, B. A.: Deep learning in remote sensing applications: A meta-analysis and review, ISPRS J. Photogramm., 152, 166–177, https://doi.org/10.1016/j.isprsjprs.2019.04.015, 2019. a
Mäder, P., Boho, D., Rzanny, M., Seeland, M., Wittich, H. C., Deggelmann, A., and Wäldchen, J.: The flora incognita app–interactive plant species identification, Methods in Ecol. Evol., 12, 1335–1342, https://doi.org/10.1111/2041-210X.13611, 2021. a
Maes, W. H. and Steppe, K.: Perspectives for remote sensing with unmanned aerial vehicles in precision agriculture, Trends Plant Sci., 24, 152–164, https://doi.org/10.1016/j.tplants.2018.11.007, 2019. a
Milas, A. S., Arend, K., Mayer, C., Simonson, M. A., and Mackey, S.: Different colours of shadows: Classification of UAV images, Int. J. Remote Sens., 38, 3084–3100, https://doi.org/10.1080/01431161.2016.1274449, 2017. a
Molls, C.: The Obs-Services and their potentials for biodiversity data assessments with a test of the current reliability of photo-identification of Coleoptera in the field, Tijdschrift voor Entomologie, 164, 143–153, 2021. a
Müllerová, J., Brundu, G., Große-Stoltenberg, A., Kattenborn, T., and Richardson, D. M.: Pattern to process, research to practice: remote sensing of plant invasions, Biol. Invasions, 25, 3651–3676, https://doi.org/10.1007/s10530-023-03150-z, 2023. a
Ronneberger, O., Fischer, P., and Brox, T.: U-net: Convolutional networks for biomedical image segmentation, in: International Conference on Medical image computing and computer-assisted intervention, Springer, 234–241, https://doi.org/10.1007/978-3-319-24574-4_28, 2015. a, b
Rzanny, M., Mäder, P., Deggelmann, A., Chen, M., and Wäldchen, J.: Flowers, leaves or both? How to obtain suitable images for automated plant identification, Plant Methods, 15, 1–11, https://doi.org/10.1186/s13007-019-0462-4, 2019. a
Schiefer, F., Kattenborn, T., Frick, A., Frey, J., Schall, P., Koch, B., and Schmidtlein, S.: Mapping forest tree species in high resolution UAV-based RGB-imagery by means of convolutional neural networks, ISPRS J. Photogramm., 170, 205–215, https://doi.org/10.1016/j.isprsjprs.2020.10.015, 2020. a, b, c, d, e, f, g
Schiefer, F., Schmidtlein, S., Frick, A., Frey, J., Klinke, R., Zielewska-Büttner, K., Junttila, S., Uhl, A., and Kattenborn, T.: UAV-based reference data for the prediction of fractional cover of standing deadwood from Sentinel time series, ISPRS Open Journal of Photogrammetry and Remote Sensing, 8, 100034, https://doi.org/10.1016/j.ophoto.2023.100034, 2023. a
Schiller, C., Schmidtlein, S., Boonman, C., Moreno-Martínez, A., and Kattenborn, T.: Deep learning and citizen science enable automated plant trait predictions from photographs, Sci. Rep., 11, 1–12, 2021. a, b, c
Schmitt, M., Prexl, J., Ebel, P., Liebel, L., and Zhu, X. X.: Weakly supervised semantic segmentation of satellite images for land cover mapping–challenges and opportunities, arXiv [preprint], https://doi.org/10.48550/arXiv.2002.08254, 2020. a
Soltani, S., Feilhauer, H., Duker, R., and Kattenborn, T.: Transfer learning from citizen science photographs enables plant species identification in UAVs imagery, ISPRS Open Journal of Photogrammetry and Remote Sensing, 5, 100016, https://doi.org/10.1016/j.ophoto.2022.100016, 2022. a, b, c, d, e, f, g, h, i
Sun, Z., Wang, X., Wang, Z., Yang, L., Xie, Y., and Huang, Y.: UAVs as remote sensing platforms in plant ecology: review of applications and challenges, J. Plant Ecol., 14, 1003–1023, https://doi.org/10.1093/jpe/rtab089, 2021. a, b
Tan, M. and Le, Q.: Efficientnet: Rethinking model scaling for convolutional neural networks, in: International conference on machine learning, 6105–6114, PMLR, Long Beach, California, 10–15 June 2019, https://doi.org/10.48550/arXiv.1905.11946, 2019. a
van Der Velde, M., Goëau, H., Bonnet, P., d’Andrimont, R., Yordanov, M., Affouard, A., Claverie, M., Czúcz, B., Elvekjær, N., Martinez-Sanchez, L., and Rotllan-Puig, X.: Pl@ ntNet Crops: merging citizen science observations and structured survey data to improve crop recognition for agri-food-environment applications, Environ. Res. Lett., 18, 025005, https://doi.org/10.1088/1748-9326/acadf3, 2023. a
Van Horn, G., Mac Aodha, O., Song, Y., Cui, Y., Sun, C., Shepard, A., Adam, H., Perona, P., and Belongie, S.: The inaturalist species classification and detection dataset, in: Proceedings of the IEEE conference on computer vision and pattern recognition, Salt Lake City, Utah, USA 18–22 June 2018, 8769–8778, 2018. a, b
Van Horn, G., Cole, E., Beery, S., Wilber, K., Belongie, S., and Mac Aodha, O.: Benchmarking Representation Learning for Natural World Image Collections, in: Proceedings of the IEEE/CVF Conference on Computer Vision and Pattern Recognition, virtual, 19–25 June 2021, https://doi.org/10.48550/arXiv.2103.16483, 12884–12893, 2021. a
Wagner, F. H.: The flowering of Atlantic Forest Pleroma trees, Sci. Rep., 11, 1–20, https://doi.org/10.1038/s41598-021-99304-x, 2021. a
Zhou, Z.-H.: A brief introduction to weakly supervised learning, Natl. Sci. Rev., 5, 44–53, https://doi.org/10.1093/nsr/nwx106, 2018. a