the Creative Commons Attribution 4.0 License.
the Creative Commons Attribution 4.0 License.
 | 23 Jul 2024
Climate-based prediction of carbon fluxes from deadwood in Australia
Elizabeth S. Duan
Luciana Chavez Rodriguez
Nicole Hemming-Schroeder
Baptiste Wijas
Habacuc Flores-Moreno
Alexander W. Cheesman
Lucas A. Cernusak
Michael J. Liddell
Paul Eggleton
Amy E. Zanne
Steven D. Allison
Deadwood is an important yet understudied carbon pool in tropical ecosystems. Deadwood degradation to CO2 through decomposer (microbial, termite) activities is driven by wood moisture and temperature, which are in turn strongly influenced by local climate. Thus, climate data could be used to predict CO2 fluxes from decaying wood. Given the increasing availability of gridded climate data, this link would allow for the rapid estimation of deadwood-related CO2 fluxes from tropical ecosystems worldwide. In this study, we adapted a mechanistic fuel moisture model that uses weather variables (e.g., air temperature, precipitation, solar radiation) to simulate wood moisture and temperature along a rainfall gradient in Queensland, Australia. We then developed a Bayesian statistical relationship between wood moisture and temperature and CO2 flux from pine (Pinus radiata) blocks and combined this relationship with our simulations to predict CO2 fluxes from deadwood at 1 h temporal resolution. We compared our pine-based simulations to the moisture–CO2 relationships from stems of native tree species deployed at the wettest and driest sites. Finally, we integrated fluxes over time to estimate the amount of carbon entering the atmosphere and compared these estimates to measured mass loss in pines and native stems. Our statistical model showed a positive relationship between CO2 fluxes and wood moisture and temperature. Comparing cumulative CO2 with wood mass loss, we observed that carbon from deadwood decomposition is mainly released as CO2 regardless of the precipitation regime. At the dry savanna, only about 20 % of the wood mass loss was decomposed within 48 months, compared to almost 100 % at the wet rainforest, suggesting longer residence times of deadwood compared to wetter sites. However, the amount of carbon released in situ as CO2 is lower when wood blocks are attacked by termites, especially at drier sites. These results highlight the important but understudied role of termites in the breakdown of deadwood in dry climates. Additionally, mass loss–flux relationships of decaying native stems deviated from those of pine blocks. Our results indicate that wood moisture and temperature are necessary but not sufficient for predicting CO2 fluxes from deadwood degradation. Other factors, such as wood traits (wood quality, chemical composition, and stoichiometry) and biotic processes, should be considered in future modeling efforts.
- Article
(5019 KB) - Full-text XML
-
Supplement
(16215 KB) - BibTeX
- EndNote


Tropical and subtropical forests are important ecosystems in the global terrestrial carbon (C) cycle (Raich et al., 2006; Mitchard, 2018; Taylor et al., 2017). In 2020, they made up 61 % of the global tree cover by area (FAO, 2020). Within tropical forests, deadwood, including fallen trees and branches, stumps, and dead standing trees (Woldendorp and Keenan, 2005), can account for more than 50 % of the aboveground C stock (Progar et al., 2000; Pfeifer et al., 2015; Wu et al., 2020). Deadwood is also considered a stable C pool due to its long residence time (Pfeifer et al., 2015) and provides ecological services such as habitat for plants and soil fauna (Gale, 2000; Woldendorp and Keenan, 2005; Yan et al., 2006; Liu et al., 2006; Gómez-Brandón et al., 2017; Kumar et al., 2017). Despite its global importance, deadwood remains an understudied terrestrial carbon pool (Gale, 2000; Pfeifer et al., 2015).
Tropical deadwood is mainly cycled biotically through activities of wood-dwelling microorganisms, such as fungi, and invertebrates, such as termites (Ulyshen, 2016; Griffiths et al., 2019; Zanne et al., 2022). Invertebrates are responsible for the mechanical breakdown of wood, while fungi and other microbes secrete digestive enzymes to break down wood chemically (Ulyshen, 2016). The activities of these decomposers are controlled by site-specific environmental conditions (Zhou et al., 2007). Moisture and temperature affect microbial (Hu et al., 2017) and termite activity (Cheesman et al., 2018; Clement et al., 2021; Kim et al., 2021; Zanne et al., 2022), as well as fungal species composition and richness (Pouska et al., 2017; Olou et al., 2019; Dossa et al., 2021), by modulating enzyme production and activity (Pichler et al., 2012; Green et al., 2022) and defining microhabitats suitable for microbial and invertebrate activity (Yoon et al., 2015). Thus, these two variables indirectly affect deadwood degradation by modifying degradation rates (Hagemann et al., 2010; Hu et al., 2018). Quantifying how environmental conditions influence deadwood degradation rates is necessary to understand the variation in CO2 fluxes from tropical forests across time and space (Cornwell et al., 2009).
There is little consensus around which factors control deadwood degradation and CO2 fluxes from decaying deadwood. Chambers et al. (2000) found that temperature is the best predictor of CO2 fluxes from decaying wood in forests. However, according to Rowland et al. (2013), this might only be true for temperate forests where stronger temperature gradients are observed, whereas moisture levels are more consistent. The interaction of these two factors could also be important for controlling deadwood degradation rates (Forrester et al., 2012). Precipitation, coupled with high moisture content, increases degradation rates only at high temperatures (Seibold et al., 2021), and high temperatures compensate for slower degradation rates under dry conditions by increasing enzyme kinetics (A'Bear et al., 2014).
Most studies use climate variables, such as air temperature and precipitation, to represent the microclimate where deadwood decay occurs and to predict CO2 fluxes from decaying wood (Chambers et al., 2000; Zhou et al., 2007; Hu et al., 2018; Cheesman et al., 2018; Kim et al., 2021). Even though there is a clear coupling between climate variables and microclimate, unique conditions independent of climate may occur under the forest canopy (Floriancic et al., 2023). Thus, the microclimate of wood degradation may be better represented by directly considering wood moisture and temperature. Few studies in ecology have measured wood moisture content and temperature directly, and those that have are limited to a low temporal resolution or impacted by wood degradation processes if using sensors (Woodall et al., 2020; Green et al., 2022). A low temporal resolution of wood moisture and temperature might mask daily and seasonal variations in these variables. Consequently, variations in CO2 fluxes from deadwood decay will not be well represented (Green et al., 2022), impeding our understanding of the C budget from forest ecosystems.
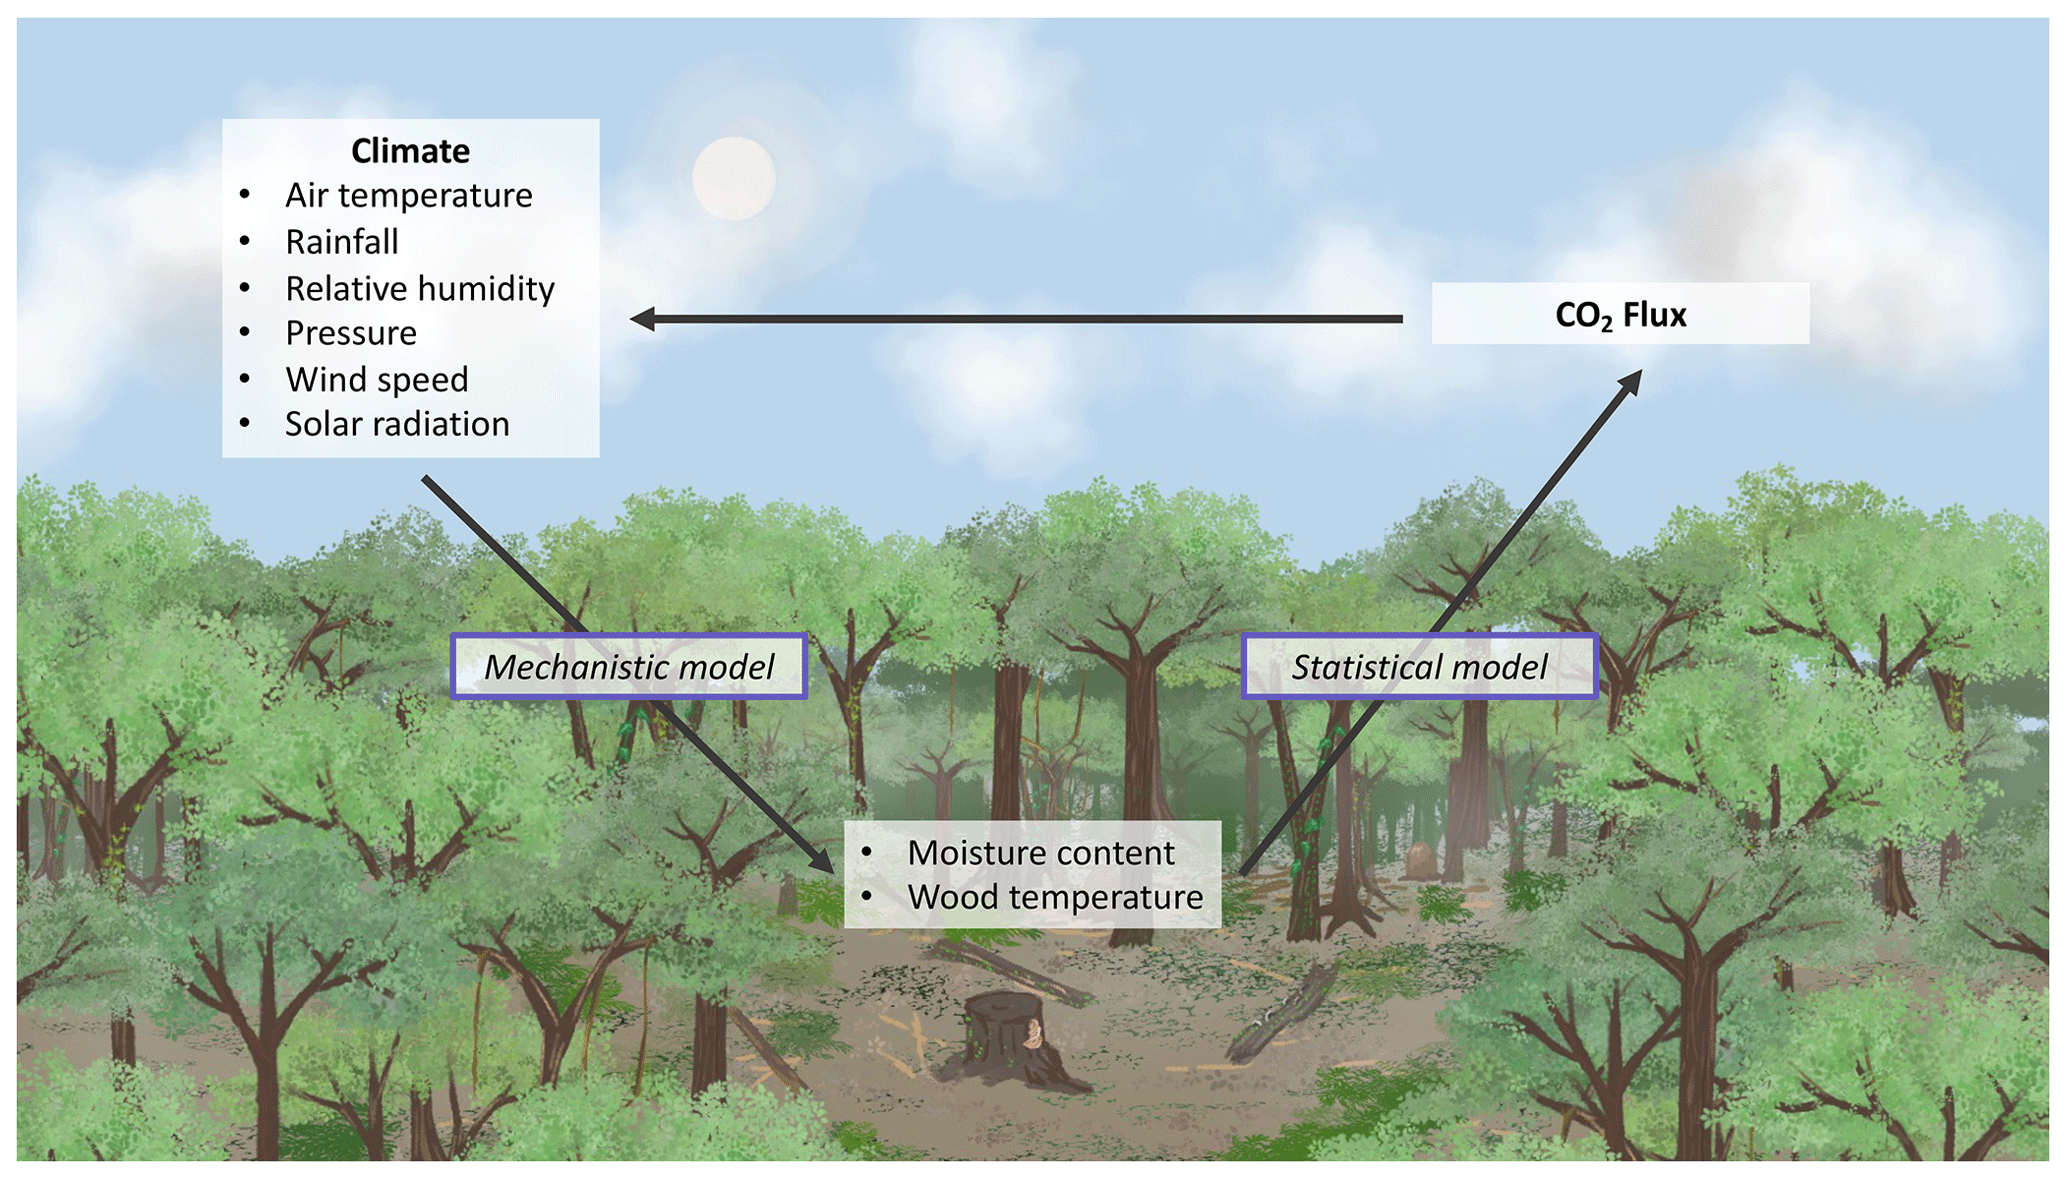
Figure 1Conceptual model of interactions between wood moisture and temperature and CO2 fluxes from decaying wood. Weather variables influence wood moisture and temperature, which in turn influences deadwood degradation and the release of CO2 back into the atmosphere. Finally, altered CO2 concentration in the atmosphere affects local and regional climate as well as future climate patterns. In this study, we used a mechanistic model to derive wood moisture and temperature from weather data and a statistical model to relate them to CO2 flux.
In this study, we predict CO2 fluxes from tropical deadwood degradation using wood moisture and temperature. Taking advantage of gridded climate data from remote sensing (Stackhouse, 2006; Nguyen et al., 2019) and mechanistic fuel moisture content (FMC) models, typically used for firefighting and forestry management (Matthews, 2014), we simulate wood moisture and temperature across a precipitation gradient in Australia. These models use weather variables (air temperature, rainfall, solar radiation, air humidity, and wind speed) to estimate FMC and temperature (Nelson, 2000; Matthews, 2006), explaining up to 94 % of the variance in measured FMC (van der Kamp et al., 2017). Considering the importance of moisture in deadwood decay and given the ability of FMC models to predict FMC from climate, FMC models are a good candidate for downscaling weather variables to wood moisture and temperature for predictions of CO2 fluxes from deadwood decomposition (Fig. 1).
To evaluate the link between weather data, wood moisture and temperature, and CO2 fluxes from deadwood decomposition, we adapted a mechanistic FMC model by van der Kamp et al. (2017) to simulate these variables along a precipitation gradient spanning dry savanna to wet rainforest ecosystems. Similar climate-based moisture content models have also been developed for timber structure risk assessment and successfully capture daily and seasonal moisture content trends (Hansson et al., 2012). Our approach has the potential to provide wood moisture and temperature at an hourly time resolution. In this paper, we refer to deadwood moisture data collected through processing experimental wood blocks as moisture content and data collected by the Campbell CS506 moisture sensor as FMC data. From the perspective of wood integrity and durability, extensive literature in wood material sciences suggests a positive correlation between wood decay and wood moisture and/or temperature (Viitanen, 1997; Brischke and Rapp, 2008a). Additionally, wood moisture and temperature are better predictors of wood decay than macroclimate (Brischke et al., 2006; Brischke and Rapp, 2008a, b; van Niekerk et al., 2021). We extended this idea and further hypothesized that cumulative mass loss of pine blocks corresponds to CO2 flux predicted from wood moisture and temperature. If other pathways of mass loss are active, such as termite-mediated decay, then cumulative mass loss should exceed predictions of cumulative CO2 flux from deadwood. Likewise, we hypothesized that the strength of the relationship between wood moisture and temperature and CO2 fluxes should differ across our precipitation gradient. Finally, we provide additional mechanistic explanations of factors influencing deadwood decomposition in our study site.
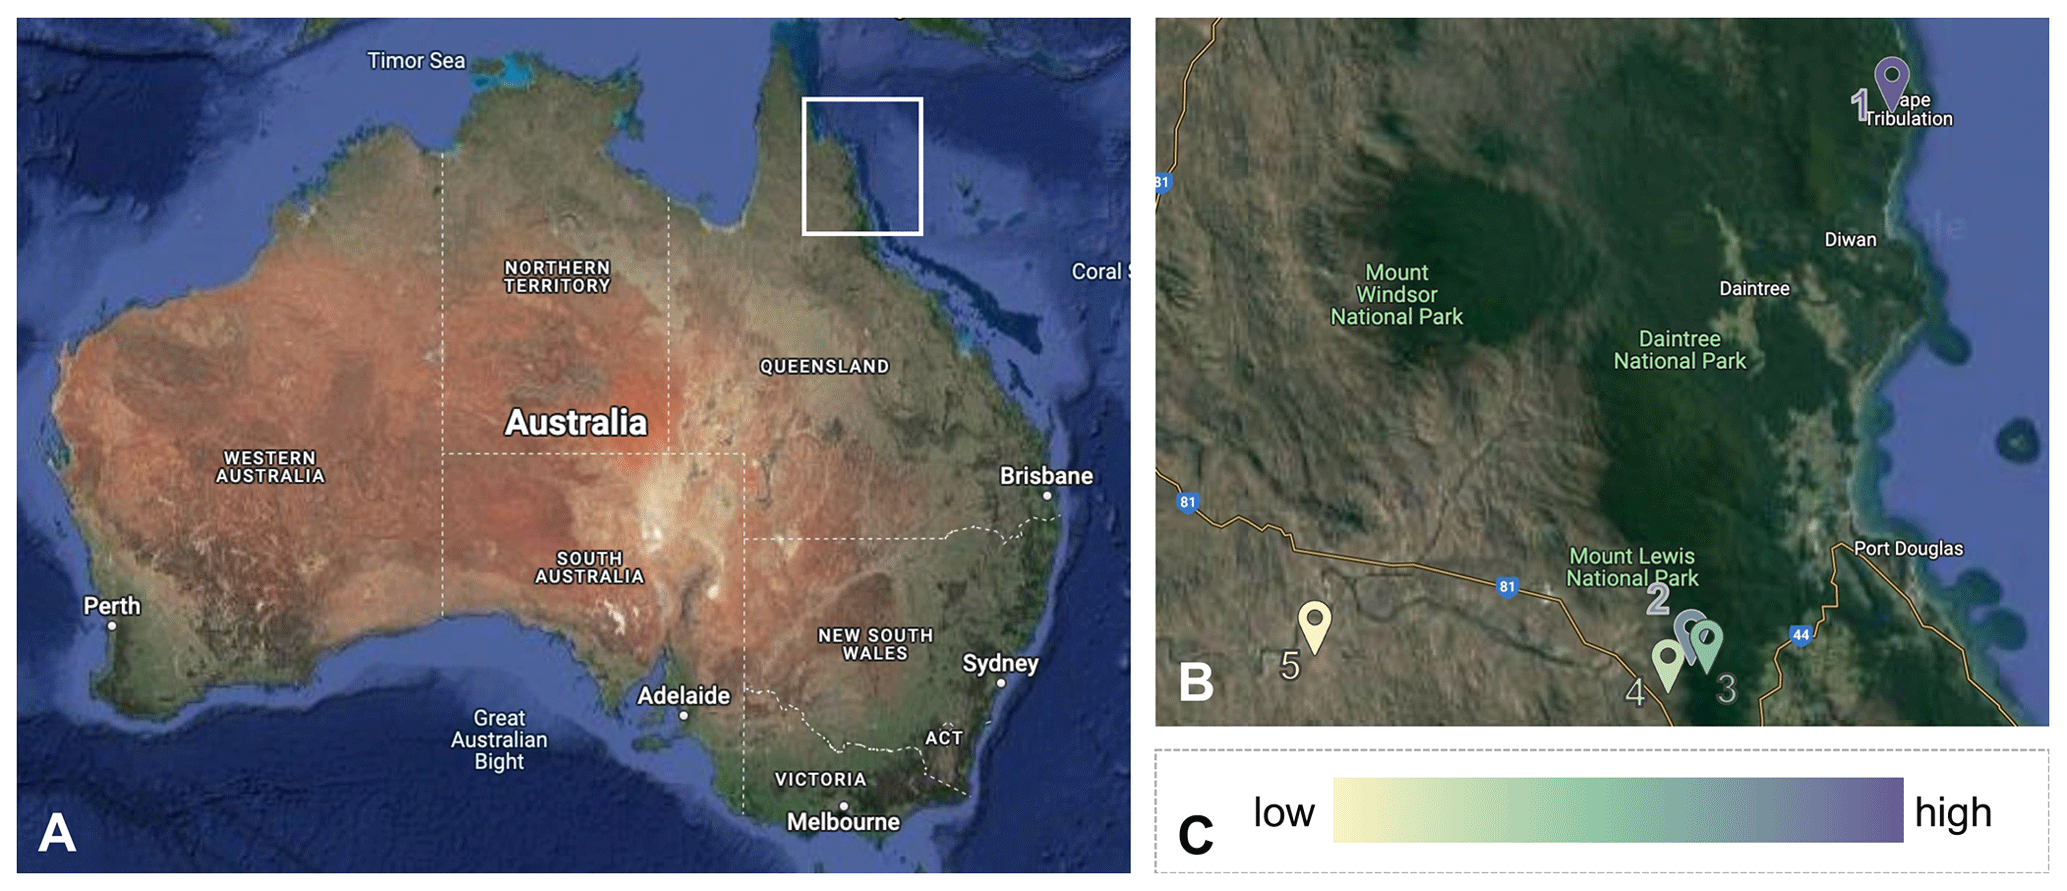
Figure 2Study sites across the precipitation gradient in Australia. The five study sites are in northeastern Australia (a) along a 75 km rainfall gradient. In (b), sites are numbered from wettest to driest (1. wet rainforest, 2. dry rainforest, 3. sclerophyll, 4. wet savanna, 5. dry savanna). Images are obtained from Google Earth (https://earth.google.com/, last access: 13 June 2024).(c) Color schemes are used to differentiate the sites. Lower precipitation is indicated by a lighter color. © Google Earth.
2.1 Study site and experimental design
2.1.1 Site description
The study was conducted at five sites along a 75 km rainfall gradient (960–4250 mm yr−1) in tropical northeastern Australia from June 2018 to June 2022 (https://www.bom.gov.au, last access: 6 March 2023, 1989–2019). From greatest to least rainfall, the sites (Fig. 2) are as follows: James Cook University's Daintree Rainforest Observatory (wet rainforest; 16.1012° S, 145.4444° E) and the Australian Wildlife Conservancy's Brooklyn Sanctuary Mt. Lewis Rainforest (dry rainforest; 16.5933° S, 145.2743° E), Mt. Lewis Sclerophyll (sclerophyll; 16.5830° S, 145.2620° E), Station Creek (wet savanna; 16.610° S, 145.2400° E), and Pennyweight Outstation (dry savanna; 16.5746° S, 144.9163° E). Site descriptors (e.g., wet, dry) are relative to our gradient.
2.1.2 Pine and common garden experimental setups
Two experiments were started in June 2018: a pine experiment and a native species common garden experiment. The pine experiment was set up to determine if CO2 fluxes from deadwood differed across all five sites in the rainfall gradient. At each site, pine (Pinus radiata) blocks (9 cm × 9 cm × 5 cm) were deployed in five plots. Pine blocks were cut from pine planks obtained from a sawmill. They were harvested from trees grown for timber, so the blocks were likely heartwood. We used this method as we followed a standard protocol for assessing termite activity developed by Cheesman et al. (2018). For each time point, two blocks enclosed in 280 µm lumite® mesh (BioQuip) were deployed in each plot to represent two insect access treatments: one completely closed to exclude insect activity and another with 10 holes, 5 mm in diameter, in the mesh to allow insect access. Blocks were deployed and harvested at 6, 12, 18, 24, 30, 36, 42, and 48 months to capture seasonal variation in CO2 fluxes (2 insect access treatments × 8 harvests × 5 plots × 5 sites = 400 blocks deployed).
The native species common garden experiment included a similar experimental setup to the pine experiment, with wood stems only deployed in the driest and wettest sites. Native stems were harvested directly from our field sites and include heartwood and sapwood (additional details in Law et al., 2023). Stems (∼ 7 cm diameter and ∼ 10 cm length) of native trees were used to assess variation in decomposition across sites. Native stems were harvested and placed in either wet rainforest (10 species) or dry savanna (6 species) at the sites where they were harvested. There were no overlapping species between sites. Stems were harvested after 12, 18, 24, 30, 36, and 42 months (Table S3 in the Supplement). Additional details of the experimental setup are described in Law et al. (2023).
2.1.3 Harvest and CO2 flux measurements
During harvests, blocks and stems were removed from their mesh bags, and any accumulated organic matter was removed. Wood pieces were examined for termite and soil presence. An initial field weight was taken, and CO2 flux from the wood was measured with an infrared gas analyzer (Los Gatos ultraportable greenhouse gas analyzer with a LI-COR long-term chamber, model 8100–104). We used a soil collar (20 cm diameter) to which we affixed a plexiglass bottom. The bottom was used to create a closed chamber, and we ensured there were no leaks. After the wood sample was equilibrated in the chamber for 60 s, CO2 concentration (ppm) and chamber temperature (°C) were measured over 180 s. Block or stem volume was then measured using water displacement. Each wood sample was separated into intact wood (wood pieces with structural integrity), carton (created from termite activity), soil (any soil that entered the bag), and excess (wood shavings and chips) with each component weighed individually. As we were only interested in CO2 fluxes coming from wood, samples which were majority soil or carton were removed from analysis (Fig. S1 in the Supplement). Final mass was determined after stems and blocks were dried in an oven at 100 °C to a constant weight. The proportion of mass loss was calculated using the following formula:
The CO2 flux rate was calculated using the formula derived by Dossa et al. (2015):
where RS is the respiration rate, ΔCO2 is the change in the concentration of CO2 over time, M is the molar mass of CO2 (44.01 g mol−1), P is the pressure, Pi is the standard pressure (1013.25 mbar), Vc is the volume of the chamber (4.27 or 4.58 L), Vs is the volume of the stem, Vi is the standard volume (22.4 L), Ti is the standard temperature (273.15 K), Tc is the temperature of the chamber in degrees Celsius, and Ws is the dry weight of the stems or wood blocks. ΔCO2 was determined by taking the slope of the linear fit to CO2 readings plotted over the first 170 s of the 180 s measurement in case of time mismatches between the chamber and software clocks. Samples with non-significant (p > 0.05) linear fits were removed from the analysis (Fig. S1, 3 % of total samples). Additionally, blocks harvested at 6 months were excluded from analysis as block volume was not measured. The final rates were represented in units of micrograms of CO2 per second per gram of wood ().
2.2 Wood moisture and temperature: observations and modeling
2.2.1 Wood moisture and temperature observations
We considered wood moisture content and temperature during flux measurements. We used the temperature of the LI-COR chamber (Tc) to represent wood temperature. Wood moisture content was calculated with fresh and dry weights of intact wood using the following formula:
2.2.2 Wood moisture and temperature modeling
- a.
Model description.
We modeled wood moisture and temperature using the fuel moisture model of van der Kamp et al. (2017). Briefly, the model considers a standard wood dowel for fuel moisture measurements to be divided into an inner core (“c”) and an outer layer (“o”). The inner core and the outer layer exchange energy and moisture, but only the outer layer exchanges energy and moisture with the environment.
The main components of the energy budget of the wood dowel part of the sensor are (i) the incoming longwave radiation (Labs), (ii) diffuse (Kabs-diff) and direct (Kabs-dir) shortwave radiation, (iii) emitted longwave radiation (Lemit), (iv) sensible (Qh) and latent (Qe) heat flux, and (v) heat conduction (C) to and from the wood dowel core. The main components of the moisture budget of the sensor are (i) the incoming precipitation (Pabs), (ii) evaporation flux from the wood dowel (E), and (iii) moisture diffusion (D) to and from the wood dowel core. Model outputs include temperature and moisture.
The original model expresses all energy fluxes in watts per square meter and all moisture fluxes in kilograms per second. However, because our climate dataset was constructed at an hourly temporal resolution (Duan et al., 2023), we adjusted all model energy and moisture fluxes to be expressed in joules per square meter per hour and kilograms per hour, respectively. Similarly, all model parameters and time-dependent parameters are expressed in units per hour (Table S3).
A detailed description of the model formulations can be found in van der Kamp et al. (2017). We present the following minor modifications.
- 1.
Canopy emissivity (εc) – we introduced an empirical approach to simulate canopy emissivity dependent on leaf and soil emissivity as proposed by Francois et al. (1997):
where εg (–) is the ground emissivity fixed to 0.95 (Francois et al., 1997), εv (–) is the vegetation emissivity fixed to 0.965 (Francois et al., 1997), and cv is the contribution coefficient of the vegetation set to 0.5.
- 2.
Precipitable water content (w) – precipitable water content was determined using Prata's empirical approximation (Prata, 1996):
where Ce is an empirical parameter that, unlike in van der Kamp et al. (2017), is set to 46.5 cm K hPa−1 for robust predictions (Prata, 1996), and HP is the humidity parameter (hPa K−1):
where e0 (kPa) is the saturation vapor pressure calculated with the Magnus-type equation described in Alduchov and Eskridge (1996) and Koutsoyiannis (2012). Ta (°C) is the ambient temperature.
- 3.
Attenuation of shortwave radiation by the canopy – we incorporated the effect of the canopy on shortwave solar radiation using the approach of Musselman et al. (2015):
where Kabs is the downwelling shortwave radiation measured at the sub-canopy surface, τdir is the canopy transmittance of the direct shortwave component that equals the sky-view factor (sv) of the canopy, and τdiff is the canopy transmittance of the diffuse shortwave component calculated as follows:
where ξ is an empirical coefficient calibrated for pine and set to 1.081 (Pomeroy et al., 2009), and ϕ is the solar elevation angle in radians.
The model was written in MATLAB (2019), and the ode15s solver was used to solve the differential equation system of the fuel moisture model.
- 1.
Table 1Model parameters for calibration.
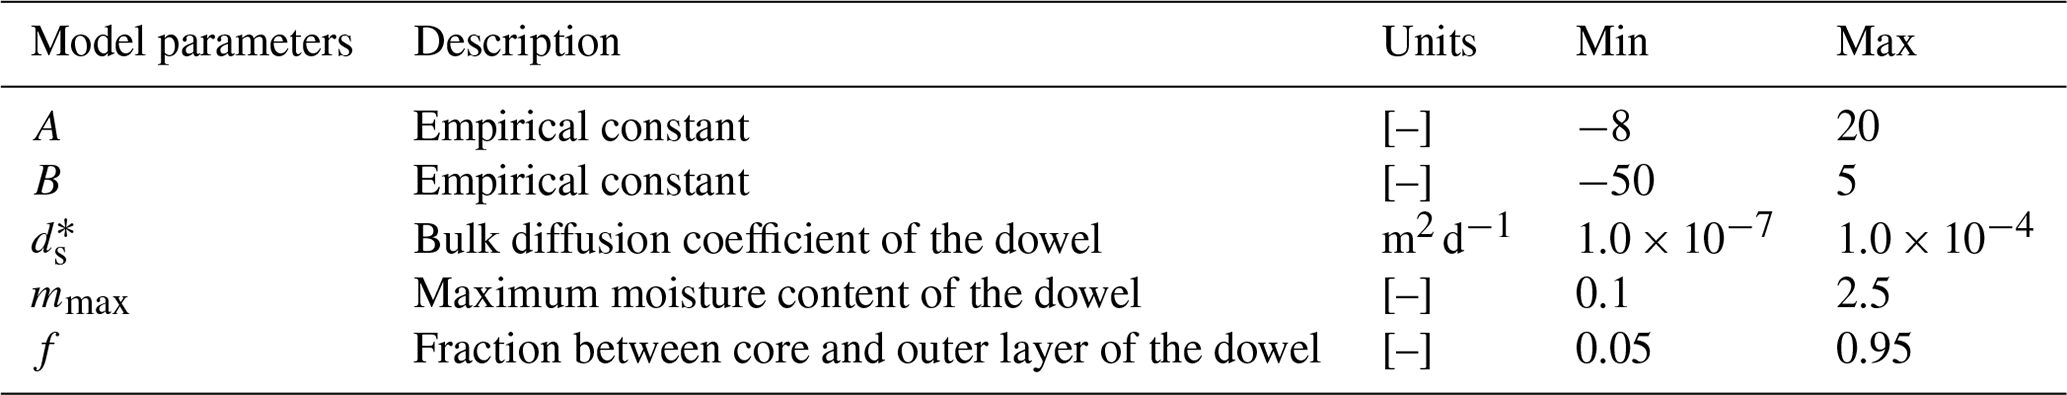
∗ ds was expressed in log scale to facilitate model calibration. Ranges of the parameters were adjusted from van der Kamp et al. (2017).
- b.
Model calibration – data description.
Fuel moisture sensors (Campbell CS506, 10 h fuel moisture sensor) were placed at each site to measure fuel moisture content. To simulate the conditions blocks were experiencing, the sensors were placed in mesh bags directly on the ground and replaced annually to avoid measurement errors due to decomposition of the wood dowel part of the sensor. Due to the fuel moisture sensors' direct contact with the ground, we regularly recorded moisture values above the normal operating range (0 %–70 %).
- c.
Model calibration – calibration process.
We followed a two-step calibration approach, in which we first fitted moisture content measured from standard fuel moisture sensors and then derived the wood moisture and temperature of pine blocks at hourly resolution.
We performed a site-specific calibration for all sites except for the wet rainforest site using hourly time series of FMC (see model calibration – data description). Observations from 2019 were used for calibration, and the remaining data were used for visual validation of the model results. The wet rainforest site was excluded from calibration due to malfunction of the fuel moisture sensor. Instead, calibrated parameters from the dry rainforest site were used to simulate fuel moisture in the wet rainforest site.
We calibrated five model parameters as in van der Kamp et al. (2017) (Table 1). Fixed parameters (Table S3) and initial conditions of the state variables were taken from van der Kamp et al. (2017) and were set equal for all the sites. Forcing variables (see “Weather data” section) were derived from weather data following the equations suggested by van der Kamp et al. (2017). Parameter ranges were initially taken from van der Kamp et al. (2017), but we extended the parameter ranges to account for the fact that sensors were placed directly on the ground rather than raised above the ground, which may alter original physical properties described in van der Kamp et al. (2017), such as aerodynamic resistance.
We used the nonlinear optimization algorithm fmincon in MATLAB (2019) to find the best possible fits of the parameters (Table 1) and the root mean square error (RMSE) as the objective function to compare model output with observations (Eq. 9):
The model output corresponding to the observations was the average moisture of the wood dowel ms (unitless), calculated from the simulated moisture content in the core and the outer layer of the wood dowel converted to a fraction of the dry weight of the wood dowel:
where mc (kg) is the moisture content of the core, mo (kg) is the moisture content of the outer layer, f (unitless) is the fraction of the volume between the core and outer layer of the wood dowel, ρs is the wood dowel density fixed to 400 kg m−3 (Nelson, 2000), and Vs (cm3) is the volume of the wood dowel.
- d.
Wood moisture and temperature simulations.
We simulated pine block moisture content and temperature using the described mechanistic model and the fitted model parameters for each site. Moisture content observations that were measured for pine blocks throughout the experiment were used as the benchmark reference for model performance. There was no additional automatic model calibration of the fuel moisture mechanistic model previously described, only minor modifications to capture the benchmark observations. First, we adjusted equations for heat and water transfer to represent the geometry of blocks as opposed to cylindrical sticks (code available on https://doi.org/10.5281/zenodo.11623043) and set the wood density to 480 kg m−3. Additionally, the parameter mmax was manually increased based on field moisture measurements to allow the blocks to hold more water, and the parameter f was manually reduced to allow for a more stable moisture content compared to sensors due to the higher contribution of the inner core to the final simulated moisture content. Latent heat flux was modified for two sites (dry forest and dry savanna) through adjustment of the empirical parameter A. Finally, we calculated the Nash–Sutcliffe efficiency (NSE) (van der Kamp et al., 2017) along with other standard model skill metrics to assess the model performance.
2.3 Weather data
We previously constructed an hourly time series dataset of weather variables across our 4-year (from June 2018 to June 2022) field experiments using Vaisala Weather Transmitters (WXT530), gap filled with publicly available weather datasets (Duan et al., 2023) (detailed methods available on https://github.com/Zanne-Lab/WTF-Climate, last access: 22 May 2023). For this project, we extracted from Duan et al. (2023) soil surface air temperature, precipitation, air pressure, wind speed, relative humidity, shortwave radiation, longwave radiation, solar elevation, and solar azimuth as forcing variables for simulations of fuel moisture of sensor wood dowels and pine block temperature and moisture.
We also collected sky-view factor data (Table S2) by taking photos of the sky from 1 m above the ground at each site with a fisheye lens and calculating the sky-view factor using image binarization (Honjo et al., 2019).
2.4 Statistical analysis (wood moisture and temperature vs. CO2 fluxes)
To simulate high-resolution CO2 fluxes for each site, we developed a mixed nonlinear model using CO2 flux as the response variable; wood moisture content, temperature, and moisture–temperature interaction as fixed effects; and site as a random effect. This model performed better compared to simpler models that excluded temperature and moisture–temperature interaction (code available on https://doi.org/10.5281/zenodo.11623043). We used the wood moisture measurements from the pine experiment and the corresponding chamber temperature observations to construct the model. To account for simulation uncertainty, we used the Bayesian inference package bmrs (Bürkner, 2017, 2018, 2021) in R version 4.0.4 (R Core Team, 2021). The sampler used 5000 iterations, a warm-up period of 2500 simulations, and four chains and assumed a beta distribution for the response variable. A total of 10 000 post-warmup draws were performed. We assessed convergence of the model parameters using the R diagnostic ( = 1) and tracer plots (Fig. S2). Model predictions were obtained using 2000 draws of the parameter posterior distribution. The Bayesian p-value equivalent is calculated with the package bayestestR (Makowski et al., 2019a, b).
Our statistical model of wood moisture and temperature and CO2 fluxes was based on observations of Pinus radiata blocks, a readily available non-native wood. To estimate model skill in predicting CO2 fluxes of native species, we plotted flux measurements of native species with our statistical model and simulations. Natives were only deployed at the two extremes of our precipitation gradient (wet rainforest and dry savanna), and no species overlapped between sites. We assessed if the relationship between wood moisture and temperature and CO2 fluxes measured in pine blocks could predict that of native stems at the wettest and driest sites. Finally, we plotted the measured CO2 fluxes and wood moisture and temperature of native stems together with the model-predicted values.
2.5 Estimated wood mass loss
We estimated the cumulative mass loss of our pine blocks and native stems at each biannual harvesting point by integrating hourly predicted CO2 fluxes over time. We used the area under the curve (AUC) function and the trapezoid method implemented in the R package DescTools (Signorell et al., 2023). We then converted these values from micrograms of CO2 per gram wood to grams of carbon per gram carbon as follows:
First, micrograms of CO2 was converted to grams of carbon using the molecular weights of C and CO2. The carbon percentage of Pinus radiata, 49.2 %, was used to convert grams of wood to grams of carbon (Law et al., 2023). The final unit, grams of carbon per gram carbon, is comparable to the proportional mass loss measured in field experiments at each harvest time point (Sect. 2.1.3).
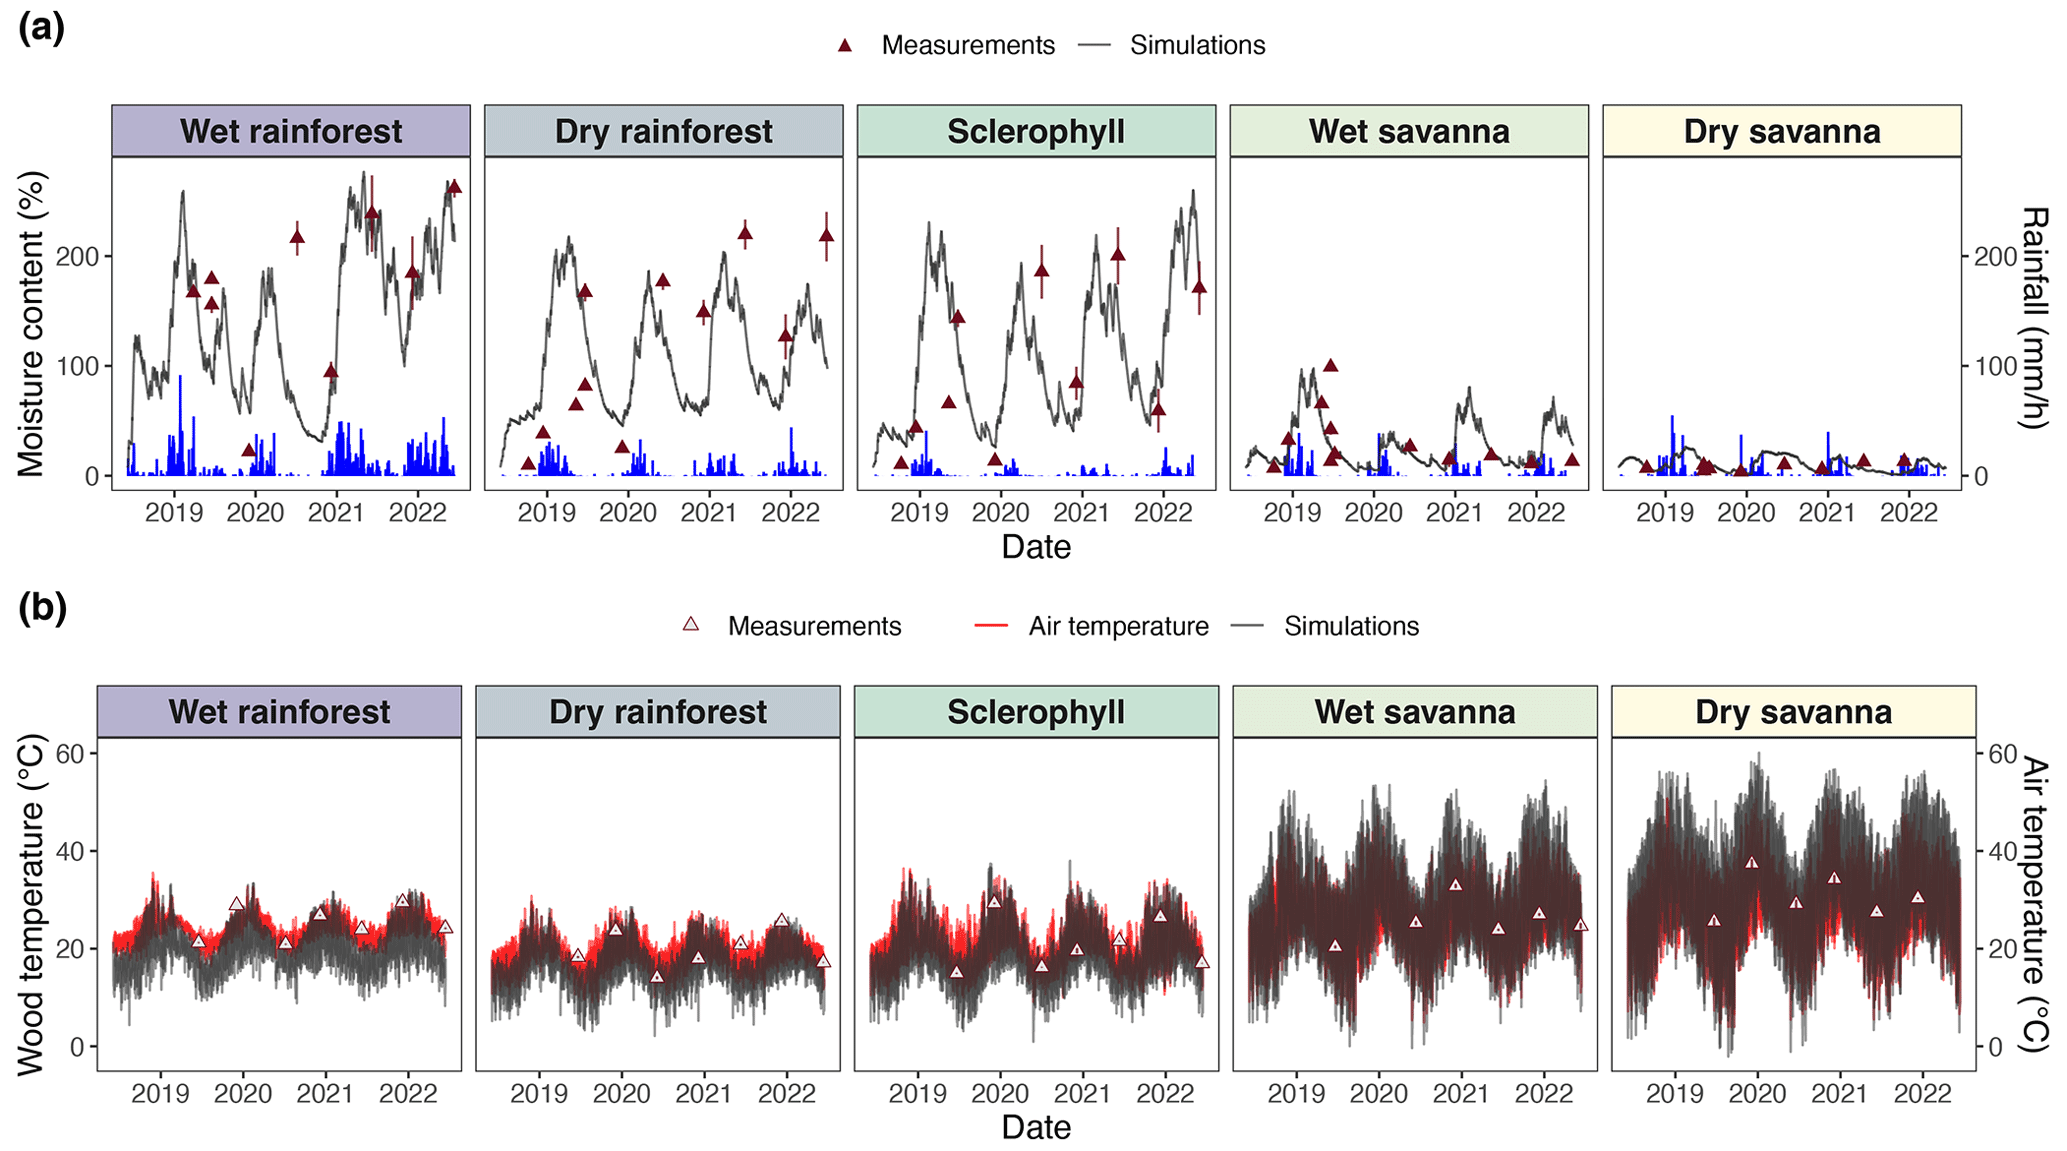
Figure 3Time series of comparisons between pine block simulations and climate observations. (a) Simulated moisture content is shown in gray, and hourly precipitation is shown in blue. Different colors represent different sites, and triangles represent wood moisture content measurements from field experiments used to calibrate simulations. (b) Simulated wood temperature is shown in gray, and soil surface air temperature is shown in red. Triangles represent the temperature of the LI-COR chamber during flux measurements. Model skill metrics (RMSE and bias) are presented in Table S6.
3.1 Wood moisture and temperature validation
We derived wood moisture and temperature from a fuel moisture model (van der Kamp et al., 2017) calibrated with fuel moisture sensor measurements along a precipitation gradient in Australia (Fig. 3). Throughout the 4-year experiment, we observed higher wood moisture content at sites with higher precipitation (Fig. 3a). We obtained wood moisture content and temperature simulations that captured major trends in the empirical measurements. Our wood moisture content simulations were sensitive to annual rainfall seasons (Fig. 3a), which was, in turn, reflected by a positive NSE in four out of five sites (Table 2). Only the simulations of the dry savanna slightly overestimated the observed moisture ranges but exhibited lower overall moisture than the other sites. Moisture values were calculated relative to the dry weight of the wood (Eq. 3). For this reason, moisture can reach values over 100 %.
Table 2Standard model skill metrics for the wood moisture model.
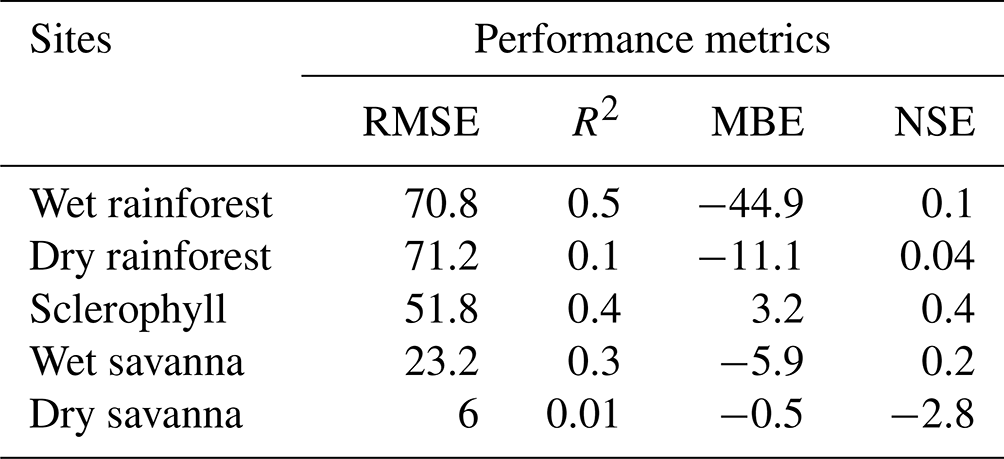
RMSE – root mean squared error, R2 – coefficient of determination, MBE – mean bias error, NSE – Nash–Sutcliffe efficiency.
Wood temperature simulations were benchmarked against air temperature at the soil surface. Simulated wood temperature was higher than air temperature at each site and increased with decreasing precipitation, i.e., at dry and wet savannas (Fig. 3b).
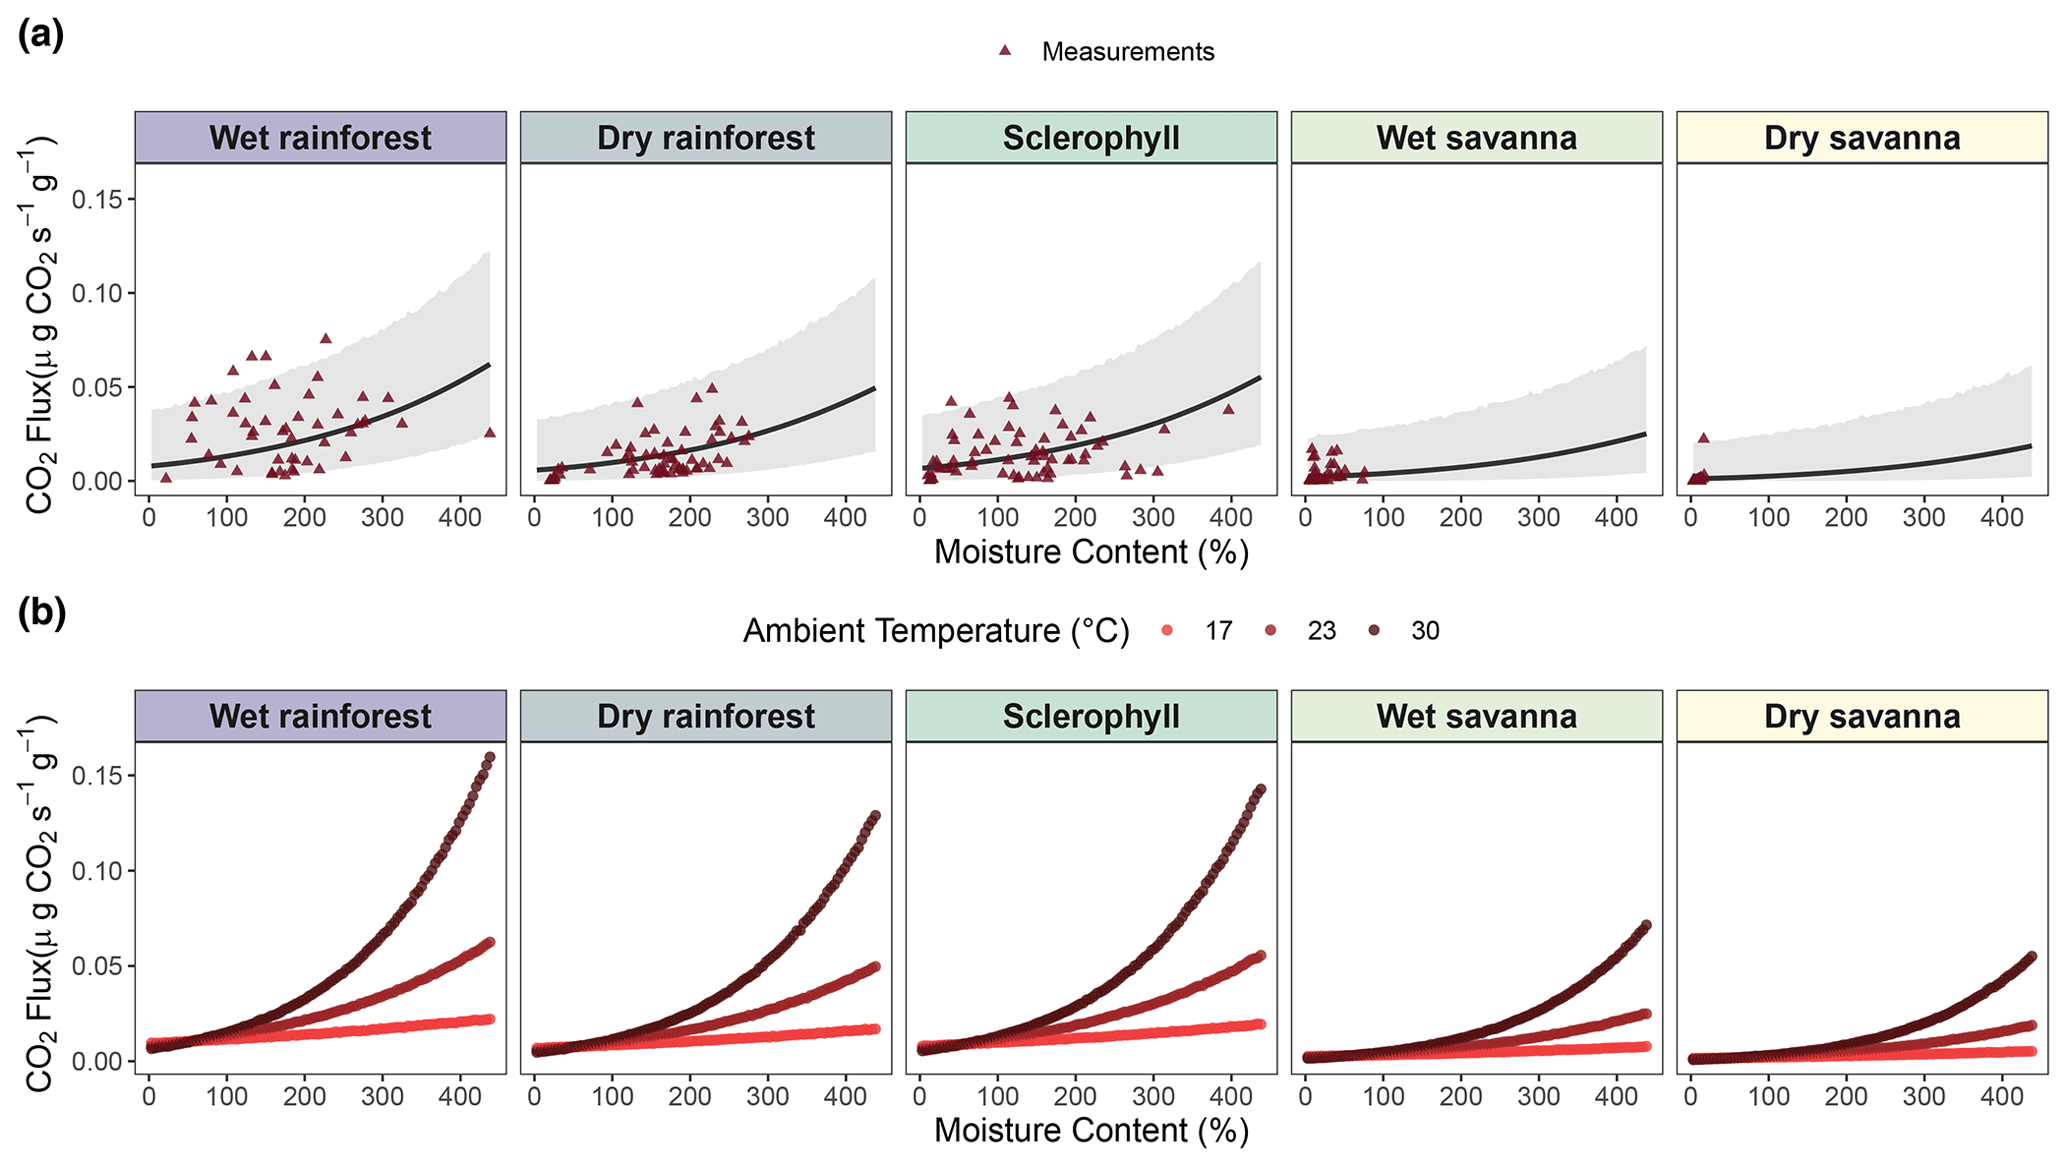
Figure 4Mixed model of CO2 fluxes () from decaying wood, with wood moisture content and temperature as fixed effects and site as a random effect. (a) Flux predictions against wood moisture content. (b) Flux predictions against interaction between wood moisture and temperature using three different simulated temperature levels. Triangles represent pine block measurements used to construct the model. An outlier in the dry savanna was kept, as there was no indication that there was an error in measurement.
3.2 Wood moisture and temperature vs. CO2 fluxes across the precipitation gradient
We assessed the statistical relationship between wood moisture and temperature and CO2 fluxes across our precipitation gradient. Despite the high uncertainty likely attributable to the high variability of the observations (Fig. 4a), our results indicated a positive relationship between CO2 fluxes and wood moisture at each of the study sites (Fig. 4a and Table S1, p value < 0.001). However, the strength of this relationship decreased with decreasing precipitation levels (Table S1). Thus, the savanna sites exhibited lower CO2 fluxes from decaying wood than the rainforest sites. Wood temperature was also positively correlated with CO2 fluxes (Fig. S3), but the correlation was not significant (Table S1, p value = 0.4). On the other hand, the interaction between wood moisture content and temperature was a significant factor in our statistical model (Fig. 4b and Table S1, p value = 0.001), showing that temperature is relevant, but only when there is sufficient moisture. Therefore, at dry sites, like dry and wet savanna, the temperature is not strongly correlated to CO2 flux due to low moisture levels.
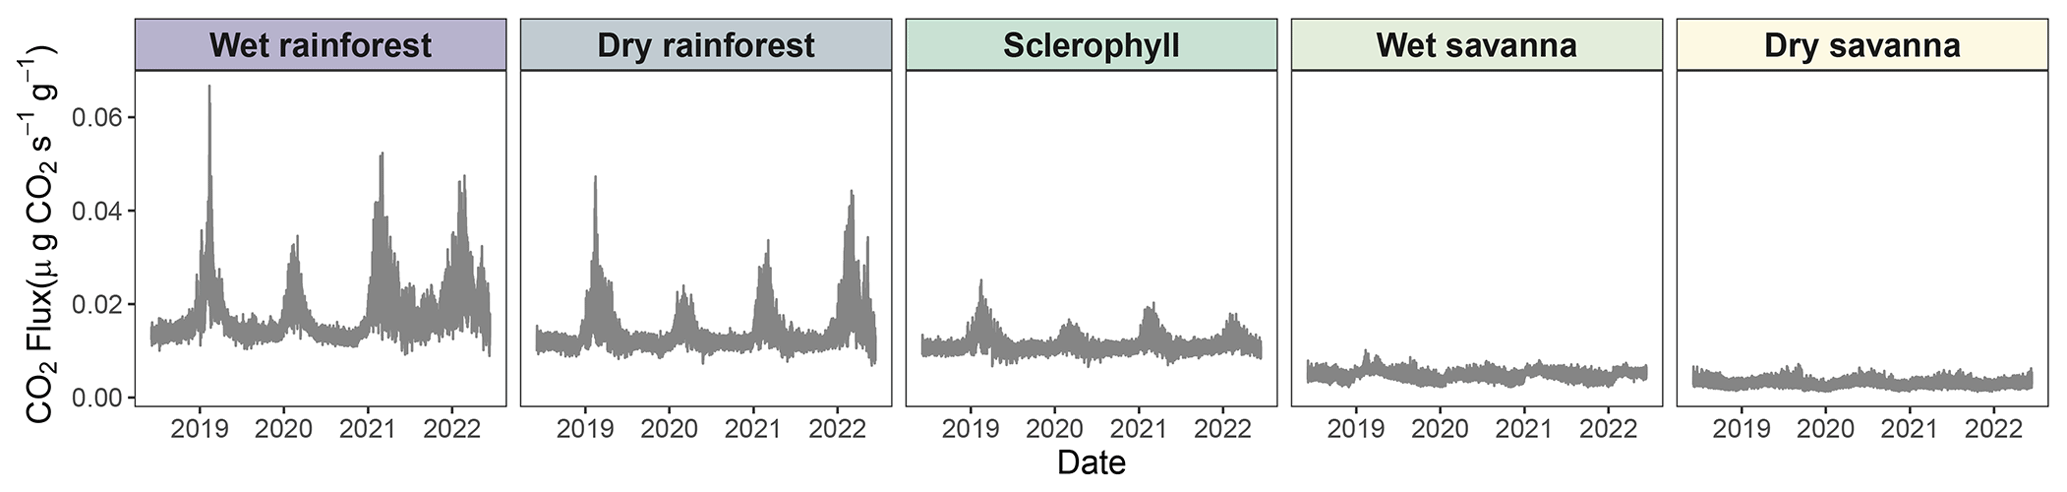
Figure 5High-resolution time series of CO2 fluxes across the precipitation gradient derived from high-resolution time series of simulated wood moisture content and temperature of pine blocks. Solid lines represent model means. Uncertainties were not displayed so as to make seasonal trends more apparent (Fig. S4).
3.3 Time series of CO2 fluxes across the precipitation gradient
We observed patterns in CO2 fluxes that matched seasonal precipitation patterns (Fig. 5). For example, the higher CO2 peaks between 2021 and 2022 in the wet rainforest corresponded to large precipitation events recorded in the area (Fig. 3a). Similarly, in 2022, little precipitation was observed for the dry savanna, which corresponded to lower CO2 fluxes (Fig. 5). This seasonal pattern was present at all sites regardless of precipitation regime, although seasonality was more visible at the wetter sites. Wood temperature affected CO2 flux at a daily timescale at all sites, which may have amplified seasonality (Figs. 3b and 5).
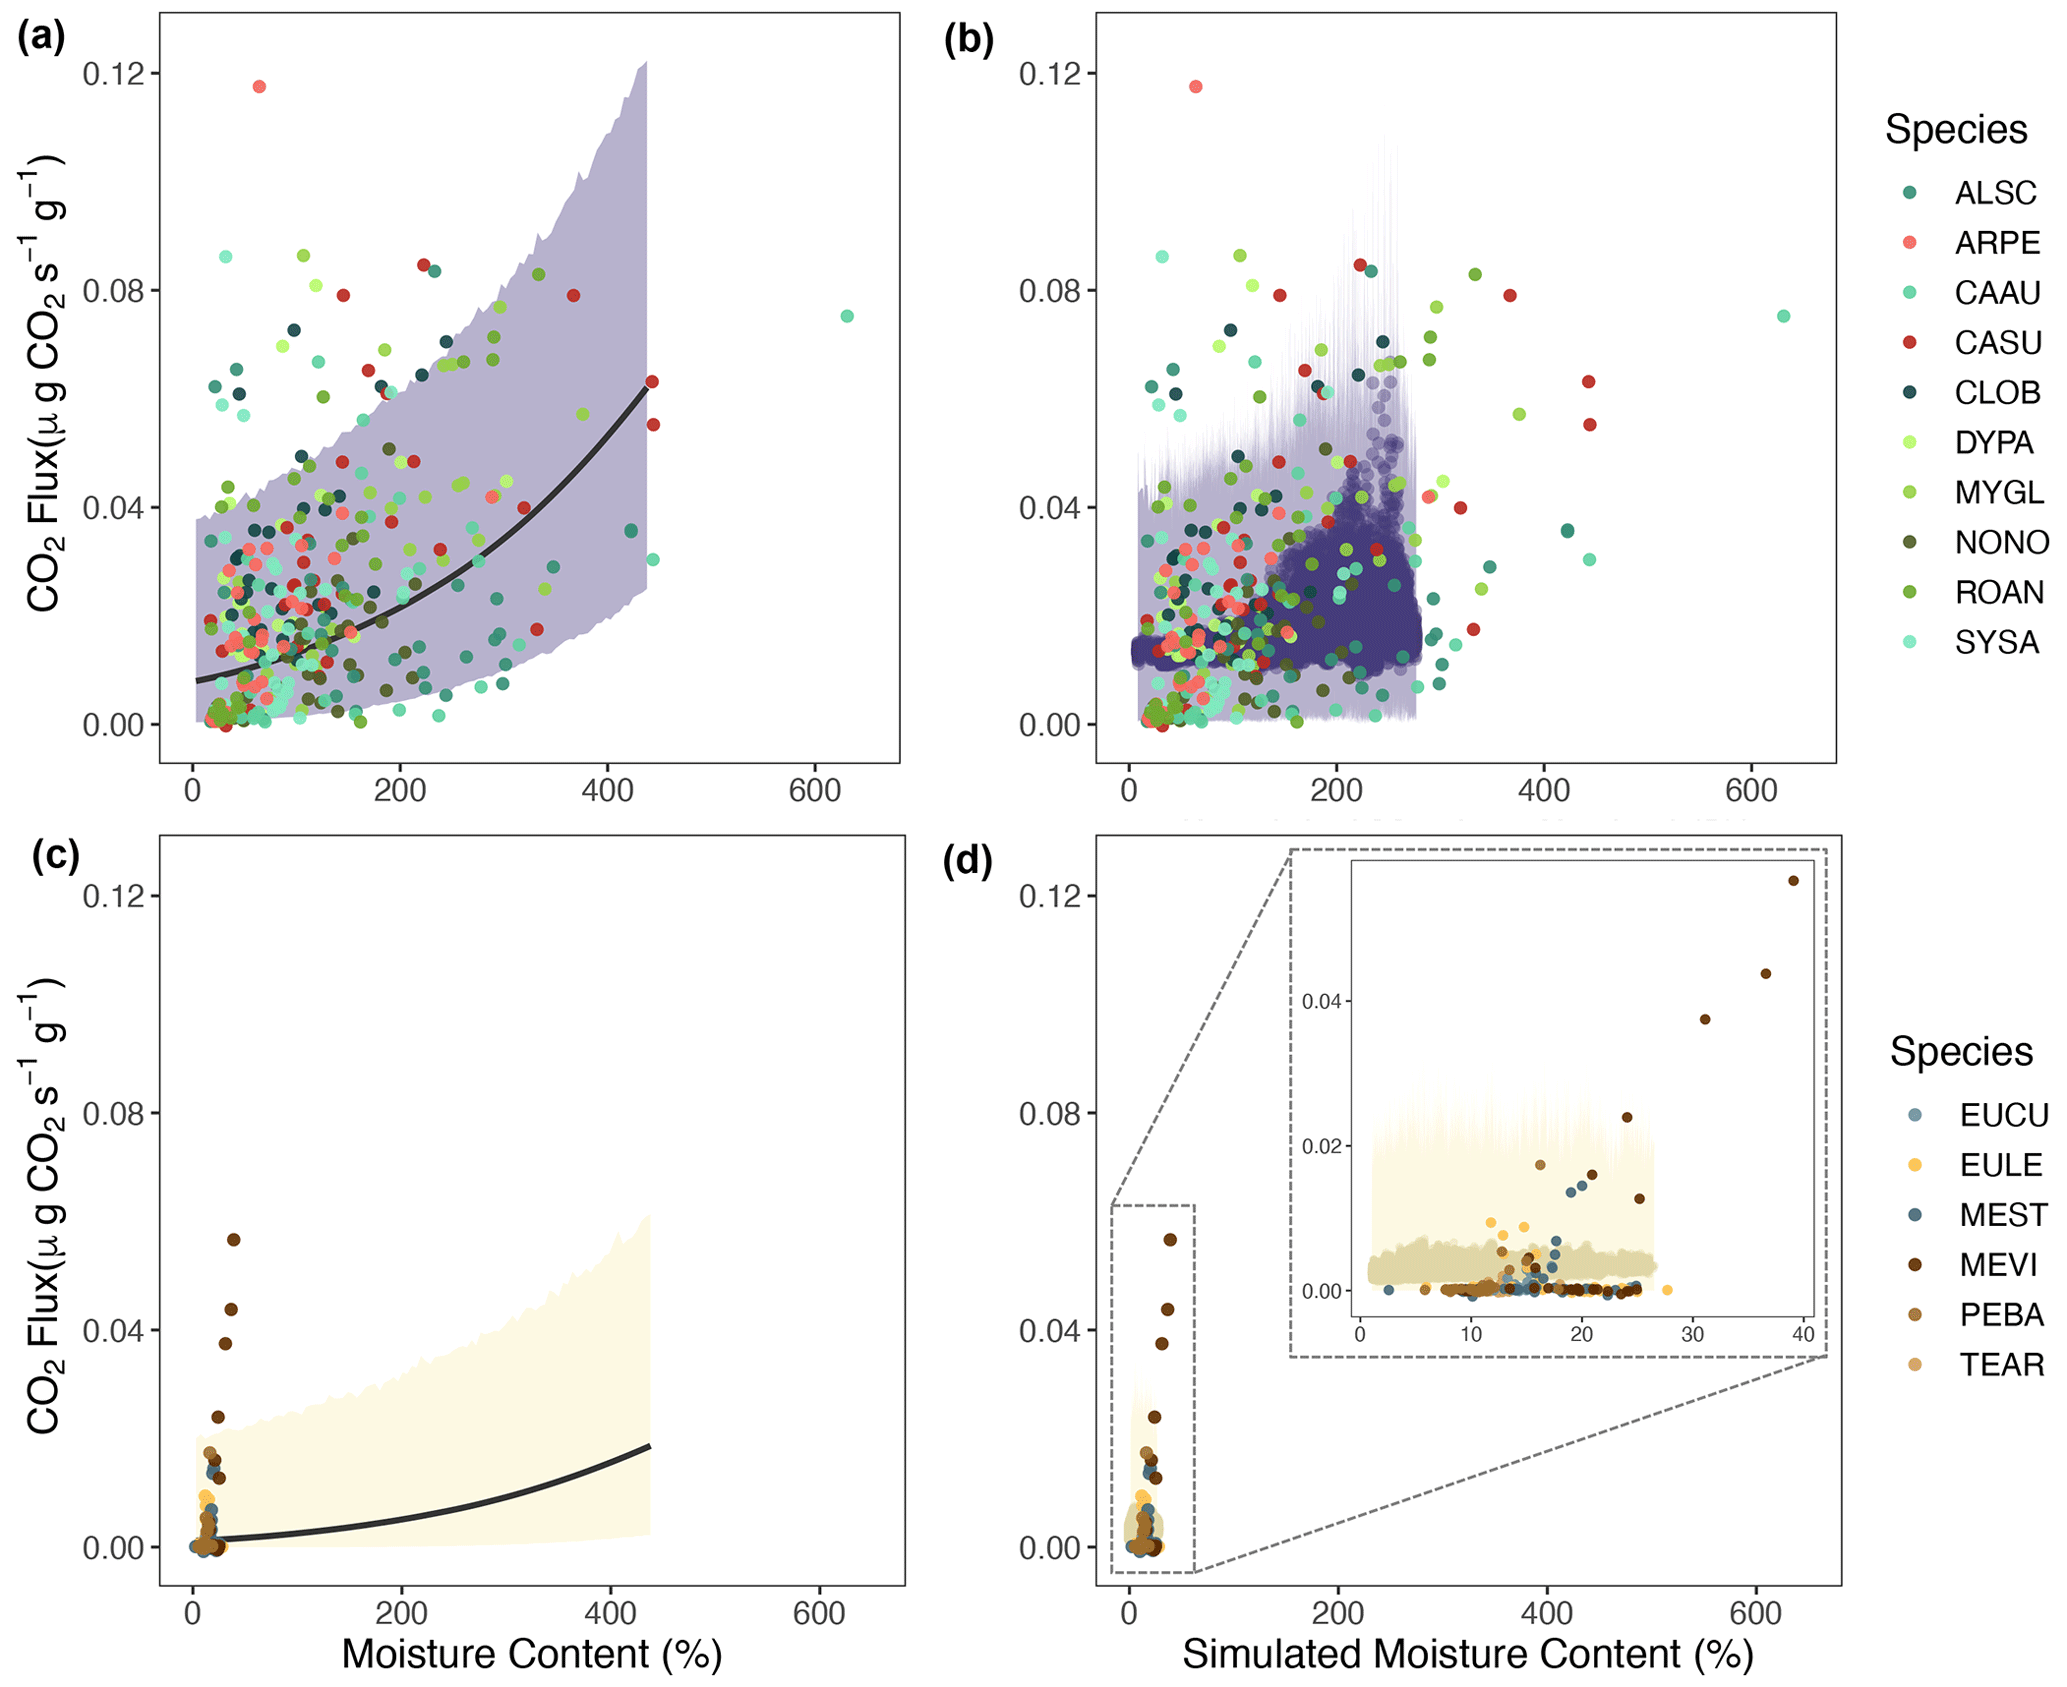
Figure 6Measured native stem moisture content and CO2 fluxes plotted with estimates from the statistical model (a, c) and time-resolved simulations (b, d) for native species from the wet rainforest (a, b) and dry savanna (c, d). The species name for each code is given in Table S4.
3.4 Simulated and measured wood moisture and temperature: pines vs. native species across the precipitation gradient
Generally, we observed that most native species exhibited a positive relationship between the wood moisture and temperature and CO2 fluxes (Figs. 6 and S5). This relationship is captured by our statistical model, as measured native CO2 fluxes are within the uncertainty regions of the CO2 estimations (Fig. 6a and c). Our simulations generally matched the magnitude of CO2 fluxes from decaying wood from native trees in the wet rainforest and dry savanna (Fig. 6b and d). An exception was the species Melaleuca viridiflora (MEVI) in the dry savanna, for which wood respiration rates were more sensitive to increasing moisture content than predicted. In temperature–flux comparisons, our simulations captured a wider range of wood temperature values in both sites (Fig. S5b and d).
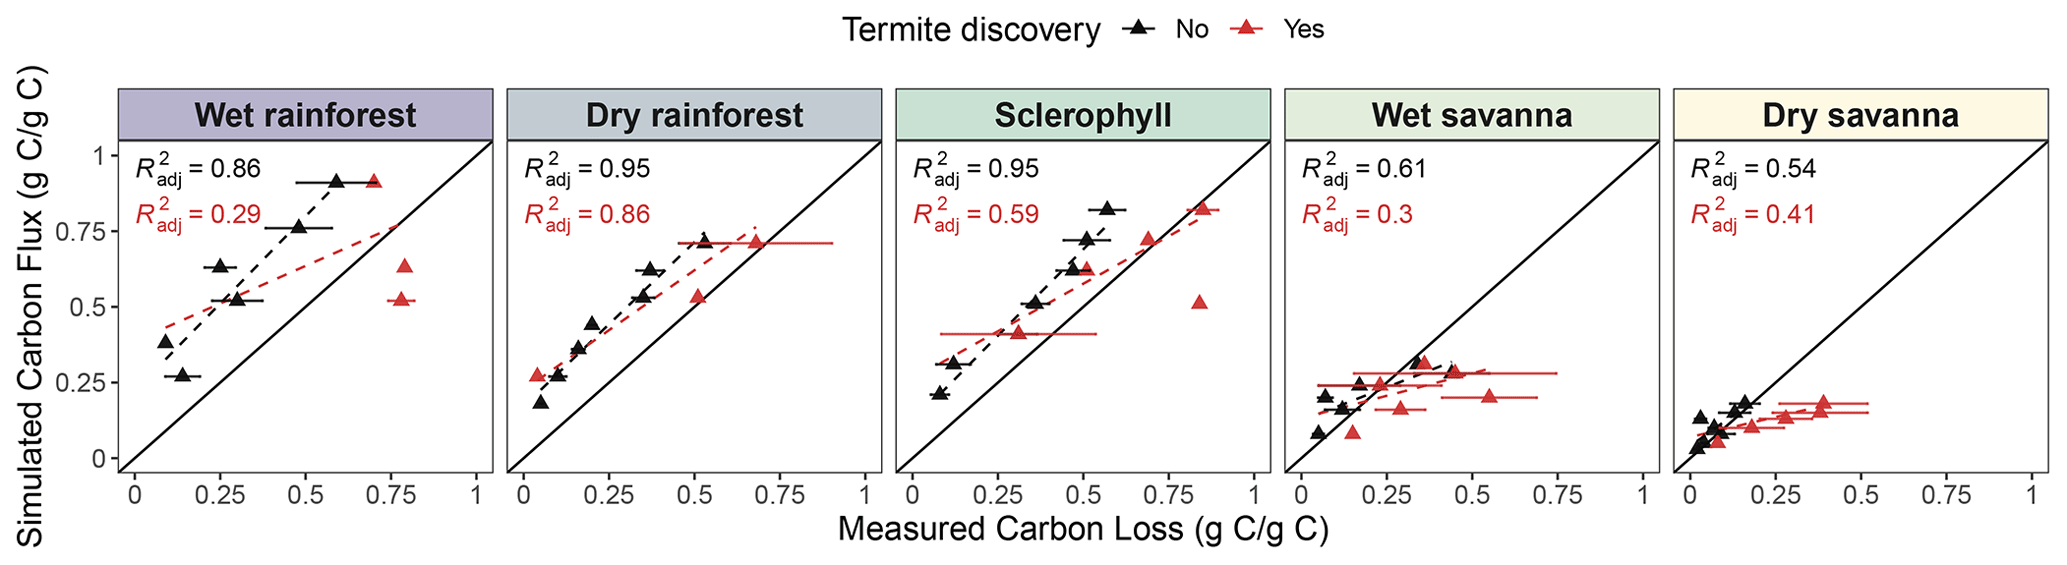
Figure 7Simulated mean cumulative carbon flux (g g−1) compared with mean measured wood mass loss (g g−1) of pine blocks. Each point represents a time point at which pine block mass loss was measured (12, 18, 24, 30, 36, 42, and 48 months). The mean carbon loss between blocks at each time point is plotted, and bars represent the standard error of the mean. Colors indicate whether a termite attack was recorded (red) or not (black). Regression lines and R2 are shown for blocks without termite discovery (black) or all blocks, including those discovered (red).
3.5 Simulated cumulative carbon flux and measured wood mass loss over time
Measured mass loss was positively related to simulated cumulative C flux (Fig. 7), with a stronger correlation at wetter sites (R2: 0.86, 0.95, 0.95, 0.61, and 0.54, from wettest to driest). We observed a slight overestimation of CO2 flux from decaying wood at wetter sites (dry rainforest and sclerophyll) and a strong overestimation at the wet rainforest. Our simulations showed nearly 100 % mass loss to CO2 after 48 months in the rainforest, suggesting an acceleration of decomposition by about 8 weeks compared to observations. In the dry savanna, about 20 % of the total mass was released as CO2. When wood blocks that termites discovered were included in the analysis, we observed a decrease in the strength of the mass loss–flux correlation (R2: 0.29, 0.86, 0.59, 0.30, and 0.41, from wettest to driest) and a deviation from the 1:1 line. These weaker correlations suggest that termites promote C loss from decaying wood through other pathways besides atmospheric CO2 flux. More termite attacks were recorded at the two driest sites (wet and dry savannas), suggesting a higher effect of termite activity at dry sites (Fig. 7). We additionally ran a linear regression and found a marginally significant interaction between carbon loss and termite activity (p=0.067, Table S5).
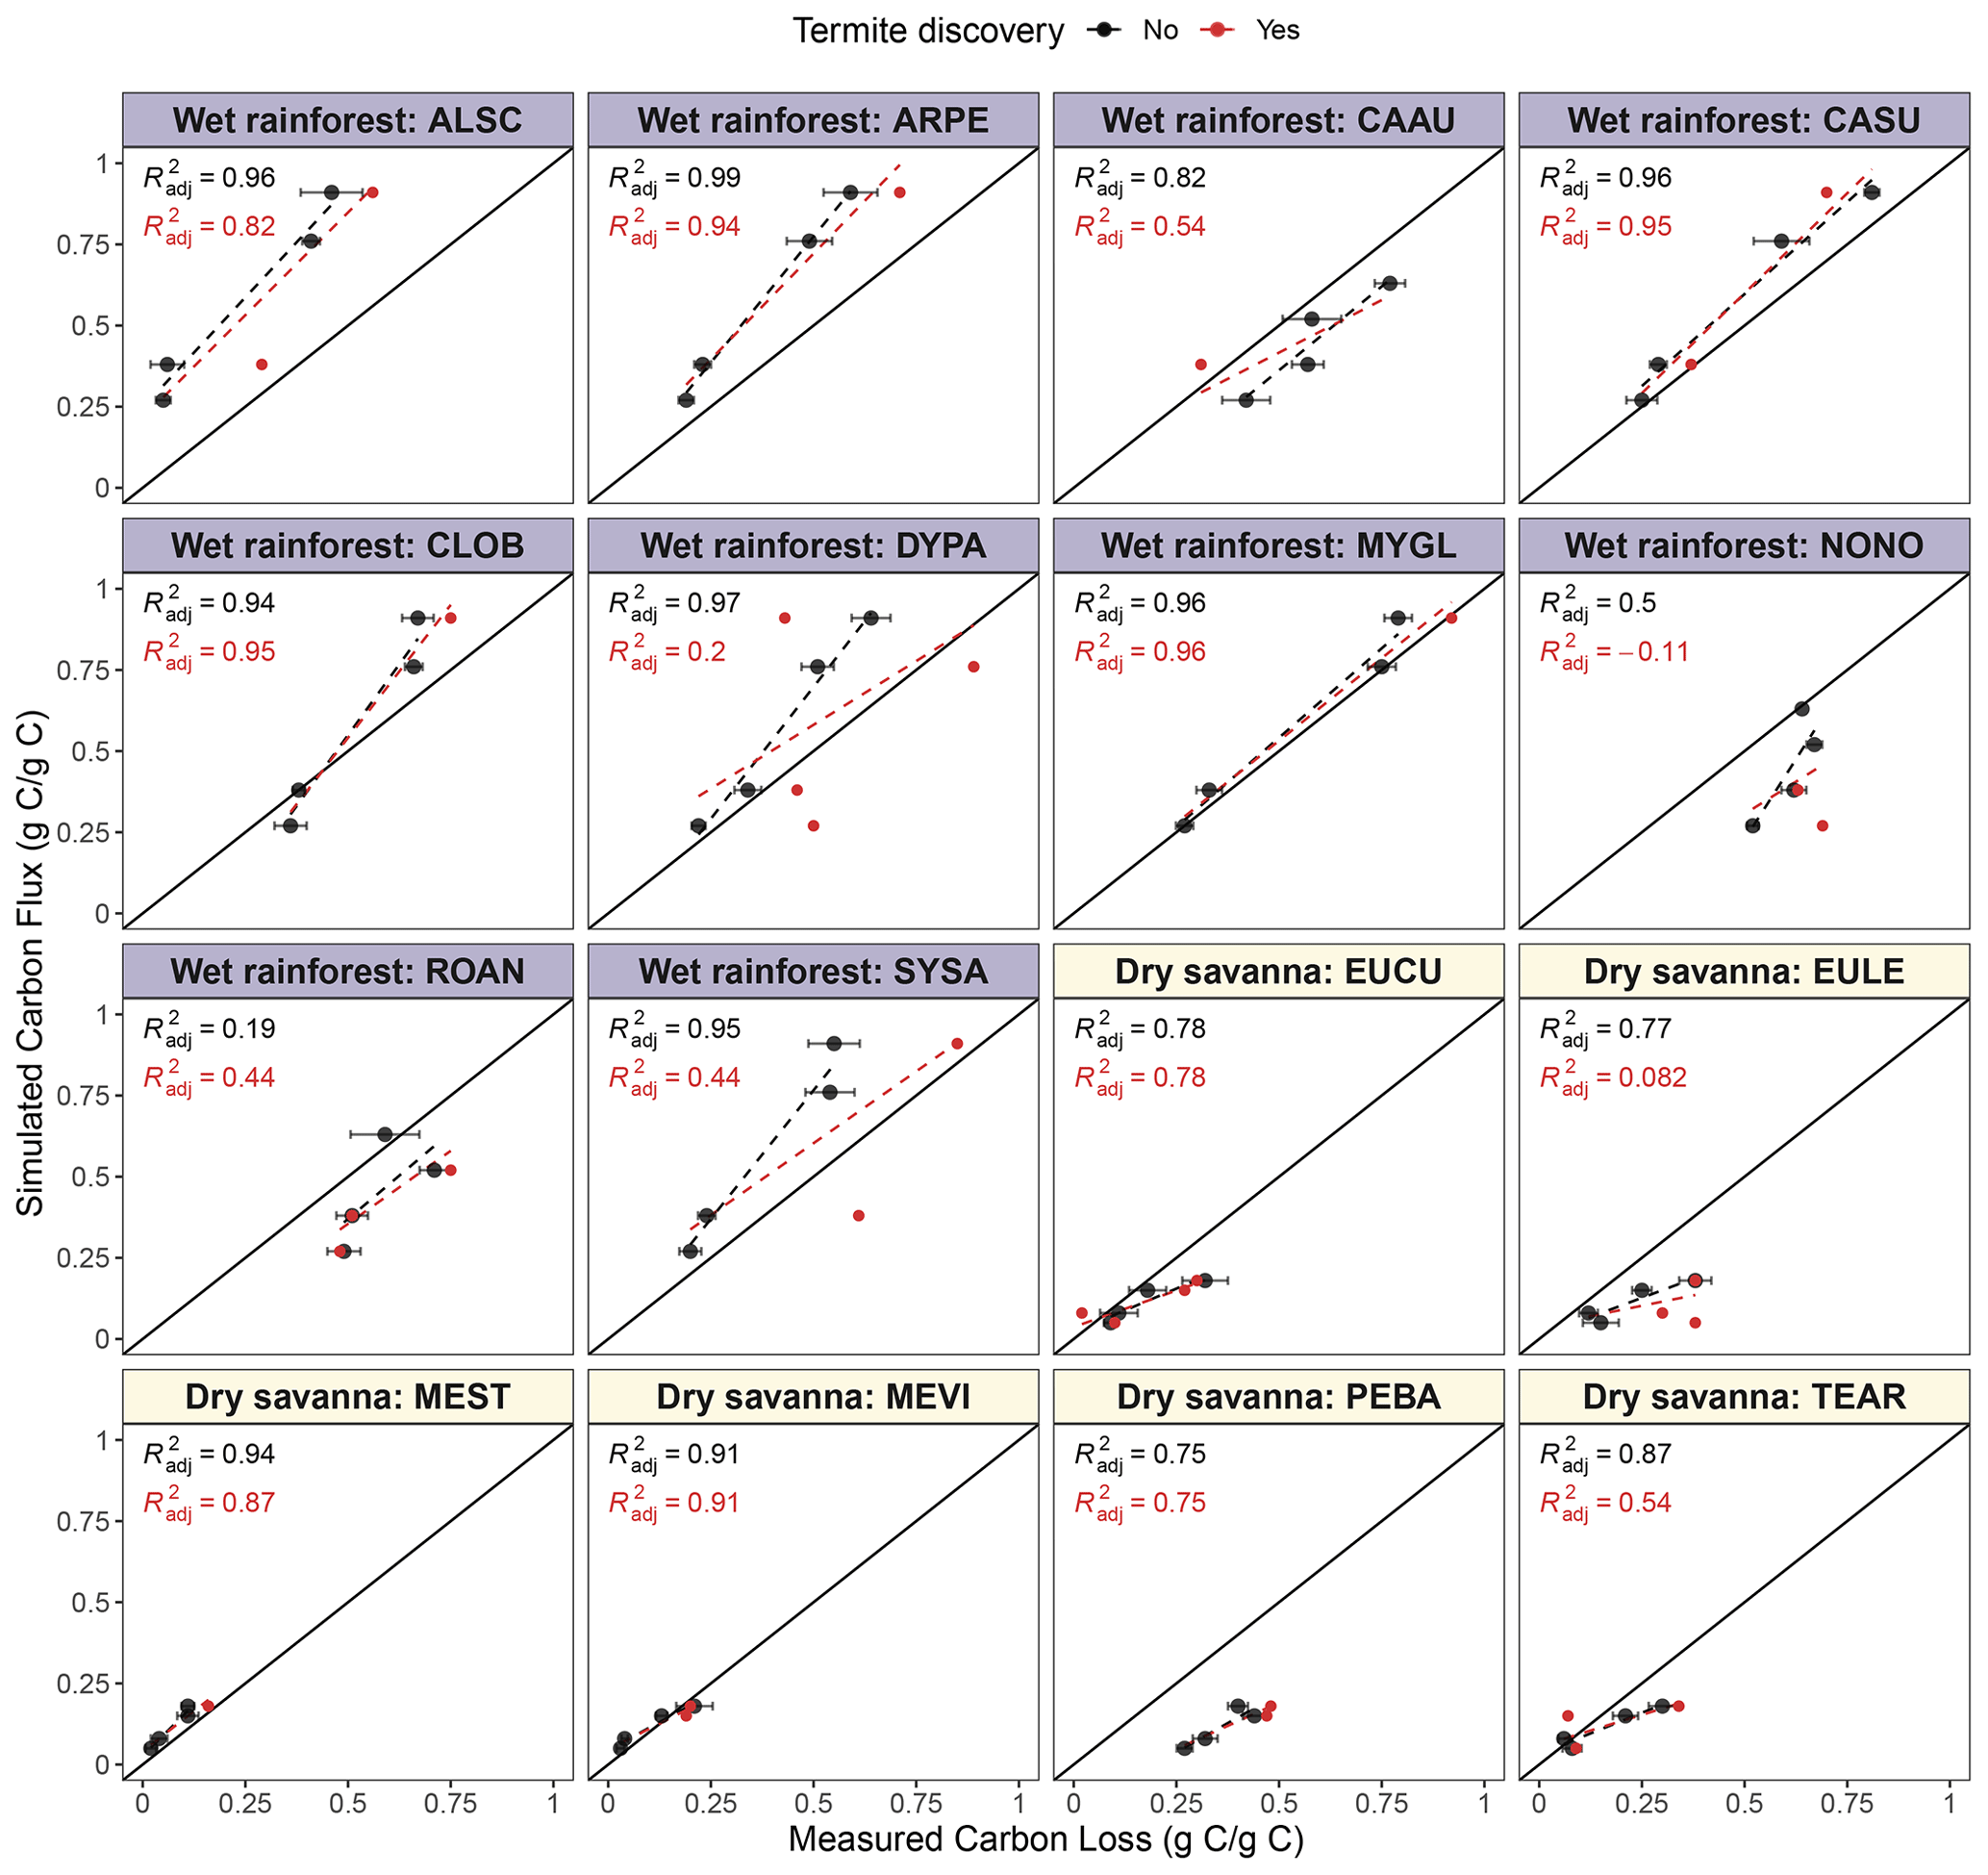
Figure 8Simulated mean cumulative carbon flux (g g−1) and mean measured wood mass loss (g g−1) of native species at two ends of the precipitation gradient. Each point represents a time at which pine block mass loss was measured (12, 18, 24 or 36, and 30 or 42 months, Law et al., 2023). Points represent mean carbon loss at each time point, and bars represent the standard error of the mean. Colors indicate whether a termite attack was recorded (red) or not (black). Regression lines and R2 are shown for blocks without termite discovery (black) or all blocks, including those discovered (red). Species from the wet rainforest have a blue title background, while species from the dry savanna have a yellow background.
We observed a similar positive relationship between cumulative CO2 and mass loss for the native woody species; however, cumulative flux sometimes differed from mass loss (Fig. 8). The relationship varied among species, suggesting that native species' wood was lost in ways other than as CO2 fluxes or that our model based on pine is not sufficient to capture the behavior of native species.
4.1 Climate variables as predictors of wood moisture and temperature
We estimated wood moisture and temperature using a mechanistic fuel moisture model (van der Kamp et al., 2017) driven by weather data measured with portable weather stations or retrieved from gridded databases. We followed a two-step calibration approach, in which we first fitted moisture content measured from standard fuel moisture sensors and then derived wood moisture and temperature for our blocks at hourly resolution. Despite the potential uncertainty in the simulations, this calibration approach was chosen due to the low density of wood moisture observations that limited representation of hourly dynamics of wood temperature and moisture in a single simulation.
Our simulated wood moisture and temperature reproduced the major patterns of the empirical observations (Fig. 3) and showed a positive NSE in four out of five sites, suggesting that our simulations perform better than just the mean value of the observations (Knoben et al., 2019). However, the simulations missed some of the measured moisture content peaks in the wettest sites and failed to reproduce very low moisture values in the dry savanna, where the NSE was negative. Although NSE may not be the most suitable performance metric for a highly dynamic variable like wood moisture (Schaefli and Gupta, 2007; Moriasi et al., 2015), representing other physical processes may improve simulations. For example, our blocks were placed in mesh bags and directly on the ground, which may have resulted in moisture uptake and release by capillary action, while our mechanistic model does not account for this process (van Niekerk et al., 2021; Thybring et al., 2022). Surface runoff, in combination with the topography of the site, could also either increase or decrease the likelihood of high wood moisture content (Shorohova and Kapitsa, 2016). Additionally, the moisture retention capacity of wood differs among stages of decay (Pichler et al., 2012) and could explain the low moisture content in the dry savanna. However, adding an additional degradation term in the mechanistic model is not typical for fuel moisture models and would have added more uncertainty to our simulations. Finally, to simulate the conditions experienced by deadwood more closely, sensor dowels were similarly placed in bags on the ground and not above ground as per standard practice. These conditions may have influenced energy and moisture transport, as described by van der Kamp et al. (2017). During calibration, we allowed our parameters to take on values beyond the range proposed by van der Kamp et al. (2017) to account for this issue.
Nevertheless, our simulated wood moisture and temperature were robust, even in the dry savanna, where the low moisture values still correlate with low CO2 fluxes. Moreover, our simulations showed higher wood temperatures than soil surface air temperature, especially in the hotter and drier sites (Fig. 4). This result is consistent with wood thermodynamics, in which wood is heated by incoming radiation during the day, and heat is stored and slowly released at night. Sites with higher canopy cover experienced smaller temperature ranges as shade buffers temperature extremes (Brischke and Rapp, 2008b).
4.2 Climate-derived wood moisture and temperature as a predictor of CO2 fluxes from decaying wood
We found a positive relationship between CO2 fluxes and wood moisture and temperature across the precipitation gradient, with the strength of this relationship decreasing at low-precipitation sites. This result was expected as wood moisture and temperature are known to be important drivers of deadwood degradation (Viitanen, 1997; Mackensen et al., 2003; Brischke and Rapp, 2008a; Kahl et al., 2015; Wang et al., 2023), influencing microbial- and invertebrate-driven decay (Progar et al., 2000; Zanne et al., 2022). Moisture and temperature modulate enzyme production and activity and determine microhabitats suitable for microbial and invertebrate activity (Yoon et al., 2015).
As observed in other tropical ecosystems (Wang et al., 2023), we found that wood moisture was an important limiting factor of deadwood degradation at our sites (Table S1, p value < 0.001). Wood moisture controls saprophytic microbial activity (Cheesman et al., 2018) and determines the dominant fungi in decaying wood (Progar et al., 2000; Barker, 2008; Thybring et al., 2018). Bond-Lamberty et al. (2002) found a similar strong correlation between wood moisture and CO2 respiration fluxes but only below a moisture content of 43 %. Similarly, we observed increasing uncertainty in our CO2 predictions with increasing wood moisture content. As wood moisture content increases, its relative importance decreases, and other factors, such as wood traits (wood quality, chemical composition, and stoichiometry), become more relevant (González et al., 2008; Risch et al., 2022; Law et al., 2023). Additionally, high wood moisture contents close to saturation can slow wood decay rates due to anaerobic processes becoming dominant (Piaszczyk et al., 2022).
Chambers et al. (2000) suggested that temperature is a better predictor of CO2 fluxes in temperate forests than moisture, arguing that sufficient moisture must be available for trees to grow in the first place. However, in contrast to temperate forests, where wood degradation is limited by temperature, our tropical sites (from wet rainforest to dry savanna) experience relatively similar mean temperatures throughout the year (Fig. 3b) but are subject to very different moisture conditions (Fig. 3a). For this reason, moisture is a limiting factor across our sites and is thus the best predictor of CO2 fluxes. Similarly, Rowland et al. (2013) found that moisture is the limiting factor for deadwood decay in tropical and subtropical forests. However, temperature variation can interact with moisture and cause CO2 fluxes to be nonlinear (Viitanen, 1997; Wang et al., 2002; González et al., 2008; Forrester et al., 2012). This pattern is consistent with what we observed: the interaction between wood moisture content and temperature was significant at all sites (Table S1, p value < 0.001), and the relative role of temperature in wood decay increases after a certain moisture threshold is reached (Fig. 4b).
4.3 Deadwood fate under a precipitation gradient in Australia
An essential question in tropical forest ecosystems is whether the mass loss of deadwood is released into the atmosphere as CO2 or stored in microbial and/or invertebrate biomass or some other stable form of C (Cornwell et al., 2009). We addressed this question by combining our linear mixed model and high-temporal-resolution simulations of wood moisture and temperature. Despite high uncertainty at any given time, when summing CO2 flux estimates over long periods of time, the fine-scale variation averages out, and estimated cumulative flux was comparable to mass loss of pine blocks (Fig. 7). We observed that deadwood has longer residence times in dry, hot sites (wet and dry savanna), and wood decay is enhanced by moisture in wet sites (wet and dry rainforest). After 48 months, almost 100 % of the deadwood was degraded and released as CO2 in the wet rainforest, but 20 % was released in the dry savanna (Fig. 7).
Our model predictions based on wood moisture and temperature do not capture invertebrate activity influencing deadwood decay. When termites are involved in the decay of pine blocks, termite activity leads to deviations from the linear relationship between cumulative CO2 flux and wood mass loss. This suggests that C is lost through other processes, which might include leaching, volatilization (Read et al., 2022), and fragmentation (Yoon et al., 2015). These processes may eventually release carbon at locations other than the wood block, for example, at termite mounds (Jamali et al., 2013; Clement et al., 2021).
The underprediction of cumulative CO2 flux relative to mass loss observed in some native stems (Fig. 8) suggests that other biotic factors should be included in statistical models when extrapolating beyond wood used for calibration (here, pine) (Jomura et al., 2008). The strength of wood moisture content and temperature influence is likely to vary among tree species (Herrmann and Bauhus, 2013; Wu et al., 2021). Wood traits such as wood nutrient content, quality, and woody debris geometry can be important drivers of deadwood decomposition (Zhou et al., 2007; Weedon et al., 2009; Hu et al., 2018; Risch et al., 2022; Kipping et al., 2022). They influence the relative contribution of wood-degrading organisms (bacteria, fungi, and invertebrates such as termites) and CO2 from wood decomposition. Cornwell et al. (2009) and Law et al. (2023) suggest that wood traits are likely the main determinants of deadwood fate in tropical forests. We found that a positive relationship between cumulative CO2 and mass loss holds for most of the native species; however, some species release less CO2 per unit mass loss. This result suggests that the interplay between weather, site conditions, biotic interactions, and specific wood traits (wood quality, chemical composition, and stoichiometry) is essential to determine CO2 fluxes from tropical ecosystems (Law et al., 2023). For example, mass loss in tree species with dense wood was not fully captured in our flux predictions (Fig. 8: Eucalyptus cullenii (EUCU), Eucalyptus chlorophylla (EULE), Terminalia aridicola (TEAR)), likely due to the lower capacity of dense structures to hold water (Thybring et al., 2022). There are also similar discrepancies for tree species with a high syringyl to guaiacyl () ratio (Cardwellia sublimis (CASU), Normanbya normanbyi (NONO)) and species with high nitrogen content (Rockinghamia angustifolia (ROAN), Petalostigma banksii (PEBA)).
Wood moisture and temperature are essential drivers of deadwood degradation in forest ecosystems. We found that wood moisture content and the interaction between wood moisture content and temperature are the main drivers determining the fate of deadwood degradation along a precipitation gradient in Australia. Because of the high variability in ecosystems and climates within this tropical region, it is essential to consider wood moisture and temperature to improve CO2 predictions from decaying deadwood. Ecosystem-scale carbon models like the YASSO model (Liski et al., 2005) and the CLM soil module (Lawrence et al., 2019) have already incorporated deadwood decomposition as a function of microbial activity affected by climate variables but have not yet explored the effects of wood moisture and temperature on microbial processes related to wood decay. More progress has been achieved in the field of wood material sciences, where the positive correlations between wood moisture and temperature and wood decay have been demonstrated (Brischke et al., 2006; Brischke and Rapp, 2008a, b; van Niekerk et al., 2021). Our work extends these findings by quantifying the strength of the relationship between wood moisture and temperature and CO2 fluxes from deadwood in response to precipitation and microbial and insect activities. Our approach can advance our understanding of CO2 dynamics, as using climatic variables allows us to simulate deadwood decomposition at high temporal and spatial resolution. However, we found that wood moisture and temperature alone are insufficient to predict the CO2 fluxes, especially from diverse native woody species. Wood traits are likely to be important drivers of deadwood fate in tropical forests (Cornwell et al., 2009; Law et al., 2023) and may improve CO2 predictions in tropical forest ecosystems. Factors such as termite, fungal, and bacterial activity and their climate sensitivity (Zanne et al., 2022) as well as wood traits, such as wood quality, chemical composition, and stoichiometry (Law et al., 2023), and their interplay with climate need to be implemented in future ecosystem models to more accurately predict the fate of deadwood in tropical forests and its contribution to the global carbon cycle (Cornwell et al., 2009).
The codes and data that support the findings of this study can be found in https://doi.org/10.5281/zenodo.11623043 (Duan et al., 2024).
The supplement related to this article is available online at: https://doi.org/10.5194/bg-21-3321-2024-supplement.
ESD: conceptualization, data curation, formal analysis, investigation, methodology, software, visualization, writing (original draft). LCR: conceptualization, data curation, formal analysis, investigation, methodology, software, supervision, validation, writing (original draft). NHS: software, validation, review and editing of the draft. BW: investigation, validation, review and editing of the draft. HFM: data curation, investigation, methodology, software, validation, review and editing of the draft. AWC: data curation, investigation, validation, review and editing of the draft. LAC: investigation, resources, review and editing of the draft. MJL: data curation, investigation, review and editing of the draft. PE: funding acquisition, project administration, resources, review and editing of the draft. AEZ: conceptualization, funding acquisition, project administration, resources, validation, review and editing of the draft. SDA: conceptualization, funding acquisition, project administration, resources, supervision, validation, review and editing of the draft. ESD and LCR contributed equally.
The contact author has declared that none of the authors has any competing interests.
Publisher's note: Copernicus Publications remains neutral with regard to jurisdictional claims made in the text, published maps, institutional affiliations, or any other geographical representation in this paper. While Copernicus Publications makes every effort to include appropriate place names, the final responsibility lies with the authors.
We thank the Australian Wildlife Conservancy and Daintree Rainforest Observatory of James Cook University for access to field sites. This work was conducted on the unceded territory of the Kuku Yalanji, Djabugay, and Djungan peoples, who are the traditional owners of the land. We also thank Darren Crayn, Rigel Jensen, and Andrew Thompson for help with species identification; Ana Palma, Emma Carmichael, Paula Gavarró, Gabby Hoban, Jessica Braden, Amy Smart, Xine Li, Baoli Fan, Xennephone Hadeen, Iftakharul Alam, Bethanie Hasse, Hannah Smart, Scott Nacko, Chris Siotis, Tom Swan, Bryan Johnstone, Sally Sheldon, Michaela Fitzgerald, Abbey Yatsko, Rebecca Clement, Mark Rosenfield, and Donna Davis for help with fieldwork, laboratory analyses, and data processing; and Michelle Schiffer and the Cornwell and Wright laboratories for help with logistics. Luciana Chavez Rodriguez thanks Brian Ingalls for his helpful comments on the modeling approach.
This research has been supported by the National Science Foundation (grant nos. DEB-1655759, DEB-2149151, and DEB-1655340), the Natural Environment Research Council (grant no. NE/K01613X/1), and the Future Investigators in NASA Earth and Space Science and Technology (award no. 80NSSC20K1626).
This paper was edited by Edzo Veldkamp and reviewed by Christian Brischke and Derek Van der Kamp.
Alduchov, O. A. and Eskridge, R. E.: Improved Magnus Form Approximation of Saturation Vapor Pressure, J. Appl. Meteorol., 35, 601–609, https://doi.org/10.1175/1520-0450(1996)035<0601:IMFAOS>2.0.CO;2, 1996. a
A'Bear, A. D., Jones, T. H., Kandeler, E., and Boddy, L.: Interactive effects of temperature and soil moisture on fungal-mediated wood decomposition and extracellular enzyme activity, Soil Biol. Biochem., 70, 151–158, https://doi.org/10.1016/j.soilbio.2013.12.017, 2014. a
Barker, J.: Decomposition of Douglas-fir coarse woody debris in response to differing moisture content and initial heterotrophic colonization, Forest Ecol. Manag., 255, 598–604, https://doi.org/10.1016/j.foreco.2007.09.029, 2008. a
Bond-Lamberty, B., Wang, C., and Gower, S. T.: Annual carbon flux from woody debris for a boreal black spruce fire chronosequence: Carbon flux for Black Spruce woody debris, J. Geophys. Res.-Atmos., 107, WFX 1-1–WFX 1–10, https://doi.org/10.1029/2001JD000839, 2002. a
Brischke, C. and Rapp, A. O.: Dose–response relationships between wood moisture content, wood temperature and fungal decay determined for 23 European field test sites, Wood Sci. Technol., 42, 507–518, https://doi.org/10.1007/s00226-008-0191-8, 2008a. a, b, c, d
Brischke, C. and Rapp, A. O.: Influence of wood moisture content and wood temperature on fungal decay in the field: observations in different micro-climates, Wood Sci. Technol., 42, 663–677, https://doi.org/10.1007/s00226-008-0190-9, 2008b. a, b, c
Brischke, C., Bayerbach, R., and Otto Rapp, A.: Decay-influencing factors: A basis for service life prediction of wood and wood-based products, Wood Material Science & Engineering, 1, 91–107, https://doi.org/10.1080/17480270601019658, 2006. a, b
Bürkner, P.-C.: brms: An R Package for Bayesian Multilevel Models Using Stan, J. Stat. Softw., 80, 1–28, https://doi.org/10.18637/jss.v080.i01, 2017. a
Bürkner, P.-C.: Advanced Bayesian Multilevel Modeling with the R Package brms, R Journal, 10, 395, https://doi.org/10.32614/RJ-2018-017, 2018. a
Bürkner, P.-C.: Bayesian Item Response Modeling in R with brms and Stan, J. Stat. Softw., 100, 1–54, https://doi.org/10.18637/jss.v100.i05, 2021. a
Chambers, J. Q., Higuchi, N., Schimel, J. P., Ferreira, L. V., and Melack, J. M.: Decomposition and carbon cycling of dead trees in tropical forests of the central Amazon, Oecologia, 122, 380–388, https://doi.org/10.1007/s004420050044, 2000. a, b, c
Cheesman, A. W., Cernusak, L. A., and Zanne, A. E.: Relative roles of termites and saprotrophic microbes as drivers of wood decay: A wood block test, Austral. Ecol., 43, 257–267, https://doi.org/10.1111/aec.12561, 2018. a, b, c, d
Clement, R. A., Flores-Moreno, H., Cernusak, L. A., Cheesman, A. W., Yatsko, A. R., Allison, S. D., Eggleton, P., and Zanne, A. E.: Assessing the Australian Termite Diversity Anomaly: How Habitat and Rainfall Affect Termite Assemblages, Front. Ecol. Evol., 9, 657444, https://doi.org/10.3389/fevo.2021.657444, 2021. a, b
Cornwell, W. K., Cornelissen, J. H. C., Allison, S. D., Bauhus, J., Eggleton, P., Preston, C. M., Scarff, F., Weedon, J. T., Wirth, C., and Zanne, A. E.: Plant traits and wood fates across the globe: rotted, burned, or consumed?, Glob. Change Biol., 15, 2431–2449, https://doi.org/10.1111/j.1365-2486.2009.01916.x, 2009. a, b, c, d, e
Dossa, G. G. O., Paudel, E., Wang, H., Cao, K., Schaefer, D., and Harrison, R. D.: Correct calculation of CO2 efflux using a closed-chamber linked to a non-dispersive infrared gas analyzer, Methods Ecol. Evol., 6, 1435–1442, https://doi.org/10.1111/2041-210X.12451, 2015. a
Dossa, G. G. O., Yang, Y.-Q., Hu, W., Paudel, E., Schaefer, D., Yang, Y.-P., Cao, K.-F., Xu, J.-C., Bushley, K. E., and Harrison, R. D.: Fungal succession in decomposing woody debris across a tropical forest disturbance gradient, Soil Biol. Biochem., 155, 108142, https://doi.org/10.1016/j.soilbio.2021.108142, 2021. a
Duan, E. S., Chavez Rodriguez, L., Flores-Moreno, H., Cheesman, A. W., Liddell, M. J., Zanne, A. E., and Allison, S. D.: WTF Climate dataset: 4 years of weather data from tropical Queensland, Australia, Zenodo [data set], https://doi.org/10.5281/ZENODO.7958670, 2023. a, b, c
Duan, E. S., Chavez Rodriguez, L., Hemming-Schroeder, N., Wijas, B., Flores-Moreno, H., Cheesman, A. W., Cernusak, L. A., Liddell, M. J., Eggleton, P., Zanne, A. E., and Allison, S. D.: Data and code from: Climate-based prediction of carbon fluxes from deadwood in Australia (v1.0.0), Zenodo [code], https://doi.org/10.5281/zenodo.11623043, 2024. a
FAO: Global Forest Resources Assessment 2020, FAO, https://doi.org/10.4060/ca9825en, 2020. a
Floriancic, M. G., Allen, S. T., Meier, R., Truniger, L., Kirchner, J. W., and Molnar, P.: Potential for significant precipitation cycling by forest-floor litter and deadwood, Ecohydrology, 16, e2493, https://doi.org/10.1002/eco.2493, 2023. a
Forrester, J. A., Mladenoff, D. J., Gower, S. T., and Stoffel, J. L.: Interactions of temperature and moisture with respiration from coarse woody debris in experimental forest canopy gaps, Forest Ecol. Manag., 265, 124–132, https://doi.org/10.1016/j.foreco.2011.10.038, 2012. a, b
Francois, C., Ottle, C., and Prevot, L.: Analytical parameterization of canopy directional emissivity and directional radiance in the thermal infrared. Application on the retrieval of soil and foliage temperatures using two directional measurements, Int. J. Remote Sens., 18, 2587–2621, https://doi.org/10.1080/014311697217495, 1997. a, b, c
Gale, N.: The aftermath of tree death: coarse woody debris and the topography in four tropical rain forests, Can. J. Forest Res., 30, 1489–1493, https://doi.org/10.1139/x00-071, 2000. a, b
González, G., Gould, W. A., Hudak, A. T., and Hollingsworth, T. N.: Decay of Aspen (Populus tremuloides Michx.) Wood in Moist and Dry Boreal, Temperate, and Tropical Forest Fragments, Ambio, 37, 588–597, https://doi.org/10.1579/0044-7447-37.7.588, 2008. a, b
Green, M. B., Fraver, S., Lutz, D. A., Woodall, C. W., D'Amato, A. W., and Evans, D. M.: Does deadwood moisture vary jointly with surface soil water content?, Soil Sci. Soc. Am. J., 86, 1113–1121, https://doi.org/10.1002/saj2.20413, 2022. a, b, c
Griffiths, H. M., Ashton, L. A., Evans, T. A., Parr, C. L., and Eggleton, P.: Termites can decompose more than half of deadwood in tropical rainforest, Curr. Biol., 29, R118–R119, https://doi.org/10.1016/j.cub.2019.01.012, 2019. a
Gómez-Brandón, M., Ascher-Jenull, J., Bardelli, T., Fornasier, F., Fravolini, G., Arfaioli, P., Ceccherini, M. T., Pietramellara, G., Lamorski, K., Sławiński, C., Bertoldi, D., Egli, M., Cherubini, P., and Insam, H.: Physico-chemical and microbiological evidence of exposure effects on Picea abies – Coarse woody debris at different stages of decay, Forest Ecol. Manag., 391, 376–389, https://doi.org/10.1016/j.foreco.2017.02.033, 2017. a
Hagemann, U., Moroni, M. T., Gleißner, J., and Makeschin, F.: Disturbance history influences downed woody debris and soil respiration, Forest Ecol. Manag., 260, 1762–1772, https://doi.org/10.1016/j.foreco.2010.08.018, 2010. a
Hansson, E. F., Brischke, C., Meyer, L., Isaksson, T., Thelandersson, S., and Kavurmaci, D.: Durability of timber outdoor structures – modeling performance and climate impacts, New Zealand Timber Design Society, Auckland, New Zealand, 295–303, 2012. a
Herrmann, S. and Bauhus, J.: Effects of moisture, temperature and decomposition stage on respirational carbon loss from coarse woody debris (CWD) of important European tree species, Scand. J. Forest Res., 28, 346–357, https://doi.org/10.1080/02827581.2012.747622, 2013. a
Honjo, T., Lin, T.-P., and Seo, Y.: Sky view factor measurement by using a spherical camera, J. Agr. Meteorol., 75, 59–66, https://doi.org/10.2480/agrmet.D-18-00027, 2019. a
Hu, Z., Xu, C., McDowell, N. G., Johnson, D. J., Wang, M., Luo, Y., Zhou, X., and Huang, Z.: Linking microbial community composition to C loss rates during wood decomposition, Soil Biol. Biochem., 104, 108–116, https://doi.org/10.1016/j.soilbio.2016.10.017, 2017. a
Hu, Z., Michaletz, S. T., Johnson, D. J., McDowell, N. G., Huang, Z., Zhou, X., and Xu, C.: Traits drive global wood decomposition rates more than climate, Glob. Change Biol., 24, 5259–5269, https://doi.org/10.1111/gcb.14357, 2018. a, b, c
Jamali, H., Livesley, S. J., Hutley, L. B., Fest, B., and Arndt, S. K.: The relationships between termite mound emissions and internal concentration ratios are species specific, Biogeosciences, 10, 2229–2240, https://doi.org/10.5194/bg-10-2229-2013, 2013. a
Jomura, M., Kominami, Y., Dannoura, M., and Kanazawa, Y.: Spatial variation in respiration from coarse woody debris in a temperate secondary broad-leaved forest in Japan, Forest Ecol. Manag., 255, 149–155, https://doi.org/10.1016/j.foreco.2007.09.002, 2008. a
Kahl, T., Baber, K., Otto, P., Wirth, C., and Bauhus, J.: Drivers of CO2 Emission Rates from Dead Wood Logs of 13 Tree Species in the Initial Decomposition Phase, Forests, 6, 2484–2504, https://doi.org/10.3390/f6072484, 2015. a
Kim, S., Han, S. H., Li, G., Roh, Y., Kim, H.-J., and Son, Y.: The initial effects of microclimate and invertebrate exclusion on multi-site variation in the mass loss of temperate pine and oak deadwoods, Sci. Rep.-UK, 11, 14840, https://doi.org/10.1038/s41598-021-94424-w, 2021. a, b
Kipping, L., Maurer, F., Gossner, M. M., Muszynski, S., Kahl, T., Kellner, H., Weiser, W. W., Jehmlich, N., and Noll, M.: Drivers of deadwood decay of 13 temperate tree species are similar between forest and grassland habitats, Frontiers in Forests and Global Change, 5, 1020737, https://doi.org/10.3389/ffgc.2022.1020737, 2022. a
Knoben, W. J. M., Freer, J. E., and Woods, R. A.: Technical note: Inherent benchmark or not? Comparing Nash–Sutcliffe and Kling–Gupta efficiency scores, Hydrol. Earth Syst. Sci., 23, 4323–4331, https://doi.org/10.5194/hess-23-4323-2019, 2019. a
Koutsoyiannis, D.: Clausius–Clapeyron equation and saturation vapour pressure: simple theory reconciled with practice, Eur. J. Phys., 33, 295–305, https://doi.org/10.1088/0143-0807/33/2/295, 2012. a
Kumar, P., Chen, H. Y., Thomas, S. C., and Shahi, C.: Effects of coarse woody debris on plant and lichen species composition in boreal forests, J. Veg. Sci., 28, 389–400, https://doi.org/10.1111/jvs.12485, 2017. a
Law, S., Flores-Moreno, H., Cheesman, A. W., Clement, R., Rosenfield, M., Yatsko, A., Cernusak, L. A., Dalling, J. W., Canam, T., Iqsaysa, I. A., Duan, E. S., Allison, S. D., Eggleton, P., and Zanne, A. E.: Wood traits explain microbial but not termite-driven decay in Australian tropical rainforest and savanna, J. Ecol., 111, 982–993, https://doi.org/10.1111/1365-2745.14090, 2023. a, b, c, d, e, f, g, h, i
Lawrence, D. M., Fisher, R. A., Koven, C. D., Oleson, K. W., Swenson, S. C., Bonan, G., Collier, N., Ghimire, B., Van Kampenhout, L., Kennedy, D., Kluzek, E., Lawrence, P. J., Li, F., Li, H., Lombardozzi, D., Riley, W. J., Sacks, W. J., Shi, M., Vertenstein, M., Wieder, W. R., Xu, C., Ali, A. A., Badger, A. M., Bisht, G., Van Den Broeke, M., Brunke, M. A., Burns, S. P., Buzan, J., Clark, M., Craig, A., Dahlin, K., Drewniak, B., Fisher, J. B., Flanner, M., Fox, A. M., Gentine, P., Hoffman, F., Keppel-Aleks, G., Knox, R., Kumar, S., Lenaerts, J., Leung, L. R., Lipscomb, W. H., Lu, Y., Pandey, A., Pelletier, J. D., Perket, J., Randerson, J. T., Ricciuto, D. M., Sanderson, B. M., Slater, A., Subin, Z. M., Tang, J., Thomas, R. Q., Val Martin, M., and Zeng, X.: The Community Land Model Version 5: Description of New Features, Benchmarking, and Impact of Forcing Uncertainty, J. Adv. Model. Earth Sy., 11, 4245–4287, https://doi.org/10.1029/2018MS001583, 2019. a
Liski, J., Palosuo, T., Peltoniemi, M., and Sievänen, R.: Carbon and decomposition model Yasso for forest soils, Ecol. Model., 189, 168–182, https://doi.org/10.1016/j.ecolmodel.2005.03.005, 2005. a
Liu, W. H., Bryant, D. M., Hutyra, L. R., Saleska, S. R., Hammond-Pyle, E., Curran, D., and Wofsy, S. C.: Woody Debris Contribution to the Carbon Budget of Selectively Logged and Maturing Mid-Latitude Forests, Oecologia, 148, 108–117, https://www.jstor.org/stable/20445889 (last access: 19 July 2024), 2006. a
Mackensen, J., Bauhus, J., and Webber, E.: Decomposition rates of coarse woody debris—A review with particular emphasis on Australian tree species, Aust. J. Bot., 51, 27, https://doi.org/10.1071/BT02014, 2003. a
Makowski, D., Ben-Shachar, M., and Lüdecke, D.: bayestestR: Describing Effects and their Uncertainty, Existence and Significance within the Bayesian Framework, Journal of Open Source Software, 4, 1541, https://doi.org/10.21105/joss.01541, 2019a. a
Makowski, D., Ben-Shachar, M. S., Chen, S. H. A., and Lüdecke, D.: Indices of Effect Existence and Significance in the Bayesian Framework, Front. Psychol., 10, 2767, https://doi.org/10.3389/fpsyg.2019.02767, 2019b. a
MATLAB: MATLAB version 9.6.0.1072779 (R2019a), MATLAB, Natick, Massachusetts, https://www.mathworks.com (last access: 10 April 2024), 2019. a, b
Matthews, S.: A process-based model of fine fuel moisture, Int. J. Wildland Fire, 15, 155–168, https://doi.org/10.1071/WF05063, 2006. a
Matthews, S.: Dead fuel moisture research: 1991–2012, Int. J. Wildland Fire, 23, 78, https://doi.org/10.1071/WF13005, 2014. a
Mitchard, E. T. A.: The tropical forest carbon cycle and climate change, Nature, 559, 527–534, https://doi.org/10.1038/s41586-018-0300-2, 2018. a
Moriasi, D. N., Gitau, M. W., Pai, N., and Daggupati, P.: Hydrologic and Water Quality Models: Performance Measures and Evaluation Criteria, T. ASABE, 58, 1763–1785, https://doi.org/10.13031/trans.58.10715, 2015. a
Musselman, K. N., Pomeroy, J. W., and Link, T. E.: Variability in shortwave irradiance caused by forest gaps: Measurements, modelling, and implications for snow energetics, Agr. Forest Meteorol., 207, 69–82, 2015. a
Nelson, R. M.: Prediction of diurnal change in 10-h fuel stick moisture content, Can. J. Forest Res., 30, 1071–1087, https://doi.org/10.1139/x00-032, 2000. a, b
Nguyen, P., Shearer, E. J., Tran, H., Ombadi, M., Hayatbini, N., Palacios, T., Huynh, P., Braithwaite, D., Updegraff, G., Hsu, K., Kuligowski, B., Logan, W. S., and Sorooshian, S.: The CHRS Data Portal, an easily accessible public repository for PERSIANN global satellite precipitation data, Scientific Data, 6, 180296, https://doi.org/10.1038/sdata.2018.296, 2019. a
Olou, B. A., Yorou, N. S., Striegel, M., Bässler, C., and Krah, F.-S.: Effects of macroclimate and resource on the diversity of tropical wood-inhabiting fungi, Forest Ecol. Manag., 436, 79–87, https://doi.org/10.1016/j.foreco.2019.01.016, 2019. a
Pfeifer, M., Lefebvre, V., Turner, E., Cusack, J., Khoo, M., Chey, V. K., Peni, M., and Ewers, R. M.: Deadwood biomass: an underestimated carbon stock in degraded tropical forests?, Environ. Res. Lett., 10, 044019, https://doi.org/10.1088/1748-9326/10/4/044019, 2015. a, b, c
Piaszczyk, W., Lasota, J., Błońska, E., and Foremnik, K.: How habitat moisture condition affects the decomposition of fine woody debris from different species, CATENA, 208, 105765, https://doi.org/10.1016/j.catena.2021.105765, 2022. a
Pichler, V., Homolák, M., Skierucha, W., Pichlerová, M., Ramírez, D., Gregor, J., and Jaloviar, P.: Variability of moisture in coarse woody debris from several ecologically important tree species of the Temperate Zone of Europe, Ecohydrology, 5, 424–434, https://doi.org/10.1002/eco.235, 2012. a, b
Pomeroy, J. W., Marks, D., Link, T., Ellis, C., Hardy, J., Rowlands, A., and Granger, R.: The impact of coniferous forest temperature on incoming longwave radiation to melting snow, Hydrol. Process., 23, 2513–2525, https://doi.org/10.1002/hyp.7325, 2009. a
Pouska, V., Macek, P., Zíbarová, L., and Ostrow, H.: How does the richness of wood-decaying fungi relate to wood microclimate?, Fungal Ecol., 27, 178–181, https://doi.org/10.1016/j.funeco.2016.06.006, 2017. a
Prata, A. J.: A new long-wave formula for estimating downward clear-sky radiation at the surface, Q. J. Roy. Meteor. Soc., 122, 1127–1151, https://doi.org/10.1002/qj.49712253306, 1996. a, b
Progar, R. A., Schowalter, T. D., Freitag, C. M., and Morrell, J. J.: Respiration from coarse woody debris as affected by moisture and saprotroph functional diversity in Western Oregon, Oecologia, 124, 426–431, https://doi.org/10.1007/PL00008868, 2000. a, b, c
R Core Team: R: A Language and Environment for Statistical Computing, R Foundation for Statistical Computing, Vienna, Austria, https://www.R-project.org/ (last access: 19 July 2024), 2021. a
Raich, J. W., Russell, A. E., Kitayama, K., Parton, W. J., and Vitousek, P. M.: Temperature influences carbon accumulation in moist tropical forests, Ecology, 87, 76–87, https://doi.org/10.1890/05-0023, 2006. a
Read, Z., Fraver, S., Forrester, J. A., Wason, J., and Woodall, C. W.: Temporal trends in CO2 emissions from Picea rubens stumps: A chronosequence approach, Forest Ecol. Manag., 524, 120528, https://doi.org/10.1016/j.foreco.2022.120528, 2022. a
Risch, A. C., Page-Dumroese, D. S., Schweiger, A. K., Beattie, J. R., Curran, M. P., Finér, L., Hyslop, M. D., Liu, Y., Schütz, M., Terry, T. A., Wang, W., and Jurgensen, M. F.: Controls of Initial Wood Decomposition on and in Forest Soils Using Standard Material, Frontiers in Forests and Global Change, 5, 829810, https://doi.org/10.3389/ffgc.2022.829810, 2022. a, b
Rowland, L., Stahl, C., Bonal, D., Siebicke, L., Williams, M., and Meir, P.: The Response of Tropical Rainforest Dead Wood Respiration to Seasonal Drought, Ecosystems, 16, 1294–1309, https://doi.org/10.1007/s10021-013-9684-x, 2013. a, b
Schaefli, B. and Gupta, H. V.: Do Nash values have value?, Hydrol. Process., 21, 2075–2080, https://doi.org/10.1002/hyp.6825, 2007. a
Seibold, S., Rammer, W., Hothorn, T., Seidl, R., Ulyshen, M. D., Lorz, J., Cadotte, M. W., Lindenmayer, D. B., Adhikari, Y. P., Aragón, R., Bae, S., Baldrian, P., Barimani Varandi, H., Barlow, J., Bässler, C., Beauchêne, J., Berenguer, E., Bergamin, R. S., Birkemoe, T., Boros, G., Brandl, R., Brustel, H., Burton, P. J., Cakpo-Tossou, Y. T., Castro, J., Cateau, E., Cobb, T. P., Farwig, N., Fernández, R. D., Firn, J., Gan, K. S., González, G., Gossner, M. M., Habel, J. C., Hébert, C., Heibl, C., Heikkala, O., Hemp, A., Hemp, C., Hjältén, J., Hotes, S., Kouki, J., Lachat, T., Liu, J., Liu, Y., Luo, Y.-H., Macandog, D. M., Martina, P. E., Mukul, S. A., Nachin, B., Nisbet, K., O'Halloran, J., Oxbrough, A., Pandey, J. N., Pavlíček, T., Pawson, S. M., Rakotondranary, J. S., Ramanamanjato, J.-B., Rossi, L., Schmidl, J., Schulze, M., Seaton, S., Stone, M. J., Stork, N. E., Suran, B., Sverdrup-Thygeson, A., Thorn, S., Thyagarajan, G., Wardlaw, T. J., Weisser, W. W., Yoon, S., Zhang, N., and Müller, J.: The contribution of insects to global forest deadwood decomposition, Nature, 597, 77–81, https://doi.org/10.1038/s41586-021-03740-8, 2021. a
Shorohova, E. and Kapitsa, E.: The decomposition rate of non-stem components of coarse woody debris (CWD) in European boreal forests mainly depends on site moisture and tree species, Eur. J. For. Res., 135, 593–606, https://doi.org/10.1007/s10342-016-0957-8, 2016. a
Signorell, A., Aho, K., Alfons, A., Anderegg, N., Aragon, T., Arachchige, C., Arppe, A., Baddeley, A., Barton, K., Bolker, B., Borchers, H. W., Caeiro, F., Champely, S., Chessel, D., Chhay, L., Cooper, N., Cummins, C., Dewey, M., Doran, H. C., Dray, S., Dupont, C., Eddelbuettel, D., Ekstrom, C., Elff, M., Enos, J., Farebrother, R. W., Fox, J., Francois, R., Friendly, M., Galili, T., Gamer, M., Gastwirth, J. L., Gegzna, V., Gel, Y. R., Graber, S., Gross, J., Grothendieck, G., Jr, F. E. H., Heiberger, R., Hoehle, M., Hoffmann, C. W., Hojsgaard, S., Hothorn, T., Huerzeler, M., Hui, W. W., Hurd, P., Hyndman, R. J., Jackson, C., Kohl, M., Korpela, M., Kuhn, M., Labes, D., Leisch, F., Lemon, J., Li, D., Maechler, M., Magnusson, A., Mainwaring, B., Malter, D., Marsaglia, G., Marsaglia, J., Matei, A., Meyer, D., Miao, W., Millo, G., Min, Y., Mitchell, D., Mueller, F., Naepflin, M., Navarro, D., Nilsson, H., Nordhausen, K., Ogle, D., Ooi, H., Parsons, N., Pavoine, S., Plate, T., Prendergast, L., Rapold, R., Revelle, W., Rinker, T., Ripley, B. D., Rodriguez, C., Russell, N., Sabbe, N., Scherer, R., Seshan, V. E., Smithson, M., Snow, G., Soetaert, K., Stahel, W. A., Stephenson, A., Stevenson, M., Stubner, R., Templ, M., Lang, D. T., Therneau, T., Tille, Y., Torgo, L., Trapletti, A., Ulrich, J., Ushey, K., VanDerWal, J., Venables, B., Verzani, J., Iglesias, P. J. V., Warnes, G. R., Wellek, S., Wickham, H., Wilcox, R. R., Wolf, P., Wollschlaeger, D., Wood, J., Wu, Y., Yee, T., and Zeileis, A.: DescTools: Tools for Descriptive Statistics, R package version 0.99.23, https://cran.r-project.org/web/packages/DescTools/index.html (last access: 24 April 2024), 2023. a
Stackhouse, P.: NASA POWER | Prediction Of Worldwide Energy Resources, NASA Langley Res. Ctr., Hampton, VA, https://power.larc.nasa.gov/ (last access: 3 April 2023), 2006. a
Taylor, P. G., Cleveland, C. C., Wieder, W. R., Sullivan, B. W., Doughty, C. E., Dobrowski, S. Z., and Townsend, A. R.: Temperature and rainfall interact to control carbon cycling in tropical forests, Ecol. Lett., 20, 779–788, https://doi.org/10.1111/ele.12765, 2017. a
Thybring, E., Kymäläinen, M., and Rautkari, L.: Moisture in modified wood and its relevance for fungal decay, iForest, 11, 418–422, https://doi.org/10.3832/ifor2406-011, 2018. a
Thybring, E. E., Fredriksson, M., Zelinka, S. L., and Glass, S. V.: Water in Wood: A Review of Current Understanding and Knowledge Gaps, Forests, 13, 2051, https://doi.org/10.3390/f13122051, 2022. a, b
Ulyshen, M. D.: Wood decomposition as influenced by invertebrates, Biol. Rev. Camb. Philos., 91, 70–85, https://doi.org/10.1111/brv.12158, 2016. a, b
van der Kamp, D. W., Moore, R. D., and McKendry, I. G.: A model for simulating the moisture content of standardized fuel sticks of various sizes, Agr. Forest Meteorol., 236, 123–134, https://doi.org/10.1016/j.agrformet.2017.01.013, 2017. a, b, c, d, e, f, g, h, i, j, k, l, m, n, o, p
van Niekerk, P. B., Brischke, C., and Niklewski, J.: Estimating the Service Life of Timber Structures Concerning Risk and Influence of Fungal Decay – A Review of Existing Theory and Modelling Approaches, Forests, 12, 588, https://doi.org/10.3390/f12050588, 2021. a, b, c
Viitanen, H. A.: Modelling the Time Factor in the Development of Brown Rot Decay in Pine and Spruce Sapwood – The Effect of Critical Humidity and Temperature Conditions, Holzforschung, 51, 99–106, https://doi.org/10.1515/hfsg.1997.51.2.99, 1997. a, b, c
Wang, C., Bond-Lamberty, B., and Gower, S. T.: Environmental controls on carbon dioxide flux from black spruce coarse woody debris, Oecologia, 132, 374–381, https://doi.org/10.1007/s00442-002-0987-4, 2002. a
Wang, H., Wu, C., Liu, J., Chen, Q., Li, C., Shu, C., Zhang, Y., and Liu, Y.: Changes in soil microbial communities induced by warming and N deposition accelerate the CO2 emissions of coarse woody debris, J. Forestry Res., 34, 1051–1063, https://doi.org/10.1007/s11676-022-01544-8, 2023. a, b
Weedon, J. T., Cornwell, W. K., Cornelissen, J. H., Zanne, A. E., Wirth, C., and Coomes, D. A.: Global meta-analysis of wood decomposition rates: a role for trait variation among tree species?, Ecol. Lett., 12, 45–56, https://doi.org/10.1111/j.1461-0248.2008.01259.x, 2009. a
Woldendorp, G. and Keenan, R. J.: Coarse woody debris in Australian forest ecosystems: A review, Austral Ecol., 30, 834–843, https://doi.org/10.1111/j.1442-9993.2005.01526.x, 2005. a, b
Woodall, C., Evans, D., Fraver, S., Green, M., Lutz, D., and D'Amato, A.: Real-time monitoring of deadwood moisture in forests: lessons learned from an intensive case study, Can. J. Forest Res., 50, 1244–1252, https://doi.org/10.1139/cjfr-2020-0110, 2020. a
Wu, C., Zhang, Z., Shu, C., Mo, Q., Wang, H., Kong, F., Zhang, Y., Geoff Wang, G., and Liu, Y.: The response of coarse woody debris decomposition and microbial community to nutrient additions in a subtropical forest, Forest Ecol. Manag., 460, 117799, https://doi.org/10.1016/j.foreco.2019.117799, 2020. a
Wu, D., Pietsch, K. A., Staab, M., and Yu, M.: Wood species identity alters dominant factors driving fine wood decomposition along a tree diversity gradient in subtropical plantation forests, Biotropica, 53, 643–657, https://doi.org/10.1111/btp.12906, 2021. a
Yan, E., Wang, X., and Huang, J.: Concept and Classification of Coarse Woody Debris in Forest Ecosystems, Frontiers of Biology in China, 1, 76–84, https://doi.org/10.1007/s11515-005-0019-y, 2006. a
Yoon, T. K., Noh, N. J., Kim, S., Han, S., and Son, Y.: Coarse woody debris respiration of Japanese red pine forests in Korea: controlling factors and contribution to the ecosystem carbon cycle, Ecol. Res., 30, 723–734, https://doi.org/10.1007/s11284-015-1275-1, 2015. a, b, c
Zanne, A. E., Flores-Moreno, H., Powell, J. R., Cornwell, W. K., Dalling, J. W., Austin, A. T., Classen, A. T., Eggleton, P., Okada, K.-i., Parr, C. L., Adair, E. C., Adu-Bredu, S., Alam, M. A., Alvarez-Garzón, C., Apgaua, D., Aragón, R., Ardon, M., Arndt, S. K., Ashton, L. A., Barber, N. A., Beauchêne, J., Berg, M. P., Beringer, J., Boer, M. M., Bonet, J. A., Bunney, K., Burkhardt, T. J., Carvalho, D., Castillo-Figueroa, D., Cernusak, L. A., Cheesman, A. W., Cirne-Silva, T. M., Cleverly, J. R., Cornelissen, J. H. C., Curran, T. J., D'Angioli, A. M., Dallstream, C., Eisenhauer, N., Evouna Ondo, F., Fajardo, A., Fernandez, R. D., Ferrer, A., Fontes, M. A. L., Galatowitsch, M. L., González, G., Gottschall, F., Grace, P. R., Granda, E., Griffiths, H. M., Guerra Lara, M., Hasegawa, M., Hefting, M. M., Hinko-Najera, N., Hutley, L. B., Jones, J., Kahl, A., Karan, M., Keuskamp, J. A., Lardner, T., Liddell, M., Macfarlane, C., Macinnis-Ng, C., Mariano, R. F., Méndez, M. S., Meyer, W. S., Mori, A. S., Moura, A. S., Northwood, M., Ogaya, R., Oliveira, R. S., Orgiazzi, A., Pardo, J., Peguero, G., Penuelas, J., Perez, L. I., Posada, J. M., Prada, C. M., Přívětivý, T., Prober, S. M., Prunier, J., Quansah, G. W., Resco de Dios, V., Richter, R., Robertson, M. P., Rocha, L. F., Rúa, M. A., Sarmiento, C., Silberstein, R. P., Silva, M. C., Siqueira, F. F., Stillwagon, M. G., Stol, J., Taylor, M. K., Teste, F. P., Tng, D. Y. P., Tucker, D., Türke, M., Ulyshen, M. D., Valverde-Barrantes, O. J., van den Berg, E., van Logtestijn, R. S. P., Veen, G. F. C., Vogel, J. G., Wardlaw, T. J., Wiehl, G., Wirth, C., Woods, M. J., and Zalamea, P.-C.: Termite sensitivity to temperature affects global wood decay rates, Science, 377, 1440–1444, https://doi.org/10.1126/science.abo3856, 2022. a, b, c, d
Zhou, L., Dai, L.-m., Gu, H.-y., and Zhong, L.: Review on the decomposition and influence factors of coarse woody debris in forest ecosystem, J. Forestry Res., 18, 48–54, https://doi.org/10.1007/s11676-007-0009-9, 2007. a, b, c