the Creative Commons Attribution 4.0 License.
the Creative Commons Attribution 4.0 License.
 | 24 Jul 2024
The biological and preformed carbon pumps in perpetually slower and warmer oceans
Matthew A. Chamberlain
The marine carbon cycle is vitally important for climate and the fertility of the oceans. However, predictions of future biogeochemistry are challenging because a myriad of processes need parameterization and the future evolution of the physical ocean state is uncertain. Here, we embed a data-constrained model of the carbon cycle in slower and warmer ocean states as simulated under the RCP4.5 and RCP8.5 (RCP: Representative Concentration Pathway) scenarios for the 2090s and frozen in time for perpetuity. Focusing on steady-state changes from preindustrial conditions allows us to capture the response of the system integrated over all the timescales of the steady-state biogeochemistry, as opposed to typical transient simulations that capture only sub-centennial timescales. We find that biological production experiences only modest declines (of 8 %–12 %) because the reduced nutrient supply due to a more sluggish circulation and strongly shoaled mixed layers is counteracted by warming-stimulated growth. Organic-matter export declines by 15 %–25 % due to reductions in both biological production and export ratios, the latter being driven by warming-accelerated shallow respiration and reduced subduction of dissolved organic matter. The perpetual-2090s biological pump cycles a 30 %–70 % larger regenerated inventory accumulated over longer sequestration times, while preformed DIC is shunted away from biological utilization to outgassing. The regenerated and preformed DIC inventories both increase by a similar magnitude. We develop a conceptually new partitioning of preformed DIC to quantify the ocean's preformed carbon pump and its changes. Near-surface paths of preformed DIC are more important in the slower circulations, as weakened ventilation isolates the deep ocean. Thus, while regenerated DIC cycling becomes slower, preformed DIC cycling speeds up.
- Article
(15939 KB) - Full-text XML
- BibTeX
- EndNote


The ocean carbon cycle is a key control on future climate (e.g., Revelle and Suess, 1957; Broecker, 1982; Arias et al., 2021), and the sustained biological productivity of the ocean is essential for future food security (e.g., Golden, 2016; FAO, 2018). Anthropogenic forcing of the climate system will have profound effects on the future carbon cycle and has already begun to impact ocean biogeochemistry (e.g., Riebesell et al., 2009). In recent decades, dissolved oxygen has declined (e.g., Helm et al., 2011; Whitney et al., 2007), the ocean has acidified (e.g., Doney et al., 2009), and the upper ocean has warmed and stratified (e.g., Li et al., 2020). The question of how the ocean carbon cycle will evolve in the future is thus of intense interest and has stimulated numerous studies (for a small selection, see, e.g., Sarmiento and Le Quéré, 1996; Sarmiento et al., 1998; Matear and Hirst, 1999; Plattner et al., 2001; Riebesell et al., 2009; Bopp et al., 2013; Bernardello et al., 2014; Ito et al., 2015; Hauck et al., 2015; Moore et al., 2018; Henson et al., 2022; Wilson et al., 2022; Liu et al., 2023).
Carbon sequestration in the ocean occurs primarily through two mechanisms (Volk and Hoffert, 1985): (i) organic-matter production in the surface ocean is followed by the export of biogenic particles and dissolved organic carbon (DOC) to depth (the biological pump), and (ii) CO2 is highly soluble in seawater (Weiss, 1974) and newly dissolved inorganic carbon (DIC) is physically transported into the ocean interior with the circulation (the solubility pump). In response to climate change, both the biological and solubility pumps are expected to change. This will have major consequences for the radiative forcing of the atmosphere (without the biological pump, preindustrial atmospheric pCO2 concentrations would have been about 200 ppm higher; see, e.g., Volk and Hoffert, 1985; Holzer et al., 2021b) and for future food security, as biological production is expected to diminish (e.g., Kwiatkowski et al., 2020).
For the 21st century and beyond, there is broad agreement among models of the fifth and sixth phases of the Coupled Model Intercomparison Project (CMIP5 and CMIP6) that the ocean will sequester more carbon (Bopp et al., 2013; Ito et al., 2015; Hauck et al., 2015; Henson et al., 2022; Wilson et al., 2022; Liu et al., 2023). There is also broad agreement that despite future reductions in productivity and export (e.g., Bopp et al., 2013), the biological pump will cycle a larger pool of regenerated carbon in the future, as a slowing overturning circulation will increase the residence time of carbon in the deep ocean (e.g., Ito et al., 2015; Wilson et al., 2022; Liu et al., 2023).
However, the future evolution of the ocean carbon cycle remains uncertain (Riebesell et al., 2009; Henson et al., 2022) for many reasons. Future radiative forcing depends on uncertain socioeconomic factors (Meinshausen et al., 2020), numerous physical and complex biogeochemical processes need to be parameterized and calibrated (e.g., Gent et al., 1995; Kriest, 2017; Kriest et al., 2020), and ocean models must be properly spun up so that future changes are not biased by initial drift (e.g., Irving et al., 2021). Moreover, typical centennial simulations are unable to probe the response of the carbon cycle to future conditions on all its natural timescales, which exceed a millennium (Primeau, 2005; Holzer and Primeau, 2010; Holzer et al., 2021a). Recognizing the importance of the slow deep circulation for carbon cycling, some studies have explored the response of the ocean's carbon pumps to the year 2300 (e.g., Moore et al., 2018; Liu et al., 2023), but even that only probes a fraction of the full spectrum of timescales that will shape the long-term evolution of ocean biogeochemistry.
The central question of our work here is the following: what would the equilibrium steady-state ocean carbon cycle be if the ocean circulation and thermodynamic state at the end of the 21st century were frozen in time? Probing the system in steady state is advantageous because it avoids the complications of transience by integrating the system's response to change in perpetual decadal-mean ocean state on all timescales. To reduce uncertainty due to poorly constrained biogeochemical parameters, we employ a data-constrained model of the carbon cycle with optimized parameters (Pasquier et al., 2023). To avoid the computational costs of model spin-up, we directly solve for the biogeochemical steady-state equilibrium with frozen-in-time circulations as simulated for the 2090s under the RCP4.5 and RCP8.5 scenarios by the Australian Community Climate and Earth System Simulator (ACCESS1.3; Bi et al., 2013a) (Representative Concentration Pathways RCP4.5 and RCP8.5 represent intermediate and worst-case scenarios for future global warming; Meinshausen et al., 2011).
To comprehensively track all carbon through the ocean, we quantify changes between our perpetual-2090s states and our preindustrial state in terms of the biological carbon pump and in terms of what we call the preformed carbon pump. A quantification of the preformed pump is made possible by a novel partition of preformed DIC according to its sources and sinks. The preformed pump defined here allows us to track all preformed DIC back in time to its sources when atmospheric CO2 entered the ocean, when organic matter was remineralized in the euphotic zone, or when aphotically regenerated DIC resurfaced. In addition, we track preformed DIC forward in time to its sinks, when it will outgas to the atmosphere or be utilized biologically. In this way, we quantify the timescales and flow rates (the “plumbing”) of not just the biological pump but also the preformed pump as well as the interaction between these pumps and the atmosphere and how these change in our idealized perpetual-2090s steady states.
2.1 Frozen-in-time ocean circulation models
To build our frozen-in-time circulation models, we use physical ocean states from ACCESS1.3 climate-model simulations (Bi et al., 2013a) for the preindustrial ocean and for two future climate scenarios. For the preindustrial ocean, we build on the work of Chamberlain et al. (2019) and Pasquier et al. (2023) and use the 1990s average of the circulation, thermodynamic, and forcing fields from the “historical” ACCESS1.3 runs submitted to CMIP5 (Taylor et al., 2012). We refer to this 1990s state as “preindustrial” because the carbon cycle was optimized against DIC observations corrected for anthropogenic DIC. The circulation itself and the other tracers used as constraints are appropriate for the 1990s, but because the preindustrial-to-1990s changes are dwarfed by the centennial changes analyzed here, we do not make a further distinction with a true preindustrial state.
For the perpetually warmer and slower ocean states, we use the 2090s average for the ACCESS1.3 CMIP5 runs for the RCP4.5 and RCP8.5 scenarios. We use RCP8.5 (which represents the worst-case scenario for future global warming; Meinshausen et al., 2011) because it provides the strongest perturbation and the more likely intermediate RCP4.5 to assess the sensitivity of our results to the climate-change scenario. We prescribe atmospheric CO2 ratios of 278 ppm for the preindustrial state and 536 and 886 ppm for the RCP4.5- and RCP8.5-based perpetual-2090s states analyzed below.
The ocean's advective–diffusive flux-divergence operator is discretized on the numerical grid and organized into “transport matrices” for each state following the approach of Chamberlain et al. (2019). The horizontal advective fluxes across grid-cell faces are taken from the averaged ACCESS1.3 fields, and the vertical fluxes are calculated from mass conservation by integrating up from the seafloor. To speed up numerical solutions, we coarse-grain the grid by lumping horizontally neighboring grid cells 2 × 2, as done by Pasquier et al. (2023). Using the original resolution without re-optimizing parameters degrades the biogeochemical model's match with observations, with little improvement in finer-scale features. The coarse-grained grid has a nominal horizontal resolution of 2° × 2° (finer in latitude near the Equator) and 50 depth levels with layer thicknesses that increase from 10 m for the surface layer to 335 m for the deepest layer. We prescribe background horizontal and vertical diffusivities of 500 and 10−5 m2 s−1, respectively, and a mixed-layer vertical diffusivity of 0.1 m2 s−1. The transport matrix for the preindustrial state is identical to the ACCESS-M matrix used by Pasquier et al. (2023).
We use the transport matrices to embed our biogeochemical model (PCO2, Pasquier et al., 2023) in the corresponding circulations. The transport matrices and atmospheric pCO2 are held fixed in time, and we solve for steady state using an efficient iterative Newton solver. We thus calculate the equilibrium biogeochemical state under perpetual preindustrial and 2090s RCP4.5 and RCP8.5 conditions. While this avoids spin-up issues, we emphasize that our perpetual-2090s states cannot be interpreted as predictions for the 2090s or for any future steady state. Instead, our steady-state solutions allow us to determine what the asymptotically long-term adjustment of the carbon cycle would look like if the physical and thermodynamic state of the 2090s ocean was frozen in time.
2.2 Biogeochemistry model
We use PCO2, a simple model of the ocean's carbon, nutrient, and oxygen cycles (Pasquier et al., 2023). Here, we only detail the features and parameterizations directly relevant to the present work. Crucially, PCO2 mechanistically couples the carbon, phosphorus, and oxygen cycles, capturing important nonlinear interactions and feedbacks in the response of the biogeochemistry to climate change. These include the effects of nutrient supply and temperature on biological production and the effects of temperature and oxygen on bacterial respiration.
Pasquier et al. (2023) objectively optimized the parameters of the PCO2 model for the preindustrial state against the observed concentrations of phosphate (PO4), DIC, oxygen, and total alkalinity, with the DIC observations corrected for anthropogenic carbon. The optimization tends to correct biases from the embedding circulation as well as biases from the biogeochemistry model (see Sect. 4 for model caveats). We use the same biogeochemical parameters for all states to capture the response of the carbon cycle to changes in physical ocean state without any changes in plankton physiology.
In a nutshell, PCO2 makes the following simplifying approximations: phosphate is the only limiting nutrient, which avoids the complexities of the nitrogen cycle and micronutrients such as iron, and the marine ecosystem is approximated by a single phytoplankton species with an implicitly parameterized mortality to avoid the considerable complexities of higher trophic levels. These simplifications are justified a fortiori by the good fit to the observations.
We focus on DIC, which, in steady state, obeys
where is the flux divergence of DIC due to advection (with velocity u) and eddy diffusion (diffusivity tensor K), and the local sources and sinks are on the right. The biological utilization rate per unit volume U (further detailed below) converts DIC to DOC, fast- and slow-sinking particulate organic carbon (POCf and POCs), or particulate inorganic carbon (PIC). Organic matter is then remineralized back to DIC through respiration at rates RDOC, , and , while PIC is dissolved to form DIC at rate DPIC. In PCO2, biogenic particles are only transported by gravitational settling, which dominates advective–diffusive transport. All the particles that reach the bottommost grid box are either remineralized or dissolved there. In Eq. (1), R denotes the total DIC regeneration rate, i.e., . In addition, DIC also has local sources or sinks Jatm through CO2 exchange with the atmosphere (described further below).
The biological DIC uptake rate U is nonlinearly colimited by temperature, light, and nutrient availability, the latter being additionally modulated by the variable C:P uptake stoichiometry, parameterized here in terms of phosphate concentration. Specifically, we parameterize U as
where τ = 30 d is a growth timescale, pmax = 23.4 µM is a scale for the phytoplankton concentration, T is the water temperature, κ = 0.063 K−1 sets the e-folding temperature for growth and mortality, and kI = 10 W m−2 and kP = 3.14 µM are the half-saturation constraints for photosynthetically active radiation (PAR) and PO4, respectively. The last fraction in Eq. (2) is the C:P uptake ratio parameterized in terms of [PO4] with slope m = 6.9 and intercept b = 6.0 mmolP molC−1 (Galbraith and Martiny, 2015) (see Table 1 of Pasquier et al., 2023, for the values of all model parameters). In Eq. (2), we grouped terms into the factors β (temperature-related), λ (light-related), and α (nutrient-related). With these definitions, ΔU, the uptake change from the preindustrial state to the perpetual-2090s state, can be decomposed into contributions from the changes in each of these factors by writing . Throughout, ΔX denotes the change in X from the preindustrial to the perpetual-2090s state, while X not preceded by Δ denotes the preindustrial value.
At the surface, carbon enters and exits the ocean through CO2 air–sea exchange following the parameterization of Wanninkhof (2014). Specifically, in Eq. (1), is the source/sink of [DIC] due to air–sea exchange in the surface layer, where w0 is the gas-transfer velocity, K0 is the CO2 solubility, is the atmospheric partial pressure of CO2 at the sea surface, is the seawater equivalent partial pressure, and z0 is the thickness of the top model layer (K0 and are computed using the MATLAB CO2SYS package; Lewis and Wallace, 1998; van Heuven et al., 2011). Note that in our model, carbon can only enter or exit the ocean through air–sea exchange so that in steady-state equilibrium, there is no net carbon source or sink when globally integrating over all locations r, i.e., .
2.3 Tracking preformed DIC from its sources to its sinks
We partition the DIC concentration into its usual preformed and regenerated components but explicitly identify the sources and sinks of preformed DIC. Because the re-emergence of regenerated DIC into the euphotic zone is one of the sources of preformed DIC, we first consider regenerated DIC.
To track regenerated DIC, we label DIC during regeneration in the aphotic zone (mask Ωaph=1 in the aphotic zone and 0 otherwise) and immediately unlabel it on entry into the euphotic zone (mask ). This unlabeling is conveniently accomplished by a fast relaxation to zero with timescale τ0 = 1 s. The regenerated DIC concentration Creg thus obeys
Creg is then straightforwardly partitioned according to regeneration mechanism (DOC, POCf, or POCs respiration, or PIC dissolution) by replacing R in Eq. (3) with the corresponding respiration or dissolution rate. The flow rates, residence times, and pathways of the mechanism-partitioned Creg are then used to quantify the plumbing of the biological pump, as in the work of Pasquier et al. (2023).
To track preformed DIC, we define a new labeling tracer that is allowed to roam over the entire ocean, including the euphotic zone, and for which we diagnose explicit euphotic sources and sinks. This contrasts sharply with the traditional approach where concentrations in the surface ocean (taken as the euphotic zone in many models or above the maximum mixed-layer depth in data-based analyses) are defined as preformed and then propagated into the ocean interior (e.g., Ito and Follows, 2005). Our preformed labeling tracer has the exact same concentrations as obtained by the traditional approach (i.e., by propagating euphotic concentrations), but identifying its sources and sinks makes it possible to quantify the transport of preformed DIC within the surface ocean, which is not possible with the traditional approach.
Preformed DIC has three sources and two sinks. The sources are gross CO2 ingassing at rate , regeneration within the euphotic zone at rate ΩeupR, and the emergence of aphotically regenerated DIC into the euphotic zone. When aphotically regenerated DIC enters the euphotic zone, its regenerated label is replaced by the preformed label so that the corresponding rate of labeling preformed DIC (“newly” preformed) is equal to the rate of unlabeling regenerated DIC given by in Eq. (3). The sinks are biological utilization (removing the preformed label at rate U) and gross outgassing (removing the preformed label at rate ). The preformed DIC concentration Cpre thus obeys
Casting the equation for preformed DIC in this way has major advantages over the traditional boundary-value approach. For the first time, we will be able to (i) partition preformed DIC according to its source and sink mechanisms, (ii) track the transport of DIC through the surface ocean, and (iii) quantify bulk flow rates of preformed DIC without the complications of singular diffusive one-way fluxes (for further discussion, see Sect. 4).
To partition Cpre according to specified source origin (s) and sink destination (loss, l), we employ linear labeling tracers (e.g., Holzer et al., 2014; Pasquier and Holzer, 2018; Holzer and DeVries, 2022, with the details given in Appendix A). This provides the preformed concentration , which we use to quantify the plumbing of the ocean's preformed carbon pump and how it changes in the perpetual-2090s states.
3.1 The perpetual-2090s biological pump
The key components of the biological carbon pump are organic-matter production, export of organic matter, and sequestration of regenerated DIC in the aphotic interior. We now examine how each of these components changes from their preindustrial values and what the main mechanisms are that drive these changes.
3.1.1 Changes in organic-matter production
Organic-matter production in the euphotic zone, modeled here by Eq. (2) as the DIC uptake U, is a key metric of ocean health, and its future is of great importance for food security (e.g., Costello et al., 2020). The circulation of our perpetual-2090s states is known to be more sluggish (Holzer et al., 2020), and the question is how this affects production.
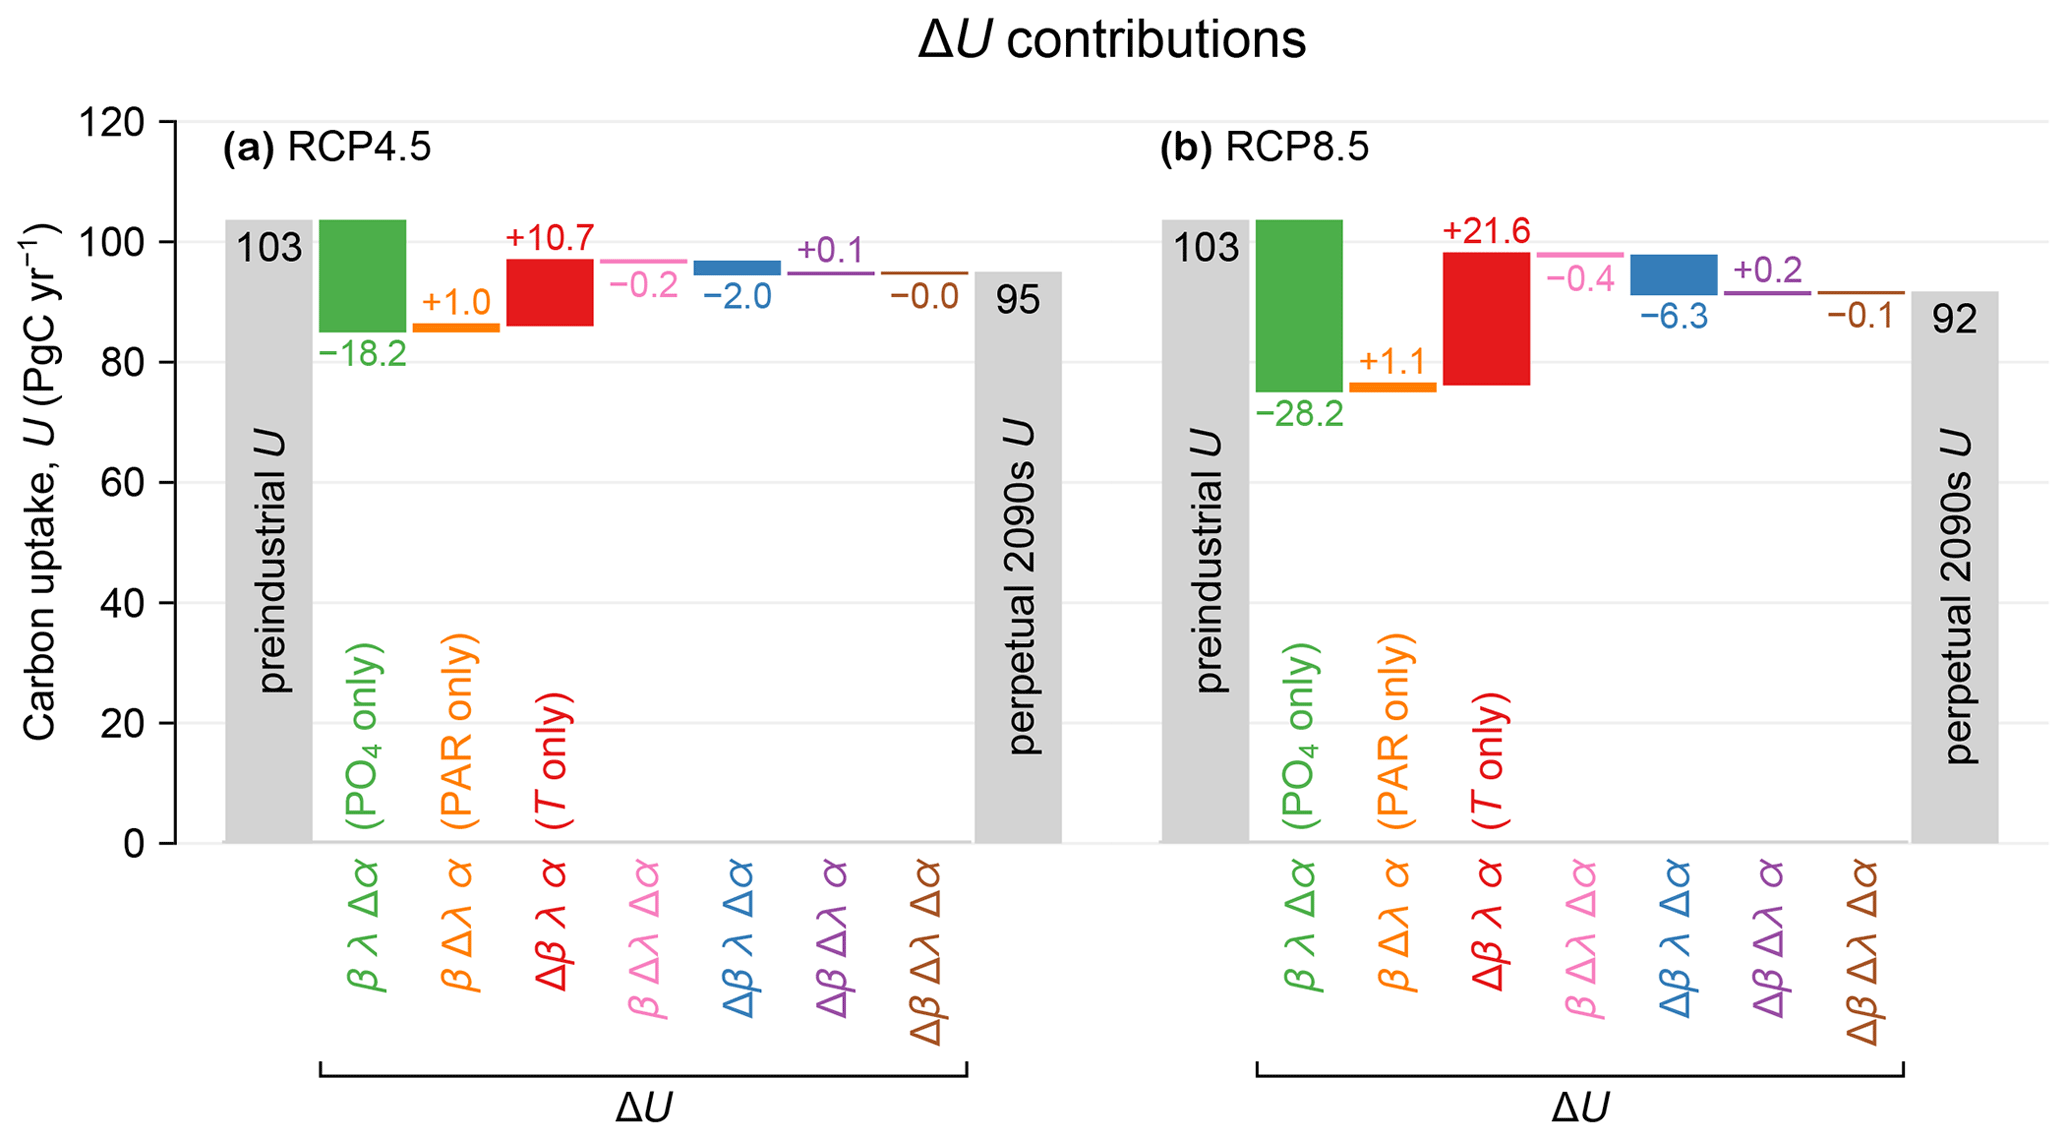
Figure 1(a) Carbon uptake U for preindustrial conditions (leftmost gray bar) and the RCP4.5-based perpetual-2090s state (rightmost gray bar). The colored bars show the changes ΔU due to changes in the factors α (nutrients), λ (light), and β (temperature) (see Eq. 2). These changes are plotted as a waterfall chart, with each contribution (each bar) starting where the previous one ends. The values of the contributions are indicated in units of PgC yr−1. (b) As (a) but for RCP8.5.
Production appears to be remarkably resilient: the globally integrated production decreases by 8 % and 12 % for the RCP4.5 and RCP8.5 scenarios, respectively. Given the large physical and thermodynamic changes in our perpetual-2090s states, this resilience points to strong compensations between competing mechanisms. The nutrient supply does decline as expected from the more sluggish circulation: the global euphotic phosphate inventories decline by 12 % and 19 % for the two scenarios (Fig. B1a–e). These declines are enhanced by increased Southern Ocean trapping (e.g., Primeau et al., 2013) due to the slower 2090s circulation and decreased ventilation. The decreased nutrient supply (i.e., reduced phosphate concentration) reduces biological carbon uptake despite increasing the C:P uptake ratio as parameterized by Eq. (1) following Galbraith and Martiny (2015). This is counteracted by warming, which exponentially enhances nutrient and carbon uptake rates. The euphotic zone warms globally by 1.5 and 2.7 °C (Fig. C1) for RCP4.5 and RCP8.5, although the North Atlantic contains a patch of prominent cooling (e.g., Caesar et al., 2018).
Production declines because of lower nutrient supply and despite warming-enhanced growth. To quantify the drivers of production change ΔU, we decompose it algebraically into contributions from changes in nutrient limitation (Δα), temperature growth factor (Δβ), and light limitation (Δλ) (see Eq. 2; Fig. 1). The contributions from nutrient limitation only are βλΔα = −18 and −28 PgC yr−1 for RCP4.5 and RCP8.5, while the corresponding contributions from the temperature factor only are λαΔβ = +11 and +22 PgC yr−1. The spatial correlations between Δα and Δβ (purple bars in Fig. 1) are negative, as Δα and Δβ are opposite in sign and thus reinforce the production decrease. The other terms in the decomposition are less than about 1 PgC yr−1 in magnitude. Our finding that Southern Ocean nutrient trapping and reduced nutrient supply to the euphotic zone are the primary drivers of the production decline is consistent with projections for the next few centuries (e.g., Moore et al., 2018).
3.1.2 Changes in export ratio
Export production, Jex, is the rate at which organic carbon taken up at a given location is exported and respired in the aphotic interior (e.g., Primeau et al., 2013; Kwon et al., 2022). The export ratio is thus a measure of the efficiency of export and is useful for understanding changes in organic-matter export. f generally decreases in the perpetual-2090s states (Fig. D2), with production-weighted global means being reduced from a preindustrial value of 0.32 to 0.30 and 0.28 for RCP4.5 and RCP8.5, respectively. While export ratios are expected to decline overall with warming, it is understood that many factors other than temperature can play an important role locally (e.g., Laws et al., 2000, 2011; Cael and Follows, 2016). Because of the nonlocal and nonlinear coupling of the mechanisms that set export ratios in our model, a formal decomposition into factors of changes Δ is not useful.
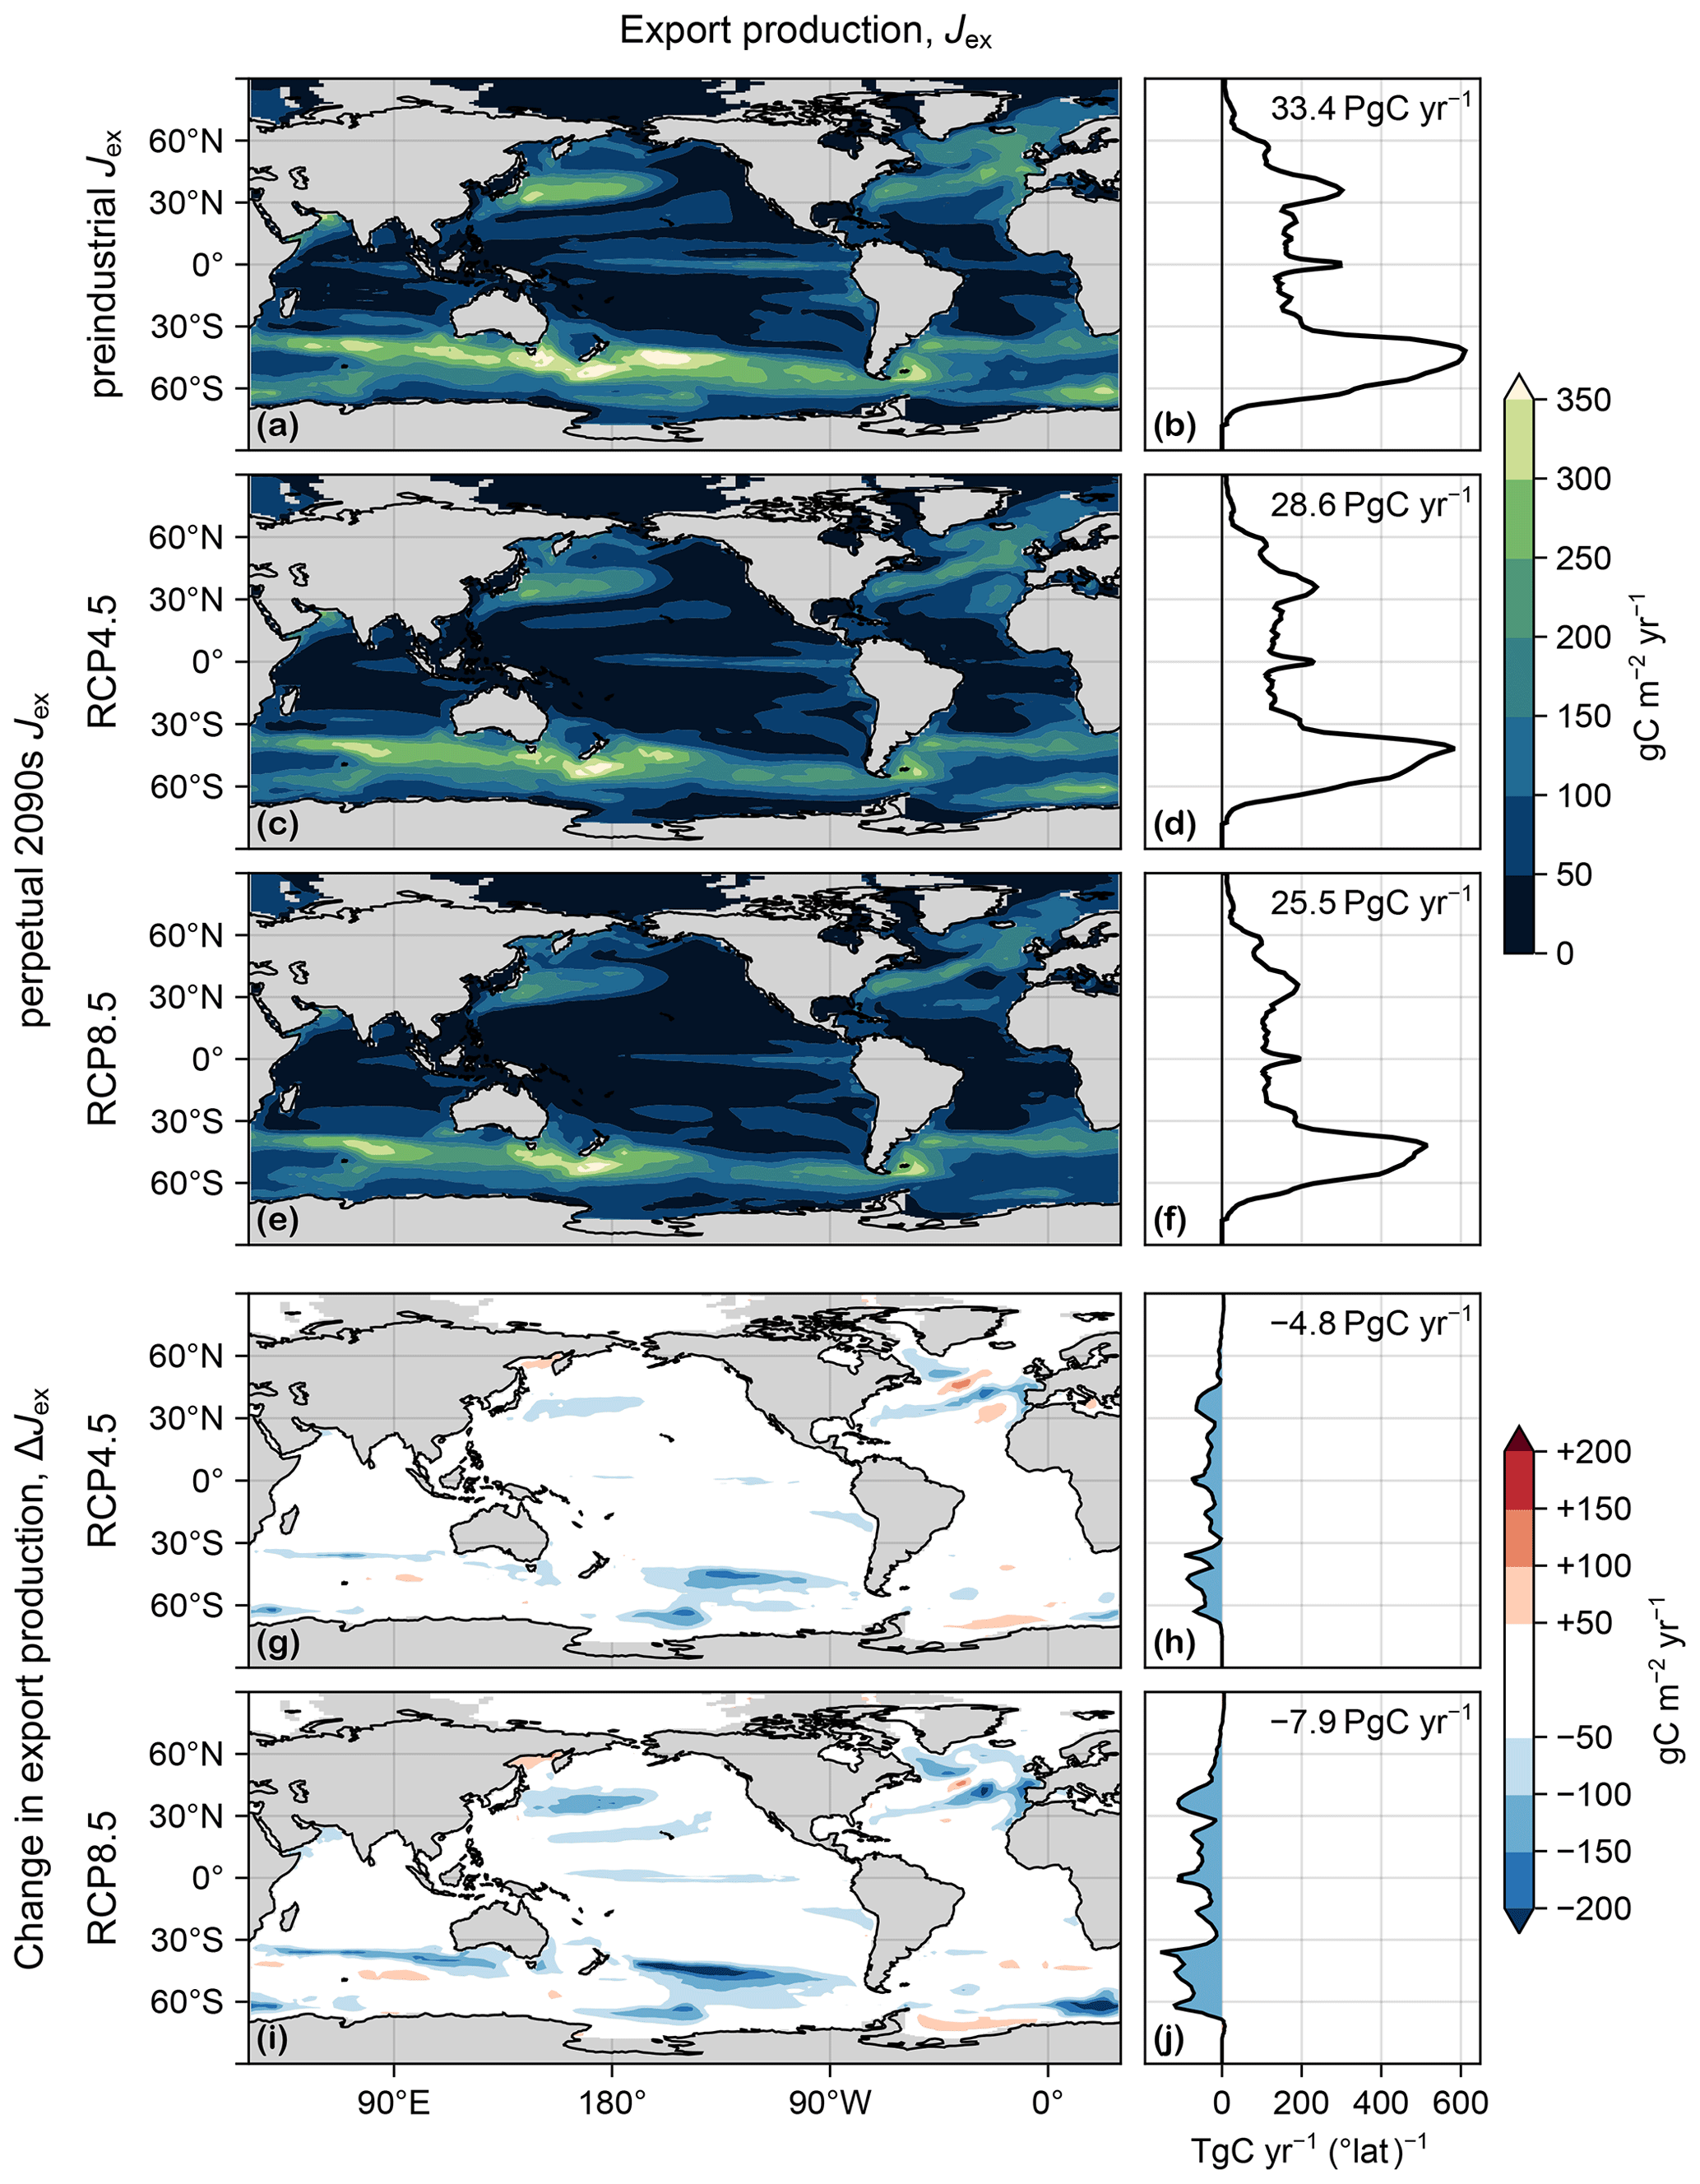
Figure 2(a) Map of export production Jex(r), vertically integrated, in the preindustrial state. (b) Zonal integral of (a). (c, d) As (a, b) but for the RCP4.5-based perpetual-2090s state. (e, f) As (c, d) but for RCP8.5. (g–j) As (c–f) but for ΔJex.
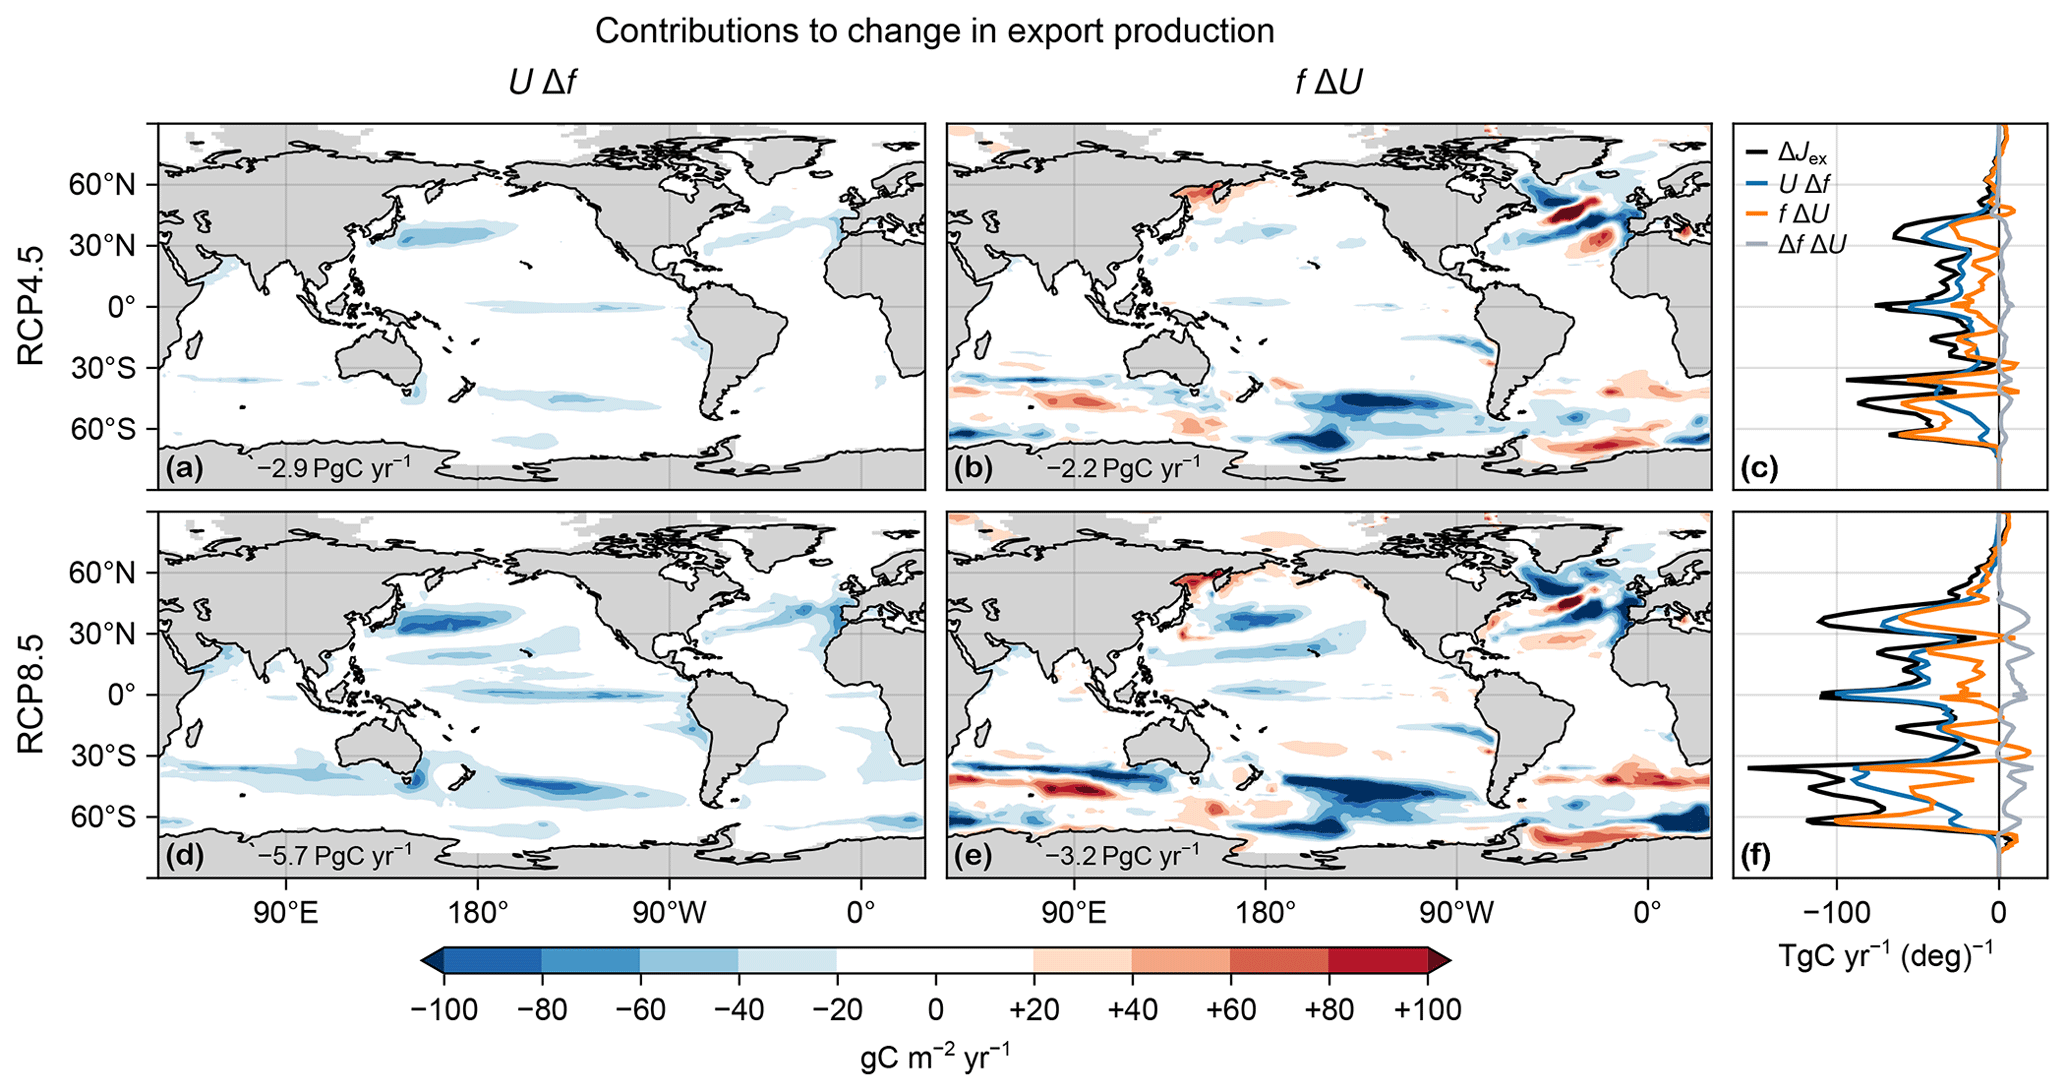
Figure 3(a, b, d, e) Maps of vertically integrated contributions from changes in export ratio UΔf (a, d) and carbon uptake fΔU (b, e) to the changes in export production ΔJex in the RCP4.5 (a, b) and RCP8.5 (d, e) scenarios. (c, f) Corresponding zonal integrals of UΔf (blue), fΔU (orange), and ΔJex (black). Also shown is the zonal integral of ΔfΔU (gray).
In PCO2, warming has opposing effects on the key mechanisms controlling export efficiency. On the one hand, warming stimulates the respiration of POC in the euphotic zone, leaving less POC to be exported, which tends to decrease export ratios. On the other hand, warming reduces water viscosity so that particles sink faster out of the euphotic zone, which tends to increase export ratios (see Eqs. 2 and A3 in Pasquier et al., 2023). For POC, the more rapid sinking does not fully compensate for the increased respiration rates (at least for our optimized parameters) so that the net effect is an overall reduction in POC export ratio (consistent with, e.g., Cael and Follows, 2016). For PIC (only dissolution, no respiration), the effect is faster sinking, increasing the PIC export ratio, but this has little impact because the preindustrial PIC export ratio is already close to 1. Global euphotic deoxygenation (Fig. B1f–j) is driven by reduced oxygen solubility and reduced photosynthesis (except in the Weddell and Ross seas due to future sea ice loss), which slows euphotic POC respiration, thereby increasing POC export ratios. DOC export ratios are expected to decrease with the circulation slowdown because DOC is exported by water transport. Zonal integrals of the contributions from each export pathway (DOC, POCs, POCf, and PIC) are shown in Fig. D3.
3.1.3 Changes in export production
We now consider changes in the carbon export production Jex itself. Figure 2 shows Jex for the preindustrial state and for the two perpetual-2090s states along with the corresponding change, ΔJex. Globally integrated, Jex decreases by 14 % and 24 % in the RCP4.5 and RCP8.5 scenarios, respectively. This overall decrease in export production is driven by the combined action of changes in temperature, PAR, and euphotic nutrient and oxygen concentrations, themselves driven by changes in ocean circulation and air–sea exchange.
Large reductions in Jex (Fig. 2g–j) generally occur in regions of large preindustrial export production, with the Southern Ocean being most affected. In the Ross Sea, a large decrease in [PO4] results in a significant decrease in uptake and export. This is because the unrealistic deep mixed layer of the preindustrial ACCESS circulation (Bi et al., 2013a), which brings nutrient-rich deep waters to the surface, disappears in the perpetual-2090s states (Fig. C2). By contrast, in the Weddell Sea, export production increases despite the disappearance of the unrealistically deep mixed layer because retreating sea ice allows for additional photosynthesis. There are also patches of export increases of similar magnitude in the Sea of Okhotsk, in the mid-latitude southern Atlantic and Indian Ocean, and in the North Atlantic. The patterns of ΔJex broadly correlate with those of ΔU, but some notable differences (Figs. 2 and D1) suggest that changes in organic-matter production alone do not suffice to explain changes in export production.
To quantify the role of changes in organic-matter production (ΔU) and changes in export ratio (Δf) in shaping export production changes, we decompose ΔJex into contributions from ΔU and Δf and their spatial correlation. We find that in the global mean, changes in export ratio alone UΔf contribute about 50 % more to ΔJex than changes in production alone fΔU (Fig. 3). The cross-term contribution ΔfΔU captures the spatial correlation between ΔU and Δf and is positive but about an order of magnitude smaller (Fig. 3c, f). The declines in export production are thus driven by changes in both the production and export ratios, but the latter make larger contributions globally, particularly for the RCP8.5 scenario.
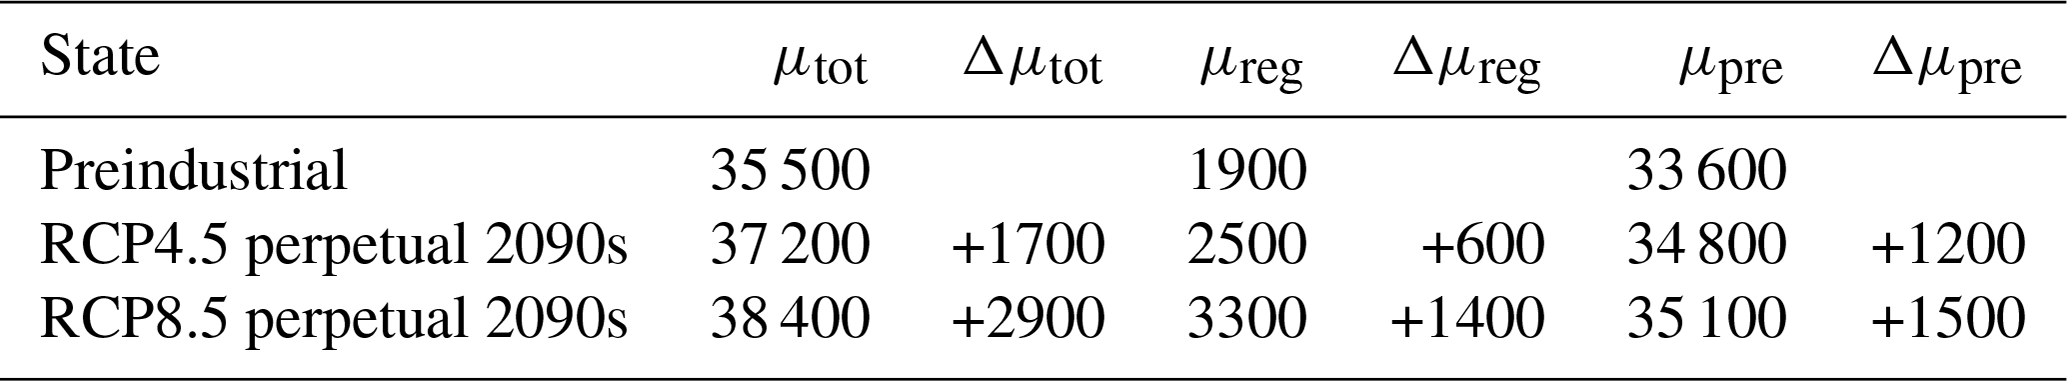
Table 1Total, regenerated, and preformed DIC inventories for the preindustrial, RCP4.5, and RCP8.5 states in units of petagrams of carbon (PgC). Changes relative to the preindustrial state are also shown.
The spatial patterns of the contributions UΔf and fΔU to the export-production changes are very different in character, with UΔf being negative almost everywhere (Fig. 3a, d) and fΔU having both signs (Fig. 3b, e). In the Northern Hemisphere, many features of UΔf mirror (with the opposite sign) the patterns of the surface temperature and oxygen changes (Figs. C1 and B1i, j), suggesting important contributions from both. This is not the case in the Southern Ocean, where changes in export ratios are likely driven by changes in DOC export driven in turn by the large circulation changes. The pattern of fΔU shows that ΔU drives both decreases (negative) and increases (positive over about 40 % of the ocean) in export production. The changes in organic-matter production itself ΔU are due to the competing effects of changes in nutrient concentrations, temperature, and light, as documented for the global integral above (Fig. 1). fΔU is largest in magnitude at high latitudes, where it is dominated by the pattern of ΔU, with zonal bands of alternating sign indicating meridional shifts in organic-matter production. Overall, the contributions from UΔf tend to dominate near the Equator, while the contributions from fΔU (from changes in organic-matter production) are more important at high latitudes, where f is larger (Fig. D2).
3.2 Global changes in carbon sequestration
The sequestration strengths of the biological and preformed carbon pumps are conveniently quantified by the sizes of the regenerated and preformed inventories. Table 1 lists the total, regenerated, and preformed DIC inventories (μtot, μreg, and μpre) for the preindustrial and perpetual-2090s states and the corresponding changes. The ocean's total carbon inventory increases by 5 % and 8 % for the RCP4.5 and RCP8.5 scenarios, respectively. Contributions to the changes from regenerated and preformed DIC are on the same order despite being driven by distinct mechanisms, which we will now explore in detail.
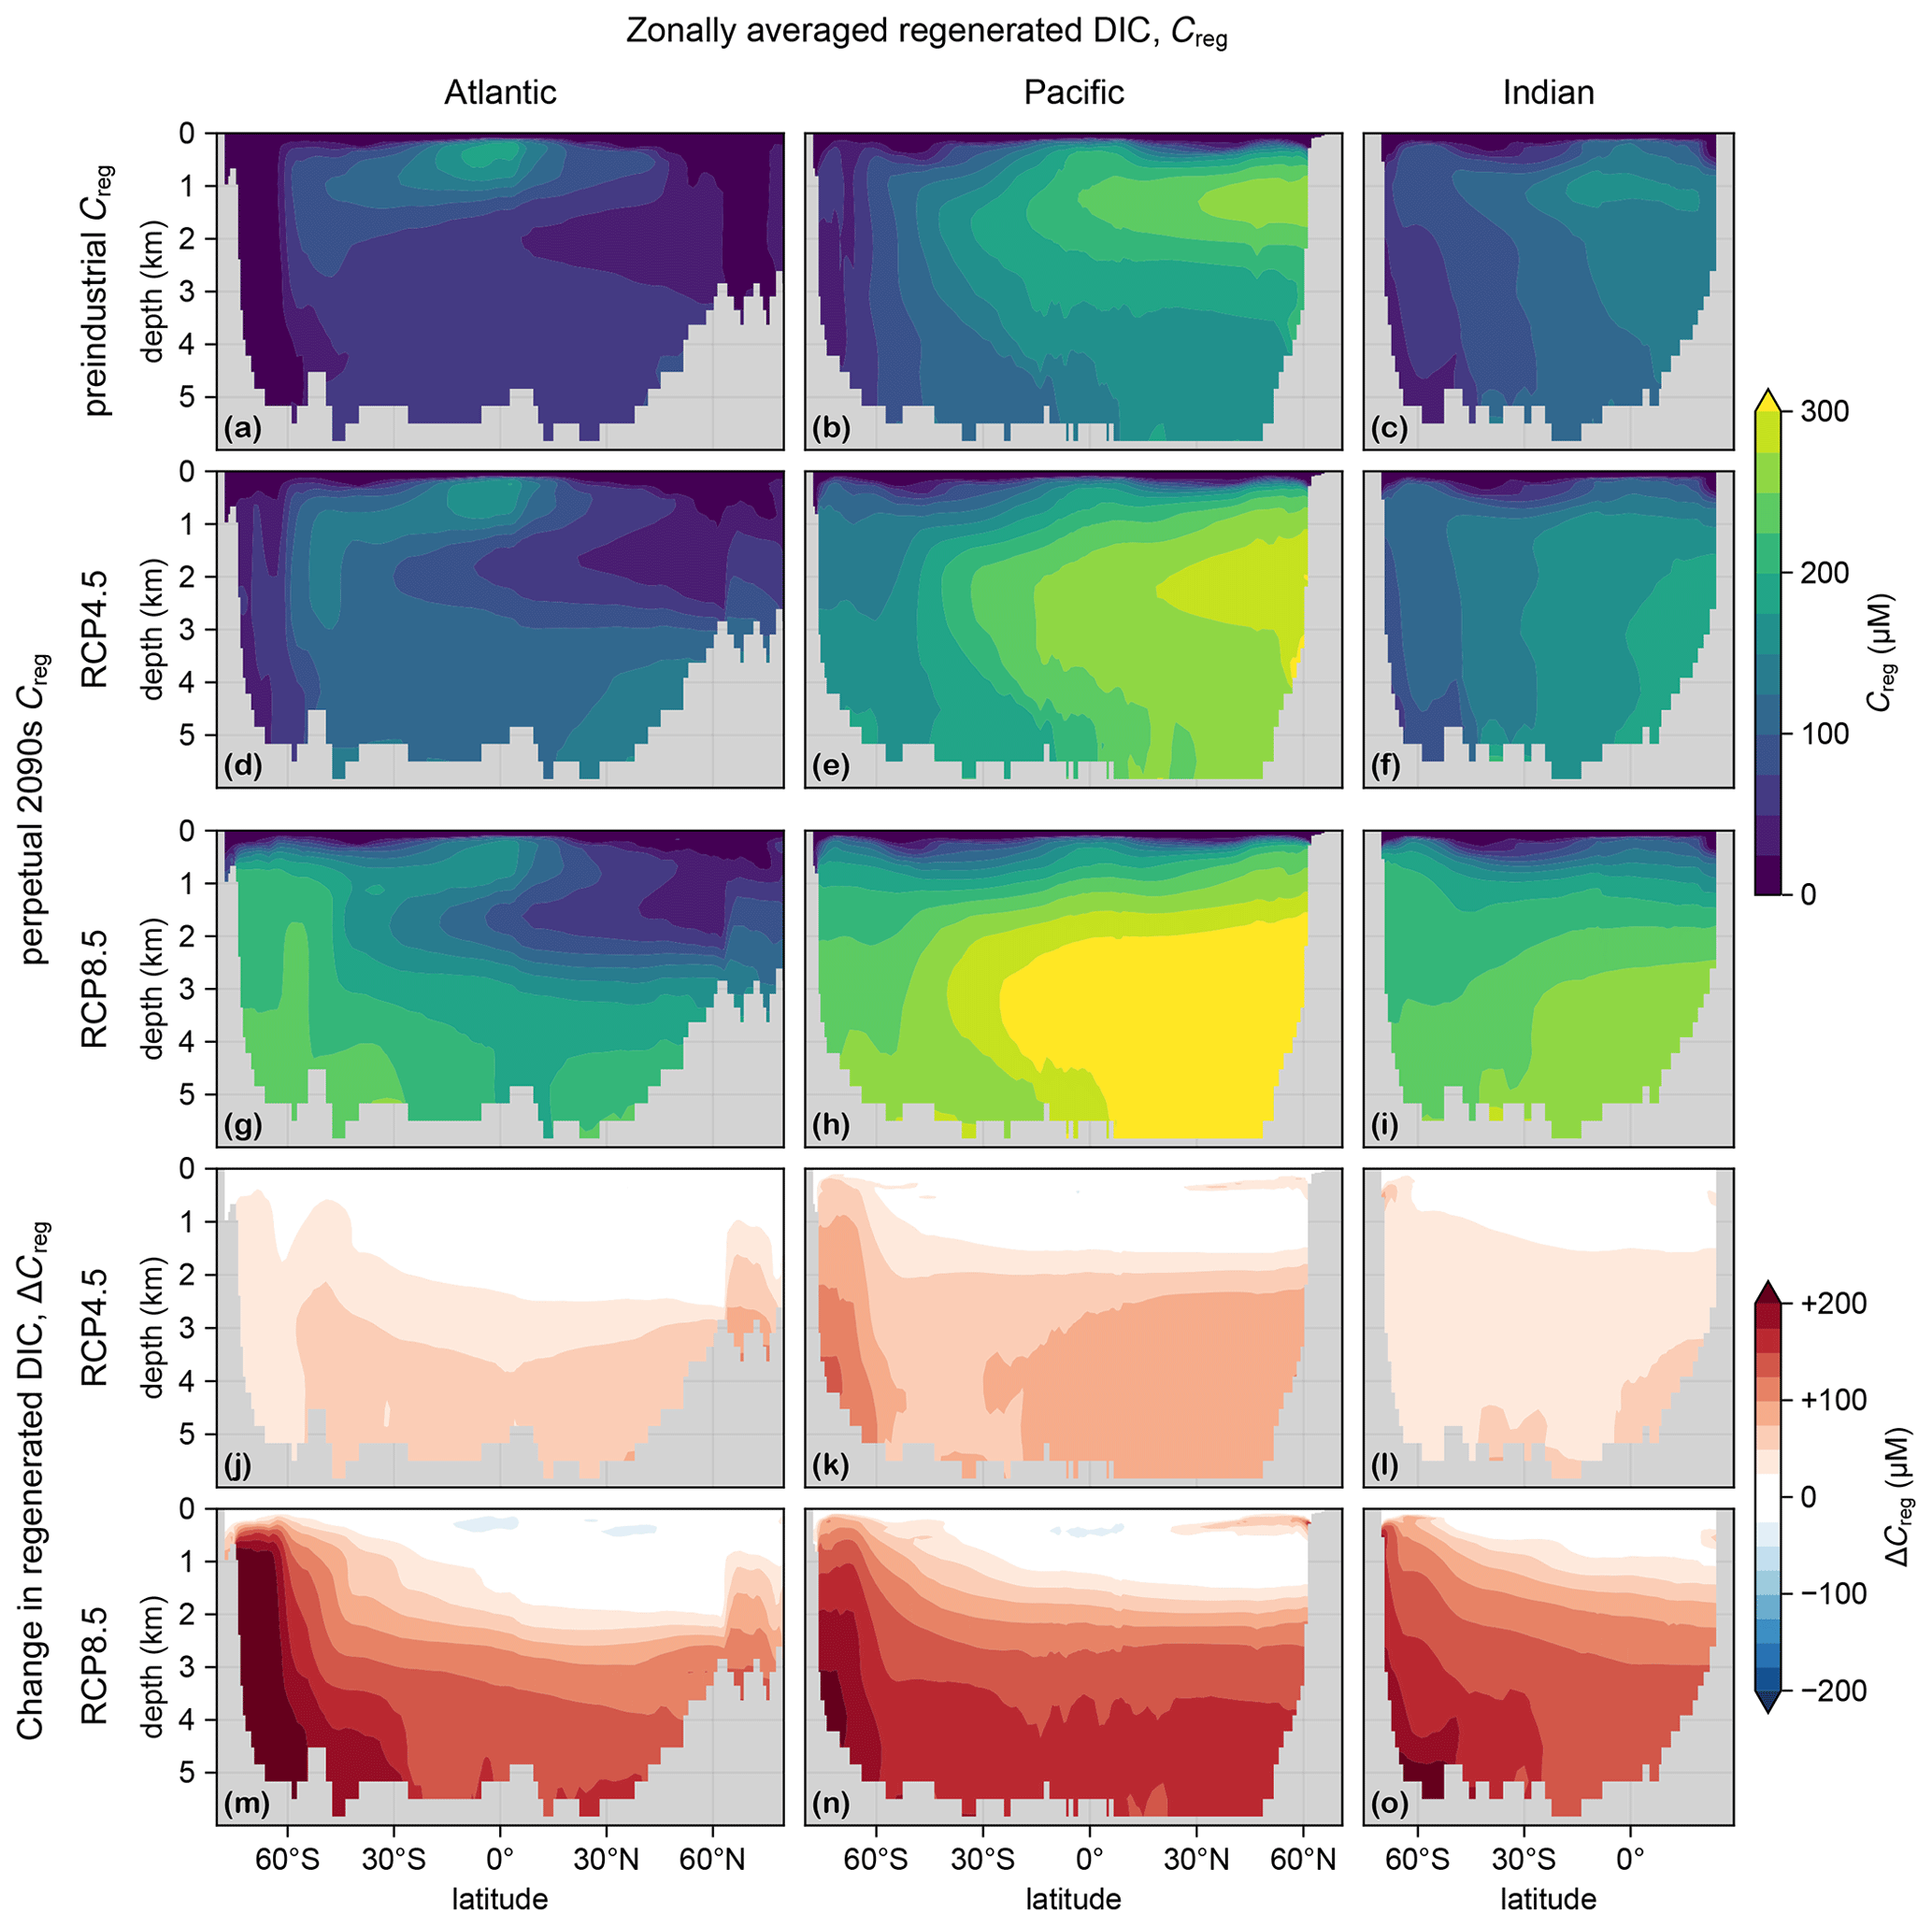
Figure 4(a–c) Zonal mean Creg for the preindustrial state in the Atlantic (a), Pacific (b), and Indian Ocean (c). For all zonal means shown in this work, the Atlantic basin excludes the Gulf of Mexico and the Caribbean, and the Pacific basin excludes the Sea of Japan, so that the averages are more cleanly interpretable. (d–f) As (a–c) but for the RCP4.5-based perpetual-2090s state. (g–i) As (d–f) but for RCP8.5. (j–o) As (d–i) but for ΔCreg.
To trace the pathways of regenerated DIC, we plot in Fig. 4 the zonal mean Creg and its change from the preindustrial to the perpetual-2090s state, ΔCreg. The zonal mean ΔCreg (Fig. 4j–o) shows large increases throughout the entire deep ocean of up to about 100 and 200 µM for the RCP4.5 and RCP8.5 scenarios, respectively. The increases are most prominent in the deep Southern Ocean, where a slower circulation increasingly traps regenerated DIC. For the RCP4.5-based scenario, the Southern Ocean increase is limited in the Atlantic sector because the unrealistically deep mixed layer, which short-circuits Southern Ocean nutrient trapping (Pasquier et al., 2023), has not completely shoaled. The slight decreases at low latitudes and thermocline depths are likely due to decreased tropical organic-matter production.
The regenerated DIC inventory μreg is governed by the product of the globally integrated export production and the bulk sequestration time for which the respired exported organic matter is allowed to accumulate in the aphotic ocean (e.g., DeVries et al., 2012; Holzer et al., 2021b). We find that the fraction of DIC that is regenerated increases from its preindustrial values of 5.4 % to 6.7 % (a 25 % increase) for RCP4.5 and to 8.5 % (a 60 % increase) for RCP8.5 (Fig. 5). We will now show that these increases are driven primarily by changes in the circulation pathways that return regenerated DIC to the euphotic zone.
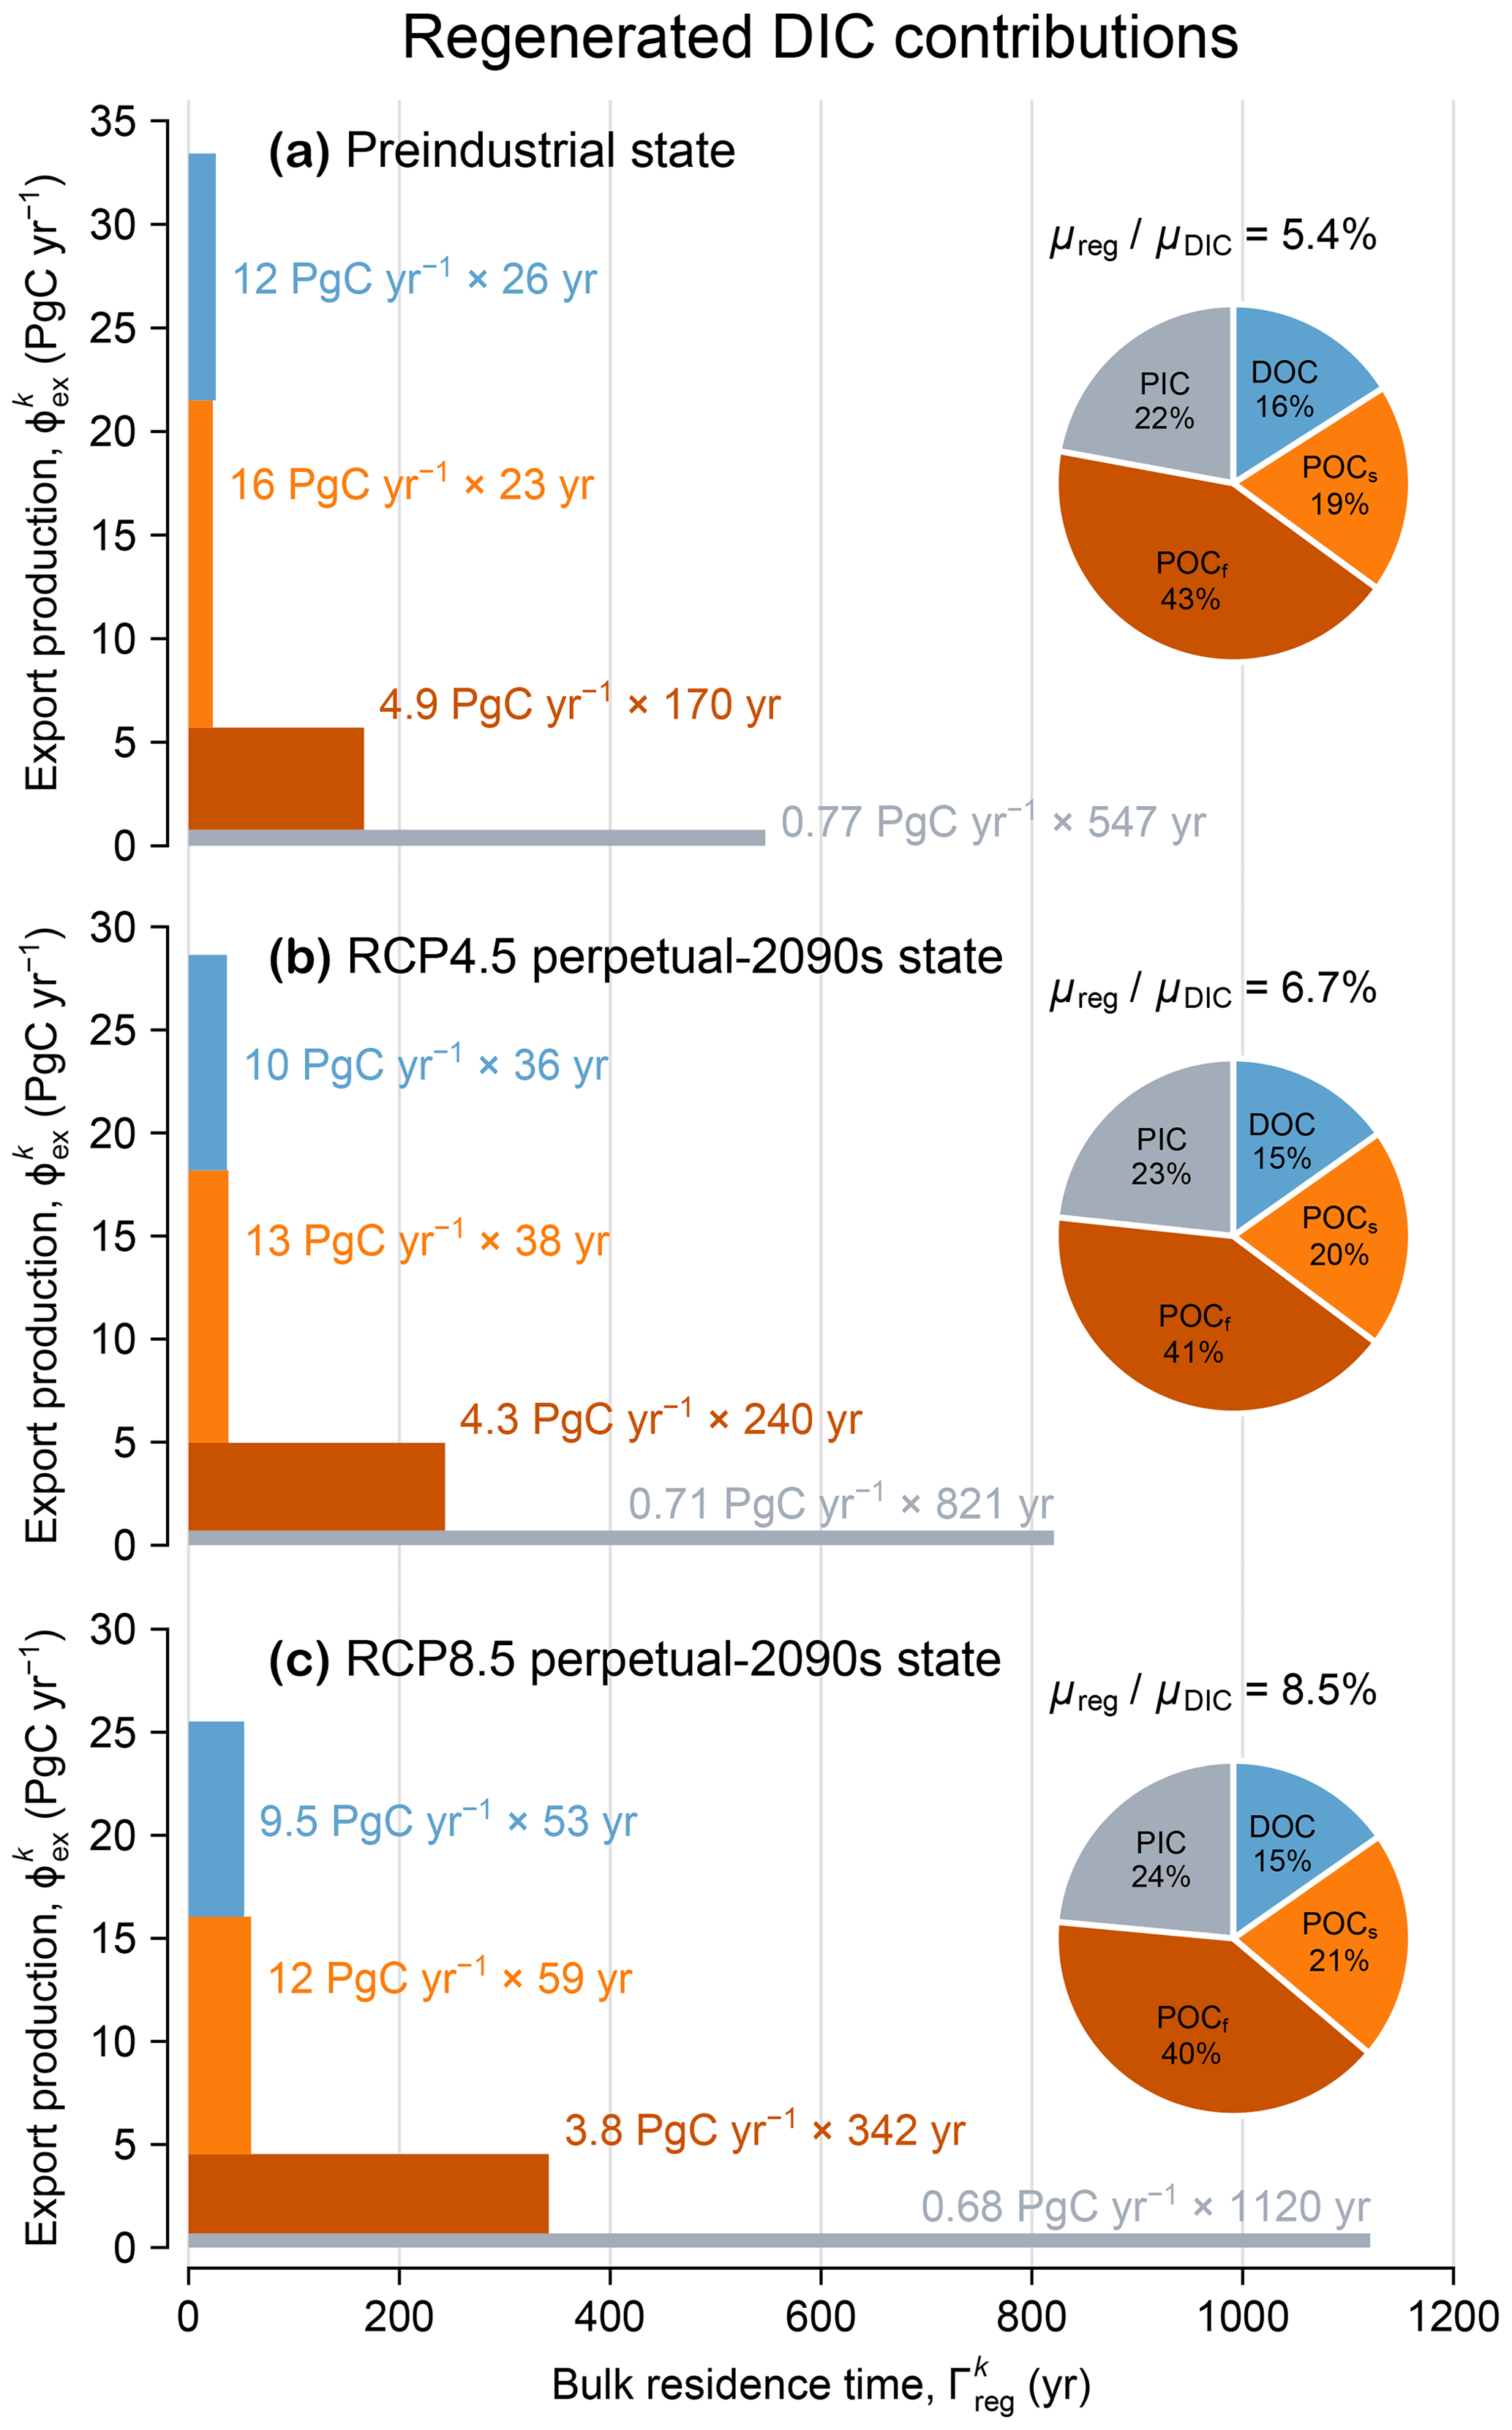
Figure 5(a) Regenerated DIC contributions from each mechanism k = DOC, POCs, POCf, and PIC (blue, orange, red, and gray) for the preindustrial state, represented as both a pie chart and a bar chart. The pie chart quantifies the fractional contribution . Pump sequestration strength, as quantified by , is indicated above the pie chart. Each bar can be interpreted as a pipe flowing from left to right whose area represents the regenerated DIC inventory, , which equals the globally integrated export production, (pipe width, y axis), multiplied by the bulk residence time, (pipe length, x axis). (b) As (a) but for the RCP4.5-based perpetual-2090s state. (c) As (b) but for RCP8.5.
The pie charts of Fig. 5 show the fractional contributions to the global regenerated DIC inventory from the export of DOC, POCs, POCf, and PIC for the preindustrial and perpetual-2090s states. The contributions from each of these export mechanisms are remarkably impervious to change, with perpetual-2090s-minus-preindustrial differences within 1 %–3 % for both RCP4.5 and RCP8.5. This is surprising because DOC, POCs, POCf, and PIC do not remineralize at the same location or, in particular, at the same depth.
To demonstrate that bulk sequestration time is the key control on the biological pump, we partitioned the regenerated DIC inventory into separate pools according to regeneration mechanism and calculated the flow rate through each pool (equal to the volume-integrated regeneration rate). Each pool may be considered to be a “pipe” in the plumbing of the biological pump, with the bulk sequestration time for each pipe simply being the ratio of inventory in the pipe to the corresponding flow rate. In Fig. 5, each pipe is depicted as a horizontal bar whose length, width, and area quantify the bulk sequestration time (in years), flow rate (PgC yr−1), and inventory (PgC), respectively (as done previously for the optimized preindustrial state by Pasquier et al., 2023).
Figure 5 shows that for each export mechanism (DOC, POCs, POCf, and PIC), export production declines and sequestration time increases. The increases in sequestration time are consistent with an overall slowdown of the circulation and with longer re-exposure times for regenerated DIC to return to the euphotic zone (Fig. C3). Across all mechanisms, export production rates decline by 8 %–16 % and 11 %–27 % for RCP4.5 and RCP8.5. These export changes affect POCs the most because the pattern of its export-ratio changes correlates well with preindustrial production (see Figs. D3b, f and D1), and they affect PIC the least because PIC dissolution in our model is independent of temperature, oxygen, or circulation. Across all mechanisms, re-exposure times increase by 40 %–50 % and 100 %–160 % for RCP4.5 and RCP8.5, respectively. Re-exposure times of DIC regenerated from slow-sinking POCs are the most affected, likely because POCs is respired at an average depth of about 200 m, where the relative changes in re-exposure times are the largest (Fig. C3).
Table 2Contributions to the change in the regenerated carbon inventory from changes in bulk residence time and export production for each pump mechanism k (values are in PgC and are rounded to two significant digits).
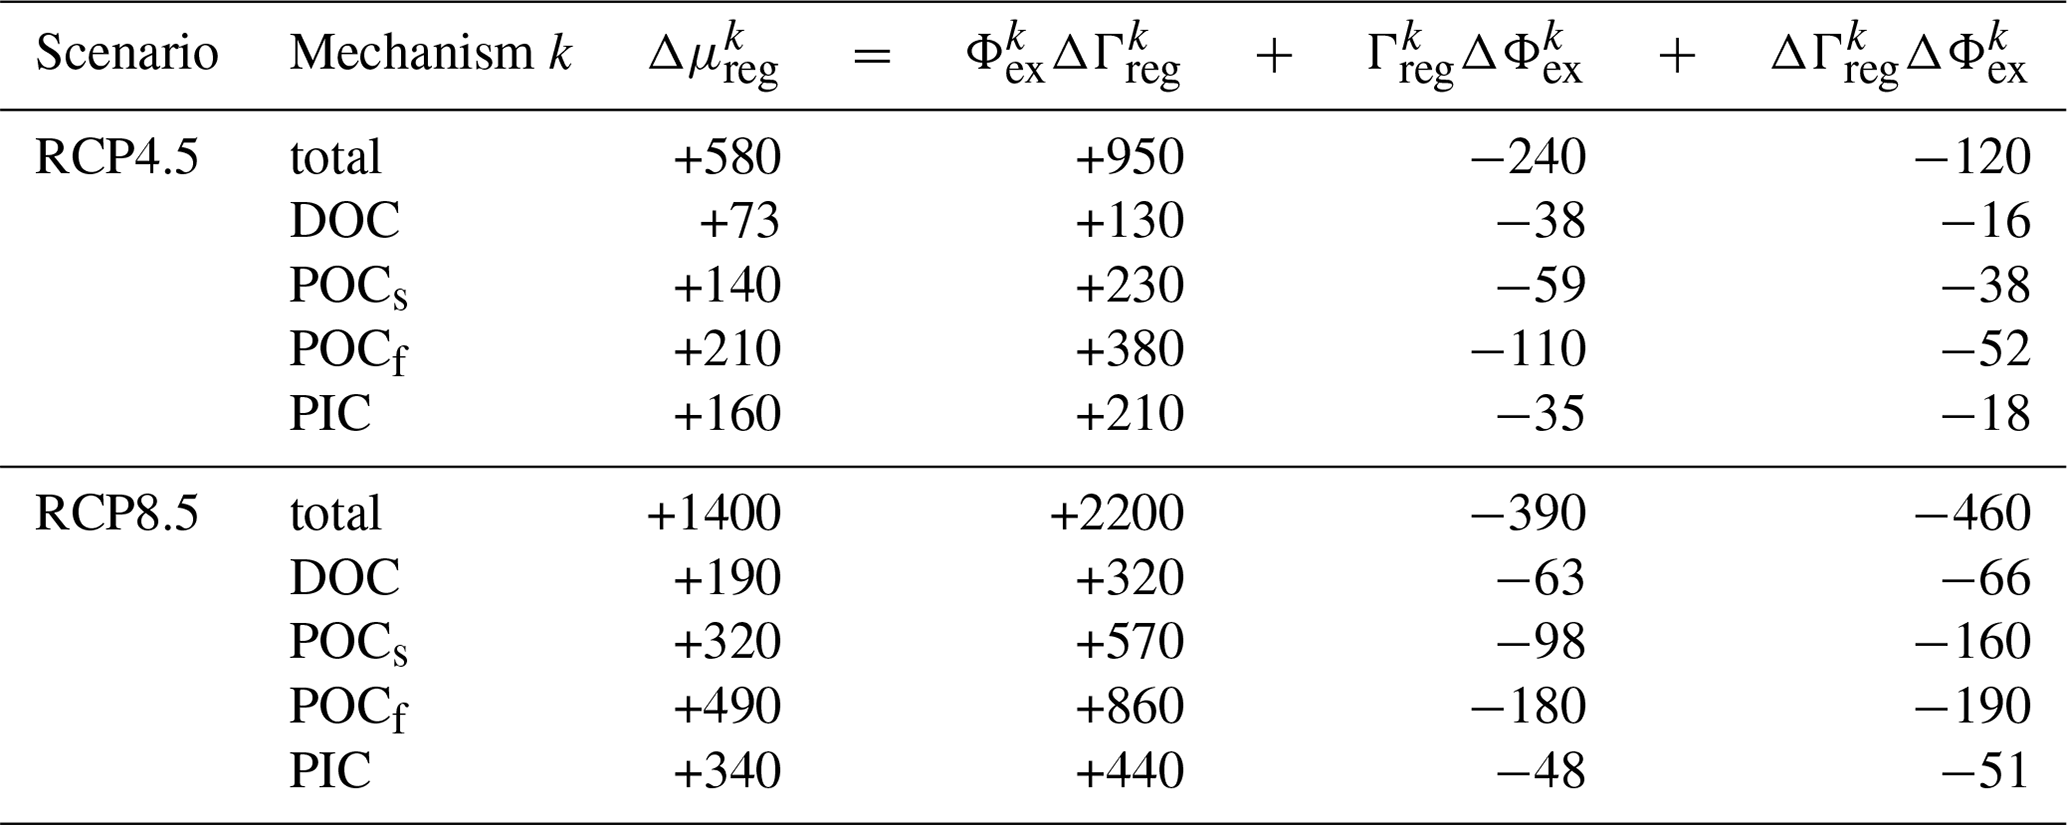
The effect of increased bulk sequestration times wins over the effect of decreased export production rates. This is shown in Table 2, where the change in each pipe's regenerated DIC inventory Δμreg is formally decomposed into contributions from ΔΓreg and ΔΦex, including cross-terms. Overall, regenerated inventories increase by 25 %–40 % and 60 %–90 % across all regeneration mechanisms for the RCP4.5 and RCP8.5 scenarios, respectively. In both scenarios, the circulation changes quantified here by ΔΓreg are the dominant control: the increase in regenerated inventory due to longer re-exposure times alone (ΦexΔΓreg) is ∼ 4–6 times larger than the decrease due to smaller export production alone (ΓregΔΦex). In addition, the cross-term ΔΓregΔΦex, which captures the spatial correlations between ΔΦex and ΔΓreg, makes contributions on the same order as ΓregΔΦex, underlining the highly nonlinear response of the biological pump in both scenarios.
3.3 The preformed carbon pump
To assess the state of the biological pump, it is useful to place it in the context of overall carbon sequestration by also considering the preformed DIC pool (e.g., Ito et al., 2015). Our approach differs conceptually from previous quantifications of the abiotic carbon cycle in terms of the solubility pump (e.g., Volk and Hoffert, 1985), where one typically focuses on the subsurface pathways of preformed DIC, and efficiency is defined relative to complete surface saturation. By contrast, our new preformed DIC tracer allows us to quantify not only interior but also euphotic DIC pathways, how they change in the perpetual-2090s states, and how they affect the ocean's entire DIC inventory. The “preformed carbon pump” considered here is thus the natural counterpart of the biological pump.
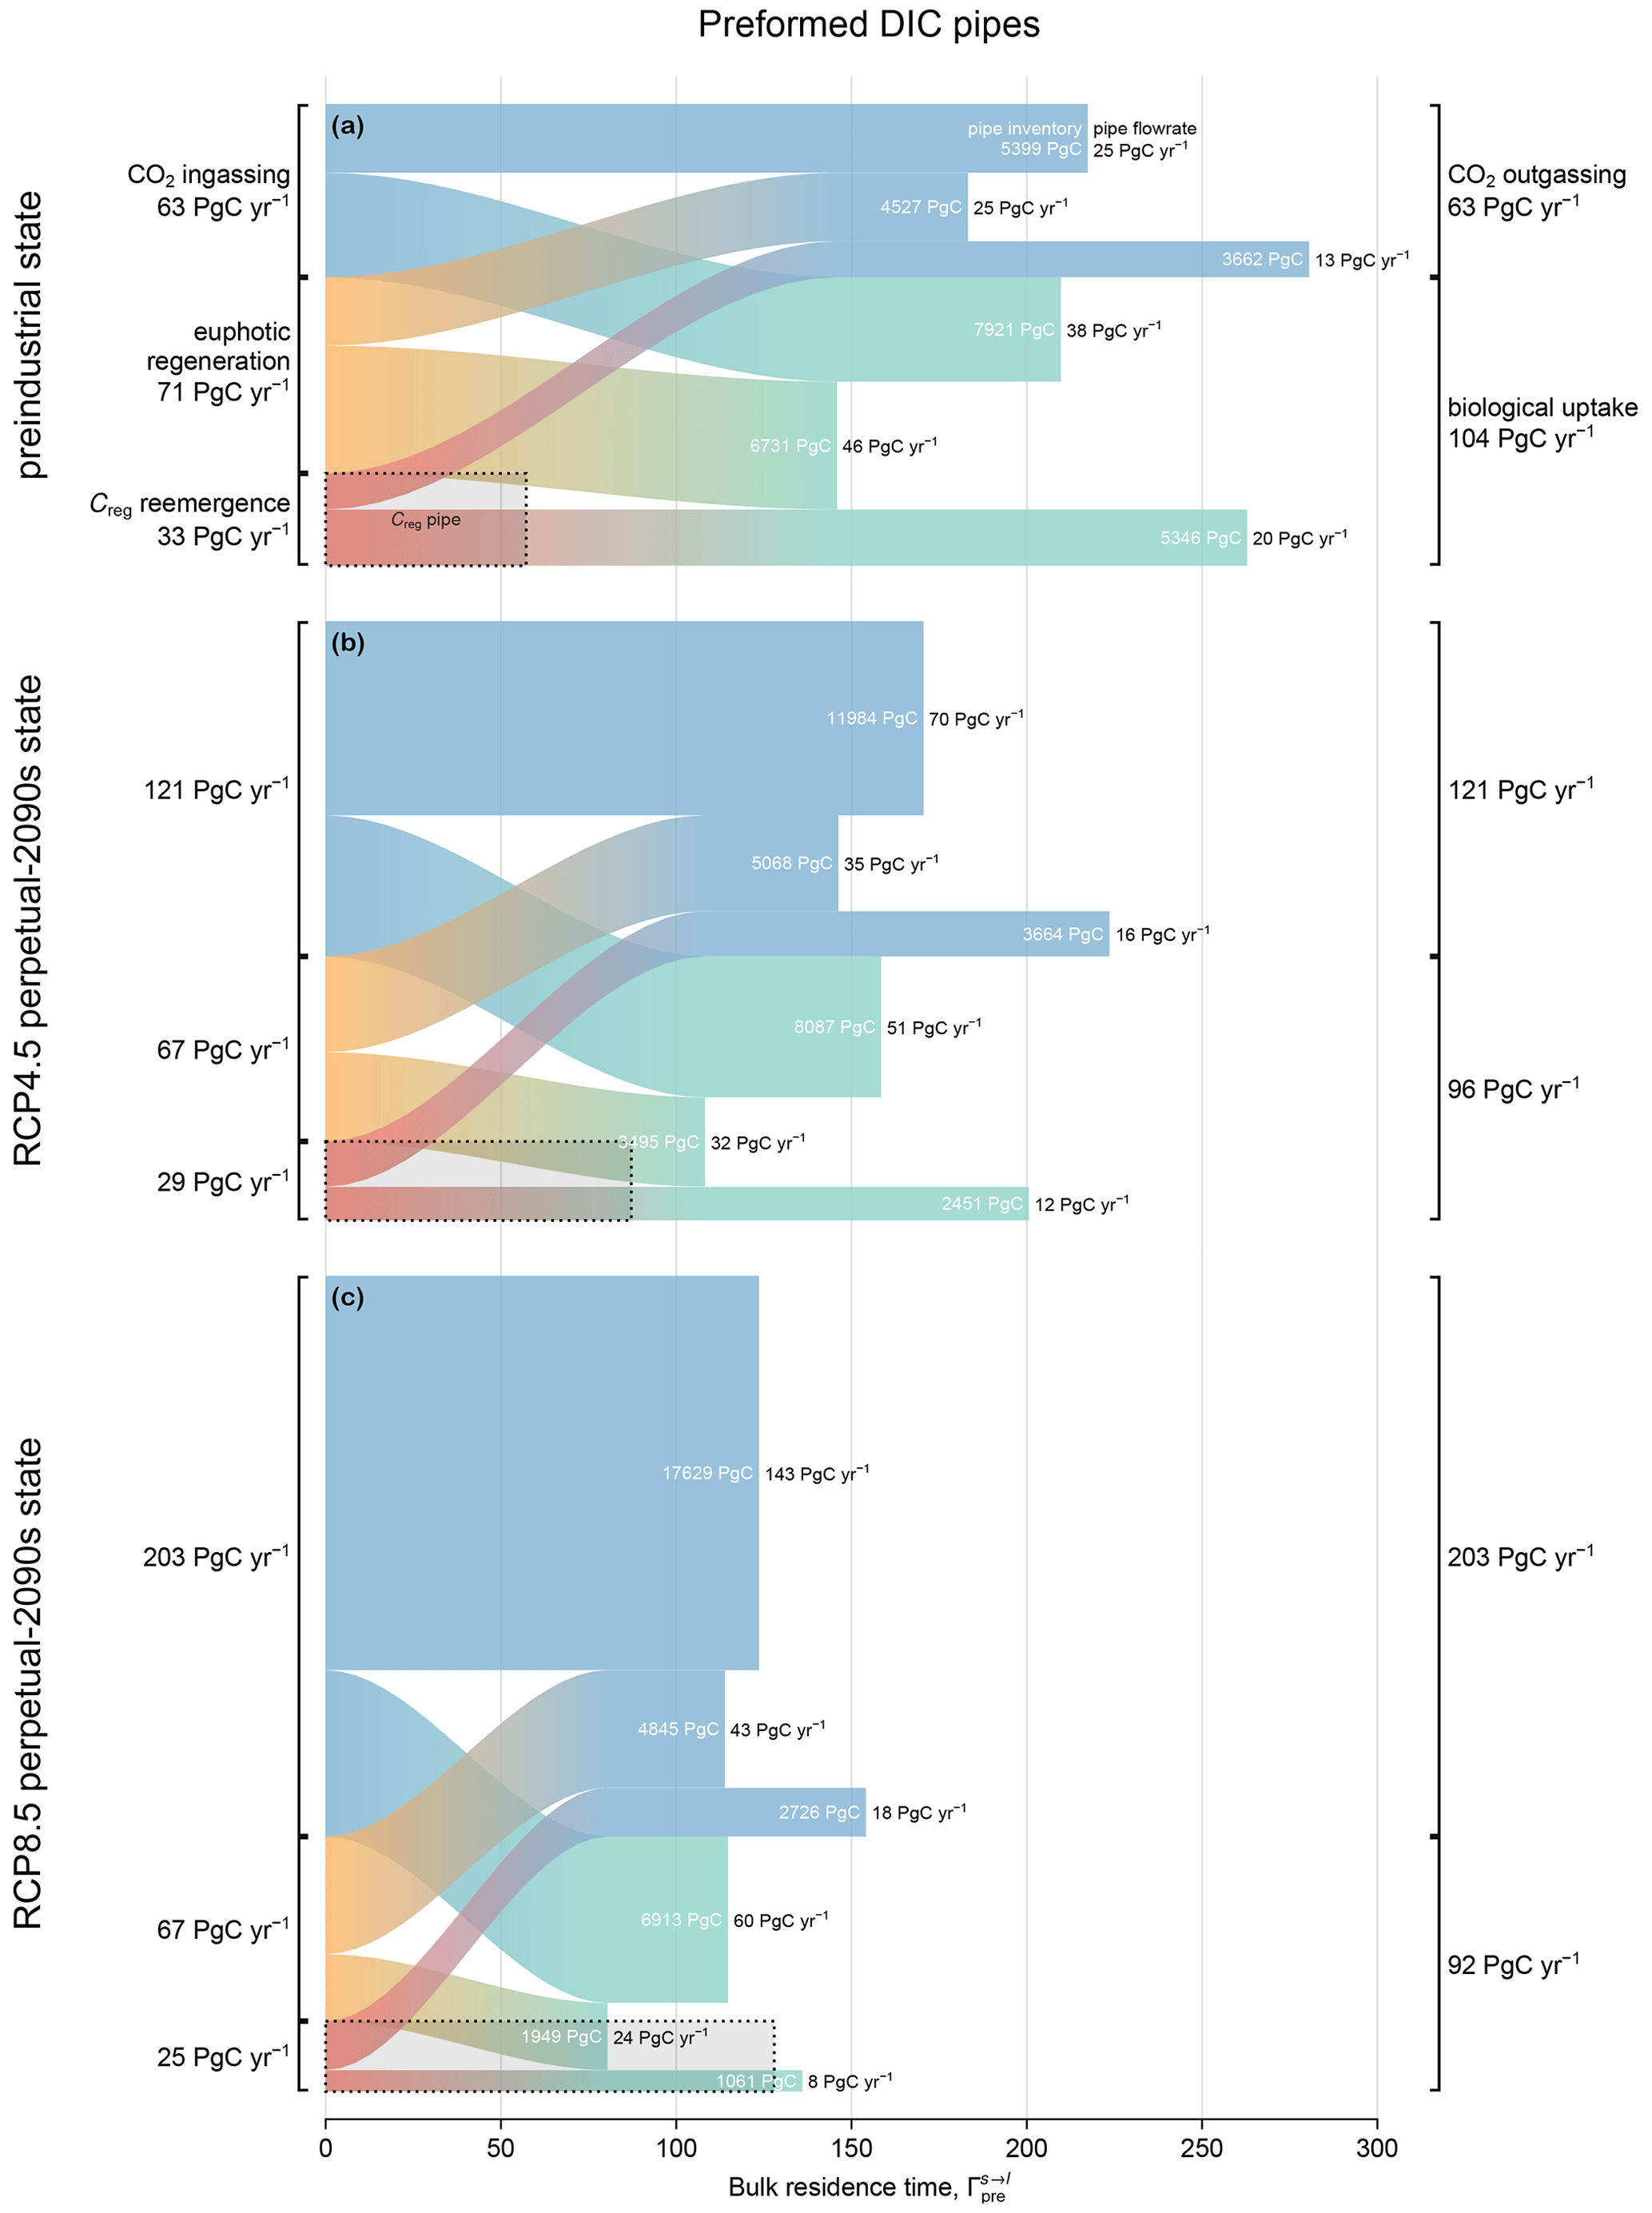
Figure 6Preformed DIC pipes for (a) the preindustrial state, (b) the RCP4.5-based perpetual-2090s state, and (c) the RCP8.5-based perpetual-2090s state, partitioned according to source (left) and sink (right). The area, width (y axis), and length (x axis) of each s→l pipe represent the inventory (white text), flow rate (black text at the end of each pipe), and bulk residence time , respectively. For comparison, the dotted rectangle in the bottom left corner of each panel indicates the total regenerated DIC pipe (all mechanisms are summed/averaged from Fig. 5), also represented as export Φex (width) × bulk residence time Γreg (length).
We partition the ocean's preformed DIC into pools that connect specified sources of preformed DIC (ingassing, euphotic regeneration, or the emergence of aphotically regenerated DIC) to specified sinks (outgassing or biological uptake). Each pool may again be considered to be a pipe of the ocean's preformed DIC pump, with the flow rate through each pool determining the corresponding bulk residence time. To the best of our knowledge, this is the first time that preformed DIC has been partitioned in this way (see the Methods section and Appendix A for mathematical details).
Figure 6 shows the preformed DIC inventory μpre, partitioned into pipes that connect each source s to each loss l, for the preindustrial and perpetual-2090s states. As in Fig. 5, the inventory (area) of each pipe is the product of the globally integrated flow rate (y-axis width) and the bulk residence time (x-axis length). When interpreting Fig. 6, it is useful to keep in mind the following constraints on the flow rates: (i) the emergence rate of aphotically regenerated DIC into the preformed pool is equal to the export production Jex, as the source and sink balance in steady state; (ii) the biological utilization rate of preformed DIC is equal to the total nutrient uptake U, as the euphotic DIC is preformed by definition; and (iii) the euphotic regeneration rate is equal to the rate of un-exported production in steady state. Given the novelty of this diagnostic, we first take a look at the preindustrial state before examining changes in the perpetual-2090s states.
3.3.1 The preindustrial preformed pump
The (vertical) widths of the preformed pipes (Fig. 6) that terminate in biological utilization represent the rate at which preformed DIC fuels photosynthetic organic-matter production. In the preindustrial ocean, the fraction of newly preformed DIC destined for biological uptake is remarkably large at 60 %–65 % across all source processes. Here, “newly” preformed DIC denotes preformed DIC at the time of labeling it as “preformed”, i.e., at its source. For instance, of the 63 PgC yr−1 ingassed from the atmosphere, 38 PgC yr−1 supports biological production, while the remainder outgasses without ever interacting with biology. In terms of inventories, 60 % of all preformed DIC is in transit to biological uptake, while the rest is destined for outgassing. Conversely, of the total biological DIC uptake that occurs, 36 % is supplied by ingassing, 44 % is supplied by euphotic regeneration, and 20 % is supplied by upwelling of aphotically regenerated DIC.
To better understand the transport pathways of preformed DIC, we quantify the amount that enters the aphotic ocean. To that end, we partitioned the DIC in each preformed pipe according to whether or not it enters the aphotic interior during its source-to-sink transit (Eqs. A9 and A10). This partition (not shown in Fig. 6) revealed that, regardless of the source–sink pair, more than 90 % of the preformed DIC that has been newly injected into the euphotic zone (newly preformed) will eventually explore the aphotic interior, with a bulk first-contact time with the aphotic interior of less than half a year (roughly in agreement with the findings of Bopp et al., 2015). The preformed DIC pipes thus consist almost entirely of pathways that probe the aphotic interior.
Figure 6a also shows the bulk preindustrial residence times in each preformed DIC pipe, which range from 150 to 280 years, depending on the pipe. In comparison, the bulk residence time for regenerated DIC is only about 60 years, which might seem surprising given that DIC regeneration occurs at depth. However, preformed DIC can roam over the euphotic zone for times on the order of a century without being biologically utilized or outgassed, while regenerated DIC immediately loses its regenerated label on contact with the euphotic zone. Furthermore, not all deep-to-surface paths are slow: analysis of nutrient cycling in a data-assimilated circulation (Pasquier and Holzer, 2016) showed that nutrients regenerated at intermediate depths (and hence DIC) are likely to return to the surface through short diffusive vertical pathways, while deep regenerated DIC is predominantly transported into Circumpolar Deep Water (CDW), which provides a relatively fast upwelling conduit back to the surface. For the ACCESS-M PCO2 model, the CDW conduit is additionally short-circuited regionally in the Southern Ocean by the parent model's unrealistic deep mixing (Fig. C2 and Holzer et al., 2020).
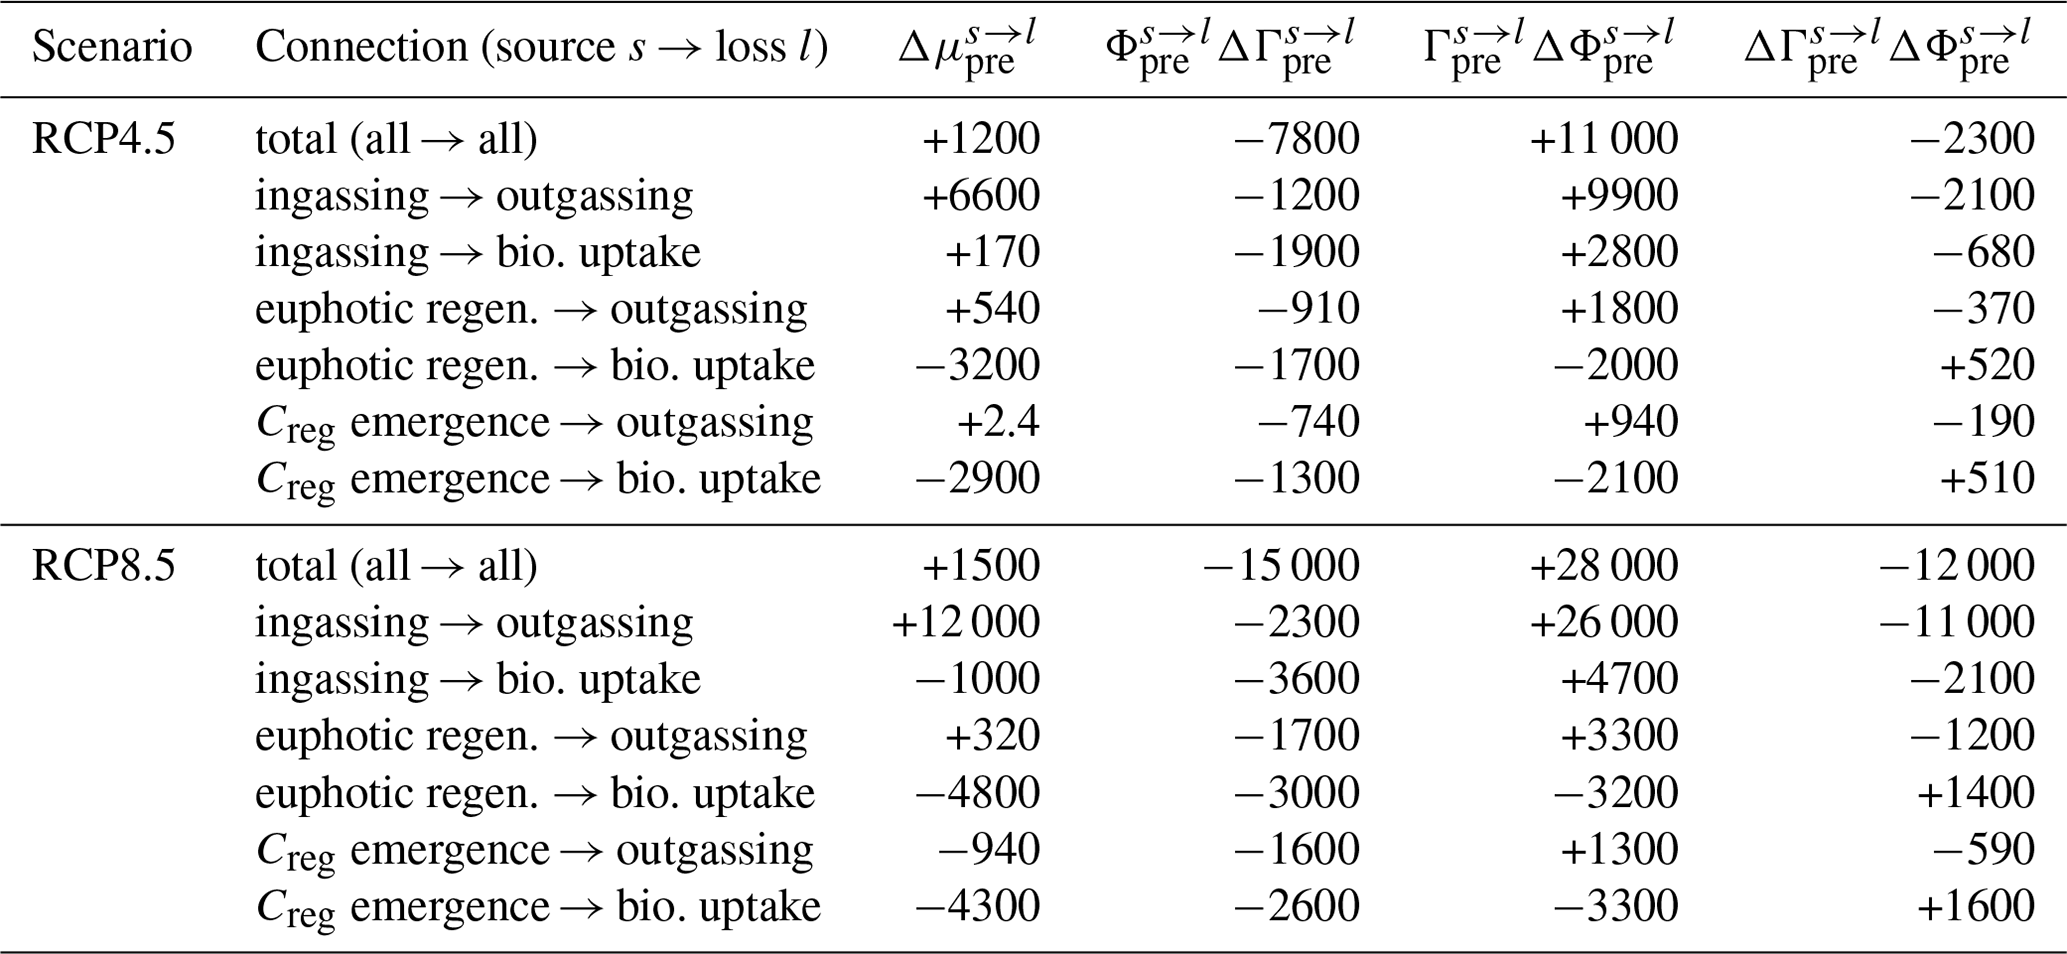
Table 3Contributions to the response of the preformed carbon inventory from changes in bulk residence time and changes in flow rate (values are in PgC and are rounded to two significant digits).
3.3.2 The perpetual-2090s preformed pump
In our perpetual-2090s states, the global preformed DIC inventory μpre increases from its preindustrial value by ∼ 1200 and 1500 PgC for the RCP4.5 and RCP8.5 scenarios, respectively (Table 3). While this is only about 5 % of the total preformed inventory, the absolute changes are of the same order of magnitude as (and larger than) the changes in the regenerated DIC pool (∼ 600 and 1400 PgC for the two scenarios, respectively).
The plumbing of the preformed DIC pump is reshaped entirely in our perpetual-2090s states. Preformed DIC is rerouted from biological utilization to outgassing. The strong increase in gross outgassing rate (by roughly a factor of 2 and 3 for RCP4.5 and RCP8.5, respectively) reflects the corresponding factor of 2 and 3 increases in atmospheric pCO2. The roles of reduced CO2 solubility in warmer surface waters and changes in gas-exchange coefficients due to wind changes are dwarfed by the prescribed pCO2 increases. The increase in outgassing rate reduces the fraction of newly preformed DIC destined for biological utilization from a preindustrial 60 %–65 % to 40 %–50 % and 30 %–35 % in the two perpetual-2090s states (ranges are given across source mechanisms). Similarly, the fraction of biological production supported by newly ingassed DIC increases from 35 % in the preindustrial state to 50 % and 65 % in the perpetual-2090s states. Across all source–sink pairs, the ingassing-to-outgassing flow rates increase the most (roughly by factors of 3 and 6 for RCP4.5 and RCP8.5, respectively) because of the dramatic change in atmospheric pCO2. Note that if we had prescribed the total (i.e., oceanic plus atmospheric) carbon inventory instead of only the atmospheric pCO2, the increases in atmospheric pCO2 and ingassing/outgassing fluxes in Fig. 6 would have been significantly smaller.
The rerouting of preformed DIC points to the biological pump becoming less efficient in warmer and slower oceans: regenerated DIC is much less likely to pass through the biological pump another time before outgassing to the atmosphere. Specifically, only about 40 % (for RCP4.5; 30 % for RCP8.5) of the preformed DIC sourced from regenerated organic matter is destined for biological utilization in the perpetual-2090s states compared to 60 % in the preindustrial state. In the sense that the number of lifetime passages through the biological pump is a measure of carbon pump efficiency (Holzer et al., 2021b), the perpetual-2090s biological pump becomes less efficient. Using the vertical attenuation of the POC flux as a measure of pump efficiency (e.g., Buesseler et al., 2020; Volk and Hoffert, 1985), we similarly find that the efficiency of POC transfer to 1000 m below the euphotic zone decreases by around 5 % in the perpetual-2090s states. Hence, the pump becomes stronger in the sense that it sequesters a larger regenerated DIC pool in the perpetual-2090s states, but it does so less efficiently in the sense of reduced export rate and lifetime biological pump passages.
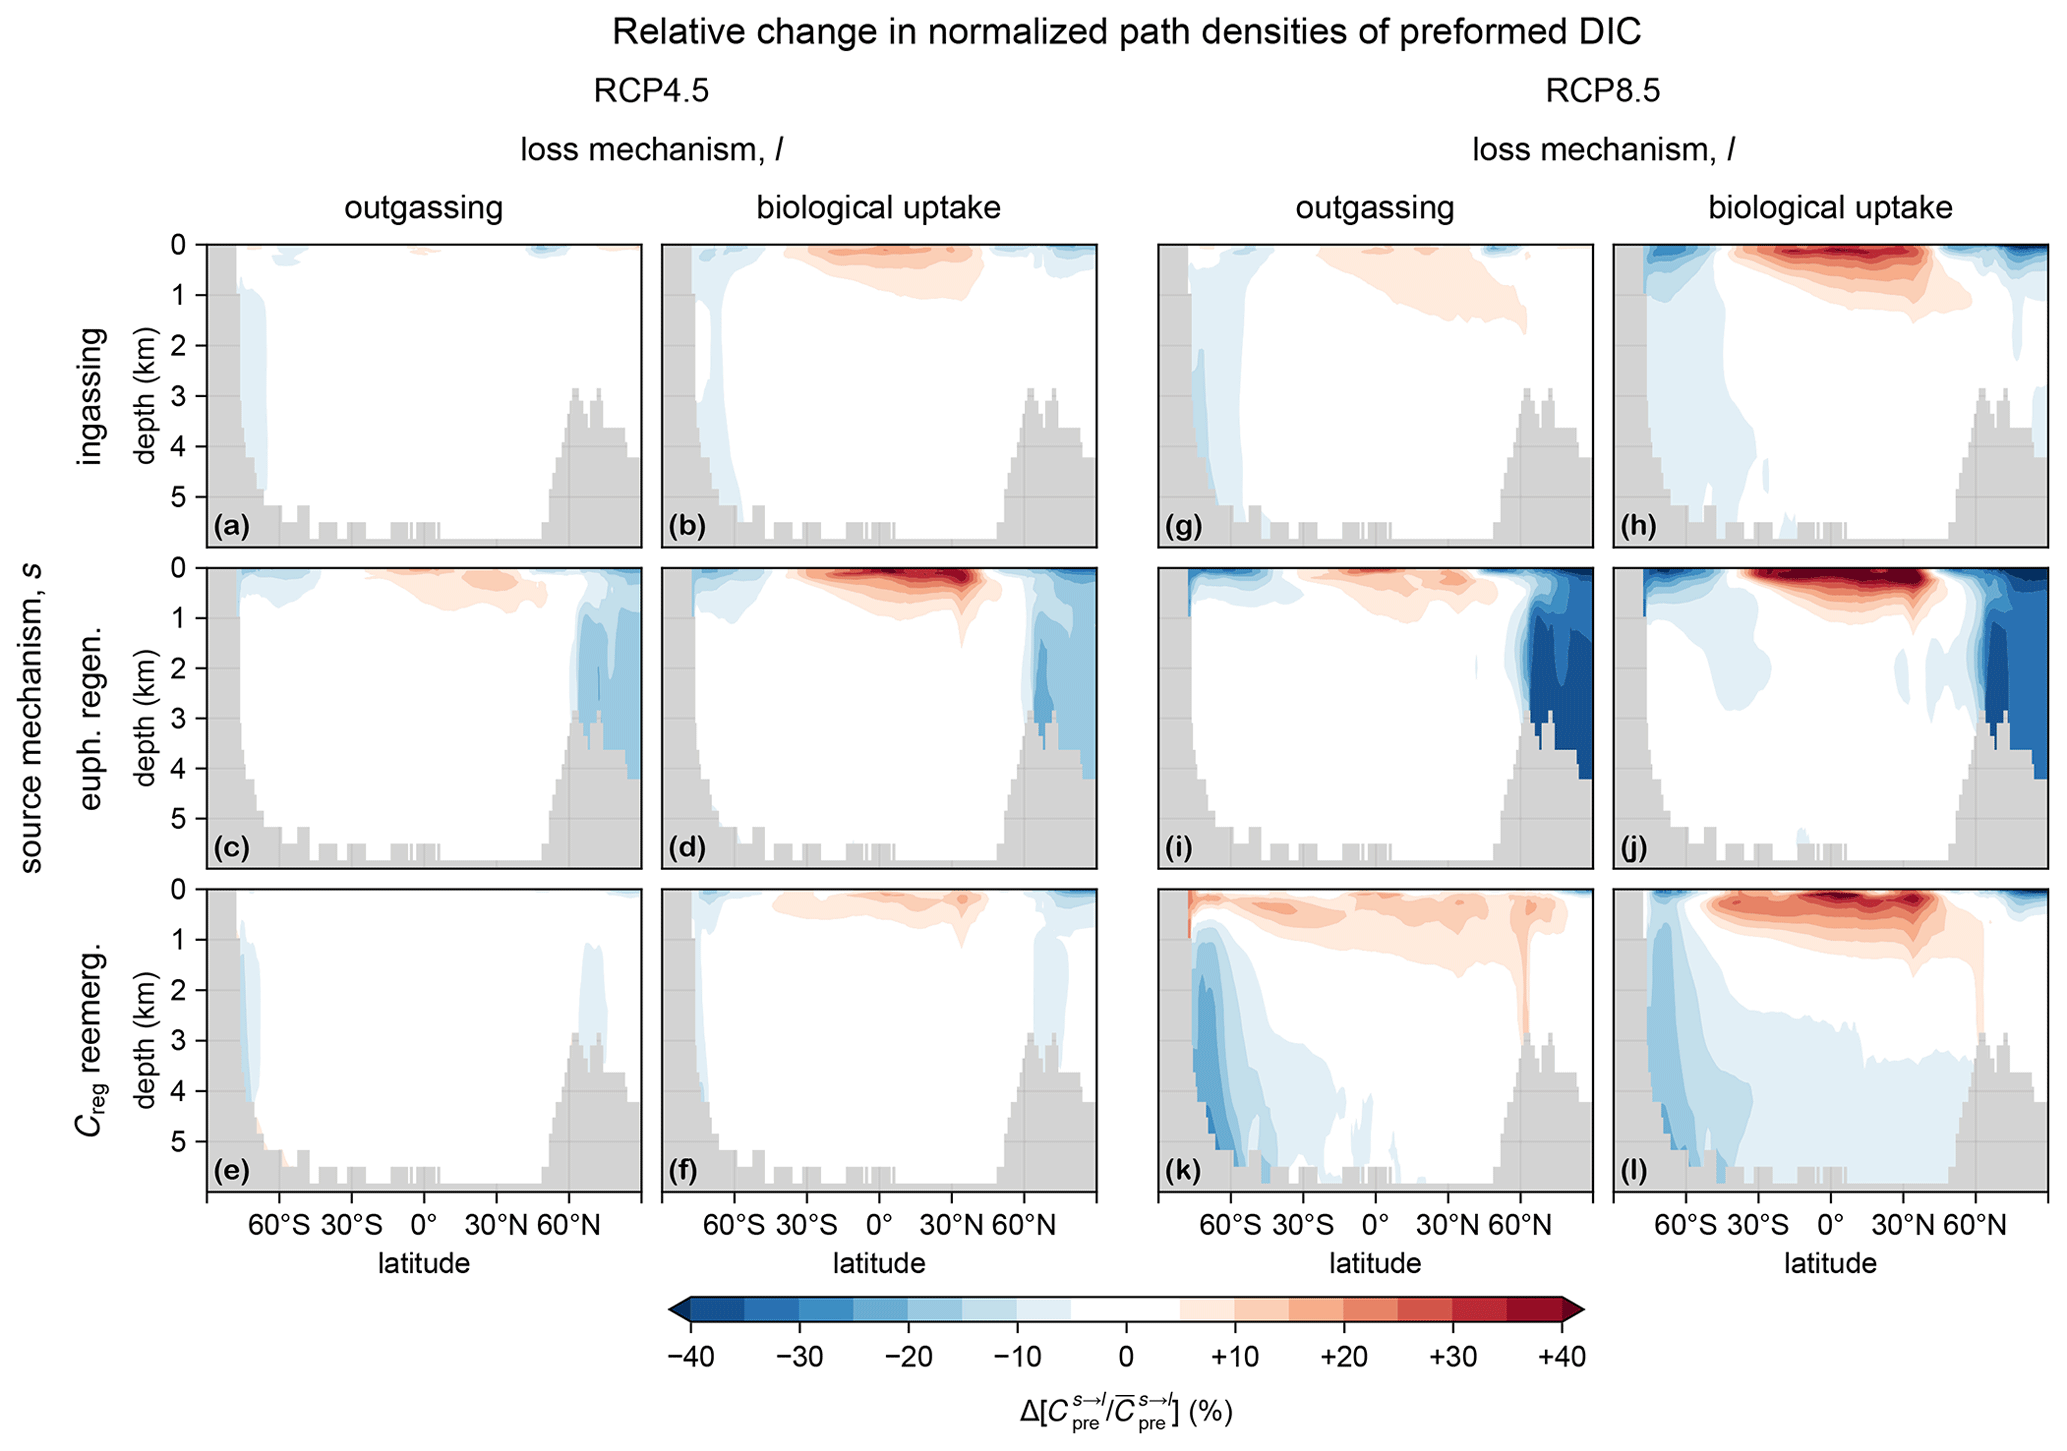
Figure 7Zonal means of the change in the normalized path density of preformed DIC from each source mechanism s (rows) to each loss mechanism l (columns), , for the RCP4.5-based perpetual-2090s state (a–f) and the RCP8.5-based perpetual-2090s state (g–l). Note that normalization by the global mean is necessary to uncover changes in pattern, given the large overall changes in the magnitude of .
A key feature of the perpetual-2090s preformed pump is that the bulk residence times in its pipes are shorter than in the preindustrial state. Preformed DIC pipes thus respond oppositely to regenerated DIC pipes – while the flow of regenerated DIC slows down with the more sluggish 2090s circulation, the flow of preformed DIC actually speeds up: bulk preformed residence times across all the pipes decrease by 20 %–25 % and 40 %–50 % for the RCP4.5 and RCP8.5 scenarios, respectively. This initially counterintuitive behavior can be understood in terms of the 2090s deep ocean being more isolated due to weaker ventilation. Faster surface paths are thus expected to become more important contributors to the overall transport than the slower deep paths. To confirm and quantify this, we calculated the path density (e.g., Holzer and Primeau, 2013; Pasquier and Holzer, 2016) for source- and sink-partitioned preformed DIC. For a given source–sink pair, this path density is simply the concentration of DIC in transit from a specified source to a specified sink. Figure 7 shows the changes in the global zonal mean normalized preformed DIC path densities between the preindustrial and perpetual-2090s states. (The path densities were normalized by the corresponding global preformed DIC inventory to reveal changes in pattern.) For all source–sink pairs, the perpetual-2090s path density becomes surface-intensified, with strongly increased upper-ocean transport away from high latitudes. This is consistent with changes in the fraction of newly preformed DIC that will remain entirely within the euphotic zone before outgassing or biological utilization (Eqs. A9–A10; not shown), which increases from about 5 % in the preindustrial state to 8 % and 12 % in the RCP4.5- and RCP8.5-based perpetual-2090s states, respectively.
We have analyzed the ocean carbon cycle in idealized steady-state equilibrium corresponding to a perpetually warmer and slower ocean state as predicted for the 2090s in the RCP4.5 and RCP8.5 scenarios. Our approach tracks all carbon in the ocean by considering the biologically pumped regenerated carbon pool, the preformed carbon pool, and the exchanges between these pools and the atmosphere. By focusing on the steady-state equilibrium response of the carbon cycle, we gain insight into how the system adjusts on long timescales, including the millennial timescales of deep ventilation (e.g., Primeau and Holzer, 2006). This is important to capture, e.g., strengthened Southern Ocean nutrient trapping, which is driven by the circulation slowdown and manifests in transient simulations only well after the 21st century (Moore et al., 2018). In contrast, 21st-century transient simulations can only probe the response on centennial and sub-centennial timescales.
To track preformed DIC not only in the interior but also in the surface ocean, we introduced a conceptually new partition of preformed DIC according to the sources that inject DIC into the euphotic zone and the sinks that remove it. This represents a significant advance over the traditional view of preformed DIC as being merely the propagated surface DIC concentration (e.g., Ito and Follows, 2005), with which it is impossible to track preformed DIC transport in the surface ocean. Our new approach allows us to paint a quantitative picture of the plumbing of the ocean's preformed carbon pump and how it connects the atmosphere to the biological pump.
Our new partition of preformed tracers will be useful beyond the scope of the present work. For example, a key quantity of interest in the ocean's nutrient cycles is the fraction of the production in one region supported by the supply of nutrients that are newly preformed in another region. This cannot be accurately quantified using the traditional concept of preformed tracers because of the singular diffusive return flux of locally labeled preformed tracers (Hall and Holzer, 2003; Primeau and Holzer, 2006). Previous approaches have sidestepped this difficulty by either perturbing the system in the origin region and attributing the nonlinear response elsewhere to contributions from the origin region (e.g., Sarmiento et al., 2004), using interior volumes to label nutrient origin (e.g., Palter et al., 2010), or labeling nutrient origin according to the last biological utilization or regeneration (e.g., Holzer and Primeau, 2013; Pasquier and Holzer, 2016). By contrast, our new partition of preformed tracers has non-diffusive sinks and is hence not subject to diffusive singularities, making it the ideal tool for tracking preformed connectivity in the ocean.
A number of caveats must be kept in mind:
- i.
Our results for steady-state biogeochemistry embedded in frozen-in-time ocean states are not predictions of the future. The real ocean will keep changing for many centuries beyond the 2090s, and its future long-term dynamical equilibrium (if forcing ever stabilizes) will likely be vastly different from the ocean states analyzed here (e.g., Schmittner et al., 2008). However, our idealized steady states do reveal the key mechanisms driving the system's responses to future change.
- ii.
Our steady states do not capture seasonal covariances between physical, thermodynamic, and biological variations (e.g., Riebesell et al., 2009). While this could be addressed with a cyclo-stationary model (e.g., Bardin et al., 2014), doing so would greatly increase complexity and computational cost. We expect seasonality to mostly affect the upper few hundred meters of the water column, as was the case for Huang et al. (2021), who built a seasonally varying ocean circulation inverse model (CYCLOCIM). We therefore do not expect the absence of explicit seasonality to affect the qualitative character of our results, as most of the circulation-driven changes analyzed occur at depth.
- iii.
Most of the quantitative aspects of our results are likely model-specific and to some extent imprinted by circulation biases. While the ACCESS1.3 parent model is state of the art, it produces Antarctic Bottom Water (AABW) through unrealistically deep convection in the Southern Ocean (Bi et al., 2013a). However, the future reduction in AABW seen here is robust across CMIP5 models and also expected from recent observations (de Lavergne et al., 2014). We therefore do not expect our results to be sensitive to this unrealistic model feature. Although a model with more realistic AABW formation might produce quantitatively different results (e.g., production could increase due to a smaller decline in mixed-layer depths), the qualitative links between changes and their driving mechanisms should be robust and model-independent (e.g., mixed-layer shoaling driving intensified nutrient trapping; Liu et al., 2023).
- iv.
The parent ACCESS1.3 model does not include meltwater from terrestrial ice sheets. Including ice-sheet meltwater would further reduce Southern Ocean ventilation (Purich et al., 2018; Purich and England, 2023; Li et al., 2023). This would likely strengthen the already dominating role of the circulation in driving changes in the biological and preformed carbon pumps.
- v.
Our model may not capture potentially important effects from biogeochemical mechanisms that are not explicitly parameterized (e.g., Henson et al., 2022). These include changes in community composition from adaptation and evolution (e.g., Boyd, 2015; Passow and Carlson, 2012; Doney et al., 2009; Lomas et al., 2022), changes in nitrogen and/or iron limitation (e.g., Thornton et al., 2009; Jickells et al., 2005), or changes in early diagenesis and sediment fluxes (e.g., Griffiths et al., 2017; Sweetman et al., 2017). However, at least some of our model's mechanistic shortcomings are partially compensated for by having optimized biogeochemical parameters (Pasquier et al., 2023).
- vi.
Using the 1990s and 2090s decadal means from a single climate-model run does not capture decadal variability. However, we expect decadal variability to be small compared to the centennial changes considered here. While important for precise predictions, decadal variability is not important in our idealized steady-state framework, for which any reasonable future state suffices.
A number of factors made the ACCESS-embedded PCO2 model a natural choice for this study, which builds on previous publications. While we could have chosen a different circulation model, all models have biases, and none of the other models' transport matrices have been assessed in as much detail as those for ACCESS1.3 (Chamberlain et al., 2019; Holzer et al., 2020). Furthermore, Pasquier et al. (2023) optimized PCO2 embedded in the ACCESS1.3 transport matrix (“ACCESS-M PCO2”) and quantified the effects of circulation biases on the biological pump. Importantly, our optimized preindustrial state fits observations of DIC, total alkalinity, dissolved O2, and PO4 better than most CMIP5 and CMIP6 models (see, e.g., Bao and Li, 2016; Fu et al., 2022; Planchat et al., 2023).
How do the steady-state responses analyzed here compare with the trends seen in transient simulations? On the one hand, we would expect a closer correspondence with the long-term behavior of multi-century simulations, where the system's slow processes have a chance to begin to assert themselves. On the other hand, even the long-term evolution of the ocean will likely be characterized by transience (Schmittner et al., 2008), and an overturning slowdown may eventually recover once dynamical equilibrium becomes re-established (e.g., Bi et al., 2001; Jansen and Nadeau, 2019). Simulation time is thus key when comparing to steady-state responses, and one must be careful with the interpretation of transient simulations. For example, an analysis of a transient 21st-century circulation slowdown may interpret a decreased preformed DIC inventory as a weakening of the solubility pump (e.g., Raven and Falkowski, 1999; Liu et al., 2023). However, at steady state, a more sluggish circulation is expected to enhance the solubility pump and increase the preformed DIC inventory by allowing larger spatial gradients to form (Murnane et al., 1999; Toggweiler et al., 2003; DeVries, 2022).
Our estimates of perpetual-2090s DIC increases of 1700–2900 PgC roughly agree with estimates from multi-century simulations. For example, in 350-year simulations with 2× and 4× preindustrial pCO2, Sarmiento and Le Quéré (1996) found increased DIC inventories ranging from 1000 to 2000 PgC. Similarly, in simulations with pCO2 prescribed at 550 and 1000 µatm, Plattner et al. (2001) found increases ranging from 1000 to 1500 PgC by the year 2500. More recently, Liu et al. (2023) found an increase of about 1000 PgC by 2300 for the RCP8.5 scenario. For CMIP6 models under the SSP2-4.5 and SSP5-8.5 scenarios (which nominally match RCP4.5 and RCP8.5, respectively; Riahi et al., 2017; Arias et al., 2021), the increase in ocean carbon sequestration is about 400–500 PgC by the year 2100 (Liu et al., 2023), only about 100 PgC of which is regenerated DIC, as there has been insufficient time for it to accumulate at depth.
The qualitative agreement of our results with the long-term behavior of transient simulations underlines the common driving mechanisms that are at work. Across almost all CMIP5 and CMIP6 models (e.g., Bopp et al., 2013; Hauck et al., 2015; Kwiatkowski et al., 2020; Arora et al., 2020; Wilson et al., 2022; Liu et al., 2023), a slower future circulation reduces the nutrient supply, which reduces production and export despite warming-accelerated growth and increases the sequestration time of regenerated DIC. At the same time, higher future atmospheric pCO2 drives more carbon into the ocean. While the PCO2 model explicitly represents only 3 (the dependence of viscosity on T and the dependence of respiration on T and O2) of 12 export-controlling mechanisms identified by Henson et al. (2022), our results broadly agree with the corresponding expected future effects in terms of both magnitude and direction: the dominant effect is that warming reduces export through enhanced shallow respiration followed by faster particle sinking in less viscous seawater and decreased deep respiration due to reduced oxygen. Our results also roughly agree with the changes in the controls on carbon export and biological utilization identified by Boyd (2015). However, their one-dimensional water-column analysis cannot capture the effects of circulation changes, which are a key control on the carbon cycle identified here, while our analysis cannot capture changes in plankton community composition, which was identified as a key driver by Boyd (2015). PCO2 may implicitly capture the effects of such changes through its optimized nonlinear production parameterization.
Our findings challenge the hypothesis of Liu et al. (2023) that a future circulation slowdown will reduce the capacity of the ocean to take up anthropogenic CO2 on multi-century timescales. Our analysis shows that the circulation slowdown is the dominant driver of the large regenerated DIC increases in the long-term steady state through increased residence times in the deep ocean. A slower circulation may also increase the preformed DIC inventory by increasing DIC gradients, thereby increasing the efficiency of the solubility pump (e.g., Murnane et al., 1999; Toggweiler et al., 2003), but this effect is overwhelmed by the large future increases in atmospheric pCO2. The bulk of the DIC inventory is located in the deep ocean and returns to the surface with a distribution of transit times that has a mean exceeding a millennium close to the seafloor rather than a few centuries (e.g., Fig. C3 or Primeau, 2005). The correlation for the year 2100 between carbon uptake and decreased overturning across CMIP6 models found by Liu et al. (2023) can therefore only capture the relatively short-timescale response of preformed DIC, and the correlation may thus very well change sign by 2300 or a few centuries later as more time becomes available to fill abyssal waters with additional DIC, assuming that the slow circulation persists.
Our decomposition of the change in regenerated DIC inventory into contributions from changes in export and circulation is consistent with the results of Liu et al. (2023), but our analysis identifies important nonlinearities that appear to be absent in their simulation to the year 2300. Broadly consistent with our findings, they found that the circulation slowdown contributes an increase in μreg below 2000 m that is roughly 5 times larger than the reduction due to weakened export. However, in stark contrast to our finding of a large correlation between changes in regeneration and re-exposure times (roughly 20 %–30 % of the total change; see Table 1), Liu et al. (2023) argue that the interaction between export and circulation is negligible. That the nonlinear interaction terms would fortuitously collapse to zero because of model specifics or experimental design is unlikely. Based on our analyses, it is more likely that this difference stems predominantly from the fact that our perpetual-2090s steady states capture the response associated with much longer timescales, allowing the system's nonlinear interactions to develop fully.
We investigated the steady-state response of the ocean's carbon pumps in perpetually warmer and slower oceans. This was done by embedding a relatively simple biogeochemical model into the average ocean state as predicted by the ACCESS climate model for the 2090s under the RCP4.5 and RCP8.5 scenarios. We then solved for the steady state of the biogeochemistry, keeping the ocean state and prescribed atmospheric pCO2 fixed over time.
Most features of the carbon cycle's response are already manifest in the RCP4.5-based scenario. For many quantities, the response for RCP8.5 is approximately twice that for RCP4.5, roughly tracking the change in atmospheric pCO2. One way in which the system's nonlinearities manifest is in the spatial correlations between key driving mechanisms, which are 3–8 times higher for RCP8.5 than for RCP4.5. These nonlinearities can either strengthen (e.g., biological uptake) or weaken (e.g., export production) the overall response.
Our analysis focused on the mechanisms that drive the response to climate change, brought to light here by applying novel diagnostics of carbon sequestration and transport made possible by the steady-state framework. We partitioned the ocean's DIC into regenerated and preformed pools and further partitioned according to sources and sinks. Each partitioned DIC pool, together with its source-to-sink flow rate defining the residence time in each pool, may be considered to be an advective–diffusive pipe. These pipes constitute the plumbing of the biological and preformed carbon pumps. Whereas preformed DIC is usually considered as determined by a concentration boundary condition, here we introduced a new partitioning of preformed DIC that allows us to track not only its interior transport but also its surface pathways. This made it possible – for the first time, to the best of our knowledge – to track DIC from its injection into the preformed pool (by ingassing, euphotic regeneration, or upwelling of regenerated DIC) to its exit from the preformed pool through outgassing or biological uptake.
Our main conclusions are as follows:
-
Biological productivity is remarkably resilient in the face of large environmental change. For our perpetual 2090s scenarios, production declines by only ∼ 10 % from preindustrial values, even for RCP8.5. These declines are driven by a reduced nutrient supply but are partially compensated for by surface warming, which exponentially enhances organic-matter production and the recycling of nutrients within the euphotic zone. The overall nutrient supply declines because of intensified Southern Ocean nutrient trapping and because decreased ventilation and strong mixed-layer shoaling slows the resurfacing of nutrients from depth.
-
Export production declines by 14 % and 24 % in the RCP4.5- and RCP8.5-based perpetual-2090s states, respectively. These declines are driven not only by reduced organic-matter production but also by reduced export ratios. The reduction in export ratios is driven primarily by enhanced shallow POC respiration due to surface warming and by decreased DOC export due to reduced ventilation. Decreased respiration from deoxygenation and faster POC sinking in less viscous warmer water tend to increase export ratios but are of secondary importance.
-
The perpetual-2090s biological pump cycles a larger regenerated DIC inventory but does so less efficiently. The regenerated DIC inventory increases by 30 % (∼ 600 PgC) and 70 % (∼ 1400 PgC) for the RCP4.5- and RCP8.5-based scenarios, respectively. These steady-state increases capture millennial response timescales and are driven primarily by reduced deep ventilation that increases the sequestration time in the aphotic ocean. This allows more regenerated DIC to accumulate at depth and to participate in Southern Ocean trapping. Reduced export production only compensates for about half of the increase in regenerated inventories, underlining the key importance of circulation changes. Biological pump efficiency is decreased in the sense that resurfacing regenerated DIC contributes less to organic-matter production.
-
The preformed carbon pump is completely replumbed in our perpetual-2090s states. Preformed DIC is largely rerouted from supporting biological production to outgassing primarily because dissolved CO2 at the surface, and hence gross ingassing and outgassing, increases by 2–3 times, in approximate proportion to the prescribed atmospheric pCO2 increases. Reduced biological production and decreased CO2 solubility in warmer waters play only a secondary role. Because the inventory of preformed DIC in the euphotic zone increases only by a few percent due to carbonate buffering, increased ingassing and outgassing rates correspond to preformed DIC with shorter residence times in the euphotic zone. As a consequence, the fraction of newly preformed DIC that supports biological production shrinks from about 60 % in the preindustrial to roughly 40 % in the perpetual-2090s states. However, the fraction of biological production supported by newly ingassed DIC increases from 36 % in the preindustrial to more than 50 % in the perpetual-2090s states, again because of the large increase in ingassing.
-
Preformed DIC is cycled more rapidly in our perpetual-2090s states, despite the overall slower circulation. Across all source and sink mechanisms, the residence times of preformed DIC in the entire ocean decrease by 20 %–50 %, while the global preformed inventory increases by only a few percent (∼ 5 % or 1500 PgC for the RCP8.5 case), implying faster source-to-sink flow rates. This is driven by fast shallow preformed transport pathways becoming more important relative to slow deep pathways as reduced ventilation isolates the deep ocean. The fraction of newly preformed DIC that never enters the aphotic ocean roughly doubles from its preindustrial value of 5 % in both perpetual-2090s states.
Our analysis reveals a complex, multifaceted response of the carbon cycle to changes in ocean state, even for our relatively simple biogeochemistry model and idealized scenarios. On the one hand, a more sluggish circulation slows down biological cycling, but the regenerated carbon inventory increases due to longer sequestration times. On the other hand, preformed DIC shoals with faster source-to-sink flow due to the increased isolation of the deep ocean. While the responses of the biological and preformed pumps are driven by different mechanisms with widely different response timescales, the regenerated and preformed DIC inventories both increase by similar absolute amounts when the contributions from the longest response timescales are captured in steady state.
To partition preformed DIC according to the source and loss mechanism, we consider the following linear labeling tracer equation whose solution is identical to that of Eq. (4):
where and are equivalent linear loss rates for preformed DIC corresponding to the inverse timescales of local outgassing and biological uptake, respectively. Equation (A1) exploits the fact that labels are removed in proportion to their fractional abundance, even when the removal process is nonlinear (e.g., Holzer and DeVries, 2022). The Green function Gpre for Eq. (A1) obeys
where is the three-dimensional Dirac distribution, and the subscript in 𝒯r indicates that the differential operator 𝒯 is applied at point r. The Green function allows us to cleanly partition Cpre according to every source and sink. Specifically, the preformed DIC contributed by any source s is given by
which, in matrix form, is equivalent to
where T is the advective–diffusive transport matrix, Latm and Lbio are diagonal matrices representing the local loss rates latm and lbio, respectively, and s is a column vector of the source s.
To quantify the fraction of Cpre destined for a given loss mechanism (outgassing or uptake), we take the adjoint Green function , defined as the solution to
where is the adjoint of 𝒯 with respect to the volume-weighted inner product. The fraction of preformed DIC destined for loss process l, where l=lbio or latm, is given by
In matrix form, Eq. (A6) becomes
where is the adjoint of T with respect to the volume-weighted inner product (V is a diagonal matrix of grid-box volumes), and l is the vector representing the grid-point values of l.
The preformed DIC concentration due to source mechanism s and destined for loss mechanism l is thus given by
The inventory of the s→l preformed DIC pipe, i.e., the amount of preformed DIC in transit from source s to loss l, is given by . Similarly, the global flow rate of the s→l preformed DIC pipe is given by . The bulk transit time is then simply given by .
To better diagnose the physical pathways of preformed DIC, we further partition the DIC in the preformed pipes into DIC that remains in the euphotic zone throughout the preformed lifetime and DIC that explores the aphotic interior. To this end, we introduce a labeling tracer for euphotic-only DIC, , which is governed by
which is similar to Eq. (A1) but where additionally unlabels any preformed DIC that leaves the euphotic zone. Taking the difference with the full preformed DIC from Eq. (A1) gives the concentration of preformed DIC that will explore the aphotic interior and obeys
In practice, Eqs. (A9) and (A10) are again solved in matrix form.
Nutrient supply (here PO4) is the dominant driver of the response of production (Fig. 1), while oxygen concentrations control the respiration rates in the euphotic zone and thus export ratios. Figure B1 shows the euphotic-zone mean [PO4] and [O2] in the preindustrial and perpetual-2090s states, along with the corresponding change. Phosphate concentrations decrease almost everywhere, with a particularly strong decrease near the Weddell Sea and the Ross Sea, where the mixed layer that was unrealistically deep preindustrially has shoaled considerably (Fig. C2). For euphotic-zone [O2], we also see a global decline except in the Weddell and Ross seas, where oxygen was strongly undersaturated preindustrially because of the unrealistic mixed-layer depths (MLDs).
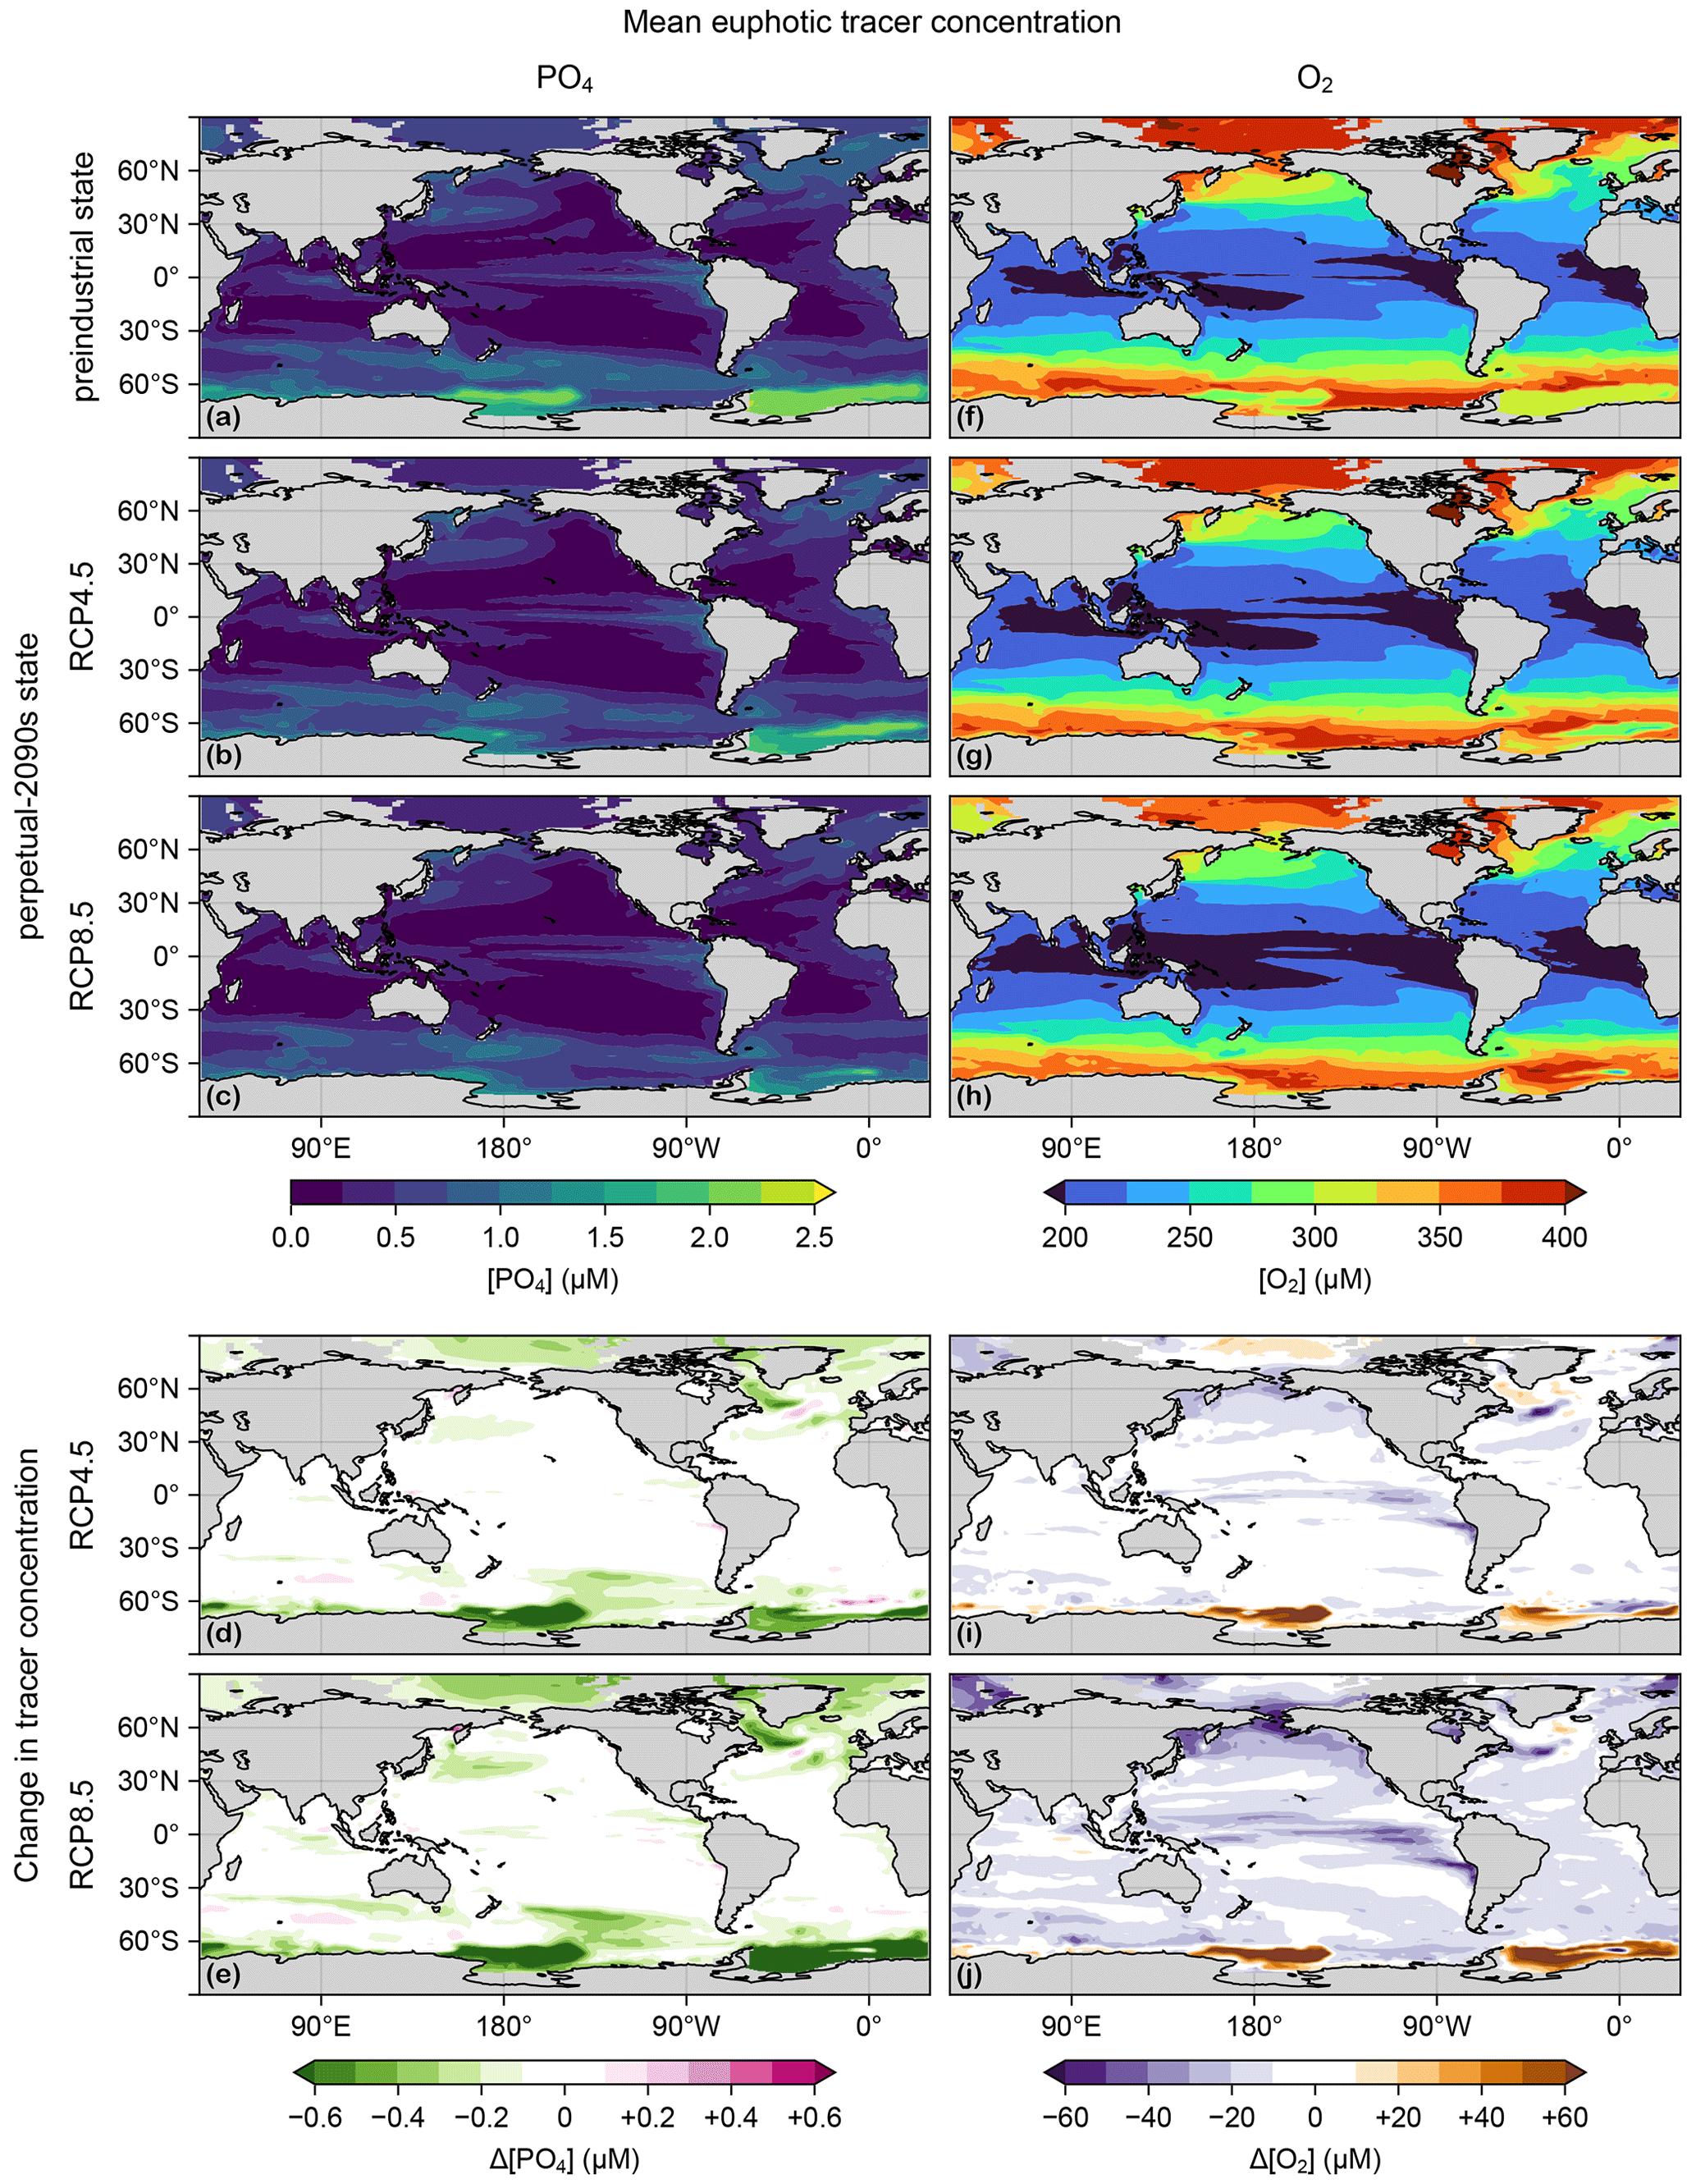
Figure B1(a) Mean euphotic [PO4] for the preindustrial state. (b) As (a) but for the RCP4.5-based perpetual-2090s state. (c) As (b) but for RCP8.5. (d, e) As (b, c) but for Δ[PO4]. (f–j) As (a–e) but for O2.
Through its control on phytoplankton and bacterial growth rates, temperature change is a key driver of production and export changes. Figure C1 shows the changes in euphotic-zone temperature from the preindustrial values for the RCP4.5 and RCP8.5 scenarios. (The temperature fields used here are decadal means for the 1990s and 2090s of the parent ACCESS1.3 model, consistent with our methodology for extracting the circulations.) Temperature strongly increases almost everywhere except in the highest latitudes of the Southern Ocean and in the subpolar North Atlantic “cold blob”, where temperatures decrease (this is thought to be driven partly by the Atlantic overturning circulation slowdown; see, e.g., Cheng et al., 2022).
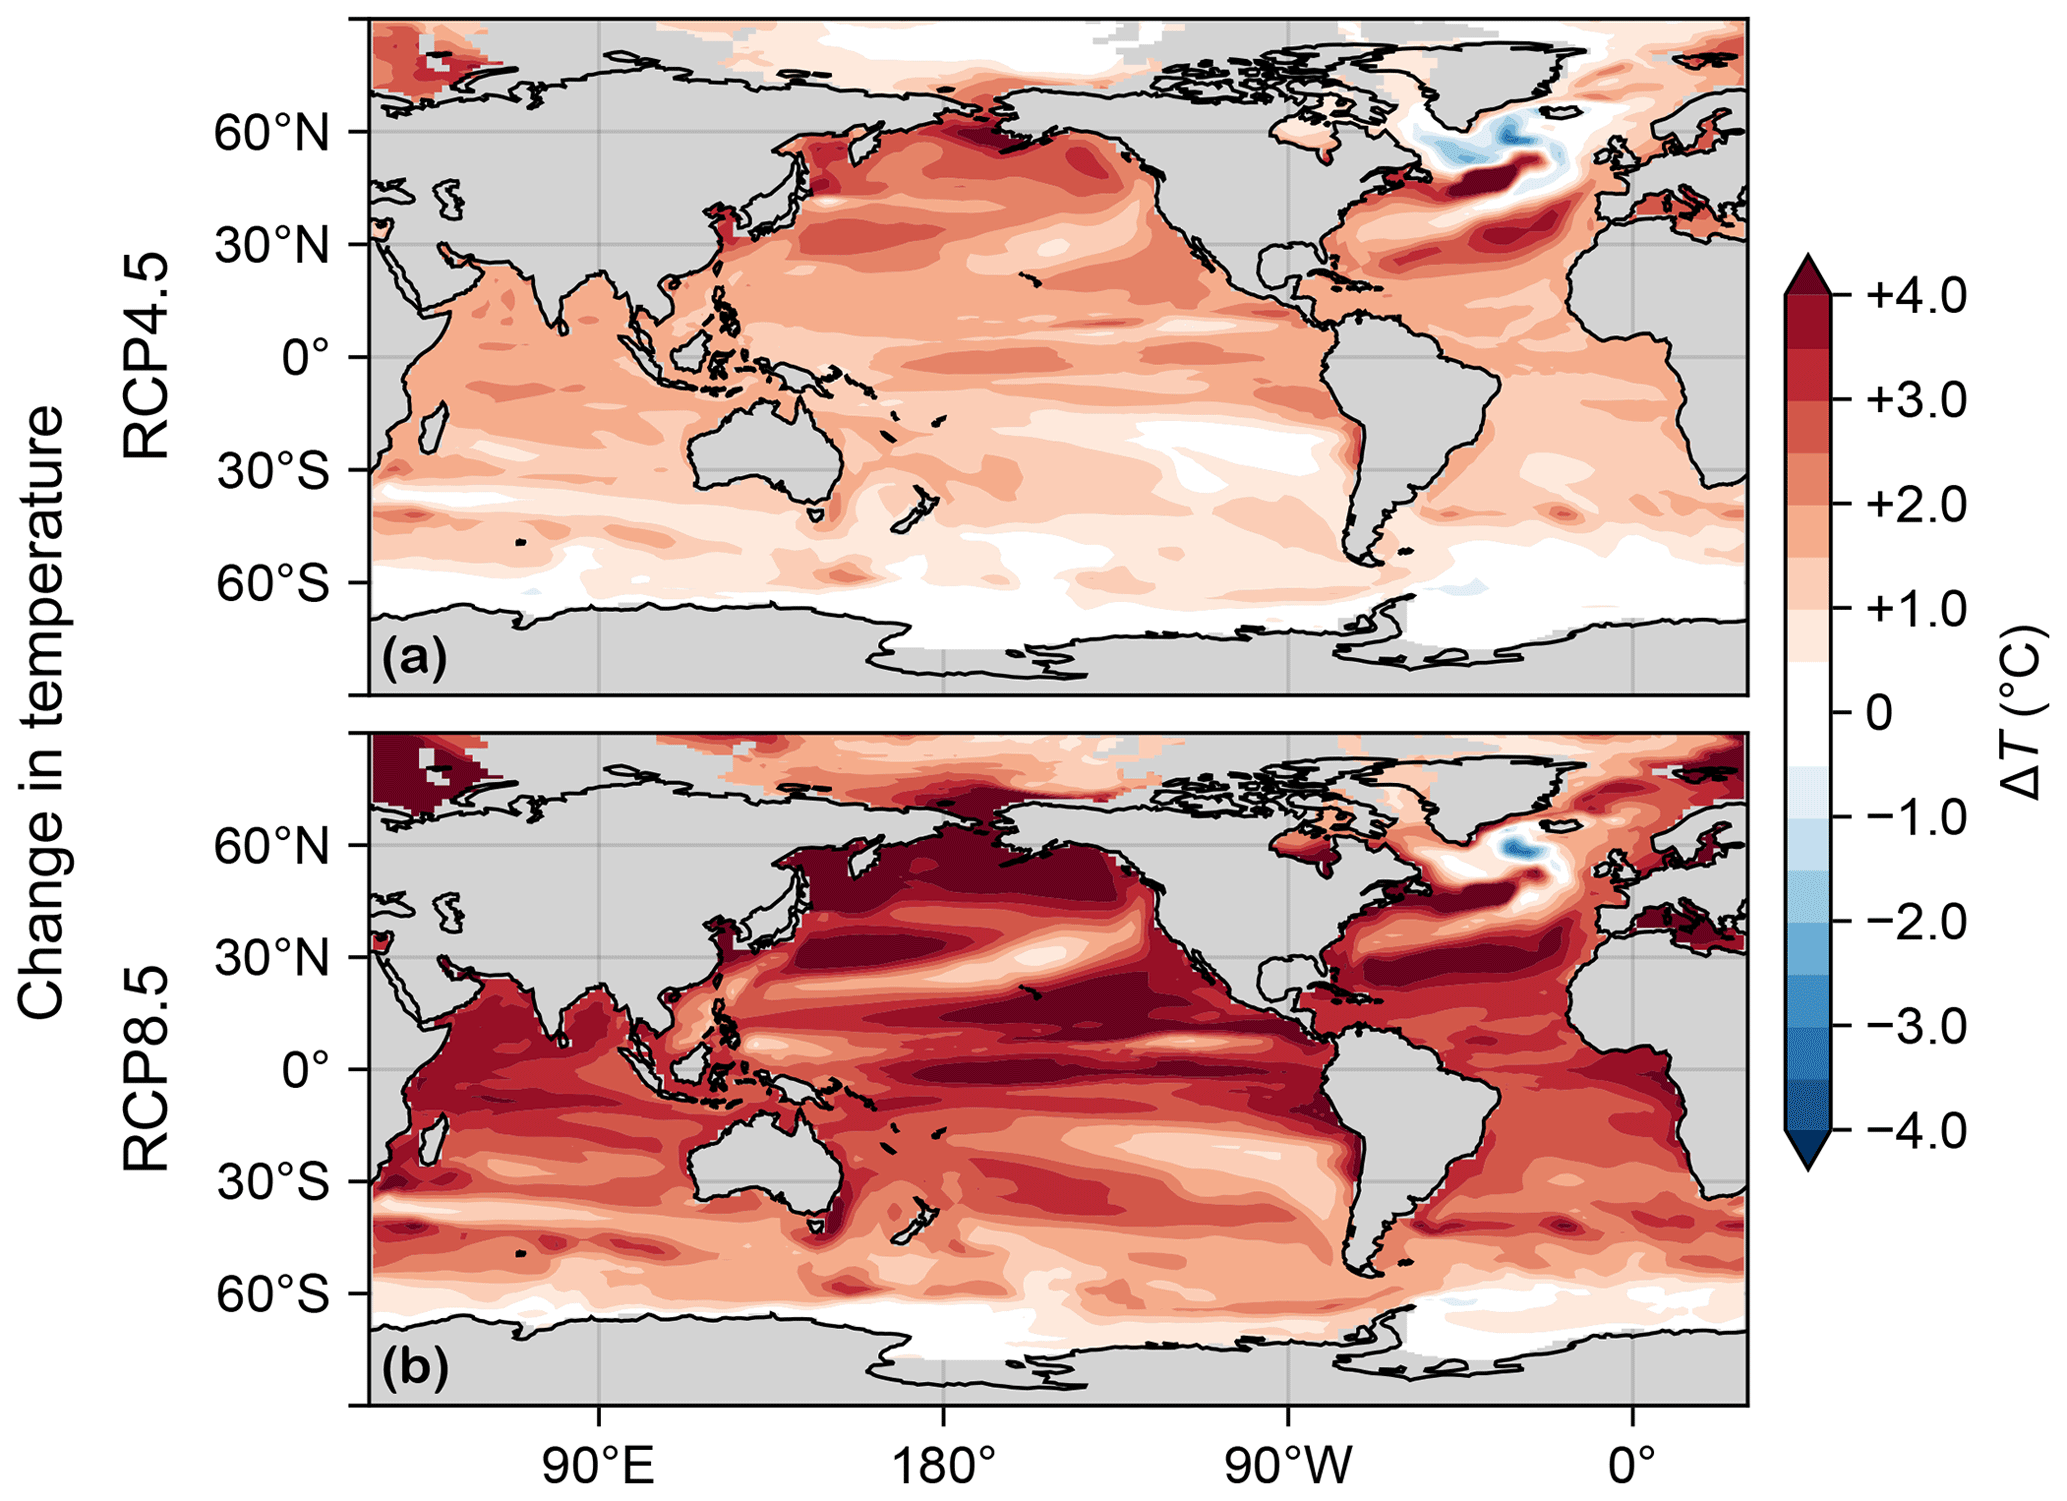
Figure C1(a) Change in vertical mean euphotic temperature, ΔT, for the RCP4.5 scenario. (b) As (a) but for RCP8.5.
The mixed layer plays a key role in supplying nutrients to the euphotic zone. Figure C2 shows the mixed-layer depths (MLDs) in the preindustrial and perpetual-2090s states. (As for temperature, the MLD fields were taken from 1990s and 2090s averages of ACCESS1.3 simulations.) The unrealistically deep MLDs of the 1990s (used here as the preindustrial state) dramatically shoal in the 2090s, partially shutting off the model's deep-water formation (Bi et al., 2013a), although the deep Atlantic MLD near the Weddell Sea has not entirely subsided in the RCP4.5 scenario (Fig. C2b).
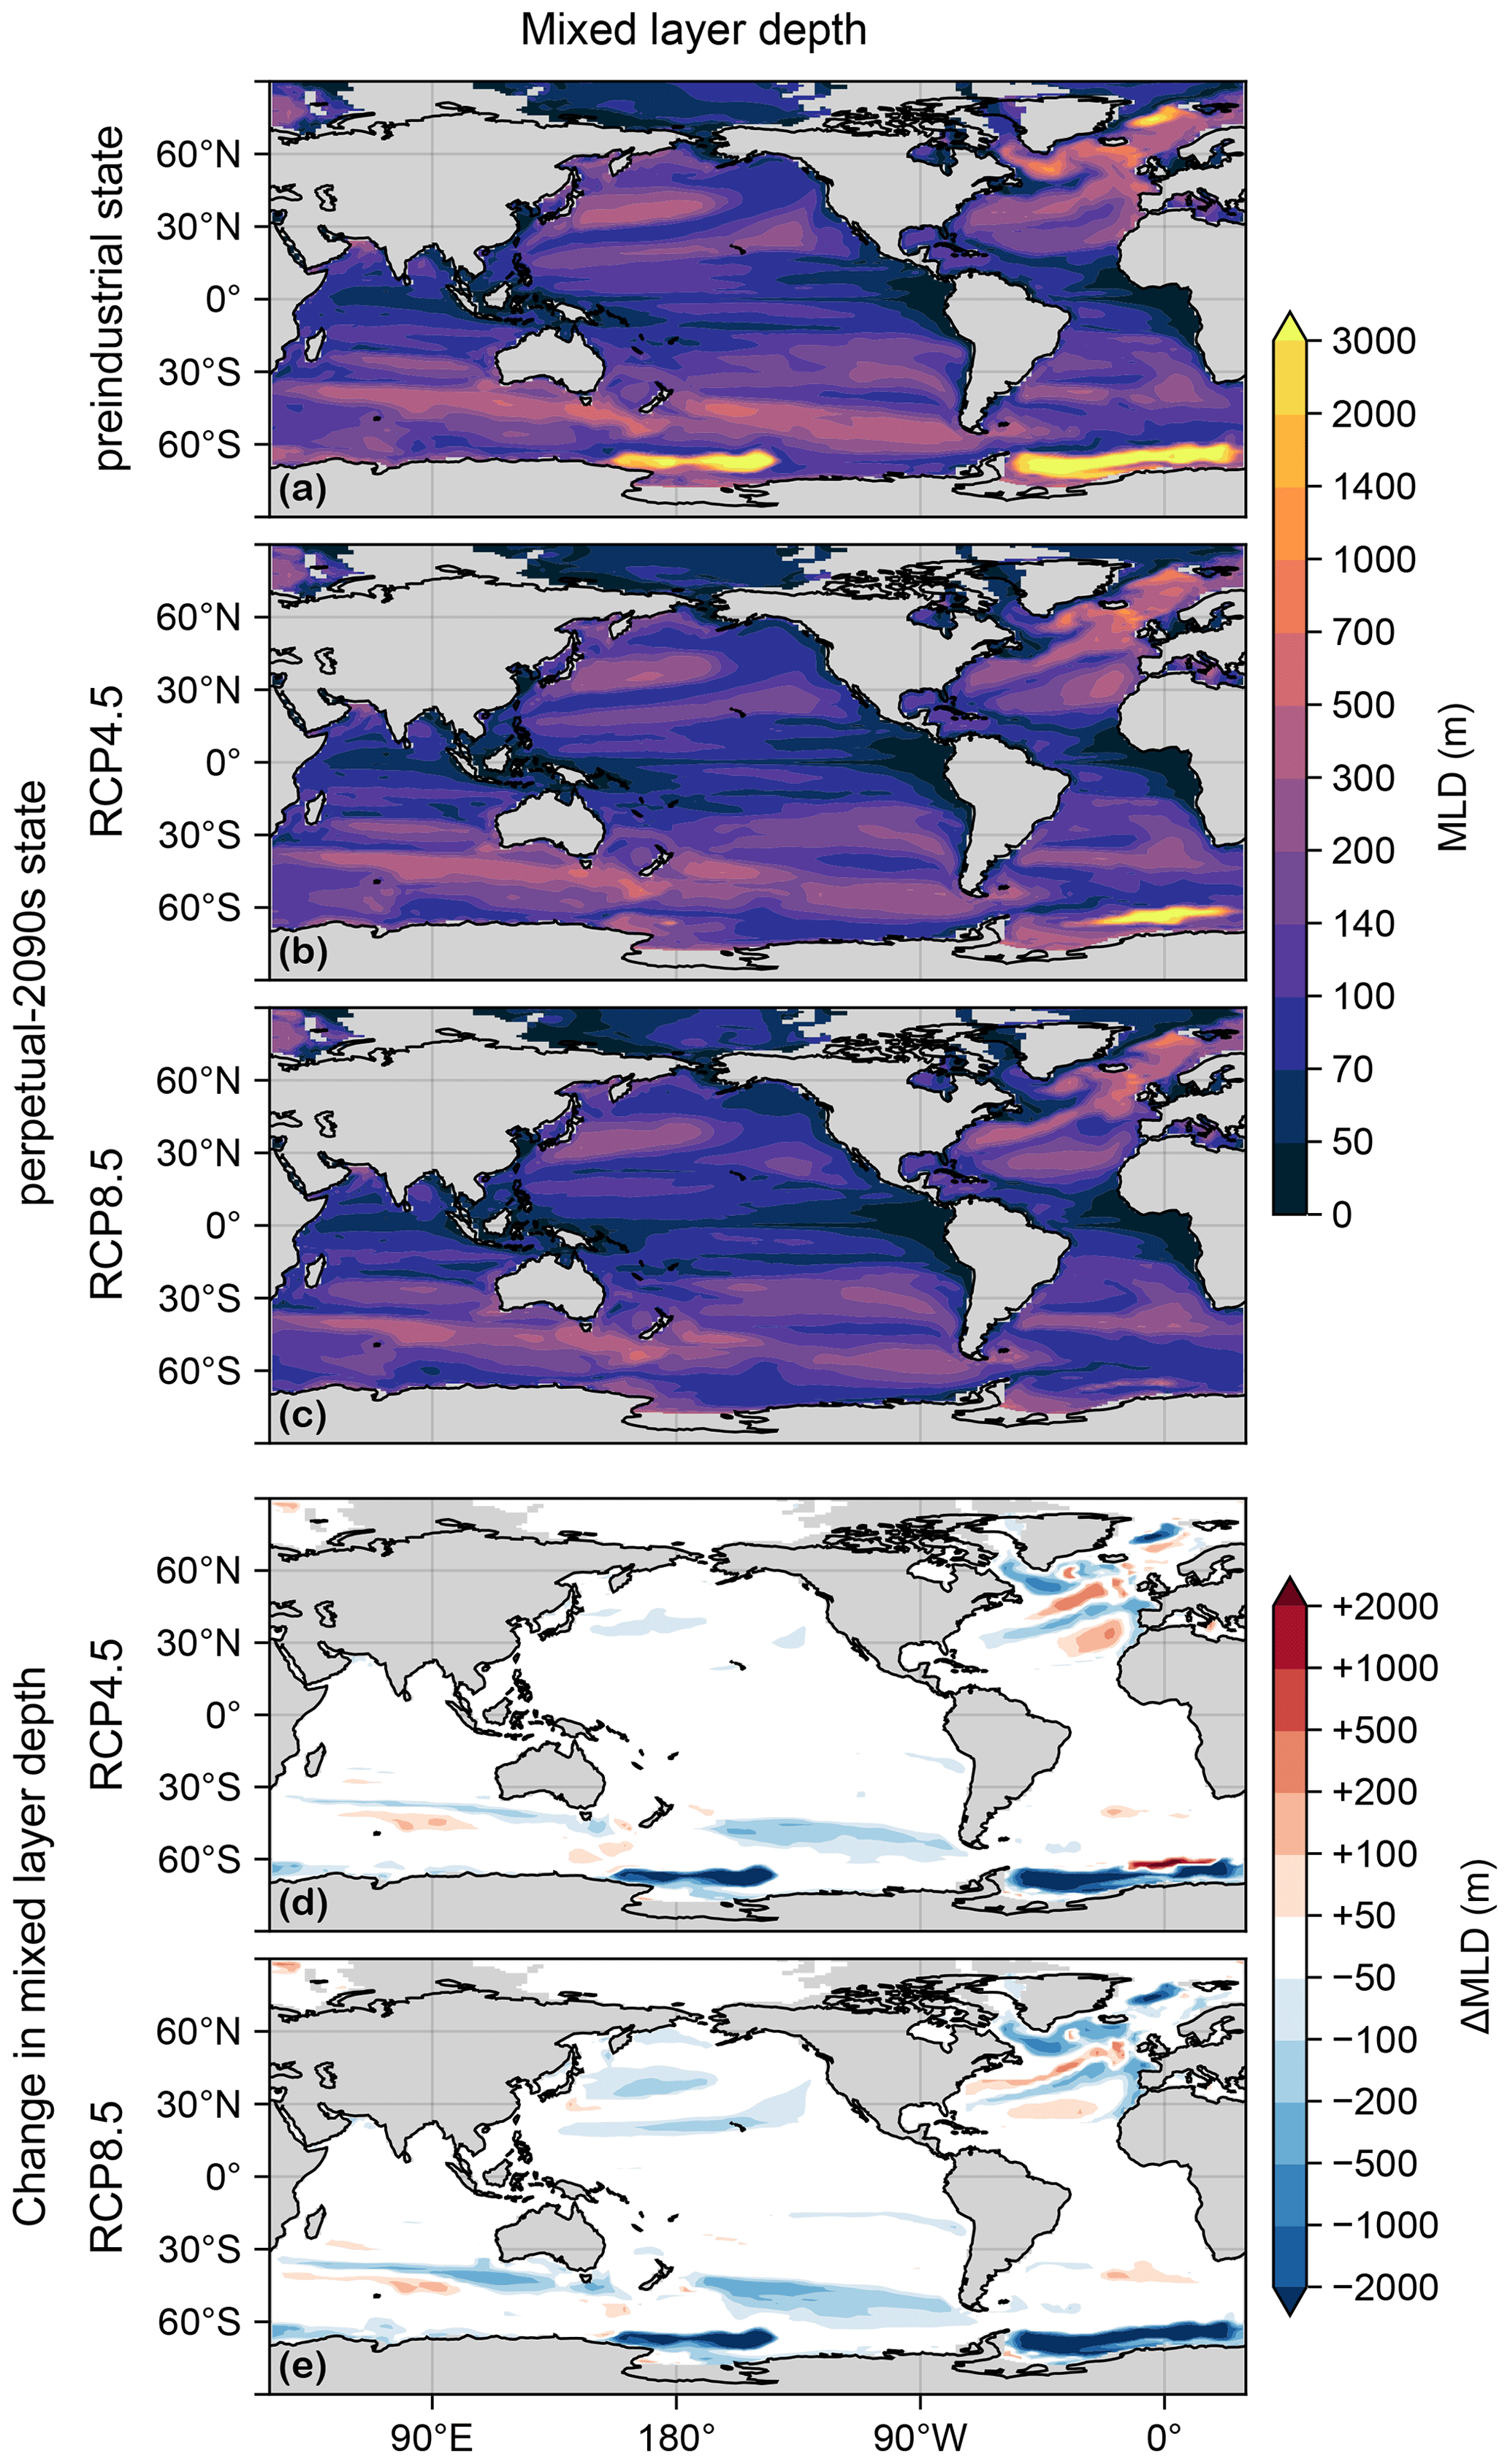
Figure C2(a) Mixed-layer depth (MLD) for the preindustrial state. (b) As (a) but for the RCP4.5-based perpetual-2090s state. (c) As (b) but for RCP8.5. (d, e) As (b, c) but for the change in mixed-layer depth, ΔMLD.
The dominant control on the sequestration strength of the biological pump is the mean time Γ↑ to return water to the euphotic layer (termed re-exposure time; Primeau, 2005; DeVries and Holzer, 2019; Holzer et al., 2020) because it sets the mean residence (or sequestration) time of regenerated DIC. Figure C3 shows the Atlantic, Pacific, and Indian Ocean zonal mean Γ↑ for the preindustrial and perpetual-2090s states. (Re-exposure times are calculated as in the work by Holzer et al., 2020, who considered only the RCP8.5 scenario.) Γ↑ increases greatly (by up to 600 and 1200 years for the RCP4.5 and RCP8.5 scenarios, respectively). At first glance, the RCP8.5 response may appear to be proportional to the RCP4.5 response, but on closer inspection, different patterns are visible, particularly in the Atlantic sector. These differences are consistent with the corresponding differences in MLD (Fig. C2).
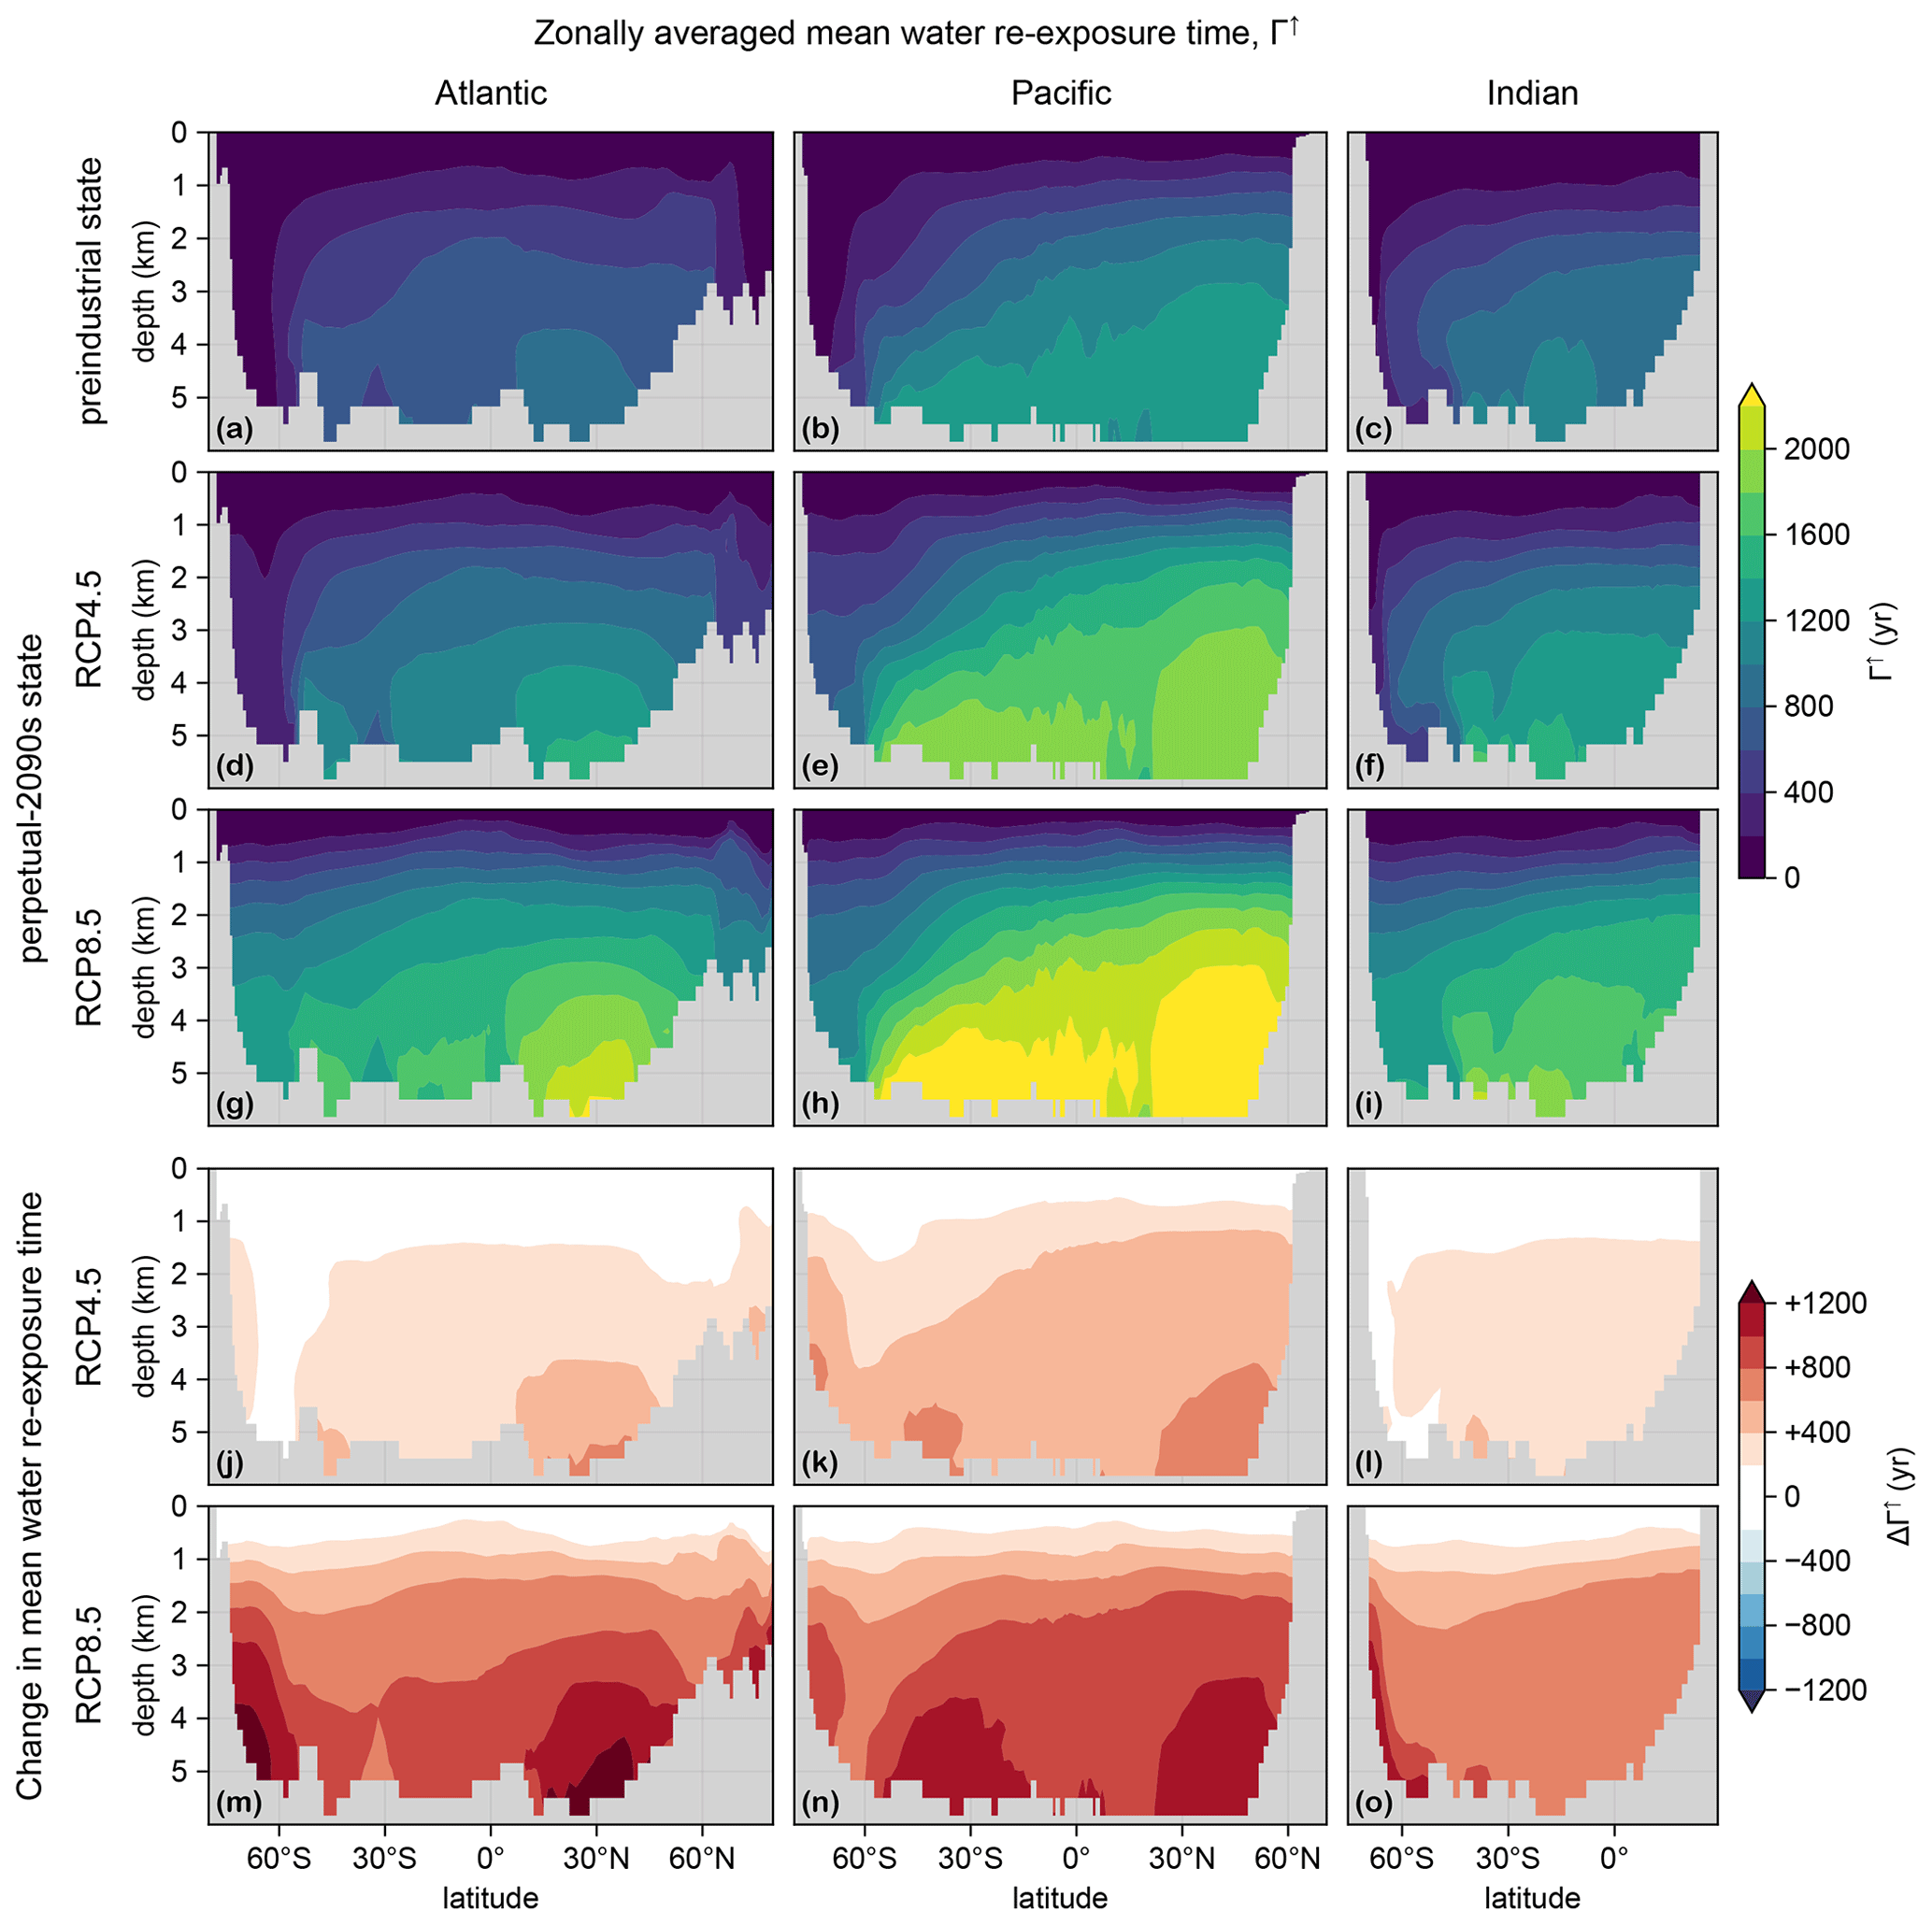
Figure C3(a–c) Mean water re-exposure time, Γ↑, for the preindustrial circulation, zonally averaged over the Atlantic (a), Pacific (b), and Indian Ocean (c). (d–f) As (a–c) but for the RCP4.5 state. (g–i) As (d–f) but for RCP8.5. (j–o) As (d–i) but for ΔΓ↑.
Figure D1 shows the production, U, for the preindustrial and perpetual-2090s states, along with the corresponding changes. Similarly, Fig. D2 shows the corresponding export ratios, f. As shown by Fig. 3, important contributions from export ratios occur in places where Δf and U are both large, and important contributions from production occur where f and ΔU are both large.
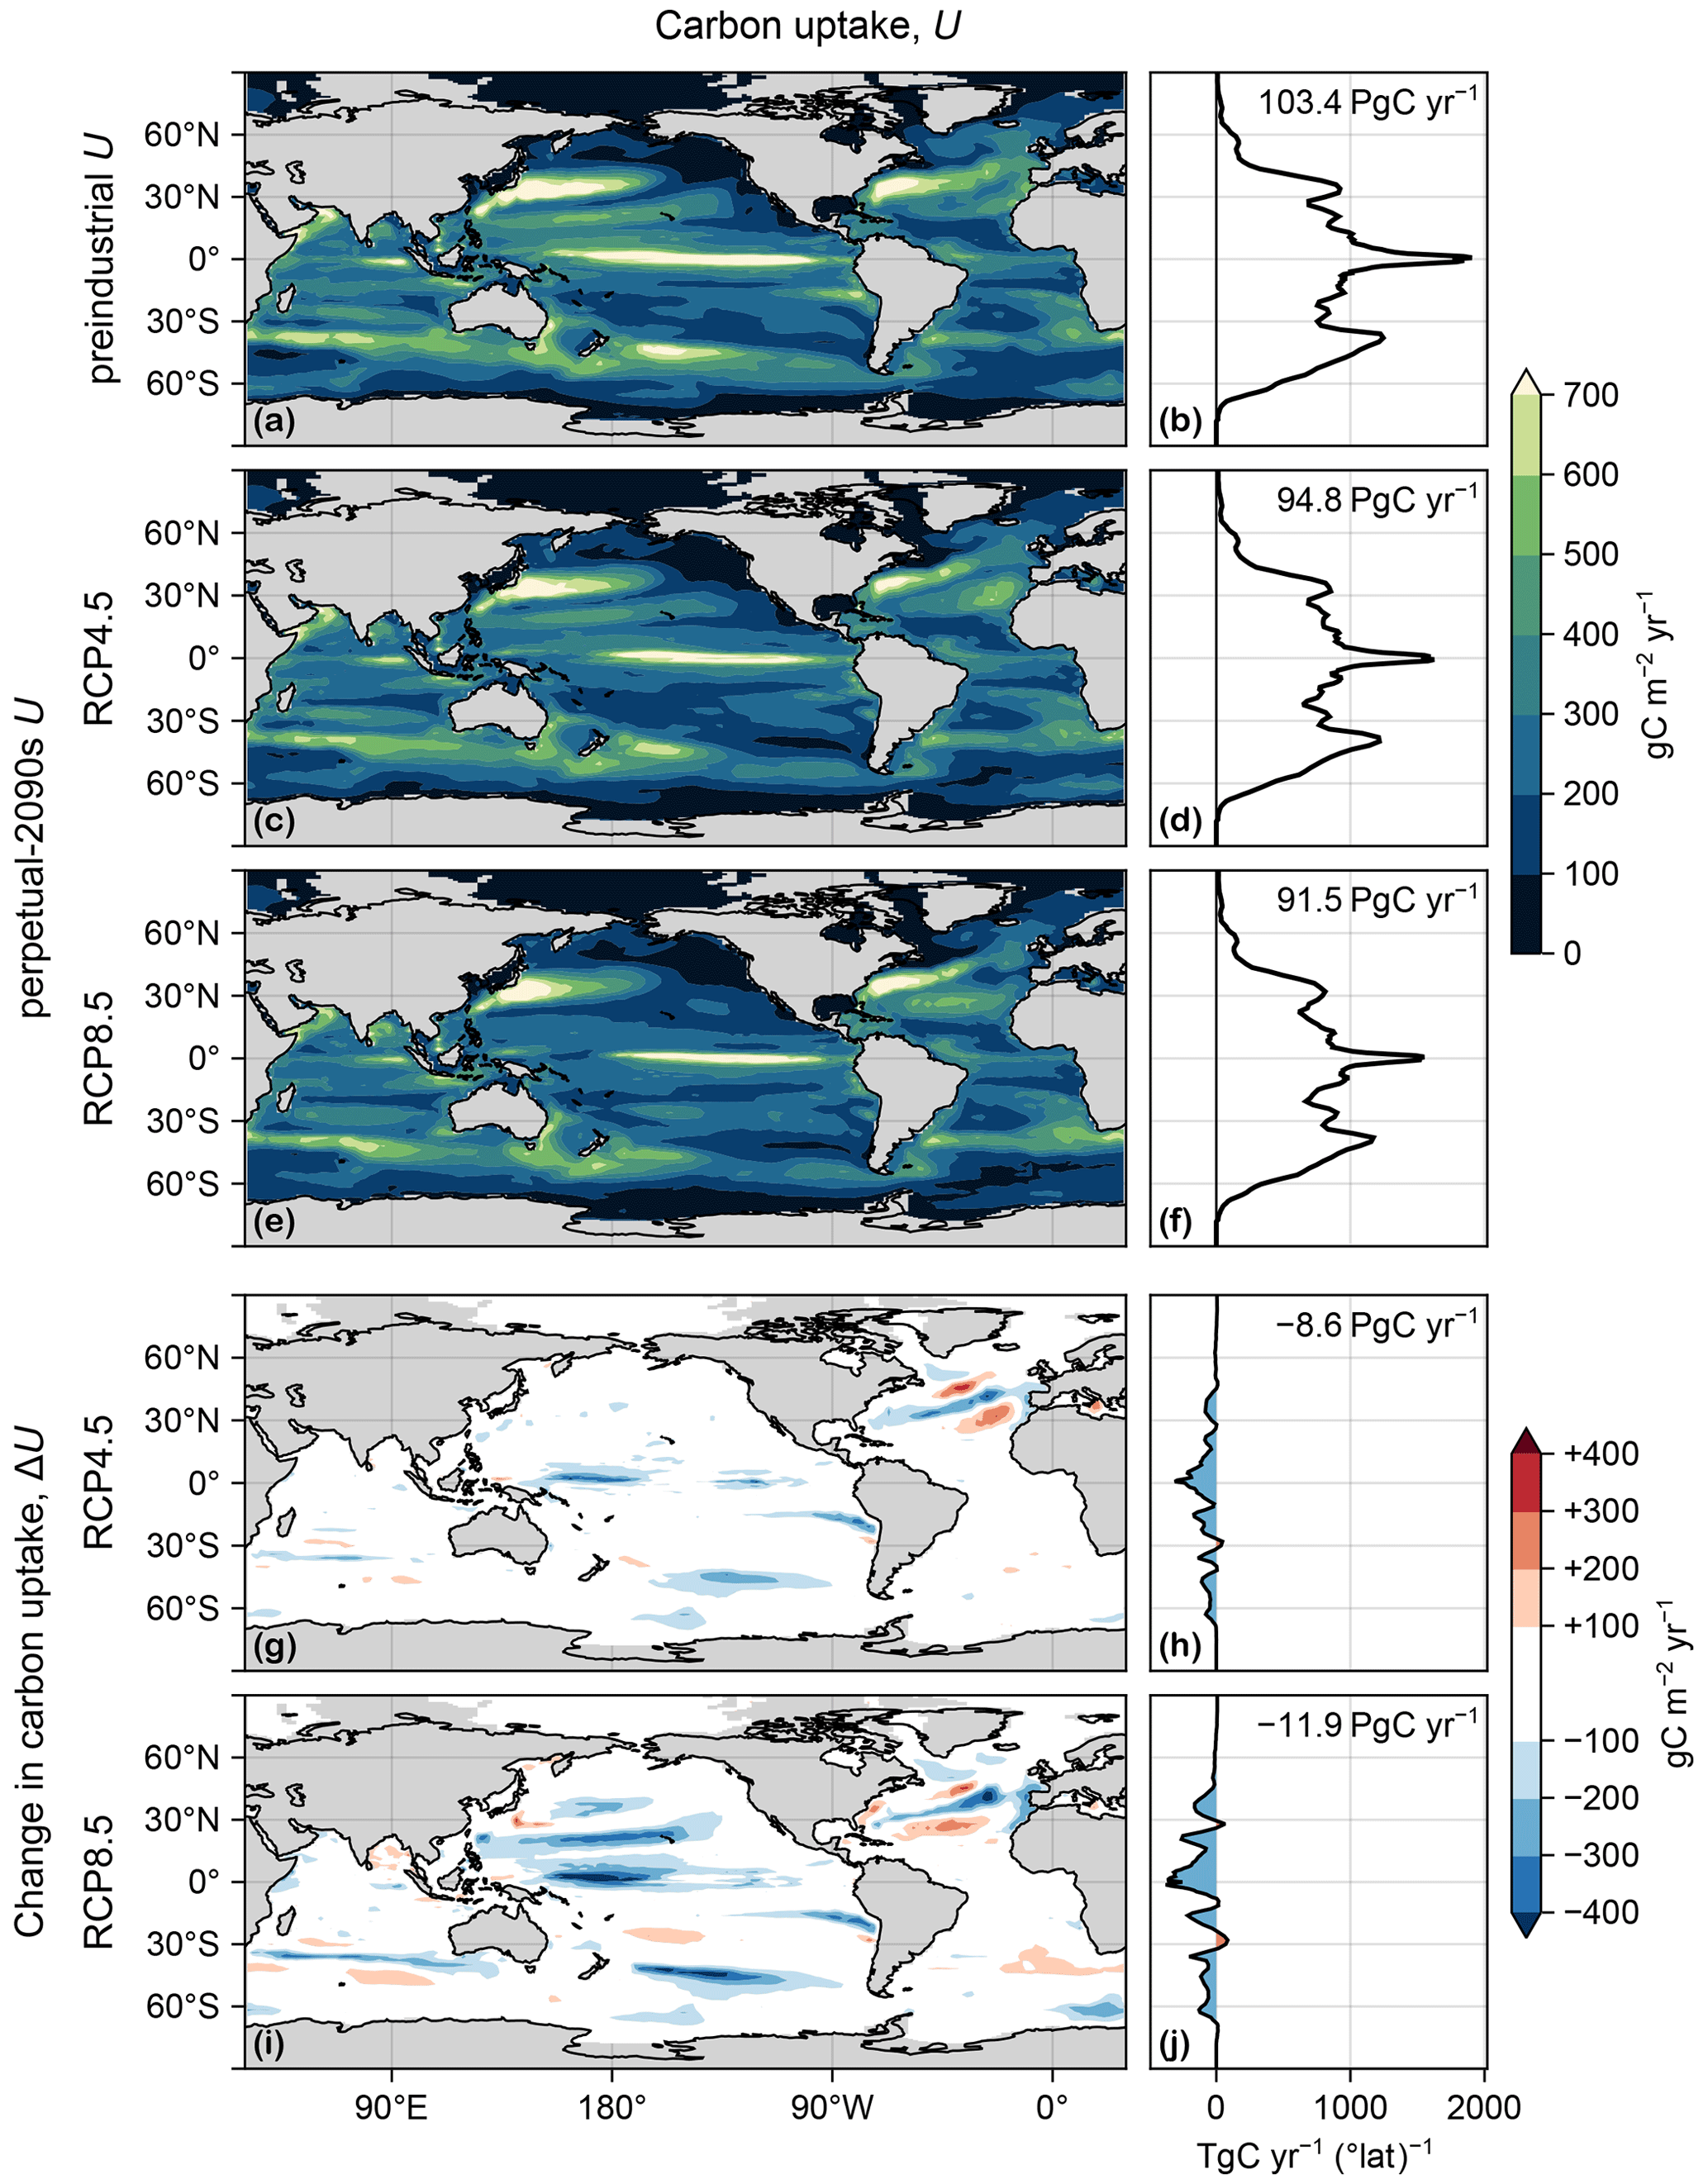
Figure D1(a) Map of carbon uptake, U(r), vertically integrated, in the preindustrial state. (b) Zonal integral of (a). (c, d) As (a, b) but for the RCP4.5-based perpetual-2090s state. (e, f) As (c, d) but for RCP8.5. (g–j) As (c–f) but for ΔU.
The changes in export production vary with mechanism, i.e., POCf, POCs, DOC, or PIC. The zonally integrated changes for each mechanism are shown in Fig. D3. For POCs export, changes are strongly dominated by export ratios, particularly in the tropics, likely because very little POCs makes it through the euphotic zone (f≈0), and thus ΔJex≈U Δf. In contrast, PIC export is entirely controlled by changes in production (ΔJex≈f ΔU; Fig. D3) because, in our model, its export ratio is unaffected by any environmental change (f≈0.97 and Δf≈0.001).
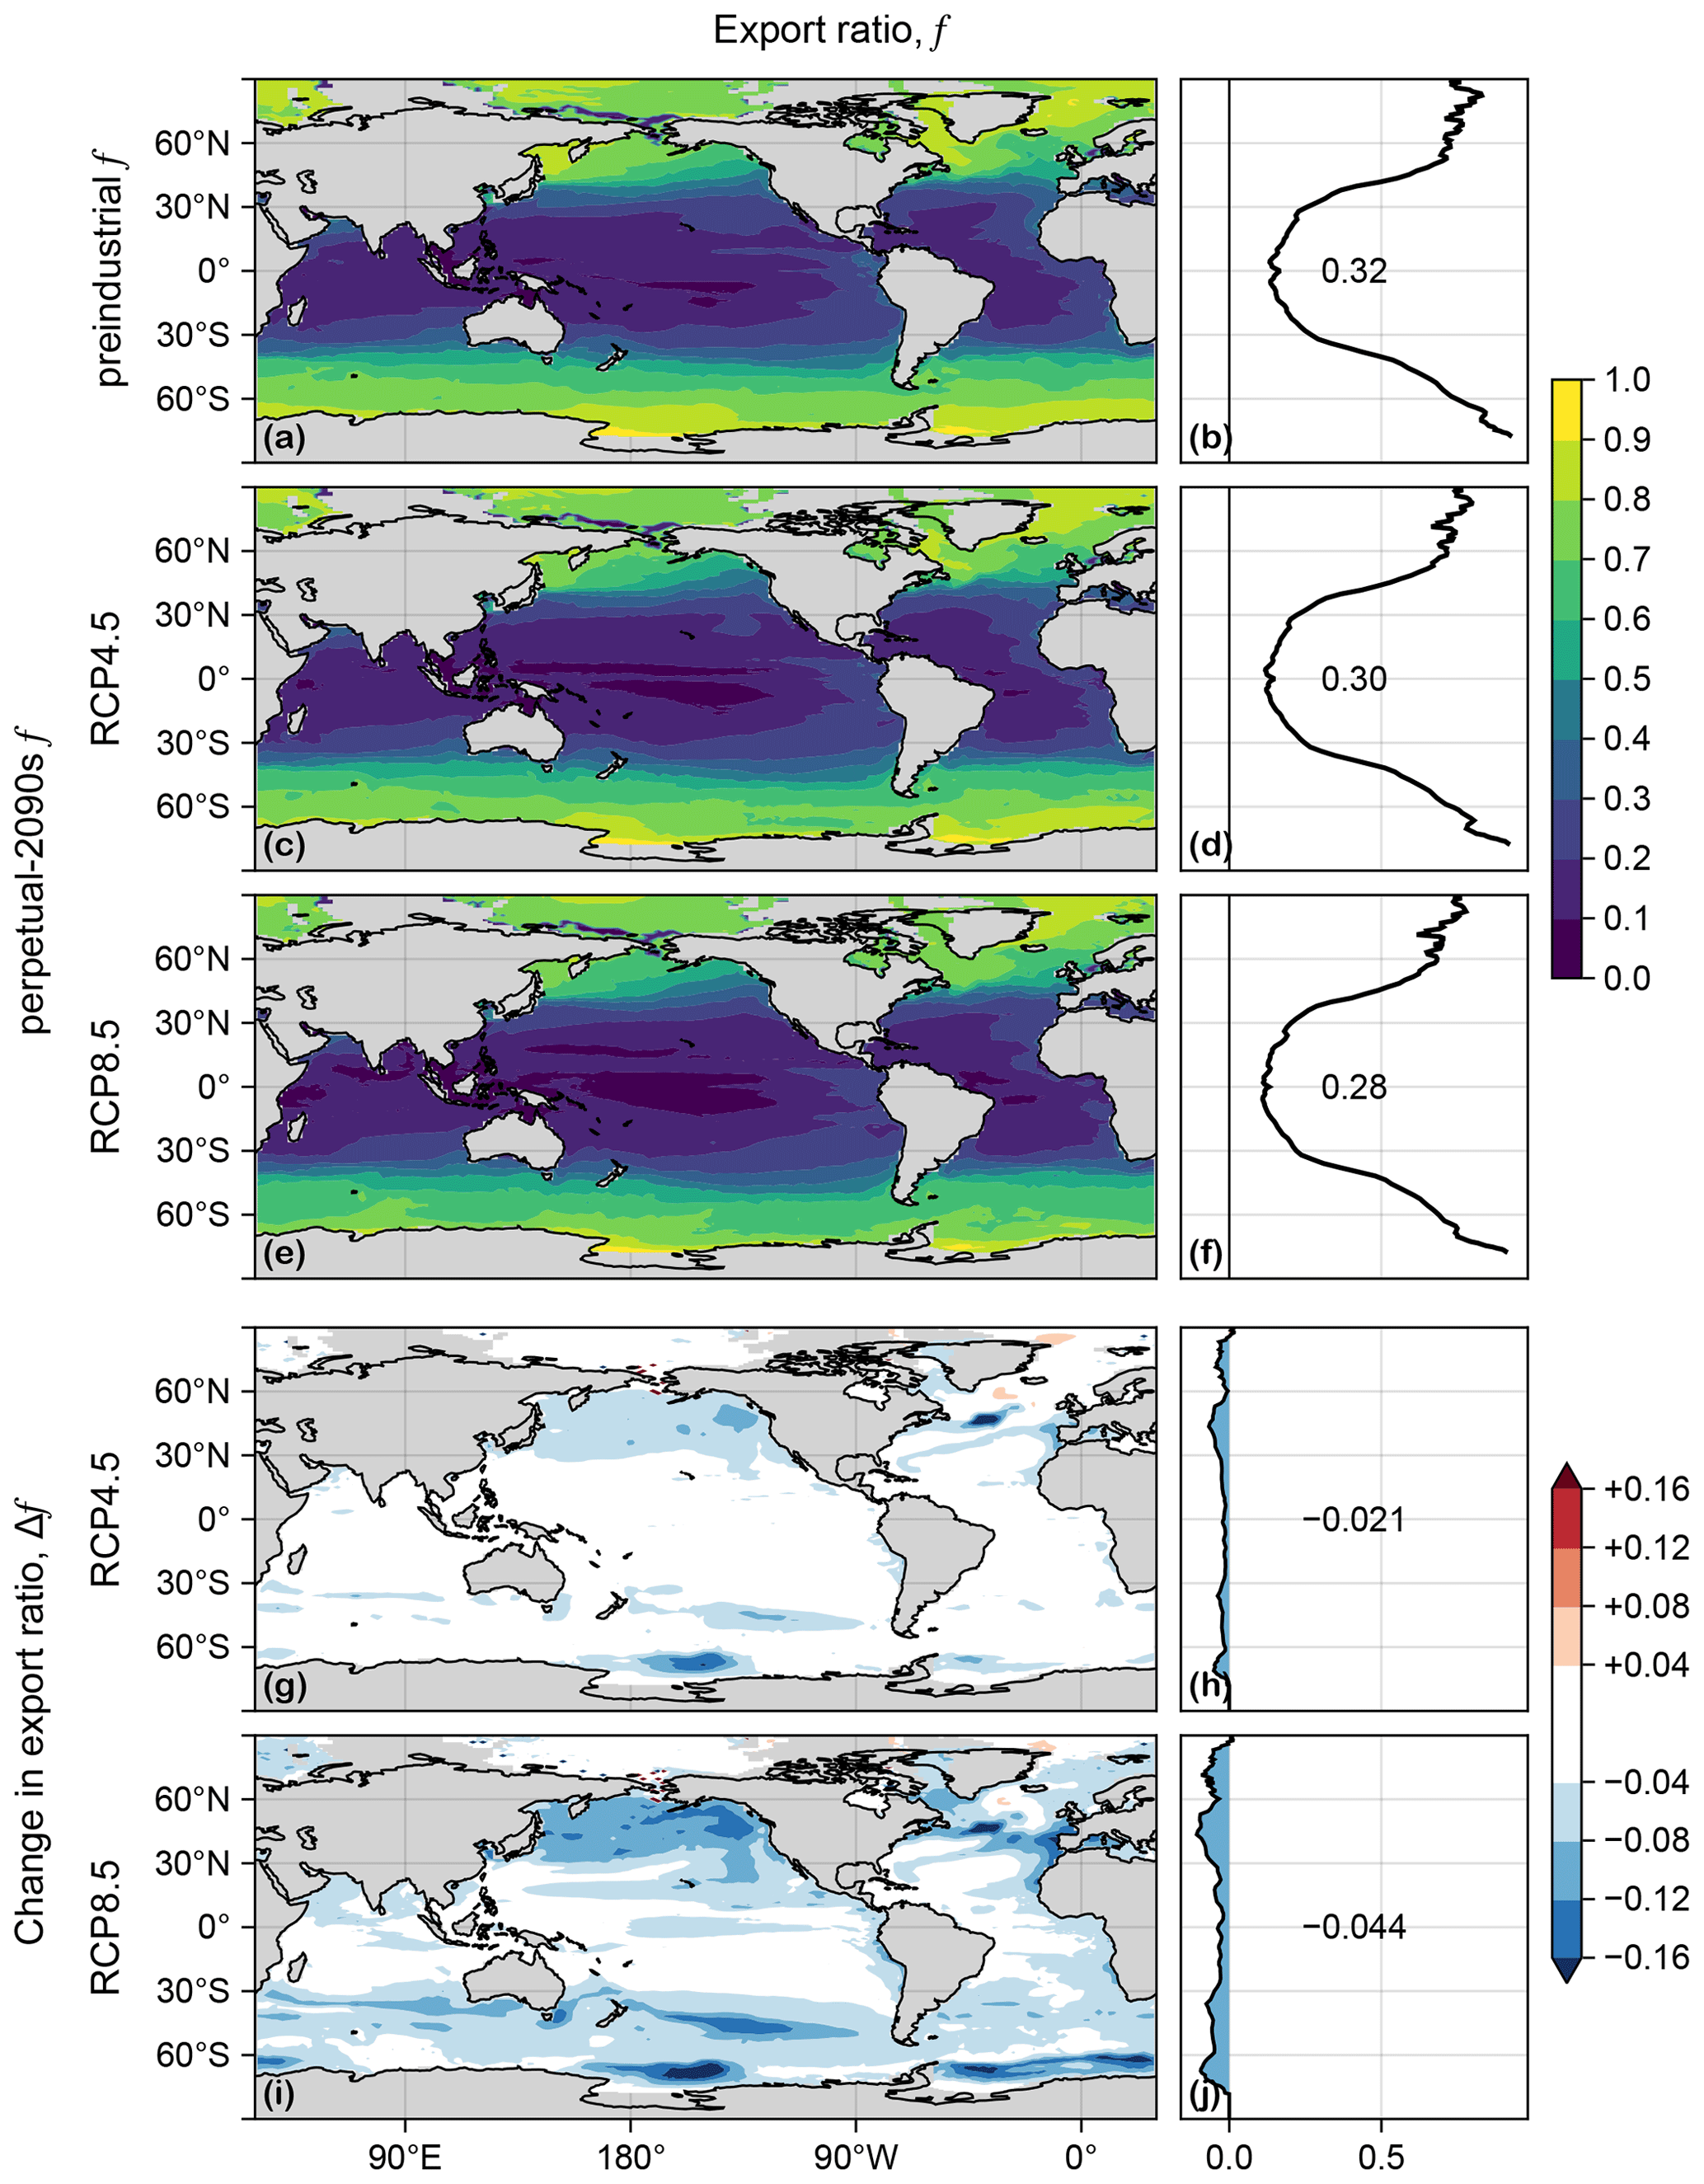
Figure D2(a) Map of export ratio, f, in the preindustrial state. (b) Zonal mean of (a). (c, d) As (a, b) but for the RCP4.5-based perpetual-2090s state. (e, f) As (c, d) but for RCP8.5. (g–j) As (c–f) but for Δf.
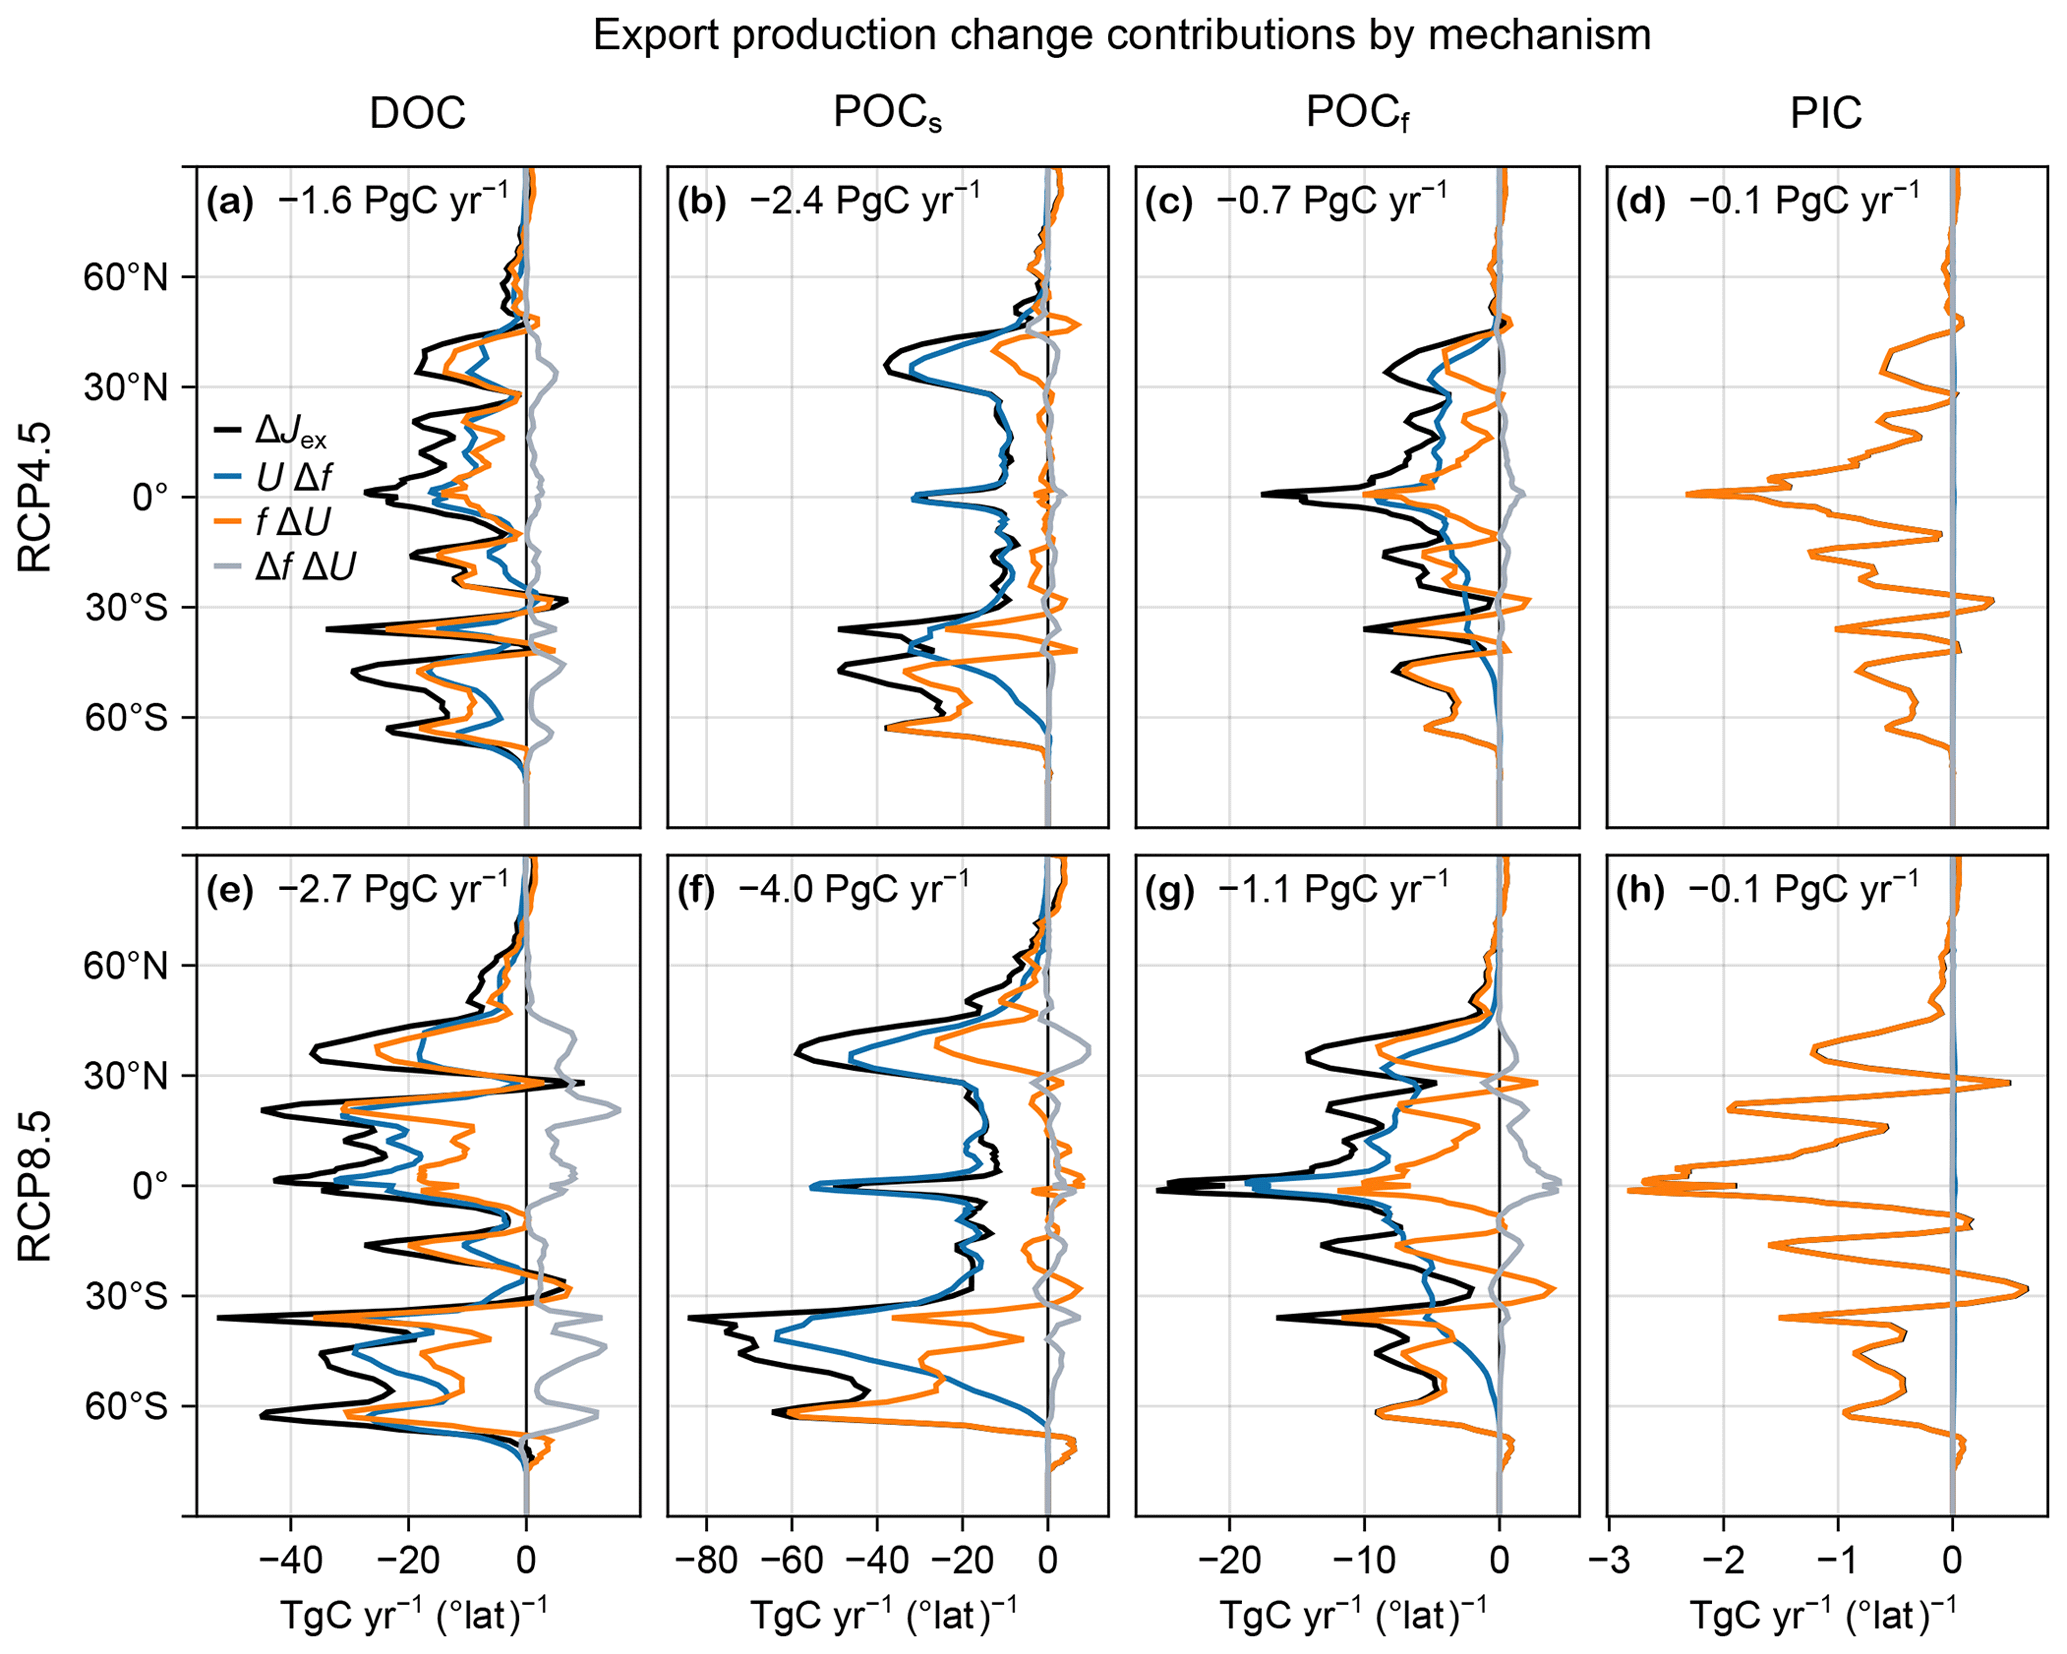
Figure D3(a–d) Change in DOC (a), POCs (b), POCf (c), and PIC (d) zonally integrated export production, ΔJex (black), for the RCP4.5-based perpetual-2090s state, decomposed into contributions from UΔf (blue), fΔU (orange), and Δf ΔU (gray). The globally integrated contribution to ΔJex is indicated in each panel. (e–h) As (a–d) but for RCP8.5.
The MATLAB and Julia code for this work is available at https://doi.org/10.5281/zenodo.11406528 (Pasquier, 2024). The figures were created in Julia (Bezanson et al., 2017) with the Makie.jl plotting package (Danisch and Krumbiegel, 2021). The transport matrices were built from the historical, RCP4.5, and RCP8.5 ACCESS1.3 CMIP5 model runs available at https://esgf.nci.org.au/projects/esgf-nci/ (last accessed July 2023; for more details on the ACCESS model used, see, e.g., Bi et al., 2013a; Bi et al., 2013b). This output also includes temperature, salinity, photosynthetically available radiation (PAR), sea ice, and wind fields.
BP and MH designed the study, analyzed the data, and wrote the manuscript with input from all co-authors. BP wrote the code, performed the experiments, and produced the figures with input from all co-authors.
The contact author has declared that none of the authors has any competing interests.
Publisher's note: Copernicus Publications remains neutral with regard to jurisdictional claims made in the text, published maps, institutional affiliations, or any other geographical representation in this paper. While Copernicus Publications makes every effort to include appropriate place names, the final responsibility lies with the authors.
We thank Yi Liu for helpful discussions. This work was supported by Australian Research Council grant DP210101650 (to MH) and undertaken with the assistance of resources and services from the National Computational Infrastructure (NCI), which is supported by the Australian Government.
This research has been supported by the Australian Research Council (grant no. DP210101650).
This paper was edited by Edouard Metzger and reviewed by two anonymous referees.
Arias, P., Bellouin, N., Coppola, E., Jones, R., Krinner, G., Marotzke, J., Naik, V., Palmer, M., Plattner, G.-K., Rogelj, J., Rojas, M., Sillmann, J., Storelvmo, T., Thorne, P., Trewin, B., Achuta Rao, K., Adhikary, B., Allan, R., Armour, K., Bala, G., Barimalala, R., Berger, S., Canadell, J., Cassou, C., Cherchi, A., Collins, W., Collins, W., Connors, S., Corti, S., Cruz, F., Dentener, F., Dereczynski, C., Di Luca, A., Diongue Niang, A., Doblas-Reyes, F., Dosio, A., Douville, H., Engelbrecht, F., Eyring, V., Fischer, E., Forster, P., Fox-Kemper, B., Fuglestvedt, J., Fyfe, J., Gillett, N., Goldfarb, L., Gorodetskaya, I., Gutierrez, J., Hamdi, R., Hawkins, E., Hewitt, H., Hope, P., Islam, A., Jones, C., Kaufman, D., Kopp, R., Kosaka, Y., Kossin, J., Krakovska, S., Lee, J.-Y., Li, J., Mauritsen, T., Maycock, T., Meinshausen, M., Min, S.-K., Monteiro, P., Ngo-Duc, T., Otto, F., Pinto, I., Pirani, A., Raghavan, K., Ranasinghe, R., Ruane, A., Ruiz, L., Sallée, J.-B., Samset, B., Sathyendranath, S., Seneviratne, S., Sörensson, A., Szopa, S., Takayabu, I., Tréguier, A.-M., van den Hurk, B., Vautard, R., von Schuckmann, K., Zaehle, S., Zhang, X., and Zickfeld, K.: echnical Summary, in: Climate Change 2021: The Physical Science Basis. Contribution of Working Group I to the Sixth Assessment Report of the Intergovernmental Panel on Climate Change, edited by: Masson-Delmotte, V., Zhai, P., Pirani, A., Connors, S., Péan, C., Berger, S., Caud, N., Chen, Y., Goldfarb, L., Gomis, M., Huang, M., Leitzell, K., Lonnoy, E., Matthews, J., Maycock, T., Waterfield, T., Yelekçi, O., Yu, R., and Zhou, B., Cambridge University Press, Cambridge, United Kingdom and New York, NY, USA, https://doi.org/10.1017/9781009157896.002, pp. 33–144, 2021. a, b
Arora, V. K., Katavouta, A., Williams, R. G., Jones, C. D., Brovkin, V., Friedlingstein, P., Schwinger, J., Bopp, L., Boucher, O., Cadule, P., Chamberlain, M. A., Christian, J. R., Delire, C., Fisher, R. A., Hajima, T., Ilyina, T., Joetzjer, E., Kawamiya, M., Koven, C. D., Krasting, J. P., Law, R. M., Lawrence, D. M., Lenton, A., Lindsay, K., Pongratz, J., Raddatz, T., Séférian, R., Tachiiri, K., Tjiputra, J. F., Wiltshire, A., Wu, T., and Ziehn, T.: Carbon–concentration and carbon–climate feedbacks in CMIP6 models and their comparison to CMIP5 models, Biogeosciences, 17, 4173–4222, https://doi.org/10.5194/bg-17-4173-2020, 2020. a
Bao, Y. and Li, Y.: Simulations of Dissolved Oxygen Concentration in CMIP5 Earth System Models, Acta Oceanol. Sin., 35, 28–37, https://doi.org/10.1007/s13131-016-0959-x, 2016. a
Bardin, A., Primeau, F. W., and Lindsay, K.: An offline implicit solver for simulating prebomb radiocarbon, Ocean Model., 73, 45–58, https://doi.org/10.1016/j.ocemod.2013.09.008, 2014. a
Bernardello, R., Marinov, I., Palter, J. B., Galbraith, E. D., and Sarmiento, J. L.: Impact of Weddell Sea deep convection on natural and anthropogenic carbon in a climate model, Geophys. Res. Lett., 41, 7262–7269, https://doi.org/10.1002/2014GL061313, 2014. a
Bezanson, J., Edelman, A., Karpinski, S., and Shah, V. B.: Julia: A Fresh Approach to Numerical Computing, SIAM Rev., 59, 65–98, https://doi.org/10.1137/141000671, 2017. a
Bi, D., Budd, W. F., Hirst, A. C., and Wu, X.: Collapse and Reorganisation of the Southern Ocean Overturning under Global Warming in a Coupled Model, Geophys. Res. Lett., 28, 3927–3930, https://doi.org/10.1029/2001GL013705, 2001. a
Bi, D., Marsland, S. J., Uotila, P., O'Farrell, S., Fiedler, R. A. S., Sullivan, A., Griffies, S. M., Zhou, X., and Hirst, A. C.: ACCESS-OM: The Ocean and Sea Ice Core of the ACCESS Coupled Model, Aust. Meteorol. Ocean., 63, 213–232, 2013a. a, b, c, d, e, f
Bi, D., Dix, M., Marsland, S., O'Farrell, S., Rashid, H., Uotila, P., Hirst, T., Kowalczyk, E., Golebiewski, M., Sullivan, A., Yan, H., Hannah, N., Franklin, C., Sun, Z., Vohralik, P., Watterson, I., Zhou, X., Fiedler, R., Collier, M., Ma, Y., Noonan, J., Stevens, L., Uhe, P., Zhu, H., Griffies, S., Hill, R., Harris, C., and Puri, K.: he ACCESS Coupled Model: Description, Control Climate and Evaluation, Austr. Meteorol. Oceanogr. J., 63, 41–64, https://doi.org/10.22499/2.6301.004, 213b. a
Bopp, L., Resplandy, L., Orr, J. C., Doney, S. C., Dunne, J. P., Gehlen, M., Halloran, P., Heinze, C., Ilyina, T., Séférian, R., Tjiputra, J., and Vichi, M.: Multiple stressors of ocean ecosystems in the 21st century: projections with CMIP5 models, Biogeosciences, 10, 6225–6245, https://doi.org/10.5194/bg-10-6225-2013, 2013. a, b, c, d
Bopp, L., Lévy, M., Resplandy, L., and Sallée, J. B.: Pathways of anthropogenic carbon subduction in the global ocean, Geophys. Res. Lett., 42, 6416–6423, https://doi.org/10.1002/2015GL065073, 2015. a
Boyd, P. W.: Toward quantifying the response of the oceans' biological pump to climate change, Front. Mar. Sci., 2, 77, https://doi.org/10.3389/fmars.2015.00077, 2015. a, b, c
Broecker, W. S.: Glacial to Interglacial Changes in Ocean Chemistry, Prog. Oceanogr., 11, 151–197, https://doi.org/10.1016/0079-6611(82)90007-6, 1982. a
Buesseler, K. O., Boyd, P. W., Black, E. E., and Siegel, D. A.: Metrics that matter for assessing the ocean biological carbon pump, P. Natl. Acad. Sci. USA, 117, 9679–9687, https://doi.org/10.1073/pnas.1918114117, 2020. a
Cael, B. B. and Follows, M. J.: On the temperature dependence of oceanic export efficiency, Geophys. Res. Lett., 43, 5170–5175, https://doi.org/10.1002/2016GL068877, 2016. a, b
Caesar, L., Rahmstorf, S., Robinson, A., Feulner, G., and Saba, V.: Observed Fingerprint of a Weakening Atlantic Ocean Overturning Circulation, Nature, 556, 191–196, https://doi.org/10.1038/s41586-018-0006-5, 2018. a
Chamberlain, M. A., Matear, R. J., Holzer, M., Bi, D., and Marsland, S. J.: Transport matrices from standard ocean-model output and quantifying circulation response to climate change, Ocean Model., 135, 1–13, https://doi.org/10.1016/j.ocemod.2019.01.005, 2019. a, b, c
Cheng, L., von Schuckmann, K., Abraham, J. P., Trenberth, K. E., Mann, M. E., Zanna, L., England, M. H., Zika, J. D., Fasullo, J. T., Yu, Y., Pan, Y., Zhu, J., Newsom, E. R., Bronselaer, B., and Lin, X.: Past and Future Ocean Warming, Nature Reviews Earth & Environment, 3, 776–794, https://doi.org/10.1038/s43017-022-00345-1, 2022. a
Costello, C., Cao, L., Gelcich, S., Cisneros-Mata, M. Á., Free, C. M., Froehlich, H. E., Golden, C. D., Ishimura, G., Maier, J., Macadam-Somer, I., Mangin, T., Melnychuk, M. C., Miyahara, M., de Moor, C. L., Naylor, R., Nøstbakken, L., Ojea, E., O'Reilly, E., Parma, A. M., Plantinga, A. J., Thilsted, S. H., and Lubchenco, J.: The Future of Food from the Sea, Nature, 588, 95–100, https://doi.org/10.1038/s41586-020-2616-y, 2020. a
Danisch, S. and Krumbiegel, J.: Makie.jl: Flexible High-Performance Data Visualization for Julia, Journal of Open Source Software, 6, 3349, https://doi.org/10.21105/joss.03349, 2021. a
de Lavergne, C., Palter, J. B., Galbraith, E. D., Bernardello, R., and Marinov, I.: Cessation of Deep Convection in the Open Southern Ocean under Anthropogenic Climate Change, Nat. Clim. Change, 4, 278–282, https://doi.org/10.1038/nclimate2132, 2014. a
DeVries, T.: The Ocean Carbon Cycle, Annu. Rev. Env. Resour., 47, 317–341, https://doi.org/10.1146/annurev-environ-120920-111307, 2022. a
DeVries, T. and Holzer, M.: Radiocarbon and Helium Isotope Constraints on Deep Ocean Ventilation and Mantle-3He Sources, J. Geophys. Res.-Oceans, 124, 3036–3057, https://doi.org/10.1029/2018JC014716, 2019. a
DeVries, T., Primeau, W. F., and Deutsch, C.: The sequestration efficiency of the biological pump, Geophys. Res. Lett., 39, L13601, https://doi.org/10.1029/2012GL051963, 2012. a
Doney, S. C., Fabry, V. J., Feely, R. A., and Kleypas, J. A.: Ocean Acidification: The Other CO2 Problem, Annu. Rev. Mar. Sci., 1, 169–192, https://doi.org/10.1146/annurev.marine.010908.163834, pMID: 21141034, 2009. a, b
FAO: The State of World Fisheries and Aquaculture 2018 – Meeting the sustainable development goals, Food and Agriculture Organization of the United Nations FAO, ISBN: 978-92-5-130562-1, 2018. a
Fu, W., Moore, J. K., Primeau, F., Collier, N., Ogunro, O. O., Hoffman, F. M., and Randerson, J. T.: Evaluation of Ocean Biogeochemistry and Carbon Cycling in CMIP Earth System Models With the International Ocean Model Benchmarking (IOMB) Software System, J. Geophys. Res.-Oceans, 127, e2022JC018965, https://doi.org/10.1029/2022JC018965, 2022. a
Galbraith, E. D. and Martiny, A. C.: A simple nutrient-dependence mechanism for predicting the stoichiometry of marine ecosystems, P. Natl. Acad. Sci. USA, 112, 8199–8204, https://doi.org/10.1073/pnas.1423917112, 2015. a, b
Gent, P. R., Willebrand, J., McDougall, T. J., and McWilliams, J. C.: Parameterizing eddy-induced tracer transports in ocean circulation models, J. Phys. Oceanogr., 25, 463–474, https://doi.org/10.1175/1520-0485(1995)025<0463:PEITTI>2.0.CO;2, 1995. a
Golden, C.: Fall in fish catch threatens human health, Nature, 534, 317–320, 2016. a
Griffiths, J. R., Kadin, M., Nascimento, F. J. A., Tamelander, T., Törnroos, A., Bonaglia, S., Bonsdorff, E., Brüchert, V., Gårdmark, A., Järnström, M., Kotta, J., Lindegren, M., Nordström, M. C., Norkko, A., Olsson, J., Weigel, B., Žydelis, R., Blenckner, T., Niiranen, S., and Winder, M.: The Importance of Benthic–Pelagic Coupling for Marine Ecosystem Functioning in a Changing World, Glob. Change Biol., 23, 2179–2196, https://doi.org/10.1111/gcb.13642, 2017. a
Hall, T. M. and Holzer, M.: Advective-diffusive mass flux and implications for stratosphere-troposphere exchange, Geophys. Res. Lett., 30, 1222, https://doi.org/10.1029/2002GL016419, 2003. a
Hauck, J., Völker, C., Wolf-Gladrow, D. A., Laufkötter, C., Vogt, M., Aumont, O., Bopp, L., Buitenhuis, E. T., Doney, S. C., Dunne, J., Gruber, N., Hashioka, T., John, J., Le Quéré, C., Lima, I. D., Nakano, H., Séférian, R., and Totterdell, I.: On the Southern Ocean CO2 uptake and the role of the biological carbon pump in the 21st century, Global Biogeochem. Cy., 29, 1451–1470, https://doi.org/10.1002/2015GB005140, 2015. a, b, c
Helm, K. P., Bindoff, N. L., and Church, J. A.: Observed decreases in oxygen content of the global ocean, Geophys. Res. Lett., 38, L23602, https://doi.org/10.1029/2011GL049513, 2011. a
Henson, S. A., Laufkötter, C., Leung, S., Giering, S. L. C., Palevsky, H. I., and Cavan, E. L.: Uncertain Response of Ocean Biological Carbon Export in a Changing World, Nat. Geosci., 15, 248–254, https://doi.org/10.1038/s41561-022-00927-0, 2022. a, b, c, d, e
Holzer, M. and DeVries, T.: Source-labeled anthropogenic carbon reveals a large shift of preindustrial carbon from the ocean to the atmosphere, Global Biogeochem. Cy., 36, e2022GB007405, https://doi.org/10.1029/2022GB007405, 2022. a, b
Holzer, M. and Primeau, F. W.: Improved Constraints on Transit Time Distributions from Argon 39: A Maximum Entropy Approach, J. Geophys. Res.-Oceans, 115, C12021, https://doi.org/10.1029/2010JC006410, 2010. a
Holzer, M. and Primeau, F. W.: Global teleconnections in the oceanic phosphorus cycle: patterns, paths, and timescales, J. Geophys. Res.-Oceans, 118, 1775–1796, https://doi.org/10.1002/jgrc.20072, 2013. a, b
Holzer, M., Primeau, F. W., DeVries, T., and Matear, R.: The Southern Ocean silicon trap: Data-constrained estimates of regenerated silicic acid, trapping efficiencies, and global transport paths, J. Geophys. Res.-Oceans, 119, 313–331, https://doi.org/10.1002/2013JC009356, 2014. a
Holzer, M., Chamberlain, M. A., and Matear, R. J.: Climate-Driven Changes in the Ocean's Ventilation Pathways and Time Scales Diagnosed From Transport Matrices, J. Geophys. Res.-Oceans, 125, e2020JC016414, https://doi.org/10.1029/2020JC016414, 2020. a, b, c, d, e
Holzer, M., DeVries, T., and de Lavergne, C.: Diffusion controls the ventilation of a Pacific Shadow Zone above abyssal overturning, Nat. Commun., 12, 4348, https://doi.org/10.1038/s41467-021-24648-x, 2021a. a
Holzer, M., Kwon, E. Y., and Pasquier, B.: A New Metric of the Biological Carbon Pump: Number of Pump Passages and Its Control on Atmospheric pCO2, Global Biogeochem. Cy., 35, e2020GB006863, https://doi.org/10.1029/2020GB006863, 2021b. a, b, c
Huang, Q., Primeau, F. W., and DeVries, T.: CYCLOCIM: A 4-D variational assimilation system for the climatological mean seasonal cycle of the ocean circulation, Ocean Model., 159, 101762, https://doi.org/0.1016/j.ocemod.2021.101762, 2021. a
Irving, D., Hobbs, W., Church, J., and Zika, J.: A Mass and Energy Conservation Analysis of Drift in the CMIP6 Ensemble, J. Climate, 34, 3157 – 3170, https://doi.org/10.1175/JCLI-D-20-0281.1, 2021. a
Ito, T. and Follows, M. J.: Preformed phosphate, soft tissue pump and atmospheric CO2, J. Mar. Res., 63, 813–839, 2005. a, b
Ito, T., Bracco, A., Deutsch, C., Frenzel, H., Long, M., and Takano, Y.: Sustained growth of the Southern Ocean carbon storage in a warming climate, Geophys. Res. Lett., 42, 4516–4522, https://doi.org/10.1002/2015GL064320, 2015. a, b, c, d
Jansen, M. F. and Nadeau, L.-P.: A Toy Model for the Response of the Residual Overturning Circulation to Surface Warming, J. Phys. Oceanogr., 49, 1249–1268, https://doi.org/10.1175/JPO-D-18-0187.1, 2019. a
Jickells, T. D., An, Z. S., Andersen, K. K., Baker, A. R., Bergametti, G., Brooks, N., Cao, J. J., Boyd, P. W., Duce, R. A., Hunter, K. A., Kawahata, H., Kubilay, N., laRoche, J., Liss, P. S., Mahowald, N., Prospero, J. M., Ridgwell, A. J., Tegen, I., and Torres, R.: Global Iron Connections Between Desert Dust, Ocean Biogeochemistry, and Climate, Science, 308, 67–71, https://doi.org/10.1126/science.1105959, 2005. a
Kriest, I.: Calibration of a simple and a complex model of global marine biogeochemistry, Biogeosciences, 14, 4965–4984, https://doi.org/10.5194/bg-14-4965-2017, 2017. a
Kriest, I., Kähler, P., Koeve, W., Kvale, K., Sauerland, V., and Oschlies, A.: One size fits all? Calibrating an ocean biogeochemistry model for different circulations, Biogeosciences, 17, 3057–3082, https://doi.org/10.5194/bg-17-3057-2020, 2020. a
Kwiatkowski, L., Torres, O., Bopp, L., Aumont, O., Chamberlain, M., Christian, J. R., Dunne, J. P., Gehlen, M., Ilyina, T., John, J. G., Lenton, A., Li, H., Lovenduski, N. S., Orr, J. C., Palmieri, J., Santana-Falcón, Y., Schwinger, J., Séférian, R., Stock, C. A., Tagliabue, A., Takano, Y., Tjiputra, J., Toyama, K., Tsujino, H., Watanabe, M., Yamamoto, A., Yool, A., and Ziehn, T.: Twenty-first century ocean warming, acidification, deoxygenation, and upper-ocean nutrient and primary production decline from CMIP6 model projections, Biogeosciences, 17, 3439–3470, https://doi.org/10.5194/bg-17-3439-2020, 2020. a, b
Kwon, E. Y., Holzer, M., Timmermann, A., and Primeau, F. W.: Estimating three-dimensional carbon-to-phosphorus stoichiometry of exported marine organic matter, Global Biogeochem. Cy., 36, e2021GB007154, https://doi.org/10.1029/2021GB007154, 2022. a
Laws, E. A., Falkowski, P. G., Smith Jr., W. O., Ducklow, H., and McCarthy, J. J.: Temperature effects on export production in the open ocean, Global Biogeochem. Cy., 14, 1231–1246, https://doi.org/10.1029/1999GB001229, 2000. a
Laws, E. A., D'Sa, E., and Naik, P.: Simple equations to estimate ratios of new or export production to total production from satellite-derived estimates of sea surface temperature and primary production, Limnol. Oceanogr.-Meth., 9, 593–601, https://doi.org/10.4319/lom.2011.9.593, 2011. a
Lewis, E. R. and Wallace, D. W. R.: Program Developed for CO2 System Calculations, ORNL/CDIAC-105, Carbon Dioxide Information Analysis Center, Oak Ridge National Laboratory, Oak Ridge, TN, https://doi.org/10.15485/1464255, 1998. a
Li, G., Cheng, L., Zhu, J., Trenberth, K. E., Mann, M. E., and Abraham, J. P.: Increasing Ocean Stratification over the Past Half-Century, Nat. Clim. Change, 10, 1116–1123, https://doi.org/10.1038/s41558-020-00918-2, 2020. a
Li, Q., England, M. H., Hogg, A. M., Rintoul, S. R., and Morrison, A. K.: Abyssal Ocean Overturning Slowdown and Warming Driven by Antarctic Meltwater, Nature, 615, 841–847, https://doi.org/10.1038/s41586-023-05762-w, 2023. a
Liu, Y., Moore, J. K., Primeau, F., and Wang, W. L.: Reduced CO2 Uptake and Growing Nutrient Sequestration from Slowing Overturning Circulation, Nat. Clim. Change, 13, 83–90, https://doi.org/10.1038/s41558-022-01555-7, 2023. a, b, c, d, e, f, g, h, i, j, k, l, m
Lomas, M. W., Bates, N. R., Johnson, R. J., Steinberg, D. K., and Tanioka, T.: Adaptive Carbon Export Response to Warming in the Sargasso Sea, Nat. Commun., 13, 1211, https://doi.org/10.1038/s41467-022-28842-3, 2022. a
Matear, R. J. and Hirst, A. C.: Climate change feedback on the future oceanic CO2 uptake, Tellus B, 51, 722–733, https://doi.org/10.1034/j.1600-0889.1999.t01-1-00012.x, 1999. a
Meinshausen, M., Smith, S. J., Calvin, K., Daniel, J. S., Kainuma, M. L. T., Lamarque, J.-F., Matsumoto, K., Montzka, S. A., Raper, S. C. B., Riahi, K., Thomson, A., Velders, G. J. M., and van Vuuren, D. P.: The RCP Greenhouse Gas Concentrations and Their Extensions from 1765 to 2300, Climatic Change, 109, 213, https://doi.org/10.1007/s10584-011-0156-z, 2011. a, b
Meinshausen, M., Nicholls, Z. R. J., Lewis, J., Gidden, M. J., Vogel, E., Freund, M., Beyerle, U., Gessner, C., Nauels, A., Bauer, N., Canadell, J. G., Daniel, J. S., John, A., Krummel, P. B., Luderer, G., Meinshausen, N., Montzka, S. A., Rayner, P. J., Reimann, S., Smith, S. J., van den Berg, M., Velders, G. J. M., Vollmer, M. K., and Wang, R. H. J.: The shared socio-economic pathway (SSP) greenhouse gas concentrations and their extensions to 2500, Geosci. Model Dev., 13, 3571–3605, https://doi.org/10.5194/gmd-13-3571-2020, 2020. a
Moore, J. K., Fu, W., Primeau, F. W., Britten, G. L., Lindsay, K., Long, M., Doney, S. C., Mahowald, N., Hoffman, F., and Randerson, J. T.: Sustained climate warming drives declining marine biological productivity, Science, 359, 1139–1143, https://doi.org/10.1126/science.aao6379, 2018. a, b, c, d
Murnane, R. J., Sarmiento, J. L., and Le Quéré, C.: Spatial distribution of air–sea CO2 fluxes and the interhemispheric transport of carbon by the oceans, Global Biogeochem. Cy., 13, 287–305, https://doi.org/10.1029/1998GB900009, 1999. a, b
Palter, J. B., Sarmiento, J. L., Gnanadesikan, A., Simeon, J., and Slater, R. D.: Fueling export production: nutrient return pathways from the deep ocean and their dependence on the Meridional Overturning Circulation, Biogeosciences, 7, 3549–3568, https://doi.org/10.5194/bg-7-3549-2010, 2010. a
Pasquier, B.: Code for The Ocean's Biological and Preformed Carbon Pumps in Perpetually Slower and Warmer Oceans, Zenodo [code], https://doi.org/10.5281/zenodo.11406528, 2024. a
Pasquier, B. and Holzer, M.: The plumbing of the global biological pump: Efficiency control through leaks, pathways, and time scales, J. Geophys. Res.-Oceans, 121, 6367–6388, https://doi.org/10.1002/2016JC011821, 2016. a, b, c
Pasquier, B. and Holzer, M.: The number of past and future regenerations of iron in the ocean and its intrinsic fertilization efficiency, Biogeosciences, 15, 7177–7203, https://doi.org/10.5194/bg-15-7177-2018, 2018. a
Pasquier, B., Holzer, M., Chamberlain, M. A., Matear, R. J., Bindoff, N. L., and Primeau, F. W.: Optimal parameters for the ocean's nutrient, carbon, and oxygen cycles compensate for circulation biases but replumb the biological pump, Biogeosciences, 20, 2985–3009, https://doi.org/10.5194/bg-20-2985-2023, 2023. a, b, c, d, e, f, g, h, i, j, k, l, m, n
Passow, U. and Carlson, C. A.: The Biological Pump in a High CO2 World, Mar. Ecol. Prog. Ser., 470, 249–271, https://doi.org/10.3354/meps09985, 2012. a
Planchat, A., Kwiatkowski, L., Bopp, L., Torres, O., Christian, J. R., Butenschön, M., Lovato, T., Séférian, R., Chamberlain, M. A., Aumont, O., Watanabe, M., Yamamoto, A., Yool, A., Ilyina, T., Tsujino, H., Krumhardt, K. M., Schwinger, J., Tjiputra, J., Dunne, J. P., and Stock, C.: The representation of alkalinity and the carbonate pump from CMIP5 to CMIP6 Earth system models and implications for the carbon cycle, Biogeosciences, 20, 1195–1257, https://doi.org/10.5194/bg-20-1195-2023, 2023. a
Plattner, G.-K., Joos, F., Stocker, T. F., and Marchal, O.: Feedback mechanisms and sensitivities of ocean carbon uptake under global warming, Tellus B, 53, 564–592, https://doi.org/10.3402/tellusb.v53i5.16637, 2001. a, b
Primeau, F. W.: Characterizing Transport between the Surface Mixed Layer and the Ocean Interior with a Forward and Adjoint Global Ocean Transport Model, J. Phys. Oceanogr., 35, 545–564, https://doi.org/10.1175/JPO2699.1, 2005. a, b, c
Primeau, F. W. and Holzer, M.: The Ocean's Memory of the Atmosphere: Residence-Time and Ventilation-Rate Distributions of Water Masses, J. Phys. Oceanogr., 36, 1439–1456, https://doi.org/10.1175/JPO2919.1, 2006. a, b
Primeau, F. W., Holzer, M., and DeVries, T.: Southern Ocean nutrient trapping and the efficiency of the biological pump, J. Geophys. Res.-Oceans, 118, 2547–2564, https://doi.org/10.1002/jgrc.20181, 2013. a, b
Purich, A. and England, M. H.: Projected Impacts of Antarctic Meltwater Anomalies over the Twenty-First Century, J. Climate, 36, 2703–2719, https://doi.org/10.1175/JCLI-D-22-0457.1, 2023. a
Purich, A., England, M. H., Cai, W., Sullivan, A., and Durack, P. J.: Impacts of Broad-Scale Surface Freshening of the Southern Ocean in a Coupled Climate Model, J. Climate, 31, 2613–2632, https://doi.org/10.1175/JCLI-D-17-0092.1, 2018. a
Raven, J. A. and Falkowski, P. G.: Oceanic sinks for atmospheric CO2, Plant Cell Environ., 22, 741–755, https://doi.org/10.1046/j.1365-3040.1999.00419.x, 1999. a
Revelle, R. and Suess, H. E.: Carbon Dioxide Exchange Between Atmosphere and Ocean and the Question of an Increase of Atmospheric CO2 during the Past Decades, Tellus, 9, 18–27, https://doi.org/10.3402/tellusa.v9i1.9075, 1957. a
Riahi, K., van Vuuren, D. P., Kriegler, E., Edmonds, J., O'Neill, B. C., Fujimori, S., Bauer, N., Calvin, K., Dellink, R., Fricko, O., Lutz, W., Popp, A., Cuaresma, J. C., KC, S., Leimbach, M., Jiang, L., Kram, T., Rao, S., Emmerling, J., Ebi, K., Hasegawa, T., Havlik, P., Humpenöder, F., Da Silva, L. A., Smith, S., Stehfest, E., Bosetti, V., Eom, J., Gernaat, D., Masui, T., Rogelj, J., Strefler, J., Drouet, L., Krey, V., Luderer, G., Harmsen, M., Takahashi, K., Baumstark, L., Doelman, J. C., Kainuma, M., Klimont, Z., Marangoni, G., Lotze-Campen, H., Obersteiner, M., Tabeau, A., and Tavoni, M.: The Shared Socioeconomic Pathways and their energy, land use, and greenhouse gas emissions implications: An overview, Global Environ. Chang., 42, 153–168, https://doi.org/10.1016/j.gloenvcha.2016.05.009, 2017. a
Riebesell, U., Körtzinger, A., and Oschlies, A.: Sensitivities of marine carbon fluxes to ocean change, P. Natl. Acad. Sci. USA, 106, 20602–20609, https://doi.org/10.1073/pnas.0813291106, 2009. a, b, c, d
Sarmiento, J. L. and Le Quéré, C.: Oceanic Carbon Dioxide Uptake in a Model of Century-Scale Global Warming, Science, 274, 1346–1350, https://doi.org/10.1126/science.274.5291.1346, 1996. a, b
Sarmiento, J. L., Hughes, T. M. C., Stouffer, R. J., and Manabe, S.: Simulated Response of the Ocean Carbon Cycle to Anthropogenic Climate Warming, Nature, 393, 245–249, https://doi.org/10.1038/30455, 1998. a
Sarmiento, J. L., Gruber, N., Brzezinski, M. A., and Dunne, J. P.: High-Latitude Controls of Thermocline Nutrients and Low Latitude Biological Productivity, Nature, 427, 56–60, https://doi.org/10.1038/nature02127, 2004. a
Schmittner, A., Oschlies, A., Matthews, H. D., and Galbraith, E. D.: Future changes in climate, ocean circulation, ecosystems, and biogeochemical cycling simulated for a business-as-usual CO2 emission scenario until year 4000 AD, Global Biogeochem. Cy., 22, https://doi.org/10.1029/2007GB002953, 2008. a, b
Sweetman, A. K., Thurber, A. R., Smith, C. R., Levin, L. A., Mora, C., Wei, C.-L., Gooday, A. J., Jones, D. O. B., Rex, M., Yasuhara, M., Ingels, J., Ruhl, H. A., Frieder, C. A., Danovaro, R., Würzberg, L., Baco, A., Grupe, B. M., Pasulka, A., Meyer, K. S., Dunlop, K. M., Henry, L.-A., and Roberts, J. M.: Major Impacts of Climate Change on Deep-Sea Benthic Ecosystems, Elementa: Science of the Anthropocene, 5, 4, https://doi.org/10.1525/elementa.203, 2017. a
Taylor, K., Stouffer, R., and Meehl, G.: An Overview of CMIP5 and the experiment design, B. Am. Meteorol. Soc., 93, 485–498, https://doi.org/10.1175/BAMS-D-11-00094.1, 2012. a
Thornton, P. E., Doney, S. C., Lindsay, K., Moore, J. K., Mahowald, N., Randerson, J. T., Fung, I., Lamarque, J.-F., Feddema, J. J., and Lee, Y.-H.: Carbon-nitrogen interactions regulate climate-carbon cycle feedbacks: results from an atmosphere-ocean general circulation model, Biogeosciences, 6, 2099–2120, https://doi.org/10.5194/bg-6-2099-2009, 2009. a
Toggweiler, J. R., Gnanadesikan, A., Carson, S., Murnane, R., and Sarmiento, J. L.: Representation of the carbon cycle in box models and GCMs: 1. Solubility pump, Global Biogeochem. Cy., 17, 1026, https://doi.org/10.1029/2001GB001401, 2003. a, b
van Heuven, S., Pierrot, D., Rae, J., Lewis, E., and Wallace, D.: CO2SYS v1.1, MATLAB program developed for CO2 system calculations, ORNL/CDIAC-105b, Carbon Dioxide Information Analysis Center, Oak Ridge National Laboratory, U. S. DoE, Oak Ridge, TN, 2011. a
Volk, T. and Hoffert, M. I.: Ocean Carbon Pumps: Analysis of Relative Strengths and Efficiencies in Ocean-Driven Atmospheric CO2 Changes, in: The Carbon Cycle and Atmospheric CO2: Natural Variations Archean to Present, edited by: Sundquist, E. T. and Broecker, W. S., American Geophysical Union (AGU), https://doi.org/10.1029/GM032p0099, pp. 99–110, 1985. a, b, c, d
Wanninkhof, R.: Relationship between wind speed and gas exchange over the ocean revisited, Limnol. Oceanogr.-Meth., 12, 351–362, https://doi.org/10.4319/lom.2014.12.351, 2014. a
Weiss, R. F.: Carbon Dioxide in Water and Seawater: The Solubility of a Non-Ideal Gas, Mar. Chem., 2, 203–215, https://doi.org/10.1016/0304-4203(74)90015-2, 1974. a
Whitney, F. A., Freeland, H. J., and Robert, M.: Persistently Declining Oxygen Levels in the Interior Waters of the Eastern Subarctic Pacific, Prog. Oceanogr., 75, 179–199, https://doi.org/10.1016/j.pocean.2007.08.007, 2007. a
Wilson, J. D., Andrews, O., Katavouta, A., de Melo Viríssimo, F., Death, R. M., Adloff, M., Baker, C. A., Blackledge, B., Goldsworth, F. W., Kennedy-Asser, A. T., Liu, Q., Sieradzan, K. R., Vosper, E., and Ying, R.: The biological carbon pump in CMIP6 models: 21st century trends and uncertainties, P. Natl. Acad. Sci. USA, 119, e2204369119, https://doi.org/10.1073/pnas.2204369119, 2022. a, b, c, d
- Abstract
- Introduction
- Methods
- Results
- Discussion
- Conclusions
- Appendix A: Preformed DIC source-to-loss partition
- Appendix B: Changes in tracer fields
- Appendix C: Thermodynamic fields and circulation features
- Appendix D: Biological production and export production
- Code and data availability
- Author contributions
- Competing interests
- Disclaimer
- Acknowledgements
- Financial support
- Review statement
- References