the Creative Commons Attribution 4.0 License.
the Creative Commons Attribution 4.0 License.
 | 09 Aug 2024
An assessment of ocean alkalinity enhancement using aqueous hydroxides: kinetics, efficiency, and precipitation thresholds
Mallory C. Ringham
Nathan Hirtle
Cody Shaw
Xi Lu
Julian Herndon
Brendan R. Carter
Matthew D. Eisaman
Ocean alkalinity enhancement (OAE) is a promising approach to marine carbon dioxide removal (mCDR) that leverages the large surface area and carbon storage capacity of the oceans to sequester atmospheric CO2 as dissolved bicarbonate (). One OAE method involves the conversion of salt in seawater into aqueous alkalinity (NaOH), which is returned to the ocean. The resulting increase in seawater pH and alkalinity causes a shift in dissolved inorganic carbon (DIC) speciation toward carbonate and a decrease in the surface ocean pCO2. The shift in the pCO2 results in enhanced uptake of atmospheric CO2 by the seawater due to gas exchange. In this study, we systematically test the efficiency of CO2 uptake in seawater treated with NaOH at aquarium (15 L) and tank (6000 L) scales to establish operational boundaries for safety and efficiency in advance of scaling up to field experiments. CO2 equilibration occurred on the order of weeks to months, depending on circulation, air forcing, and air bubbling conditions within the test tanks. An increase of ∼0.7–0.9 mol DIC per mol added alkalinity (in the form of NaOH) was observed through analysis of seawater bottle samples and pH sensor data, consistent with the value expected given the values of the carbonate system equilibrium calculations for the range of salinities and temperatures tested. Mineral precipitation occurred when the bulk seawater pH exceeded 10.0 and Ωaragonite exceeded 30.0. This precipitation was dominated by Mg(OH)2 over hours to 1 d before shifting to CaCO3,aragonite precipitation. These data, combined with models of the dilution and advection of alkaline plumes, will allow the estimation of the amount of carbon dioxide removal expected from OAE pilot studies. Future experiments should better approximate field conditions including sediment interactions, biological activity, ocean circulation, air–sea gas exchange rates, and mixing zone dynamics.
- Article
(3350 KB) - Full-text XML
-
Supplement
(2324 KB) - BibTeX
- EndNote


The Sixth Assessment Report of the Intergovernmental Panel on Climate Change reported that, in addition to a drastic decrease in CO2 emissions, the active removal of 5–15 Gt of atmospheric CO2 per year by 2100 is necessary to constrain average global warming to less than 1.5–2 °C (noting that the magnitude of carbon removals varies by climate scenario; IPCC, 2022; Rogelj et al., 2018). A wide variety of negative emissions technologies (NETs) are under development to meet this enormous challenge (Minx et al., 2018; NASEM, 2018, 2021; Rueda et al., 2021; Vitillo et al., 2022).
A suite of promising approaches to CO2 removal, termed ocean or marine carbon dioxide removal (ocean CDR or mCDR, respectively), leverage the enormous surface area and carbon storage capacity of the ocean (Boettcher et al., 2019; NASEM, 2021). Ocean alkalinity enhancement (OAE) is an mCDR method that aims to store atmospheric CO2 in a dissolved phase in the ocean as bicarbonate ions (), thereby accelerating a natural planetary CO2 regulation mechanism, the carbonate–silicate cycle (Berner et al., 1983; Isson et al., 2020). OAE has the potential to scale to gigatons of CO2 removal per year (He and Tyka, 2023), but development of this approach requires careful consideration of the methods and materials used to source and process alkalinity, the form and method of delivery of alkalinity to the surface ocean (for example, aqueous or solid phase), and the selection of appropriate geographic sites for alkalinity dispersal (Oschlies et al., 2023). OAE methods under exploration include mining and crushing alkaline minerals (e.g., olivine, basalts) to be spread via ship or in coastal environments (e.g., beach restoration or salt marsh distribution) (Feng et al., 2017; Köhler et al., 2010; Monserrat et al., 2017; Rigopoulos et al., 2018); the mining or industrial production of Mg(OH)2 or mining CaCO3 and calcining it to CaO or Ca(OH)2, with the Mg(OH)2 or Ca(OH)2 spread via ship or coastal outfall pipe (Harvey, 2008; Ilyina et al., 2013; Kheshgi, 1995; La Plante et al., 2023; Moras et al., 2022; Nduagu, 2012; Rau, 2008; Renforth and Henderson, 2017; Shaw et al., 2022); and the electrochemical conversion of saltwater into aqueous hydroxides and dispersal via coastal outfalls (de Lannoy et al., 2018; Eisaman et al., 2012, 2018, 2023; Lu et al., 2022; Tyka et al., 2022).
Many of these approaches and technologies are at a nascent stage. We must move quickly to quantitatively test and characterize their performance to determine which, if any, justify larger-scale deployment. The electrochemical conversion of salt (NaCl) into aqueous alkalinity (NaOH) has many potential advantages in scaling considerations, including simplified distribution of a liquid product to the ocean, avoidance of mining and the transportation of the alkalinity source over long distances, and avoidance of potentially harmful impurities present in mined alkalinity sources (NASEM, 2021; Caserini et al., 2022).
Total alkalinity (TA) is defined as the excess of proton acceptors over proton donors in an aqueous solution (Eq. 1), where ellipses represent neglected acids and bases (Dickson, 1981, 1992; Wolf-Gladrow et al., 2007). A higher TA value for a seawater sample indicates that it has a higher buffering capacity than a sample with a lower TA value. That is, for a sample with a higher TA value, the addition of a given amount of acid to the sample will decrease its pH less than for a sample with a lower TA value.
In Eq. (1), we see that the increased OH− concentration in a treated seawater solution corresponds to a salt solution with increased alkalinity relative to the starting salt solution. This increase in OH− ion concentration rapidly increases the seawater pH upon mixing, resulting in a shift in the dissolved inorganic carbon (DIC) speciation towards carbonate (Eisaman et al., 2023):
The concentration of dissolved CO2 gas (CO2,aq) in this alkalinity-enhanced seawater is less than it would be if it were in equilibrium with atmospheric CO2 (Reaction 1b). Over the longer timescale required for air–sea gas exchange (weeks to months (Wang et al., 2023) or months to years (He and Tyka, 2023) depending on location), the disequilibrium in the surface ocean resulting from the alkalinity addition drives the invasion of atmospheric CO2 into seawater (or lessens the outgassing of CO2 from the surface ocean to the atmosphere), where it reacts with carbonate and is stored primarily in the stable bicarbonate phase (Jones et al., 2014; Bach et al., 2019; Renforth and Henderson, 2017; Eisaman et al., 2023).
Under typical ocean conditions, after equilibrium has been reached, OAE results in an increase in the DIC in seawater on the order of 0.7–0.9 moles of DIC per mole of NaOH added, with a slightly increased pH relative to the initial value (He and Tyka, 2023).
It is possible that air–sea gas exchange will not completely drive the seawater pCO2 to the initial unperturbed value before the seawater sinks into the ocean interior and loses contact with the atmosphere for hundreds to thousands of years. Therefore, the DIC anomaly relative to the alkalinity anomaly present when the seawater sinks into the ocean interior may be used to assess the effective impact of the OAE for capturing atmospheric CO2 on the 0–100 year timescales that are most important for climate interventions.
In addition to the storage of atmospheric CO2 in the form of DIC, this process may have the potential to locally and transiently mitigate the elevated pCO2 associated with ocean acidification (NASEM, 2021; Cross et al., 2023; Butenschön et al., 2021). In a water body with a finite seawater exchange rate with the ocean, such as a semi-protected estuary or bay, alkalinity could be added in a controlled manner such that the combination of the rapid reactions described by Eq. (1) and the exchange/flushing rate with the open ocean results in the bay being held in steady state at a target pH or aragonite saturation state value that is higher than its equilibrium value under conditions of ocean acidification. As this added alkalinity diffuses through the bay and makes its way to the open ocean, CO2 removal and storage as DIC would occur. By metering the rate of alkalinity addition to the bay to match the flushing rate, the pH or saturation state of the bay can be held at a constant target value. Even once equilibrium has been achieved in the open ocean, the pH and the carbonate ion concentration in the open ocean remain slightly higher than before the alkaline discharge. However, the absolute value of this pH increase after equilibrium has been reached is sufficiently small relative to the alkalinity and DIC increase that mitigating ocean acidification on a global scale with this method is unfeasible. For example, increasing the equilibrium pH value from 8.0 to 8.1 at a fixed pCO2 of 400 µatm (at 20 °C and 35 salinity with no macronutrients) requires a TA increase of around ∼620 µmol kg-sw−1 and a DIC increase of around 520 µmol kg-sw−1. Using these numbers, mitigating OA over the entire 360×106 km2 surface of the ocean to a depth of 100 m would require around 487 Gt of cumulative CO2 removal. Deploying the Safe Elevation of Alkalinity for the Mitigation of Acidification Through Electrochemistry (SEA MATE) in the ocean or coastal waters will require an understanding of carbonate chemistry in seawater in the ocean volume under consideration and of the thresholds for safe operation. For example, at the point of alkaline dispersal where there is the maximum change in seawater chemistry, SEA MATE must control the rate of alkalinity addition relative to the rate of mixing and dilution in the ocean to avoid the precipitation of Mg(OH)2 or CaCO3 (Hartmann et al., 2023; Moras et al., 2022). While Mg(OH)2 readily redissolves, an increase in turbidity due to precipitation may negatively affect marine organisms (Bainbridge et al., 2018; Broderson et al., 2017). By contrast, CaCO3 will generally not redissolve in the surface ocean without biological mediation, and runaway precipitation, where alkalinity removed by precipitation exceeds that added by the OAE treatment, can occur under conditions of increased aragonite saturation state and increased nucleation sites in the water column (Moras et al., 2022). CaCO3 precipitation could counteract the intended effect of the OAE intervention by removing alkalinity from the surface ocean and releasing CO2 gas via Reaction (R3) (Zeebe and Wolf-Gladrow, 2001):
Upon dispersal to the ocean through a coastal outfall pipe, the added alkalinity is advected and diffuses away from the point source, becoming increasingly diluted through the mixing zone. Because the timescale for air–sea gas exchange and re-equilibration described by Reaction (R1) is longer than the characteristic timescale for dilution driven by tides, currents, and weather, most of the CO2 removal occurs far from the mixing zone. Dilution will spread the impacts over a broad area, to an extent that it is unlikely that the impacts on the DIC distribution can be quantified using only direct measurements, given current instrument resolution and the typical dynamic range of natural variability (Wang et al., 2023). In general, options for measurement, reporting, and verification (MRV) of OAE will therefore rely on (Ho et al., 2023) experimentation in laboratory and mesocosm settings, such as the work we describe here, to establish CO2 removal dynamics under conditions of OAE; direct monitoring of the rate and characteristics of alkalinity addition into seawater; monitoring the seawater carbonate and environmental chemistry in the immediate vicinity of the outfall via sensors and sampling (Cyronak et al., 2023; Schulz et al., 2023); and ocean modeling to estimate CDR beyond the range of direct detection (Fennel et al., 2023).
While some work has investigated various aspects of NaOH-based ocean alkalinity enhancement in microcosms (Ferderer et al., 2022; Hartmann et al., 2023) and mesocosms (Groen et al., 2023) and other work has studied the release of NaOH over natural coral reefs as a method of local ocean acidification mitigation (Albright et al., 2016), a systematic characterization of the efficiency and kinetics of OAE as a function of key process parameters has not yet been performed. Here we report the first tank-scale tests of OAE that use aqueous hydroxide (NaOH) to enhance the alkalinity of natural seawater, a process that mimics OAE via the electrochemical brine-to-alkalinity conversion used in the SEA MATE process. Our experiments, conducted in 6000 L tanks using seawater pumped from Flax Pond on Long Island Sound in Stony Brook, NY, quantify the magnitude and timescale of the CO2 removal from the air and storage as seawater DIC by monitoring the air–seawater re-equilibration after an initial alkalinity perturbation. In addition, our use of both laboratory-processed bottle samples and field-deployable sensors to measure and over-constrain the carbonate chemistry response allows us to assess the suitability of certain sensing platforms for MRV. Finally, we investigate safe thresholds for the rate and concentration of alkalinity addition to avoid (1) the precipitation and redissolution of Mg(OH)2 that can lead to local, temporary increases in turbidity and (2) the precipitation of CaCO3, which partially reverses the intended OAE effect by removing alkalinity from, and releasing CO2 gas into, the surrounding seawater.
Using this approach, we address the following key questions:
- (1)
How much additional atmospheric CO2 is stored in seawater as DIC in response to a given alkalinity perturbation?
- (2)
What is the timescale for CO2 removal from the air, and how does it depend on pH and the magnitude of alkalinity enhancement?
- (3)
What are the conditions for Mg(OH)2 precipitation upon addition of NaOH to seawater?
- (4)
What are the threshold values for pH and aragonite saturation state beyond which undesired CaCO3 precipitation will occur?
Answering these questions is key to assessing the viability of this approach and to optimizing its eventual deployment. The large-tank experiments presented in this paper provide a stepping stone between bench-scale experiments and in situ mesocosms or field pilots. Even if these experiments simply confirm stoichiometric and modeled expectations, this is critical information in the design and implementation of OAE deployments. This work is a necessary part of the growing scientific body that will allow field trials to progress.
2.1 Experimental procedure
We investigated the carbonate chemistry changes resulting from the addition of NaOH(aq) to natural seawater over timescales ranging from 2 weeks to 2 months in a series of experiments at two scales: (1) two large (∼6200 L) indoor tanks and (2) multiple 15 L aquaria (Fig. 1). The large volume of the tank experiments allowed precise measurement of the seawater carbonate chemistry via bottle sampling (1 L each, sent to the NOAA Pacific Marine Environmental Laboratory (NOAA/PMEL) for analysis) with high sampling frequency. To complement these measurements, we also performed a series of experiments in smaller aquaria (15 L each), which enabled a larger number of replicates and a faster time to equilibrium when bubbled with air.
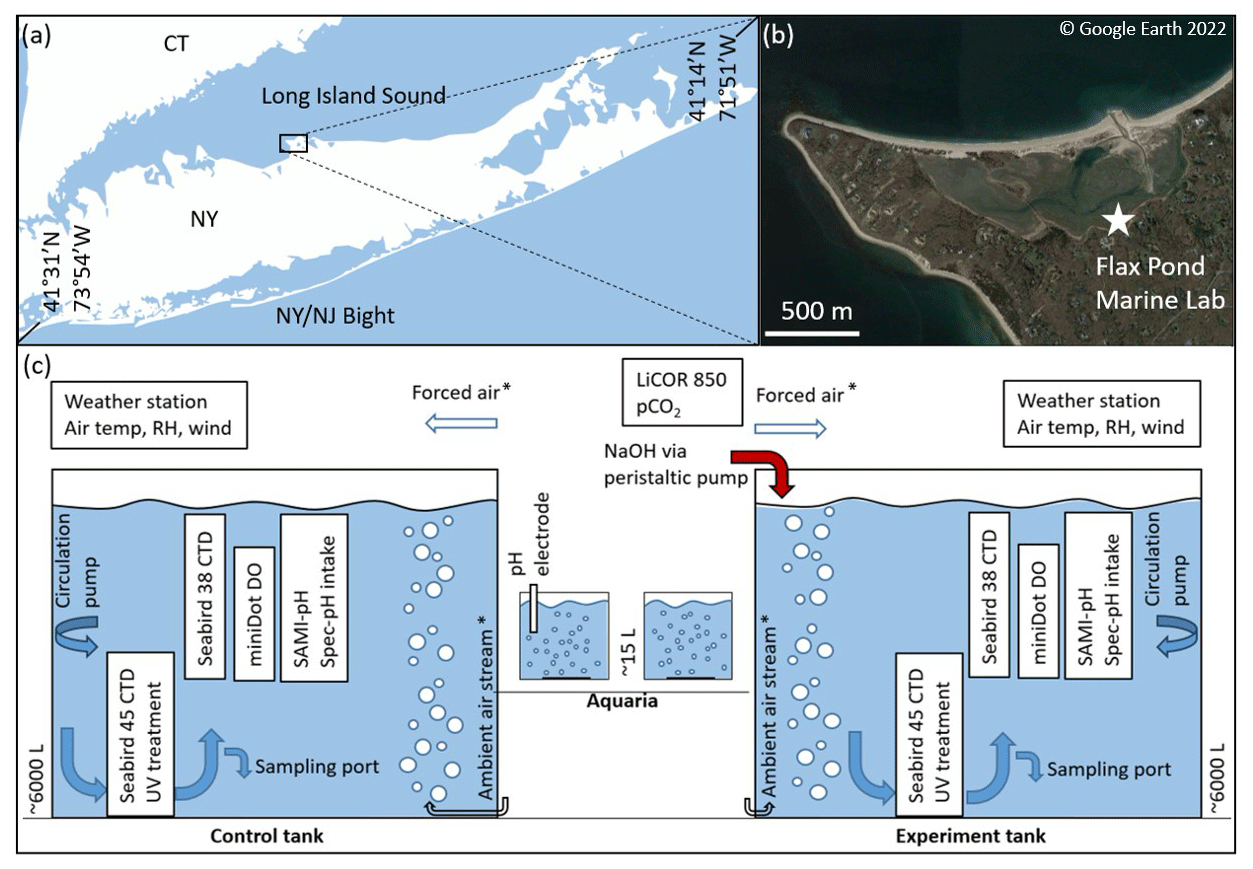
Figure 1(a, b) Flax Pond Marine Laboratory is located on Long Island Sound, New York, USA (© Google Earth 2022). (c) The ∼6000 L control and experiment tanks were instrumented with a series of oceanographic sensors and sampled routinely for DIC/TA analyses to allow the measurement of carbon uptake over time following an addition of alkalinity in the form of NaOH. The ∼15 L aquaria were instrumented with standard pH electrodes and monitored with routine TA analyses. The forced air and ambient airstreams indicate their use in some but not all experiments, as noted in later sections.
This study was conducted at the Flax Pond Marine Laboratory at Stony Brook University, NY. All experiments used natural seawater collected from Flax Pond, part of a 128-acre salt marsh tidal wetland connected to the Long Island Sound. The surface areas of the tanks and aquaria were ∼4.6 and ∼0.1 m2, respectively. The tanks had a diameter of 2.4 m and a total height of 1.52 m and were typically filled to a height of ∼1.35 m, allowing a corresponding seawater volume of 6185 L. The aquaria had a diameter of 0.3 m and were typically filled to a height of ∼0.23 m for a total seawater volume of 15 L. The large tank volumes were chosen to limit interactions with walls while increasing the air–seawater boundary and to lose a smaller fraction of their volume to evaporation. These tanks allow in situ oceanographic sensor deployment and frequent bottle sampling while retaining semi-controlled temperature, mixing, filtration, and biological control. The inherent limitations of these tank tests include limited air–sea interaction, unrealistic light levels and circulation, and biological responses that are not a perfect representation of natural seawater in the ocean, but they serve as a stepping stone to mesocosm and eventual field experiments. On average, the experiments with large tanks (∼6000 L) took ∼6.5 weeks after dosing with NaOH to reach 90 % of the calculated or extrapolated asymptotic ΔDICTA addition ratio indicative of full air–seawater equilibrium, as will be discussed in Sect. 3. Therefore, in addition to the large-tank tests, we conducted a series of smaller aquarium alkalinity additions to increase our capacity for experimental test cases. The limitations of the aquaria include limited sensor options, unrealistic circulation, and limited biological control. While it is expected that equilibration occurs more rapidly in the small aquaria than in the large tanks, the results from these cases should be similar, as CO2 equilibrates across the air–sea boundary. However, we note that some variation is expected due to limited sensing and sampling options in the smaller aquaria and the greater potential for biological growth in the large tanks over longer timescales.
2.1.1 Tank experiments
Seawater was pumped into the tanks at high tide through a series of sock filters to exclude macroscopic biology. The tanks were then dosed to 40 ppm bleach (sodium hypochlorite), and the shock-treated seawater was allowed to circulate through the tanks for ∼1 d to limit biological growth. The seawater was then circulated through UV light arrays to break down the bleach over ∼1–2 weeks, as assessed by a standard Hach test kit for free chlorine. During this period, seawater was pumped between the two large-test tanks (∼25 L min−1) to increase mixing of the bleach and to homogenize the tanks to similar initial conditions. For the remainder of each experiment, the seawater was continually pumped through the UV sterilizers. Measurements of total alkalinity showed no significant differences in the bulk seawater TA before and after the bleaching process in any experiment or control tank. In an early experiment (in which bulk pHT was raised from the initial condition to 8.7, as described below), the initial pHT and DIC varied between the control and experiment tanks by 0.17 and 77 µmol kg−1, respectively. This was because seawater was pumped from Flax Pond into multiple reservoirs and was then unevenly distributed between the tanks. The experiments were subsequently refined to allow several days of cross-pumping between tanks to homogenize the control and experiment seawater before NaOH was added at the start of an experiment. More details on experimental variations and a larger summary table are available in the Supplement.
Oceanographic sensors and discrete daily bottle sampling, as described in Sects. 2.2 and 2.3, respectively, were deployed for carbonate chemistry analysis for several days prior to the alkalinity addition to understand the initial baseline conditions in both tanks. Two submerged pumps were used for water circulation within each tank: the first pump (Current eFlux DC Flow Pump, 210 GPH) cycled seawater through the UV arrays with an estimated overturning time of the bulk tank on order of 1 d, and a second pump (Kedsum Submersible Pump, 260 GPH), mounted at an angle halfway down the tank wall, allowed subsurface circulation within the tank to reduce the occurrence of unmixed “dead zones” and subsequent non-homogenous biological growth, as assessed visually on the surface of the water and/or tank lining. Initial tank experiments were conducted with a still surface condition, i.e., with no visible water movement across the surface of each tank. As experiments progressed, forced air movement was added across the surface of each tank using a stationary fan with a wind speed of ∼5 km h−1. This was done to control for potential variations in the laboratory HVAC system and to potentially reduce the time to equilibration for the experiments by increasing the rate of air–sea CO2 equilibration. In later experiments, air was bubbled into the bottom of each tank at a rate of ∼30 L min−1 with an estimated surface area of ∼0.3 m2, with a goal of further increasing the rate of equilibration to allow a more rapid throughput of experiments. These variations are further discussed in Sect. 2.4.
After baselining, one tank (referred to as the “experimental tank”) was dosed with enough 0.5 M NaOH (see Supplement) to raise the bulk seawater pH to the target pH of interest for a given experiment, and the same volume of DI water was added to the other tank (referred to as the “control tank”). NaOH additions were typically dosed into the tank via peristaltic pump at a low enough rate (∼50 mL min−1) that a steady increase in bulk tank pH was observed, but local pH measured just below the NaOH introduction never exceeded a pH of 9.0. A pump (∼25 L min−1) was placed just below the NaOH stream to speed the mixing of NaOH into the bulk tank, increase dilution from the point source, and prevent the immediate precipitation of Mg(OH)2 upon contact of the NaOH with seawater. This pump was removed after the full volume of NaOH was mixed into the tank.
After the alkalinity addition, the tanks were left to equilibrate with the atmosphere and were monitored by sensors and sampling as described in Sects. 2.2 and 2.3. The tanks were indoors in the wet laboratory at Flax Pond Marine Lab, such that the temperature and CO2 concentration were moderated by the building's HVAC system, but varied throughout days and seasons depending on other uses of the lab space. The experiments were concluded when the observed pH or DIC (calculated from daily pH and frequent TA measurements) appeared to stabilize (e.g., ΔpH ± 0.05 % or ΔDIC ± 10 ) over several days. The continuous improvement of experimental methods during this study resulted in some minor variations among the methods used for each experiment, including methods of NaOH dosing, tank circulation, and biological control, as discussed where necessary in Sect. 3 and in the Supplement.
2.1.2 Aquarium experiments
A series of polycarbonate aquaria were filled with 15 L of seawater taken from the large control tank just after the described bleaching and bleach breakdown procedure was completed. NaOH was dosed into each aquarium to reach a targeted bulk pHT, with a corresponding volume of DI H2O added to the control aquarium, and then the seawater was allowed to equilibrate with atmospheric pCO2 over days to weeks. The aquaria had neither UV light arrays for biological control nor aquarium pumps for internal circulation. With the exception of a single-target pHT 8.5 experiment, all aquaria were bubbled with ambient air (∼4 L min−1) via a standard aquarium bubbling bar spanning the center diameter of each aquarium, allowing rapid CO2 exchange. There was no fine control on air bubbling, but the surface area of all air bubbles in a given aquarium at any point in time was estimated at ∼0.01 m2. No sensors were deployed in the aquaria due to their limited size, and seawater chemistry was established via discrete pHT and TA measurements (Sect. 2.2). An optically clear lid was placed on each aquarium to reduce evaporation and splashing onto nearby equipment. Some evaporation was evident from the rising TA throughout these experiments, but it was not resolvable within the resolution of a handheld salinometer used for these experiments. The temperature was discretely recorded from a combination ROSS pH electrode.
As shown in Eq. (2), we define the dimensionless carbon-to-alkalinity ratio (CAR) for our experiments as the molar ratio of the increase in nDIC (in units of µmol kg−1, normalized to the system's initial salinity to account for evaporation) to the magnitude of the TA increase (ΔTA, in units of µmol kg−1). nDICequ is the measured (via direct titration) or calculated (via CO2SYS using measured TA and pHT) DIC value that the system reached at the end of an experiment (Pierrot et al., 2006; Van Heuven et al., 2011). Some experiments were left long enough to achieve equilibration with atmospheric CO2, but others were halted early. In these cases, a CO2SYS calculation was used to estimate the DIC increase expected at equilibration given initial seawater conditions, and the difference between this value and the final recorded nDICequ was used to estimate the overall percent equilibration for a given experiment. Depending on experimental constraints described in later sections, nDICi may represent either (1) the final nDIC measured (via titration of bottle samples) or calculated (via CO2SYS using seawater TA and pH) in the control tank or (2) the “baseline” nDIC before the addition of NaOH to a given aquarium experiment, for cases where a corresponding control case may not be available. Note that, because we are reporting CAR values where the measured DIC has reached or has been estimated at equilibrium, the CAR values we measure and report reflect the ratio of ΔDIC to ΔTA that would be expected given sufficient time for air–sea exchange to reach equilibrium; therefore, they are equivalent to directly measuring the value of the “TA addition potential impact ratio” as defined by Wang et al. (2023).
2.2 Oceanographic sensors
Each tank was instrumented with a series of sensors placed halfway down the wall of the tank near the inlet of the UV circulation pump. A Sea-Bird 38 Digital Oceanographic Thermometer and a Sea-Bird 45 MicroTSG Thermosalinograph continuously monitored seawater temperature and salinity, respectively. Dissolved oxygen was measured by a PME miniDOT Logger at 10 min resolution. pHT was monitored daily by a SAMI-pH (manufacturer-specified accuracy/precision , though this accuracy is likely an underestimate of the uncertainty given known challenges for the calibration of the pHT measurements) and by a semi-automated spectrophotometric pH unit (spec-pH; ) as described by Carter et al. (2013). CRM measurements were taken by each pH system at the beginning and end of each experiment and were used alongside discrete samples of DIC and TA as described in Sect. 2.3 to constrain the stability of each sensor. The SAMI-pH measurements were recorded at ambient seawater temperature and corrected for in situ salinity as recorded by the Sea-Bird Thermosalinograph following best practices from the manufacturer. The spec-pH analyses occurred in a jacketed cuvette held at 20 °C (regulated via water bath) and were corrected to the in situ bulk tank temperature and salinity as recorded by the Sea-Bird Thermometer and Thermosalinograph. Both the SAMI-pH and the spec-pH rely on spectrophotometric analysis of metacresol purple indicator dye, which allows pH measurement within the pHT range of approximately 7 to 9. For experiments in which enough NaOH was dosed into seawater to raise pH above these limits, a Thermo Scientific Orion ROSS Ultra pH/ATC Triode combination electrode (8157BNUMD) was used to monitor pHNBS at the surface of the tank (±0.01 precision), which was then converted to pHT for comparison with the other pH sensor systems.
A LI-COR LI-850 sensor was used to analyze atmospheric pCO2 (±1.5 % accuracy) above the tanks. The inlet to this sensor was periodically moved between tanks to ensure that atmospheric pCO2 in the vicinity of the control and experiment tanks was the same. AcuRite Iris weather stations were mounted on the side of each tank to monitor air temperature (±2 °C), relative humidity (±3 %), and air speed (±0.8 m s−1). All data were compiled on an hourly basis in a custom R package.
2.3 Discrete sampling
Two types of discrete sampling were used to constrain carbonate chemistry throughout these experiments. Firstly, 500 mL of seawater was collected and preserved from each tank, typically on a daily basis and as frequently as hourly during the addition of NaOH, following best practices laid out by Dickson et al. (2007), including overflowing of the sample bottles during the collection and addition of 0.2 mL of saturated mercuric chloride (HgCl2) as a preservative. These bottle samples were analyzed for DIC and TA at the NOAA Pacific Marine Environmental Laboratory (NOAA/PMEL). DIC concentrations were measured using a coulometer (UIC Inc.) and a single-operator multiparameter metabolic analyzer (SOMMA) (Johnson et al., 1985). TA was determined by an open-cell acidimetric titration (Dickson et al., 2007). The accuracy of DIC and TA measurements was assessed with certified reference materials (CRMs; supplied by the Dickson laboratory at Scripps Institution of Oceanography), and the overall uncertainty for both DIC and TA was typically ±0.1 % (∼2 µmol kg−1).
In addition, discrete seawater samples were analyzed for TA via open-cell potentiometric titration at Stony Brook University. A Thermo Scientific Orion ROSS Ultra pH/ATC Triode combination electrode (8157BNUMD), calibrated using three buffer solutions (pHNBS 4.01, 7, and 10.01), was used to track the titration of an ∼20 mL seawater sample with a dilute HCl solution (∼0.1 M in 0.7 M NaCl, calibrated daily with CRM or a secondary seawater standard) following a modified Gran titration procedure using a Kloehn digital syringe pump (Song et al., 2020; Wang and Cai, 2004). The precision of TA measurements was –10 µmol kg−1. These TA data were corrected to those of the bottle samples analyzed via titration at NOAA/PMEL where available (see Supplement).
There are several differences between the aquarium experiments and the larger-tank experiments. Firstly, the aquarium experiments were monitored daily to every few days by the discrete measurement of TA at Stony Brook University and pHNBS via a Thermo Scientific Orion ROSS Ultra pH/ATC Triode combination electrode (8157BNUMD) (±0.01 precision), which was then converted to pHT and corrected against the other pH sensor systems via occasional bottle samples for DIC and TA analysis at NOAA/PMEL. Variations between these experiments are noted in Sect. 3 where necessary and in the Supplement.
In either tank or aquarium cases where mineral precipitation was observed, 0.5–1 L of seawater was vacuum filtered through a 0.45 µm Whatman GF/F filter via vacuum pump, and the solids were rinsed with DI water three times to remove NaCl. The precipitate was dried in an oven at 90 °C then crushed into a uniform powder via mortar and pestle. Samples were analyzed via a Hitachi S-4800 scanning electron microscope (SEM) (5 kV) and a Rigaku SmartLab X-ray diffractometer (XRD) (Cu Kα, 1.5406 Å, 10–100° 2θ at 4° min−1) at the Materials Synthesis and Characterization Facility of the Center for Functional Nanomaterials at Brookhaven National Laboratory.
2.4 Evaluation of CO2 uptake by seawater in response to NaOH perturbation
Seawater carbonate chemistry measurements were used to analyze the uptake of CO2 in each tank, primarily relying on calculations from the NOAA/PMEL DIC and TA analyses of bottle samples when available and using sensor pH and Stony Brook TA measurements for cross-verification or to fill in between discrete DIC samples. DIC and TA data were normalized to the salinity at the start of a given experiment to account for evaporation (Friis et al., 2003). Carbonate chemistry calculations were then performed using CO2SYS (Lewis et al., 1998), with carbonate constants from Lueker et al. (2000), KSO4 from Dickson (1990), and total boron from Lee et al. (2010). Wherever possible, a combination of CRM analyses and comparisons between simultaneous pH sensor and NOAA/PMEL bottle samples was used to correct SAMI-pH and spectrophotometric pH sensor data for drift.
Changes in the seawater carbonate chemistry over time were analyzed with respect to shifts away from the baseline within a single control or experiment tank and with respect to the differences between the control and experimental tanks.
3.1 Large-tank experiments
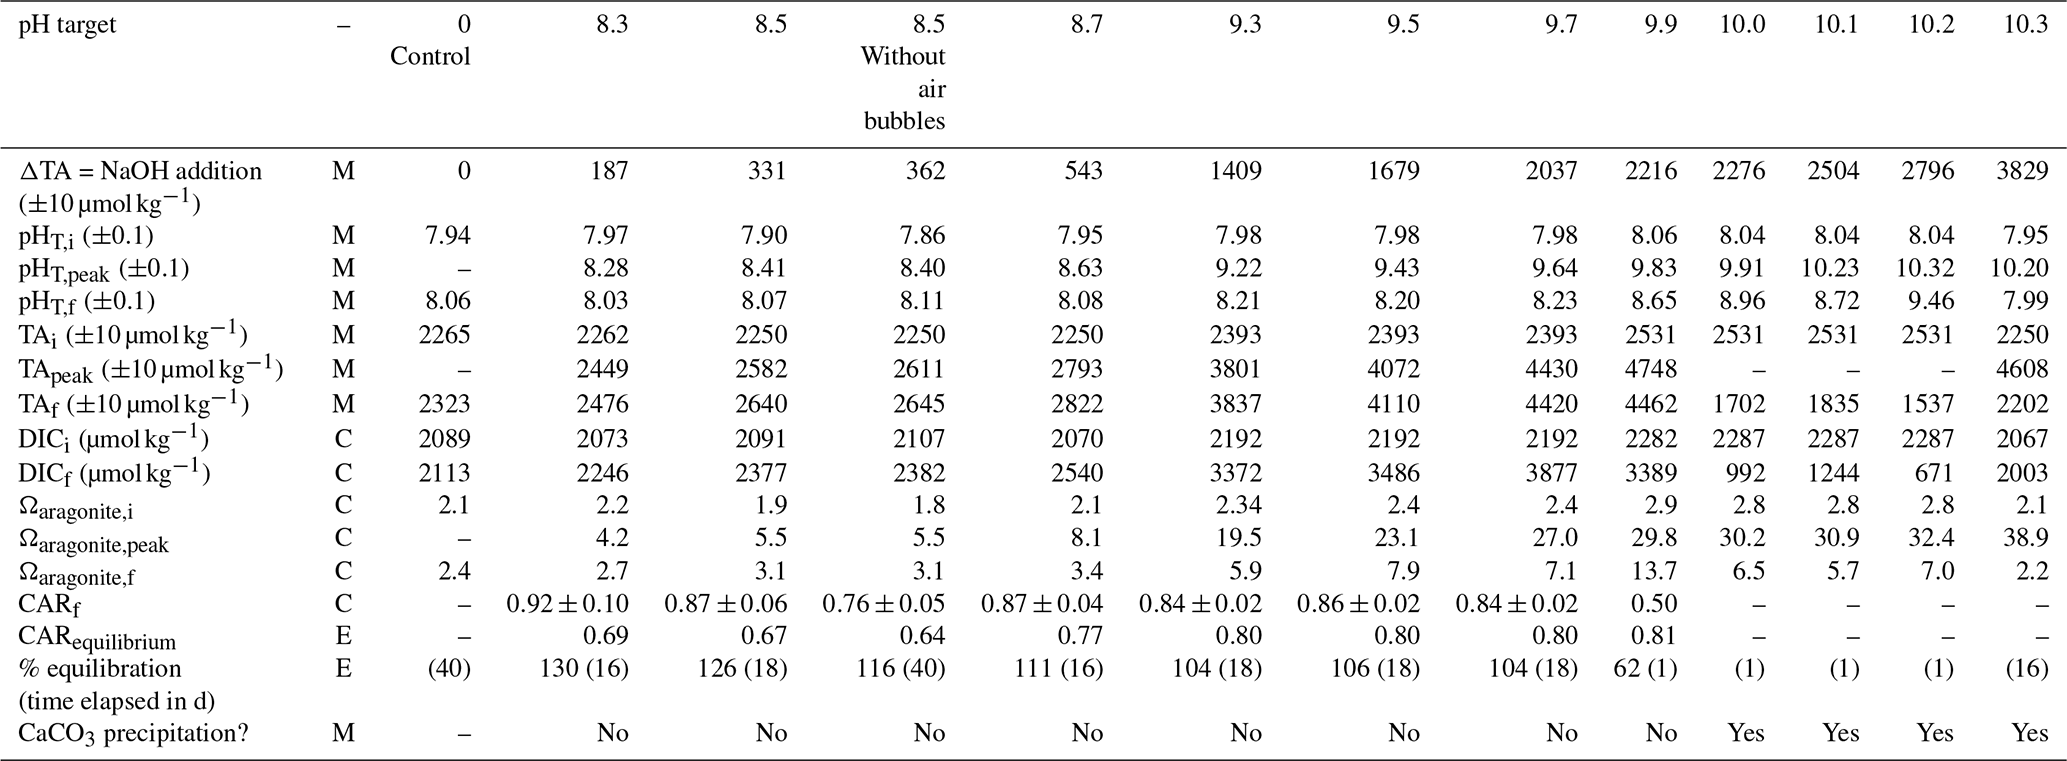
A summary of the range of oceanographic variables measured by sensors and bottle samples, calculated via CO2SYS, or extrapolated to equilibration conditions during the large-tank experiments, is provided in Table 1. This summary includes six experiments, including three targeting pHT 8.5 (still surface water, with forced air, and with forced air and air bubbling) and one (each) targeting pHT values of 8.7 (still surface water), 9.5 (with forced air and air bubbling), and 10.3 (still surface water). While the initial seawater conditions were similar between the control and experiment tanks, we note that these cases are not entirely comparable after the termination of cross-pumping between tanks and the subsequent addition of alkalinity. While tanks were initially bleached, eventually some biological growth was noted in each tank with potential differences in spatial and temporal distribution and with differences in species and community. Herein, we assume that differences between the control and experiment cases are due to the addition of alkalinity alone, but we note that the characterization of other potential confounding factors is a subject for future work.
Table 1Range of variables measured, calculated, or extrapolated in large-tank experiments, where M denotes direct measurement, C denotes calculation via CO2SYS, and E denotes extrapolation to equilibrium conditions. Subscripts i and f refer to initial and final conditions, and “peak” refers to the time point immediately after the addition of NaOH.
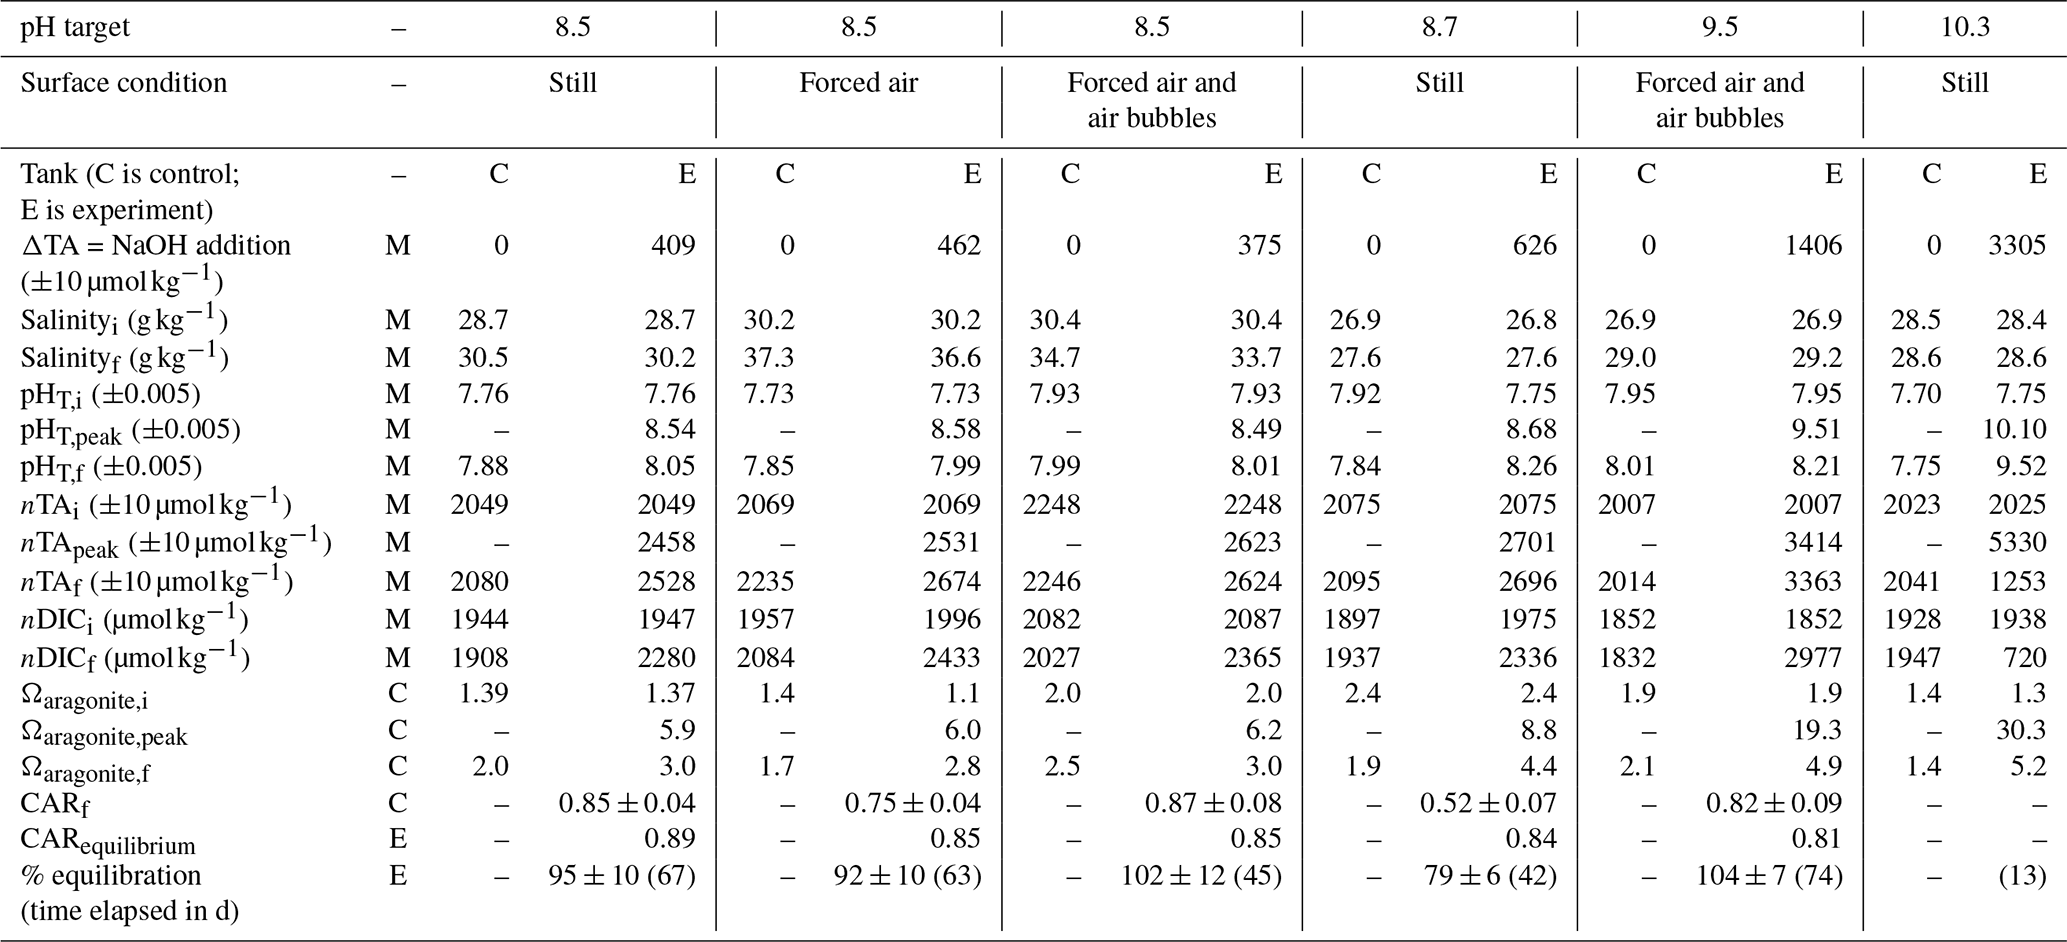
The initial pHT, TA, and DIC varied across experiments as seawater was collected between March 2022 and May 2023, with pH values from 7.66 (December 2022)–7.95 (May 2023), TA values from 2001 (May 2023)–2176 (March 2023) µmol kg−1, and DIC values from 1847 (May 2023)–2021 (March 2023) µmol kg−1. Both measured and CO2SYS-calculated DIC and TA values were normalized to salinity to account for evaporation, which drove salinity increases ranging from 0.2–7.1 across these experiments.
After the addition of NaOH, the control and experiment tanks were allowed to equilibrate with atmospheric CO2. While refinements in the experimental design allowed complete or near-complete equilibration in later experiments, as determined by the stabilization of nDIC at some asymptotic value, early experiments were terminated before full equilibration. In all experiments, the absorption of atmospheric CO2 began immediately after the NaOH addition, as determined by decreasing pH and Ωarag and increasing DIC and seawater pCO2. nTA was fairly stable or increasing (+10–60 µmol kg−1) after the NaOH addition in all cases except the pHT=10.3 experiment, where nTA and DIC rapidly decreased due to runaway CaCO3 precipitation. A stable TA value is an indicator that no significant persistent mineral precipitation (e.g., Mg(OH)2 or CaCO3) has occurred. In the absence of active mixing or bubbling, Mg(OH)2 precipitation occurred immediately upon the introduction of NaOH to seawater; however, the precipitation can be rapidly dissolved by turbulence (i.e., pumping NaOH directly above a strong circulation pump and/or stream of air bubbles). No CaCO3 precipitation was observed in the tanks or aquaria for which the bulk seawater pHT was <10.0. The pHT=10.3 experiment was designed to induce CaCO3 runaway precipitation, as described in Sect. 3.3.
Ωarag ranged from 1.4–2.5 in the control tanks with minimal variation over the course of any given experiment. During the three experiments in which bulk pHT was increased to ∼8.5, Ωarag increased immediately to 6.0–6.3 at the peak of the experiments before slowly decreasing to 2.8–3.0 as the seawater equilibrated with atmospheric CO2. For the bulk pHT 9.5 experiment, Ωarag increased to 20.2 and slowly decreased to 5.0 when the experiment was ended at full equilibration. Mineral precipitation was observed in the bulk pHT 10.3 experiment, where Ωarag was increased to 30.3 and rapidly (<1 week) fell to 5.2 after the addition of NaOH.
The results of one representative set of time series measurements from the control and experiment tanks are shown in Fig. 2 for the case where pHT of the bulk experiment tank was raised to 8.5 then allowed to relax into equilibration with the atmosphere without the addition of surface air forcing or bubbling. Time series plots for the other tank-scale experiments are available in the Supplement.
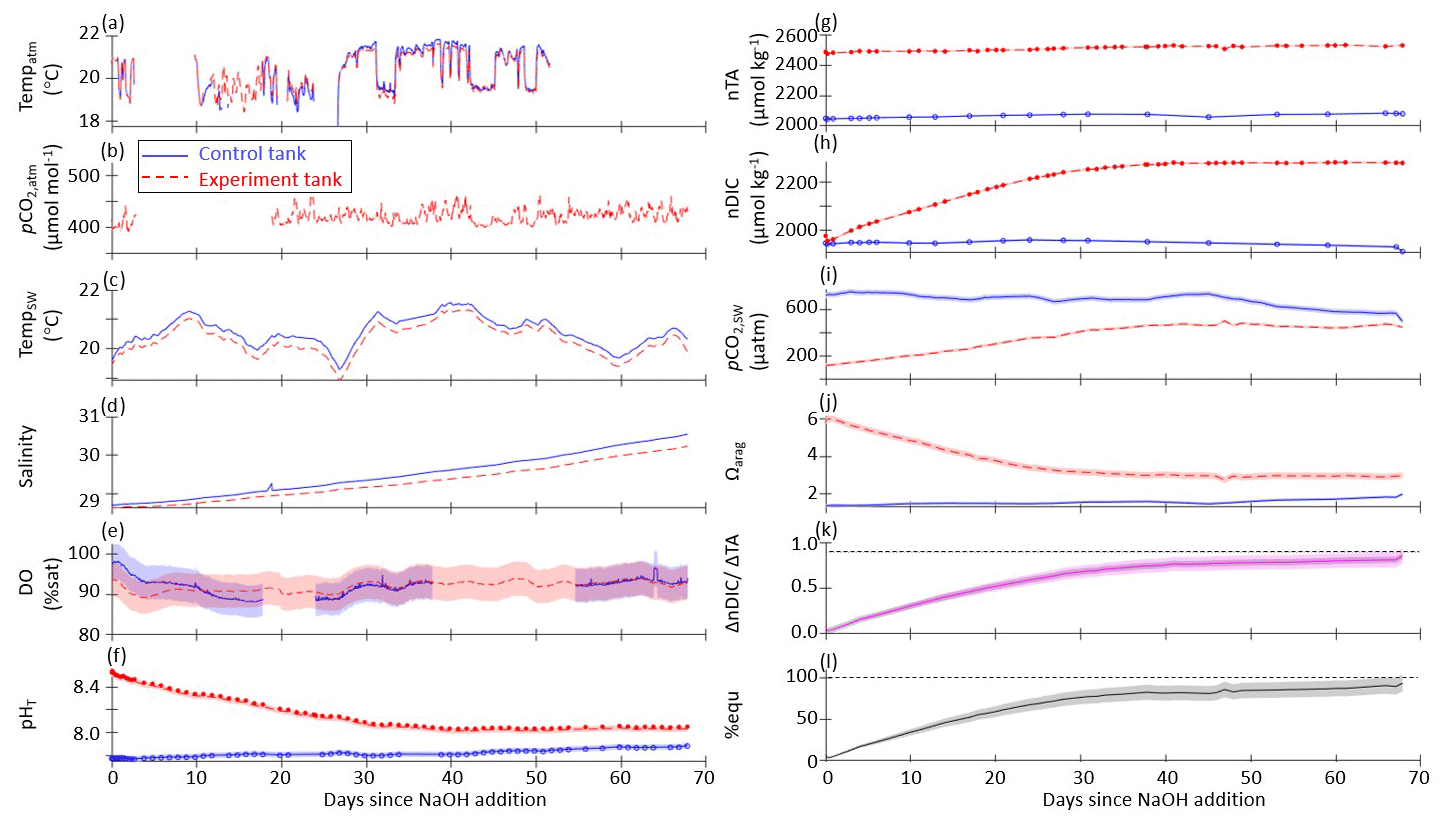
Figure 2Time series data for the case where pHT of the bulk experiment tank was raised to 8.5 with no forced airflow and no bubbling (still surface) for control (solid blue lines) and experiment (dashed red lines) tanks: (a) continuously measured air temperature, (b) atmospheric pCO2, (c) seawater temperature, (d) salinity, and (e) dissolved oxygen. (f) pHT measured by the SAMI-pH (circles) and interpolated from the spec-pH (line), corrected to bottle sample and CRM data. (g) NOAA/PMEL-measured TA and (h) DIC from bottle samples and normalized to salinity. (i) Seawater pCO2 and (j) saturation state of aragonite (Ωarag) calculated from interpolated nDIC and nTA data via CO2SYS. (k) The observed carbon uptake ratio (CAR) as (nDICexp−nDICcontrol)TANaOH addition (solid lines) and the theoretical CAR (dashed lines) from a CO2SYS calculation using measured TA and the average pCO2,atm to estimate the equilibrium change in DIC (dashed lines). (l) The percent equilibration estimated between the observed and theoretical CAR. Data gaps in panels (a), (b), and (e) are due to connectivity issues while offloading sensor data.
The ΔnTA and ΔnDIC values calculated between the control and experiment tanks are summarized in Fig. 3, where nTA and nDIC were interpolated between bottle samples measured at NOAA/PMEL and/or were calculated via CO2SYS using sensor pHT and TA measured at Stony Brook University corrected to less-frequent NOAA/PMEL TA and DIC bottle samples. The ratio of the ΔnDIC to the addition of alkalinity in the form of NaOH, or ΔnTA, is included in Fig. 3 for all experiments except that of the bulk pHT increase to 10.3. Neglecting experiments that were terminated before full equilibration, the final observed CAR ranged from 0.75 ± 0.04 to 0.87 ± 0.08 (Table 1).
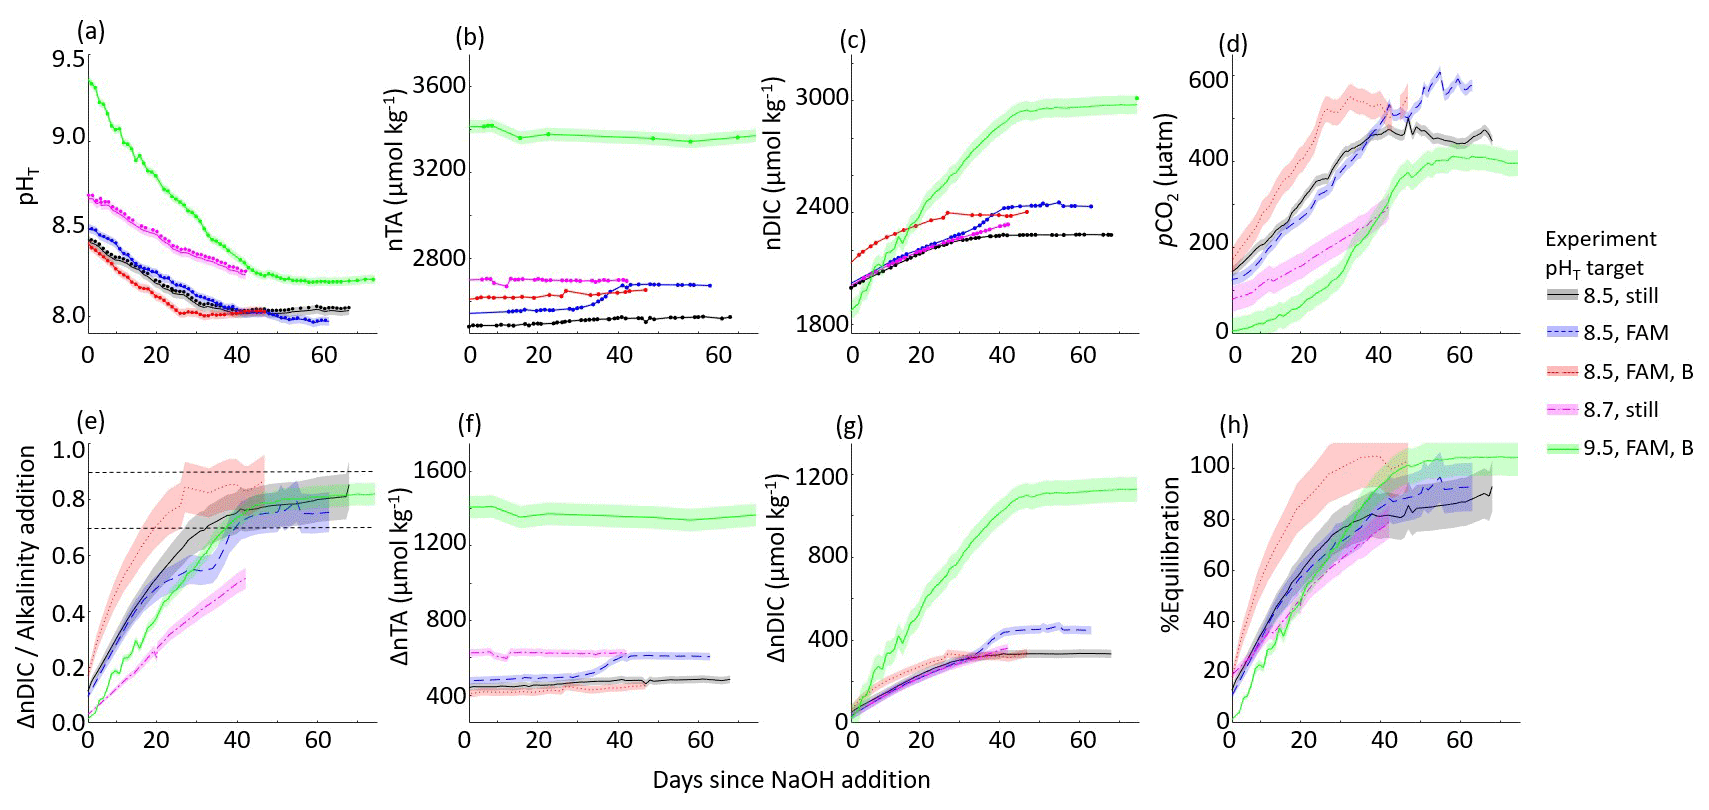
Figure 3Results of five tank-scale experiments in which enough NaOH was added to each tank to raise the bulk pHT to 8.3–9.7. pHT decreased rapidly in all cases in which air bubbling sped equilibration with atmospheric CO2. Results include (a) measured pHT, (b) measured nTA, (c) measured nDIC or CO2SYS calculated (for pHT 9.5 case only), (d) CO2SYS-calculated pCO2, (e) the observed carbon uptake ratio (CAR) as with horizontal dashed lines representing the expected range of 0.7–0.9 mol CO2 uptake per mol NaOH added to seawater, the change in (f) nTA and (g) nDIC compared to the baseline measurements before the addition of NaOH, and (h) the percent equilibration estimated between the observed and the theoretical CAR.
An anomalous event was noted in both the experiment and control cases for the target pHT 8.5 experiment with forced air movement across the surface of the tank, wherein an increase in TA and DIC was noted around day 30 of the experiment. The cause of this event is unclear but could include biological changes in both tanks, the introduction of alkalinity from environmental contaminants, or the anomalous delayed release of alkalinity from suspended solids. This event was not observed in any other case, and it highlights the importance of using controls to understand complex interactions in these experiments. A time series including this event is available in the Supplement.
Henry's law and CO2SYS calculations were used to estimate the initial and final equilibration condition of each tank experiment. LI-COR pCO2,atm measurements were averaged across experiments to a representative value of 421 ± 14 ppm, which was used with the initial seawater temperature and salinity to estimate pCO2,seawater at the beginning of each experiment. This initial pCO2,seawater was in all cases greater than the atmospheric pCO2,seawater, indicating that the seawater was not fully equilibrated with the atmosphere at the time when NaOH was added, likely due to respiration and decomposition of organic material (Sect. 2.1), and, as such, the tanks should outgas CO2. The initial equilibrium DIC was estimated from a CO2SYS calculation using the pCO2,seawater and nTAi, which in all cases was less than the initial nDIC measured or calculated from nTAi and pHT,i (by 29–108 µmol kg−1). These observations underscore the importance of having a control tank to capture natural dynamics of CO2 ingassing and outgassing to ensure that changes in DIC attributed to OAE are correctly accounted for.
The final equilibrium nDIC was estimated from a CO2SYS calculation using the same pCO2,seawater and the nTA measured just after the NaOH addition, corrected for the linear increase in salinity over the course of the experiment. The ratio of the expected ΔnDIC calculated at equilibrium with the atmosphere to the addition of alkalinity provides a simple estimate of the expected CO2 storage capacity for a given experiment. The percent equilibration for each experiment was then estimated from the measured and expected values for CAR. Within the series of experiments with a targeted pHT of 8.5, the timeline to reach an estimated 90 % CO2 equilibration decreased from 65 d (with internal circulation but still water at the surface of the tank) to 50 d (with the addition of forced air movement across the surface of the tank) to 22 d (with the addition of air bubbling). We note that only the two cases with the addition of air bubbling (targeted pHT of 8.5 and 9.5) reached full equilibration with the atmosphere.
3.2 Aquarium experiments
Table 2 provides a summary of the range of oceanographic variables quantified for the aquarium experiments.
Table 2Range of variables measured, calculated, or extrapolated in aquarium experiments, where M denotes direct measurement, C denotes calculation via CO2SYS, and E denotes estimation within specified equilibration conditions. Subscripts i and f refer to initial and final conditions, and “peak” refers to the time point immediately after the addition of NaOH.
The aquarium experiments are not directly comparable to the control stated in Table 2. Seawater for one control aquarium was collected in March 2023 and was monitored for pHT and TA changes through May 2023. Seawater for the experimental aquaria was collected in three batches between March and May 2023, with only four to six aquarium experiments running in parallel within each set of experiments due to space and analytical throughput constraints. Because of this, the experiments started in March 2023 could be compared directly to the control (target pHT 8.3, 8.5, 8.5 still, and 8.7), but the rest of the experiments used different initial seawater to the control aquarium. The CAR for each aquarium experiment was therefore calculated from changes in DIC and TA between the initial “baseline” condition and after the NaOH was added within a given aquarium, rather than between the experiment and control cases. The CAR ranged between 0.76 ± 0.05 and 0.92 ± 0.10, excluding cases where mineral precipitation was evident and for the pHT 9.9 case where the experiment ended after 1 d due to a sensor logging failure. This wide range in is likely due to the limited number of TA samples collected throughout these experiments (daily at best with no duplicates due to the limited volume) and to the imprecision of electrode-based pHT measurements relative to the SAMI-pH and spec-pH measurements used in the large-tank experiments.
No significant changes in salinity were recorded during these experiments as measured by a handheld salinometer with a range of 30–31. Therefore, DIC and TA were not normalized to salinity. Temperature values ranged from 19–21 °C during the experiments.
Similarly to the large-tank experiments, we used Henry's law and CO2SYS calculations to estimate the initial and final equilibration condition of each aquarium experiment. The same average pCO2,atm of 421 ± 14 ppm was used with the initial seawater temperature and salinity to estimate pCO2,seawater at the beginning of each experiment. The initial equilibrium DIC was estimated from a CO2SYS calculation using this pCO2,seawater and TAi, which in all cases was less than the initial DIC calculated from TAi and pHT,i (by 16–36 µmol kg−1). This indicates that the seawater was not fully equilibrated with the atmosphere at the time when NaOH was added, likely due to respiration and decomposition of organic material (Sect. 2.1), and, as such, the aquaria should outgas CO2. The final equilibrium DIC was estimated from a CO2SYS calculation using the same pCO2,seawater and the TA measured just after the NaOH addition. The percent equilibration for each experiment was then estimated between the measured and predicted values for . Due to the air bubbling, most experiments approached equilibrium with the atmosphere within 1–7 d, with the exception of the non-bubbled pHT 8.5 experiment that took ∼20 d. The surface water of this non-bubbled experiment was stagnant, and the water was only mixed via stirring just before taking pH and TA samples. Absorption of atmospheric CO2 began immediately after the NaOH addition, as determined by decreasing pHT. We note that there are significant uncertainties in these equilibrium estimates leading to estimates of >100 % equilibration. These estimates would be better constrained with more continuous carbonate chemistry measurements, particularly seawater and atmosphere pCO2 throughout the experiments, that would allow more direct calculation of air–sea CO2 flux and equilibration, and a finer control of bubbling and diffusion rates is necessary to define the timeline for equilibration within the aquaria.
Each aquarium was gently stirred during the addition of NaOH to prevent and/or redissolve Mg(OH)2 precipitation. No CaCO3 precipitation was observed in the tanks below a bulk seawater pHT of 10.0, and TA remained stable in each of these experiments with the exception of some increase driven by minor evaporation on the order of +2 . Experiments where CaCO3 precipitation was induced by increasing the starting pH to values above 10 are discussed in Sect. 3.3.
The aquarium experiments with a target pHT of 8.3–9.9 are summarized in Fig. 4.
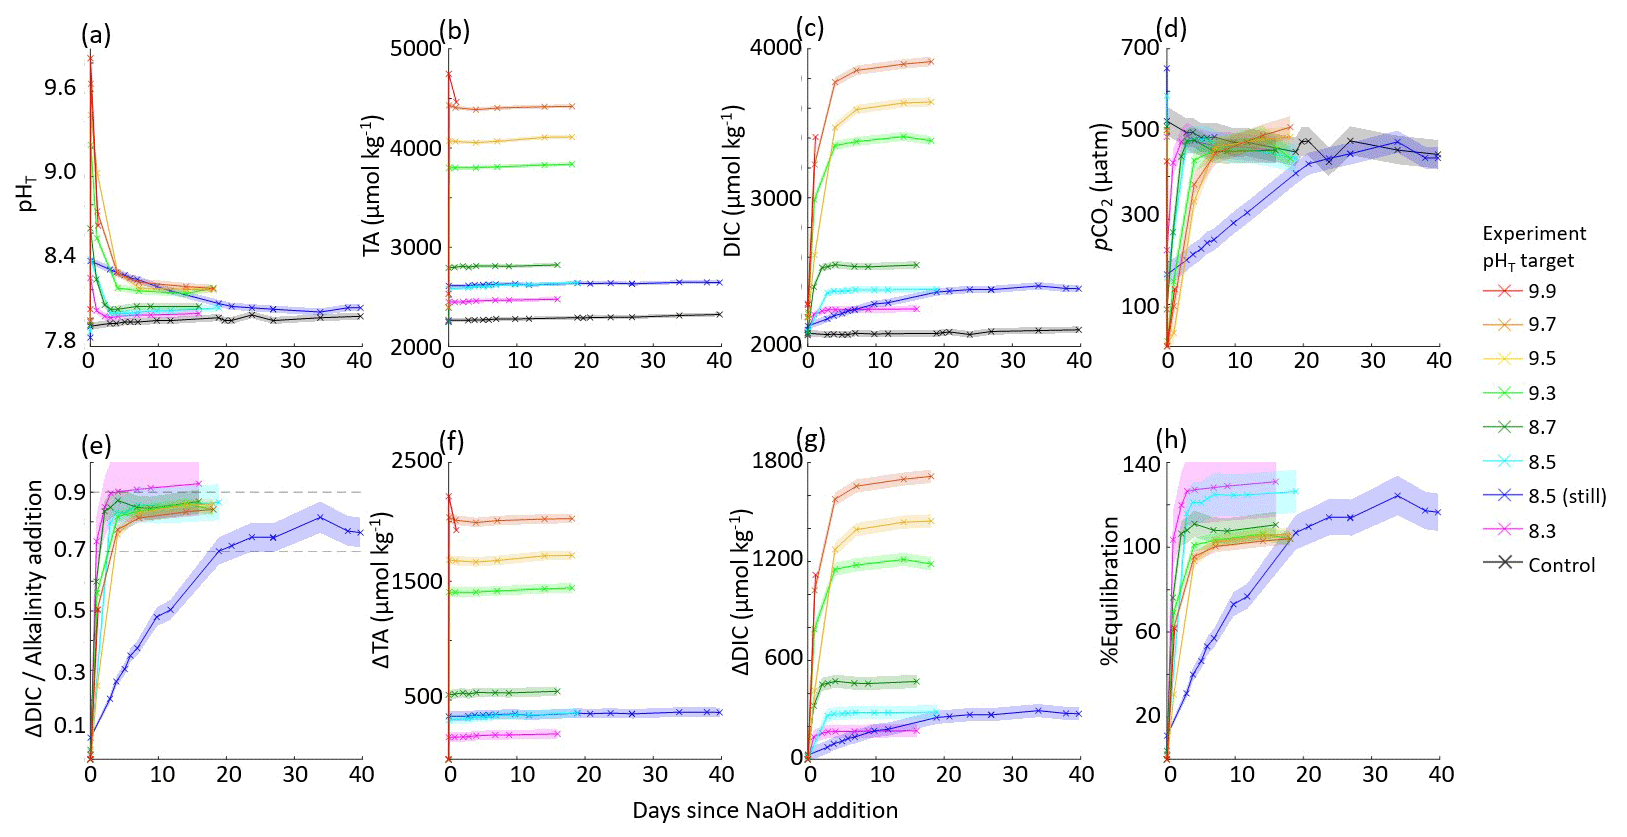
Figure 4Results of nine aquarium experiments in which enough NaOH was added to each aquarium to raise the bulk pHT to 8.3–9.9. pHT decreased rapidly in all cases in which air bubbling sped equilibration with atmospheric CO2. Results include (a) measured pHT, (b) measured TA, (c) CO2SYS-calculated DIC, (d) CO2SYS-calculated pCO2, (e) the observed carbon uptake ratio (CAR) as with horizontal dashed lines representing the expected range of 0.7–0.9 mol CO2 uptake per mol NaOH added to seawater, the change in (f) TA and (g) DIC compared to the baseline measurements before the addition of NaOH, and (h) the percent equilibration estimated between the observed and theoretical CAR.
In general, the large tanks and aquaria showed reasonable agreement in achieving values for CAR within the expected range of 0.7–0.9 (He and Tyka, 2023; Burt et al., 2021; Wang et al., 2023). While the use of aquaria bubbled with air to speed equilibration allowed a greater range of data collection within a constrained experiment timeline, the quality of these data is limited by the lack of appropriate sensors to fit into these small 15 L aquaria and by fewer bottle samples due to the reduced quantity of seawater. However, while the large tanks allow a larger range of oceanographic sampling and sensing techniques, it is more challenging to fully quantify mixing and circulation rates in the current large-tank experimental setup.
Figure 5 shows the dependence of the equilibrium values of ΔDIC, CAR, and as a function of the alkalinity addition for both tank and aquarium experiments in which the final percent equilibration for CO2 was estimated to be greater than 90 %. Results for tank and aquarium experiments aligned well, with increasing ΔDIC for increasing alkalinity additions. The CAR was observed in all experiments to fall within the range expected for seawater with the temperature and salinity values used in these tests. As expected from calculations of the response of the seawater carbonate buffer system to additions of alkalinity, the pHT at equilibrium exceeded the initial pHT value prior to the addition of alkalinity. That is, even once equilibrium in the alkalinity-enhanced experiment tank had been reached, the ending pH value was slightly elevated relative to the starting pH value. This finding warrants further investigation on the potential of OAE to mitigate some acidification impacts in controlled field trials by metering the discharge of alkalinity to a semi-protected water body.
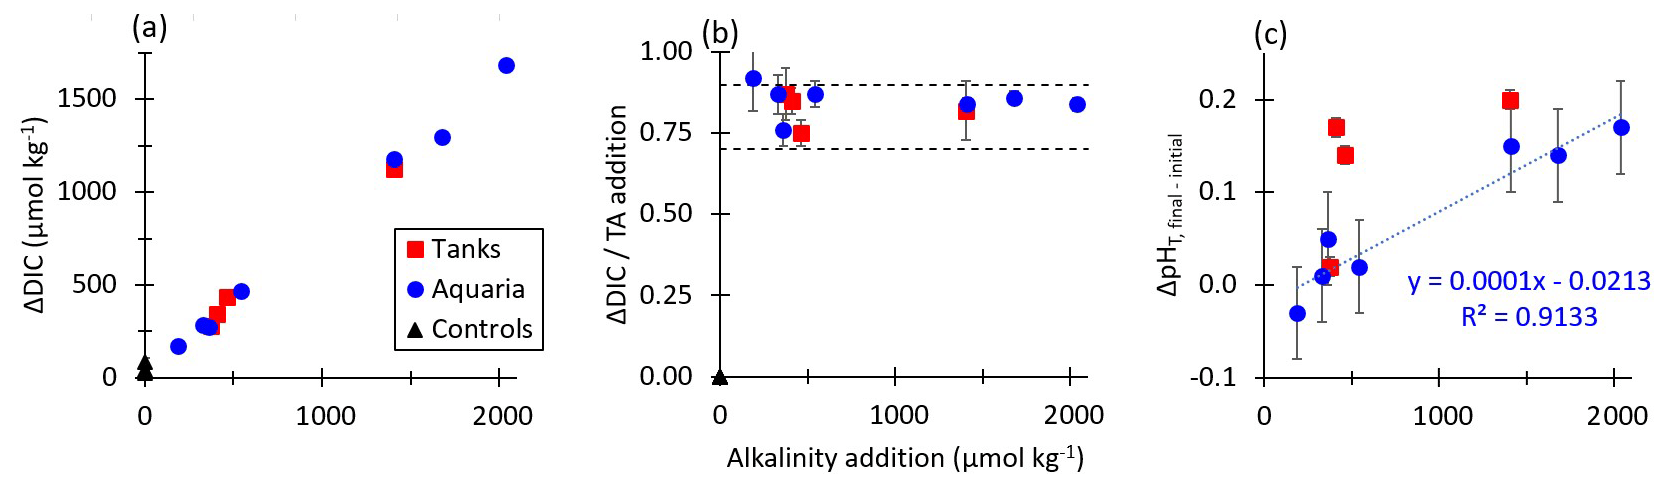
Figure 5(a) The change in final CO2SYS-predicted DIC relative to the initial conditions for tank, aquarium, and control experiments increases with increasing NaOH additions for cases where the air–sea CO2 equilibration was estimated at >90 % at the termination of each experiment. (b) CO2SYS-predicted CAR (ΔDIC / alkalinity addition) at air–sea equilibrium conditions for tank, aquarium, and control experiments, with horizontal dashed lines representing the expected range of 0.7–0.9 mol CO2 uptake per mol NaOH added to seawater. (c) The measured increases with alkalinity addition for both tank and aquarium experiments.
3.3 Experiments exceeding the CaCO3 precipitation threshold
While Mg(OH)2 precipitation occurs immediately upon the introduction of concentrated (i.e., ∼0.5 M) NaOH to still seawater, it may be rapidly dissolved or avoided entirely by gentle mixing, including via the use of stirrers, circulation pumps, or air bubblers. This precipitation and redissolution happened rapidly enough that it was not identified in any TA or other variables measured in the aquarium and tank tests. However, in cases where enough NaOH was added to raise the bulk seawater pHT to greater than 10.0 (i.e., in one large-tank test with a target pHT of 10.3 and in four aquarium experiments ranging from pHT 10.0–10.3), runaway precipitation of Mg(OH)2 and CaCO3 was observed. This was characterized by a sharp reduction in both TA and DIC and by an increase in turbidity. Runaway precipitation has been described as a condition in which more alkalinity is removed from seawater by mineral precipitation than was initially added until a new steady state is achieved (Moras et al., 2022; Hartmann et al., 2023; Suitner et al., 2023). This can significantly impact the efficiency of OAE and has implications for biological productivity, as increased turbidity may impact photosynthesis or predator–prey interactions.
In both the tank and aquarium cases with a pHT of 10.3, discrete samples of the precipitate were collected at seven different times after the bulk pHT value reached 10.3 (0, 3, 24, 49, 71, 145, and 167 h; see Fig. 6) for XRD and SEM analysis. At each time point, 0.5–1 L of seawater was collected from the tank sampling port or from the center of the aquarium. In cases where precipitation had visibly settled at the bottom of the aquarium, this material was stirred into the water column before sampling. We note that material that settled to the bottom of the large tanks was not directly collected and that only a subset of precipitation was collected at each time point, such that later time points may include solids that had precipitated at the beginning of the experiment. The filtered seawater was immediately analyzed for TA and pH via ROSS electrode because the heightened pH was out of the range of spectrophotometric methods. Bottle samples of filtered seawater were not able to be analyzed at NOAA/PMEL due to the continued precipitation of CaCO3 after filtration and preservation. Both XRD and SEM results showed the dominance of Mg(OH)2 precipitation immediately after the alkalinity addition and the corresponding increase in pH and Ωaragonite (to a value of around 30). The Mg(OH)2 precipitation at this stage was thick, slurry-like, and difficult to rinse appropriately. Broad peaks associated with brucite at the 0 and 3 h time points may reflect that these signals were partially obscured by the presence of other salts, and a sharp peak at the 0 h time point of ∼27° 2θ is likely associated with NaCl. Within hours of the NaOH addition, the runaway CaCO3 precipitation began, characterized by fine, light particulates in the water column and a sharp increase in turbidity. Within ∼24 h of the NaOH addition, most Mg(OH)2 signals had disappeared, leaving only aragonite and calcite peaks in the XRD. The results of the XRD analysis for the tank experiment are summarized in Fig. 6, and the aquarium experiment showed similar results (see Supplement). TA decreased throughout the precipitation of Mg(OH)2 and CaCO3 and was below that of the initial seawater within 24 h of the NaOH addition. In the tank experiment, the initial TA (2025 µmol kg−1) was raised by 3305 µmol kg−1. Within 3 d, the TA had decreased to 1583 µmol kg−1 and continued to decrease through the termination of the experiment to 1253 µmol kg−1 10 d after the addition of NaOH. The DIC, which was initially measured at 1938 µmol kg−1, decreased to 720 µmol kg−1 by the end of the experiment. This experiment shows that runaway CaCO3 can result in a significant loss both in the efficiency of alkalinity dosing for OAE projects and in the storage of carbon in the form of DIC. A figure of time series data collected during the tank experiment is available in the Supplement.
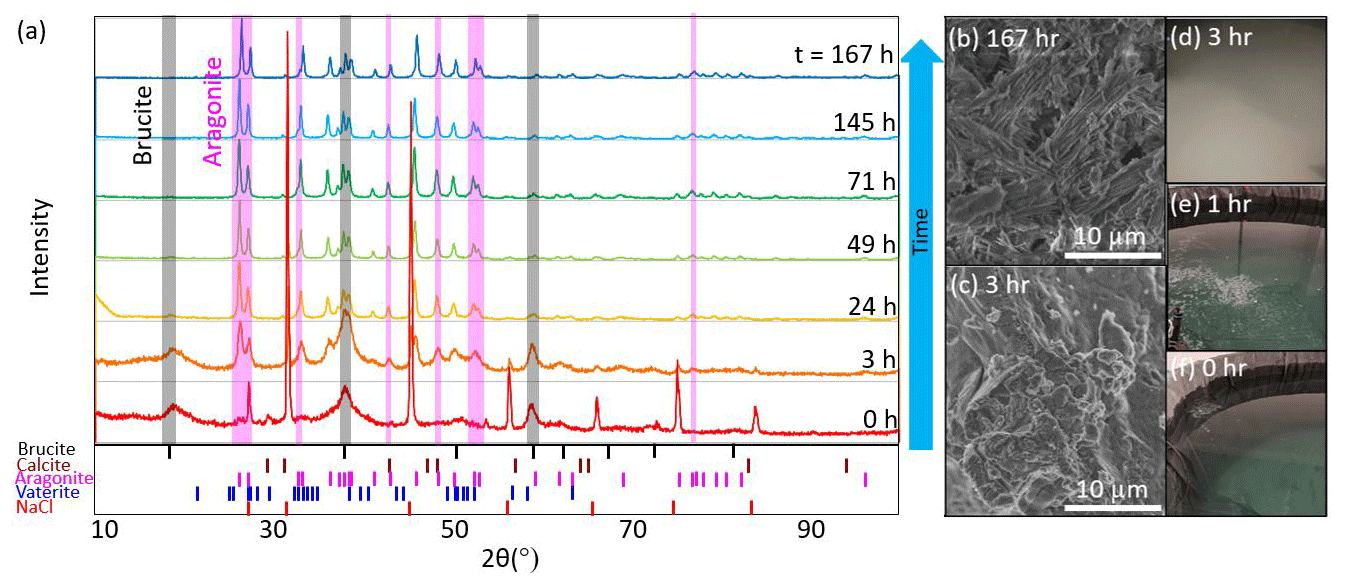
Figure 6(a) XRD analysis of particulates filtered from seawater after the addition of enough NaOH to raise the bulk seawater pHT to 10.3 showed mineral precipitation initially dominated by Mg(OH)2 before it was overtaken by CaCO3,arag. The shaded gray vertical bars highlight several peaks characteristic of brucite which typically disappear after 24 h, and the shaded pink bars represent several aragonite peaks which appear between 3 and 24 h. Representative SEM images show (b) CaCO3,arag at the end of the experiment and (c) Mg(OH)2 captured ∼3 h after the NaOH addition. Photographs of the tank experiment show seawater (d) ∼3 h after the NaOH addition, when runaway CaCO3 precipitation became visually apparent; (e) during NaOH addition into still water (i.e., without the use of stirrers, circulation pumps, or air bubblers to break up and redissolve Mg(OH)2); and (f) before NaOH addition.
In summary, the presence and duration of brucite precipitation upon the addition of 0.5 M aqueous NaOH depends on the ratio of the NaOH addition rate to the local dilution rate in the receiving waters. Future research using flow-through tanks could help identify thresholds below which brucite precipitation can be avoided or limited, and the immediate formation of Mg(OH)2 may be reversible, as also noted by Suitner et al. (2023) and Cyronak et al. (2023). At the given initial seawater conditions, the threshold for aragonite precipitation began at an Ωarag of 30, corresponding to pHT>10.0, and continued as Ωarag decreased to ∼5.2. This threshold corresponded to an increase in TA of >2270 µmol kg−1. The potential for runaway aragonite precipitation may be reduced by active mixing at the point of NaOH introduction, maintaining a mixing volume below bulk seawater pHT of 10.0 and allowing appropriate dilution in flow-through conditions, particularly on timescales of hours after alkalinity addition. Additional characterization of runaway precipitation thresholds at varying temperatures, salinities, and suspended particulate conditions will allow OAE implementation designs that best avoid this potential risk to OAE efficiency and ecosystem perturbation. We note that these results are only valid for experiments that are open to the atmosphere, allowing the exchange of CO2 across the air–sea boundary using an aqueous hydroxide feedstock for alkalinity, and are not comparable to experiments such as closed-bottle incubations, where sustained conditions of high Ωarag may result in precipitation at different thresholds. We also note that we do not assume zero aragonite precipitation at conditions below the stated thresholds but that potential precipitation is not readily detectable with our experimental setup. For example, heterogeneous CaCO3 precipitation events, such as those that may occur on suspended sediments in the water column, have been suggested through characteristic changes in seawater TADIC ratios in cases of riverine inputs and bottom sediment resuspension (Bustos-Serrano et al., 2009; Wurgaft et al., 2016, 2021). Suspended sediments in the context of OAE project sites could influence OAE efficiency and the potential for runaway precipitation and should be included in future studies (Bach et al., 2024). The thresholds determined in this study are significantly higher than those of some mineral-based OAE studies, including precipitation after an increase in TA of ∼500 µmol kg−1 using CaO and Ca(OH)2 mineral additions (Moras et al., 2022). Hartmann et al. (2023) noted precipitation resulting from alkalinity additions of >600 µmol kg−1 Mg(OH)2 and found that alkaline solutions avoided carbonate precipitation better than reactive alkaline particle additions to seawater. Suitner et al. (2023) suggested that alkalinity additions >2000 µmol kg−1 could be achievable given sufficient dilution to avoid runaway precipitation. Together, these studies highlight the need to expand research into runaway precipitation to characterize potential inefficiencies in OAE, particularly in in situ experiments to establish relationships applicable to ocean environments.
These results demonstrate that ocean alkalinity enhancement using aqueous sodium hydroxide in seawater results in CO2 removal from air at an efficiency of 0.75 (±0.04)–0.92 (±0.10), with 90 % equilibration typically achieved within 7–9 weeks (still surface water with ∼16 L min−1 subsurface circulation through UV arrays) to 3–5 weeks (with the addition of ambient air bubbling into the bottom of each tank) of the initial addition when performed in ∼6000 L tanks with seawater–air contact areas of around 4.6 m2. These results are in general agreement with the ratios noted in Burt et al. (2021), He and Tyka (2023), and Wang et al. (2023). Here, uncertainties are driven by sensor precision and temporal resolution in discrete DIC and TA sampling; the limited number of experiments with minimal opportunities for duplicates or replicates; and poorly constrained data on mixing, circulation, and air bubbling rates. Ongoing experiments seek to improve each of these conditions and should particularly focus on constraining the movement of water within a given tank to improve air–sea equilibration estimates and to allow better extrapolation from tank to field experiments. In addition, a focus of ongoing and future work is to provide rate estimates for the uptake of atmospheric CO2 in response to an NaOH addition, allowing the fitting and extrapolation of a shortened experiment to equilibration with the atmosphere.
We relied on several methods to constrain seawater carbonate chemistry. The tank-scale experiments primarily relied on discrete (at most daily) DIC and TA sampling (NOAA/PMEL), paired with daily measurements from spectrophotometric pH systems (SAMI-pH and a semi-automated benchtop spec-pH system following Carter et al., 2013) and local TA measurements. With appropriate calibration or correction of the spec-pH systems relative to CRM, there was no significant difference in carbonate calculations using the NOAA/PMEL DIC–TA or spec-pH–local TA pairings, though the latter case typically produced larger uncertainties. Aquarium experiments relied on a standard glass pH electrode (at most daily, corrected to spectrophotometric systems) with discrete (at most daily) TA measurements, which provided reasonable data relative to the tank experiments. As a result, ongoing tank-scale experiments have limited the volume of discrete DIC and TA samples collected for analysis at NOAA/PMEL to allow faster and less expensive monitoring via spec-pH and local TA titrations. However, we note that the major limitation in this measurement pathway lies in the spec-pH method, which is typically limited to pHT measurements ranging from 7–9 for the metacresol purple indicator dye used. While our measurements retained some sensitivity up to pHT 9.5, such a method should typically be regarded as unreliable at these pHT values, and we relied on frequent correction to CRM and comparison with DICTA samples. Thymol blue is an alternative spectrophotometric pHT indicator dye with sensitivity over the higher-pHT conditions observed during these initial trials and will be assessed for future experiments (Zhang and Byrne, 1996; Liu et al., 2006).
Aqueous NaOH with concentrations as high as 0.5 M can be added directly to turbulent seawater with only limited observable precipitation of Mg(OH)2. In these conditions, this precipitated mineral rapidly redissolves on timescales of minutes to seconds. Improved control over the NaOH dosing rate (in our tank experiments, ∼50 mL NaOH min−1) and the turbulence of the receiving water through metered flow-through experiments will be valuable in extrapolating to field conditions. This precipitation is detectable both visually and through turbidity measurements and implies that straightforward measurement of pH and turbidity at the dispersal site can be used to adjust the alkalinity dispersal rate according to local mixing conditions such that Mg(OH)2 precipitation is avoided and/or redissolves when it occurs. No significant CaCO3 precipitation was observed at pH<10.0 or Ωaragonite<30.0. Runaway CaCO3 precipitation was observed above these thresholds, where a massive precipitation and settling of Mg(OH)2 and CaCO3 solids results in less alkalinity in the overlying water than at the starting condition. pH and turbidity sensing combined with discrete TA measurements could be used as a feedback signal for alkalinity dosing into seawater to ensure that the local maximum thresholds at the dispersal location do not approach or exceed conditions that promote significant CaCO3 precipitation. We note that future investigations seeking to better approximate field conditions should take into account seasonal and tidal shifts in temperature and salinity and varying conditions of suspended sediment in the water column, including that of aerial dust, terrestrial runoff, and resuspended bottom sediments.
In these experiments, the seawater was filtered and bleach-treated prior to experiments to limit biological growth, and both tank and aquarium experiments were conducted indoors with limited light. Nevertheless, in most experiments, biological growth was observed after a few weeks, including cyanobacteria and coccolithophores. A series of experiments are underway to test the difference in CO2 removal efficiency for two side-by-side tanks, both of which are dosed with NaOH but only one of which was bleached. Preliminary results show minimal difference between the bleached and unbleached tanks, indicating that these experiments are applicable to real-world conditions, at least for regions with biological communities similar to those of Long Island Sound, but further investigation is warranted.
A focus of future work is to consider the potential impact of the SEA MATE process on local ocean acidification mitigation efforts. We note that, in each constrained tank and aquarium experiment, the pHT at equilibrium exceeds the initial pHT value prior to the addition of alkalinity. A controlled release of alkalinity could theoretically be configured to maintain a locally elevated pHT value relative to pre-alkaline conditions, with potential uses in aquaculture and hatchery environments.
These results provide clear and practical guidelines for MRV for OAE implementations employing aqueous alkalinity. Firstly, carbonate chemistry and turbidity measurements at the alkalinity dispersal location can ensure that seawater parameters such as pH and Ωaragonite remain within pre-determined safe bounds and that unwanted precipitation is avoided. Secondly, for a given OAE deployment, where ocean models provide a reasonable certainty about the fraction of the alkalinity plume remaining in the surface over weeks to months, the CO2 removal efficiency and timescale for air–seawater equilibration provided by our experiments can place a lower bound on the amount of CO2 removal expected from that OAE intervention. Expanding these studies from tank-scale to mesocosm and field experiments will be crucial to understanding biological impacts and constraining realistic air–sea interactions in response to this type of OAE (Oschlies et al., 2023).
Data are described in the paper and provided in the Supplement, which includes a .csv file with processed sensor and sample time series data at hourly resolution.
The supplement related to this article is available online at: https://doi.org/10.5194/bg-21-3551-2024-supplement.
MDE and BRC designed the experiments, and MCR carried them out with support from NH, CS, and XL. JH provided support on experimental setup and instrumentation. MCR prepared the article with contributions from all co-authors.
Mallory C. Ringham is Lead Oceanographer and Head of MRV at Ebb Carbon, Inc. Matthew D. Eisaman is Co-Founder and Chief Scientific Advisor at Ebb Carbon, Inc.
Publisher's note: Copernicus Publications remains neutral with regard to jurisdictional claims made in the text, published maps, institutional affiliations, or any other geographical representation in this paper. While Copernicus Publications makes every effort to include appropriate place names, the final responsibility lies with the authors.
We thank Stephen Abrams and Thomas Wilson at Stony Brook University Flax Pond Marine Lab for technical assistance in the experiment setup, Chris Ikeda and Susan Curless of NOAA/PMEL for support in discrete sample analysis, Mike Tyka for productive discussions, and Eyal Wurgaft for assistance in TA titrations.
This research has been supported by the Grantham Foundation for the Protection of the Environment (grant no. 15: Safe Elevation of Alkalinity for the Mitigation of Acidification Through Electrochemistry – SEA MATE) and the Brookhaven National Laboratory (grant no. DE-SC0012704). Brendan R. Carter and Julian Herndon were funded through the Cooperative Institute for Climate, Ocean, and Ecosystem Studies (CICOES) under 30 NOAA cooperative agreement NA20OAR4320271 and supported by NOAA’s PMEL.
This paper was edited by Jack Middelburg and reviewed by Sijia Dong and two anonymous referees.
Albright, R., Caldeira, L., Hosfelt, J., Kwiatkowski. L., Maclaren, J. K., Mason, B. M., Nebuchina, Y., Ninokawa, A., Pongratz, J., Ricke, K. L., Rivlin, T., Schneider, K., Sesboüé, M., Shamberger, K., Silverman, J., Wolfe, K., Zhu, K., and Caldeira, K.: Reversal of ocean acidification enhances net coral reef calcification, Nature, 531, 362–365, 2016.
Bach, L. T.: The additionality problem of ocean alkalinity enhancement, Biogeosciences, 21, 261–277, https://doi.org/10.5194/bg-21-261-2024, 2024.
Bach, L. T., Gill, S. J., Rickaby, R. E. M., Gore, S., and Renforth, P.: CO2 removal with enhanced weathering and ocean alkalinity enhancement: potential risks and co-benefits for marine pelagic ecosystems, Frontiers in Climate, 1, 7, 2019.
Bainbridge, Z., Lewis, S., Bartley, R., Fabricius, K., Collier, C., Waterhouse, J., Garzon-Garcia, A., Robson, B., Burton, J., Wenger, A., and Brodie, J.: Fine sediment and particulate organic matter: A review and case study on ridge-to-reef transport, transformations, fates, and impacts on marine ecosystems, Mar. Pollut. Bull., 135, 1205–1220, 2018.
Berner, R. A., Lasaga, A. C., and Garrels, R. M.: Carbonate-silicate geochemical cycle and its effect on atmospheric carbon dioxide over the past 100 million years, Am. J. Sci., 283, https://doi.org/10.2475/ajs.283.7.641, 1983.
Boettcher, M., Chai, F. Cullen, J., Goeschl, T., Lampitt, R., Lenton, A., Oschlies, A., Rau, G. H., Rickaby, R., Wanninhof, R., Vivian, C., and Boyd, P. W. : High level review of a wide range of proposed marine geoengineering techniques, GESAMP Working Group Reports and Studies, 41, 2019.
Broderson, K. E., Hammer, K. J., Schrameyer, V., Floytrup, A., Rasheed, M. A., Ralph, P. J., Kühl, M., and Pederson, O.: Sediment resuspension and deposition on seagrass leaves impedes internal plant aeration and promotes phytotoxic Hh2S intrusion, Front. Plant Sci., 8, 657, https://doi.org/10.3389/fpls.2017.00657, 2017.
Burt, D. J., Fröb, F., and Ilyina, T.: The sensitivity of the marine carbonate system to regional ocean alkalinity enhancement, Front. Clim., 3, 624075, https://doi.org/10.3389/fclim.2021.624075, 2021.
Bustos-Serrano, H., Morse, J. W., and Millero, F. J.: The formation of whitings on the Little Bahama Bank, Mar. Chem., 113, 1–8, 2009.
Butenschön, M., Lovato, T., Masina, S., Caserini, S., and Grosso, M.: Alkalinization scenarios in the Mediterranean Sea for efficient removal of atmospheric CO2 and the mitigation of ocean acidification, Front. Clim., 3, 614537, https://doi.org/10.3389/fclim.2021.614537, 2021.
Carter, B. R., Radich, J. A., Doyle, H. L., and Dickson, A. G.: An automated system for spectrophotometric seawater pH measurements, Limnol. Oceanogr.-Meth., 11, 16–27, 2013.
Caserini, S., Storni, N., and Grosso, M.: The availability of limestone and other raw materials for ocean alkalinity enhancement, Global Biogeochem. Cy., 36, e2021GB007246, https://doi.org/10.1029/2021GB007246, 2022.
Cross, J. N., Sweeney, C., Jewett, E. B., Feely, R. A., McElhany, P., Carter, B., Stein, T., Kitch, G. D., and Gledhill, D.: Strategy for NOAA carbon dioxide removal research: A white paper documenting a potential NOAA CDR science strategy as an element of NOAA's Climate Interventions Portfolio, NOAA Special Report, NOAA, Washington, DC, https://doi.org/10.25923/gzke-8730, 2023.
Cyronak, T., Albright, R., and Bach, L. T.: Field experiments in ocean alkalinity enhancement research, in: Guide to Best Practices in Ocean Alkalinity Enhancement Research, edited by: Oschlies, A., Stevenson, A., Bach, L. T., Fennel, K., Rickaby, R. E. M., Satterfield, T., Webb, R., and Gattuso, J.-P., Copernicus Publications, State Planet, 2-oae2023, 7, https://doi.org/10.5194/sp-2-oae2023-7-2023, 2023.
de Lannoy, C.-F., Eisaman, M. D., Jose, A., Karnitz, S. D., DeVaul, R. W., Hannun, K., and Rivest, J. L. B.: Indirect ocean capture of atmospheric CO2: Part I. Prototype of a negative emissions technology, Int. J. Greenh. Gas Con., 70, 243–253, 2018.
Dickson, A. G.: An exact definition of total alkalinity and a procedure for the estimation of alkalinity and total inorganic carbon from titration data, Deep-Sea Res., 28, 609–623, 1981.
Dickson, A. G.: Thermodynamics of the dissociation of boric acid in synthetic seawater from 273.15 to 318.15 K, Deep-Sea Res., 37, 755–766, 1990.
Dickson, A. G.: The development of the alkalinity concept in marine chemistry, Mar. Chem., 40, 49–63, 1992.
Dickson, A. G., Sabine, C. L., and Christian, J. R.: Guide to best practices for ocean CO2 measurements, North Pacific Marine Science Organization, https://doi.org/10.13140/RG.2.2.29818.03528, 2007.
Eisaman, M. D., Parajuly, K., Tuganov, A., Eldershaw, C., Chang, N., and Littau, K. A.: CO2 Extraction from Seawater Using Bipolar Membrane Electrodialysis, Energ. Environ. Sci., 5, 7346, https://doi.org/10.1039/c2ee03393c, 2012.
Eisaman, M. D., Rivest, J. L. B., Karnitz, S. D., De Lannoy, C.-F., Jose, A., DeVaul, R. W., and Hannun, K.: Indirect Ocean Capture of Atmospheric CO2: Part II. Understanding the Cost of Negative Emissions, Int. J. Greenh. Gas Con., 70, 254–261, https://doi.org/10.1016/j.ijggc.2018.02.020, 2018.
Eisaman, M. D., Geilert, S., Renforth, P., Bastianini, L., Campbell, J., Dale, A. W., Foteinis, S., Grasse, P., Hawrot, O., Löscher, C. R., Rau, G. H., and Rønning, J.: Assessing the technical aspects of ocean-alkalinity-enhancement approaches, in: Guide to Best Practices in Ocean Alkalinity Enhancement Research, edited by: Oschlies, A., Stevenson, A., Bach, L. T., Fennel, K., Rickaby, R. E. M., Satterfield, T., Webb, R., and Gattuso, J.-P., Copernicus Publications, State Planet, 2-oae2023, 3, https://doi.org/10.5194/sp-2-oae2023-3-2023, 2023.
Feng, E. Y., Koeve, W., Keller, D. P., and Oschlies, A.: Model-Based Assessment of the CO2 Sequestration Potential of Coastal Ocean Alkalinization, Earths Future, 5, 1252–1266, 2017.
Fennel, K., Long, M. C., Algar, C., Carter, B., Keller, D., Laurent, A., Mattern, J. P., Musgrave, R., Oschlies, A., Ostiguy, J., Palter, J. B., and Whitt, D. B.: Modelling considerations for research on ocean alkalinity enhancement (OAE), in: Guide to Best Practices in Ocean Alkalinity Enhancement Research, edited by: Oschlies, A., Stevenson, A., Bach, L. T., Fennel, K., Rickaby, R. E. M., Satterfield, T., Webb, R., and Gattuso, J.-P., Copernicus Publications, State Planet, 2-oae2023, 9, https://doi.org/10.5194/sp-2-oae2023-9-2023, 2023.
Ferderer, A., Chase, Z., Kennedy, F., Schulz, K. G., and Bach, L. T.: Assessing the influence of ocean alkalinity enhancement on a coastal phytoplankton community, Biogeosciences, 19, 5375–5399, https://doi.org/10.5194/bg-19-5375-2022, 2022.
Friis, K., Körtzinger, A., and Wallace, D. W. R.: The Salinity Normalization of Marine Inorganic Carbon Chemistry Data, Geophys. Res. Lett., 30, 1085, https://doi.org/10.1029/2002GL015898, 2003.
Groen, A., Kittu, L., Ortiz Cortes, J., Schulz, K., and Riebesell, U.: Assessing the response of particulate organic matter stoichiometry to ocean alkalinisation, Ocean Visions Summit, Atlanta, Georgia, USA, 4–6 April 2023, Bibcode: 2023EGUGA..2512209G, 2023.
Hartmann, J., Suitner, N., Lim, C., Schneider, J., Marín-Samper, L., Arístegui, J., Renforth, P., Taucher, J., and Riebesell, U.: Stability of alkalinity in ocean alkalinity enhancement (OAE) approaches – consequences for durability of CO2 storage, Biogeosciences, 20, 781–802, https://doi.org/10.5194/bg-20-781-2023, 2023.
Harvey, L.: Mitigating the atmospheric CO2 increase and ocean acidification by adding limestone powder to upwelling regions, J. Geophys. Res.-Oceans, 113, C04028, https://doi.org/10.1029/2007JC004373, 2008.
He, J. and Tyka, M. D.: Limits and CO2 equilibration of near-coast alkalinity enhancement, Biogeosciences, 20, 27–43, https://doi.org/10.5194/bg-20-27-2023, 2023.
Ho, D. T., Bopp, L., Palter, J. B., Long, M. C., Boyd, P. W., Neukermans, G., and Bach, L. T.: Monitoring, reporting, and verification for ocean alkalinity enhancement, in: Guide to Best Practices in Ocean Alkalinity Enhancement Research, edited by: Oschlies, A., Stevenson, A., Bach, L. T., Fennel, K., Rickaby, R. E. M., Satterfield, T., Webb, R., and Gattuso, J.-P., Copernicus Publications, State Planet, 2-oae2023, 12, https://doi.org/10.5194/sp-2-oae2023-12-2023, 2023.
Ilyina, T., Wolf-Gladrow, D., Munhoven, G., and Heinze, C.: Assessing the potential of calcium-based artificial ocean alkalinization to mitigate rising atmospheric CO2 and ocean acidification, Geophys. Res. Lett., 40, 5909–5914, 2013.
IPCC: Summary for Policymakers, in: Climate Change 2021: The Physical Science Basis, Contribution of Working Group I to the Sixth Assessment Report of the Intergovernmental Panel on Climate Change, edited by: Masson-Delmotte, V., Zhai, P., Pirani, A., Connors, S. L., Péan, C., Berger, S., Caud, N., Chen, Y., Goldfarb, L., Gomis, M. I., Huang, M., Leitzell, K., Lonnoy, E., Matthews, J. B. R., Maycock, T. K., Waterfield, T., Yelekçi, O., Yu, R., and Zhou, B.: Cambridge University Press, Cambridge, United Kingdom and New York, NY, USA, 3–32, https://doi.org/10.1017/9781009157896.001, 2022.
Isson, T. T., Planavsky, N. J., Coogan, L. A., Stewart, E. M., Ague, J. J., Bolton, E. W., Zhang, S., McKenzie, N. R., and Kump, L. R.: Evolution of the global carbon cycle and climate regulation on earth, Global Biogeochem. Cy., 34, e2018GB006061, https://doi.org/10.1029/2018GB006061, 2020.
Johnson, K. M., King, A. E., and Sieburth, J. M.: Coulometric TCO2 analyses for marine studies: An introduction, Mar. Chem., 16, 61–82, 1985.
Jones, D. C., Ito, T., Takano, Y., and Hsu, C.-W.: Spatial and seasonal variability of the air-sea equilibration timescale of carbon dioxide, Global Biogeochem. Cy., 28, 1163–1178, https://doi.org/10.1002/2014GB004813, 2014.
Kheshgi, H. S.: Sequestering atmospheric carbon dioxide by increasing ocean alkalinity, Energy, 20, 915–922, 1995.
Köhler, P., Hartmann, J., and Wolf-Gladrow, D. A.: Geoengineering potential of artificially enhanced silicate weathering of olivine, P. Natl. Acad. Sci. USA, 107, 20228–20233, 2010.
La Plante, E., Chen, X., Bustillos, S., Bouissonnie, A., Traynor, T., Jassby, D., Corsini, L., Simonetti, D., and Sant, G.: Electrolytic seawater mineralization and the mass balances that demonstrate carbon dioxide removal, ACS EST Engg., 3, 955–968, https://doi.org/10.1021/acsestengg.3c00004, 2023.
Lee, K., Kim, T.-W., Byrne, R. H., Millero, F. J., Feely, R. A., and Liu, Y.-M.: The universal ratio of boron to chlorinity for the North Pacific and North Atlantic oceans, Geochim. Cosmochim. Ac., 74, 1801–1811, 2010.
Lewis, E., Wallace, D., and Allison, L. J.: Program developed for CO2 system calculations, US, https://doi.org/10.2172/639712, 1998.
Liu, X., Wang, Z. A., Byrne, R. H., Kaltenbacher, E. A., and Bernstein, R. E.: Spectrophotometric measurements of pH in-situ: laboratory and field evaluations of instrumental performance, Environ. Sci. Technol., 40, 5026–5044, 2006.
Lu, X., Ringham, M., Hirtle, N., Hillis, K., Shaw, C., Herndon, J., Carter, B. R., and Eisaman, M. D.: Characterization of an Electrochemical Approach to Ocean Alkalinity Enhancement, AGU Fall Meeting, Chicago, IL, USA, 12–16 December 2022, Bibcode: 2022AGUFMGC31C..01L, Vol. 2022, GC31C-01, 2022.
Lueker, T. J., Dickson, A. G., and Keeling, C. D.: Ocean pCO2 calculated from dissolved inorganic carbon, alkalinity, and equations for K1 and K2: validation based on laboratory measurements of CO2 in gas and seawater at equilibrium, Mar. Chem., 70, 105–119, 2000.
Minx, J. C., Lamb, W. F., Callaghan, M. W., Fuss, S., Hilaire, J., 15 Creutzig, F., Amann, T., Beringer, T., de Oliveira Garcia, W., Hartmann, J., Khanna, T., Lenzi, D., Luderer, G., Nemet, G.F., Rogelj, J., Smith, P., Vicente, J.L.V., Wilcox, J., and del Mar Zamora Dominguez, M.: Negative emissions – Part 1: Research landscape and synthesis, Environ. Res. Lett., 13, 063001, https://doi.org/10.1088/1748-9326/aabf9b, 2018.
Montserrat, F., Renforth, P., Hartmann, J., Leermakers, M., Knops, P., and Meysman, F. J. R.: Olivine dissolution in seawater: implications for CO2 sequestration through enhanced weathering in coastal environments, Environ. Sci. Technol., 51, 3960–3972, 2017.
Moras, C. A., Bach, L. T., Cyronak, T., Joannes-Boyau, R., and Schulz, K. G.: Ocean alkalinity enhancement – avoiding runaway CaCO3 precipitation during quick and hydrated lime dissolution, Biogeosciences, 19, 3537–3557, https://doi.org/10.5194/bg-19-3537-2022, 2022.
National Academies of Sciences, Engineering, and Medicine (NASEM): Negative Emissions Technologies and Reliable Sequestration: A Research Agenda, https://doi.org/10.17226/25259, 2018.
National Academies of Sciences, Engineering, and Medicine (NASEM): A research strategy for ocean-based carbon dioxide removal and sequestration, https://doi.org/10.17226/26278, 2021.
Nduagu, E.: Production of Mg(OH)2 from Mg-silicate rock for CO2 mineral sequestration, Dissertation for Abo Akademi University, ISBN 978-952-12-2821-6, 2012.
Oschlies, A., Bach, L. T., Rickaby, R. E. M., Satterfield, T., Webb, R., and Gattuso, J.-P.: Climate targets, carbon dioxide removal, and the potential role of ocean alkalinity enhancement, in: Guide to Best Practices in Ocean Alkalinity Enhancement Research, edited by: Oschlies, A., Stevenson, A., Bach, L. T., Fennel, K., Rickaby, R. E. M., Satterfield, T., Webb, R., and Gattuso, J.-P., Copernicus Publications, State Planet, 2-oae2023, 1, https://doi.org/10.5194/sp-2-oae2023-1-2023, 2023.
Pierrot, D., Lewis, E., and Wallace, D. W. R.: MS Excel program developed for CO2 system calculations. ORNL/CDIAC-105a, Carbon Dioxide Information Analysis Center, Oak Ridge National Laboratory, U. S. Department of Energy, Oak Ridge, Tennessee, https://github.com/dpierrot/co2sys_xl (last access: January 2022), 2006.
Rau, G. H.: Electrochemical splitting of calcium carbonate to increase solution alkalinity: Implications for mitigation of carbon dioxide and ocean acidity, Environ. Sci. Technol., 42, 8935–8940, 2008.
Renforth, P. and Henderson, G.: Assessing ocean alkalinity for carbon sequestration, Rev. Geophys., 55, 636–674, 2017.
Rigopoulos, I., Harrison, A. L., Delimitis, A., Ioannou, I., Efstathiou, A. M., Kyratsi, T., and Oelkers, E. H.: Carbon sequestration via enhanced weathering of peridotites and basalts in seawater, Appl. Geochem., 91, 197–207, 2018.
Rogelj, J., Popp, A., Calvin, K. V., Luderer, G., Emmerling, J., Gernaat, D., Fujimori, S., Strefler, J., Hasegawa, T., Marangoni, G., Krey, V., Kriegler, E., Riahi, K., van Vuuren, D. P., Doelman, J., Drouet, L., Edmonds, J., Fricko, O., Harmsen, M., Havlík, P., Humpenöder, F., Stehfest, E., and Tavoni, M.: Scenarios towards limiting global mean temperature increase below 1.5 °C, Nat. Clim. Change, 8, 325–332, https://doi.org/10.1038/s41558-018-0091-3, 2018.
Rueda, O., Mogollón, J. M., Tukker, A., and Scherer, L.: Negative-emissions technology portfolios to meet the 1.5 °C target, Global Environ. Chang., 67, 102238, https://doi.org/10.1016/j.gloenvcha.2021.102238, 2021.
Schulz, K. G., Bach, L. T., and Dickson, A. G.: Seawater carbonate chemistry considerations for ocean alkalinity enhancement research: theory, measurements, and calculations, in: Guide to Best Practices in Ocean Alkalinity Enhancement Research, edited by: Oschlies, A., Stevenson, A., Bach, L. T., Fennel, K., Rickaby, R. E. M., Satterfield, T., Webb, R., and Gattuso, J.-P., Copernicus Publications, State Planet, 2-oae2023, 2, https://doi.org/10.5194/sp-2-oae2023-2-2023, 2023.
Shaw, C., Ringham, M. C., Lu, X., Carter, B. R., Eisaman, M. D., and Tyka, M.: Understanding the Kinetics of Electrochemically derived Magnesium Hydroxide for Ocean Alkalinity Enhancement, AGU Fall Meeting, Chicago, IL, USA, 12–16 December 2022, Bibcode: 2022AGUFMGC32I0713S, Vol. 2022, GC32I-0713, 2022.
Song, S., Wang, Z. A., Gonneea, M. E., Kroeger, K. D., Chu, S. N., Li, D., and Liang, H.: An important biogeochemical link between organic and inorganic carbon cycling: Effects of organic alkalinity on carbonate chemistry in coastal waters influenced by intertidal salt marshes, Geochim. Cosmochim. Ac., 275, 123–139, 2020.
Suitner, N., Faucher, G., Lim, C., Schneider, J., Moras, C. A., Riebesell, U., and Hartmann, J.: Ocean alkalinity enhancement approaches and the predictability of runaway precipitation processes – Results of an experimental study to determine critical alkalinity ranges for safe and sustainable application scenarios, EGUsphere [preprint], https://doi.org/10.5194/egusphere-2023-2611, 2023.
Tyka, M. D., Arsdale, C. V., and Platt, J. C.: CO2 capture by pumping surface acidity to the deep ocean, Energ. Environ. Sci., 15, 786–798, 2022.
Van Heuven, S., Pierrot, D., Rae, J., Lewis, E., and Wallace, D.: MATLAB program developed for CO2 system calculations, ORNL/CDIAC-105b, 530, https://doi.org/10.3334/CDIAC/otg.CO2SYS_MATLAB_v1.1, 2011.
Vitillo, J. G., Eisaman, M. D., Aradóttir, E. S. P., Passarini, F., Wang, T., and Sheehan, S. W.: The role of carbon capture, utilization and storage for economic pathways that limit global warming to below 1.5 °C, Iscience, 25, 104237, https://doi.org/10.1016/j.isci.2022.104237, 2022.
Wang, H., Pilcher, D. J., Kearney, K. A., Cross, J. N., Shugart, O. M., Eisaman, M. D., and Carter, B. R.: Simulated impact of ocean alkalinity enhancement on atmospheric CO2 removal in the Bering Sea, Earths Future, 11, e2022EF002816, https://doi.org/10.1029/2022EF002816, 2023.
Wang, Z. A. and Cai, W. J.: Carbon dioxide degassing and inorganic carbon export from a marsh-dominated estuary (the Duplin River): A marsh CO2 pump, Limnol. Oceanogr., 49, 341–354, 2004.
Wolf-Gladrow, D. A., Zeebe, R. E., Klaas, C., Körtzinger, A., and Dickson, A. G.: Total alkalinity: The explicit conservative expression and its application to biogeochemical processes, Mar. Chem., 106, 287–300, 2007.
Wurgaft, E., Steiner, Z., Luz, B., and Lazar, B.: Evidence for inorganic precipitation of CaCO3 on suspended solids in the open water of the Red Sea, Mar. Chem., 186, 145–155, 2016.
Wurgaft, E., Wang, Z., Churchill, J., Dellapenna, T., Song, S., Du,J., Ringham, M., Rivlin, T., and Lazar, B.: Particle triggered reactions as an important mechanism of alkalinity and inorganic carbon removal in river plumes, Geophys. Res. Lett., 48, e2021GL093178, https://doi.org/10.1029/2021GL093178, 2021.
Zeebe, R. E. and Wolf-Gladrow, D.: CO2 in seawater: equilibrium, kinetics, isotopes, Vol. 65, Gulf Professional Publishing, ISBN 9780444509468, 2001.
Zhang, H. and Byrne, R. H.: Spectrophotometric pH measurements of surface seawater at in-situ conditions: absorbance and protonation behavior of thymol blue, Mar. Chem., 52, 17–25, 1996.