the Creative Commons Attribution 4.0 License.
the Creative Commons Attribution 4.0 License.
 | 04 Sep 2024
Drivers of decadal trends in the ocean carbon sink in the past, present, and future in Earth system models
The ocean and the land biosphere are the two major sinks of anthropogenic carbon at present. When anthropogenic carbon emissions become zero and temperatures stabilize, the ocean is projected to become the dominant and only global natural sink of carbon. Despite the ocean's importance for the carbon cycle and hence the climate, uncertainties about the decadal variability in this carbon sink and the underlying drivers of this decadal variability remain large because observing the ocean carbon sink and detecting anthropogenic changes over time remain challenging. The main tools that are used to provide annually resolved estimates of the ocean carbon sink over the last decades are global observation-based pCO2 products that extrapolate sparse pCO2 observations in space and time and global ocean biogeochemical models forced with atmospheric reanalysis data. However, these tools (i) are limited in time over the last 3 to 7 decades, which hinders statistical analyses of the drivers of decadal trends; (ii) are all based on the same internal climate state, which makes it impossible to separate externally and internally forced contributions to decadal trends; and (iii) cannot assess the robustness of the drivers in the future, especially when carbon emissions decline or cease entirely. Here, I use an ensemble of 12 Earth system models (ESMs) from phase 6 of the Coupled Model Intercomparison Project (CMIP6) to understand drivers of decadal trends in the past, present, and future ocean carbon sink. The simulations by these ESMs span the period from 1850 to 2100 and include four different future Shared Socioeconomic Pathways (SSPs), from low emissions and high mitigation to high emissions and low mitigation. Using this ensemble, I show that 80 % of decadal trends in the ocean carbon sink can be explained by changes in decadal trends in atmospheric CO2 as long as the ocean carbon sink remains smaller than 4.5 Pg C yr−1. The remaining 20 % are due to internal climate variability and ocean heat uptake, which result in a loss of carbon from the ocean. When the carbon sink exceeds 4.5 Pg C yr−1, which only occurs in the high-emission SSP3-7.0 and SSP5-8.5, atmospheric CO2 rises faster, climate change accelerates, and the ocean overturning and the chemical capacity to take up carbon from the atmosphere reduce, so that decadal trends in the ocean carbon sink become substantially smaller than estimated based on changes in atmospheric CO2 trends. The breakdown of this relationship in both high-emission pathways also implies that the decadal increase in the ocean carbon sink is effectively limited to ∼1 Pg C yr−1 dec−1 in these pathways, even if the trend in atmospheric CO2 continues to increase. Previously proposed drivers, such as the atmospheric CO2 or the growth rate of atmospheric CO2, can explain trends in the ocean carbon sink for specific time periods, for example, during exponential atmospheric CO2 growth, but fail when emissions start to decrease again. The robust relationship over an ensemble of 12 different ESMs also suggests that very large positive and negative decadal trends in the ocean carbon sink by some pCO2 products are highly unlikely and that the change in the decadal trends in the ocean carbon sink around 2000 is likely substantially smaller than estimated by these pCO2 products.
- Article
(6125 KB) - Full-text XML
- BibTeX
- EndNote


The ocean has taken up around one-quarter of all anthropogenic CO2 emissions from land-use change and fossil fuels since the beginning of the Industrial Revolution (Friedlingstein et al., 2023; Gruber et al., 2023; Terhaar et al., 2022b). As such, in addition to the land biosphere, it is one of the two major natural sinks of carbon in the Earth system. If land-use change emissions are regarded as part of the land carbon sink, the land becomes almost neutral and the ocean carbon sink becomes the only major natural carbon sink (Friedlingstein et al., 2023). Once temperatures stabilize, the ocean will become the dominant global natural sink of carbon (Silvy et al., 2024) and will store more than half of the anthropogenically emitted CO2 in around 1000 years (Joos et al., 2013). By taking up carbon from the atmosphere, the ocean effectively slows down global warming (IPCC, 2021) and will contribute to stabilizing global temperatures over the next centuries if emissions reach near-zero (Terhaar et al., 2023; MacDougall et al., 2020). Here, I define the ocean carbon sink as in the Global Carbon Budget as the change in air–sea CO2 flux due to anthropogenic carbon emissions and anthropogenic climate change in comparison to a relatively stable pre-industrial state (Friedlingstein et al., 2023). Consequently, “anthropogenic” refers to direct effects from anthropogenic emissions and indirect effects from anthropogenically caused climate change.
The overall magnitude of the ocean carbon sink is mainly determined by the ocean overturning circulation, i.e., the rate at which surface waters with increased anthropogenic carbon content can be transported to the deep ocean and be replaced by waters with low anthropogenic carbon content (Sarmiento et al., 1992; Caldeira and Duffy, 2000; Orr et al., 2001). Furthermore, the magnitude of the ocean carbon sink is influenced by the surface ocean capacity to take up more anthropogenic carbon, which itself is determined by the surface ocean carbonate chemistry and especially the alkalinity (Broecker et al., 1979; Terhaar et al., 2022b). Over the historical period, the change in atmospheric CO2 has been the main driver of changes in the ocean carbon sink and is assumed to be approximately proportional to the strength of the ocean carbon sink (Mikaloff Fletcher et al., 2006; Gruber et al., 2009; Terhaar et al., 2021b). However, this linear relationship between the strength of the ocean carbon sink and atmospheric CO2 is only assumed to work under exponential atmospheric CO2 growth (Raupach, 2013; Raupach et al., 2014; Ridge and McKinley, 2021).
Over the last decades, the relatively steady growth of the ocean carbon sink has been weakened by outgassing of natural carbon due to warming and climate change (Joos et al., 1999; McNeil and Matear, 2013; Frölicher et al., 2015) and is superimposed by decadal variability and trends in the ocean carbon sink, i.e., a reduction in the 1990s and an increase since 2000 (Lovenduski et al., 2008, 2007; Le Quéré et al., 2007; Landschützer et al., 2015, 2016). A consensus of the drivers of these trends is still not reached, and possible explanations for these different trends are changes in wind and pressure systems (Le Quéré et al., 2007; Keppler and Landschützer, 2019), variability in the ocean circulation and ventilation (DeVries et al., 2017), and changes in the atmospheric CO2 growth rate and ocean surface temperature due to the eruption of Mount Pinatubo (McKinley et al., 2020; Frölicher et al., 2011). Moreover, recent studies suggest that the observation-based decadal variability over the last decades might be overestimated (Gloege et al., 2021; Hauck et al., 2023).
Despite the importance of the ocean carbon sink for the global climate and carbon cycle, observing or simulating the ocean carbon sink is still challenging. The two main tools to estimate the annually resolved ocean carbon sink over the past 3 to 7 decades, to provide an annual update every year within the Global Carbon Budget and to understand the drivers of the magnitude and trends in the ocean carbon sink, are observation-based pCO2 products and global ocean biogeochemical models (GOBMs) (Friedlingstein et al., 2023; Hauck et al., 2023). Observation-based pCO2 products extrapolate sparse observations of surface ocean pCO2 using statistical methods and/or machine learning to create global monthly maps of surface ocean pCO2 (Fay et al., 2021; Gregor and Gruber, 2021; Chau et al., 2022; Rödenbeck et al., 2015; Watson et al., 2020; Landschützer et al., 2015; Gloege et al., 2022; Bennington et al., 2022a, b). These monthly pCO2 maps are then used to estimate the global ocean carbon uptake. In addition, an estimate of pre-industrial natural outgassing of CO2 due to the difference in riverine carbon input and carbon sequestration in sediments (Lacroix et al., 2020; Regnier et al., 2022) has to be added to estimate the change in the air–sea CO2 flux with respect to pre-industrial conditions. Global ocean biogeochemical models (GOBMs) (Orr et al., 2001; Hauck et al., 2020; Terhaar et al., 2024) simulate the ocean carbon sink while being forced with past observed atmospheric CO2 and observation-based reanalysis data, such as wind, humidity, precipitation, and temperature (Hersbach et al., 2020; Tsujino et al., 2018).
The estimates of both product classes vary in magnitude and decadal trends, with pCO2 products estimating a larger magnitude of the ocean carbon sink and also generally larger decadal trends over the last 2 decades (DeVries et al., 2023; Friedlingstein et al., 2023). One reason for the low carbon sink in GOBMs might be that the starting year of these simulations is often later than the beginning of the increase in atmospheric CO2; thus the atmospheric CO2 in the pre-industrial reference period and the pCO2 in the ocean are too high (Terhaar et al., 2019, 2024; Bronselaer et al., 2017). Another reason for the low carbon sink is the existing biases in GOBMs in their simulated ocean circulation, especially Southern Ocean and Atlantic Ocean overturning, and the biases in the surface ocean carbonate chemistry (Terhaar et al., 2024). Similar biases were previously identified in Earth system model (ESM) ensembles (Terhaar et al., 2022b, 2021b; Goris et al., 2018). As opposed to the magnitude, the differences in the decadal trends between pCO2 products and GOBMs might be due to uneven sampling of observations in space and in time, e.g., few observations in the 1980s and 1990s and few observations in the Southern Hemisphere, as demonstrated with a subset of pCO2 products evaluated with output from a GOBM (Hauck et al., 2023) and ESMs (Gloege et al., 2021). In addition to differences in trends between pCO2 products and GOBMs, no consensus has yet been made with respect to the underlying drivers of the decadal trends in the ocean carbon sink (Friedlingstein et al., 2023; DeVries et al., 2023; Gruber et al., 2023). The detection of these drivers with pCO2 products, GOBMs, and other methods, such as data assimilation models (DeVries et al., 2017), is difficult due to the relatively short time period over which enough pCO2 observations and atmospheric reanalysis data exist, due to the relative homogeneity of drivers over this period, e.g., constantly increasing atmospheric CO2, and the absence of an alternative climate state against which these ocean carbon sink estimates can be compared.
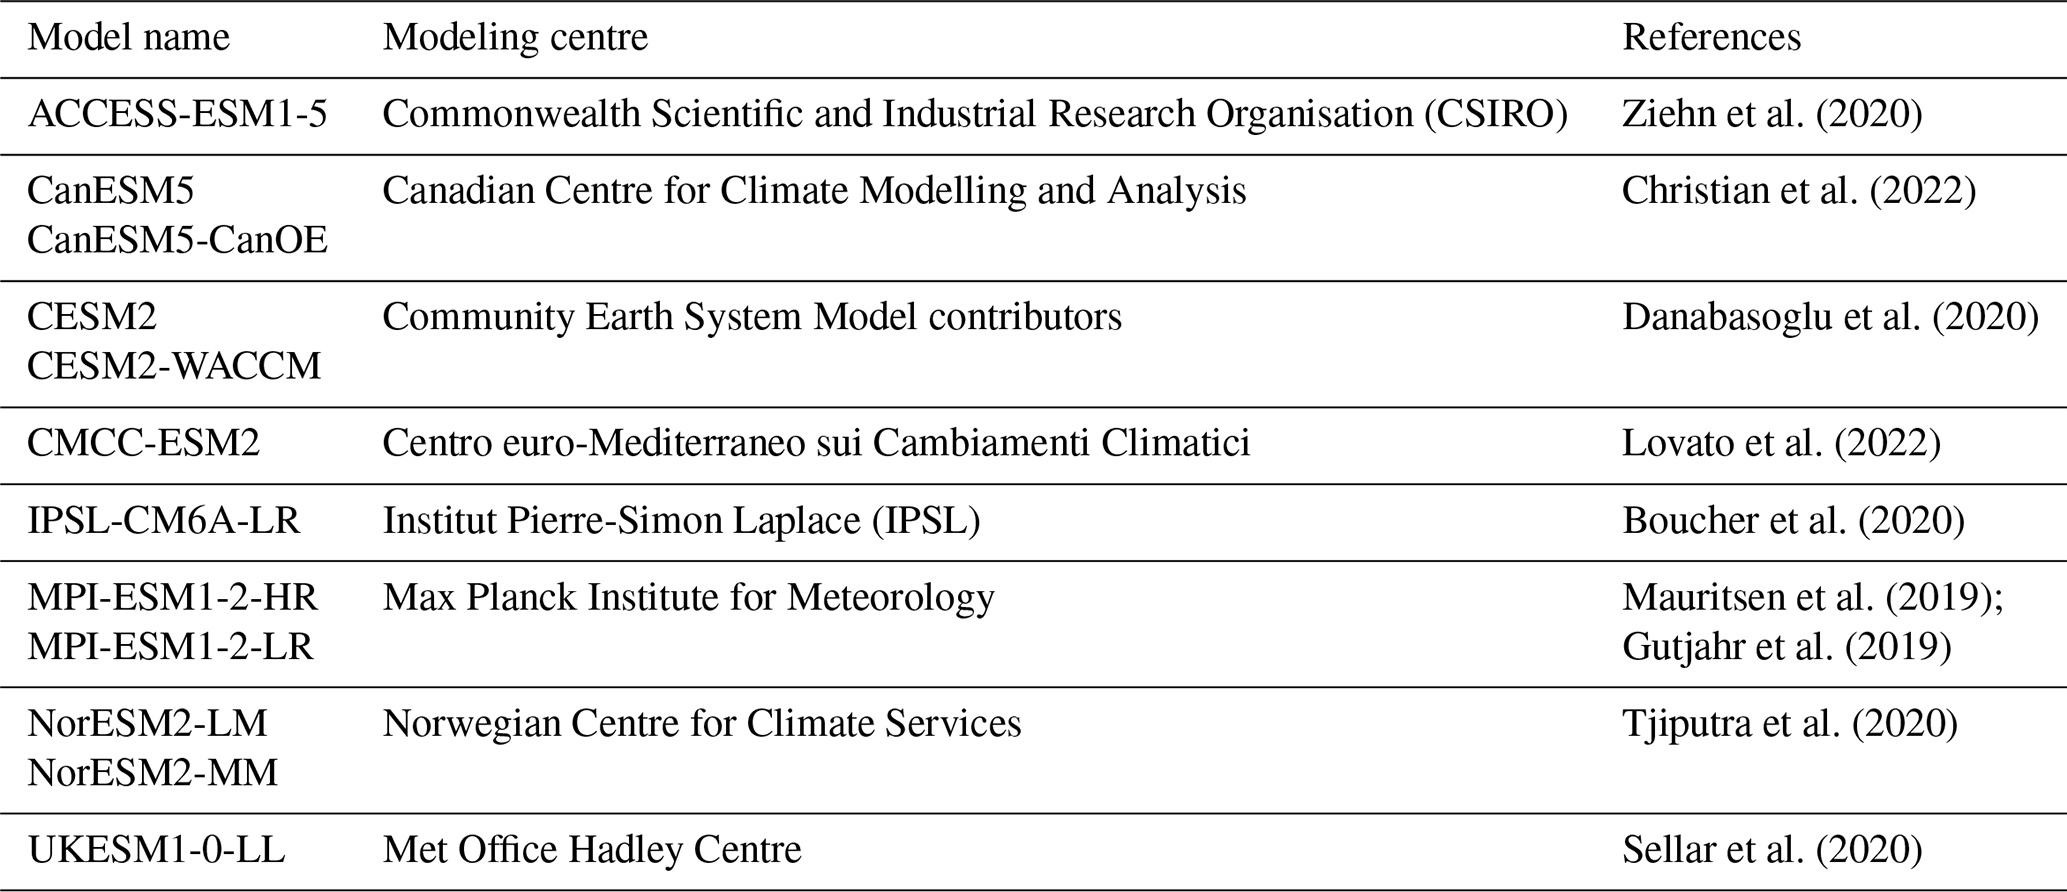
Here, I use an ensemble of 12 ESMs from phase 6 of the Coupled Model Intercomparison Project (CMIP6) (Table 1) to provide a new perspective on potential drivers of the decadal trends in the ocean carbon sink, i.e., the underlying causes of its multi-decadal variability. Fully coupled ESMs are another tool to quantify and understand the ocean carbon sinks (e.g., Joos et al., 1999; McNeil and Matear, 2013; Frölicher et al., 2015; Goris et al., 2018; Terhaar et al., 2022b, 2021b). As ESMs are fully coupled and not forced with atmospheric reanalysis data, they do not simulate the same inter-annual internal climate variability as pCO2 products and GOBMs do, and their biases of the surface ocean physics and biogeochemistry are thus larger than surface ocean biases of GOBMs (Terhaar et al., 2022b, 2024). However, ESMs have distinctive advantages compared to pCO2 products and GOBMs for the analysis of decadal drivers of the ocean carbon sink because (1) they cover a period of 251 years from 1850 to 2100, (2) they cover at least four different future scenarios, and (3) they all have a different internal climate state. The long time period with different climate states in each model gives ample material to perform statistical analyses, and the different future scenarios allow testing to see how robustly potential drivers predict the decadal variability in the ocean carbon sink under continuously rising and strongly decreasing carbon emission trajectories. Furthermore, using different ESMs (e.g., Goris et al., 2018; Terhaar et al., 2022b, 2021b; McKinley et al., 2023) in comparison to large ensembles of one ESM (Fay et al., 2023; McKinley et al., 2016) avoids the risk of having a common bias in that one ESM, which might wrongly influence the analysis. Using the ESM ensemble from CMIP6, I will present how potential drivers of the ocean carbon sink (i.e., the atmospheric CO2 and its growth rate, ocean heat uptake, and climate variability) drive trends in the ocean carbon sink from 1850 to 2100 in these models.
2.1 Earth system model ensemble
In this study, I use an ensemble of 12 ESMs from CMIP6 (Table 1). All ESMs from CMIP6 that provide the necessary model output for the following analysis were chosen. For each ESM, only the first ensemble member is used, as averaging over multiple ensemble members would have removed variability and using different numbers of ensemble members per ESM would have biased results towards the ESMs with more ensemble members.
Table 1CMIP6 models used in this study and the corresponding model groups.
2.2 Calculating the ocean carbon sink
The annually averaged ocean carbon sink was calculated from concentration-driven historical simulations from CMIP (1850–2014) and four different concentration-driven Shared Socioeconomic Pathways (SSPs) (2015–2100): the low-emission high-mitigation SSP1-2.6, the high-emission low-mitigation SSP5-8.5, and the two intermediate pathways SSP2-4.5 and SSP3-7.0 (Riahi et al., 2017). To account for drifts in the historical and SSP simulations, a linear fit was calculated over the annual carbon sink over the years of the pre-industrial control run that correspond to the years 1850 to 2100 in the historical and SSP simulations. The linear change in the carbon sink in the pre-industrial simulations since 1850 was then subtracted from the historical and SSP simulations.
Furthermore, ESMs have biases in the magnitude of the ocean carbon sink due to biases in their respective circulation and surface ocean carbonate chemistry that also affect the size of the decadal trends; i.e., a negative bias in the magnitude of the carbon sink also introduces a negative bias in the decadal trends. To statistically compare the decadal trends in the carbon sink over the ESM ensemble used here, the global estimate of the ocean carbon sink was adjusted for each ESM with respect to biases in its circulation and surface ocean carbonate chemistry following Terhaar et al. (2022). Firstly, the Revelle factor, the inter-frontal Southern Ocean sea surface salinity, and the Atlantic Meridional Overturning Circulation (AMOC) strength were calculated for each model. Afterwards, a multi-linear fit was performed with the three observation-based quantities as predictors and the average ocean carbon sink from 1850 to 2100 as target variables (the period from 2015 to 2100 was used four times for each of the four SSPs). Finally, the biases in each predictor with respect to observation-based estimates of these predictors were calculated and used to adjust the simulated ocean carbon sink based on the determined constants from the multi-linear fit. Overall, this result in an adjustment of 10±7 % (i.e., increased ocean carbon uptake) for the model ensemble used here. The adjustment corrects for known biases in the models' circulations and surface ocean carbonate chemistry and hence reduced differences in the overall magnitude of the simulated carbon sink between ESMs (Terhaar et al., 2022b). This reduction in the difference in the magnitude of the carbon sink also reduces differences between the magnitude of trends and slightly improves the relationships found here (r2 in Fig. 3 would have been 0.83 without adjustment instead of 0.91 with adjustment). Nevertheless, the results are quantitatively and qualitatively almost identical with and without that adjustment.
The ocean carbon sink was also calculated for each of the five major ocean basins (Atlantic Ocean, Pacific Ocean, Indian Ocean, Arctic Ocean, and Southern Ocean) using the RECCAP2 biome mask (DeVries et al., 2023; Terhaar et al., 2024), which is a slightly adapted version of a previously developed biome mask (Fay and McKinley, 2014). Regionally, no bias adjustments were performed, as it still remains largely unclear, apart from the Southern Ocean (Terhaar et al., 2021b), how biases in circulation and carbonate chemistry affect the regional ocean carbon sink estimates.
2.3 Atmospheric CO2 and growth rate
The annually averaged atmospheric CO2 over the historical period and for each SSP was taken from the CMIP6 forcing files (Meinshausen et al., 2020, 2017). The atmospheric CO2 growth rate in each year was calculated as the difference in atmospheric CO2 between that year and the year before.
2.4 Estimating the effect of climate change and ocean heat uptake on the ocean carbon sink
The effect of climate change and ocean heat uptake on the ocean carbon sink in ESMs was calculated based on additional idealized simulations provided by 5 of the 12 ESMs in the ensemble (ACCESS-ESM1-5, CanESM5, MRI-ESM2-0, NorESM2-LM, and UKESM1-0-LL) within the CMIP6 framework. These five ESMs made historical simulations, called “bgc”, where the change in atmospheric CO2 has no effect on climate change but the carbon cycle still “sees” the increase in atmospheric CO2. However, other non-CO2 radiative agents (aerosols, CH4, N2O, etc.) still affect the climate in these simulations. These “bgc” simulations were only made for SSP5-8.5 (“ssp585-bgc”) and not for the other SSPs. The difference between the normal historical and SSP5-8.5 simulations (including effects from CO2 and non-CO2 radiative agents) and the respective additional “bgc” simulations quantifies the heat and carbon fluxes that are solely due to CO2-induced climate change and warming.
2.5 Climate modes
To assess the climate variability across the ensemble of the ESM, annual averages of three climate modes were calculated for each ESM over the 251 years of the pre-industrial control simulation: (1) the Atlantic Multi-decadal Oscillation (AMO), (2) the Niño 3.4 index, and (3) the Marshall Southern Annular Mode (SAM) index. The AMO was calculated based on SST anomalies in the North Atlantic between 0 and 80° N. The Niño 3.4 index was calculated based on SST anomalies in the tropical Pacific region from 5° S to 5° N and from 170 to 120° W. The Marshall SAM index was calculated as anomalies of the zonal pressure difference between the latitudes of 40 and 65° S. Anomalies for each index in ESMs were calculated by removing a linear fit over the 251 years of the pre-industrial control simulation.
In addition, observation-based estimates of each climate mode were used. The observation-based AMO index (https://climatedataguide.ucar.edu/sites/default/files/2022-03/amo_monthly.txt, last access: 10 June 2024) and the Niño 3.4 index (https://psl.noaa.gov/gcos_wgsp/Timeseries/Data/nino34.long.data, last access: 10 June 2024) are based on HadISST1 (Rayner et al., 2003). The Marshall SAM index was calculated based on 12 stations: 6 stations at ∼40° S and 6 stations at ∼65° S (Marshall, 2003). To compare each observation-based index to the simulated index in the pre-industrial control simulations, the time series of the observation-based indexes have been detrended by subtracting a linear trend over the respective observation-based index estimate.
2.6 Decadal trends
Decadal trends in different variables are defined here as the slope of linear fits over 10 years.
2.7 Coefficient of determination, p-values, and Bayes factor
To determine the strength of correlations, the coefficient of correlation was calculated throughout this study (r2). In addition, the p-value was calculated to test the hypothesis that the trend change in atmospheric CO2 from 1 decade to another decade is a significant driver of trends in the global and regional ocean carbon sink. A p-value larger than 0.1 indicates little or no evidence for that hypothesis, a p-value from 0.1 to 0.05 indicates weak evidence or a suggestion of evidence, a p-value from 0.05 to 0.01 indicates evidence or modest evidence, and a p-value from 0.01 to 0.001 indicates strong evidence (Held and Ott, 2018). In addition, an upper bound for the Bayes factor can be calculated following Halsey (2019). Throughout the paper, the p-values are never larger than , resulting in Bayes factors that are at least 1×1086. Based on the Bayes factor, the hypothesis that the trend change in atmospheric CO2 from 1 decade to another decade is a significant driver of trends in the global and regional ocean carbon sink is 1×1086 more likely than the hypothesis that the trend change in atmospheric CO2 from 1 decade to another decade is not a significant driver of trends in the global and regional ocean carbon sink. As p-values are that small and Bayes factors are that high, I simply refrain from reporting that the p-values are smaller than 0.001.
3.1 Atmospheric CO2
Over the historical period of CMIP6 simulations from 1850 to 2014, the annually averaged global ocean carbon sink has increased approximately proportionally to the rise in atmospheric CO2 (Fig. 1a, b, c). Due to the exponential rise in atmospheric CO2, the cumulative ocean carbon sink is also approximately proportional to the rise in atmospheric CO2. However, these quasi-linear relationships did not hold from 1920 (atmospheric CO2 of 304 ppm) to 1960 (317 ppm) and from 1990 (354 ppm) to 1995 (360 ppm), when the ocean carbon sink did not increase while the atmospheric CO2 continued to increase. These periods manifest themselves as “jumps” in the linear relationship between the atmospheric CO2 and the cumulative ocean carbon sink (indicated by light-gray shading in Fig. 1d).
After 2014, when the historical period in CMIP6 ends and SSPs start, the link between atmospheric CO2 and the ocean carbon sink depends strongly on the future scenario of atmospheric CO2. The linear relationship between the annually averaged carbon sink and atmospheric CO2 breaks down under all scenarios. Under SSP5-8.5, a pathway with a continuous increase in emissions (Riahi et al., 2017) and exponentially growing atmospheric CO2 (Fig. 1a), the increase in the ocean carbon sink per increase in atmospheric CO2 reduces until the ocean carbon sink reaches a maximum just above 6 Pg C yr−1 (Fig. 1b), which is not exceeded even if atmospheric CO2 rises (Fig. 1e). Under SSP3-7.0, a pathway with slightly smaller emissions and atmospheric CO2 than SSP5-8.5, the ocean carbon sink also converges to a maximum but at around 5 Pg C yr−1. Under SSP2-4.5, CO2 emissions start to decline around 2050 (Riahi et al., 2017) and atmospheric CO2 stabilizes around 600 ppm by 2100 (Fig. 1a). Although atmospheric CO2 stabilizes, the ocean carbon sink reduces strongly (Fig. 1b). Under SSP1-2.6, atmospheric CO2 not only stabilizes but starts to reduce by 2080, leading to a strong reduction in the ocean carbon sink (Fig. 1a). In comparison, the relationship between the cumulative ocean carbon sink and atmospheric CO2 remains almost linear in the two high-emission pathways (SSP3-7.0 and SSP5-8.5), although the slope reduces with warming (Fig. 1f). For the two low-emission pathways (SSP1-2.6 and SSP2-4.5), the relationship breaks down as the ocean continuously takes up carbon, even when atmospheric CO2 stabilizes and decreases (Fig. 1e, f).
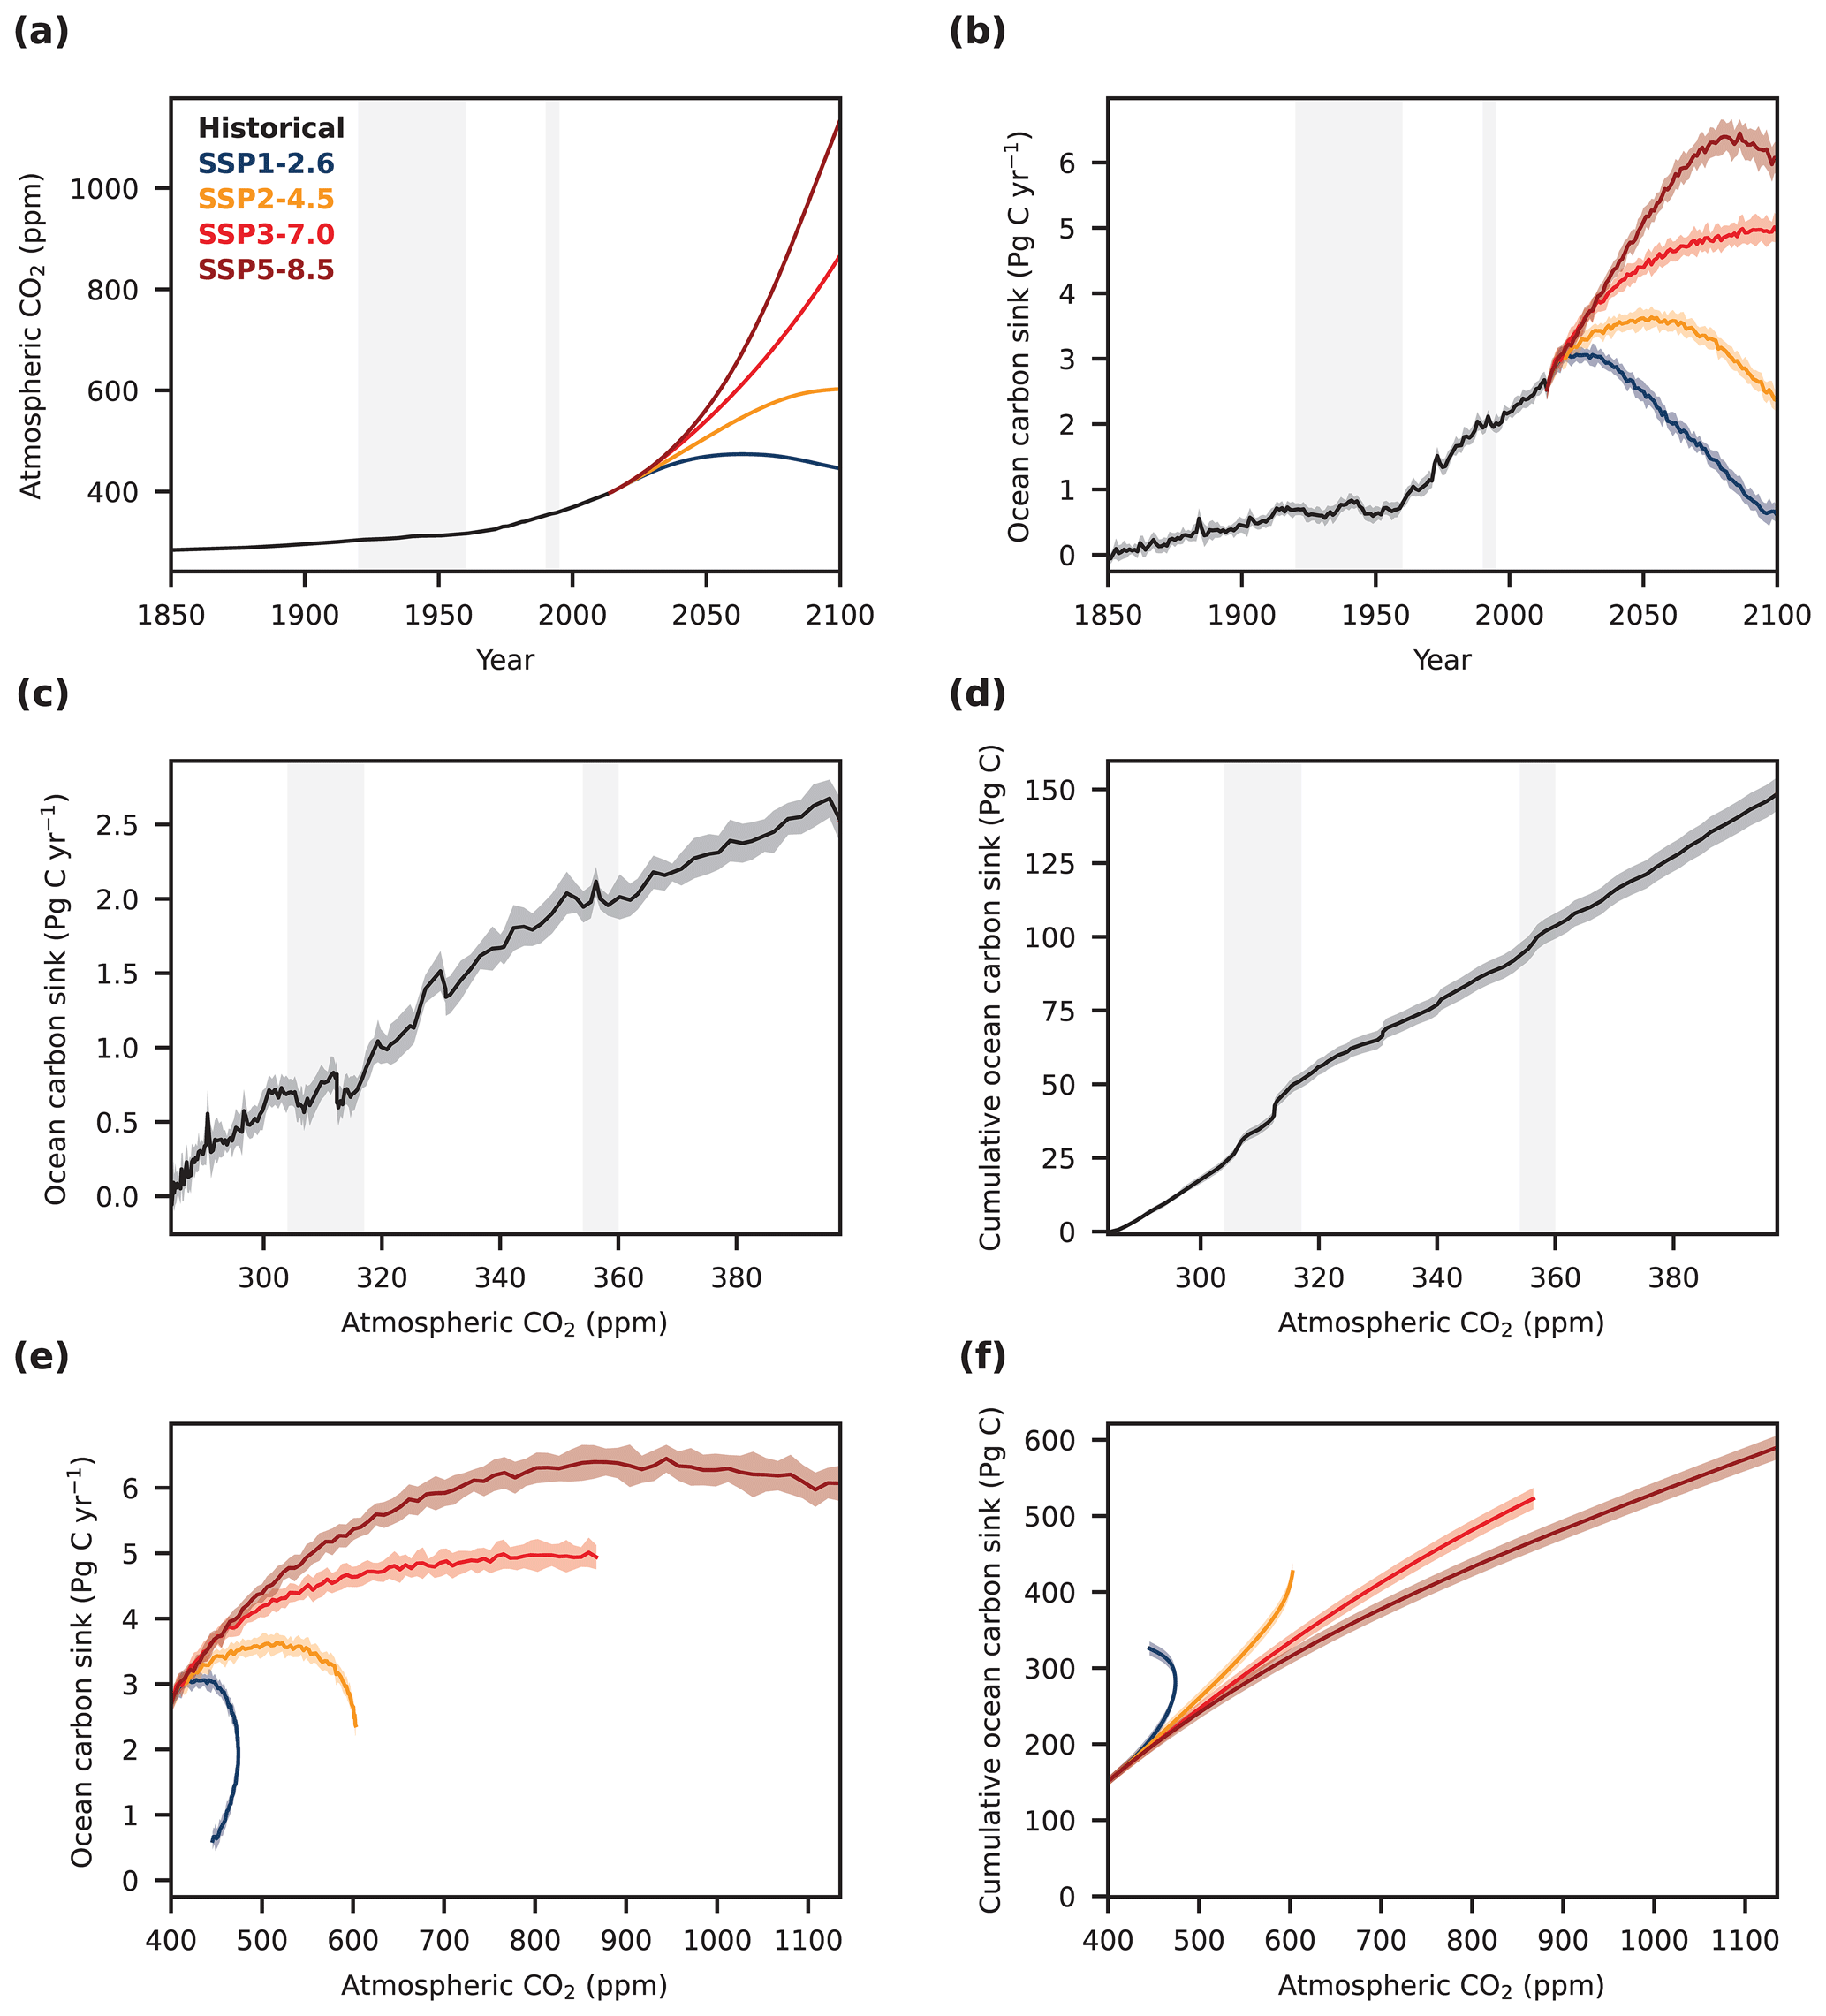
Figure 1The relationship between atmospheric CO2 and the global ocean carbon sink. (a) The annually averaged atmospheric CO2 that was used to force the ESMs from CMIP6 based on observation-based estimates from 1850 to 2014 (black) and based on four different SSPs (SSP1-2.6 in blue, SSP2-4.5 in orange, SSP3-7.0 in red, and SSP5-8.5 in brown) from 2015 to 2100. (b) The resulting ocean carbon sink as simulated by 12 ESMs (Table 1) after being adjusted for biases in circulation and surface ocean carbonate chemistry following Terhaar et al. (2022). The thick lines indicate multi-model means, and the shading indicates the 1σ standard deviation across the model ensemble. Relationships between atmospheric CO2 and the annually averaged ocean carbon sink (c) for the historical period until 2014 and (e) for the 21st century from 2015 onwards, as well as between atmospheric CO2 and the cumulative ocean carbon sink (d) for the historical period until 2014 and (f) for the 21st century from 2015 onwards. The light-gray shading in (a)–(d) indicates the time periods from 1920 to 1960 and from 1990 to 1995.
3.2 Atmospheric CO2 growth rate
As an alternative to the atmospheric CO2, the growth rate of atmospheric CO2 was proposed as a key driver for the strength of the ocean carbon sink (McKinley et al., 2017, 2020). Over the historical period, the atmospheric CO2 growth rate appears to be weakly linearly related to the strength of the ocean carbon sink (Fig. 2c). This relationship weakens after ∼1960, when the prescribed atmospheric CO2 growth rate is based on direct atmospheric CO2 observations and not, as before, on relatively smooth observation-based estimates from proxies (light-gray shading in Fig. 2a and gray dots in Fig. 2c, d). The direct observations capture the strong inter-annual variability in the atmospheric CO2 growth rate that cannot be reconstructed by observation-based estimates from proxies. However, even this relationship between the atmospheric CO2 growth rate and the strength of the ocean carbon sink breaks down in the 1920s and 1940s (pale-green dots in Fig. 2c, d), when the growth rate is around zero over around 1 decade each time (pale-green shading in Fig. 2a), but the ocean carbon sink does not go back close to zero and instead remains almost stable (pale-green shading in Fig. 2b).
Over the 21st century, the relationship between the ocean carbon sink and the atmospheric CO2 growth rate breaks down (Fig. 2c). As long as CO2 emissions and the atmospheric CO2 growth rate rise, as they do under SSP3-7.0 and SSP5-8.5 (Fig. 2a), the relationship flattens (Fig. 2a). However, the strength of the relationship varies between SSP3-7.0 and SSP5-8.5. Under SSP5-8.5, the relationship also breaks down in the last 2 decades, when the atmospheric CO2 growth stabilizes but the ocean carbon sink weakens. Under SSP1-2.6 and SSP2-4.5, with declining emissions or declining and even negative atmospheric CO2 growth rates, the ocean carbon sink reduces – but not along the same path on which it increased over the historical period (Fig. 2c).
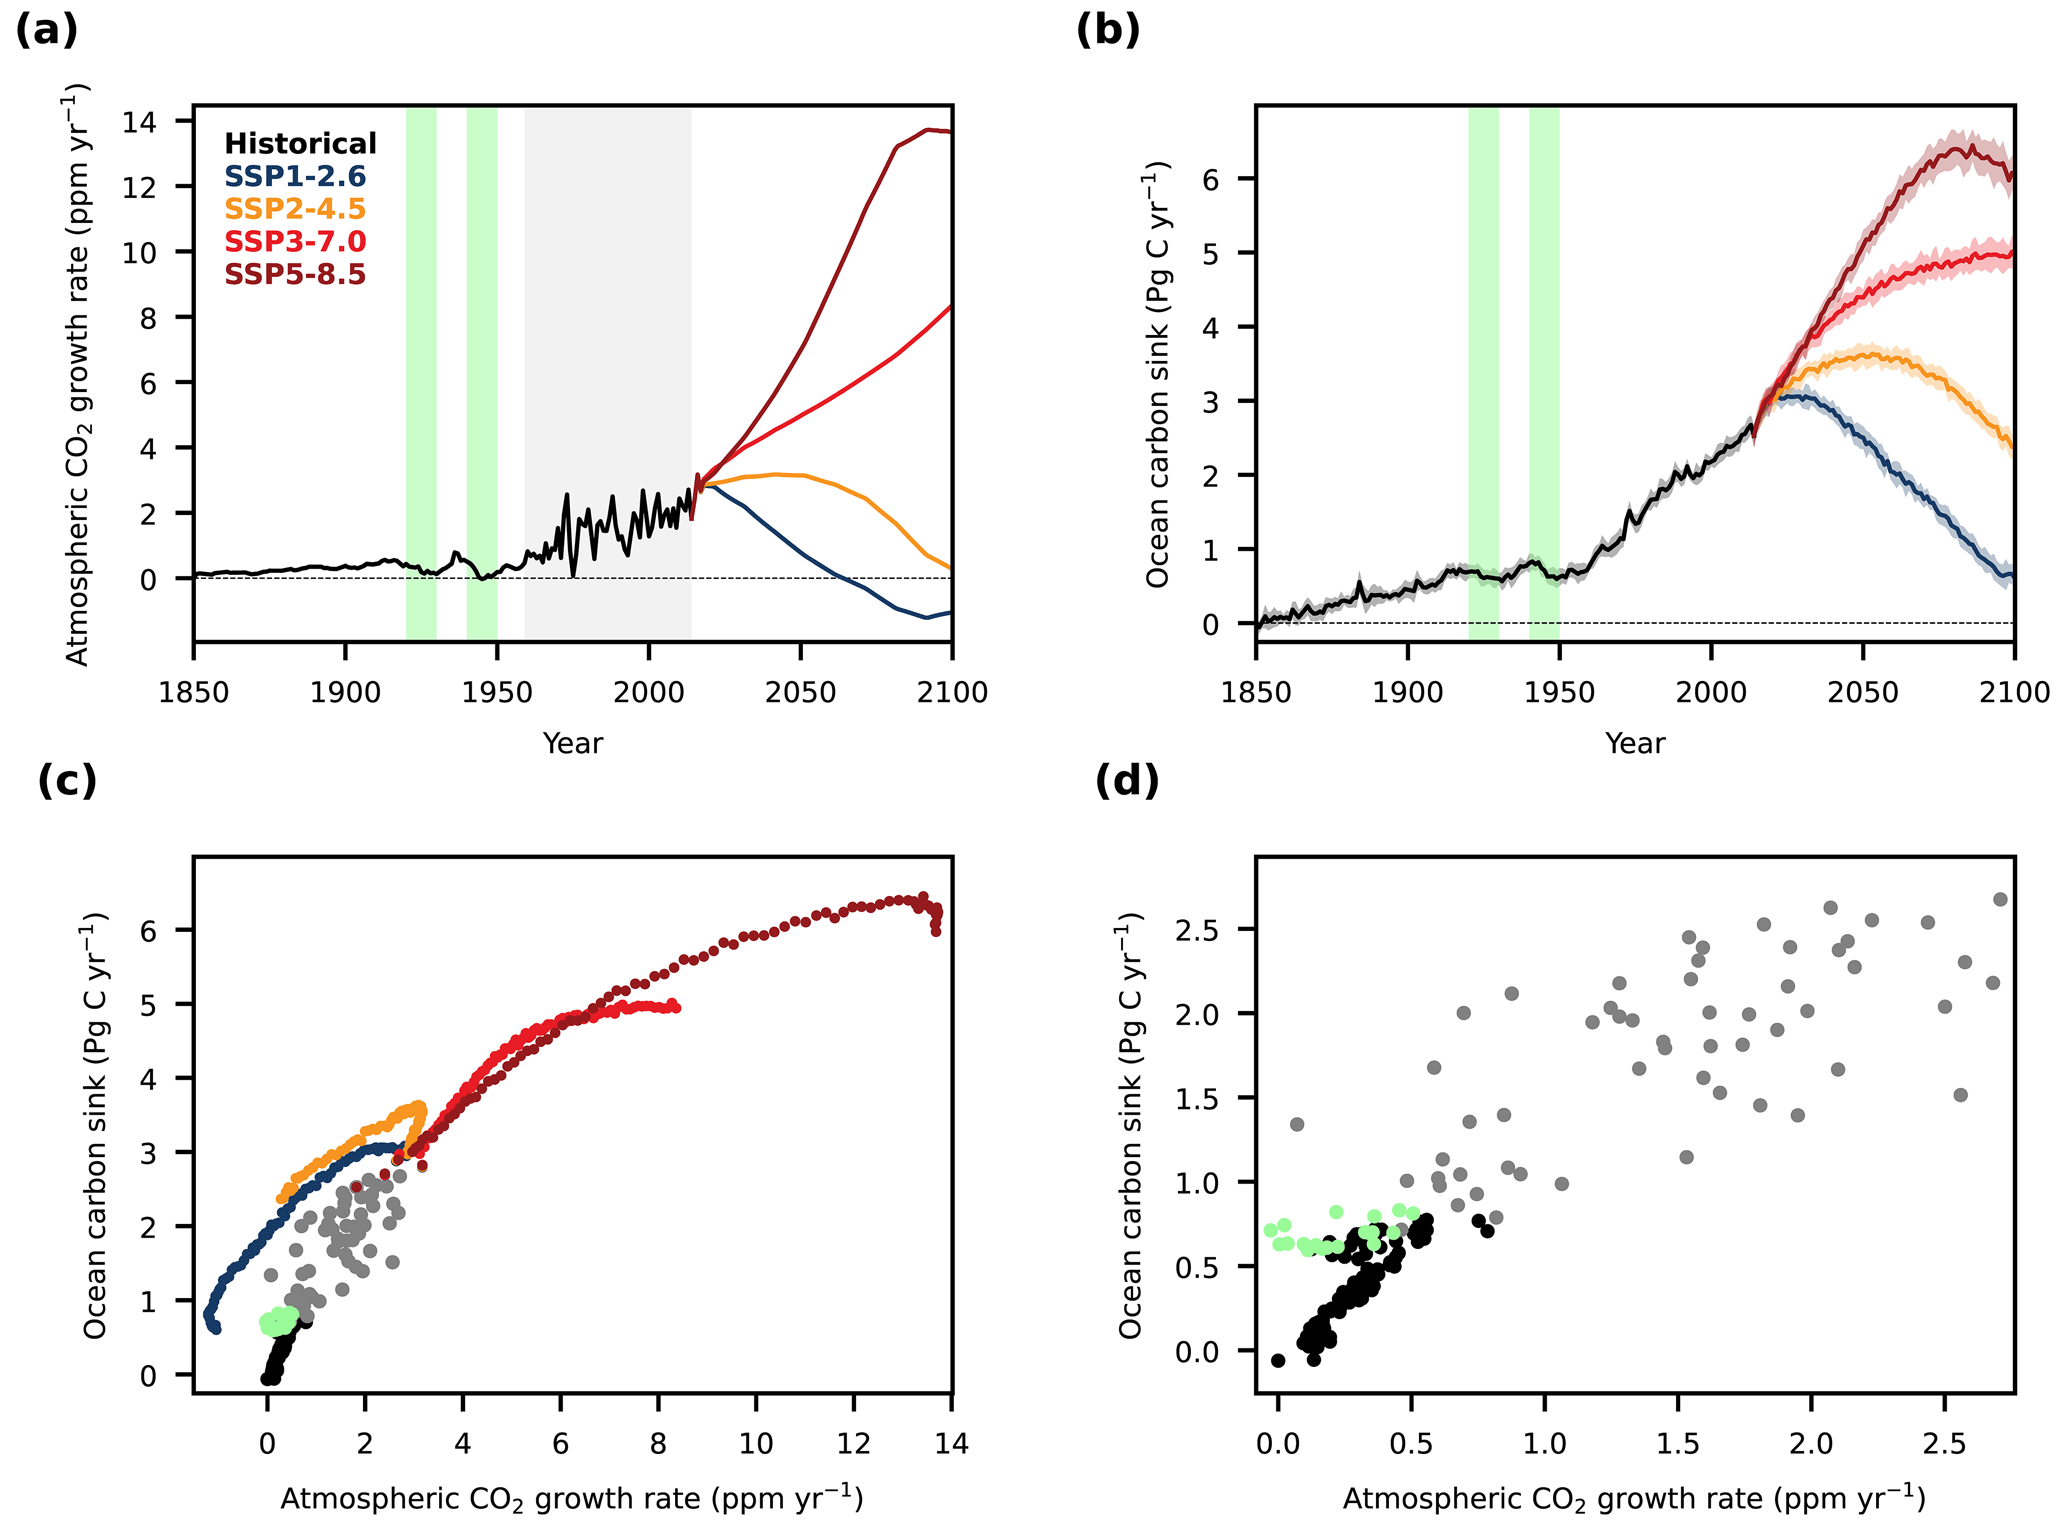
Figure 2The relationship between the atmospheric CO2 growth rate and the global ocean carbon sink. (a) The annually averaged atmospheric CO2 growth rate based on atmospheric CO2 forcing files from CMIP6, which are based on observation-based estimates from 1850 to 2014 (black) and based on four different SSPs (SSP1-2.6 in blue, SSP2-4.5 in orange, SSP3-7.0 in red, and SSP5-8.5 in brown) from 2015 to 2100. (b) The ocean carbon sink as simulated by 12 ESMs (Table 1) after being adjusted for biases in circulation and surface ocean carbonate chemistry following Terhaar et al. (2022). The thick lines indicate multi-model means, and the shading indicates the 1σ standard deviation across the model ensemble. Relationships between atmospheric CO2 growth rate and the annually averaged ocean carbon sink (c) for the entire period from 1850 to 2100 and (d) only for historical period until 2014. The light-gray shading in panel (a) indicates the period where direction atmospheric CO2 observations are available, and the pale-green shading in panels (a) and (b) and the pale-green dots in panels (c) and (d) indicate the 1920s and 1940s. The zero growth rate and ocean carbon sink in panels (a) and (b) are shown as dashed black lines.
3.3 Changes in atmospheric CO2 growth rate determine changes in decadal trends in the ocean carbon sink
3.3.1 Global relationship
Although neither the atmospheric CO2 nor its growth rate can quantify the strength of the ocean carbon sink over various time periods and different trajectories of atmospheric CO2, the atmospheric CO2 growth rate can nevertheless be used to understand changes in the ocean carbon sink on decadal timescales, i.e., decadal trends in the ocean carbon sink. For the period from 1980 to 2018, it has been shown that a slowing of the growth rate in comparison to a linear trend has led to a stagnation of the increase in the ocean carbon sink and that an accelerated increase in the growth rate has led to a strongly increasing carbon sink (McKinley et al., 2020).
Over longer time periods and different future SSPs, ESMs provide more such examples, where changes in the growth rate of atmospheric CO2 led to changes in decadal trends in the simulated ocean carbon sink (Fig. 2). Around 1915, the atmospheric CO2 growth rate changes from an increase to a decrease, and, at the same time, the ocean carbon sink stops increasing and starts to decrease. Then, in 1930, the atmospheric CO2 growth rate increases and the ocean carbon sink also starts to increase simultaneously. Then, in 1940, the atmospheric CO2 growth rate decreases again and the ocean carbon sink also decreases at the same time. Similarly, the atmospheric CO2 growth rate changes from a positive trend to a negative trend in 1990, exactly when the ocean carbon sink also starts to slow down. When the atmospheric CO2 growth rate increases again, the ocean carbon sink also increases. Over the 21st century, the same relationship continues. Under SSP2-4.5, the atmospheric CO2 growth rate slows down until 2050 and the positive trend in the ocean carbon sink weakens. Once the atmospheric CO2 growth declines, the trend in the ocean carbon sink becomes negative.
As a slowing or acceleration in the growth rate in comparison to a theoretical linear trend, as in McKinley et al. (2020), is not possible anymore over longer time periods of exponential growth or when atmospheric CO2 peaks, I generalize the idea of McKinley et al. (2020) that a slowing or acceleration in the atmospheric CO2 growth rate drives the trends in the ocean carbon sink by defining such slowing or acceleration as the difference in the growth rate in a given decade with respect to the preceding decade. When defining slowing or acceleration in the atmospheric CO2 growth rate that way, a clear relationship (r2=0.91) emerges over the entire historical period and all four future scenarios over the 21st century (excluding years where the ocean carbon sink exceeds 4.5 Pg C yr−1) between changes in the atmospheric CO2 growth rate and the decadal trend in the multi-model average of the ocean carbon sink (Fig. 3). Changes in the atmospheric CO2 growth rate are defined here as the change in trends (linear fit over 1 decade) in atmospheric CO2 from 1 decade to the next. Trends in the ocean carbon sink are a linear fit over annual values of the global ocean carbon sink in the second decade. It thus appears that it is the change in the growth rate in comparison to the previous decade that drives the decadal trends in the ocean carbon sink and not the difference to an expected linear trend. If, for example, the growth rate strongly reduced from 1 decade to another, the ocean carbon sink would show a negative trend. If the growth rate then stays at that lower level, the carbon sink would not decline further but would stabilize at its new level. This relationship even holds when CO2 emissions decline strongly, as under SSP1-2.6.
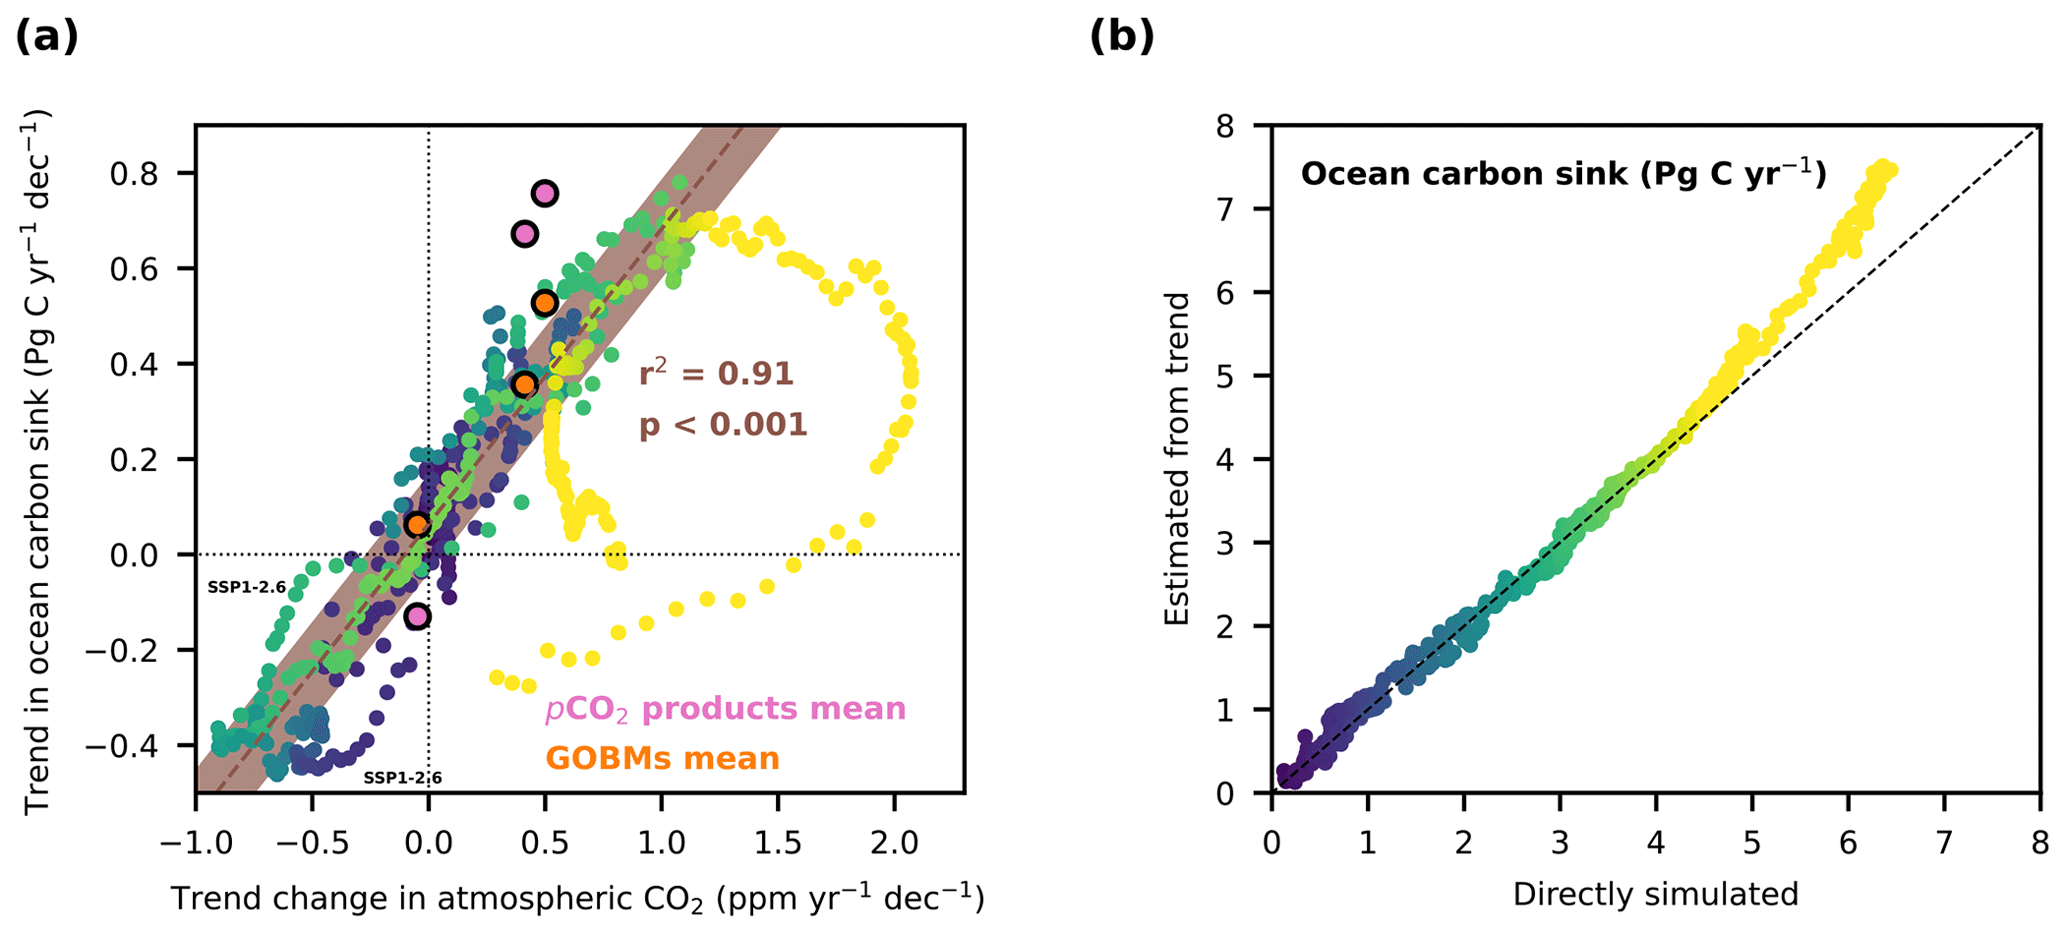
Figure 3The relationship between changes in the atmospheric CO2 growth rate and decadal trends in the global ocean carbon sink for the multi-model mean. (a) Decadal trends in the multi-model mean ocean carbon sink compared to changes in decadal trends in atmospheric CO2, which represent the decadal averaged growth rate of atmospheric CO2. The dark-blue to yellow circles without a surrounding black line show multi-model averages for all years of the historical period from 1850 to 2014 and for all years from 2015 to 2100 for all four SSPs. All decades from 1850 to 2100 are shown, i.e., 2000–2009, 2001–2010, 2002–2011, etc. The brown line shows a linear fit for all years when the global ocean carbon sink is smaller than 4.5 Pg C yr−1, and the brown shading is the 1σ projection uncertainty. The dots with black lines around them show values from the respective ensemble means of the pCO2 products (pink) and GOBMs (orange) from the Global Carbon Budget 2023 (Friedlingstein et al., 2023) for the 3 decades between 1990 and 2020. Small deviations from the relationship in SSP1-2.6 are marked by “SSP1-2.6”. (b) The simulated ocean carbon sink in comparison to the expected ocean carbon sink based on the relationship in panel (a) and the prescribed trend change in atmospheric CO2 in the simulations.
However, this relationship between changes in the atmospheric CO2 growth rate and the decadal trend in the multi-model average of the ocean carbon sink breaks down if the ocean carbon sink is larger than 4.5 Pg C yr−1 (Fig. 3; r2 starts to reduce if years with an ocean carbon sink larger than 4.5 Pg C yr−1 are included). The breakdown likely occurs because climate change and the associated ocean heat uptake and circulation changes become so large that effects on the natural carbon sink reduce the trend in the ocean carbon sink substantially enough. Thus, it is not the carbon uptake of 4.5 Pg C yr−1 itself that causes the breakdown in the relationship but the combined impact of an increasing Revelle factor (Revelle and Suess, 1957) and climate change (Joos et al., 1999; McNeil and Matear, 2013; Frölicher et al., 2015). In SSPs from CMIP6, the combined impact is large enough to affect the relationship identified here when the ocean carbon sink is around 4.5 Pg C yr−1. The breakdown in the relationship also implies that the decadal trends in the ocean carbon sink cannot exceed 0.78±0.10 Pg C yr−1 dec−1 (the uncertainty is the 1σ standard deviation across the ESM ensemble in the decade when the multi-model mean decadal trend is largest). Thus, if the ocean carbon sink is below 4.5 Pg C yr−1, and if its magnitude 10 years ago and the change in the decadal trends in atmospheric CO2 between the last 2 decades (20 to 10 years ago and 10 years ago to now) is known, the absolute ocean carbon sink this year can be determined (Fig. 3b).
3.3.2 Regional relationships
The relationship between changes in the atmospheric CO2 growth rate and the global ocean carbon sink holds in all five large ocean basins (Fig. 4a–j) as it has also done from 1980 to 2018 (McKinley et al., 2020). The coefficient of determination (r2) is larger than 0.84 in the Atlantic, Pacific, Indian, and Southern oceans. Only the Arctic Ocean has a smaller correlation coefficient of 0.66.
In the Arctic Ocean, the carbon sink has already been shown to be substantially more affected by climate change than in any other ocean basin (Yasunaka et al., 2023). In the future, when sea ice disappears and the Arctic continues to warm faster than any other region, the importance of climate change for the Arctic Ocean carbon sink will likely remain relatively large, for example, through freshening (Terhaar et al., 2021a) and a change in the seasonal cycle of pCO2 (Orr et al., 2022), and hence reduce the importance of changes in the atmospheric CO2 for trends in the ocean carbon sink.
In the Southern Ocean, the simulated trends in the ocean carbon also slightly differ from the expected trends based on changes in trends in atmospheric CO2 in three brief periods (Fig. 4i). From 1995 to 2005 over the historical period and from 2030 to 2050 under SSP1-2.6, the decadal trend in the ocean carbon sink is larger than expected, whereas it is smaller than expected from 2080 to 2100 under SSP1-2.6. The differences under SSP-1.2.6 are even visible for the global carbon sink (Fig. 3a). As the difference occurs in the multi-model mean, it appears to be a forced response and not a response that is linked to the particular state of the climate in one of the models. The time periods where the differences are visible globally (2030–2050 and 2080 to 2100 under SSP1-2.6) are the times when the growth in atmospheric CO2 stops and when it starts to decrease in that scenario (Fig. 1c). As the atmospheric CO2 growth rate changes quickly in these periods (Fig. 2a), first by changing into a decreasing phase and then by transitioning into a stabilizing phase, it appears that a fast transition of the trend change in atmospheric CO2 temporarily leads to differences in the expected relationship. If the trend change in atmospheric CO2 decreases quickly, the trend in the ocean carbon sink remains larger than expected, and, if the trend change in atmospheric CO2 increases quickly, the trend in the ocean carbon sink remains smaller than expected. However, the drivers behind the divergence from the expected decadal trend in the multi-model mean from 1995 to 2005 in the Southern Ocean remain unclear and should be analyzed in future research.
Despite these small differences, the overall relationship between changes in decadal trends in the atmospheric CO2 and decadal trends in the local and global ocean carbon sink is very strong (r2>0.84, apart from in the Arctic Ocean) and demonstrates how atmospheric CO2 is the main driver of the externally forced decadal trends in the ocean carbon sink.
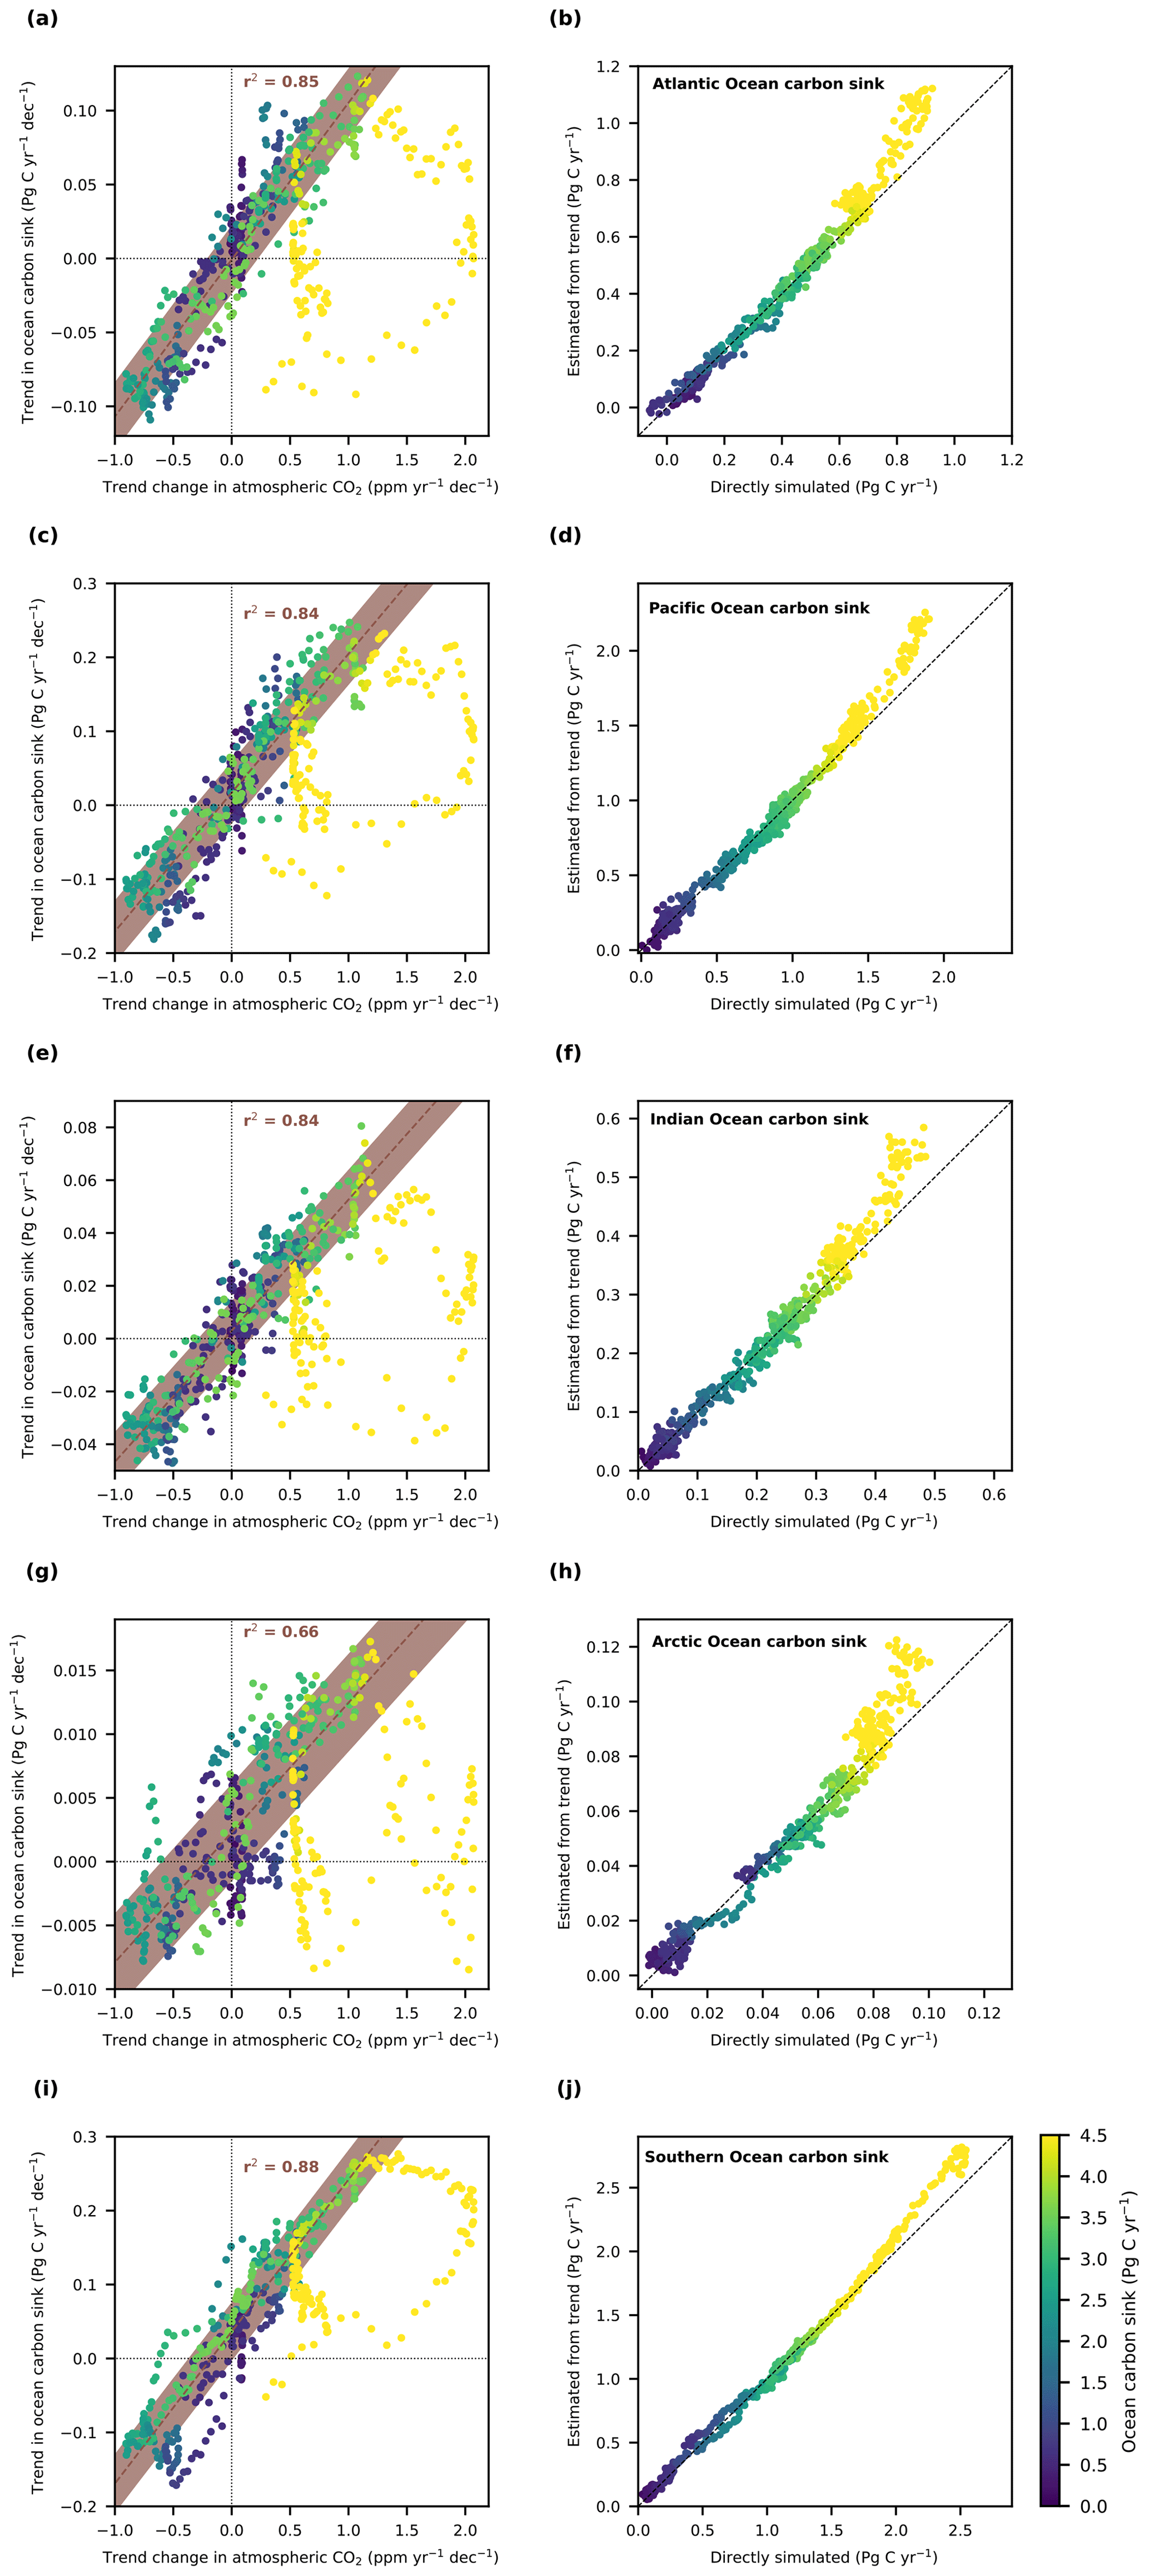
Figure 4The relationship between changes in the atmospheric CO2 growth rate and decadal trends in the ocean carbon sink in the five major ocean basins. Decadal trends in the ocean carbon sink in the (a) Atlantic Ocean, (c) Pacific Ocean, (e) Indian Ocean, (g) Arctic Ocean, and (i) Southern Ocean compared to changes in decadal trends in atmospheric CO2, which represent the decadal averaged growth rate of atmospheric CO2. The dark-blue to yellow circles without a surrounding black line show multi-model averages for all years of the historical period from 1850 to 2014 and for all years from 2015 to 2100 for all four SSPs. The brown line shows a linear fit for all years when the global ocean carbon sink is smaller than 4.5 Pg C yr−1, and the brown shading is the 1σ projection uncertainty. The dots with black lines around them show values from pCO2 products (pink) and GOBMs (orange) from the Global Carbon Budget 2023 (Friedlingstein et al., 2023) for the 3 decades between 1990 and 2020. The simulated ocean carbon sink in the (b) Atlantic Ocean, (d) Pacific Ocean, (f) Indian Ocean, (h) Arctic Ocean, and (j) Southern Ocean in comparison to the expected ocean carbon sink based on the respective relationships in panels (a), (c), (e), (g), and (i) and the prescribed trend change in atmospheric CO2 in the simulations. The p-value for each regional relationship is smaller than 0.001.
Internal climate and ocean variability in ESMs can strongly affect the decadal trends in ESMs (Li and Ilyina, 2018) and hence reduces the strength of the relationship between changes in decadal trends in the atmospheric CO2 and decadal trends in the ocean carbon sink. To quantify the importance of climate variability, I calculated the relationship between changes in decadal trends in the atmospheric CO2 and decadal trends in the ocean carbon sink not for the multi-model mean but for the individual ESMs. When calculating the linear fit over the results from the individual ESMs, the correlation factor only slightly reduces from r2=0.91 to r2=0.80 (Fig. 5). Although Li and Ilyina (2018) showed that 50–70 ensemble members are needed to remove internal variability for 1 given decade, the relationship remains strong here because it is based on at least 34 decades for each ESM (16 historical plus 18 future decades (SSP1-2.6 and SSP2-4.5)). Thus, two ESMs alone already provide the 50–70 decades that were shown to be necessary (Li and Ilyina, 2018). The 1σ prediction interval around the linear fit is 0.16 Pg C yr−1 dec−1, meaning that 68 % of all trends will be within ±0.16 Pg C yr−1 dec−1 of the predicted trend based on decadal trends in the atmospheric CO2, 95 % will be within ±0.31 Pg C yr−1 dec−1 of the predicted trend, and virtually all trends (99.7 %) will be within ±0.47 Pg C yr−1 dec−1 of the predicted trend. The largest simulated trend in the ocean carbon sink in one of the ESMs is 0.96 Pg C yr−1 dec−1. This is within the 2σ range of the largest trend as diagnosed by the multi-model mean 0.78±0.10 Pg C yr−1 dec−1.
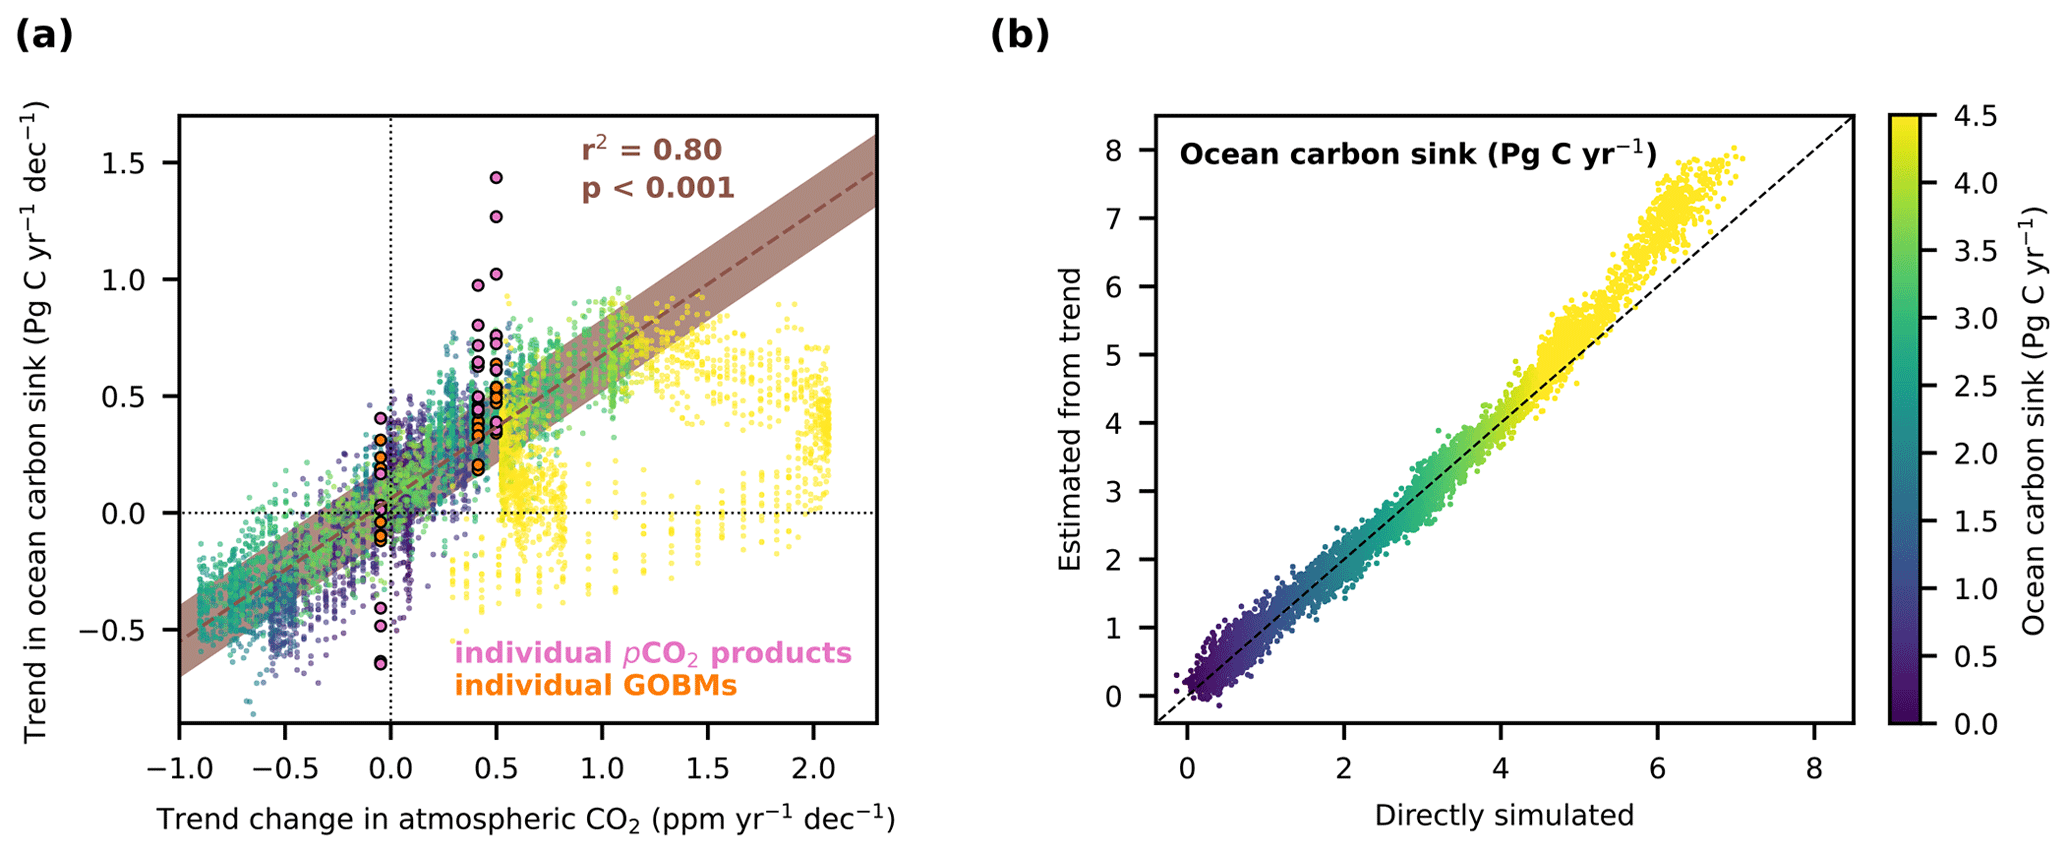
Figure 5The relationship between changes in the atmospheric CO2 growth rate and decadal trends in the global ocean carbon sink for individual ESMs. (a) Decadal trends in the ocean carbon sink for all ESMs individually compared to changes in decadal trends in atmospheric CO2, which represent the decadal average growth rate of atmospheric CO2. The dark-blue to yellow circles without a surrounding black line show multi-model averages for all years of the historical period from 1850 to 2014 and for all years from 2015 to 2100 for all four SSPs. The brown line shows a linear fit for all years when the global ocean carbon sink is smaller than 4.5 Pg C yr−1, and the brown shading is the 1σ projection uncertainty. The dots with black lines around them show values from individual pCO2 products (pink) and GOBMs (orange) from the Global Carbon Budget 2023 (Friedlingstein et al., 2023) for the 3 decades between 1990 and 2020. (b) The simulated ocean carbon sink in comparison to the expected ocean carbon sink based on the relationship in panel (a) and the prescribed trend change in atmospheric CO2 in the simulations.
The range of simulated trends in ocean carbon sink with different internal climate variability encompasses the ocean carbon sink trend estimates of GOBMs from the Global Carbon Budget 2023 (Friedlingstein et al., 2023), but the trend estimates of the pCO2 products exceed the range that is simulated by ESMs. For the decade from 1990 to 1999, 7 out of 10 GOBMs fall within the ±1σ range and the remaining 3 GOBMs fall within the ±2σ range. In comparison, only 3 out of 8 pCO2 products fall within the ±1σ range, 2 pCO2 products fall within the ±3σ range, 1 pCO2 product falls within the ±4σ range, and 2 pCO2 products fall within the ±5σ range. For the decade from 2000 to 2009, 5 GOBMs fall within the ±1σ range, 4 GOBMs fall within the ±2σ range, and the final GOBM falls within the ±3σ range. In comparison, only 2 pCO2 products fall within the ±1σ range, 1 pCO2 product falls within the ±2σ range, 2 pCO2 products fall within the ±3σ range, 1 pCO2 product falls within the ±5σ range, 1 pCO2 product falls within the ±6σ range, and 1 pCO2 product falls within the ±7σ range. For the decade from 2010 to 2019, 9 GOBMs fall within the ±1σ range and the remaining one falls within the ±2σ range. In comparison, only 1 pCO2 product falls within the ±1σ range, 2 pCO2 products fall within the ±2σ range, 3 pCO2 products fall within the ±3σ range, 1 pCO2 product falls within the ±4σ range, and 1 pCO2 product falls within the ±5σ range. In general, the pCO2 product estimates of the decadal trends are not randomly distributed across the possible range that the ESMs suggest. Instead, pCO2 products systematically overestimate the magnitude of the respective trends that is suggested by ESMs, i.e., a negative trend in the 1990s that is too low and a positive trend in the 2000s and 2010s that is too high.
In addition to atmospheric CO2 and internal climate variability, climate change and ocean heat uptake also affect the ocean carbon sink and potentially its decadal trends. The ocean heat uptake, for example, causes changes in the ocean circulation, such as stratification and outgassing of natural carbon from the ocean, due to increasing temperatures and reduced solubility (Fig. 6). Across the five ESMs that performed the simulations to quantify the effect of ocean heat uptake on the natural carbon in the ocean (see Methods), the loss of natural carbon from the ocean to the atmosphere is related to the ocean heat uptake via a second-degree polynomic function under strong radiative forcing (SSP5-8.5) (Fig. 6a). Although annual variability hides part of this relationship, the relationship emerges strongly for decadal averages (Fig. 6b).
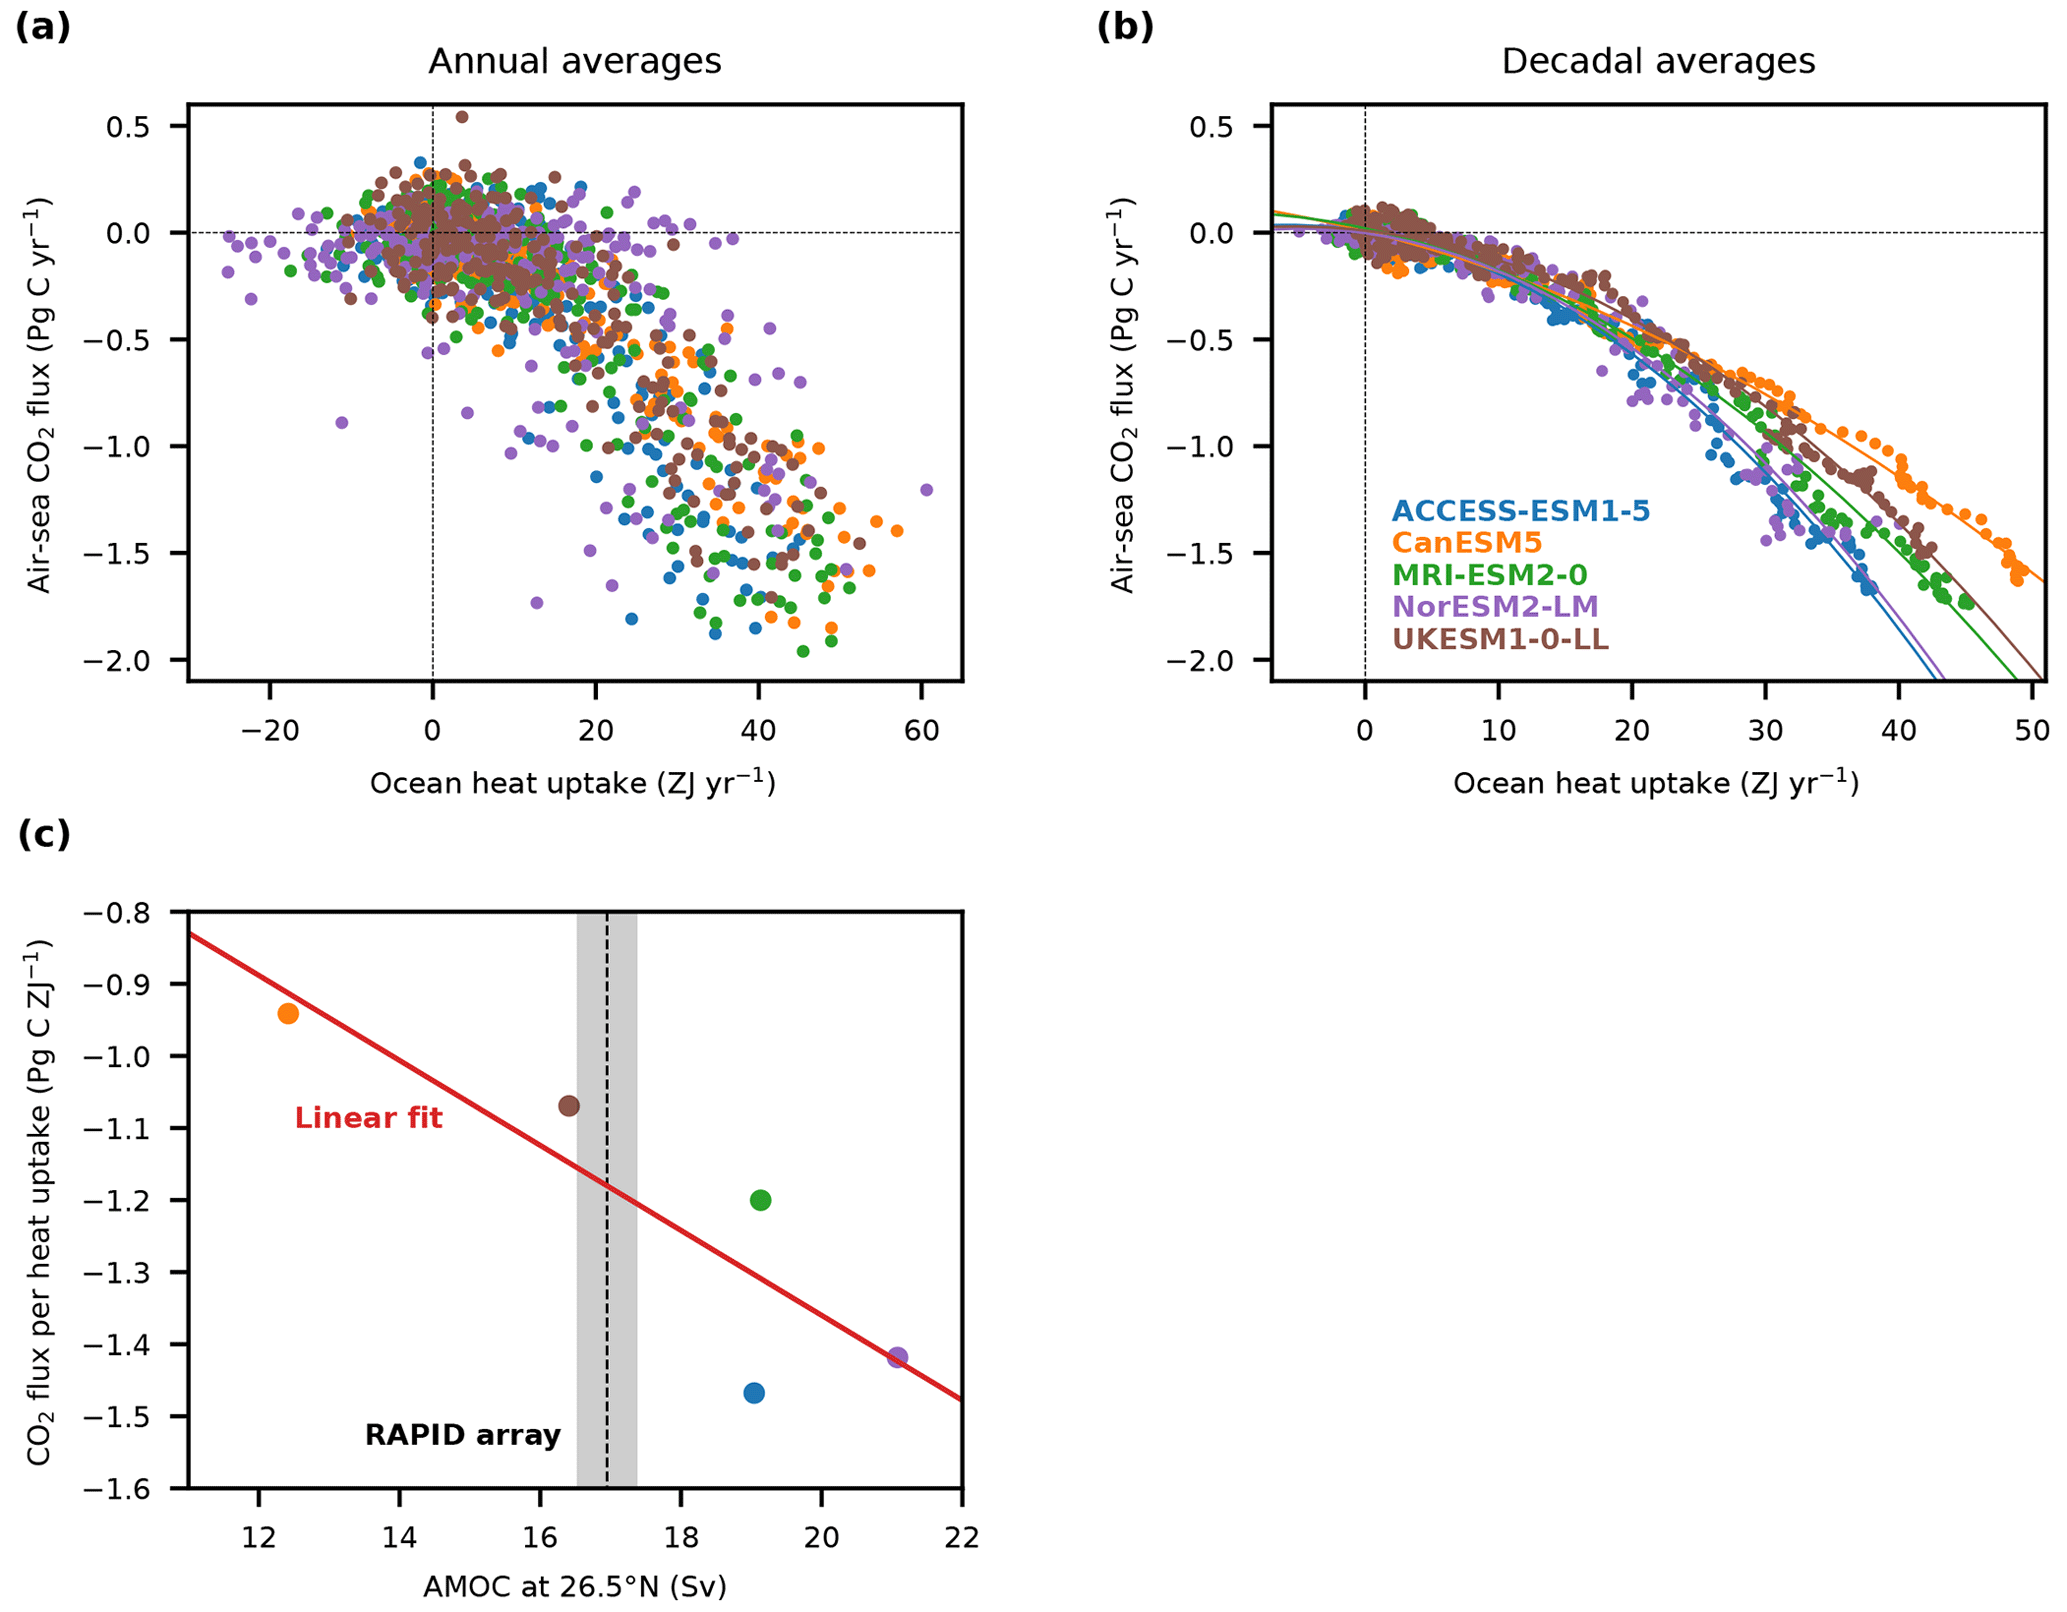
Figure 6The relationship between natural carbon loss and ocean heat uptake and its link to the Atlantic Meridional Overturning Circulation (AMOC). (a) Annual and (b) decadal average air–sea CO2 flux solely caused by ocean heat uptake (for details see Methods) vs. the annual average ocean heat uptake in five different ESMs (ACCESS-ESM1-5 in blue, CanESM5 in orange, MRI-ESM2-0 in green, NorESM2-LM in purple, and UKESM1-0-LL in brown). A second-degree polynomic function (colored lines) was fitted over the decadal average values of each ESM. (c) The CO2 flux per ocean heat uptake, calculated for each model from the fitted second-degree polynomic function at an ocean heat uptake of 35 ZJ yr−1 against the AMOC at 26.5° N calculated in each ESM from 2004 to 2018 (historical plus SSP5-8.5 simulations). The vertical dashed black line and the gray shading indicate the average observed AMOC at the RAPID array from 2004 to 2018 (McCarthy et al., 2020).
While each of the five ESMs suggests that the loss of natural carbon from the ocean to the atmosphere is related to the ocean heat uptake via a second-degree polynomic function, the amount of carbon loss due to ocean heat uptake varies across ESMs (Fig. 5b). The main reason for these differences is likely the different changes in ocean circulation and stratification due to ocean heat uptake in each ESM. One aspect of the ocean overturning circulation that is expected to change a great deal with climate change and ocean warming in ESMs is the Atlantic Meridional Overturning Circulation (AMOC; Weijer et al., 2020). Across a large ensemble of ESMs from CMIP6, it has been shown that ESMs with an already stronger AMOC also show a larger reduction in the AMOC (Weijer et al., 2020). The larger overturning reduction thus causes the models with a higher AMOC to lose more natural carbon for the same heat uptake (Fig. 5c). Based on this linear relationship, it would be possible to constrain the loss of carbon per heat uptake with observations of the present-day AMOC. However, using only five ESMs to quantify a linear relationship likely does not yield a robust relationship, so I abstain from constraining the loss of carbon per heat uptake. Nevertheless, the observed AMOC at 26.5° N is close to the average of the simulated AMOC at 26.5° N in ESMs, suggesting that the multi-model average sensitivity of air–sea CO2 fluxes to heat uptake is a good approximation of the real-world sensitivity.
Unfortunately, CMIP6 only provides simulations that allow the quantification of the ocean's natural carbon sink response to ocean warming for SSP5-8.5 and not for other scenarios where the ocean warming slows down or even stabilizes. Thus, it remains impossible for now to quantify the effect of ocean heat uptake for other scenarios and to test if the relationship identified here is robust. However, as differences in the decline in the AMOC are similar across all these scenarios, although the ocean heat uptake is much smaller in the low-emission scenarios (Weijer et al., 2020), the sensitivity of carbon loss to heat uptake might be greater in low-emission scenarios. As such, changes in the ocean heat uptake and its trend might well cause changes in the anthropogenic ocean carbon sink via outgassing of natural carbon. Although these changes are likely small, as decadal average ocean heat uptake does not change quickly. However, these changes might still be partly responsible for differences between the decadal trend in the ocean carbon sink that were expected based on changes in the trend in atmospheric CO2 and in the decadal trend in the simulated ocean carbon sink, especially those in SSP1-2.6 globally (Fig. 3) and in the Southern Ocean (Fig. 4i). To verify this hypothesis, CMIP simulations allowing the quantification of the ocean's natural carbon sink response to ocean warming would have to be run for other scenarios than SSP5-8.5.
The strong dependence of decadal trends in ocean carbon sinks on the change in the atmospheric CO2 growth rate from 1 decade to the other was identified here across an ensemble of state-of-the-art ESMs from CMIP6. The robustness of this relationship depends on the model's ability to represent the internal climate variability and might also be biased if the entire model ensemble is biased, for example, due to relatively coarse resolution or a common unrealistic representation of the physics or biogeochemistry.
If, for example, the internal climate variability on decadal timescales was underestimated by the ESMs used here, the predictability of the decadal trends in the ocean carbon sink by changes in the growth rate of CO2 would be overestimated. A prerequisite for ESMs to simulate the contribution of the natural variability to decadal trends in the ocean carbon sink is that they also simulate the size of the decadal trends in internal climate modes that are known to most affect the variability of the ocean carbon sink. The major climate modes that are known to influence the decadal variability in the ocean carbon sink are the Niño 3.4 index (Feely et al., 1999; Ishii et al., 2014; McKinley et al., 2004), the Atlantic Multi-decadal Oscillation (Breeden and McKinley, 2016; Keppler et al., 2023), and the Marshall Southern Annular Mode (Le Quéré et al., 2007; Gruber et al., 2019b; Landschützer et al., 2015; Lovenduski et al., 2008; Thompson and Solomon, 2002; Lenton and Matear, 2007; Hauck et al., 2013). The decadal trends in the Niño 3.4 index in ESMs are 17 % (−19 % to 53 %) larger than the decadal trends in the observation-based estimates of the Niño 3.4 index (the numbers in parentheses indicate the standard deviation across ESMs) (Fig. 7b), the decadal trends in the Atlantic Multi-decadal Oscillation in ESMs are 13 % (−7 % to 33 %) larger than the decadal trends in the observation-based estimates (Fig. 7c), and the decadal trends in the Marshall Southern Annular Mode in ESMs are 52 % (30 % to 75 %) larger than the decadal trends in the observation-based estimates (Marshall, 2003) (Fig. 7d). The relatively large decadal trends in climate modes in ESMs suggest that the ESMs are indeed capable of simulating the internal climate variability on decadal timescales. As the decadal trends in climate mode are larger than or equal to the observed ones, there is no indication that the decadal variability in the ocean carbon sink in ESMs (Fig. 7a) might be too small because of an internal climate variability in ESMs that is too small, as previously hypothesized by Gruber et al. (2023) based on small carbon–climate feedbacks in idealized scenarios without variability in the atmospheric CO2 growth (Arora et al., 2020).
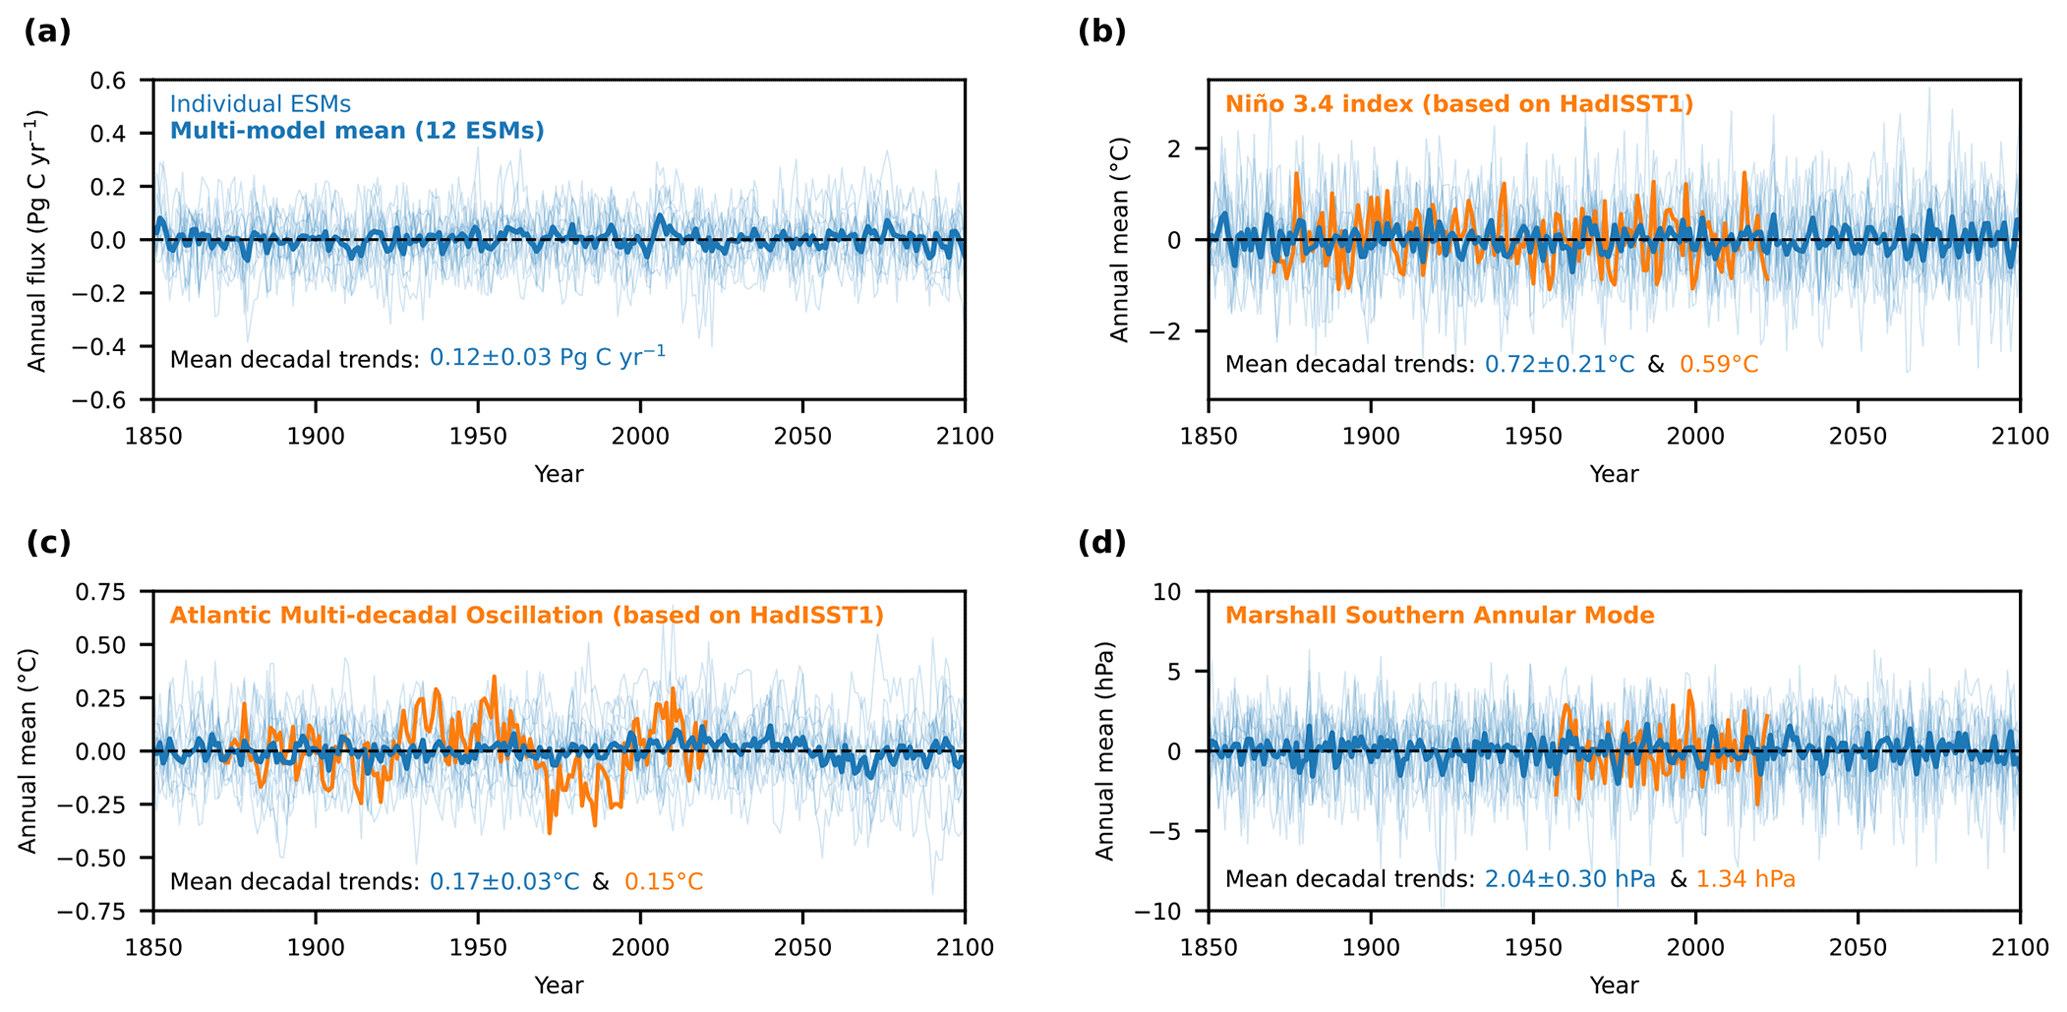
Figure 7Time series and decadal trends in the ocean carbon sink and climate modes in Earth system models compared to observations. (a) The globally integrated annual air–sea CO2 flux in the pre-industrial control simulations for 12 ESMs (thin blue lines) and the multi-model average (thick blue line). The same is shown for (b) the Niño 3.4 index, (c) the Atlantic Multi-decadal Oscillation, and (d) the Marshall Southern Annular Mode. For the three climate modes, observation-based estimates are shown based on HadISST1 for panels (b) and (c) and based on Marshall (2003) for panel (d). The decadal trends in these observation-based estimates (orange numbers) are compared to the decadal trends in ESM estimates (blue numbers indicating average and standard deviation across the ESM ensemble).
However, in addition to physical climate-driven variability, which is the dominant driver of variability in the ocean carbon sink (Doney et al., 2009), there is also biology- and biogeochemical-driven climate-related variability in the air–sea CO2 fluxes (Ostle et al., 2022; Doney et al., 2009; Keller et al., 2012), for example, due to changes in net primary production or remineralization caused by changes in nutrient supply, temperature, and oxygen. Over the North Atlantic, it has been shown that biogeochemical variability is also strongly influenced by climate modes, such as the Atlantic Multi-decadal Oscillation (Ostle et al., 2022). Nevertheless, GOBMs suggest that the influence of physical variability exceeds the influence of biogeochemical variability (Doney et al., 2009; DeVries et al., 2023). Despite different representations of the biogeochemistry and biology across the models from RECCAP2 (DeVries et al., 2023; Rodgers et al., 2023), they all simulate a similar inter-annual and decadal variability and trends in the ocean carbon sink (DeVries et al., 2023; Terhaar et al., 2024), as they are forced with historical atmospheric reanalysis products and share the same internal climate modes. Although the similarity of all GOBMs when forced with historical reanalysis strongly suggest that the physical impact on decadal variability exceeds the biogeochemical impact, detailed regional analyses of the biogeochemical-driven climate-related variability in the air–sea CO2 fluxes (Ostle et al., 2022; Keller et al., 2015), which exceed the scope of this paper, are necessary. Overall, the dominance of physical variability over biogeochemical variability and the larger decadal trends in climate modes in ESMs than in the real world suggest that the ESMs do not underestimate the natural variability in the ocean carbon sink, although it always remains possible that the pCO2 products capture real signals that are not yet simulated.
Although the ESMs from CMIP6 used here simulate even larger decadal trends in important climate modes, they might still underestimate decadal trends in the ocean carbon sink driven by climate variability because of their resolution that has increased over the past decades but is still too coarse to explicitly resolve mesoscale ocean eddies. Higher-resolved ESMs are still computationally too expensive to be run within the CMIP framework with the sufficiently long spin-ups that are necessary for these models to be in equilibrium (Séférian et al., 2016; Gupta et al., 2013). In some studies with fewer simulations than required for CMIP, higher-resolved ocean models have been shown to affect the ocean carbon sink and physics and their variability (Lachkar et al., 2007, 2009; Dufour et al., 2015; Griffies et al., 2015). While it remains impossible to evaluate the effect of higher resolution over a large ensemble of ESMs, as such an ensemble does not exist yet, I tested the relationship identified here with the highest-resolved Earth system model within CMIP6, GFDL-CM4 (Held et al., 2019), which has a horizontal resolution of 0.25° that allows resolving eddies in tropical and subtropical oceans but still has to parametrize some eddy activity in subpolar and polar oceans. GFDL-CM4 was not included in the overall analyses as it did not provide simulations under SSP1-2.6 and SSP3-7.0, presumably because of its large computational costs. The trends in the ocean carbon sink in GFDL-CM4 lie mostly within ±1σ of the relationship between changes in the atmospheric CO2 growth rate and trends in the ocean carbon sink, with only a few decades being in the ±2σ range (Fig. 8). As for the other ESMs, the relationship in GFDL-CM4 only holds if the ocean carbon sink remains below 4.5 Pg C yr−1. Although a potential change in this relationship at an even higher resolution cannot be excluded with certainty until simulations with higher resolution are performed, the robustness of the relationship even for higher-resolved ESMs such as GFDL-CM4 gives no indication that the relationship will not hold at even higher resolution.
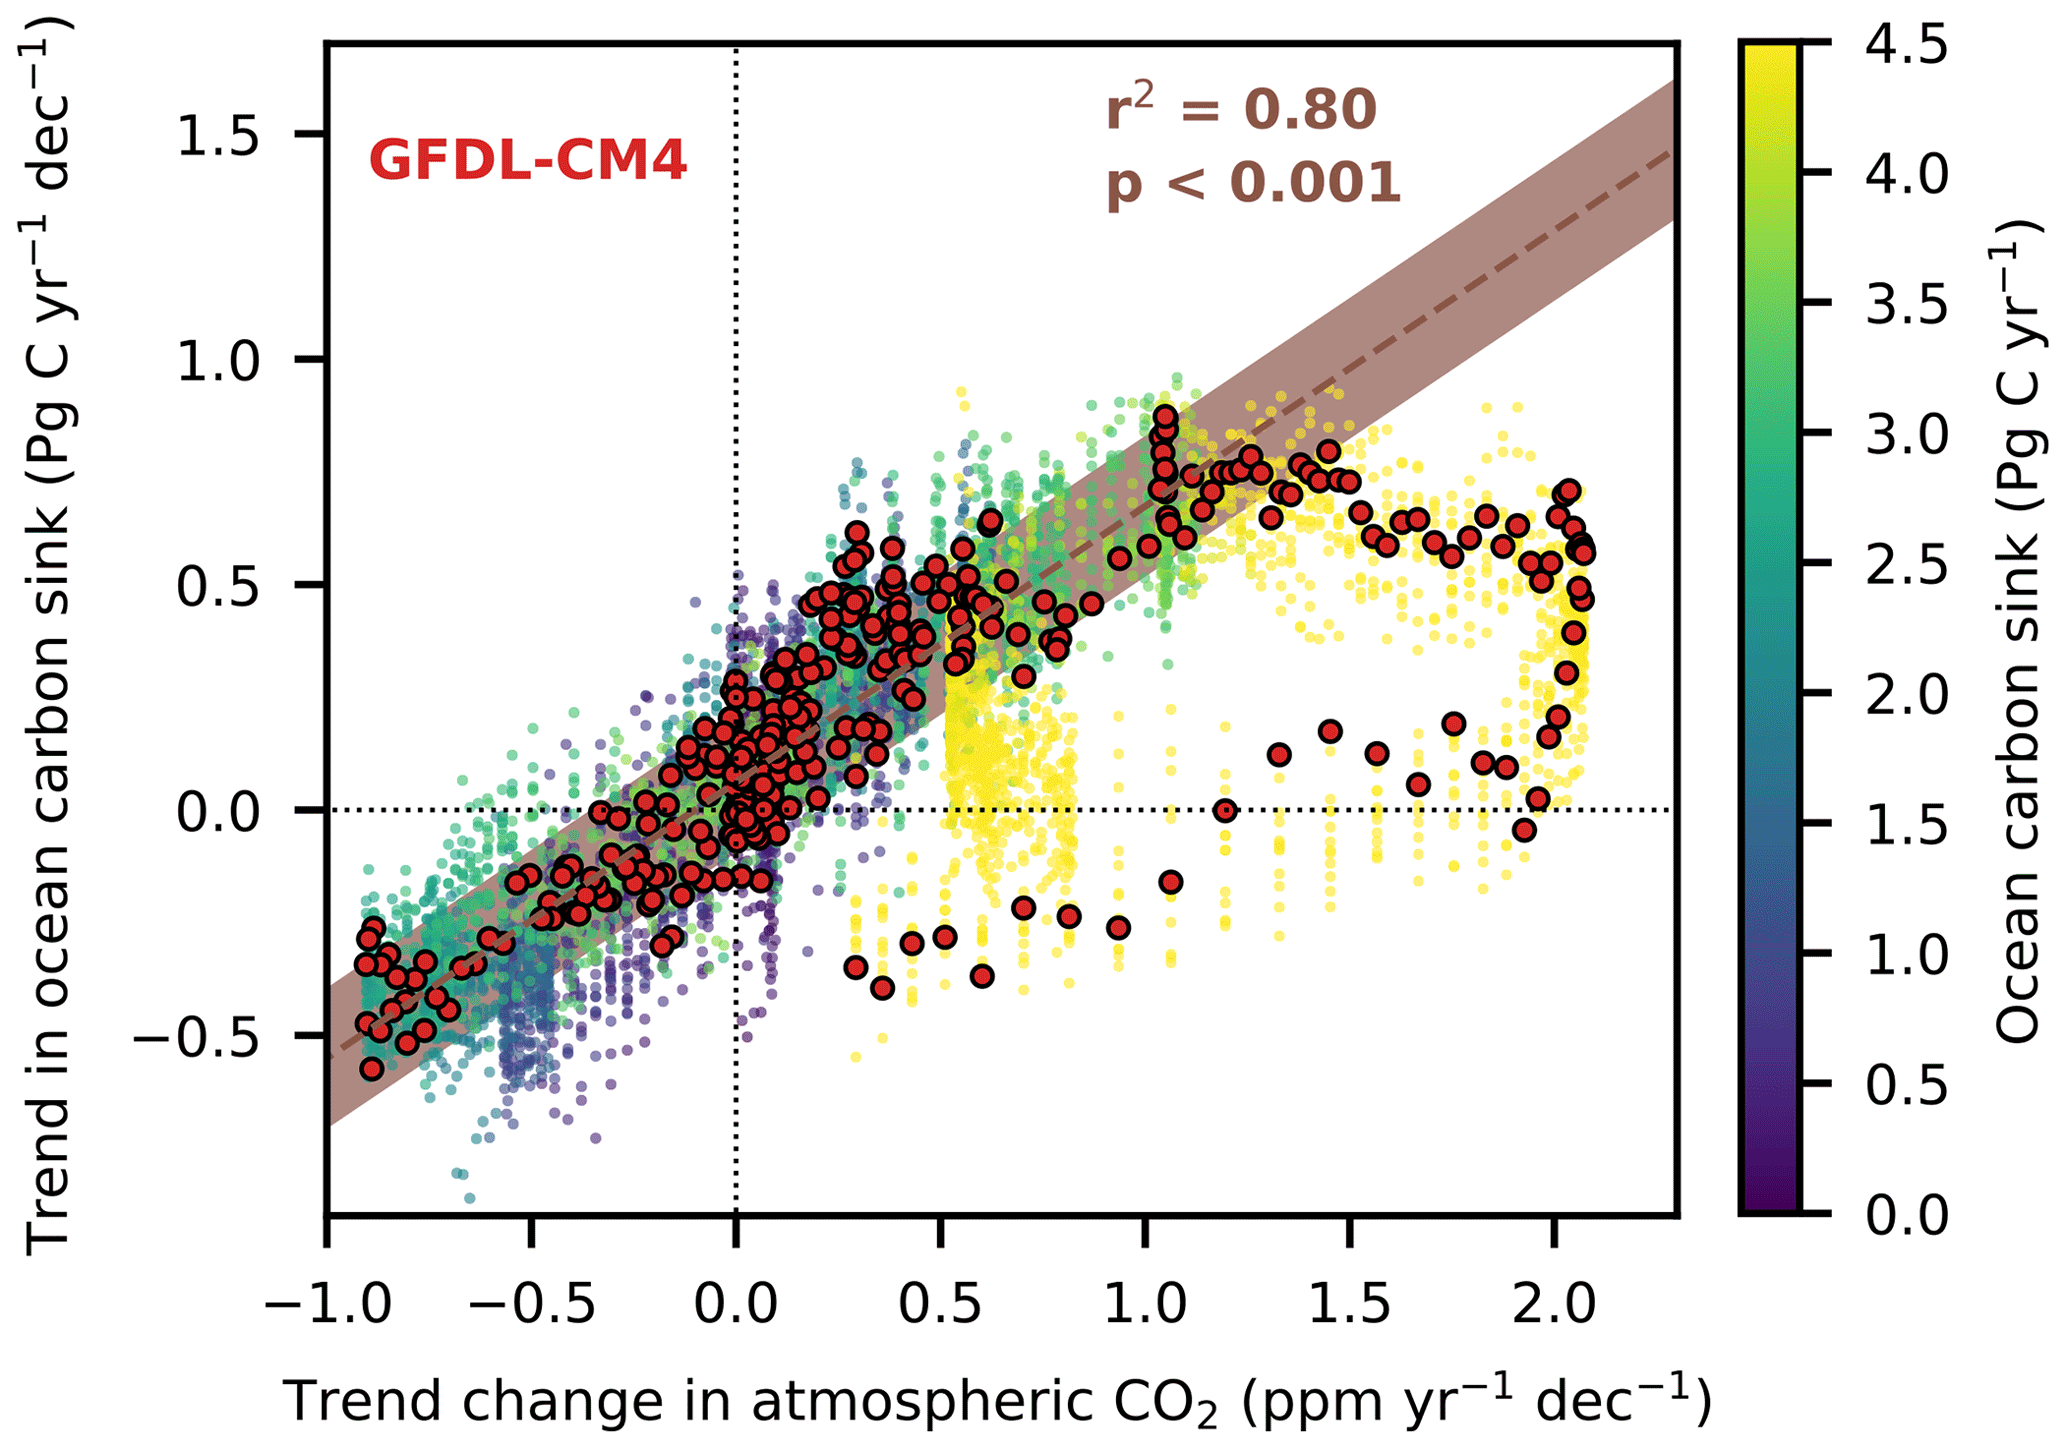
Figure 8The relationship between changes in the atmospheric CO2 growth rate and decadal trends in the global ocean carbon sink in a high-resolution model. (a) Decadal trends in the multi-model mean ocean carbon sink compared to changes in decadal trends in atmospheric CO2, which represent the decadal average growth rate of atmospheric CO2. The dark-blue to yellow circles without a surrounding black line show multi-model averages for all years of the historical period from 1850 to 2014 and for all years from 2015 to 2100 for all four SSPs. The brown line shows a linear fit for all years when the global ocean carbon sink is smaller than 4.5 Pg C yr−1, and the brown shading is the 1σ projection uncertainty. The red dots with black lines around them show values for the high-resolution ESM, GFDL-CM4 (Held et al., 2019), under the historical simulation, SSP2-4.5, and SSP5-8.5.
The analysis with ESM suggests that changes in the atmospheric growth rate of CO2 can indeed explain most of the decadal trends in the ocean carbon sink, as previously proposed by McKinley et al. (2020). ESMs support the hypothesis by McKinley et al. (2020) that the weak decadal trend in the 1990s and the stronger trend in the 2000s is mainly driven by changes in the atmospheric CO2 growth rate (Figs. 3 and 5). The importance of atmospheric CO2 extends over all ocean basins, as also previously shown by McKinley et al. (2020). While McKinley et al. (2020) focused on the last decades and suggested that the trends in the ocean carbon sink depend on differences in the atmospheric growth rate of CO2 compared to the long-term trend in the growth rate, I could generalize this idea here and show that it is the change in the growth rate compared to the previous decade that drives the trends in the ocean carbon sink over a wide range of timescales and SSPs. Moreover, this analysis extends the timeline of previous analyses and shows how atmospheric CO2 drives trends in the ocean carbon sink in a range of different future scenarios, from high-mitigation low-emission scenarios to high-emission scenarios. In addition, the use of ESMs allowed the quantification of the link between changes in the atmospheric CO2 growth rate and decadal trends in the ocean carbon, which allows for a better separation of the effects of internal and external forcing of past decadal trends in the ocean carbon sink. However, if atmospheric CO2 rises too high and the impact of climate change on the ocean carbon sink increases, atmospheric CO2 is no longer the dominant driver of trends in the ocean carbon sink due to changes in the buffer factor and ocean ventilation (Revelle and Suess, 1957; Heinze et al., 2015; Joos et al., 1999; McNeil and Matear, 2013; Frölicher et al., 2015).
Although atmospheric CO2 is shown here to be the main driver of the decadal trends in the ocean carbon sink, climate variability also plays an important role in the decadal trends in the ocean carbon sink. With a standard deviation of ±0.16 Pg C yr−1 across all ESMs, climate variability drives 17 % of the trend in the ocean carbon sink when the growth rate of atmospheric CO2 is largest and drives all changes in carbon trends when the change in the growth rate of atmospheric CO2 is zero. Known drivers of this internal climate variability are, for example, El Niño (Feely et al., 1999; Ishii et al., 2014; McKinley et al., 2004), the Atlantic Multi-decadal Oscillation (Breeden and McKinley, 2016; Keppler et al., 2023), changes in the overturning circulation (DeVries et al., 2017), and changes in the Southern Annular Mode associated with changes in Southern Ocean winds (Le Quéré et al., 2007; Keppler and Landschützer, 2019; Landschützer et al., 2015) and with stronger consequent upwelling of older waters (Lovenduski et al., 2008, 2007), as well as changes in the Southern Ocean stratification (Gruber et al., 2019b). Across the ESMs used here, the variability in decadal trends is highest in the Southern Ocean, followed by the tropical regions, and again followed by the northern subpolar gyres (Fig. 9); confirming that the decadal trends in the ocean carbon sink are indeed most variable due to internal climate variability in the regions where they are expected based on the previous studies mentioned above. ESMs simulate decadal trends in important climate modes that are even larger than their observation-based counterparts, which suggests that ESMs also capture the climate-driven decadal trends in the ocean carbon sink. As ESMs slightly overestimate decadal trends in important climate modes and still suggest that changes in the atmospheric growth rate are the dominant drivers of decadal trends in the ocean carbon sink, climate variability and associated changes in ocean circulation appear not to be the first-order drivers of decadal trends in the ocean carbon sink over the last decades as previously suggested (Landschützer et al., 2015; DeVries et al., 2017, 2019).
The results presented here have implications for previous estimates of the ocean carbon sink, especially those from pCO2 products that suggested very strong decadal trends in the ocean carbon sink (Landschützer et al., 2015; Gruber et al., 2019b, 2023). The trend estimates of the ocean carbon sink by pCO2 products are larger than the likely trends based on the relationship identified here between changes in the atmospheric CO2 growth rate and the decadal trends in the ocean carbon sink. Thus, either pCO2 products overestimate decadal trends in the ocean carbon sink or ESMs underestimate these trends. In each decade from 1990 to 2019, there are five out of eight pCO2 products from the Global Carbon Budget (Friedlingstein et al., 2023) that estimate decadal trends that are outside of the 2σ range that is estimated here based on ESMs (Fig. 5), giving these results a likelihood of less than 5 % to occur if the ESM results are indeed robust. Some pCO2 products estimate trends that are within the 5σ, 6σ, and 7σ ranges that correspond to events that occur once every 4776 years (5σ), once every 1.38 million years (6σ), and once every 1.07 billion years (7σ). While it is already extremely unlikely that decadal trends in all 3 decades from 1990 to 2020 lie outside the 2σ range, the estimates within the 5σ to 7σ range are virtually impossible based on the ESM-derived range. Only two pCO2 products (NIES-ML3 from Zeng et al., 2022, and OS-ETHZ-Gracer from Gregor and Gruber, 2021) lie within the 1σ and 2σ ranges in the 1990s and 2000s and only very slightly above the 2σ range in the 2010s. The slightly higher trend in the 2010s in these products may very well be a consequence of the uneven sampling in space and time (Hauck et al., 2023). While the trends in these two pCO2 products are closer to what is expected based on ESMs, only an in-depth analysis will eventually allow judging the performance of each pCO2 product with certainty.
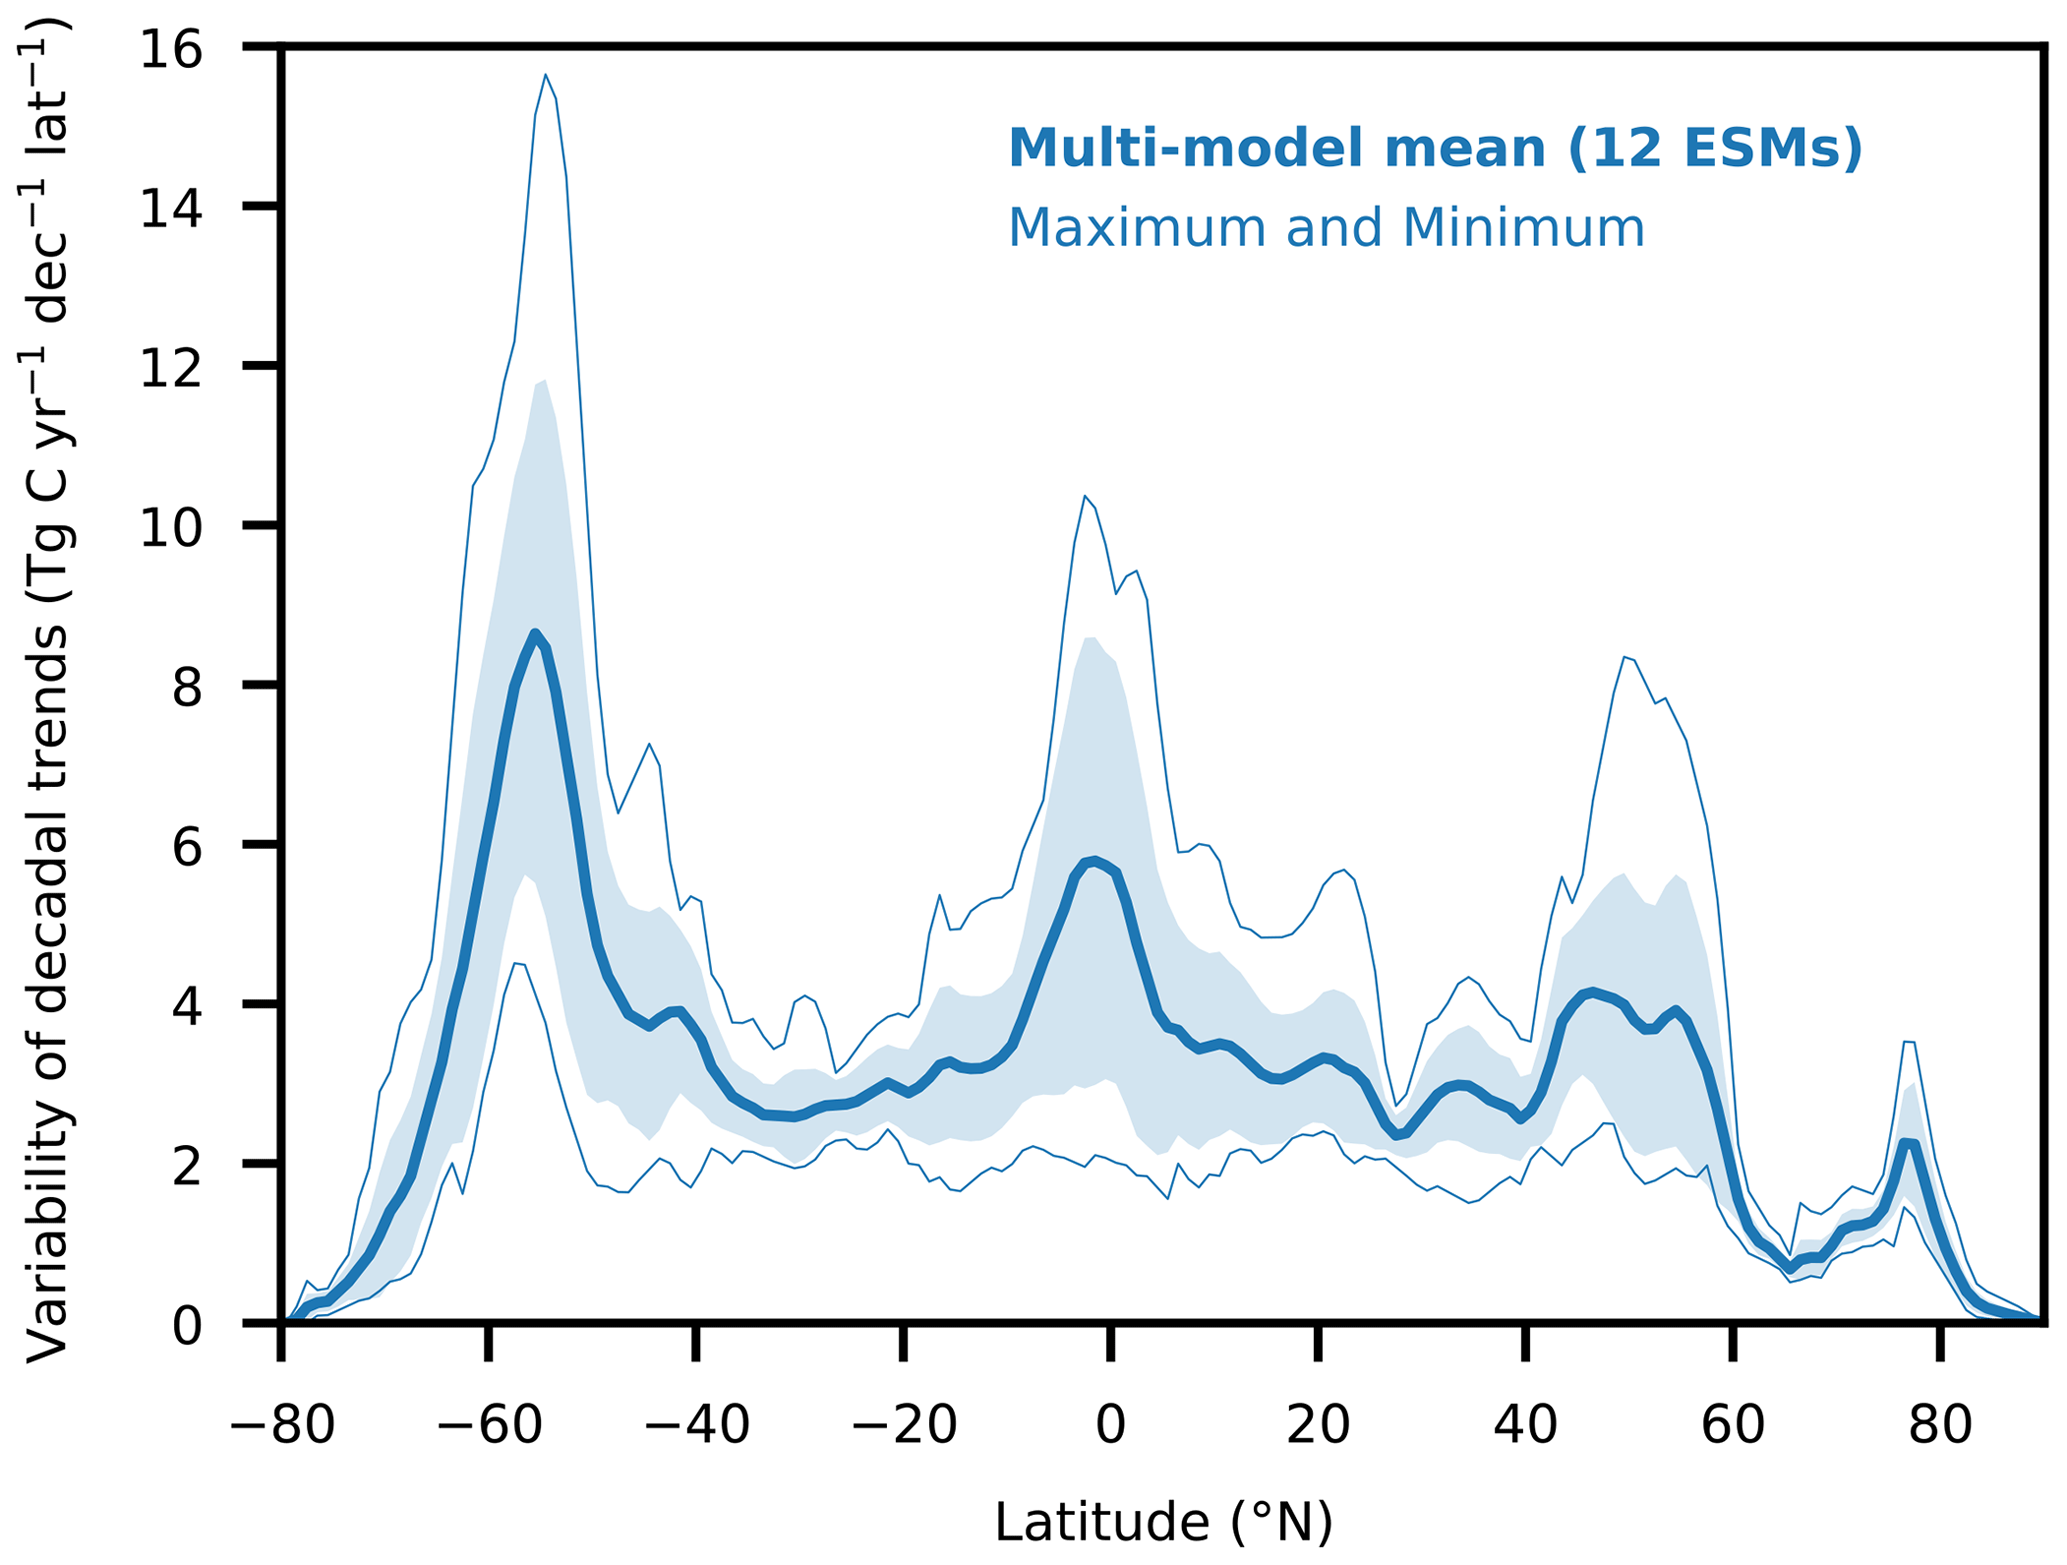
Figure 9Variability in the decadal trends in the zonally integrated ocean carbon sink in Earth system models. The multi-model mean (thick blue line) and the 1σ standard deviation of the variability in the zonally integrated ocean carbon sink across the 251 years of the pre-industrial control simulation across all 12 ESMs. In addition, the maximum and minimum variability in the ESMs are shown at each latitude (thin blue lines).
Here, I have demonstrated that ESMs are capable of simulating the size of decadal trends in important climate modes that have a strong impact on the variability in the ocean carbon sink (Fig. 7) and that higher resolution does not alter the identified relationship (Fig. 8). While this analysis does not guarantee that ESMs do not underestimate the decadal trends in the ocean carbon sink, it suggests that ESMs can simulate the size of the variability in the ocean carbon sink. This conclusion also challenges earlier findings that GOBMs might underestimate decadal trends in the ocean carbon sink (DeVries et al., 2019). Other studies (Gloege et al., 2021; Hauck et al., 2023) support the hypothesis of an overestimation of decadal trends in the ocean carbon sink by pCO2 products. Hauck et al. (2023) recently demonstrated with one GOBM and two pCO2 products that sampling biases of pCO2 have caused trends in the ocean carbon sink to be overestimated. A similar finding was made previously, when data from one GOBM, which was sampled in the same way as the real-world ocean was sampled, was extrapolated by one pCO2 product to reconstruct the ocean carbon sink (Gloege et al., 2021). This reconstructed ocean carbon sink by the pCO2 products also had a larger variability than the directly simulated ocean carbon sink by the GOBM (Gloege et al., 2021). Thus, it appears that most of the pCO2 products overestimated and still overestimate decadal trends in the global ocean carbon sink. Therefore, estimates of the variability and size of the flux of natural carbon based on the difference in the total air–sea CO2 flux from pCO2 products and the change in interior ocean anthropogenic carbon (Müller et al., 2023; Gruber et al., 2019a), defined in this special case only as the additional carbon from increasing atmospheric CO2 and not from climate change, are also likely too large.
The dependence found here of the ocean carbon sink on atmospheric CO2 also has implications for studies that extrapolate present-day observation-based estimates of the ocean carbon sink back in time over the entire historical period to estimate a cumulative ocean carbon sink since the beginning of the Industrial Revolution using the difference in atmospheric CO2 since pre-industrial times as a scaling factor (Gruber et al., 2009; Mikaloff Fletcher et al., 2006). While this scaling more or less works for most of the historical period, it breaks down from 1920 to 1960 and in the 1990s (Fig. 1). In addition, such estimates might be highly sensitive to the year for which the ocean carbon sink was estimated based on observations. If that year falls in one of these anomalous periods, as the year 1995 in Mikaloff Fletcher et al. (2006) does, the scaling might be biased low or high. Therefore, these extrapolations of present-day fluxes over the historical period should be used with caution or with a slightly more complex extrapolation method that takes the change in the atmospheric CO2 growth rate into account.
The importance of changes in the atmospheric CO2 growth rate for the trends in the global ocean carbon sink also affects our understanding of the uncertainty about the ocean carbon sink and the role of internal variability in the future. Previous studies used CMIP simulations with prescribed atmospheric CO2 to quantify the importance of internal variability for the uncertainty about the projections of the ocean carbon sink in comparison to the importance of model and scenario uncertainty (Gooya et al., 2023; Lovenduski et al., 2016; Schlunegger et al., 2020). As these prescribed atmospheric CO2 time series in CMIP simulations are much smoother than observed atmospheric CO2 time series (Fig. 1), changes in the atmospheric CO2 growth rate are also less variable. Thus, these concentration-driven CMIP SSPs suppress the internal variability in the atmospheric CO2 growth rate caused by variabilities in atmospheric temperature, precipitation, El Niño, and volcanic eruptions (Keeling et al., 1995; Kuo et al., 1990; Raupach et al., 2008; Zeng et al., 2005; Bacastow, 1976; Yang and Wang, 2000). The suppressed variability in the atmospheric CO2 growth rate in concentration-driven SSPs also suppresses the variability in the ocean carbon sink in the future, leading to an underestimation of the importance of the internal variability in ESMs for the overall uncertainty about ocean carbon sink projections over the 21st century (Gooya et al., 2023; Lovenduski et al., 2016; Schlunegger et al., 2020). This underestimation of the variability in the ocean carbon sink due to prescribed atmospheric CO2 can be avoided if ESMs are run in an emission-driven mode that automatically introduces a strong variability in the atmospheric CO2 growth rate, as in the model intercomparison project using the Adaptive Emission Reduction Approach (Terhaar et al., 2022a; Silvy et al., 2024).
While changes in the atmospheric CO2 growth rate and ocean heat uptake might allow the estimation of changes in the decadal variability in the ocean carbon sink, it remains unknown how climate variability and individual modes can be used to predict inter-annual variability in the near-term ocean carbon sink (Lovenduski et al., 2019). In addition, other external forcings, such as volcanic eruptions, are an important factor in the inter-annual variability in the ocean carbon sink but also contribute to decadal trends (McKinley et al., 2017; Fay et al., 2023; Frölicher et al., 2011, 2013).
The influence of changes in the atmospheric CO2 growth rate on the ocean carbon sink also has profound implications on the near-term future of the ocean carbon sink. With less strongly increasing or even peaking carbon emissions, the atmospheric CO2 growth rate will also peak and potentially decline. The growth rate of atmospheric CO2 on Mauna Loa has shown a robust negative trend since 2016, and the last time that the growth rate of atmospheric CO2 was as small as in 2022 was the year 2008 (https://gml.noaa.gov/ccgg/trends/gr.html, last access: 10 June 2024). If this change from a rise in the atmospheric CO2 growth rate towards a decline in the atmospheric CO2 growth rate continues, the forced trend in the ocean carbon sink will also be negative. In addition, GOBMs and pCO2 products suggest that the internal climate variability led to particularly positive trends in the ocean carbon sink in the 2000s and 2010s (Figs. 3 and 5; orange and pink dots lie above the derived relationship). This climate variability will eventually reverse at some point and lead to a larger decline in the ocean carbon sink. Furthermore, ocean heat uptake is projected to increase over the next decade or 2, independent of the chosen future pathway, also leading to stronger outgassing of carbon from the ocean in the near future and negative trends in the ocean carbon sink (Fig. 6). Although CMIP6 ESMs have tended to simulate a smaller ocean heat content over the last 2 decades (Lyu et al., 2021), this might not be an overestimation of the heat uptake by the ESMs but an especially low uptake due to climate variability. Indeed, the recent strong increase in ocean heat content and sea surface temperatures in 2023 (Cheng et al., 2024) might be the beginning of a shift from a period of low heat uptake due to climate variability to a period of high ocean heat uptake. Together, the decreasing atmospheric CO2 growth rate, the potential change in internal climate variability, and the increased ocean heat uptake will likely cause a substantial negative trend in the ocean carbon sink over the next decade. If, however, emissions and atmospheric CO2 rise, the continuous increase in the atmospheric CO2 growth rate will cause the ocean carbon sink to increase as well.
Overall, this study demonstrates how ESMs can be used to better understand the past and future of the ocean carbon sink and drivers of its variability. They hence provide not only a valuable addition to pCO2 products and GOBMs, but also a unique tool to statistically assess uncertainties and drivers of variability, also potentially in the interior ocean (Müller et al., 2023). The robustness in these results is further corroborated by their capability to simulate the size of decadal trends in important climate modes.
The Earth system model output used in this study is available via the Earth System Grid Federation (https://esgf-node.ipsl.upmc.fr/projects/esgf-ipsl/, last access: 1 June 2022). No particular code was used for the analyses.
The author has declared that there are no competing interests.
Publisher’s note: Copernicus Publications remains neutral with regard to jurisdictional claims made in the text, published maps, institutional affiliations, or any other geographical representation in this paper. While Copernicus Publications makes every effort to include appropriate place names, the final responsibility lies with the authors.
Firstly, I thank the two reviewers, Galen McKinley and Siv K. Lauvset, for their very constructive and helpful reviews, which greatly improved the paper, and Jack Middelburg for editing. In addition, I thank Thomas L. Frölicher, Fortunat Joos, Roland Séférian, and Jens D. Müller for their helpful comments on the paper and during discussions.
This research has been supported by the Woods Hole Oceanographic Institution (Postdoctoral Scholar Program) and the Schweizerischer Nationalfonds zur Förderung der Wissenschaftlichen Forschung (grant no. PZ00P2_209044 (ArcticECO)).
This paper was edited by Jack Middelburg and reviewed by Galen McKinley and Siv K. Lauvset.
Arora, V. K., Katavouta, A., Williams, R. G., Jones, C. D., Brovkin, V., Friedlingstein, P., Schwinger, J., Bopp, L., Boucher, O., Cadule, P., Chamberlain, M. A., Christian, J. R., Delire, C., Fisher, R. A., Hajima, T., Ilyina, T., Joetzjer, E., Kawamiya, M., Koven, C. D., Krasting, J. P., Law, R. M., Lawrence, D. M., Lenton, A., Lindsay, K., Pongratz, J., Raddatz, T., Séférian, R., Tachiiri, K., Tjiputra, J. F., Wiltshire, A., Wu, T., and Ziehn, T.: Carbon–concentration and carbon–climate feedbacks in CMIP6 models and their comparison to CMIP5 models, Biogeosciences, 17, 4173–4222, https://doi.org/10.5194/bg-17-4173-2020, 2020.
Bacastow, R. B.: Modulation of atmospheric carbon dioxide by the Southern Oscillation, Nature, 261, 116–118, https://doi.org/10.1038/261116a0, 1976.
Bennington, V., Galjanic, T., and McKinley, G. A.: Explicit Physical Knowledge in Machine Learning for Ocean Carbon Flux Reconstruction: The pCO2-Residual Method, J. Adv. Model. Earth Sy., 14, 3345, https://doi.org/10.1029/2021ms002960, 2022a.
Bennington, V., Gloege, L., and McKinley, G. A.: Variability in the global ocean carbon sink from 1959 to 2020 by correcting models with observations, Geophys. Res. Lett., 49, e2022GL098632, https://doi.org/10.1029/2022GL098632, 2022b.
Boucher, O., Servonnat, J., Albright, A. L., Aumont, O., Balkanski, Y., Bastrikov, V., Bekki, S., Bonnet, R., Bony, S., Bopp, L., Braconnot, P., Brockmann, P., Cadule, P., Caubel, A., Cheruy, F., Codron, F., Cozic, A., Cugnet, D., D'Andrea, F., Davini, P., de Lavergne, C., Denvil, S., Deshayes, J., Devilliers, M., Ducharne, A., Dufresne, J.-L., Dupont, E., Éthé, C., Fairhead, L., Falletti, L., Flavoni, S., Foujols, M.-A., Gardoll, S., Gastineau, G., Ghattas, J., Grandpeix, J.-Y., Guenet, B., Guez E., L., Guilyardi, E., Guimberteau, M., Hauglustaine, D., Hourdin, F., Idelkadi, A., Joussaume, S., Kageyama, M., Khodri, M., Krinner, G., Lebas, N., Levavasseur, G., Lévy, C., Li, L., Lott, F., Lurton, T., Luyssaert, S., Madec, G., Madeleine, J.-B., Maignan, F., Marchand, M., Marti, O., Mellul, L., Meurdesoif, Y., Mignot, J., Musat, I., Ottlé, C., Peylin, P., Planton, Y., Polcher, J., Rio, C., Rochetin, N., Rousset, C., Sepulchre, P., Sima, A., Swingedouw, D., Thiéblemont, R., Traore, A. K., Vancoppenolle, M., Vial, J., Vialard, J., Viovy, N., and Vuichard, N.: Presentation and Evaluation of the IPSL-CM6A-LR Climate Model, J. Adv. Model. Earth Sy., 12, e2019MS002010, https://doi.org/10.1029/2019MS002010, 2020.
Breeden, M. L. and McKinley, G. A.: Climate impacts on multidecadal pCO2 variability in the North Atlantic: 1948–2009, Biogeosciences, 13, 3387–3396, https://doi.org/10.5194/bg-13-3387-2016, 2016.
Broecker, W. S., Takahashi, T., Simpson, H. J., and Peng T.-H.: Fate of Fossil Fuel Carbon Dioxide and the Global Carbon Budget, Science, 206, 409–418, https://doi.org/10.1126/science.206.4417.409, 1979.
Bronselaer, B., Winton, M., Russell, J., Sabine, C. L., and Khatiwala, S.: Agreement of CMIP5 Simulated and Observed Ocean Anthropogenic CO2 Uptake, Geophys. Res. Lett., 44, 212–298, 305, https://doi.org/10.1002/2017GL074435, 2017.
Caldeira, K. and Duffy, P. B.: The Role of the Southern Ocean in Uptake and Storage of Anthropogenic Carbon Dioxide, Science, 287, 620–622, https://doi.org/10.1126/science.287.5453.620, 2000.
Chau, T. T. T., Gehlen, M., and Chevallier, F.: A seamless ensemble-based reconstruction of surface ocean pCO2 and air–sea CO2 fluxes over the global coastal and open oceans, Biogeosciences, 19, 1087–1109, https://doi.org/10.5194/bg-19-1087-2022, 2022.
Cheng, L., Abraham, J., Trenberth, K. E., Boyer, T., Mann, M. E., Zhu, J., Wang, F., Yu, F., Locarnini, R., Fasullo, J., Zheng, F., Li, Y., Zhang, B., Wan, L., Chen, X., Wang, D., Feng, L., Song, X., Liu, Y., Reseghetti, F., Simoncelli, S., Gouretski, V., Chen, G., Mishonov, A., Reagan, J., Von Schuckmann, K., Pan, Y., Tan, Z., Zhu, Y., Wei, W., Li, G., Ren, Q., Cao, L., and Lu, Y.: New Record Ocean Temperatures and Related Climate Indicators in 2023, Adv. Atmos. Sci., 41, 1068–1082, https://doi.org/10.1007/s00376-024-3378-5, 2024.
Christian, J. R., Denman, K. L., Hayashida, H., Holdsworth, A. M., Lee, W. G., Riche, O. G. J., Shao, A. E., Steiner, N., and Swart, N. C.: Ocean biogeochemistry in the Canadian Earth System Model version 5.0.3: CanESM5 and CanESM5-CanOE, Geosci. Model Dev., 15, 4393–4424, https://doi.org/10.5194/gmd-15-4393-2022, 2022.
Danabasoglu, G., Lamarque, J.-F., Bacmeister, J., Bailey, D. A., DuVivier, A. K., Edwards, J., Emmons, L. K., Fasullo, J., Garcia, R., Gettelman, A., Hannay, C., Holland, M. M., Large, W. G., Lauritzen, P. H., Lawrence, D. M., Lenaerts, J. T. M., Lindsay, K., Lipscomb, W. H., Mills, M. J., Neale, R., Oleson, K. W., Otto-Bliesner, B., Phillips, A. S., Sacks, W., Tilmes, S., van Kampenhout, L., Vertenstein, M., Bertini, A., Dennis, J., Deser, C., Fischer, C., Fox-Kemper, B., Kay, J. E., Kinnison, D., Kushner, P. J., Larson, V. E., Long, M. C., Mickelson, S., Moore, J. K., Nienhouse, E., Polvani, L., Rasch, P. J., and Strand, W. G.: The Community Earth System Model Version 2 (CESM2), J. Adv. Model. Earth Sy., 12, e2019MS001916, https://doi.org/10.1029/2019MS001916, 2020.
DeVries, T., Holzer, M., and Primeau, F.: Recent increase in oceanic carbon uptake driven by weaker upper-ocean overturning, Nature, 542, 215–218, https://doi.org/10.1038/nature21068, 2017.
DeVries, T., Le Quéré, C., Andrews, O., Berthet, S., Hauck, J., Ilyina, T., Landschützer, P., Lenton, A., Lima, I. D., Nowicki, M., Schwinger, J., and Séférian, R.: Decadal trends in the ocean carbon sink, P. Natl. Acad. Sci. USA, 116, 11646–11651, https://doi.org/10.1073/pnas.1900371116, 2019.
DeVries, T., Yamamoto, K., Wanninkhof, R., Gruber, N., Hauck, J., Müller, J. D., Bopp, L., Carroll, D., Carter, B. R., Chau, T. T. T., Doney, S. C., Gehlen, M., Gloege, L., Gregor, L., Henson, S., Kim, J. H., Iida, Y., Ilyina, T., Landschützer, P., Le Quéré, C., Munro, D. R., Nissen, C., Patara, L., Perez, F. F., Resplandy, L., Rodgers, K. B., Schwinger, J., Séférian, R., Sicardi, V., Terhaar, J., Triñanes, J., Tsujino, H., Watson, A. J., Yasunaka, S., and Zeng, J.: Magnitude, trends, and variability of the global ocean carbon sink from 1985–2018, Global Biogeochem. Cy., 37, e2023GB007780, https://doi.org/10.1029/2023GB007780, 2023.
Doney, S. C., Lima, I., Feely, R. A., Glover, D. M., Lindsay, K., Mahowald, N., Moore, J. K., and Wanninkhof, R.: Mechanisms governing interannual variability in upper-ocean inorganic carbon system and air–sea CO2 fluxes: Physical climate and atmospheric dust, Deep-Sea Res. Pt. II, 56, 640–655, https://doi.org/10.1016/j.dsr2.2008.12.006, 2009.
Dufour, C. O., Griffies, S. M., de Souza, G. F., Frenger, I., Morrison, A. K., Palter, J. B., Sarmiento, J. L., Galbraith, E. D., Dunne, J. P., Anderson, W. G., and Slater, R. D.: Role of Mesoscale Eddies in Cross-Frontal Transport of Heat and Biogeochemical Tracers in the Southern Ocean, J. Phys. Oceanogr., 45, 3057–3081, https://doi.org/10.1175/JPO-D-14-0240.1, 2015.
Fay, A. R. and McKinley, G. A.: Global open-ocean biomes: mean and temporal variability, Earth Syst. Sci. Data, 6, 273–284, https://doi.org/10.5194/essd-6-273-2014, 2014.
Fay, A. R., Gregor, L., Landschützer, P., McKinley, G. A., Gruber, N., Gehlen, M., Iida, Y., Laruelle, G. G., Rödenbeck, C., Roobaert, A., and Zeng, J.: SeaFlux: harmonization of air–sea CO2 fluxes from surface pCO2 data products using a standardized approach, Earth Syst. Sci. Data, 13, 4693–4710, https://doi.org/10.5194/essd-13-4693-2021, 2021.
Fay, A. R., McKinley, G. A., Lovenduski, N. S., Eddebbar, Y., Levy, M. N., Long, M. C., Olivarez, H. C., and Rustagi, R. R.: Immediate and long-lasting impacts of the Mt. Pinatubo eruption on ocean oxygen and carbon inventories, Global Biogeochem. Cy., 37, e2022GB007513, https://doi.org/10.1029/2022GB007513, 2023.
Feely, R. A., Wanninkhof, R., Takahashi, T., and Tans, P.: Influence of El Niño on the equatorial Pacific contribution to atmospheric CO2 accumulation, Nature, 398, 597–601, https://doi.org/10.1038/19273, 1999.
Friedlingstein, P., O'Sullivan, M., Jones, M. W., Andrew, R. M., Bakker, D. C. E., Hauck, J., Landschützer, P., Le Quéré, C., Luijkx, I. T., Peters, G. P., Peters, W., Pongratz, J., Schwingshackl, C., Sitch, S., Canadell, J. G., Ciais, P., Jackson, R. B., Alin, S. R., Anthoni, P., Barbero, L., Bates, N. R., Becker, M., Bellouin, N., Decharme, B., Bopp, L., Brasika, I. B. M., Cadule, P., Chamberlain, M. A., Chandra, N., Chau, T.-T.-T., Chevallier, F., Chini, L. P., Cronin, M., Dou, X., Enyo, K., Evans, W., Falk, S., Feely, R. A., Feng, L., Ford, D. J., Gasser, T., Ghattas, J., Gkritzalis, T., Grassi, G., Gregor, L., Gruber, N., Gürses, Ö., Harris, I., Hefner, M., Heinke, J., Houghton, R. A., Hurtt, G. C., Iida, Y., Ilyina, T., Jacobson, A. R., Jain, A., Jarníková, T., Jersild, A., Jiang, F., Jin, Z., Joos, F., Kato, E., Keeling, R. F., Kennedy, D., Klein Goldewijk, K., Knauer, J., Korsbakken, J. I., Körtzinger, A., Lan, X., Lefèvre, N., Li, H., Liu, J., Liu, Z., Ma, L., Marland, G., Mayot, N., McGuire, P. C., McKinley, G. A., Meyer, G., Morgan, E. J., Munro, D. R., Nakaoka, S.-I., Niwa, Y., O'Brien, K. M., Olsen, A., Omar, A. M., Ono, T., Paulsen, M., Pierrot, D., Pocock, K., Poulter, B., Powis, C. M., Rehder, G., Resplandy, L., Robertson, E., Rödenbeck, C., Rosan, T. M., Schwinger, J., Séférian, R., Smallman, T. L., Smith, S. M., Sospedra-Alfonso, R., Sun, Q., Sutton, A. J., Sweeney, C., Takao, S., Tans, P. P., Tian, H., Tilbrook, B., Tsujino, H., Tubiello, F., van der Werf, G. R., van Ooijen, E., Wanninkhof, R., Watanabe, M., Wimart-Rousseau, C., Yang, D., Yang, X., Yuan, W., Yue, X., Zaehle, S., Zeng, J., and Zheng, B.: Global Carbon Budget 2023, Earth Syst. Sci. Data, 15, 5301–5369, https://doi.org/10.5194/essd-15-5301-2023, 2023.
Frölicher, T. L., Joos, F., and Raible, C. C.: Sensitivity of atmospheric CO2 and climate to explosive volcanic eruptions, Biogeosciences, 8, 2317–2339, https://doi.org/10.5194/bg-8-2317-2011, 2011.
Frölicher, T. L., Joos, F., Raible, C. C., and Sarmiento, J. L.: Atmospheric CO2 response to volcanic eruptions: The role of ENSO, season, and variability, Global Biogeochem. Cy., 27, 239–251, https://doi.org/10.1002/gbc.20028, 2013.
Frölicher, T. L., Sarmiento, J. L., Paynter, D. J., Dunne, J. P., Krasting, J. P., and Winton, M.: Dominance of the Southern Ocean in Anthropogenic Carbon and Heat Uptake in CMIP5 Models, J. Climate, 28, 862–886, https://doi.org/10.1175/JCLI-D-14-00117.1, 2015.
Gloege, L., McKinley, G. A., Landschützer, P., Fay, A. R., Frölicher, T. L., Fyfe, J. C., Ilyina, T., Jones, S., Lovenduski, N. S., Rodgers, K. B., Schlunegger, S., and Takano, Y.: Quantifying Errors in Observationally Based Estimates of Ocean Carbon Sink Variability, Global Biogeochem. Cy., 35, e2020GB006788, https://doi.org/10.1029/2020GB006788, 2021.
Gloege, L., Yan, M., Zheng, T., and McKinley, G. A.: Improved Quantification of Ocean Carbon Uptake by Using Machine Learning to Merge Global Models and pCO2 Data, J. Adv. Model. Earth Sy., 14, e2021MS002620, https://doi.org/10.1029/2021MS002620, 2022.
Gooya, P., Swart, N. C., and Hamme, R. C.: Time-varying changes and uncertainties in the CMIP6 ocean carbon sink from global to local scale, Earth Syst. Dynam., 14, 383–398, https://doi.org/10.5194/esd-14-383-2023, 2023.
Goris, N., Tjiputra, J. F., Olsen, A., Schwinger, J., Lauvset, S. K., and Jeansson, E.: Constraining Projection-Based Estimates of the Future North Atlantic Carbon Uptake, J. Climate, 31, 3959–3978, https://doi.org/10.1175/JCLI-D-17-0564.1, 2018.
Gregor, L. and Gruber, N.: OceanSODA-ETHZ: a global gridded data set of the surface ocean carbonate system for seasonal to decadal studies of ocean acidification, Earth Syst. Sci. Data, 13, 777–808, https://doi.org/10.5194/essd-13-777-2021, 2021.
Griffies, S. M., Winton, M., Anderson, W. G., Benson, R., Delworth, T. L., Dufour, C. O., Dunne, J. P., Goddard, P., Morrison, A. K., Rosati, A., Wittenberg, A. T., Yin, J., and Zhang, R.: Impacts on Ocean Heat from Transient Mesoscale Eddies in a Hierarchy of Climate Models, J. Climate, 28, 952–977, https://doi.org/10.1175/JCLI-D-14-00353.1, 2015.
Gruber, N., Gloor, M., Mikaloff Fletcher, S. E., Doney, S. C., Dutkiewicz, S., Follows, M. J., Gerber, M., Jacobson, A. R., Joos, F., Lindsay, K., Menemenlis, D., Mouchet, A., Müller, S. A., Sarmiento, J. L., and Takahashi, T.: Oceanic sources, sinks, and transport of atmospheric CO2, Global Biogeochem. Cy., 23, GB1005, https://doi.org/10.1029/2008GB003349, 2009.
Gruber, N., Clement, D., Carter, B. R., Feely, R. A., van Heuven, S., Hoppema, M., Ishii, M., Key, R. M., Kozyr, A., Lauvset, S. K., Lo Monaco, C., Mathis, J. T., Murata, A., Olsen, A., Perez, F. F., Sabine, C. L., Tanhua, T., and Rik, W.: The oceanic sink for anthropogenic CO2 from 1994 to 2007, Science, 363, 1193–1199, https://doi.org/10.1126/science.aau5153, 2019a.
Gruber, N., Landschützer, P., and Lovenduski, N. S.: The variable southern ocean carbon sink, Annu. Rev. Mar. Sci., 11, 159–186, https://doi.org/10.1146/annurev-marine-121916-063407, 2019b.
Gruber, N., Bakker, D. C. E., DeVries, T., Gregor, L., Hauck, J., Landschützer, P., McKinley, G. A., and Müller, J. D.: Trends and variability in the ocean carbon sink, Nat. Rev. Earth Environ., 4, 119–134, https://doi.org/10.1038/s43017-022-00381-x, 2023.
Gupta, A. Sen, Jourdain, N. C., Brown, J. N., and Monselesan, D.: Climate Drift in the CMIP5 Models, J. Climate, 26, 8597–8615, https://doi.org/10.1175/JCLI-D-12-00521.1, 2013.
Gutjahr, O., Putrasahan, D., Lohmann, K., Jungclaus, J. H., von Storch, J.-S., Brüggemann, N., Haak, H., and Stössel, A.: Max Planck Institute Earth System Model (MPI-ESM1.2) for the High-Resolution Model Intercomparison Project (HighResMIP), Geosci. Model Dev., 12, 3241–3281, https://doi.org/10.5194/gmd-12-3241-2019, 2019.
Halsey, L. G.: The reign of the p-value is over: what alternative analyses could we employ to fill the power vacuum?, Biol. Lett., 15, 20190174, https://doi.org/10.1098/rsbl.2019.0174, 2019.
Hauck, J., Völker, C., Wang, T., Hoppema, M., Losch, M., and Wolf-Gladrow, D. A.: Seasonally different carbon flux changes in the Southern Ocean in response to the southern annular mode, Global Biogeochem. Cy., 27, 1236–1245, https://doi.org/10.1002/2013GB004600, 2013.
Hauck, J., Zeising, M., Le Quéré, C., Gruber, N., Bakker, D. C. E., Bopp, L., Chau, T. T. T., Gürses, Ö., Ilyina, T., Landschützer, P., Lenton, A., Resplandy, L., Rödenbeck, C., Schwinger, J., and Séférian, R.: Consistency and Challenges in the Ocean Carbon Sink Estimate for the Global Carbon Budget, Front. Mar. Sci., 7, 571720, https://doi.org/10.3389/fmars.2020.571720, 2020.
Hauck, J., Nissen, C., Landschützer, P., Rödenbeck, C., Bushinsky, S., and Olsen, A.: Sparse observations induce large biases in estimates of the global ocean CO2 sink: an ocean model subsampling experiment, Philos. Trans. R. Soc. A, 381, 20220063, https://doi.org/10.1098/rsta.2022.0063, 2023.
Heinze, C., Meyer, S., Goris, N., Anderson, L., Steinfeldt, R., Chang, N., Le Quéré, C., and Bakker, D. C. E.: The ocean carbon sink – impacts, vulnerabilities and challenges, Earth Syst. Dynam., 6, 327–358, https://doi.org/10.5194/esd-6-327-2015, 2015.
Held, I. M., Guo, H., Adcroft, A., Dunne, J. P., Horowitz, L. W., Krasting, J., Shevliakova, E., Winton, M., Zhao, M., Bushuk, M., Wittenberg, A. T., Wyman, B., Xiang, B., Zhang, R., Anderson, W., Balaji, V., Donner, L., Dunne, K., Durachta, J., Gauthier, P. P. G., Ginoux, P., Golaz, J.-C., Griffies, S. M., Hallberg, R., Harris, L., Harrison, M., Hurlin, W., John, J., Lin, P., Lin, S.-J., Malyshev, S., Menzel, R., Milly, P. C. D., Ming, Y., Naik, V., Paynter, D., Paulot, F., Ramaswamy, V., Reichl, B., Robinson, T., Rosati, A., Seman, C., Silvers, L. G., Underwood, S., and Zadeh, N.: Structure and Performance of GFDL's CM4.0 Climate Model, J. Adv. Model. Earth Sy., 11, 3691–3727, https://doi.org/10.1029/2019MS001829, 2019.
Held, L. and Ott, M.: On p-values and Bayes factors, Annu. Rev. Stat. Appl., 5, 393–419, https://doi.org/10.1146/annurev-statistics-031017-100307, 2018.
Hersbach, H., Bell, B., Berrisford, P., Hirahara, S., Horányi, A., Muñoz-Sabater, J., Nicolas, J., Peubey, C., Radu, R., Schepers, D., Simmons, A., Soci, C., Abdalla, S., Abellan, X., Balsamo, G., Bechtold, P., Biavati, G., Bidlot, J., Bonavita, M., De Chiara, G., Dahlgren, P., Dee, D., Diamantakis, M., Dragani, R., Flemming, J., Forbes, R., Fuentes, M., Geer, A., Haimberger, L., Healy, S., Hogan, R. J., Hólm, E., Janisková, M., Keeley, S., Laloyaux, P., Lopez, P., Lupu, C., Radnoti, G., de Rosnay, P., Rozum, I., Vamborg, F., Villaume, S., and Thépaut, J.-N.: The ERA5 global reanalysis, Q. J. Roy. Meteor. Soc., 146, 1999–2049, https://doi.org/10.1002/qj.3803, 2020.
IPCC: Summary for Policymakers, in: Climate Change 2021: The Physical Science Basis. Contribution of Working Group I to the Sixth Assessment Report of the Intergovernmental Panel on Climate Change, edited by: Masson-Delmotte, V., Zhai, P., Pirani, A., Connors, S. L., Péan, C., Berger, S., Caud, N., Chen, Y., Goldfarb, L., Gomis, M. I., Huang, M., Leitzell, K., Lonnoy, E., Matthews, J. B. R., Maycock, T. K., Waterfield, T., Yelekçi, O., Yu, R., and Zhou, B., Cambridge University Press, https://doi.org/10.1017/9781009157896.001, 2021.
Ishii, M., Feely, R. A., Rodgers, K. B., Park, G.-H., Wanninkhof, R., Sasano, D., Sugimoto, H., Cosca, C. E., Nakaoka, S., Telszewski, M., Nojiri, Y., Mikaloff Fletcher, S. E., Niwa, Y., Patra, P. K., Valsala, V., Nakano, H., Lima, I., Doney, S. C., Buitenhuis, E. T., Aumont, O., Dunne, J. P., Lenton, A., and Takahashi, T.: Air–sea CO2 flux in the Pacific Ocean for the period 1990–2009, Biogeosciences, 11, 709–734, https://doi.org/10.5194/bg-11-709-2014, 2014.
Joos, F., Plattner, G.-K., Stocker, T. F., Marchal, O., and Schmittner, A.: Global Warming and Marine Carbon Cycle Feedbacks on Future Atmospheric CO2, Science, 284, 464–467, https://doi.org/10.1126/science.284.5413.464, 1999.
Joos, F., Roth, R., Fuglestvedt, J. S., Peters, G. P., Enting, I. G., von Bloh, W., Brovkin, V., Burke, E. J., Eby, M., Edwards, N. R., Friedrich, T., Frölicher, T. L., Halloran, P. R., Holden, P. B., Jones, C., Kleinen, T., Mackenzie, F. T., Matsumoto, K., Meinshausen, M., Plattner, G.-K., Reisinger, A., Segschneider, J., Shaffer, G., Steinacher, M., Strassmann, K., Tanaka, K., Timmermann, A., and Weaver, A. J.: Carbon dioxide and climate impulse response functions for the computation of greenhouse gas metrics: a multi-model analysis, Atmos. Chem. Phys., 13, 2793–2825, https://doi.org/10.5194/acp-13-2793-2013, 2013.
Keeling, C. D., Whorf, T. P., Wahlen, M., and van der Plichtt, J.: Interannual extremes in the rate of rise of atmospheric carbon dioxide since 1980, Nature, 375, 666–670, https://doi.org/10.1038/375666a0, 1995.
Keller, K. M., Joos, F., Raible, C. C., Cocco, V., Frölicher, T. L., Dunne, J. P., Gehlen, M., Bopp, L., Orr, J. C., Tjiputra, J., Heinze, C., Segschneider, J., Roy, T., and Metzl, N.: Variability of the ocean carbon cycle in response to the North Atlantic Oscillation, Tellus B, 64, 18738, https://doi.org/10.3402/tellusb.v64i0.18738, 2012.
Keller, K. M., Joos, F., Lehner, F., and Raible, C. C.: Detecting changes in marine responses to ENSO from 850 to 2100 C.E.: Insights from the ocean carbon cycle, Geophys. Res. Lett., 42, 518–525, https://doi.org/10.1002/2014GL062398, 2015.
Keppler, L. and Landschützer, P.: Regional Wind Variability Modulates the Southern Ocean Carbon Sink, Sci. Rep., 9, 7384, https://doi.org/10.1038/s41598-019-43826-y, 2019.
Keppler, L., Landschützer, P., Lauvset, S. K., and Gruber, N.: Recent Trends and Variability in the Oceanic Storage of Dissolved Inorganic Carbon, Global Biogeochem. Cy., 37, e2022GB007677, https://doi.org/10.1029/2022GB007677, 2023.
Kuo, C., Lindberg, C., and Thomson, D. J.: Coherence established between atmospheric carbon dioxide and global temperature, Nature, 343, 709–714, https://doi.org/10.1038/343709a0, 1990.
Lachkar, Z., Orr, J. C., Dutay, J.-C., and Delecluse, P.: Effects of mesoscale eddies on global ocean distributions of CFC-11, CO2, and Δ14C, Ocean Sci., 3, 461–482, https://doi.org/10.5194/os-3-461-2007, 2007.
Lachkar, Z., Orr, J. C., and Dutay, J.-C.: Seasonal and mesoscale variability of oceanic transport of anthropogenic CO2, Biogeosciences, 6, 2509–2523, https://doi.org/10.5194/bg-6-2509-2009, 2009.
Lacroix, F., Ilyina, T., and Hartmann, J.: Oceanic CO2 outgassing and biological production hotspots induced by pre-industrial river loads of nutrients and carbon in a global modeling approach, Biogeosciences, 17, 55–88, https://doi.org/10.5194/bg-17-55-2020, 2020.
Landschützer, P., Gruber, N., Haumann, F. A., Rödenbeck, C., Bakker, D. C. E., van Heuven, S., Hoppema, M., Metzl, N., Sweeney, C., Takahashi, T., Tilbrook, B., and Wanninkhof, R.: The reinvigoration of the Southern Ocean carbon sink, Science, 349, 1221–1224, https://doi.org/10.1126/science.aab2620, 2015.
Landschützer, P., Gruber, N., and Bakker, D. C. E.: Decadal variations and trends of the global ocean carbon sink, Global Biogeochem. Cy., 30, 1396–1417, https://doi.org/10.1002/2015GB005359, 2016.
Lenton, A. and Matear, R. J.: Role of the Southern Annular Mode (SAM) in Southern Ocean CO2 uptake, Global Biogeochem. Cy., 21, GB2016, https://doi.org/10.1029/2006GB002714, 2007.
Le Quéré, C., Rödenbeck, C., Buitenhuis, E. T., Conway, T. J., Langenfelds, R., Gomez, A., Labuschagne, C., Ramonet, M., Nakazawa, T., Metzl, N., Gillett, N., and Heimann, M.: Saturation of the Southern Ocean CO2 Sink Due to Recent Climate Change, Science, 316, 1735–1738, https://doi.org/10.1126/science.1136188, 2007.
Li, H. and Ilyina, T.: Current and future decadal trends in the oceanic carbon uptake are dominated by internal variability, Geophys. Res. Lett., 45, 916–925, https://doi.org/10.1002/2017GL075370, 2018.
Lovato, T., Peano, D., Butenschön, M., Materia, S., Iovino, D., Scoccimarro, E., Fogli, P. G., Cherchi, A., Bellucci, A., Gualdi, S., Masina, S., and Navarra, A.: CMIP6 Simulations With the CMCC Earth System Model (CMCC-ESM2), J. Adv. Model. Earth Sy., 14, e2021MS002814, https://doi.org/10.1029/2021MS002814, 2022.
Lovenduski, N. S., Gruber, N., Doney, S. C., and Lima, I. D.: Enhanced CO2 outgassing in the Southern Ocean from a positive phase of the Southern Annular Mode, Global Biogeochem. Cy., 21, GB2026, https://doi.org/10.1029/2006GB002900, 2007.
Lovenduski, N. S., Gruber, N., and Doney, S. C.: Toward a mechanistic understanding of the decadal trends in the Southern Ocean carbon sink, Global Biogeochem. Cy., 22, GB3016, https://doi.org/10.1029/2007GB003139, 2008.
Lovenduski, N. S., McKinley, G. A., Fay, A. R., Lindsay, K., and Long, M. C.: Partitioning uncertainty in ocean carbon uptake projections: Internal variability, emission scenario, and model structure, Global Biogeochem. Cy., 30, 1276–1287, https://doi.org/10.1002/2016GB005426, 2016.
Lovenduski, N. S., Yeager, S. G., Lindsay, K., and Long, M. C.: Predicting near-term variability in ocean carbon uptake, Earth Syst. Dynam., 10, 45–57, https://doi.org/10.5194/esd-10-45-2019, 2019.
Lyu, K., Zhang, X., and Church, J. A.: Projected ocean warming constrained by the ocean observational record, Nat. Clim. Change, 11, 834–839, https://doi.org/10.1038/s41558-021-01151-1, 2021.
McCarthy, G. D., Brown, P. J., Flagg, C. N., Goni, G., Houpert, L., Hughes, C. W., Hummels, R., Inall, M., Jochumsen, K., Larsen, K. M. H., Lherminier, P., Meinen, C. S., Moat, B. I., Rayner, D., Rhein, M., Roessler, A., Schmid, C., and Smeed, D. A.: Sustainable Observations of the AMOC: Methodology and Technology, Rev. Geophys., 58, e2019RG000654, https://doi.org/10.1029/2019RG000654, 2020.
MacDougall, A. H., Frölicher, T. L., Jones, C. D., Rogelj, J., Matthews, H. D., Zickfeld, K., Arora, V. K., Barrett, N. J., Brovkin, V., Burger, F. A., Eby, M., Eliseev, A. V., Hajima, T., Holden, P. B., Jeltsch-Thömmes, A., Koven, C., Mengis, N., Menviel, L., Michou, M., Mokhov, I. I., Oka, A., Schwinger, J., Séférian, R., Shaffer, G., Sokolov, A., Tachiiri, K., Tjiputra, J., Wiltshire, A., and Ziehn, T.: Is there warming in the pipeline? A multi-model analysis of the Zero Emissions Commitment from CO2, Biogeosciences, 17, 2987–3016, https://doi.org/10.5194/bg-17-2987-2020, 2020.
Marshall, G. J.: Trends in the Southern Annular Mode from Observations and Reanalyses, J. Climate, 16, 4134–4143, https://doi.org/10.1175/1520-0442(2003)016<4134:TITSAM>2.0.CO;2, 2003.
Mauritsen, T., Bader, J., Becker, T., Behrens, J., Bittner, M., Brokopf, R., Brovkin, V., Claussen, M., Crueger, T., Esch, M., Fast, I., Fiedler, S., Fläschner, D., Gayler, V., Giorgetta, M., Goll, D. S., Haak, H., Hagemann, S., Hedemann, C., Hohenegger, C., Ilyina, T., Jahns, T., Jimenéz-de-la-Cuesta, D., Jungclaus, J., Kleinen, T., Kloster, S., Kracher, D., Kinne, S., Kleberg, D., Lasslop, G., Kornblueh, L., Marotzke, J., Matei, D., Meraner, K., Mikolajewicz, U., Modali, K., Möbis, B., Müller, W. A., Nabel, J. E. M. S., Nam, C. C. W., Notz, D., Nyawira, S.-S., Paulsen, H., Peters, K., Pincus, R., Pohlmann, H., Pongratz, J., Popp, M., Raddatz, T. J., Rast, S., Redler, R., Reick, C. H., Rohrschneider, T., Schemann, V., Schmidt, H., Schnur, R., Schulzweida, U., Six, K. D., Stein, L., Stemmler, I., Stevens, B., von Storch, J.-S., Tian, F., Voigt, A., Vrese, P., Wieners, K.-H., Wilkenskjeld, S., Winkler, A., and Roeckner, E.: Developments in the MPI-M Earth System Model version 1.2 (MPI-ESM1.2) and Its Response to Increasing CO2, J. Adv. Model. Earth Sy., 11, 998–1038, https://doi.org/10.1029/2018MS001400, 2019.
McKinley, G. A., Follows, M. J., and Marshall, J.: Mechanisms of air-sea CO2 flux variability in the equatorial Pacific and the North Atlantic, Global Biogeochem. Cy., 18, GB2011, https://doi.org/10.1029/2003GB002179, 2004.
McKinley, G. A., Pilcher, D. J., Fay, A. R., Lindsay, K., Long, M. C., and Lovenduski, N. S.: Timescales for detection of trends in the ocean carbon sink, Nature, 530, 469–472, https://doi.org/10.1038/nature16958, 2016.
McKinley, G. A., Fay, A. R., Lovenduski, N. S., and Pilcher, D. J.: Natural Variability and Anthropogenic Trends in the Ocean Carbon Sink, Annu. Rev. Mar. Sci., 9, 125–150, https://doi.org/10.1146/annurev-marine-010816-060529, 2017.
McKinley, G. A., Fay, A. R., Eddebbar, Y. A., Gloege, L., and Lovenduski, N. S.: External Forcing Explains Recent Decadal Variability of the Ocean Carbon Sink, AGU Adv., 1, e2019AV000149, https://doi.org/10.1029/2019AV000149, 2020.
McKinley, G. A., Bennington, V., Meinshausen, M., and Nicholls, Z.:. Modern air-sea flux distributions reduce uncertainty in the future ocean carbon sink, Environ. Res. Lett., 18, 044011, https://doi.org/10.1088/1748-9326/acc195, 2023.
McNeil, B. I. and Matear, R. J.: The non-steady state oceanic CO2 signal: its importance, magnitude and a novel way to detect it, Biogeosciences, 10, 2219–2228, https://doi.org/10.5194/bg-10-2219-2013, 2013.
Meinshausen, M., Vogel, E., Nauels, A., Lorbacher, K., Meinshausen, N., Etheridge, D. M., Fraser, P. J., Montzka, S. A., Rayner, P. J., Trudinger, C. M., Krummel, P. B., Beyerle, U., Canadell, J. G., Daniel, J. S., Enting, I. G., Law, R. M., Lunder, C. R., O'Doherty, S., Prinn, R. G., Reimann, S., Rubino, M., Velders, G. J. M., Vollmer, M. K., Wang, R. H. J., and Weiss, R.: Historical greenhouse gas concentrations for climate modelling (CMIP6), Geosci. Model Dev., 10, 2057–2116, https://doi.org/10.5194/gmd-10-2057-2017, 2017.
Meinshausen, M., Nicholls, Z. R. J., Lewis, J., Gidden, M. J., Vogel, E., Freund, M., Beyerle, U., Gessner, C., Nauels, A., Bauer, N., Canadell, J. G., Daniel, J. S., John, A., Krummel, P. B., Luderer, G., Meinshausen, N., Montzka, S. A., Rayner, P. J., Reimann, S., Smith, S. J., van den Berg, M., Velders, G. J. M., Vollmer, M. K., and Wang, R. H. J.: The shared socio-economic pathway (SSP) greenhouse gas concentrations and their extensions to 2500, Geosci. Model Dev., 13, 3571–3605, https://doi.org/10.5194/gmd-13-3571-2020, 2020.
Mikaloff Fletcher, S. E., Gruber, N., Jacobson, A. R., Doney, S. C., Dutkiewicz, S., Gerber, M., Follows, M., Joos, F., Lindsay, K., Menemenlis, D., Mouchet, A., Müller, S. A., and Sarmiento, J. L.: Inverse estimates of anthropogenic CO2 uptake, transport, and storage by the ocean, Global Biogeochem. Cy., 20, GB2002, https://doi.org/10.1029/2005GB002530, 2006.
Müller, J. D., Gruber, N., Carter, B., Feely, R., Ishii, M., Lange, N., Lauvset, S. K., Murata, A., Olsen, A., Pérez, F. F., Sabine, C., Tanhua, T., Wanninkhof, R., and Zhu, D.: Decadal Trends in the Oceanic Storage of Anthropogenic Carbon From 1994 to 2014, AGU Adv., 4, e2023AV000875, https://doi.org/10.1029/2023AV000875, 2023.
Orr, J. C., Maier-Reimer, E., Mikolajewicz, U., Monfray, P., Sarmiento, J. L., Toggweiler, J. R., Taylor, N. K., Palmer, J., Gruber, N., Sabine, C. L., Le Quéré, C., Key, R. M., and Boutin, J.: Estimates of anthropogenic carbon uptake from four three-dimensional global ocean models, Global Biogeochem. Cy., 15, 43–60, https://doi.org/10.1029/2000GB001273, 2001.
Orr, J. C., Kwiatkowski, L., and Pörtner, H.-O.: Arctic Ocean annual high in pCO2 could shift from winter to summer, Nature, 610, 94–100, https://doi.org/10.1038/s41586-022-05205-y, 2022.
Ostle, C., Landschützer, P., Edwards, M., Johnson, M., Schmidtko, S., Schuster, U., Watson, A. J., and Robinson, C.: Multidecadal changes in biology influence the variability of the North Atlantic carbon sink, Environ. Res. Lett., 17, 114056, https://doi.org/10.1088/1748-9326/ac9ecf, 2022.
Raupach, M. R.: The exponential eigenmodes of the carbon-climate system, and their implications for ratios of responses to forcings, Earth Syst. Dynam., 4, 31–49, https://doi.org/10.5194/esd-4-31-2013, 2013.
Raupach, M. R., Canadell, J. G., and Le Quéré, C.: Anthropogenic and biophysical contributions to increasing atmospheric CO2 growth rate and airborne fraction, Biogeosciences, 5, 1601–1613, https://doi.org/10.5194/bg-5-1601-2008, 2008.
Raupach, M. R., Gloor, M., Sarmiento, J. L., Canadell, J. G., Frölicher, T. L., Gasser, T., Houghton, R. A., Le Quéré, C., and Trudinger, C. M.: The declining uptake rate of atmospheric CO2 by land and ocean sinks, Biogeosciences, 11, 3453–3475, https://doi.org/10.5194/bg-11-3453-2014, 2014.
Rayner, N. A., Parker, D. E., Horton, E. B., Folland, C. K., Alexander, L. V, Rowell, D. P., Kent, E. C., and Kaplan, A.: Global analyses of sea surface temperature, sea ice, and night marine air temperature since the late nineteenth century, J. Geophys. Res.-Atmos., 108, 4407, https://doi.org/10.1029/2002JD002670, 2003.
Regnier, P., Resplandy, L., Najjar, R. G., and Ciais, P.: The land-to-ocean loops of the global carbon cycle, Nature, 603, 401–410, https://doi.org/10.1038/s41586-021-04339-9, 2022.
Revelle, R. and Suess, H. E.: Carbon Dioxide Exchange Between Atmosphere and Ocean and the Question of an Increase of Atmospheric CO2 during the Past Decades, Tellus A, 9, 18–27, https://doi.org/10.1111/j.2153-3490.1957.tb01849.x, 1957.
Riahi, K., van Vuuren, D. P., Kriegler, E., Edmonds, J., O'Neill, B. C., Fujimori, S., Bauer, N., Calvin, K., Dellink, R., Fricko, O., Lutz, W., Popp, A., Cuaresma, J. C., KC, S., Leimbach, M., Jiang, L., Kram, T., Rao, S., Emmerling, J., Ebi, K., Hasegawa, T., Havlik, P., Humpenöder, F., Da Silva, L. A., Smith, S., Stehfest, E., Bosetti, V., Eom, J., Gernaat, D., Masui, T., Rogelj, J., Strefler, J., Drouet, L., Krey, V., Luderer, G., Harmsen, M., Takahashi, K., Baumstark, L., Doelman, J. C., Kainuma, M., Klimont, Z., Marangoni, G., Lotze-Campen, H., Obersteiner, M., Tabeau, A., and Tavoni, M.: The Shared Socioeconomic Pathways and their energy, land use, and greenhouse gas emissions implications: An overview, Global Environ. Change, 42, 153–168, https://doi.org/10.1016/j.gloenvcha.2016.05.009, 2017.
Ridge, S. M. and McKinley, G. A.: Ocean carbon uptake under aggressive emission mitigation, Biogeosciences, 18, 2711–2725, https://doi.org/10.5194/bg-18-2711-2021, 2021.
Rödenbeck, C., Bakker, D. C. E., Gruber, N., Iida, Y., Jacobson, A. R., Jones, S., Landschützer, P., Metzl, N., Nakaoka, S., Olsen, A., Park, G.-H., Peylin, P., Rodgers, K. B., Sasse, T. P., Schuster, U., Shutler, J. D., Valsala, V., Wanninkhof, R., and Zeng, J.: Data-based estimates of the ocean carbon sink variability – first results of the Surface Ocean pCO2 Mapping intercomparison (SOCOM), Biogeosciences, 12, 7251–7278, https://doi.org/10.5194/bg-12-7251-2015, 2015.
Rodgers, K. B., Schwinger, J., Fassbender, A. J., Landschützer, P., Yamaguchi, R., Frenzel, H., Stein, K., Müller, J. D., Goris, N., Bushinsky, S. M., Chau, T. T. T., Gehlen, M., Gallego, M. A., Gloege, L., Gregor, L., Gruber, N., Hauck, J., Iida, Y., Ishii, M., Keppler, L., Kim, J.-E., Schlunegger, S., Sharma, S., Tjiputra, J., Toyama, K., and Vaittinada Ayar, P.: Seasonal variability of the surface ocean carbon cycle: a synthesis, Global Biogeochem. Cy., 37, e2023GB007798, https://doi.org/10.1029/2023GB007798, 2023.
Sarmiento, J. L., Orr, J. C., and Siegenthaler, U.: A perturbation simulation of CO2 uptake in an ocean general circulation model, J. Geophys. Res.-Oceans, 97, 3621–3645, https://doi.org/10.1029/91JC02849, 1992.
Schlunegger, S., Rodgers, K. B., Sarmiento, J. L., Ilyina, T., Dunne, J. P., Takano, Y., Christian, J. R., Long, M. C., Frölicher, T. L., Slater, R., and Lehner, F.: Time of Emergence and Large Ensemble Intercomparison for Ocean Biogeochemical Trends, Global Biogeochem. Cy., 34, e2019GB006453, https://doi.org/10.1029/2019GB006453, 2020.
Séférian, R., Gehlen, M., Bopp, L., Resplandy, L., Orr, J. C., Marti, O., Dunne, J. P., Christian, J. R., Doney, S. C., Ilyina, T., Lindsay, K., Halloran, P. R., Heinze, C., Segschneider, J., Tjiputra, J., Aumont, O., and Romanou, A.: Inconsistent strategies to spin up models in CMIP5: implications for ocean biogeochemical model performance assessment, Geosci. Model Dev., 9, 1827–1851, https://doi.org/10.5194/gmd-9-1827-2016, 2016.
Sellar, A. A., Walton, J., Jones, C. G., Wood, R., Abraham, N. L., Andrejczuk, M., Andrews, M. B., Andrews, T., Archibald, A. T., de Mora, L., Dyson, H., Elkington, M., Ellis, R., Florek, P., Good, P., Gohar, L., Haddad, S., Hardiman, S. C., Hogan, E., Iwi, A., Jones, C. D., Johnson, B., Kelley, D. I., Kettleborough, J., Knight, J. R., Köhler, M. O., Kuhlbrodt, T., Liddicoat, S., Linova-Pavlova, I., Mizielinski, M. S., Morgenstern, O., Mulcahy, J., Neininger, E., O'Connor, F. M., Petrie, R., Ridley, J., Rioual, J.-C., Roberts, M., Robertson, E., Rumbold, S., Seddon, J., Shepherd, H., Shim, S., Stephens, A., Teixiera, J. C., Tang, Y., Williams, J., Wiltshire, A., and Griffiths, P. T.: Implementation of U.K. Earth System Models for CMIP6, J. Adv. Model. Earth Sy., 12, e2019MS001946, https://doi.org/10.1029/2019MS001946, 2020.
Silvy, Y., Frölicher, T. L., Terhaar, J., Joos, F., Burger, F. A., Lacroix, F., Allen, M., Bernadello, R., Bopp, L., Brovkin, V., Buzan, J. R., Cadule, P., Dix, M., Dunne, J., Friedlingstein, P., Georgievski, G., Hajima, T., Jenkins, S., Kawamiya, M., Kiang, N. Y., Lapin, V., Lee, D., Lerner, P., Mengis, N., Monteiro, E. A., Paynter, D., Peters, G. P., Romanou, A., Schwinger, J., Sparrow, S., Stofferahn, E., Tjiputra, J., Tourigny, E., and Ziehn, T.: AERA-MIP: Emission pathways, remaining budgets and carbon cycle dynamics compatible with 1.5 ºC and 2 ºC global warming stabilization, EGUsphere [preprint], https://doi.org/10.5194/egusphere-2024-488, 2024.
Terhaar, J., Orr, J. C., Gehlen, M., Ethé, C., and Bopp, L.: Model constraints on the anthropogenic carbon budget of the Arctic Ocean, Biogeosciences, 16, 2343–2367, https://doi.org/10.5194/bg-16-2343-2019, 2019.
Terhaar, J., Torres, O., Bourgeois, T., and Kwiatkowski, L.: Arctic Ocean acidification over the 21st century co-driven by anthropogenic carbon increases and freshening in the CMIP6 model ensemble, Biogeosciences, 18, 2221–2240, https://doi.org/10.5194/bg-18-2221-2021, 2021a.
Terhaar, J., Frölicher, T., and Joos, F.: Southern Ocean anthropogenic carbon sink constrained by sea surface salinity, Sci. Adv., 7, 5964–5992, https://doi.org/10.1126/sciadv.abd5964, 2021b.
Terhaar, J., Frölicher, T. L., Aschwanden, M. T., Friedlingstein, P., and Joos, F.: Adaptive emission reduction approach to reach any global warming target, Nat. Clim. Change, 12, 1136–1142, https://doi.org/10.1038/s41558-022-01537-9, 2022a.
Terhaar, J., Frölicher, T. L., and Joos, F.: Observation-constrained estimates of the global ocean carbon sink from Earth system models, Biogeosciences, 19, 4431–4457, https://doi.org/10.5194/bg-19-4431-2022, 2022b.
Terhaar, J., Frölicher, T. L., and Joos, F.: Ocean acidification in emission-driven temperature stabilization scenarios: the role of TCRE and non-CO2 greenhouse gases, Environ. Res. Lett., 18, 024033, https://doi.org/10.1088/1748-9326/acaf91, 2023.
Terhaar, J., Goris, N., Müller, J. D., DeVries, T., Gruber, N., Hauck, J., Perez, F. F., and Séférian, R.: Assessment of global ocean biogeochemical models for ocean carbon sink estimates in RECCAP2 and recommendations for future studies, Global Biogeochem. Cy., 16, e2023MS003840, https://doi.org/10.1029/2023MS003840, 2024.
Thompson, D. W. J. and Solomon, S.: Interpretation of Recent Southern Hemisphere Climate Change, Science, 296, 895–899, https://doi.org/10.1126/science.1069270, 2002.
Tjiputra, J. F., Schwinger, J., Bentsen, M., Morée, A. L., Gao, S., Bethke, I., Heinze, C., Goris, N., Gupta, A., He, Y.-C., Olivié, D., Seland, Ø., and Schulz, M.: Ocean biogeochemistry in the Norwegian Earth System Model version 2 (NorESM2), Geosci. Model Dev., 13, 2393–2431, https://doi.org/10.5194/gmd-13-2393-2020, 2020.
Tsujino, H., Urakawa, S., Nakano, H., Small, R. J., Kim, W. M., Yeager, S. G., Danabasoglu, G., Suzuki, T., Bamber, J. L., Bentsen, M., Böning, C. W., Bozec, A., Chassignet, E. P., Curchitser, E., Boeira Dias, F., Durack, P. J., Griffies, S. M., Harada, Y., Ilicak, M., Josey, S. A., Kobayashi, C., Kobayashi, S., Komuro, Y., Large, W. G., Le Sommer, J., Marsland, S. J., Masina, S., Scheinert, M., Tomita, H., Valdivieso, M., and Yamazaki, D.: JRA-55 based surface dataset for driving ocean–sea-ice models (JRA55-do), Ocean Model., 130, 79–139, https://doi.org/10.1016/j.ocemod.2018.07.002, 2018.
Watson, A. J., Schuster, U., Shutler, J. D., Holding, T., Ashton, I. G. C., Landschützer, P., Woolf, D. K., and Goddijn-Murphy, L.: Revised estimates of ocean-atmosphere CO2 flux are consistent with ocean carbon inventory, Nat. Commun., 11, 4422, https://doi.org/10.1038/s41467-020-18203-3, 2020.
Weijer, W., Cheng, W., Garuba, O. A., Hu, A., and Nadiga, B. T.: CMIP6 Models Predict Significant 21st Century Decline of the Atlantic Meridional Overturning Circulation, Geophys. Res. Lett., 47, e2019GL086075, https://doi.org/10.1029/2019GL086075, 2020.
Yang, X. and Wang, M.: Monsoon ecosystems control on atmospheric CO2 interannual variability: Inferred from a significant positive correlation between year-to-year changes in land precipitation and atmospheric CO2 growth rate, Geophys. Res. Lett., 27, 1671–1674, https://doi.org/10.1029/1999GL006073, 2000.
Yasunaka, S., Manizza, M., Terhaar, J., Olsen, A., Yamaguchi, R., Landschützer, P., Watanabe, E., Carroll, D., Adiwara, H., Müller, J. D., and Hauck, J.: An assessment of CO2 uptake in the Arctic Ocean from 1985 to 2018, Global Biogeochem. Cy., 37, e2023GB007806, https://doi.org/10.1029/2023GB007806, 2023.
Zeng, J., Iida, Y., Matsunaga, T., and Shirai, T.: Surface ocean CO2 concentration and air-sea flux estimate by machine learning with modelled variable trends, Front. Mar. Sci., 9, 989233, https://doi.org/10.3389/fmars.2022.989233, 2022.
Zeng, N., Mariotti, A., and Wetzel, P.: Terrestrial mechanisms of interannual CO2 variability, Global Biogeochem. Cy., 19, GB1016, https://doi.org/10.1029/2004GB002273, 2005.
Ziehn, T., Chamberlain, M. A., Law, R. M., Lenton, A., Bodman, R. W., Dix, M., Stevens, L., Wang, Y.-P., and Srbinovsky, J.: The Australian Earth System Model: ACCESS-ESM1.5, J. South. Hemisph. Earth Syst. Sci., 70, 193–214, 2020.
- Abstract
- Introduction
- Methods and datasets
- The influence of atmospheric CO2 on the ocean carbon sink
- The importance of climate variability on decadal trends on the ocean carbon sink
- Imprint of climate change and ocean heat uptake on the ocean carbon sink
- Potential caveats and limitations
- Discussion and conclusion
- Code and data availability
- Competing interests
- Disclaimer
- Acknowledgements
- Financial support
- Review statement
- References