the Creative Commons Attribution 4.0 License.
the Creative Commons Attribution 4.0 License.
 | 19 Sep 2024
Mechanisms of soil organic carbon and nitrogen stabilization in mineral-associated organic matter – insights from modeling in phase space
Stefano Manzoni
M. Francesca Cotrufo
Understanding the mechanisms of plant-derived carbon (C) and nitrogen (N) transformation and stabilization in soil is fundamental for predicting soil capacity to mitigate climate change and support other soil functions. The decomposition of plant residues and particulate organic matter (POM) contributes to the formation of mineral-associated (on average more stable) organic matter (MAOM) in soil. MAOM is formed from the binding of dissolved organic matter (ex vivo pathway) or microbial necromass and bioproducts (in vivo pathway) to minerals and metal colloids. Which of these two soil organic matter (SOM) stabilization pathways is more important and under which conditions remains an open question. To address this question, we propose a novel diagnostic model to describe C and N dynamics in MAOM as a function of the dynamics of residues and POM decomposition. Focusing on relations among soil compartments (i.e., modeling in phase space) rather than time trajectories allows isolating the fundamental processes underlying stabilization. Using this diagnostic model in combination with a database of 36 studies in which residue C and N were tracked into POM and MAOM, we found that MAOM is predominantly fueled by necromass produced by microbes decomposing residues and POM. The relevance of this in vivo pathway is higher in clayey soils but lower in C-rich soils and with N-poor added residues. Overall, our novel modeling in phase space proved to be a sound diagnostic tool for the mechanistic investigation of soil C dynamics and supported the current understanding of the critical role of both microbial transformation and mineral capacity for the stabilization of C in mineral soils.
- Article
(4860 KB) - Full-text XML
-
Supplement
(795 KB) - BibTeX
- EndNote


Soil carbon (C) storage has been proposed as a climate mitigation strategy, but how much C can be stored in soil and for how long is a matter of debate. Increasing plant productivity or adding C amendments to soils can increase C stocks or slow down their decline (Bruni et al., 2022), but the persistence of the added C depends on the balance of stabilization and destabilization processes (Lehmann et al., 2020; Liang et al., 2017). Only a small fraction of the added C is retained in the soil in the long term in mineral-associated forms or occluded in stable aggregates (Cotrufo et al., 2015; Manzoni et al., 2018; Pries et al., 2017). Yet, even small annual increments in soil C stocks over large areas can support the climate mitigation effort – not to mention other benefits of organic-matter-rich soils (Paustian et al., 2016). The clear advantages of promoting C storage in soil motivate an improved understanding of C stabilization pathways.
Here we focus on stabilization by mineral association including within fine aggregates (< 53 µm) and do not consider occlusion in larger aggregates, partly because the stability of mineral-associated organic matter (MAOM) is on average higher and partly because of data availability. Two main pathways support mineral association of organic matter (Liang et al., 2017): (i) the “in vivo” pathway, in which microbial growth generates necromass and extracellular products that are stabilized on soil minerals, and (ii) the “ex vivo” pathway, in which low-molecular-weight compounds, released by the depolymerization of structural residues and particulate organic matter (POM) by extracellular enzymatic reactions or from root exudates, are stabilized on soil minerals. Both pathways are partly mediated by microbial (and faunal) decomposers. On the one hand, higher microbial growth per unit C consumed (i.e., high C use efficiency, CUE) is associated with higher necromass and thus higher C storage – consistent with the in vivo pathway (Tao et al., 2023; Wang et al., 2021). On the other hand, higher microbial growth can lead to higher enzyme production, thereby promoting residue and soil organic matter (SOM) decomposition while also promoting C stabilization via the ex vivo pathway, with an uncertain net outcome for C storage.
While microbial growth, CUE, and decomposition dynamics mediate C stabilization, ultimately in aerated mineral soils C is stabilized by association with soil minerals and amorphous metals. Therefore, their availability and capacity to interact with organic compounds set the potential for long-term C stabilization (Georgiou et al., 2022; Kögel-Knabner et al., 2008). Short-range ordered iron and aluminum oxides and exchangeable calcium and magnesium promote organic matter stabilization by adsorption, as demonstrated by their strong correlations with MAOM (King et al., 2023). From a less mechanistic point of view, the clay (or silt + clay) fraction is also associated with a higher proportion of MAOM in soil organic matter (Cotrufo et al., 2019), higher MAOM content (Begill et al., 2023), and faster stabilization of residue-derived C into MAOM (Haddix et al., 2020).
Also, the quality of the organic matter supplied to the soil plays a role in the C stabilization process. Residues rich in nutrients – especially nitrogen (N) – support microbial growth by providing microbes with a stoichiometrically balanced diet, thus resulting in higher CUE and ultimately higher likelihood of C stabilization in MAOM (Cotrufo et al., 2013). In contrast, microbes feeding on N-poor residues need to invest more resources in extracellular enzymes to mine nutrients and to release C in excess of their stoichiometric requirements, leading to lower CUE (Manzoni et al., 2017) and thus a less effective in vivo pathway. Consistent with this idea that N-rich residues promote C stabilization in MAOM, residue N content and soil C stocks are positively correlated at a regional scale (Zhou et al., 2019). However, mineral fertilizers can reduce the overall soil organic matter stability by promoting C accumulation in particulate fractions with faster turnover (Rocci et al., 2022).
The combined effects of biota, soil properties, and input quality make prediction of C stabilization difficult, but these complexities are further compounded by methodological differences in the way organic matter fractions and their stability are identified. In general, organic matter is partitioned among still undecomposed coarse residues, particulate organic matter (POM) encompassing partly decomposed or fragmented residues (free or occluded in aggregates), and MOAM encompassing more degraded compounds and necromass that are bound to soil minerals. These fractions are operationally defined in multiple ways – e.g., based on density or size fractionation or considering sub-fractions occluded in aggregates or free (Leuthold et al., 2023). Moreover, due to nonlinear interactions of residues and native organic matter (priming), determining the fate of organic matter added to the soil as POM, MAOM, or mineralized products is possible only by tracing residue-derived C and N into the different soil components – e.g., through C and/or N isotope labeling. While soil fractionation combined with isotopic labeling is a commonly employed methodology, it is laborious and, as a result, residue incorporation studies have low temporal resolution. Finally, the lack of common protocols makes comparisons across studies difficult. To overcome these methodological challenges, it can be useful to develop minimalist C and N dynamics models to be used as diagnostic tools to track residue C and N stabilization into MAOM.
A diagnostic model able to interpret observed C and N dynamics in residue, POM, and MAOM during decomposition can also be useful to reconcile different trends that have been reported. In fact, residue-derived POM can increase (Fulton-Smith and Cotrufo, 2019; Leichty et al., 2021) or decrease through time (Cheng et al., 2023; Neupane et al., 2023). MAOM can also exhibit contrasting trends (increasing in the studies cited above but decreasing in, e.g., Wang et al., 2017). These contrasting temporal dynamics might be either the result of complex stabilization dynamics or – on the contrary – a consequence of different experimental approaches and sampling times across experiments that mask simple underlying patterns.
We expect that the general pattern of stabilization is simple and universal – MAOM C and N increase as residues and POM are decomposed thanks to both in vivo and ex vivo pathways, but ultimately even MAOM C and N are mineralized – although it might take years to centuries and in some soils even millennia. We argue that this pattern would emerge clearly when modeling POM and MAOM dynamics not as a function of time but in relation to each other – e.g., modeling variations in MAOM as a function of variations in residues and POM. This approach moves away from classical modeling of time trajectories and focuses instead on modeling in the space of the state variables, also referred to as “phase space” (Argyris et al., 1994). Phase space representations allow reducing the effects of factors that determine biogeochemical reaction rates (e.g., temperature, incubation conditions) while emphasizing instead the relations among the soil C and N compartments. For example, MAOM may accumulate in one dataset but decrease in another. In the phase space, these two contrasting patterns would appear as two subsequent phases in the same trajectory – as residues and POM are decomposed, MAOM first accumulates and is then depleted, forming a single humped-shaped trajectory in the MAOM vs. POM space. Similar phase space representations have been applied to study nutrient dynamics during decomposition (Bosatta and Ågren, 1985; Manzoni et al., 2008), but to our knowledge they have not been used to investigate C and N stabilization mechanisms.
The goal of this contribution is to characterize the pathways of residue C and N stabilization using a novel, fully analytical diagnostic model combined with a database of 36 isotope labeling studies. Our specific questions are as follows.
- i.
Can we reconcile contrasting loss and accumulation patterns of residues and POM as well as MAOM by considering the dynamic coupling between these pools as decomposition progresses?
- ii.
What is the dominant pathway of C and N stabilization in MAOM?
- iii.
What are the drivers of the stabilization pathway as represented by model parameters?
2.1 Theory
2.1.1 Model rationale
For the purpose of this model, we conceptualize soil organic matter as the sum of two physically well-defined compartments: combined residues and particulate organic matter (residue + POM, subscript P) and mineral-associated organic matter (MAOM, subscript M). Residue + POM includes both partly decomposed residues (operationally defined as fragments larger than 2 mm or separated by hand based on visual inspection) and organic matter in the light or coarse soil fractions (isolated via density or size fractionation). The choice of merging residues and POM in one model compartment is motivated by the fact that in many datasets they were not separated. MAOM includes only organic matter in the heavy or fine soil fractions (also from density or size fractionation). Both compartments are characterized by their C and N contents (mass of C or N per unit soil dry mass). Moreover, different from other existing models, we consider microorganisms driving the decomposition process to be distinct for POM and MAOM given the distinctive chemical and stoichiometric properties of these two soil compartments, though they might express similar traits so as to be functionally equivalent.
The two compartments are linked by two types of mass flow from residue + POM to MAOM: (i) products of depolymerization of residue + POM transferred to MAOM in dissolved form before being converted into microbial biomass (ex vivo pathway of stabilization) and (ii) necromass of microbes grown on residue + POM transferred to MAOM (in vivo pathway of stabilization). For simplicity, we do not consider dissolved organic matter (DOM) explicitly in this model. As shown in the Supplement (Sect. S1), a model including DOM shared by microbes in both residue + POM and MAOM can be constructed, but this more general model can be approximated by the simpler one used here by making two assumptions: (i) microbial uptake of the shared DOM is negligible compared to uptake from the depolymerization of residue + POM substrates, and (ii) the DOM compartment is at quasi-equilibrium, which is a reasonable assumption because DOM is a relatively small pool with fast turnover time.
Model parameters allow regulating how C and N are partitioned between the two stabilization pathways. Moreover, we consider the possibility that the soluble fraction of the added residues is immediately stabilized as MAOM. Leaching of dissolved organic matter is neglected. In the datasets we used (Sect. 2.2.1), both C and N were added in the soil only at the beginning of the incubations, allowing us to track a single organic matter cohort. This means that the initial condition in the model represents how much C and N have been added, but there are no subsequent inputs. In natural conditions, there would also be continuous inputs from new residues incorporated in the soil and from root exudation – these inputs could be added to apply this model in other contexts. Carbon is lost through microbial respiration, while we do not track the fate of inorganic N accumulating due to net N mineralization.
With this conceptual view of the soil system, we can write the mass balance equations for C (Sect. 2.1.2) and N (Sect. 2.1.4) of both substrate and microbial decomposers in the two compartments. These equations are not solved through time as usually done with this type of model, but instead we analytically find how one state variable changes as a function of another state variable (Sect. 2.1.3 and 2.1.5). In other words, we solve the equations in phase space (Argyris et al., 1994). Symbols are defined in Table 1, a schematic of the model is shown in Fig. 1, and a summary of equations for the model solution (including various scenarios with specific parameters) is provided in Table 2.
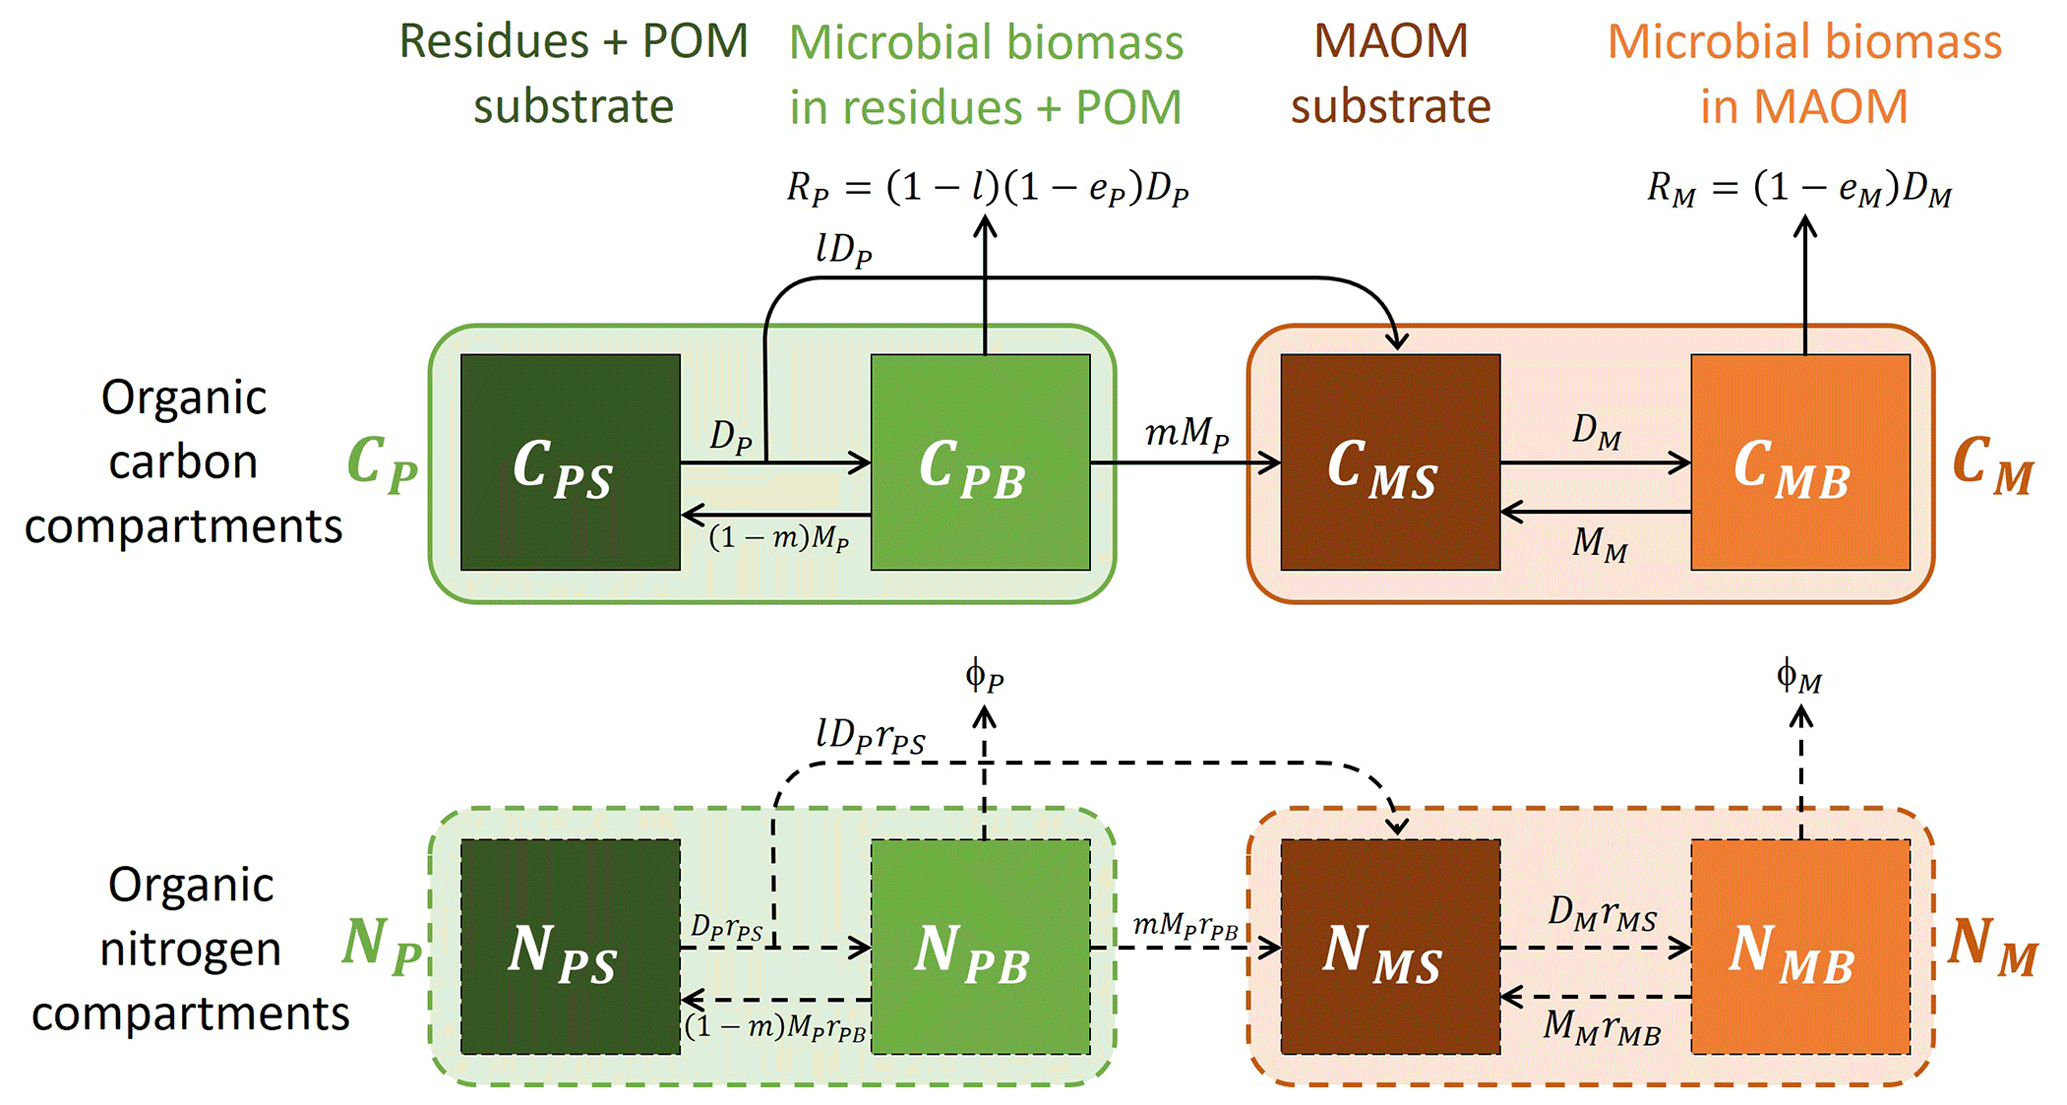
Figure 1Model schematic (see symbol explanations in Table 1). Solid and dashed arrows or compartment edges respectively indicate C and N flows or compartments. Light shading and color-coded symbols indicate aggregated variables including both substrates and microbial biomass. No input rates are shown because a single cohort of residues is tracked during decomposition and stabilization.
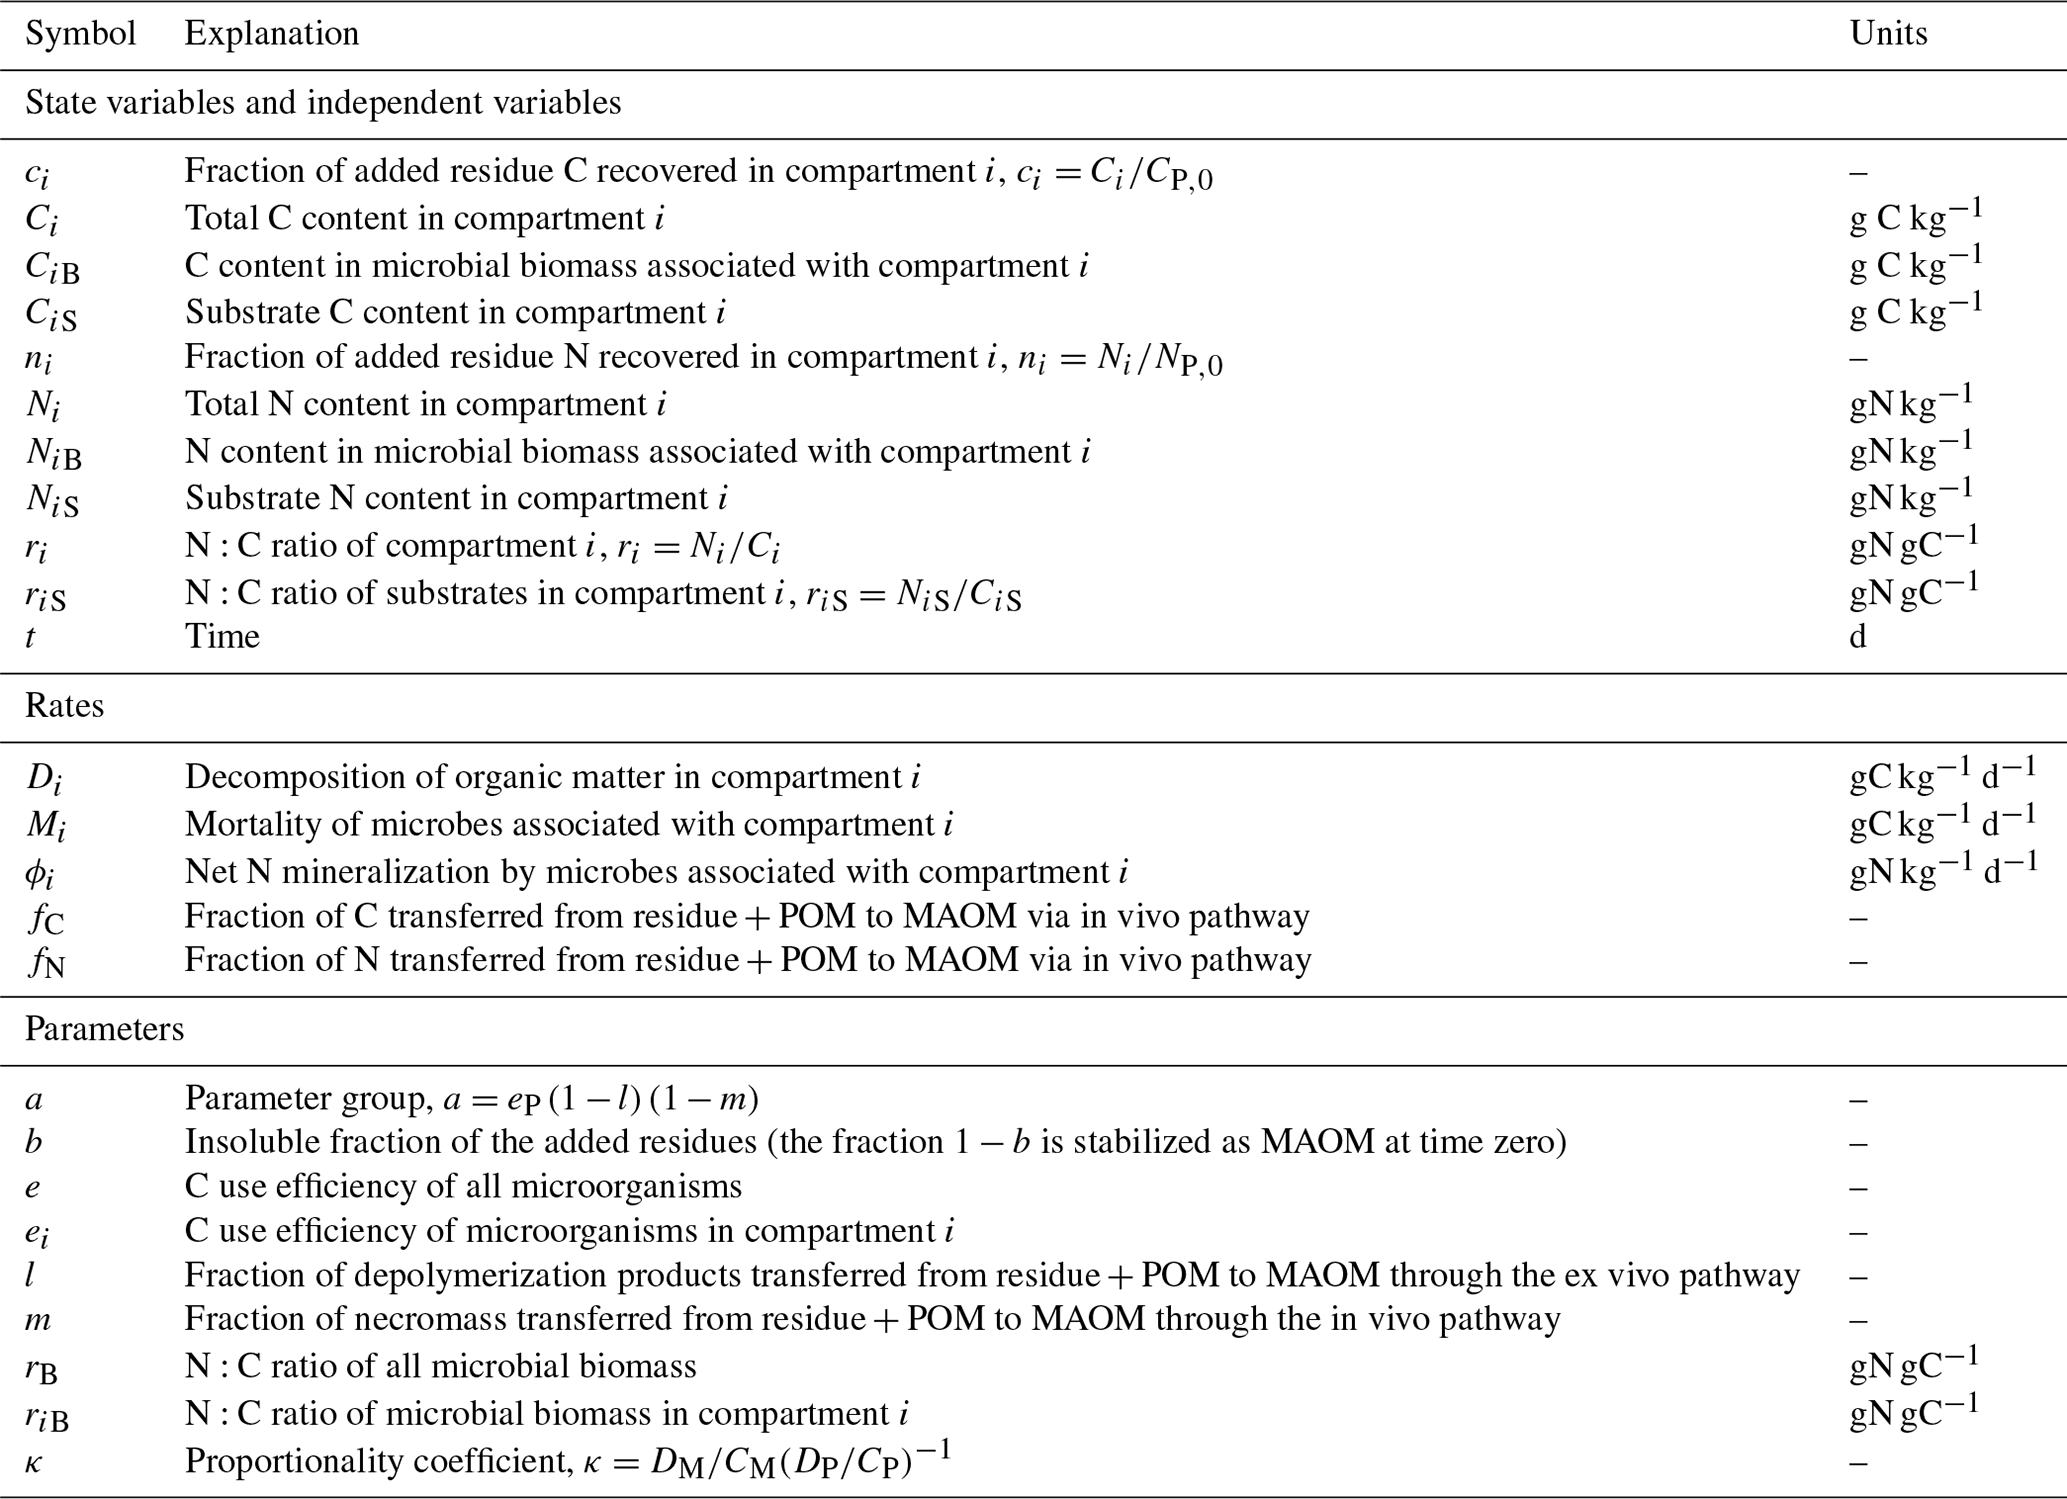
Table 1Symbol definitions and units (see also Fig. 1). Subscripts i=P and M indicate state variables, rates, or parameters associated with plant residues and particulate organic matter (POM), and mineral-associated organic matter (MAOM), respectively.
2.1.2 Carbon mass balance equations
The C mass balance equations for substrates (CPS) and microbial biomass (CPB) in residue + POM are written as
where DP is the residue + POM decomposition rate, MP is the mortality rate, l is the fraction of depolymerization products transferred to MAOM through the ex vivo pathway, m is the fraction of necromass transferred to MAOM through the in vivo pathway (1−m is the fraction recycled within the residue + POM compartment), and eP is the microbial C use efficiency (CUE).
Assuming that microbial biomass attains quasi-equilibrium () so that growth equals mortality (i.e., ) and summing up substrate and microbial biomass, we can write a single equation for the total C in the residue + POM compartment (CP),
with initial condition , where b is the insoluble residue fraction, which is retained as POM. Low values of b represent residues with a soluble fraction that is mostly stabilized as MAOM without undergoing enzymatic reaction (initial condition of Eq. 7). If b=1, no C is immediately stabilized so that the initial condition for C in the residue + POM compartment is . For conciseness, we refer to residues with b<1 as “soluble” and to residues with b=1 as “insoluble” even though all residue types are at least partly soluble, but when b=1 the soluble fraction is entirely used by microorganisms in the residue + POM compartment. The soluble fraction 1−b is immediately transferred to MAOM, where it can be adsorbed or assimilated by microorganisms in that compartment.
Defining the parameter group , Eq. (3) can be simplified to
The C mass balance equations for substrate (CMS) and microbial biomass (CMB) in MAOM are written as
where we adopted the same notation as for Eqs. (1) and (2), except that now quantities refer to the MAOM compartment, as indicated by subscript M. The first two terms of Eq. (5) represent the C flows from the residue + POM compartment. We also assumed that all necromass produced by microbes in the MAOM compartment is recycled back into MAOM. Applying as before the quasi-equilibrium approximation for microbial biomass (), we determine the mortality rate (i.e., MM≈eMDM) and finally obtain a single equation for the total C in MAOM (CM),
with initial condition , where 1−b is the fraction of residue C immediately incorporated in MAOM. For insoluble residues with b=1, the initial condition for C in the MAOM compartment is CM(0)=0.
Before proceeding, it is convenient to express the decomposition rate of MAOM as a function of the decomposition rate of residues and POM. One could argue that the kinetic constants for these two rates should be broadly correlated as they both respond to environmental conditions in similar ways (although POM can have slightly higher temperature sensitivity; Karhu et al., 2019) but that MAOM decomposes more slowly than POM. Moreover, it is reasonable to expect that both decomposition rates scale approximately linearly with the C contents of the respective compartments (a reasonable approximation when considering long-term dynamics). This means that, as a first approximation,
where κ is the coefficient of proportionality between the (first-order) kinetic constants of the decomposition rates. Values of κ lower than 1 indicate that MAOM is decomposed slower than POM (as discussed in Sect. 2.2.2, κ≈0.05). This assumption only implies a proportionality between the decay constants, while the actual rates will still be different depending on the contents of C in residue + POM and MAOM.
2.1.3 Solution of the carbon mass balance equations in phase space
Equations (4) and (7) can be solved through time after specifying how the rates DP and DM vary with the state variables CP and CM, as well as with environmental conditions. To remove some of the variability induced by environmental conditions and to limit the number of model parameters, we move from this representation in the time domain to one in the phase space. To this aim, we now combine Eqs. (4) and (7) to obtain a single ordinary differential equation with CP as an independent variable and CM as a dependent variable. This can be done by dividing Eq. (7) by Eq. (3) and simplifying DP,
The boundary condition for this equation is . This condition indicates that at the beginning of decomposition, the insoluble fraction (b) of added residues (CP,0) is in the residue + POM compartment, while the soluble fraction (1−b) is transferred to MAOM.
Equation (9) is independent of the specifics of the kinetic laws used to describe decomposition rates, and thus it is largely independent of time per se. However, Eq. (9) depends on the parameters regulating the two pathways of organic matter stabilization (l, m), the CUE of the two microbial groups (eP, eM), and the proportionality coefficient between the decomposition rates of MAOM and POM (κ).
To solve Eq. (9) and find the analytical relation CM(CP), it is convenient to first normalize the C contents by the amount of added residue C – i.e., and . This normalization allows comparing different datasets more easily, as all measured quantities are rescaled between 0 and 1, with values decreasing through time as decomposition progresses, until all the initially added residues () are mineralized (). Moreover, the equations expressed in normalized form are independent of the units used to quantify inputs and mass in each compartment, and if needed it is easy to convert the normalized variables into absolute quantities by multiplying by the mass of added residue C. After normalizing, Eq. (9) becomes
with boundary condition .
Equation (10) is a non-autonomous ordinary differential equation with a compact analytical solution when b=1 (insoluble residues),
The full solution for the general case of partly soluble residues (b<1) is reported in the Supplement (Sect. S2).
2.1.4 Nitrogen mass balance equations
Following the same rationale as for the C mass balance equations, we consider N in substrates (NPS) and microbial biomass (NPB) of residue + POM, as well as in substrates (NMS) and microbial biomass (NMB) of MAOM,
where the N:C ratios of residue + POM (), MAOM (), microbial biomass associated with residue + POM (), and microbial biomass associated with MAOM () are used to convert C flow rates to N flow rates, and ϕP and ϕP are the net N mineralization rates of the two microbial groups. The net N mineralization rates are set so that the microbial N:C ratios are stable through time (Manzoni and Porporato, 2009); i.e., they are calculated as the differences between N demand for growth and N supply through uptake of organic N of the two respective microbial groups,
These formulations for net N mineralization allow capturing both net N release if substrates are sufficiently rich in N (, ) and net N immobilization when they cannot provide enough N for microorganisms (, ). Recalling that the mortality rates can be expressed as a function of the decomposition rates thanks to the quasi-equilibrium approximation ( and MMB≈eMDM), we can now sum up substrate and microbial biomass and write the N mass balances for the total N in the residue + POM (NP) and in the MAOM compartments (NM),
In these equations, we made the additional approximations and , which are justified because the microbial biomass C and N contents are about 2 orders of magnitude smaller than the substrate C and N contents, respectively (Xu et al., 2013).
Substituting the definitions for the N mineralization rates from Eqs. (16) and (17), we obtain more compact equations,
2.1.5 Solution of the nitrogen mass balance equations in phase space
As for the C mass balance equations, we now combine Eqs. (3), (20), and (21) and group parameters as before in to obtain two ordinary differential equations with CP as an independent variable and NP and NM as dependent variables,
After normalizing NP by the amount of added residue N () and some algebraic manipulations, Eq. (22) becomes
where r0 is the initial N:C ratio of the residue + POM (). If residues are insoluble (b=1), Eq. (24) can be solved following Manzoni (2017) to obtain the N release curve,
The general solution for b<1 is reported in the Supplement (Sect. S2). Equation (25) reduces to a linear relation when a≈0 (i.e., if l or m is close to 1) and nP(cP)=cP. This property will be useful in the following.
Normalizing the N content in the MAOM compartment in Eq. (23) by the amount of added residue N () and after some algebraic manipulations we obtain
Equation (26) can be solved analytically thanks to the fact that cM and nP are known functions of cP (using Eqs. 11 and 25, respectively). For simplicity, we now assume that the microorganisms associated with both substrate types have similar N:C ratios (i.e., ) and that residues are insoluble (b=1). With these assumptions, the N release curve for MAOM is
where we highlighted how two of the terms on the right-hand side of the equation are related to nP(cP) (Eq. 25) and cM(cP) (Eq. 11). The general solution for b<1 is reported in the Supplement (Sect. S2).
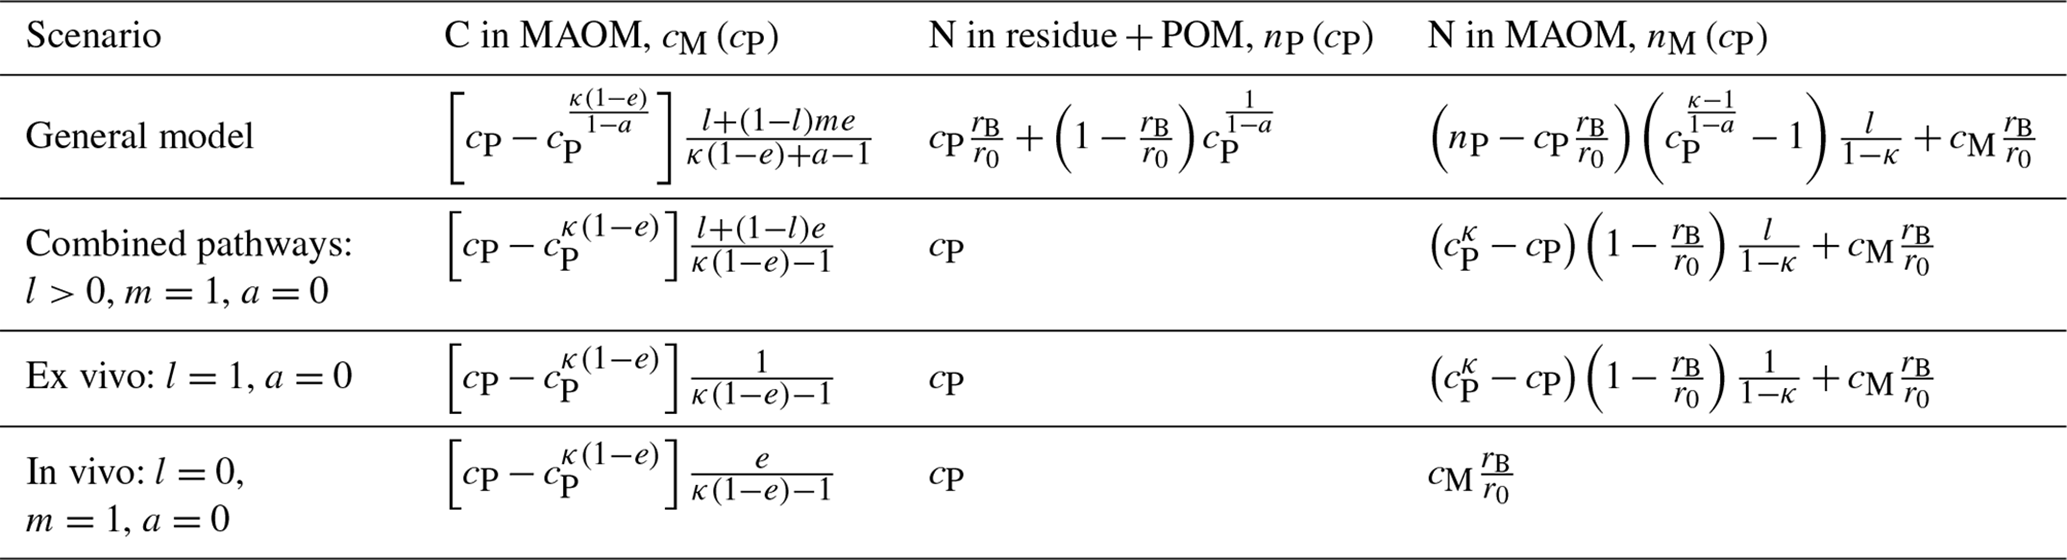
To summarize, Eqs. (11), (25), and (27) constitute the solutions in phase space of the mass balance equations describing the dynamics of C and N in the residue + POM and MAOM compartments. These equations and their limiting cases under assumptions of only in vivo or only ex vivo stabilization are reported in Table 2. The shape of these equations depends on five parameters (κ, l, m, and the microbial CUE and N:C ratio), which will be constrained using residue + POM and MAOM data, as described in Sect. 2.2.2.
Table 2Summary of analytical solutions of the dynamic model in phase space (C and N fractions are expressed as a function of the C fraction in residue + POM, cP), including model variants parameterized to describe scenarios in which the in vivo or ex vivo stabilization pathways are dominant. The solutions reported here are derived from Eqs. (11), (25), and (27) (insoluble residues, b=1) by assuming for simplicity that all microbial groups have the same N:C ratio, rB, and carbon use efficiency, e. The equations for nM(cP) are written in a compact form as a function of nP(cP) and cM(cP). Parameter group a is defined as .
2.1.6 Contribution of the in vivo pathway to MAOM
Parameters l and m regulate how much C and N is transferred to MAOM, but the total amounts transferred throughout the whole decomposition process depend on these parameters, the residue + POM decomposition rate, and how much of the initial residue C and N is transferred immediately to MAOM. These total amounts are calculated by integrating through time the C and N flow rates from residue + POM to MAOM through the in vivo and ex vivo pathways,
In Eqs. (29) and (31), the mass of residue C and N that is readily transferred to MAOM (i.e., the soluble fraction 1−b of the added residues) is also accounted for in the calculation of the ex vivo contribution to MAOM.
The relative contribution of the in vivo pathway to MAOM (fC or fN) can be then calculated as the ratio between the mass of C or N transferred from the microbial biomass in residue + POM to MAOM over the total mass of C or N transferred from POM to MAOM,
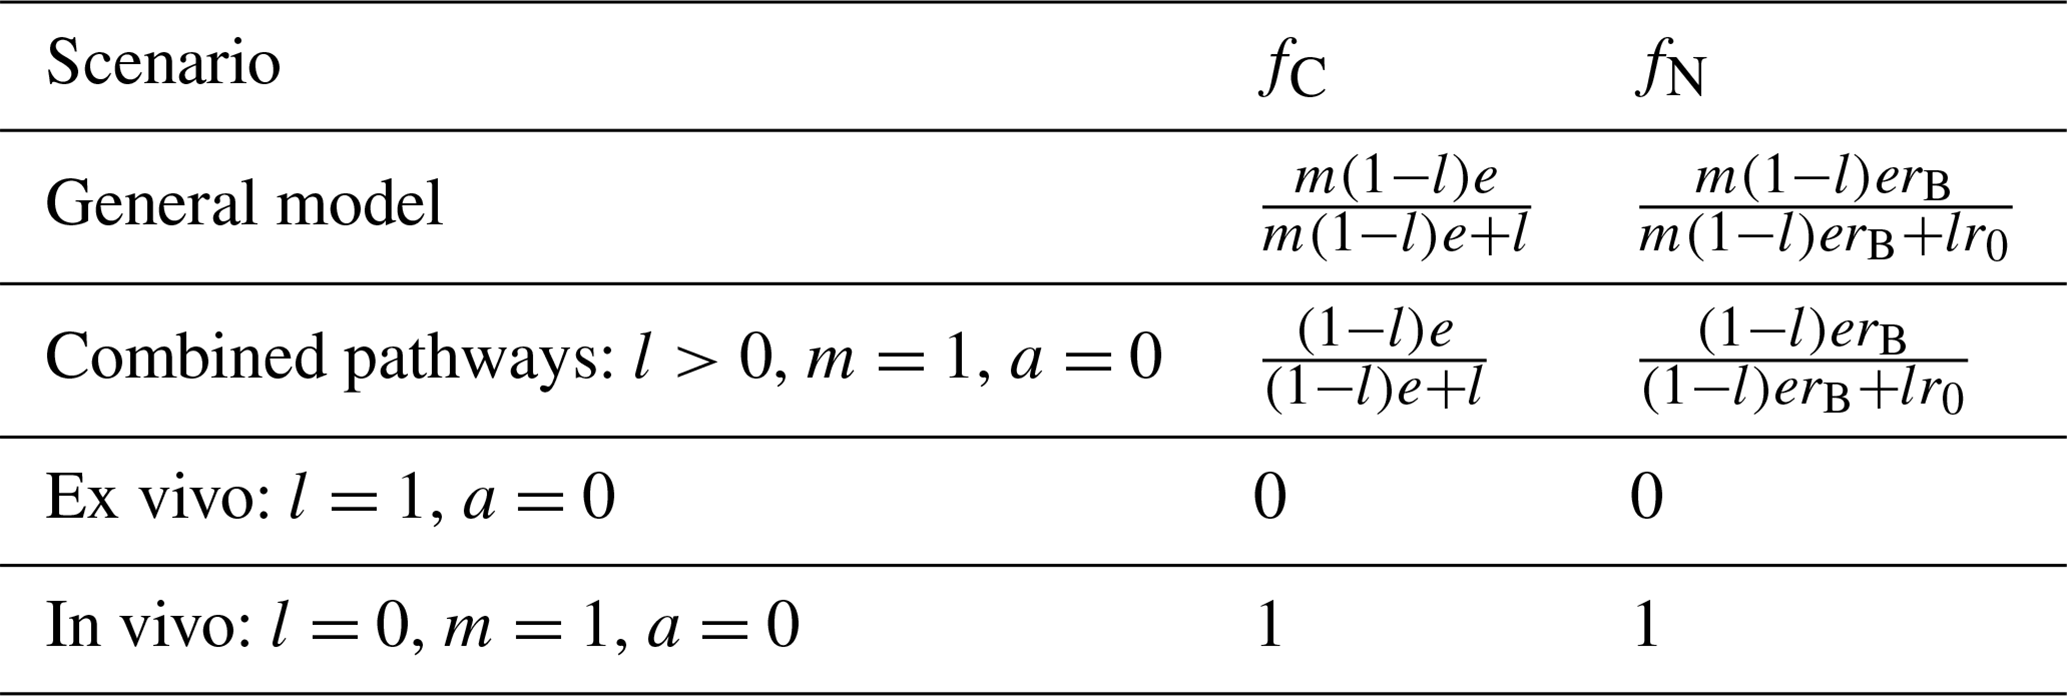
where in the last equalities of both equations we assumed that the residues were insoluble (b=1). In Eq. (33) we also approximated the time-varying N:C ratio of the residue + POM substrates (rPS) with the time-invariant initial residue N:C ratio (r0). This allows taking out from the integrals in Eq. (33) all coefficients and N:C ratios so that the integrals can be simplified, as also done in Eq. (32). As demonstrated in Sect. 3.2, this approximation is supported by the data. Simpler formulas for fC and fN can be easily obtained for the different model variants (Table 3).
Table 3Summary of analytical formulas for the relative contributions of the in vivo pathway to MAOM C and N (fC and fN from Eqs. 32 and 33, respectively). As for results reported in Table 2, we consider insoluble residues (b=1) and assume for simplicity that all microbial groups have the same N:C ratio, rB, and carbon use efficiency, e.
2.2 Data and model parameterization
2.2.1 Data retrieval and processing
Residue-derived C and N contents in undecomposed residues, POM, and MAOM were collated from published studies (Table S1). In most studies, 13C or 14C was used as a C tracer and 15N as an N tracer; in a few studies, residue-derived C and N were estimated by the difference between residue-amended and control treatments. We considered plant or microbial residues, but not leachates or biochar. Residues were often (but not always) separated before soil fractionation as fragments larger than 2 mm. Finely ground residues were instead recovered as POM (in that case we report the sum of residues and POM C or N). POM was generally isolated via density fractionation (light fraction with density lower than 1.6 to 2 g cm−3) or size fractionation (coarse fraction with size larger than 53 µm). Where both free POM and occluded POM were reported, they were combined into a single POM fraction. MAOM was generally defined as a heavy fraction (density higher than 1.6 to 2 g cm−3) or fine fraction (size smaller than 53 µm). Published data were obtained from tables and digitized figures or provided by the authors. In some cases, authors provided additional unpublished data to complete the datasets.
Data sources were selected to guarantee some degree of comparability across studies. Studies where residue C or N was traced in aggregates, but where it was not possible to distinguish between POM and MAOM within aggregates, were not considered. Reported negative values for any of the considered quantities were removed, but if primary data showed major inconsistencies (e.g., negative fractions of remaining residues) that could not be explained even after contacting the authors, the whole study was excluded. After this screening, the database contained data from 42 published articles (Almeida et al., 2021; Antonio Telles Rodrigues et al., 2022; Buckeridge et al., 2022; Canisares et al., 2023; Cheng et al., 2023; Cotrufo et al., 2024, 2015, 2022; Craig et al., 2022; Dai et al., 2022; Duan et al., 2023; Even and Cotrufo, 2024; Fang et al., 2019; Ferreira et al., 2021; Fulton-Smith and Cotrufo, 2019; Haddix et al., 2016, 2020; Huys et al., 2022a; Kölbl et al., 2006, 2007; Kou et al., 2023b; Lavallee et al., 2018; Leichty et al., 2021; Lian et al., 2016; Liang et al., 2023; Liebmann et al., 2020; Lyu et al., 2023; Magid et al., 2002; Mitchell et al., 2018; Neupane et al., 2023; Nunez et al., 2022; Nyamasoka-Magonziwa et al., 2022; Oliveira et al., 2021; Poeplau et al., 2023; Pries et al., 2017, 2018; Ridgeway et al., 2022, 2023b; Schiedung et al., 2023; Sokol et al., 2019; Su et al., 2020; Throckmorton et al., 2015; Wang et al., 2017; Witzgall et al., 2021; Xu et al., 2022). Some of these datasets were directly accessible from online repositories (Buckeridge, 2021; Craig et al., 2021; Huys et al., 2022b; Kou et al., 2023a; Ridgeway et al., 2023a). Several of the datasets within this database are incomplete because, depending on the specific experimental design, only C vs. C and N contents or only POM vs. combined residues and POM had been measured. Due to these gaps, 36 out of the total 42 datasets are used in the following analyses.
Minor data processing and harmonization were also performed. In the few studies reporting values of replicate measurements, replicates for each treatment and date were averaged. When the sum of residue-derived C in POM and MAOM did not match the amount of residue-derived C in the bulk soil (typical for physical fractionation, given that mass and C recoveries may vary from 100 %), we recalculated the fraction of residue-derived C in POM as products of the fraction of residue-derived C in bulk soil times the ratio POM (POM + MAOM); the calculation was similar for C in MAOM.
If not reported, the C content of the residues (g C per g of residue dry weight) was assumed to be equal to that of plant species in the same family that was provided in other studies of the database. Fractions of remaining residue C were approximated by the fractions of remaining residue dry mass if C contents were not reported for all measurement times. Finally, all C and N contents were normalized by the residue C and N contents added to the soil samples. In this way, C and N in undecomposed residues, POM, and MAOM were all expressed as fractions of remaining residue C and N (as in the model equations).
In addition to residue-derived C and N in the soil fractions, we also collected from the original data sources information on residue and soil properties, as well as climatic conditions at the sampled sites, including the initial residue C:N ratio, soil texture and total organic C content, and temperature during the laboratory or field incubation. If detailed texture data were not reported, percentages of sand, silt, and clay were inferred from the soil description provided in the data source. If no specific value of mean temperature during the field incubation was reported, we used the mean annual temperature at the incubation site. Generally, incubations in the field lasted more than 1 year, making the mean annual temperature representative of actual incubation conditions.
2.2.2 Model parameter estimation
The model was fitted to residue-derived C and N contents in both residue + POM and MAOM fractions. The number of free parameters was reduced by assuming that both microbial groups have the same CUE () and N:C ratio (). The latter parameter was assumed to be fixed at rB=0.13 gN gC−1, corresponding to the global average microbial C:N ratio of 7.6 gC gN−1 (Xu et al., 2013). With these assumptions, the model solutions cM(cP), nP(cP), and nM(cP) (Table 2) still have four free parameters: e, κ, l, and m. These parameters have partly similar effects, so fitting all of them could lead to equifinality issues, requiring us to constrain some of these parameters before fitting the others.
The relative decomposability κ was estimated as 0.05 based on the decay constants used in the MEMS-2 model (MEMS: microbial efficiency–matrix stabilization) (Zhang et al., 2021). In MEMS-2, the ratios of the decay constants for decomposition of MAOM and hydrolyzable residues, oxidizable residues, and POM are ≈ 2 × 10⁻², ≈ 5 × 10⁻², and ≈ 10−1, respectively. The higher ratio κ≈ 10−1 is also comparable to that estimated by Guo et al. (2022). Considering that here residues and POM are merged in a single compartment also including chemically recalcitrant compounds, we considered the intermediate value κ=0.05. We also attempted to constrain other parameters and fit κ to the data instead of setting a fixed value. However, this approach was unsuccessful, as fitting was poor for most datasets.
In Sect. 3.2 we present arguments for also constraining the value of m so that the remaining parameters e and l can be fitted to the cP and cM data using Eq. (11) that provides the relation between them cM(cP) (a lower bound for e values was set to 0.02). To this aim, we used all the time series with at least three cP and cM data pairs after grouping data from similar treatments, but not from different soils or treatments involving N additions, as those are expected to affect organic matter stabilization (38 time series in total). Too few datasets included residue-derived N contents in soil fractions for a systematic analysis, so model parameters were fitted only to the C data, except for a few examples in Sect. 3.3. Model fitting was performed by minimizing the square errors between measurements and data using the function lsqcurvefit in MATLAB (MathWorks, 2018).
2.2.3 Statistical analysis of model results
The estimated model parameters were predicted using the following as independent variables: C:N ratio of the added residues, clay content, soil organic C content (SOC, as an index of overall C availability), and incubation temperature (laboratory temperature or air temperature at the field site where the litter was incubated). The data were fitted with a linear mixed-effect model including interactions of clay content with the residue C:N ratio and soil organic C content, as well as with the data source as a random factor, using the function fitlme in MATLAB (MathWorks, 2018).
3.1 Model behavior
In general, the data show that C and N from the residue + POM compartment accumulate in MAOM in the early decomposition phase, while later both residue + POM and MAOM compartments lose mass (Appendix A). The same general trend is captured by modeled phase space trajectories, but these trajectories are modulated by the dominant stabilization pathways and other model parameters (Fig. 2). For all parameter values, decreasing cP during decomposition causes an initial increase in both cM and nM because C and N are transferred from residue + POM to MAOM (top and bottom rows in Fig. 2). However, towards the end of the decomposition process, as cP nears zero, transfer to MAOM is lower than mineralization of MAOM so that both cM and nM start decreasing to eventually also reach zero. Decomposition of residue + POM also causes nP to decrease, although in some scenarios N is preferentially retained in this pool before being transferred to MAOM or mineralized (downward concavity of the curves in the central row in Fig. 2).
Differences in the model behavior emerge when comparing predictions under contrasting stabilization pathways. If the in vivo pathway is dominant (l=0, m=1; blue), at a given cP, less C accumulates in MAOM (lower cM) compared to a scenario where the ex vivo pathway is dominant (l=1, m=0; orange). This lower C accumulation is due to respiration that removes C before necromass is formed and transferred to MAOM. In contrast, more N accumulates in MAOM (higher nM) if the in vivo pathway is dominant. This higher N accumulation is due to the N-enriched necromass from the residue + POM compartment. Because in the in vivo scenario necromass is not recycled within the residue + POM compartment (m=1), the C:N ratio of that compartment remains constant. Microorganisms might still need to immobilize N when feeding on N-poor residue + POM (Eq. 16), but the acquired N supports the production of biomass that is eventually transferred to MAOM. The mixed scenario, with simultaneous in vivo and ex vivo stabilization (green curves), leads to trajectories of cM and nM that are intermediate between the two more extreme scenarios.
Neither the in vivo nor the ex vivo pathway leads to preferential N retention in residue + POM (central row in Fig. 2). Mathematically, this pattern is explained by the fact that nP=cP when either l=1 or m=1 (both resulting in a=0). However, in the mixed scenario, preferential N retention in the residue + POM compartment occurs, as indicated by the downward concavity of the green curves in the central row of Fig. 2.
Increasing the C:N ratio of the added residues (solid vs. dashed curves in the second column of Fig. 2) causes relatively stronger N retention in residue + POM in the mixed scenario, and relatively higher N accumulation in MAOM, due to the higher N immobilization needed to satisfy the microbial N demand in both compartments. The same mechanism also causes higher N retention when increasing microbial CUE (solid vs. dashed curves in the third column of Fig. 2). However, higher CUE also increases C accumulation in MAOM (while residue C:N has no effect on cM) because less C is lost through respiration when CUE is higher.
Finally, increasing the MAOM decay constant relative to the decay constant of residue + POM (higher κ) causes lower retention of C and N in MAOM and more curvilinear trajectories as cP decreases (solid vs. dashed curves in the fourth column of Fig. 2). This pattern differs from the nearly linear accumulation (and very late decomposition) of C and N in MAOM when κ is low.
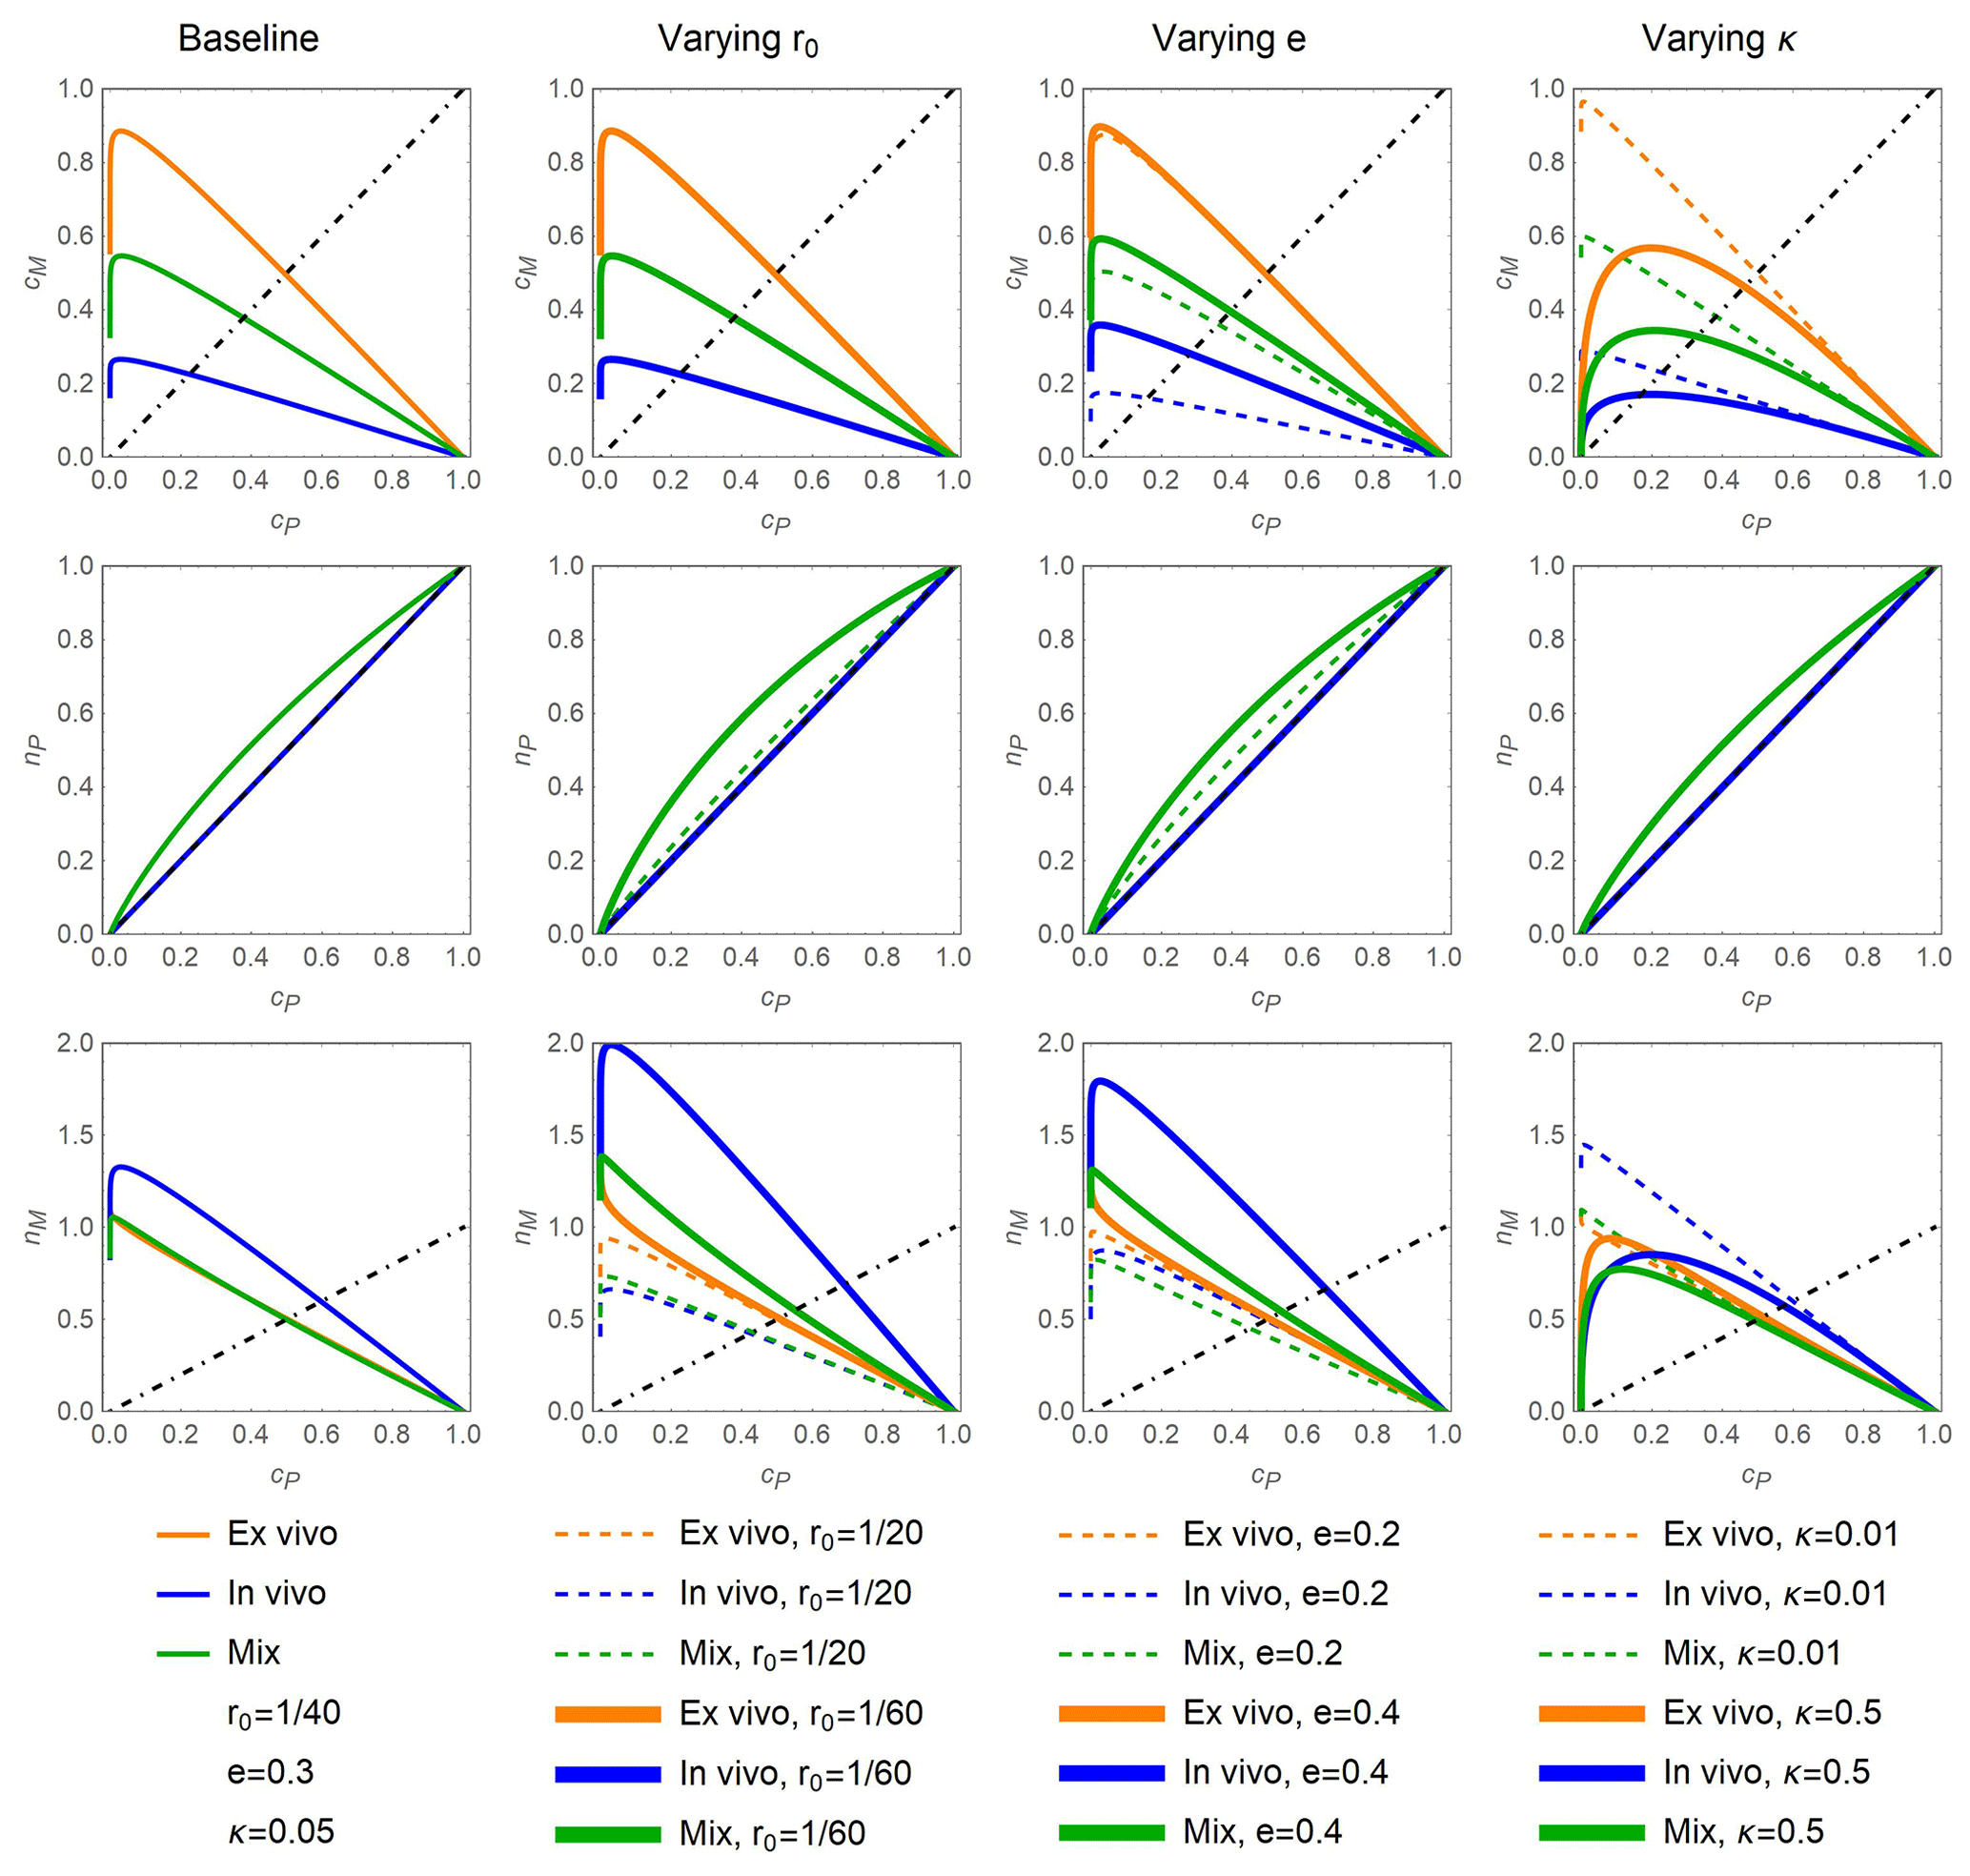
Figure 2Fraction of added C in MAOM, cM (top row); fraction of added N in residue + POM, nP (center row); and fraction of added N in MAOM, nM (bottom row) as a function of the fraction of added C in residue + POM, cP, under different stabilization pathway scenarios (colors) and when varying the values of model parameters around the baseline values shown in the first column: residue N:C ratio, r0 (second column); microbial carbon use efficiency, e (third column); and the ratio between the decay constants of MAOM and residue + POM decomposition, κ (fourth column). Three stabilization scenarios are considered: dominant ex vivo stabilization (l=1; orange), dominant in vivo stabilization (l=0, m=1; blue), and a combination of pathways denoted by “mix” (, ; green). In all panels, residue decomposition progresses from right to left along the curves as cP decreases. The dot-dashed black lines indicate 1:1 lines, which represent equality between the fractions of added C or N shown on the y axes and cP shown on the x axes; the added residues are assumed to be insoluble (b=1).
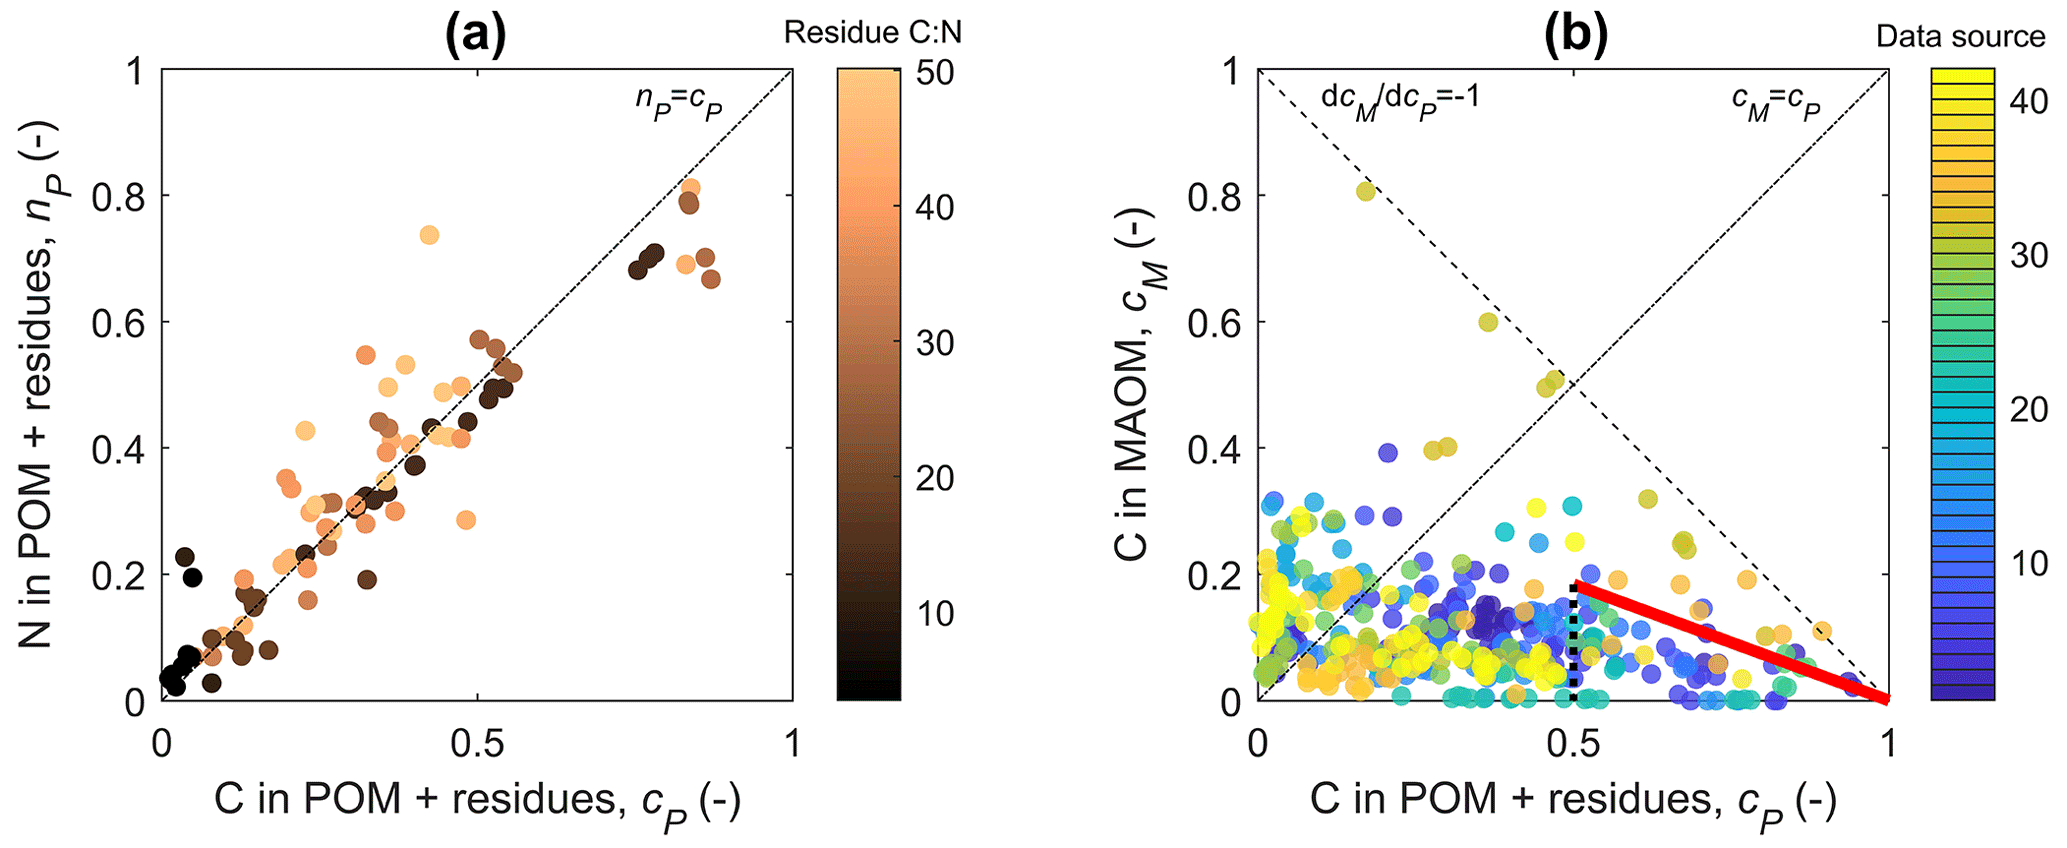
Figure 3(a) Relation between the fractions of added residue N (nP) and C (cP) recovered in residue + particulate organic matter (POM); lighter colors refer to residues with an increasing C:N ratio. (b) Relation between the fraction of added residue C recovered in mineral-associated organic matter (MAOM), cM, and cP; different colors indicate different data sources. In both panels, residue decomposition progresses from right to left along the curves as cP decreases. The dot-dashed black lines indicate 1:1 lines. In (a), the 1:1 line corresponds to the equation nP(cP)=cP (i.e., NP(CP)=r0CP), which is the solution of the model for both “ex vivo” and “in vivo” scenarios (Table 2). In (b), the dashed black line indicates the trajectory of conversion from residue + POM to MAOM without any C loss via respiration, whereas the thick red line is the upper-quartile boundary line for the early decomposition phase (). Data source numbers refer to the “source ID” in the database (Manzoni et al., 2024).
3.2 Stabilization pathways – mathematical analysis
Two lines of evidence help us constrain parameters l and m, which represent the MAOM stabilization pathways. First, during decomposition, the C:N ratio of the combined residue + POM compartment remains similar to the initial residue C:N (Fig. 3a). In general, POM is expected to have lower C:N than the residues because necromass recycling enriches the decomposing residues in N. Therefore, the observed stable C:N in the residue + POM compartment is surprising. Stable C:N implies that either microbial necromass recycling is low in the residue + POM compartment or most depolymerization products are transferred to MAOM so biomass growth is low. The first explanation corresponds to C and N in necromass being stabilized through the in vivo pathway, which in our mathematical framework implies m≈1. The second explanation requires instead that most C and N released during residue + POM decomposition are transferred to MAOM through the ex vivo pathway, corresponding to l≈1.
Mathematically, stable C:N in the residue + POM compartment requires a≈0 so that nP(cP)≈cP (Eq. 25), or – after converting variables back to actual C and N contents – NP(CP)≈r0CP. Fitting Eq. (25) to all nP and cP pairs in the dataset we found a=0.012 when considering the median r0, confirming that the C:N ratio of the residue + POM compartment is nearly constant. The parameter group a depends on both l and m, and a is approximately zero when either l≈1 (ex vivo pathway) or m≈1 (in vivo pathway). Therefore, this first argument points to one of the alternative scenarios for the model parameterization: either l≈1 (in such a case the value of m is inconsequential) or m≈1 (with l still to be determined). It is also possible that a≈0 due to a low value of e and high values of l and m simultaneously, but microbial carbon use efficiency in incubation studies with high organic matter availability is likely in the range 0.1 to 0.3, at least in the early phase of decomposition (e.g., CUE values reported for one of the incubation studies; Craig et al., 2022). We thus discard this third possibility and focus on the alternatives l≈1 or m≈1.
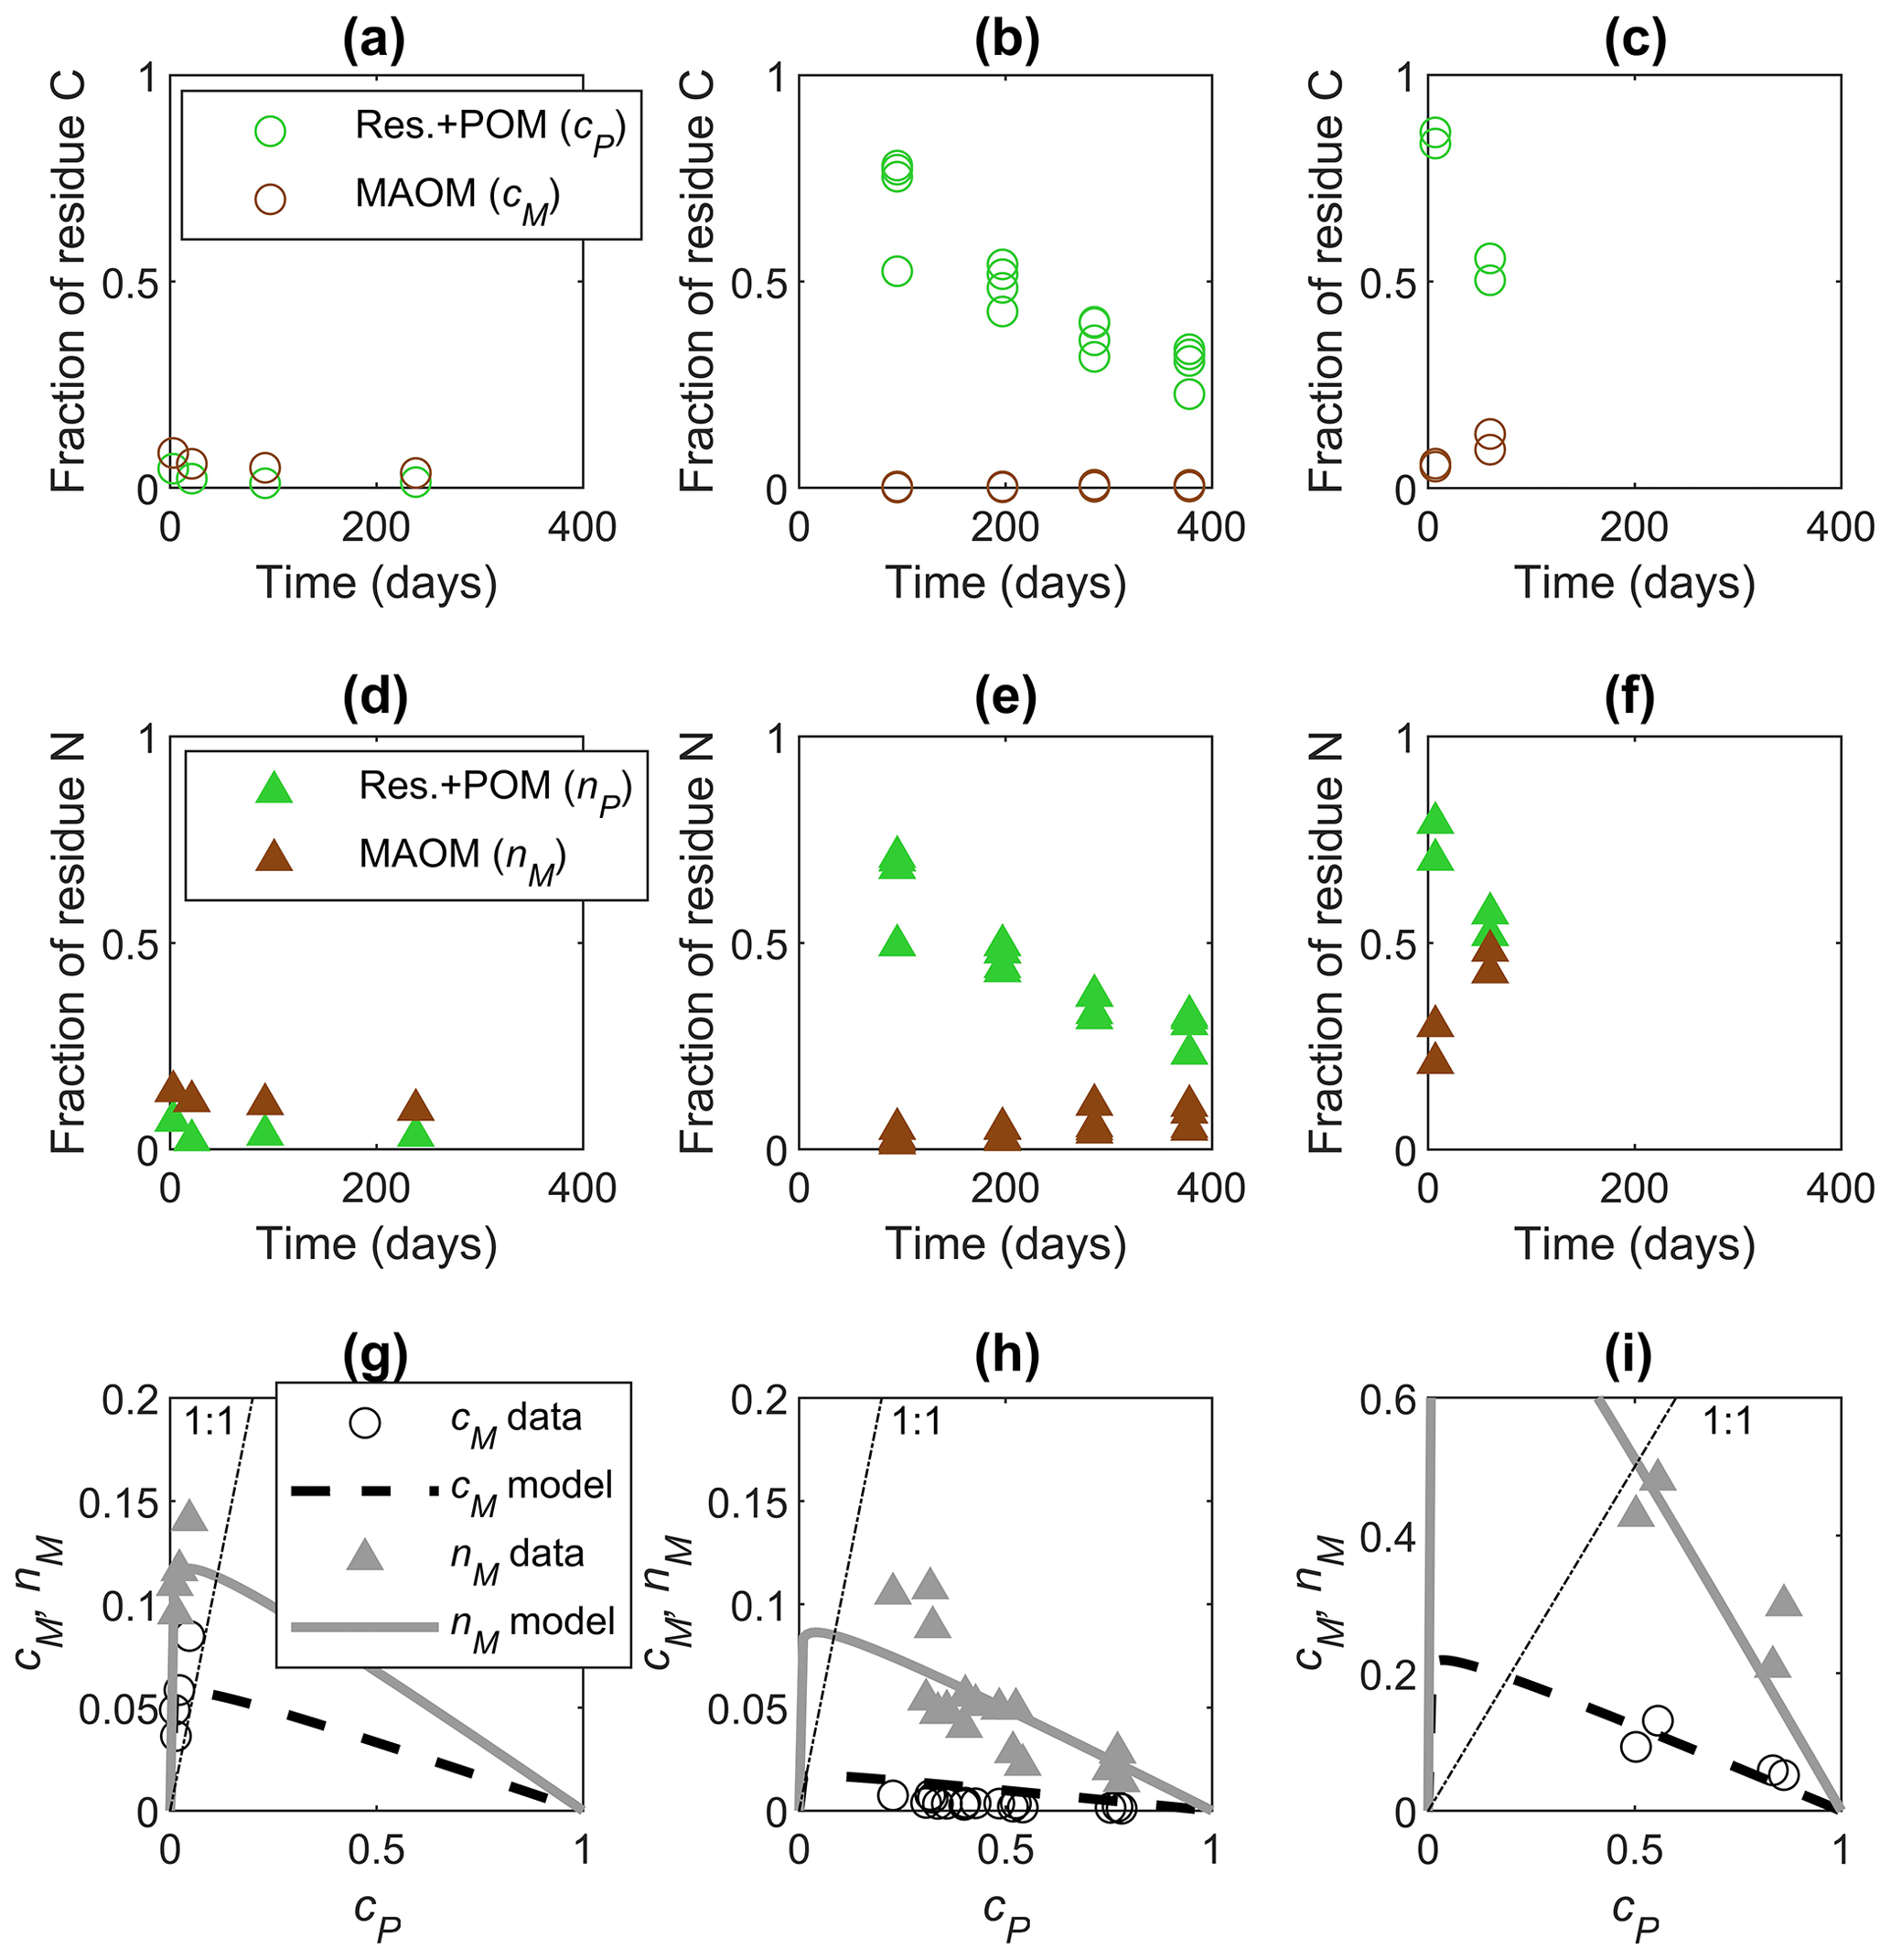
Figure 4Examples of data time series from incubations (a–f) and model fitting in the phase space (g–i) for residues with increasing residue C:N from the left to right column: (a–c) fractions of added C in residue + POM (cP, green circles) and MAOM (cM, brown circles) as a function of time, (d–f) fractions of added N in POM + residues (nP, green triangles) and MAOM (nM, brown triangles) as a function of time, and (g–i) cM (black circles) and nM (gray triangles) as a function of cP. In (g)–(i), we fitted parameters e and l in the functions cM(cP) and nM(cP) with m=1 and κ=0.05 (Table 2). Data are from (a, d, g) Buckeridge et al. (2022) (residues: Escherichia coli necromass, C:N = 3.4), (b, e, h) Mitchell et al. (2018) (residues: Chloris gayana, C:N = 14.2), and (c, f, i) Lavallee et al. (2018) (residues: Andropogon gerardii, silt soil, C:N = 28.2). In (g)–(i), residue decomposition progresses from right to left along the curves as cP decreases; the dot-dashed lines represent equality between the fractions of added C or N shown on the y axes and cP shown on the x axes.
The second line of evidence points to significant release of C through respiration as C is transferred from residue + POM to MAOM (Fig. 3B). It is likely that some of the depolymerization products are already metabolized by microbes in residue + POM (or even via extracellular oxidative metabolism; Maire et al., 2013) with the release of CO2. Mathematically, we can quantify the rate of change in cM as cP decreases in the early phase of decomposition – i.e., we can calculate from Eq. (11) for cP→1 and cM→0,
This derivative is always negative because decreasing cP causes an increase in cM, but the specific values depend on the parameter choice. In the ex vivo scenario, l≈1 and , indicating no C loss during the transfer from POM + residue to MAOM. This is a clearly unrealistic scenario because data suggest significant C loss. In fact, the measured cM values are lower than 1−cP (dashed line in Fig. 3b), indicating that not all C from residue + POM is transferred to MAOM.
In contrast, in the in vivo scenario, m≈1 and . The largest – but still reasonable – increase in MAOM as residue + POM is decomposed can be quantified from cM and cP data through the upper-quartile boundary line shown in red in Fig. 3a. The slope of this line is . This value corresponds to a reasonable e=0.37 if l=1 or to any combination of l and e satisfying . For l to be larger than zero, e<0.37. For e in the range 0.1 to 0.3, we find l between 0.1 and 0.3.
To summarize these initial results based on a simple mathematical analysis of the model combined with measured C and N contents in soil fractions, we can narrow down the range of plausible parameter values to m≈1 and l<0.3. In the following, we will set m=1, while conservatively leaving l free to vary. This allows us to determine the parameters regulating the stabilization pathway and thus the relative contribution of each pathway to C and N stabilization through least-squares fitting of individual data time series (Sect. 3.4).
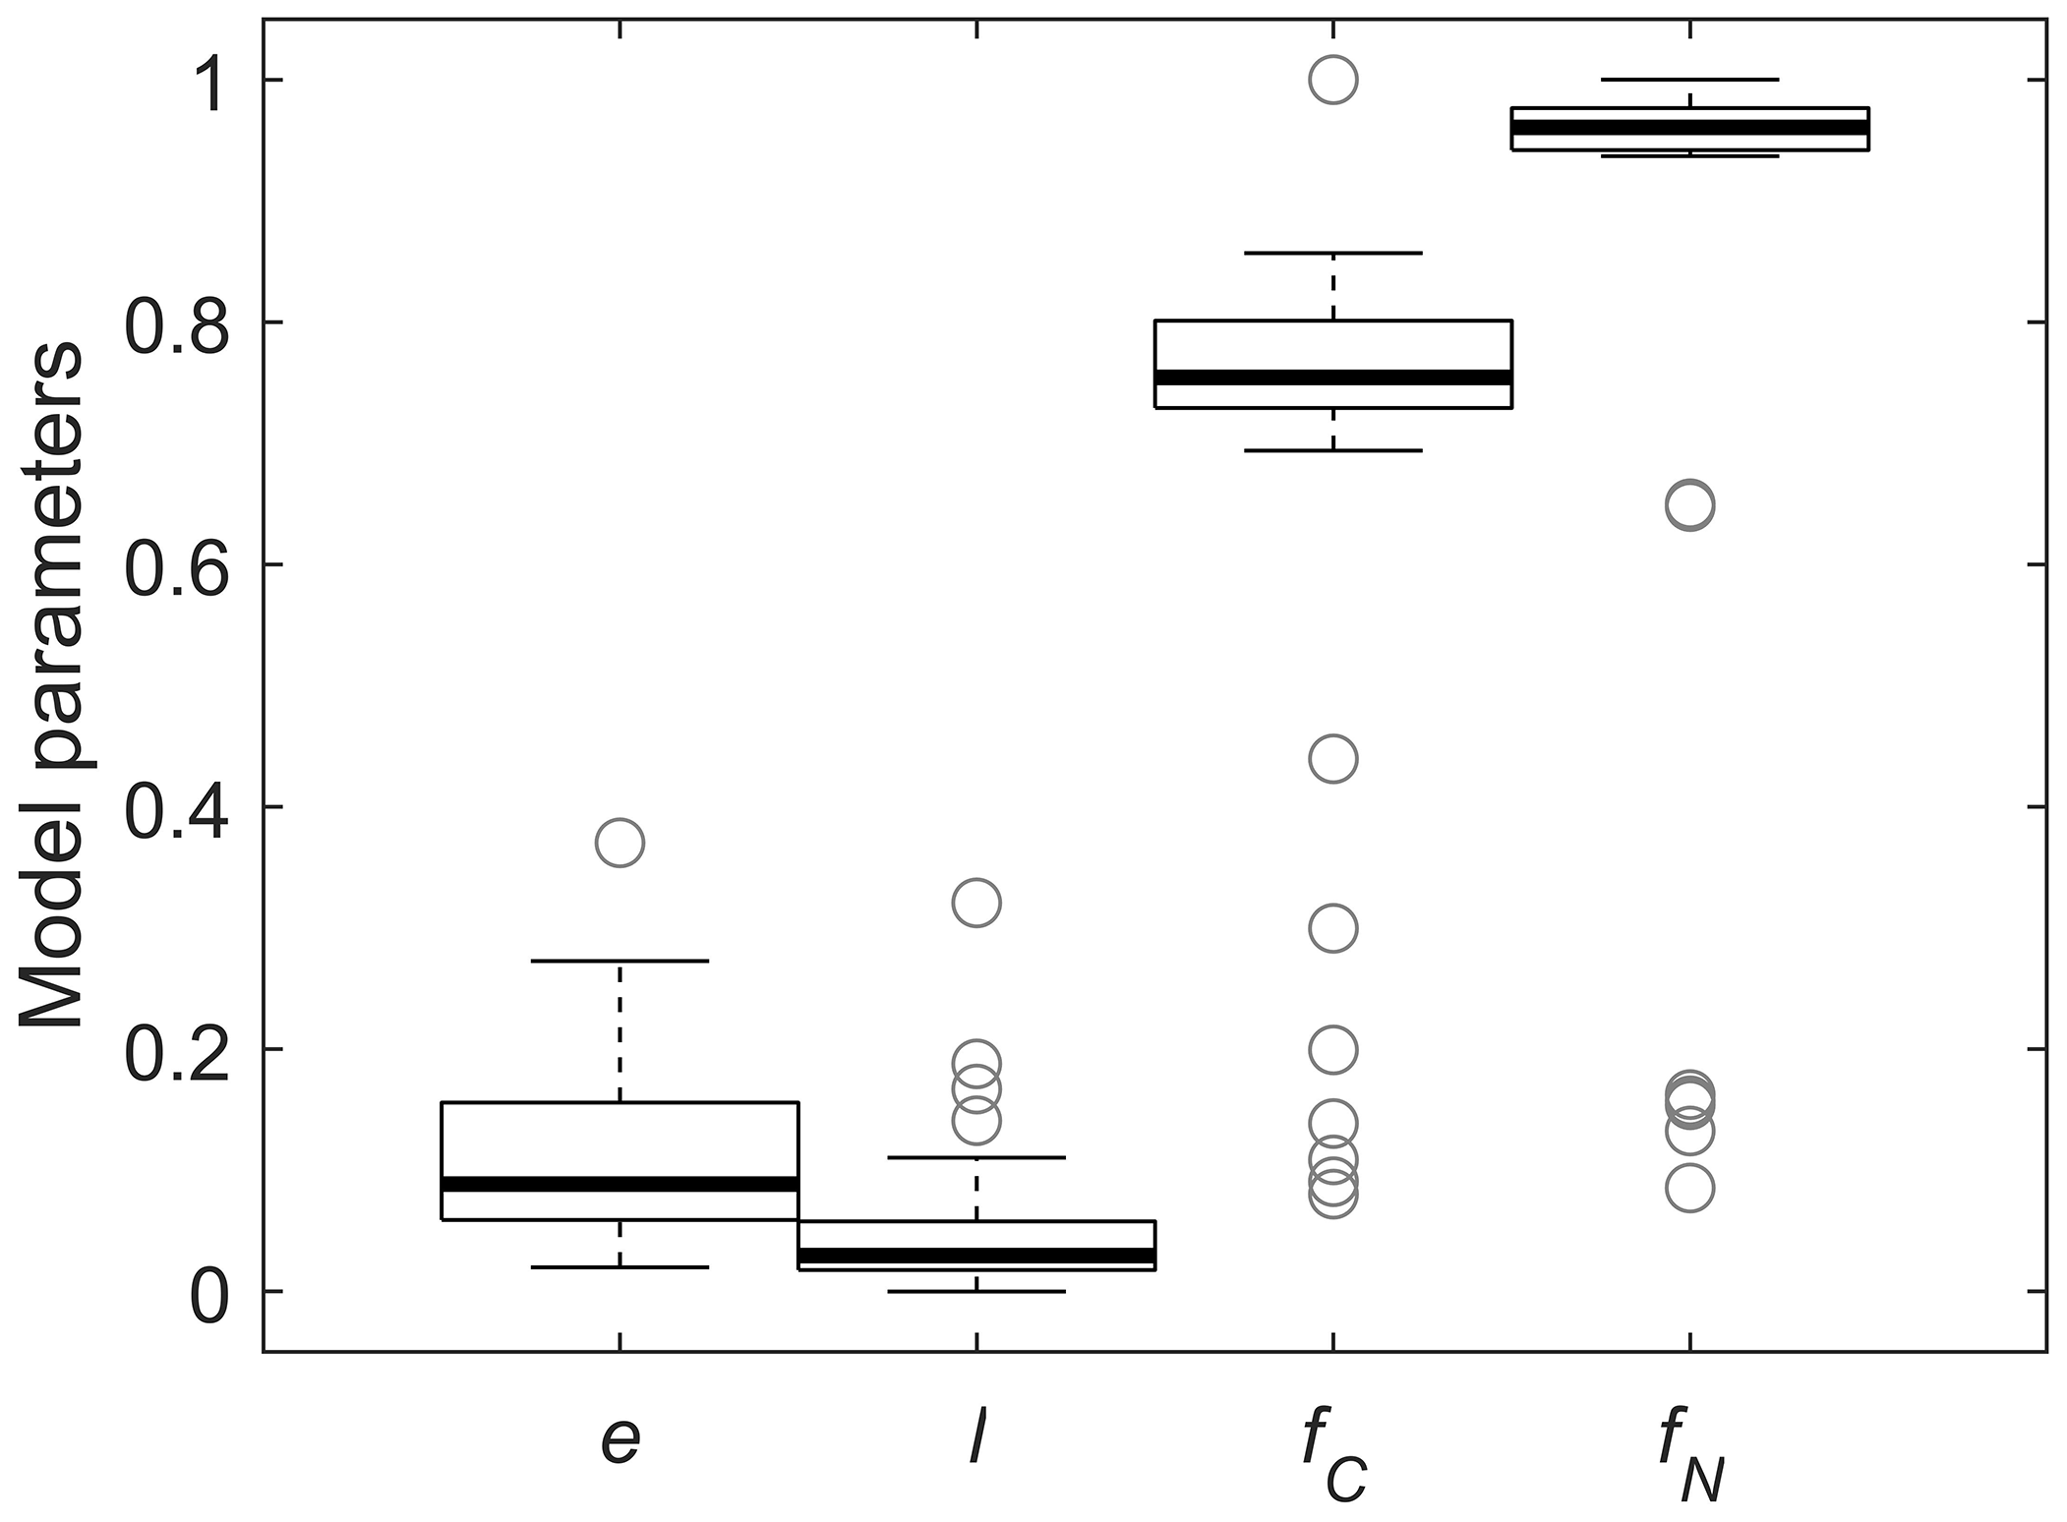
Figure 5Box plots of fitted model parameters and relative contributions of the in vivo pathways to MAOM C and N: microbial carbon use efficiency (e), fraction of depolymerized products transferred from POM + residue to MAOM (l), and fractions of C and N transferred from POM to MAOM via the in vivo pathway (fC and fN, respectively). Each box shows the median and quartiles, and whiskers represent extreme values (1.5 times the interquartile range).
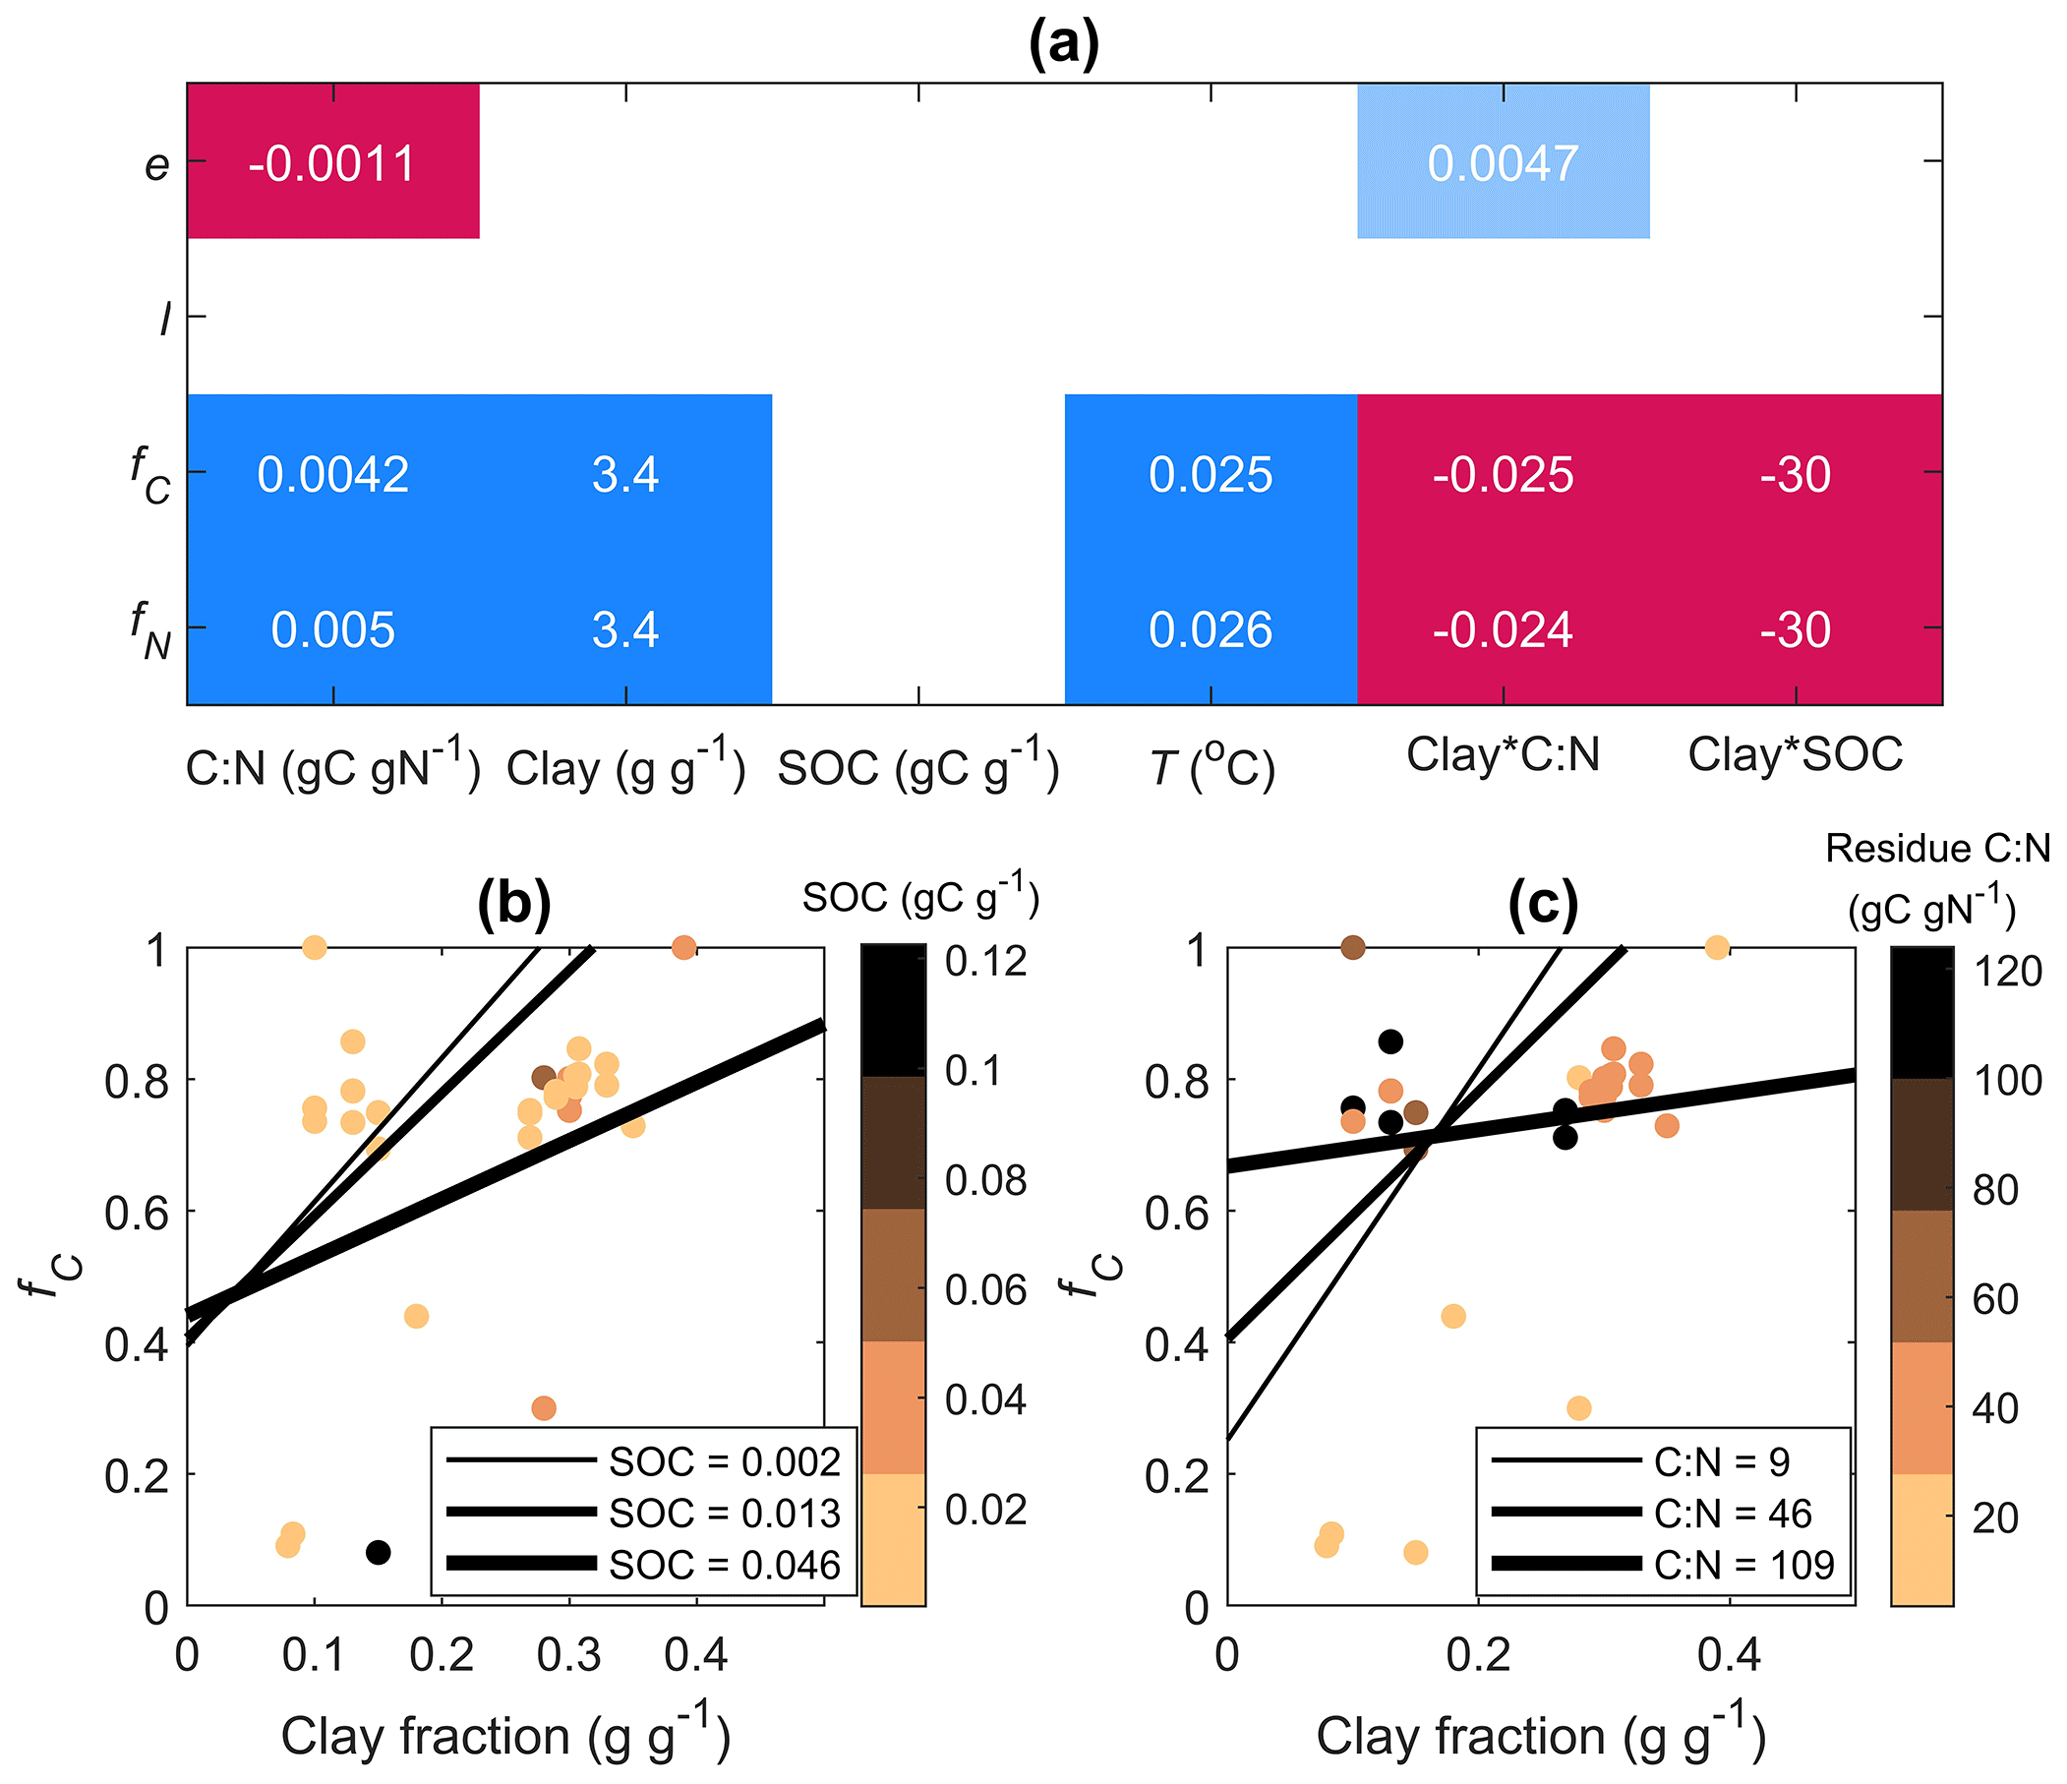
Figure 6Results of linear mixed-effect models predicting model parameters (e and l) and relative contributions of the in vivo pathway to MAOM C and N (fC and fN, respectively) as a function of the residue C:N ratio (C:N), soil clay fraction, soil organic carbon content (SOC), incubation temperature (T), and interactions of the clay fraction with C:N and SOC, with data source as a random factor. (a) Model coefficients: colors indicate the direction of the effect (red: negative, blue: positive) and shading intensity indicates the significance of the effect (blank: not significant, light colors: 0.05 < p < 0.1, dark colors: p< 0.05). Marginal coefficients of determination: 0.89, 0.96, 0.65, and 0.80 for e, l, fC, and fN, respectively. The bottom panels show model predictions of fC as a function of clay fraction when varying the (b) SOC content (gC g−1) and (c) residue C:N ratio (gC gN−1) as indicated by the thickness of the lines (values of SOC and C:N represent 10th, 50th, and 90th percentiles of the observations). Data points color-coded by SOC (b) and residue C:N (c) are also shown.
3.3 Examples of model calibration on individual time series
Parameters e and l were calibrated to datasets with at least three pairs of data points (Sect. 2.2.2). Examples of data time series and fitting of both cM(cP) and nM(cP) are shown in Fig. 4. In the first example (Fig. 4a, d, g), the residues (microbial necromass) were labile and N-rich, so they decomposed rapidly. As a result, sampling took place when most of the residues had already been decomposed (cP≈0) so that both C and N in MAOM decrease. In the second example, representing the addition of a residue with intermediate C:N (Fig. 4b, e, h), C accumulates very slowly in MAOM as C in residue + POM is decomposed, whereas N in MAOM increases through time and as cP decreases. In the third example (Fig. 4c, f, i), relatively N-poor residues exhibit strong N immobilization and accumulation of N in MAOM. In the last two examples, more N than C accumulates in MAOM at a given time or cP value (compare Fig. 4b and e or Fig. 4c and f), indicating preferential retention and stabilization of N when residues with high C:N are decomposed (as also shown in Fig. 2). These examples show that data can be representative of early (last two examples) and later phases (first example) in the same stabilization pattern, which are linked through a single curve in the phase space. Therefore, datasets might appear inconsistent across studies (cM and nM increasing vs. decreasing through time), but the underlying dynamic behavior is the same. Despite similar underlying dynamics, the fitted parameters are different across studies, reflecting contrasting residue type (plant vs. microbial necromass), soil characteristics, and experimental conditions, as shown in the next section.
3.4 Stabilization pathways – general patterns
We now focus on fitting of cM(cP), as there are too few datasets including N in MAOM to draw general conclusions. The values of e and l obtained from fitting cM(cP) were weakly correlated (Pearson correlation coefficient 0.27), indicating that despite constraining other parameters, mild equifinality issues remain with the two calibrated parameters. Values of e were below ≈ 0.2 (Fig. 5), with the lowest values from datasets with minimal accumulation of C in MAOM (Mitchell et al., 2018). Values of l were generally lower than 0.1, indicating that less than 10 % of depolymerized C is transferred to MAOM and confirming our expectations from the mathematical analysis (Sect. 3.2). Low values of l might be associated with large depolymerization rates (DP in Fig. 1) and low microbial CUE so that the actual rate of C transfer to MAOM via the ex vivo pathway could still be large (fC calculated from Eq. 32), but that was not the case. Indeed, the median relative contribution of the in vivo pathway to MAOM formation is ≈ 75 % (Fig. 5), but with a large variability. Notably, the contribution of the in vivo pathway is larger for N (fN calculated from Eq. 33), with a median value of 96 %.
Next, we tested how the estimated parameters e and l are affected by residue C:N ratio, soil properties (clay fraction, SOC content), and incubation conditions (temperature). When accounting for the combined effects of all variables and grouping data by source with a linear mixed-effect model, we found that e decreased with increasing residue C:N (Fig. 6). The in vivo contributions fC and fN increased in more clayey soils, but the effect of clay was less positive in C-rich soil and when adding N-poor residues (significant negative interactions of clay fraction with SOC and residue C:N; Fig. 6).
4.1 Model design and solution in phase space
We considered only two compartments in our model, in contrast to other more complex C and N cycling models also describing dissolved organic matter, microbial biomass (which is here assumed to be in quasi-equilibrium), occluded organic matter, and MAOM with different degrees of availability for decomposition (Abramoff et al., 2018; Guo et al., 2022; Zhang et al., 2021). However, models with more than two compartments might not fit POM and MAOM data better, while having worse equifinality issues (Guo et al., 2022). Therefore, our model design balances the need to both represent (at least in a simplified way) the previously hypothesized stabilization pathways and minimize the number of parameters to fit.
Different from previous models, here we study the dynamics of one state variable (C in MAOM, N in residue + POM, or N in MAOM) as a function of another variable (C in residue + POM). This approach allows focusing on relations among variables rather than the temporal progression of the decomposition and stabilization process. This is particularly useful when the temporal trajectories are very different among datasets (e.g., Fig. 4a–f), while in the phase space data start exhibiting more consistent (and simpler) trends (Fig. 4g–i). From a modeling perspective, using time series would require calibrating not only the parameters regulating the partitioning of C and N flows into different pathways, but also decay constants and those parameters that capture the effects of environmental conditions on the rate of decomposition – e.g., parameters in soil moisture or temperature rate modifiers (Bauer et al., 2008). Moreover, temporal dynamics depend on the chosen kinetics for decomposition, whereas our approach is largely independent of the kinetics (except for the assumption that the ratio of MAOM and residue + POM decomposition rates scales approximately as the ratio of C contents in those two compartments).
While not aiming to model C and N stabilization, previous work described N release from decomposing residues following this approach, leading – albeit through different derivations – to an equation linking residue N to residue C that is formally equivalent to Eq. (25) (the theory was developed by Bosatta and Ågren, 1985; Manzoni et al., 2008). That equation was then fitted to measured fractions of remaining C and N in litterbag incubations to estimate the CUE of residue decomposers (Bosatta and Ågren, 1985; Manzoni, 2017; Manzoni et al., 2008) or their threshold element ratio (i.e., the C:N ratio below which net N mineralization starts) (Ågren et al., 2013). In our application, we use the same equation to infer the constraint m=1, but we estimate the parameter e (representing CUE) with the analytical equation linking C in MAOM to C in residue + POM.
Moreover, our approach allows finding analytical solutions that provide mathematical insights into these processes. Besides the already mentioned application of the N vs. C relation to constrain parameter m, the analytical relation between MAOM C and residue + POM C (i.e., cM(cP)) allowed determining limit values for parameter l by studying the slope of the cM(cP) function at the beginning of decomposition. These insights would not be possible when numerically solving a more complex model.
4.2 Model limitations
Our model was designed to match the type of data available – residue, POM, and MAOM fractions measured at coarse temporal resolution from soils sampled from different ecosystems and land uses. We also aimed for full analytical tractability. These two requirements set constraints on the model complexity and the number of parameters that could be estimated from the data. These constraints in turn imply the following simplifications and approximations that might limit the model applicability.
-
Model structure: the model was initially constructed with five compartments (including POM and MAOM substrates and microbial biomass, as well as DOM), but assuming that microbial biomass and DOM are at quasi-equilibrium allows reducing the model to two compartments. This simplification has minor consequences for the POM and MAOM dynamics as long as both microbial biomass and DOM turn over faster than the POM and MAOM substrates. Microbial biomass has a turnover time of the order of a few months (Spohn et al., 2016) and DOM dynamics are even faster – shorter than the turnover of POM and MAOM. Therefore, our quasi-equilibrium assumption appears to be reasonable.
-
Organic matter chemical heterogeneity: residue + POM and MAOM contain compounds with contrasting chemical characteristics (depending on residue chemistry and on the pathway of stabilization into MAOM, respectively), but we neglected these chemical differences to keep the model simple and because of limited data to parameterize more than one compartment for residue + POM and one for MAOM. As a consequence, we also neglected the decreasing rates of decomposition through time as a result of accumulating recalcitrant compounds. However, we can expect that less decomposable compounds remain in both POM and MAOM (because of their different chemical recalcitrance or accessibility, respectively) so that the ratio of the decay constants for these compartments (i.e., parameter κ) should remain relatively stable, which is the only assumption we need to make in our derivation. Therefore, neglecting chemical heterogeneity may significantly affect the prediction of decomposition rates, but it is likely to be less important when modeling residue + POM and MAOM in phase space.
-
Microbial traits: microorganisms growing on POM are likely different from those feeding on organic matter desorbed from minerals. For example, we could expect a higher fungal to bacterial ratio in residue + POM, with higher microbial biomass C:N and possibly lower CUE (Soares and Rousk, 2019), but lack of specific information on microbial traits within the soil fractions does not allow us to parameterize these communities in the model (though soil-fraction-specific traits are retained in the general solutions of the mass balance equations).
4.3 Reconciling contrasting decomposition patterns in phase space
Our phase space representation of residue + POM and MAOM dynamics highlights a simple and consistent pattern – as residues are decomposed, the residue + POM compartment is depleted, while MAOM gains C and N (early phase of decomposition). However, residue-derived C and N in MAOM will also be decomposed eventually (late phase). These processes lead to a humped relation between the fractions of residue C or N recovered in MAOM and the C fraction recovered in POM (Fig. 3). The shape of this relation depends on microbial CUE and the partitioning of C and N between in vivo and ex vivo pathways (Fig. 2). Generally, higher CUE and ex vivo stabilization promote C and N accumulation in MAOM (steeper increase in MAOM as residue + POM is reduced). In both cases, this is due to lower C losses via respiration in the residue + POM compartment promoting C (and N) transfer to MAOM and retention in stabilized form in that compartment.
Because of the infrequent sampling in the incubation studies, the whole pattern of increasing and decreasing MAOM has not been observed so far. For example, C in MAOM increased through time in some studies (Cheng et al., 2023; Fulton-Smith and Cotrufo, 2019; Leichty et al., 2021; Neupane et al., 2023), but in others it decreased (Su et al., 2020; Throckmorton et al., 2015; Wang et al., 2017). N in MAOM tends to increase through time in most studies (Fulton-Smith and Cotrufo, 2019; Mitchell et al., 2018; Nunez et al., 2022), but it can also decrease (Kölbl et al., 2006). Through analytical equations, our model links these two regimes of early decomposition associated with transfer to MAOM and late decomposition associated with destabilization from MAOM. These equations allow us to compare datasets that might appear inconsistent at first sight.
The phase space representation also shows that the stoichiometry of residue + POM is conserved during residue decomposition and stabilization, regardless of the residue initial C:N ratio (Fig. 3a). This result might seem surprising, as N is preferentially retained during residue decomposition, often resulting in a temporary net N accumulation if residues are N-poor (Moore et al., 2006; Parton et al., 2007). This pattern can be explained by microbial N immobilization and recycling of N-rich microbial necromass within the residues, which gradually lowers the residue C:N to values close to those of microbial biomass (Manzoni et al., 2008). The observation that the residue + POM compartment retains the initial residue C:N ratio indicates that microbial necromass is not recycled within that compartment, but rather it is stabilized into the MAOM fraction through the in vivo pathway (parameter m=1). Therefore, the phase space of C and N in residue + POM both provides information about stabilization mechanisms and helps constrain model parameters.
4.4 What is the dominant pathway of C and N stabilization in MAOM?
Earlier studies identified the origin of MAOM using microbial biomarkers (e.g., amino sugars) that trace microbial necromass contributions to MAOM, molecular fingerprinting to partition MAOM into microbial- or plant-derived based on their specific molecular signatures, or isotopic and stoichiometric mixing models (Chang et al., 2024; Whalen et al., 2022). Leveraging the contrast in N contents of microbial biomass (N-rich) and plant residues (N-poor), Chang et al. (2024) estimated that between 34 % and 47 % of MAOM is of microbial origin. Estimates based on amino sugar analysis can be similar or lower (Whalen et al., 2022). Our estimates suggest that approximately 75 % of MAOM C and almost all MAOM N are formed thanks to the in vivo pathway. It is possible that the contribution of the in vivo pathway we estimated is higher because we did not consider the stabilization of residue + POM within very fine aggregates (Mueller et al., 2012), which would be separated as MAOM. Another explanation may be that we neglected the stabilization of dissolved C and N at the very beginning of decomposition. Our model can account for this process, but our data analysis to test its relevance was not conclusive (Supplement Sect. S3). A third plausible explanation is that the persistence of necromass and other sources of MAOM differ so that despite a larger contribution of the in vivo pathway (predicted by our model), compounds stabilized via the ex vivo pathway could persist longer in the MAOM compartment. This would result in lower percentages of microbe-derived MAOM as estimated by Chang et al. (2024). This explanation appears to be plausible in light of the relatively short turnover time of necromass in MAOM (< 1 year; Buckeridge et al., 2022) compared to the bulk MAOM. Therefore, we conclude that the stabilization of residue C and N in MAOM is dominated by the in vivo pathway, but we also acknowledge that other sources of C and N that would contribute ex vivo were not considered in the isotope tracing experiments or in our model.
4.5 What are the drivers of the stabilization pathway?
Our results show that a higher clay fraction is associated with more dominant in vivo stabilization of both C and N (fC and fN in Fig. 6). This is consistent with empirical evidence that the in vivo pathway is promoted in finer-textured soils (Chang et al., 2024) and thus supports the idea that in these soils, depolymerization products are used by microorganisms whose necromass is eventually stabilized. Finer-textured soils can promote microbial growth and necromass production by improving moisture retention besides offering more available minerals for stabilization of the microbial products (Mao et al., 2024). Similar to Chang et al. (2024), we found negative effects of SOC on both fC and fN, indicating that in organic-matter-rich soils the in vivo stabilization pathway is less important than in organic-matter-poor soils. The result that stabilization through the in vivo pathway is more important in clay-rich soil, but less so in C-rich soils, suggests that in vivo stabilization is particularly sensitive to saturation of mineral surfaces (Georgiou et al., 2022). This finding is consistent with N-rich organic matter – likely of microbial origin – directly bonding to minerals (Spohn, 2024) and thus being dependent on the availability of active mineral surfaces. In contrast, C-rich organic matter from the ex vivo pathway tends to indirectly bond to minerals through organic matter–organic matter interactions (Spohn, 2024) and is thus less constrained by saturation of the mineral surfaces (Begill et al., 2023).
According to the microbial efficiency–matrix stabilization (MEMS) hypothesis, labile and N-rich residues would be more likely to be stabilized via the in vivo pathway, thanks to more efficient conversion of residue-derived C and N into biomass (Cotrufo et al., 2013). The general trend of decreasing CUE as residue C:N increases (Manzoni et al., 2008, 2017) was confirmed here (Fig. 6a), and low-residue C:N indeed promoted stabilization via the in vivo pathway, but only in soils with more than about 15 % clay content (Fig. 6c).
The in vivo pathway was also promoted by warmer conditions, again consistent with the results by Chang et al. (2024).
We proposed a simple diagnostic model to interpret data on residue incorporation into POM and MAOM. The model is solved analytically in the phase space – i.e., by expressing one variable as a function of other variables instead of time. This approach moves away from the usual focus on kinetics and allows quantifying the partitioning of C and N between two main pathways of stabilization: in vivo stabilization of microbial necromass and ex vivo stabilization of depolymerization products. We found that the majority of C and N derived from added residues is stabilized through the in vivo pathway. This pathway is particularly dominant in clay-rich and C-poor soils, where stabilization is less limited by saturation of the mineral surfaces. Overall, these findings support the idea that a large fraction of MAOM is derived from microbial necromass, but also that the availability of mineral surfaces affects the relevance of this stabilization pathway.
General trends in MAOM accumulation can be assessed by calculating the change in C or N in MAOM per unit change in residue + POM (). Because the residue + POM compartment loses mass due to decomposition, its changes are always negative (ΔcP<0). As a consequence, negative relative changes in MAOM () indicate accumulation of mass in MAOM. Generally, in the early phase of decomposition when the fraction of remaining residue + POM is still high, both C and N accumulate in MAOM, but below a cP or nP threshold, both C and N are lost from MAOM (Fig. A1). The turning points when MAOM starts being depleted are at cP≈0.18 and nP≈0.42 (i.e., earlier than for C). We note that fewer data on N accumulation in MAOM do not allow constraining this threshold as accurately as for C accumulation.
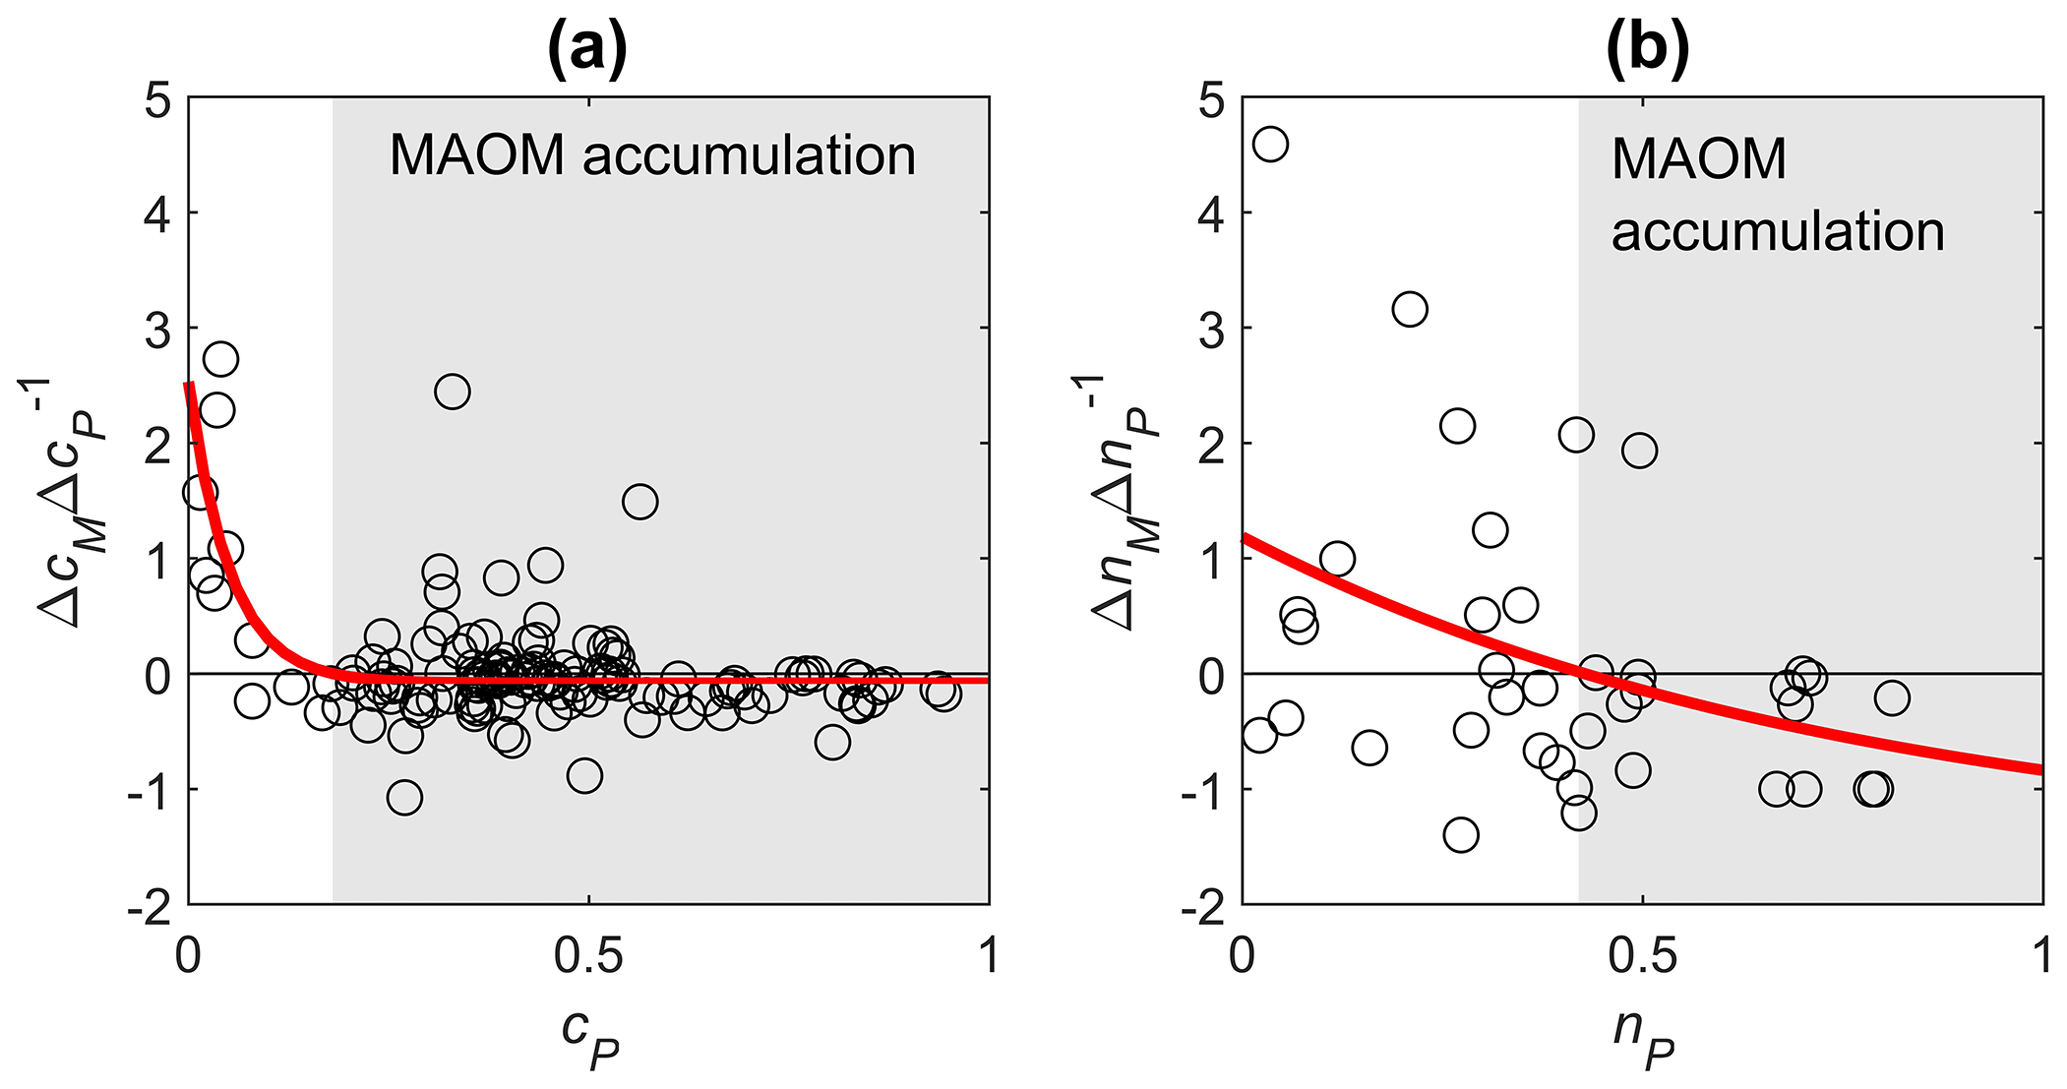
Figure A1Changes in C or N in MAOM per unit change in C or N in residue + POM as a function of remaining C or N in residue + POM (panel a for C and panel b for N). cP and cM (nP and nM) denote the fractions of remaining C (N) in residue + POM and MAOM. Time progresses from right to left as cP and nP decrease. Data points are from all datasets containing at least two subsequent measurements for the same treatment, site, and residue type. Solid curves are fitted exponential functions with an asymptote, used to define the threshold cP and nP at which MAOM accumulation (light gray) turns into depletion (we excluded from the regression outliers defined as values lower than the 3rd and higher than the 97th percentile).
Data on residue-derived carbon and nitrogen in the residue, dissolved, particulate, and mineral-associated organic matter compartments are deposited in the open-access Bolin Centre Database (Manzoni et al., 2024).
The supplement related to this article is available online at: https://doi.org/10.5194/bg-21-4077-2024-supplement.
SM collated and analyzed data, developed and implemented the model, and wrote the first draft. MFC contributed to data interpretation and model development, as well as commenting on and editing the manuscript.
The contact author has declared that none of the authors has any competing interests.
Publisher's note: Copernicus Publications remains neutral with regard to jurisdictional claims made in the text, published maps, institutional affiliations, or any other geographical representation in this paper. While Copernicus Publications makes every effort to include appropriate place names, the final responsibility lies with the authors.
We thank the following colleagues for providing raw or unpublished data and for help interpreting published data: Kate Buckeridge (Luxembourg Institute of Science and Technology), Yan Duan (Chinese Academy of Sciences, Nanjing), Gabriel Dias Ferreira (Colorado State University), Ed Gregorich (Carleton University), Michelle Haddix (Colorado State University), Jian Jin (La Trobe University), Xinchang Kou (Chinese Academy of Sciences, Shenyang), Joanna Ridgeway (West Virginia University, Morgantown), Alin Shen (Zhejiang Academy of Agricultural Sciences), and Xiaoke Zhang (Chinese Academy of Sciences, Shenyang). We also thank the three anonymous referees for their comments.
This project has received funding from the European Research Council (ERC) under the European Union's Horizon 2020 Research and Innovation Programme (grant agreement no. 101001608). This cooperation was facilitated by the August T. Larsson Foundation, which supported Francesca Cotrufo's guest professorship at the Swedish University of Agricultural Sciences (Uppsala, Sweden).
The publication of this article was funded by the Swedish Research Council, Forte, Formas, and Vinnova.
This paper was edited by Sara Vicca and reviewed by three anonymous referees.
Abramoff, R., Xu, X. F., Hartman, M., O'Brien, S., Feng, W. T., Davidson, E., Finzi, A. C., Moorhead, D., Schimel, J., Torn, M., and Mayes, M. A.: The Millennial model: in search of measurable pools and transformations for modeling soil carbon in the new century, Biogeochemistry, 137, 51–71, https://doi.org/10.1007/s10533-017-0409-7, 2018.
Ågren, G. I., Hyvonen, R., Berglund, S. L., and Hobbie, S. E.: Estimating the critical N:C from litter decomposition data and its relation to soil organic matter stoichiometry, Soil Biol. Biochem., 67, 312–318, https://doi.org/10.1016/j.soilbio.2013.09.010, 2013.
Almeida, L., Souza, I., Hurtarte, L., Teixeira, P., Inagaki, T., Silva, I., and Mueller, C.: Forest litter constraints on the pathways controlling soil organic matter formation, Soil Biol. Biochem., 163, 108447, https://doi.org/10.1016/j.soilbio.2021.108447, 2021.
Antonio Telles Rodrigues, L., Giacomini, S. J., Dieckow, J., Cherubin, M. R., Sangiovo Ottonelli, A., and Bayer, C.: Carbon saturation deficit and litter quality drive the stabilization of litter-derived C in mineral-associated organic matter in long-term no-till soil, Catena, 219, 106590, https://doi.org/10.1016/j.catena.2022.106590, 2022.
Argyris, J., Faust, G., and Haase, M.: An exploration of chaos, North Holland, 750 pp., ISBN-10: 0444820027, 1994.
Bauer, J., Herbst, M., Huisman, J. A., Weihermuller, L., and Vereecken, H.: Sensitivity of simulated soil heterotrophic respiration to temperature and moisture reduction functions, Geoderma, 145, 17–27, 2008.
Begill, N., Don, A., and Poeplau, C.: No detectable upper limit of mineral-associated organic carbon in temperate agricultural soils, Glob. Change Biol., 29, 4662–4669, https://doi.org/10.1111/gcb.16804, 2023.
Bosatta, E. and Ågren, G. I.: Theoretical-Analysis of Decomposition of Heterogeneous Substrates, Soil Biol. Biochem., 17, 601–610, 1985.
Bruni, E., Guenet, B., Clivot, H., Kätterer, T., Martin, M., Virto, I., and Chenu, C.: Defining Quantitative Targets for Topsoil Organic Carbon Stock Increase in European Croplands: Case Studies With Exogenous Organic Matter Inputs, Front. Environ. Sci., 10, 824724, https://doi.org/10.3389/fenvs.2022.824724, 2022.
Buckeridge, K., Mason, K., Ostle, N., McNamara, N., Grant, H., and Whitaker, J.: Microbial necromass carbon and nitrogen persistence are decoupled in agricultural grassland soils, Commun. Earth Environ., 3, 114, https://doi.org/10.1038/s43247-022-00439-0, 2022.
Buckeridge, K. M.: kmbuckeridge/UGrass_NecromassCNstabilization: Necromass CN stabilization (v1.0), Zenodo [data set], https://doi.org/10.5281/zenodo.5036539, 2021.
Canisares, L., Banet, T., Rinehart, B., McNear, D., and Poffenbarger, H.: Litter quality and living roots affected the formation of new mineral-associated organic carbon but did not affect total mineral-associated organic carbon in a short-term incubation, Geoderma, 430, 116302, https://doi.org/10.1016/j.geoderma.2022.116302, 2023.
Chang, Y., Sokol, N. W., van Groenigen, K. J., Bradford, M. A., Ji, D., Crowther, T. W., Liang, C., Luo, Y., Kuzyakov, Y., Wang, J., and Ding, F.: A stoichiometric approach to estimate sources of mineral-associated soil organic matter, Glob. Change Biol., 30, e17092, https://doi.org/10.1111/gcb.17092, 2024.
Cheng, X., Xing, W., and Liu, J.: Litter chemical traits, microbial and soil stoichiometry regulate organic carbon accrual of particulate and mineral-associated organic matter, Biol. Fert. Soils, 59, 777–790, https://doi.org/10.1007/s00374-023-01746-0, 2023.
Cotrufo, F., Haddix, M. L., Mullen, J. L., Zhang, Y., and McKay, J. K.: Deepening root inputs: A mod-ex study on soil carbon accrual potentials for maize, in review, 2024.
Cotrufo, M., Soong, J., Horton, A., Campbell, E., Haddix, M., Wall, D., and Parton, A.: Formation of soil organic matter via biochemical and physical pathways of litter mass loss, Nat. Geosci., 8, 776–779, https://doi.org/10.1038/NGEO2520, 2015.
Cotrufo, M., Ranalli, M., Haddix, M., Six, J., and Lugato, E.: Soil carbon storage informed by particulate and mineral-associated organic matter, Nat. Geosci., 12, 989–994, https://doi.org/10.1038/s41561-019-0484-6, 2019.
Cotrufo, M., Haddix, M., Kroeger, M., and Stewart, C.: The role of plant input physical-chemical properties, and microbial and soil chemical diversity on the formation of particulate and mineral-associated organic matter, Soil Biol. Biochem., 168, 108648, https://doi.org/10.1016/j.soilbio.2022.108648, 2022.
Cotrufo, M. F., Wallenstein, M. D., Boot, C. M., Denef, K., and Paul, E.: The Microbial Efficiency-Matrix Stabilization (MEMS) framework integrates plant litter decomposition with soil organic matter stabilization: do labile plant inputs form stable soil organic matter?, Glob. Change Biol., 19, 988–995, https://doi.org/10.1111/gcb.12113, 2013.
Craig, M., Geyer, K., Beidler, K., Brzostek, E., Frey, S., Grandy, A., Liang, C., and Phillips, R.: Fast-decaying plant litter enhances soil carbon in temperate forests but not through microbial physiological traits, Nat. Commun., 13, 1229, https://doi.org/10.1038/s41467-022-28715-9, 2022.
Craig, M. E., Brzostek, E. R., Geyer, K. M., Liang, C., and Phillips, R. P.: Data for “Fast-decaying plant litter enhances soil carbon in temperate forests, but not through microbial physiological traits”, ESS-DIVE [data set], https://doi.org/10.15485/1835182, 2021.
Dai, S., He, P., Guo, X., Ge, T., Oliver, M., and Li, L.: Faster carbon turnover in topsoil with straw addition is less beneficial to carbon sequestration than subsoil and mixed soil, Soil Sci. Soc. Am. J., 86, 1431–1443, https://doi.org/10.1002/saj2.20412, 2022.
Duan, Y., Chen, L., Li, Y., Li, J., Zhang, C., Ma, D., Zhou, G., and Zhang, J.: Nitrogen input level modulates straw-derived organic carbon physical fractions accumulation by stimulating specific fungal groups during decomposition, Soil Till. Res., 225, 105560, https://doi.org/10.1016/j.still.2022.105560, 2023.
Even, R. J. and Cotrufo, F.: The ability of soils to aggregate, more than the state of aggregation, promotes protected soil organic matter formation, Geoderma, 442, 116760, https://doi.org/10.1016/j.geoderma.2023.116760, 2024.
Fang, Y., Singh, B., Cowie, A., Wang, W., Arachchi, M., Wang, H., and Tavakkoli, E.: Balancing nutrient stoichiometry facilitates the fate of wheat residue-carbon in physically defined soil organic matter fractions, Geoderma, 354, 113883, https://doi.org/10.1016/j.geoderma.2019.113883, 2019.
Ferreira, G., Oliveira, F., Soares, E., Schnecker, J., Silva, I., and Grandy, A.: Retaining eucalyptus harvest residues promotes different pathways for particulate and mineral-associated organic matter, Ecosphere, 12, e03439, https://doi.org/10.1002/ecs2.3439, 2021.
Fulton-Smith, S. and Cotrufo, M.: Pathways of soil organic matter formation from above and belowground inputs in a Sorghum bicolor bioenergy crop, GCB Bioenergy, 11, 971–987, https://doi.org/10.1111/gcbb.12598, 2019.
Georgiou, K., Jackson, R. B., Vindušková, O., Abramoff, R. Z., Ahlström, A., Feng, W., Harden, J. W., Pellegrini, A. F. A., Polley, H. W., Soong, J. L., Riley, W. J., and Torn, M. S.: Global stocks and capacity of mineral-associated soil organic carbon, Nat. Commun., 13, 3797, https://doi.org/10.1038/s41467-022-31540-9, 2022.
Guo, X., Rossel, R., Wang, G., Xiao, L., Wang, M., Zhang, S., and Luo, Z.: Particulate and mineral-associated organic carbon turnover revealed by modelling their long-term dynamics, Soil Biol. Biochem., 173, 108780, https://doi.org/10.1016/j.soilbio.2022.108780, 2022.
Haddix, M., Gregorich, E., Helgason, B., Janzen, H., Ellert, B., and Cotrufo, M.: Climate, carbon content, and soil texture control the independent formation and persistence of particulate and mineral-associated organic matter in soil, Geoderma, 363, 114160, https://doi.org/10.1016/j.geoderma.2019.114160, 2020.
Haddix, M. L., Paul, E. A., and Cotrufo, M. F.: Dual, differential isotope labeling shows the preferential movement of labile plant constituents into mineral-bonded soil organic matter, Glob. Change Biol., 22, 2301–2312, https://doi.org/10.1111/gcb.13237, 2016.
Huys, R., Poirier, V., Bourget, M. Y., Roumet, C., Hattenschwiler, S., Fromin, N., Munson, A. D., and Freschet, G. T.: Plant litter chemistry controls coarse-textured soil carbon dynamics, J. Ecol., 110, 2911–2928, https://doi.org/10.1111/1365-2745.13997, 2022a.
Huys, R., Poirier, V., Bourget, M., Roumet, C., Hattenschwiler, S., Fromin, N., Munson, A., and Freschet, G.: Plant litter chemistry controls coarse-textured soil carbon dynamics, Dryad [data set], https://doi.org/10.5061/dryad.m63xsj45g, 2022b.
Karhu, K., Hilasvuori, E., Järvenpää, M., Arppe, L., Christensen, B., Fritze, H., Kulmala, L., Oinonen, M., Pitkänen, J., Vanhala, P., Heinonsalo, J., and Liski, J.: Similar temperature sensitivity of soil mineral-associated organic carbon regardless of age, Soil Biol. Biochem., 136, 107527, https://doi.org/10.1016/j.soilbio.2019.107527, 2019.
King, A. E., Amsili, J. P., Córdova, S. C., Culman, S., Fonte, S. J., Kotcon, J., Liebig, M., Masters, M. D., McVay, K., Olk, D. C., Schipanski, M., Schneider, S. K., Stewart, C. E., and Cotrufo, M. F.: A soil matrix capacity index to predict mineral-associated but not particulate organic carbon across a range of climate and soil pH, Biogeochemistry, 165, 1–14, https://doi.org/10.1007/s10533-023-01066-3, 2023.
Kögel-Knabner, I., Guggenberger, G., Kleber, M., Kandeler, E., Kalbitz, K., Scheu, S., Eusterhues, K., and Leinweber, P.: Organo-mineral associations in temperate soils: Integrating biology, mineralogy, and organic matter chemistry, J. Plant Nutr. Soil Sc., 171, 61–82, https://doi.org/10.1002/jpln.200700048, 2008.
Kölbl, A., von Lutzow, M., and Kögel-Knabner, I.: Decomposition and distribution of N-15 labelled mustard litter (Sinapis alba) in physical soil fractions of a cropland with high- and low-yield field areas, Soil Biol. Biochem., 38, 3292–3302, https://doi.org/10.1016/j.soilbio.2006.04.010, 2006.
Kölbl, A., von Lutzow, M., Rumpel, C., Munch, J., and Kögel-Knabner, I.: Dynamics of C-13-labeled mustard litter (Sinapis alba) in particle-size and aggregate fractions in an agricultural cropland with high- and low-yield areas, J. Plant Nutr. Soil Sc., 170, 123–133, https://doi.org/10.1002/jpln.200625071, 2007.
Kou, X., Morien, E., Tian, Y., Zhang, X., Lu, C., Xie, H., Liang, W., Li, Q., and Liang, C.: Data for: Exogenous carbon turnover within the soil food web strengthens soil carbon sequestration through microbial necromass accumulation, Dryad [data set], https://doi.org/10.5061/dryad.mgqnk9949, 2023a.
Kou, X., Morrien, E., Tian, Y., Zhang, X., Lu, C., Xie, H., Liang, W., Li, Q., and Liang, C.: Exogenous carbon turnover within the soil food web strengthens soil carbon sequestration through microbial necromass accumulation, Glob. Change Biol., 29, 4069–4080, https://doi.org/10.1111/gcb.16749, 2023b.
Lavallee, J., Conant, R., Paul, E., and Cotrufo, M.: Incorporation of shoot versus root-derived 13C and 15N into mineral-associated organic matter fractions: results of a soil slurry incubation with dual-labelled plant material, Biogeochemistry, 137, 379–393, https://doi.org/10.1007/s10533-018-0428-z, 2018.
Lehmann, J., Kaiser, C., Kleber, M., Maher, K., Manzoni, S., Nunan, N., Reichstein, M., Schimel, J. P., Torn, M., Wieder, W. R., and Kögel-Knabner, I.: Persistence of soil organic carbon caused by functional complexity, Nat. Geosci., 13, 529–534, 2020.
Leichty, S., Cotrufo, M., and Stewart, C.: Less efficient residue-derived soil organic carbon formation under no-till irrigated corn, Soil Sci. Soc. Am. J., 84, 1928–1942, https://doi.org/10.1002/saj2.20136, 2021.
Leuthold, S. J., Haddix, M. L., Lavallee, J., and Cotrufo, M. F.: Physical fractionation techniques, in: Encyclopedia of Soils in the Environment, 2nd Edn., edited by: Goss, M. J. and Oliver, M., Academic Press, Oxford, 68–80, https://doi.org/10.1016/B978-0-12-822974-3.00067-7, 2023.
Lian, T., Wang, G., Yu, Z., Li, Y., Liu, X., and Jin, J.: Carbon input from C-13-labelled soybean residues in particulate organic carbon fractions in a Mollisol, Biol. Fert. Soils, 52, 331–339, https://doi.org/10.1007/s00374-015-1080-6, 2016.
Liang, C., Schimel, J. P., and Jastrow, J. D.: The importance of anabolism in microbial control over soil carbon storage, Nat. Microbiol., 2, 17105, https://doi.org/10.1038/nmicrobiol.2017.105, 2017.
Liang, Z., Rasmussen, J., Poeplau, C., and Elsgaard, L.: Priming effects decrease with the quantity of cover crop residues-Potential implications for soil carbon sequestration, Soil Biol. Biochem., 184, 109110, https://doi.org/10.1016/j.soilbio.2023.109110, 2023.
Liebmann, P., Wordell-Dietrich, P., Kalbitz, K., Mikutta, R., Kalks, F., Don, A., Woche, S., Dsilva, L., and Guggenberger, G.: Relevance of aboveground litter for soil organic matter formation – a soil profile perspective, Biogeosciences, 17, 3099–3113, https://doi.org/10.5194/bg-17-3099-2020, 2020.
Lyu, M., Homyak, P., Xie, J., Penuelas, J., Ryan, M., Xiong, X., Sardans, J., Lin, W., Wang, M., Chen, G., and Yang, Y.: Litter quality controls tradeoffs in soil carbon decomposition and replenishment in a subtropical forest, J. Ecol., 111, 2181–2193, https://doi.org/10.1111/1365-2745.14167, 2023.
Magid, J., Cadisch, G., and Giller, K.: Short and medium term plant litter decomposition in a tropical Ultisol elucidated by physical fractionation in a dual 13C and 14C isotope study, Soil Biol. Biochem., 34, 1273–1281, https://doi.org/10.1016/S0038-0717(02)00069-X, 2002.
Maire, V., Alvarez, G., Colombet, J., Comby, A., Despinasse, R., Dubreucq, E., Joly, M., Lehours, A.-C., Perrier, V., Shahzad, T., and Fontaine, S.: An unknown oxidative metabolism substantially contributes to soil CO2 emissions, Biogeosciences, 10, 1155–1167, https://doi.org/10.5194/bg-10-1155-2013, 2013.
Manzoni, S.: Flexible Carbon-Use Efficiency across Litter Types and during Decomposition Partly Compensates Nutrient Imbalances – Results from Analytical Stoichiometric Models, Front. Microbiol., 8, 661, https://doi.org/10.3389/fmicb.2017.00661, 2017.
Manzoni, S. and Porporato, A.: Soil carbon and nitrogen mineralization: Theory and models across scales, Soil Biol. Biochem., 41, 1355–1379, 2009.
Manzoni, S., Jackson, R. B., Trofymow, J. A., and Porporato, A.: The global stoichiometry of litter nitrogen mineralization, Science, 321, 684–686, 2008.
Manzoni, S., Čapek, P., Mooshammer, M., Lindahl, B. D., Richter, A., and Šantrůčková, H.: Optimal metabolic regulation along resource stoichiometry gradients, Ecol. Lett., 20, 1182–1191, https://doi.org/10.1111/ele.12815, 2017.
Manzoni, S., Capek, P., Porada, P., Thurner, M., Winterdahl, M., Beer, C., Bruchert, V., Frouz, J., Herrmann, A. M., Lindahl, B. D., Lyon, S. W., Santruckova, H., Vico, G., and Way, D.: Reviews and syntheses: Carbon use efficiency from organisms to ecosystems – definitions, theories, and empirical evidence, Biogeosciences, 15, 5929–5949, https://doi.org/10.5194/bg-15-5929-2018, 2018.
Manzoni, S., Jin, J., Kou, X., Ridgeway, J., Zhang, X., and Cotrufo, F.: Particulate and mineral associated organic matter from 13C and 15N residue labelling studies from 2002 to 2024, Bolin Centre Database [data set], https://doi.org/10.17043/manzoni-2024-residue-stabilization-1, 2024.
Mao, H.-R., Cotrufo, M. F., Hart, S. C., Sullivan, B. W., Zhu, X., Zhang, J., Liang, C., and Zhu, M.: Dual role of silt and clay in the formation and accrual of stabilized soil organic carbon, Soil Biol. Biochem., 192, 109390, https://doi.org/10.1016/j.soilbio.2024.109390, 2024.
MathWorks: Matlab R2018b (9.5.0.944444), 2018.
Mitchell, E., Scheer, C., Rowlings, D., Conant, R., Cotrufo, M., and Grace, P.: Amount and incorporation of plant residue inputs modify residue stabilisation dynamics in soil organic matter fractions, Agr. Ecosyst. Environ., 256, 82–91, https://doi.org/10.1016/j.agee.2017.12.006, 2018.
Moore, T. R., Trofymow, J. A., Prescott, C. E., Fyles, J., and Titus, B. D.: Patterns of carbon, nitrogen and phosphorus dynamics in decomposing foliar litter in Canadian forests, Ecosystems, 9, 46–62, 2006.
Mueller, C. W., Kölbl, A., Hoeschen, C., Hillion, F., Heister, K., Herrmann, A. M., and Kögel-Knabner, I.: Submicron scale imaging of soil organic matter dynamics using NanoSIMS – From single particles to intact aggregates, Org. Geochem., 42, 1476–1488, https://doi.org/10.1016/j.orggeochem.2011.06.003, 2012.
Neupane, A., Herndon, E., Whitman, T., Faiia, A., and Jagadamma, S.: Manganese effects on plant residue decomposition and carbon distribution in soil fractions depend on soil nitrogen availability, Soil Biol. Biochem., 178, 108964, https://doi.org/10.1016/j.soilbio.2023.108964, 2023.
Nunez, A., Cotrufo, F., and Schipanski, M.: Irrigation effects on the formation of soil organic matter from aboveground plant litter inputs in semiarid agricultural systems, Geoderma, 416, 115804, https://doi.org/10.1016/j.geoderma.2022.115804, 2022.
Nyamasoka-Magonziwa, B., Vanek, S., Ojiem, J., and Fonte, S.: Examining the contributions of maize shoots, roots, and manure to stable soil organic carbon pools in tropical smallholder farming soils, Geoderma, 425, 116049, https://doi.org/10.1016/j.geoderma.2022.116049, 2022.
Oliveira, F., Ferreira, G., Dungait, J., Araujo, E., Soares, E., and Silva, I.: Eucalypt harvest residue management influences microbial community structure and soil organic matter fractions in an afforested grassland, Soil Till. Res., 205, 104787, https://doi.org/10.1016/j.still.2020.104787, 2021.
Parton, W., Silver, W. L., Burke, I. C., Grassens, L., Harmon, M. E., Currie, W. S., King, J. Y., Adair, E. C., Brandt, L. A., Hart, S. C., and Fasth, B.: Global-scale similarities in nitrogen release patterns during long-term decomposition, Science, 315, 361–364, 2007.
Paustian, K., Lehmann, J., Ogle, S., Reay, D., Robertson, G. P., and Smith, P.: Climate-smart soils, Nature, 532, 49–57, https://doi.org/10.1038/nature17174, 2016.
Poeplau, C., Begill, N., Liang, Z., and Schiedung, M.: Root litter quality drives the dynamic of native mineral-associated organic carbon in a temperate agricultural soil, Plant Soil, 491, 439–456, https://doi.org/10.1007/s11104-023-06127-y, 2023.
Pries, C., Bird, J., Castanha, C., Hatton, P., and Torn, M.: Long term decomposition: the influence of litter type and soil horizon on retention of plant carbon and nitrogen in soils, Biogeochemistry, 134, 5–16, https://doi.org/10.1007/s10533-017-0345-6, 2017.
Pries, C., Sulman, B., West, C., O'Neill, C., Poppleton, E., Porras, R., Castanha, C., Zhu, B., Wiedemeier, D., and Torn, M.: Root litter decomposition slows with soil depth, Soil Biol. Biochem., 125, 103–114, https://doi.org/10.1016/j.soilbio.2018.07.002, 2018.
Ridgeway, J., Morrissey, E., and Brzostek, E.: Plant litter traits control microbial decomposition and drive soil carbon stabilization, Soil Biol. Biochem., 175, 108857, https://doi.org/10.1016/j.soilbio.2022.108857, 2022.
Ridgeway, J., Kane, J., Starcher, H., Morrissey, E., and Brzostek, E.: BrzostekEcologyLab/InSitu_Incubation: Ridgeway et al., 2023 Data, Zenodo [data set], https://doi.org/10.5281/zenodo.8408435, 2023a.
Ridgeway, J., Kane, J., Morrissey, E., Starcher, H., and Brzostek, E.: Roots selectively decompose litter to mine nitrogen and build new soil carbon, Ecol. Lett., 27, e14331, https://doi.org/10.1111/ele.14331, 2023b.
Rocci, K., Barker, K., Seabloom, E., Borer, E., Hobbie, S., Bakker, J., MacDougall, A., McCulley, R., Moore, J., Raynaud, X., Stevens, C., and Cotrufo, M.: Impacts of nutrient addition on soil carbon and nitrogen stoichiometry and stability in globally-distributed grasslands, Biogeochemistry, 159, 353–370, https://doi.org/10.1007/s10533-022-00932-w, 2022.
Schiedung, M., Bellè, S., Hoeschen, C., Schweizer, S., and Abiven, S.: Enhanced loss but limited mobility of pyrogenic and organic matter in continuous permafrost-affected forest soils, Soil Biol. Biochem., 178, 108959, https://doi.org/10.1016/j.soilbio.2023.108959, 2023.
Soares, M. and Rousk, J.: Microbial growth and carbon use efficiency in soil: Links to fungal-bacterial dominance, SOC-quality and stoichiometry, Soil Biol. Biochem., 131, 195–205, https://doi.org/10.1016/j.soilbio.2019.01.010, 2019.
Sokol, N., Kuebbing, S., Karlsen-Ayala, E., and Bradford, M.: Evidence for the primacy of living root inputs, not root or shoot litter, in forming soil organic carbon, New Phytol., 221, 233–246, https://doi.org/10.1111/nph.15361, 2019.
Spohn, M.: Preferential adsorption of nitrogen- and phosphorus-containing organic compounds to minerals in soils: A review, Soil Biol. Biochem., 194, 109428, https://doi.org/10.1016/j.soilbio.2024.109428, 2024.
Spohn, M., Klaus, K., Wanek, W., and Richter, A.: Microbial carbon use efficiency and biomass turnover times depending on soil depth – Implications for carbon cycling, Soil Biol. Biochem., 96, 74–81, https://doi.org/10.1016/j.soilbio.2016.01.016, 2016.
Su, Y., He, Z., Yang, Y., Jia, S., Yu, M., Chen, X., and Shen, A.: Linking soil microbial community dynamics to straw-carbon distribution in soil organic carbon, Sci. Rep., 10, https://doi.org/10.1038/s41598-020-62198-2, 2020.
Tao, F., Huang, Y., Hungate, B. A., Manzoni, S., Frey, S. D., Schmidt, M. W. I., Reichstein, M., Carvalhais, N., Ciais, P., Jiang, L., Lehmann, J., Wang, Y.-P., Houlton, B. Z., Ahrens, B., Mishra, U., Hugelius, G., Hocking, T. D., Lu, X., Shi, Z., Viatkin, K., Vargas, R., Yigini, Y., Omuto, C., Malik, A. A., Peralta, G., Cuevas-Corona, R., Di Paolo, L. E., Luotto, I., Liao, C., Liang, Y.-S., Saynes, V. S., Huang, X., and Luo, Y.: Microbial carbon use efficiency promotes global soil carbon storage, Nature, 618, 981–985, https://doi.org/10.1038/s41586-023-06042-3, 2023.
Throckmorton, H., Bird, J., Monte, N., Doane, T., Firestone, M., and Horwath, W.: The soil matrix increases microbial C stabilization in temperate and tropical forest soils, Biogeochemistry, 122, 35–45, https://doi.org/10.1007/s10533-014-0027-6, 2015.
Wang, C., Qu, L., Yang, L., Liu, D., Morrissey, E., Miao, R., Liu, Z., Wang, Q., Fang, Y., and Bai, E.: Large-scale importance of microbial carbon use efficiency and necromass to soil organic carbon, Glob. Change Biol., 27, 2039–2048, https://doi.org/10.1111/gcb.15550, 2021.
Wang, Y., Yu, Z., Li, Y., Wang, G., Liu, J., Liu, J., Liu, X., and Jin, J.: Microbial association with the dynamics of particulate organic carbon in response to the amendment of elevated CO2-derived wheat residue into a Mollisol, Sci. Total Environ., 607, 972–981, https://doi.org/10.1016/j.scitotenv.2017.07.087, 2017.
Whalen, E., Grandy, A., Sokol, N., Keiluweit, M., Ernakovich, J., Smith, R., and Frey, S.: Clarifying the evidence for microbial- and plant-derived soil organic matter, and the path toward a more quantitative understanding, Glob. Change Biol., 28, 7167–7185, https://doi.org/10.1111/gcb.16413, 2022.
Witzgall, K., Vidal, A., Schubert, D., Höschen, C., Schweizer, S., Buegger, F., Pouteau, V., Chenu, C., and Mueller, C.: Particulate organic matter as a functional soil component for persistent soil organic carbon, Nat. Commun., 12, 4115, https://doi.org/10.1038/s41467-021-24192-8, 2021.
Xu, X., Thornton, P. E., and Post, W. M.: A global analysis of soil microbial biomass carbon, nitrogen and phosphorus in terrestrial ecosystems, Global Ecol. Biogeogr., 22, 737–749, https://doi.org/10.1111/geb.12029, 2013.
Xu, Y., Liu, K., Yao, S., Zhang, Y., Zhang, X., He, H., Feng, W., Ndzana, G., Chenu, C., Olk, D., Mao, J., and Zhang, B.: Formation efficiency of soil organic matter from plant litter is governed by clay mineral type more than plant litter quality, Geoderma, 412, 115727, https://doi.org/10.1016/j.geoderma.2022.115727, 2022.
Zhang, Y., Lavallee, J., Robertson, A., Even, R., Ogle, S., Paustian, K., and Cotrufo, M.: Simulating measurable ecosystem carbon and nitrogen dynamics with the mechanistically defined MEMS 2.0 model, Biogeosciences, 18, 3147–3171, https://doi.org/10.5194/bg-18-3147-2021, 2021.
Zhou, G., Xu, S., Ciais, P., Manzoni, S., Fang, J., Yu, G., Tang, X., Zhou, P., Wang, W., Yan, J., Wang, G., Ma, K., Li, S., Du, S., Han, S., Ma, Y., Zhang, D., Liu, J., Liu, S., Chu, G., Zhang, Q., Li, Y., Huang, W., Ren, H., Lu, X., and Chen, X.: Climate and litter C/N ratio constrain soil organic carbon accumulation, Natl. Sci. Rev., 6, 746–757, https://doi.org/10.1093/nsr/nwz045, 2019.