the Creative Commons Attribution 4.0 License.
the Creative Commons Attribution 4.0 License.
 | 26 Sep 2024
Future projections of Siberian wildfire and aerosol emissions
Reza Kusuma Nurrohman
Hideki Ninomiya
Lea Végh
Nicolas Delbart
Tatsuya Miyauchi
Hisashi Sato
Tomohiro Shiraishi
Ryuichi Hirata
Wildfires are among the most influential disturbances affecting ecosystem structure and biogeochemical cycles in Siberia. Therefore, accurate fire modeling via dynamic global vegetation models is important for predicting greenhouse gas emissions and other biomass-burning emissions to understand changes in biogeochemical cycles. We integrated the widely used SPread and InTensity of FIRE (SPITFIRE) fire module into the spatially explicit individual-based dynamic global vegetation model (SEIB-DGVM) to improve the accuracy of fire predictions and then simulated future fire regimes to better understand their impacts. The model can reproduce the spatiotemporal variation in biomass, fire intensity, and fire-related emissions well compared to the recent satellite-based estimations: aboveground biomass (R2=0.847, RMSE =18.3 Mg ha−1), burned fraction (R2=0.75, RMSE=0.01), burned area (R2=0.609, RMSE =690 ha), dry-matter emissions (R2=0.624, RMSE =0.01 kg DM m−2; dry matter), and CO2 emissions (R2=0.705, RMSE =6.79 Tg). We then predicted that all of the 33 fire-related gas and aerosol emissions would increase in the future due to the enhanced amount of litter as fuel load from increasing forest biomass production under climate forcing of four Representative Concentration Pathways: RCP8.5, RCP6.0, RCP4.5, and RCP2.6. The simulation under RCP8.5 showed that the CO2, CO, PM2.5, total particulate matter (TPM), and total particulate carbon (TPC) emissions in Siberia in the present period (2000–2020) will increase relatively by 189.66±6.55, 15.18±0.52, 2.47±0.09, 1.87±0.06, and 1.30±0.04 Tg species yr−1, respectively, in the future period (2081–2100) and the number of burned trees will increase by 100 %, resulting in a 385.19±40.4 g C m−2 yr−1 loss of net primary production (NPP). Another key finding is that the higher litter moisture by higher precipitation would relatively suppress the increment of fire-related emissions; thus the simulation under RCP8.5 showed the lowest emissions among RCPs. Our study offers insights into future fire regimes and development strategies for enhancing regional resilience and for mitigating the broader environmental consequences of fire activity in Siberia.
- Article
(7018 KB) - Full-text XML
-
Supplement
(11553 KB) - BibTeX
- EndNote


Fires are among the most significant disturbances affecting biogeochemical cycles, atmospheric chemistry, the carbon cycle, and ecosystem structure and function worldwide (Pickett et al., 1999). Wildfires are also the dominant climate-driven disturbance agent in boreal forests (Goldammer and Furyaev, 1996; Shorohova et al., 2011; De Groot et al., 2013), shaping major forest cover in Russia (Krylov et al., 2014) and rapidly increasing the burned area and emission intensity in Canada and Alaska (Zheng et al., 2021). Fires influence vegetation dynamics by allowing plants to adapt to fire regimes, influencing vegetation productivity, litter, and fuel load (Cochrane, 2003; Bergeron et al., 2004; Whelan, 2009). The intensity and frequency of large-scale boreal forest fires are expected to increase in the future due to increased global temperatures, drier conditions, and longer fire seasons, which will cause more emissions from biomass burning (Flannigan et al., 2009; Gauthier et al., 2015) and human activity using fire for land management (e.g., use of fire as a tool in the deforestation process) (Hantson et al., 2016; Archibald et al., 2013; Morton et al., 2008). Globally, from 2000 to 2019, satellites detected a decrease in the burned area of grassland, while there was a slight increase in the area of forest fires in Russia (Zheng et al., 2021). Central and southern European countries, such as France, Spain, Portugal, and Greece, are already experiencing larger and more devastating fires (Carnicer et al., 2022). Not only large fires but also small fires have a significant impact: areas burned by small fires contributed 35 % to the total burned area, from 345 to 464 Mha yr−1, and related carbon emissions increased from 1.9 to 2.5 Pg C yr−1 from 2001–2010 (Randerson et al., 2012). This finding is in line with current studies reporting that the global mean CO2 emission intensity has increased by 0.9±0.9 % yr−1 from 2000 to 2019 (Zheng et al., 2021) and that the fire weather index (FWI) reached levels above 30, corresponding to high, very high, and extreme levels of fire frequency, causing CO2 emissions to increase in Europe since 1980 (Carnicer et al., 2022).
Forest fires are important ecological factors that influence both the establishment and succession of vegetation (Abaimov and Sofronov, 1996). Climate-driven large fires are responsible for rapid changes in vegetation (Cleve and Viereck, 1981), soil properties (Pastor and Post, 1986; Pellegrini et al., 2021), biogeochemical cycling, microclimate, forest ecosystems (Crutzen and Goldammer, 1993), productivity, stability, and many other ecological properties (Melillo et al., 1993). Forest fires also indirectly affect vegetation dynamics by increasing CO2 levels in the atmosphere (Seiler and Crutzen, 1980; Nguyen and Wooster, 2020), as CO2 is one of the primary products of biomass combustion and is emitted in all phases of fire (ignition, flaming, glowing, pyrolysis, and extinction) (Andreae and Merlet, 2001), with the flaming phase leading to emissions (Lobert et al., 1991; Ward and Hardy, 1991). Thus, it is challenging to estimate CO2 emissions because they are generated in large quantities during biomass combustion and because of the different emission timelines produced during each combustion stage. Increasing atmospheric CO2 concentrations alter the global carbon cycle by causing global warming (Van Der Werf et al., 2006, 2010, 2017; Neto et al., 2009; Kaiser et al., 2012; Lin et al., 2013), and the resulting global warming is expected to intensify extreme fire seasons, leading to further surges in carbon emissions that significantly contribute to the global burden of greenhouse gases (fire–climate feedbacks) (Bowman et al., 2009). Therefore, accurate modeling of future wildfires and their emissions is required to understand the associated risks.
Boreal vegetation stores 17 % of the world's carbon yet encompasses almost 30 % of all terrestrial carbon stocks (Kasischke, 2000; Gauthier et al., 2015), with two-thirds being located in Siberia, Russia (Shvidenko and Nilsson, 2003). In Siberia, burned-biomass emissions approached 0.4 Gt C yr−1 in 2021, 3 times the average value between 1997 and 2020, according to GFED4s (Friedlingstein et al., 2020). Kharuk et al. (2022) also stated that the decadal frequency of wildfires tripled between 2001–2010 and 2011–2020. Catastrophic boreal forest fires are expected to continue to increase in the future due to increased global temperature, drier conditions, and longer fire seasons, and these fires will increase the severity and emissions produced from biomass burning (Flannigan et al., 2009). Burning vegetation is a major source of black carbon (BC), carbon monoxide (CO) (Forster et al., 2018), and particulate matter (PM) (Reddington et al., 2016). According to records from the Copernicus Atmosphere Monitoring Service (CAMS), Russia experienced a drastic increase to 8 Mt (metric megatons) in PM2.5 emissions in 2021, which is 78 % higher than the average level between 2004 and 2021 (4.5 Mt) (Romanov et al., 2022). Furthermore, an increase in atmospheric emissions negatively affects the climate by contributing to global warming and climate change (Randerson et al., 2006; Westerling et al., 2006; Bowman et al., 2009) and affects weather systems by modulating solar radiation and cloud properties (Schultz et al., 2008).
Understanding how long-term climate change, fire regimes, and forest vegetation interact under multiple climate scenarios is critical for forecasting forest succession trends (Clark and Richard, 1996). Modeling of fire regimes using dynamic global vegetation models (DGVMs) is a key approach to analyzing these factors. However, including interactive fire disturbances in vegetation models is critical for accurately simulating vegetation dynamics (Thonicke et al., 2001). A well-structured process-based fire module can accurately assess fire activity, consumed biomass due to fire, and biomass-burning emissions. The assessment of each fire-related variable is interconnected with another variable, so the module must be well constructed because the amount of consumed biomass during forest fires can vary significantly. Several factors affect burned biomass, such as spatial and temporal variations in the burned area based on the ignition factors, quantity and quality of the fuels available, and vegetation or plant functional type (PFT); additionally, every PFT reacts differently to fire disturbance (Cramer et al., 2001; Ito, 2011). Since the first global fire models were integrated into dynamic global vegetation models (DGVMs) 2 decades ago, the variety and complexity of fire models have expanded (Hantson et al., 2016). The Fire Modeling Intercomparison Project (FireMIP) compared 11 current fire models by structure and simulation protocols, using a benchmarking system to evaluate the models (Rabin et al., 2017). The results indicate that models that explicitly distinguish ignition factors, such as lightning and human-caused “ignition events”, as well as physical properties and processes that determine fire spread and intensity by plant functional type (PFT), performed better. One such fire module is SPITFIRE (SPread and InTensity of FIRE; an upgrade of GlobFIRM) (Thonicke et al., 2010), which has been used in several DGVMs: LPJ-GUESS–SPITFIRE, ORCHIDEE–SPITFIRE, JSBACH–SPITFIRE, and LPJ-LMfire. In this study, we integrated the SPITFIRE fire module into the spatially explicit individual-based dynamic global vegetation model (SEIB-DGVM) to predict fire, vegetation, and burned-biomass emission variables in Siberia in the future. We selected SEIB-DGVM because of its high-quality biogeochemical model coupled with a three-dimensional representation of forest structure where individual trees compete for light and space (Sato et al., 2007). The SEIB-DGVM processes physical, physiological, and vegetation dynamics and was previously used for reconstructing the geographical distributions of fundamental plant productivity properties (Sato et al., 2020), evaluating the geographic and environmental heterogeneity of larch forests with a special focus on topography (Sato and Kobayashi, 2018), and assessing the impacts of global warming on Siberian larch forests and their interactions with vegetation dynamics and thermohydrology (Sato et al., 2016). SEIB-DGVM accurately simulates forest ecology after typhoon disturbances (Wu et al., 2019), nonstructural carbohydrate dynamics (Ninomiya et al., 2023), and masting in a temperate forest (Végh and Kato, 2024).
The original fire module of SEIB-DGVM is Glob-FIRM (Thonicke et al., 2001), which has several limitations; for example, human-changed fire regimes and other land use impacts are not considered (Thonicke et al., 2001). In addition, GlobFIRM derives the burned fractional area of a grid cell from the simulated length of the fire season and from the minimum annual fuel load; this method does not specify ignition sources and assumes a constant fire-induced mortality rate for each plant functional type (PFT) (Thonicke et al., 2010). To improve the fire simulations with SEIB-DGVM, we replaced its fire module with the SPITFIRE model (Thonicke et al., 2010) by adding complete ignition equations (human and lightning effects, etc.). The module included a calculation mechanism for trace gas and aerosol emissions (Andreae and Merlet, 2001) and was adjusted to produce monthly outputs for all variables in SEIB-DGVM. These improvements allowed us to simulate fire activity and aboveground biomass dynamics and spatiotemporally assess the projected burned biomass and its emissions for the 21st century in Siberia under Representative Concentration Pathways (RCPs).
2.1 Study sites
Boreal forests represent the largest forest biome and one-third of global forest cover (De Groot et al., 2013) and play an important role in the atmosphere–land interactions of the global climate system (Randerson et al., 2006; Bonan, 2008). Geographically, boreal forests are found in Canada, Alaska, and Siberia, of which Siberia has the largest forested area. Siberia is largely covered by deciduous needleleaf conifers (Fig. 1), which consist mostly of the larch species Larix sibirica, L. decidua, and L. dahurica (Abaimov et al., 1998), which are categorized as pyrophytic species, meaning that they require periodic fires to persist on the landscape (Kharuk et al., 2011). The Siberian land cover has changed very little over the last century (Ivanov et al., 2022), and the boreal forest covers approximately km2, containing a large amount of carbon that is comparable to the combined carbon storage in tropical and temperate forests (Dixon et al., 1994; Kasischke, 2000).
The main external factors affecting Siberian boreal forests are fires and climate change (Goldammer and Furyaev, 1996; Shorohova et al., 2009). Climate change increased the frequency of forest fires, which in turn amplified the impacts of climate change locally. In the Arctic, a rapid warming trend has been observed, and the increase in temperature over the last 20 years of the 20th century was 2 to 3 times higher than the global average, while in the first 20 years of the 21st century, it exceeded 4 times (Chylek et al., 2022). This enormous increase in temperature in Siberia affected the duration and speed of snowmelt and accelerated the thawing of carbon-rich permafrost (Natali et al., 2019; Schuur et al., 2015; Nitzbon et al., 2020), which results in drier ground cover, an increased frequency of wildfires, longer fire seasons, and increased ignition sources (Kharuk et al., 2022). These changes may result in a new climate state in which heat waves as well as the associated the occurrence of wildfires may become routine and more severe (Hantemirov et al., 2022; Landrum and Holland, 2020). Produced emissions from thawing permafrost and from wildfires are likely to feed into the global carbon cycle's feedback on climate change (Schuur et al., 2015), triggering further warming trends globally (Schimel et al., 2001; Kharuk et al., 2011; Krylov et al., 2014).
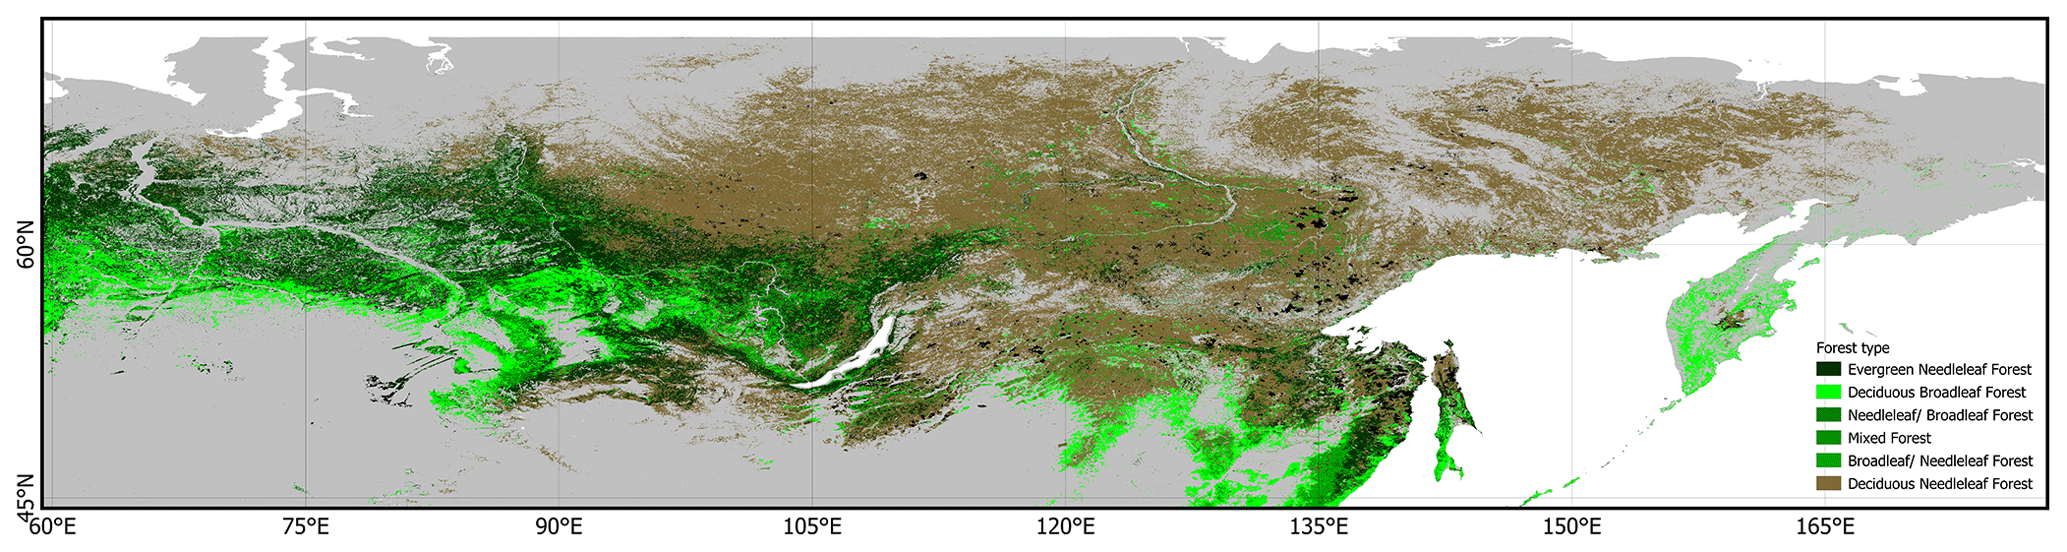
Figure 1Study site (black rectangle: 60–180° E, 45–80° N). Green and brown indicate the forest types in Siberia as provided by the Global Land Cover dataset (GLC 2000) for northern Eurasia (Bartalev et al., 2003). Grey indicates other vegetation types in the Siberian area as provided by the Database of Global Administrative Areas (GADM).
2.2 Improved fire module principles
We improved the SEIB-DGVM fire module by replacing the Glob-FIRM (Thonicke et al., 2001) with the SPITFIRE model (Thonicke et al., 2010). First, we added two new input variables for fire ignition: population and lightning data. Second, we incorporated the complete SPITFIRE equation (Thonicke et al., 2010), which included new variables, PFT parameters, and local parameters, and improved the output to be able to be produced on a monthly scale (Fig. 2). The variable integration between the default and improved fire models requires several parameter-specific PFTs (Table 1).
The default SEIB-DGVM model uses annual time steps for vegetation dynamics and disturbance, which we improved to monthly time step outputs. The fraction of individual trees killed by a fire depends on PFT fire resistance (M3, Table 1). All grass leaf biomass, all dead and living tree leaf biomass, half of the dead tree trunk biomass, and half of the litter pool are released into the atmosphere as CO2 during a fire, while the dead tree's residual biomass is converted into litter. In reaction to fire, all deciduous PFTs convert their phenology phase to dormancy, and if the stock resource of grass PFTs (gmass stock) does not meet the minimal value (50 g DM m−2; dry matter) following a fire, the deficit is supplemented from litter (Sato et al., 2007). Furthermore, related to the fire–vegetation relationships, for herbaceous PFTs, both belowground and storage biomass are preserved after a wildfire and used for the recovery of aboveground biomass. During this recovery period, herbaceous PFTs work on producing aboveground biomass while reducing their storage biomass, thus increasing the allocation ratio to aboveground biomass in the post-fire phase. For woody PFTs, fire only gives the option for individual trees to either die or survive. The surviving trees only lose their foliage biomass. As the foliage is lost, fine-root biomass becomes unnecessary, leading to its rapid loss due to its fast turnover rate. In the spring following a fire, surviving trees convert storage resources into foliage and fine-root biomass. The new net primary production (NPP) from the newly formed foliage first prioritizes the recovery of leaves and fine roots. Therefore, fires increase the allocation ratio to the foliage and fine roots in surviving woody plants.
The basic equation of fire disturbance is the area burned, which we adjusted with the SPITFIRE equation (Thonicke et al., 2010) by including the fire probability and area of the grid cell:
where Ab is the area burned in a grid cell per month (ha per month), Pb is the product of the probability of fire per month at any point inside the grid cell (per month), and A is the area of the grid cell (ha). Pb is the fire probability and is the product of the fuel load (litter + aboveground biomass) and its moisture factor. We used the same Pb mechanism as that of the default fire module, where if the fuel load satisfies the minimum fuel threshold (200 g C m−2), random fires can occur at any point location inside the grid cells. In this improvement, Pb was modified by considering the ignition event E(nig) (ha−1) alongside anthropogenic- (human population density) and natural-ignition (lightning strikes) possibilities, the fire danger index (FDI), and the mean fire area (ha). Thus, Eq. (2) can be represented as follows:
Technically, the SEIB-DGVM simulation of each grid cell is carried out independently among the surrounding grid cell, so the fire cannot spread to other grid cell without those grid cell meeting the ignition requirements (fuel load and fuel moisture).
After all variables in the SPITFIRE fire module were integrated, we added the trace gas and aerosol emission calculation process to the model. Trace gas and aerosol emission estimation are line with the Fire Modeling Intercomparison Project (FireMIP) protocols (Li et al., 2019), the comprehensive study comparison of nine dynamic global vegetation models (DGVMs), and produced an important estimation for long-term and large-scale fire emissions. Using the FireMIP protocol reference, SEIB-DGVM SPITFIRE improved to output PFT-level fire emissions.
Trace gas and aerosol emissions are the result of the total amount of burned biomass, the sum of dead and live fuel consumption as the result of surface fire, and crown scorch. Trace gas emissions are estimated based on fire carbon emissions, vegetation characteristics from DGVMs, and fire emission factors. Fire emissions of trace gas and aerosol for each species i and PFT j, Ei,j (g species m−2), are estimated based on Andreae and Merlet (2001):
where EFi,j is the PFT-specific emission factor (g species kg−1 DM); CEj is the combusted biomass of PFTj due to the fire (g C m−2); and C is the unit conversion factor from carbon to dry matter, g C kg−1 DM. The emission factors (EFs) used in this study are based on Andreae and Merlet (2001) and the updated pyrogenic emission species by various types of biomass burning (Andreae, 2019) (Table S2 in the Supplement).
DGVMs generally simulate vegetation as a combination of PFTs in a given grid location to represent plant function at a global scale, instead of land cover types (Li et al., 2019). In this, we classified the PFTs with the land cover types (LCTs) to integrate the emission factors of each LCT for trace gas and aerosol emission estimation processes. The BoNE (boreal needleleaf evergreen), BoNS (boreal needleleaf summergreen), and BoBS (boreal broadleaf summergreen) PFTs are classified as boreal forest LCTs. Other PFTs have been integrated with LCTs but are not listed in Table 1, as this study only covers boreal forest. The other integrated PFTs include TrBE (tropical broadleaf evergreen), TrBR (tropical broadleaf raingreen), TeNE (temperate needleleaf evergreen), TeBE (temperate broadleaf evergreen), TeBS (temperate broadleaf summergreen), TeH (temperate herbaceous C3 grass), and TrH (tropical herbaceous C4 grass). Related to the PFTs abbreviations, Tr represents tropical forest and Te represents temperate forest. SEIB-DGVM did not classify crop PFTs, so cropland LCTs will not be used.
Further changes to the input and output of the new SEIB-DGVM SPITFIRE are shown in Appendix A1, while Appendix A2 summarizes the improvement processes represented in this study, which can be classified into two groups: disturbance and biogeochemical dynamics. Appendix A3 lists the symbols used in the model's equations. Detailed information about the integration of the SPITFIRE module in SEIB-DGVM, which includes the improvement and adjustment of all the variables and the main important variables, such as the ignition events E(nig), fire danger index (FDI), mean fire area , fuel moisture content, rate of spread, fire fraction and intensity, fire damage to plants, and trace gas and aerosol emissions, is provided in the Supplement (Sect. S2.2.1–S2.2.7).
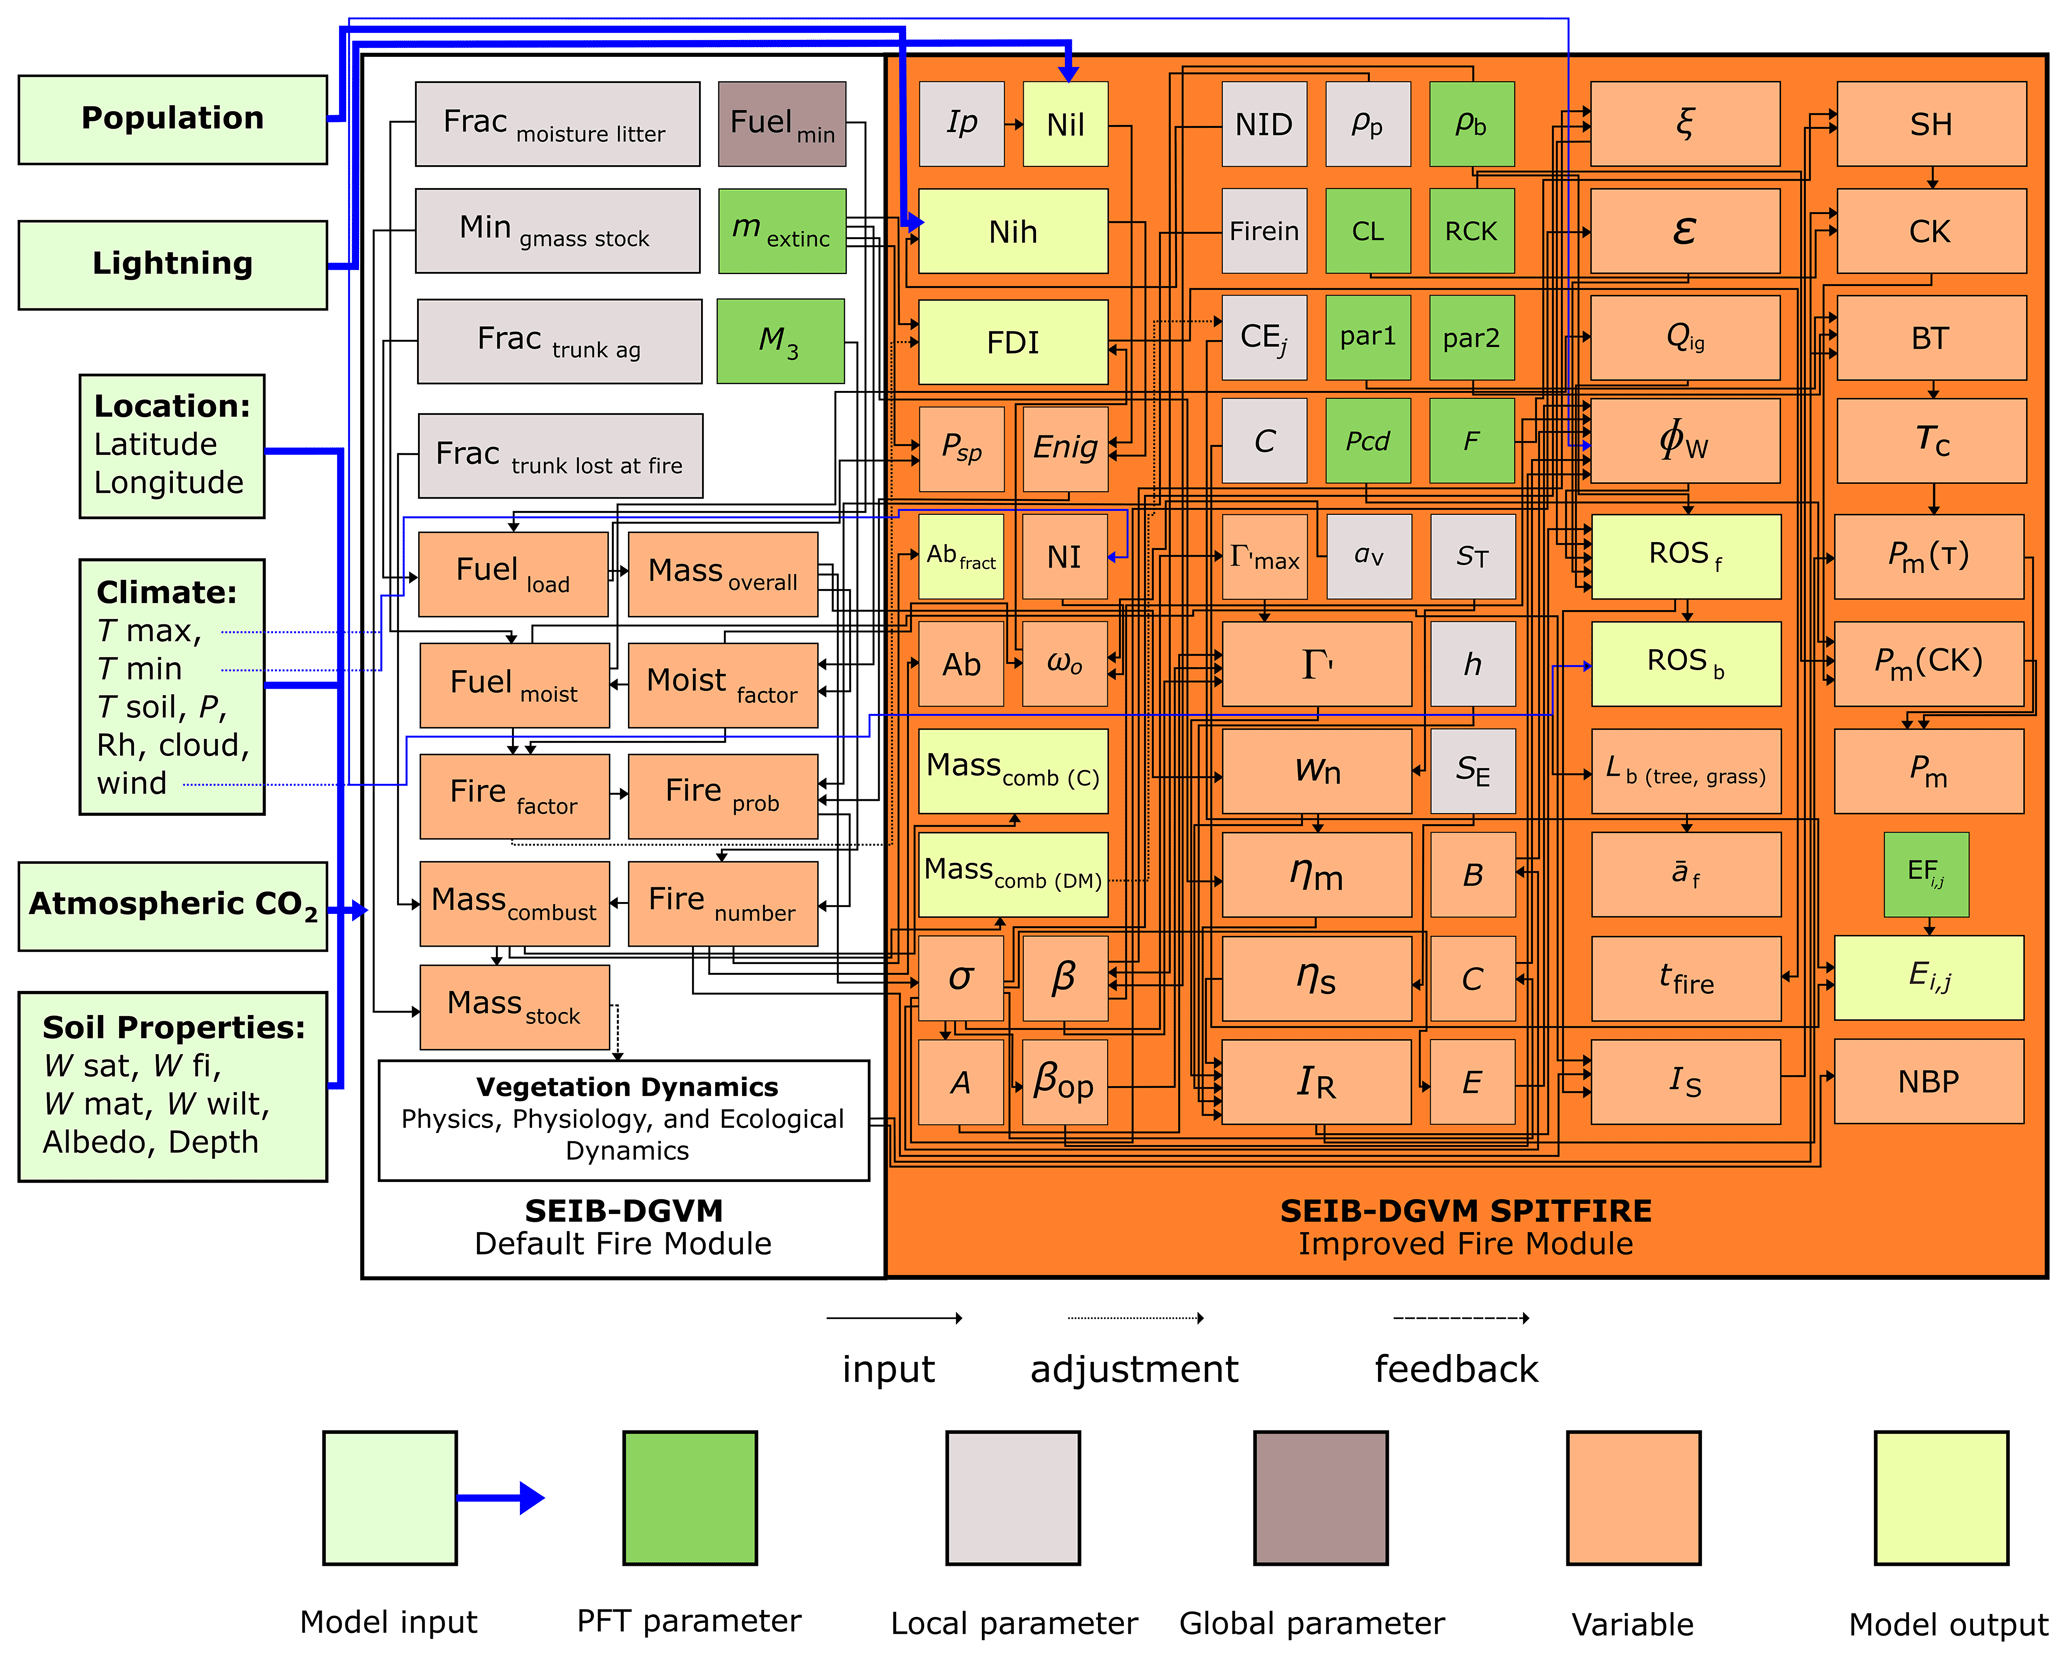
Figure 2SEIB-DGVM SPITFIRE system diagram. In describing the improvements (SPITFIRE), the interaction with the previous fire module (Glob-FIRM) is shown. All original SPITFIRE variables were integrated: ignition factor (lightning and population), PFT parameters, and other fire-related variables. In addition to the default annual output, the improved module has monthly outputs of all variables depending on the user needs. For definitions of the abbreviations, refer to Appendix A3.
Table 1SEIB-DGVM SPITFIRE PFT-specific (plant functional type) model parameter values and their attribution to LCTs. This table was modified from Thonicke et al. (2010).
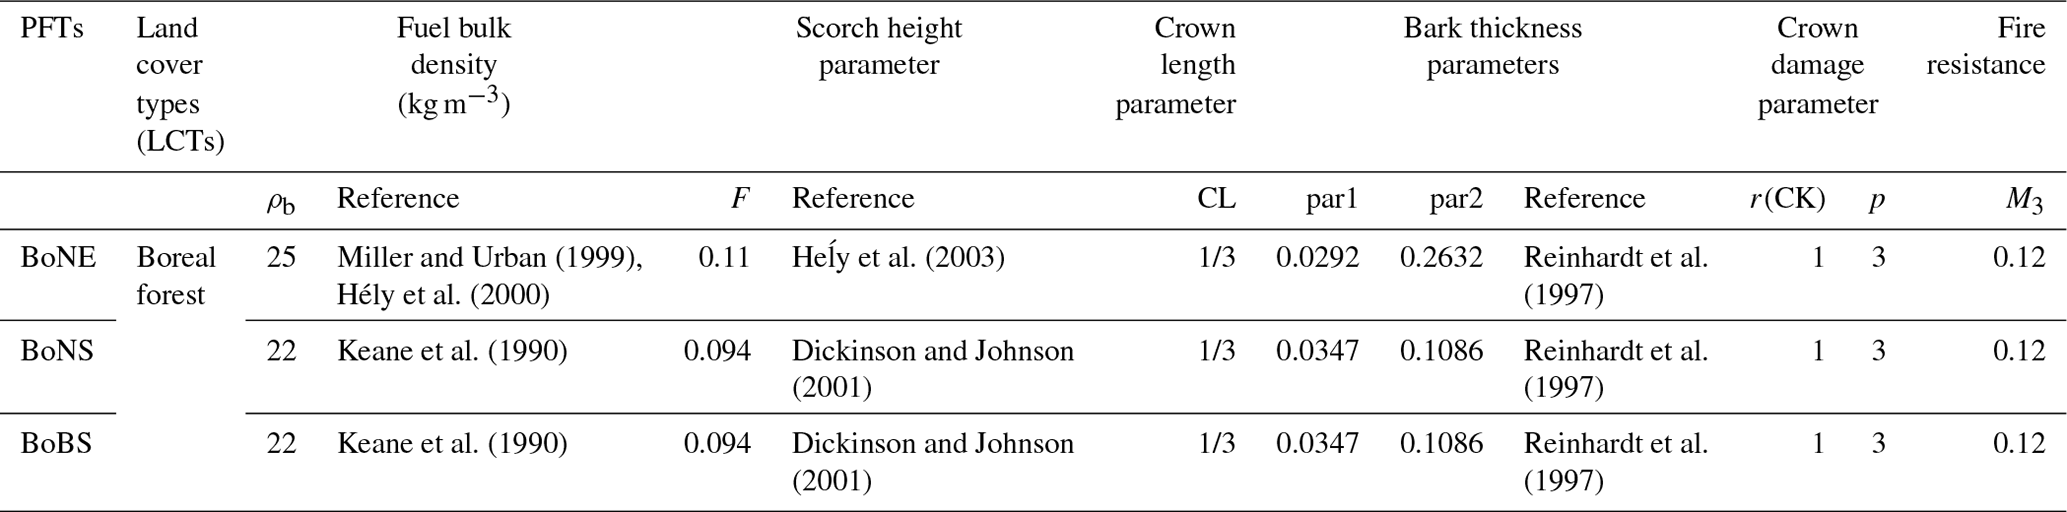
PFTs attributed to land cover types (LCTs) are needed to classify the fire emission factor (EF) (Table S2) to estimate trace gas and aerosol emissions (Andreae and Merlet, 2001).
2.3 Model calibration
We calibrate the improved model using all of the benchmark datasets (Table 3). The calibration process is done sequentially for all of the major variables, burned fraction, burned area, dry matter, aboveground biomass, burned-biomass emissions, and the forest ecology variables (Fig. 3). This calibration process involves comparing the average value of the output variable with the corresponding variable from the benchmark dataset, ensuring that both are aligned in terms of spatiotemporal resolution. The process is sequential because one variable is used for the calculation of another variable (such as the burned fraction and burned area affecting aboveground biomass, forest structure, dry matter, and emissions). One calibration process is performed with multiple iterations until the output variable has numerical values and a spatial distribution similar to the benchmark data, and the process is repeated for other variables once the previous variable has been calibrated.
2.4 Model application
The original SEIB-DGVM utilizes three computational time steps: a daily time step for all physical and physiological processes except for soil decomposition and tree growth, a monthly time step for soil decomposition and tree growth, and an annual time step for vegetation dynamics and fire disturbance (Sato et al., 2007). In this study, we improved the fire module to calculate natural- and anthropogenic-fire-ignition factors (based on lightning flashes and population density) and adjusted it to produce monthly outputs using temporal-resolution statistical downscaling methods with user-defined weighted monthly parameters (Table 2). The annual average ignition factor variables (population density and lightning flash rate) were used consistently throughout all simulation phases.
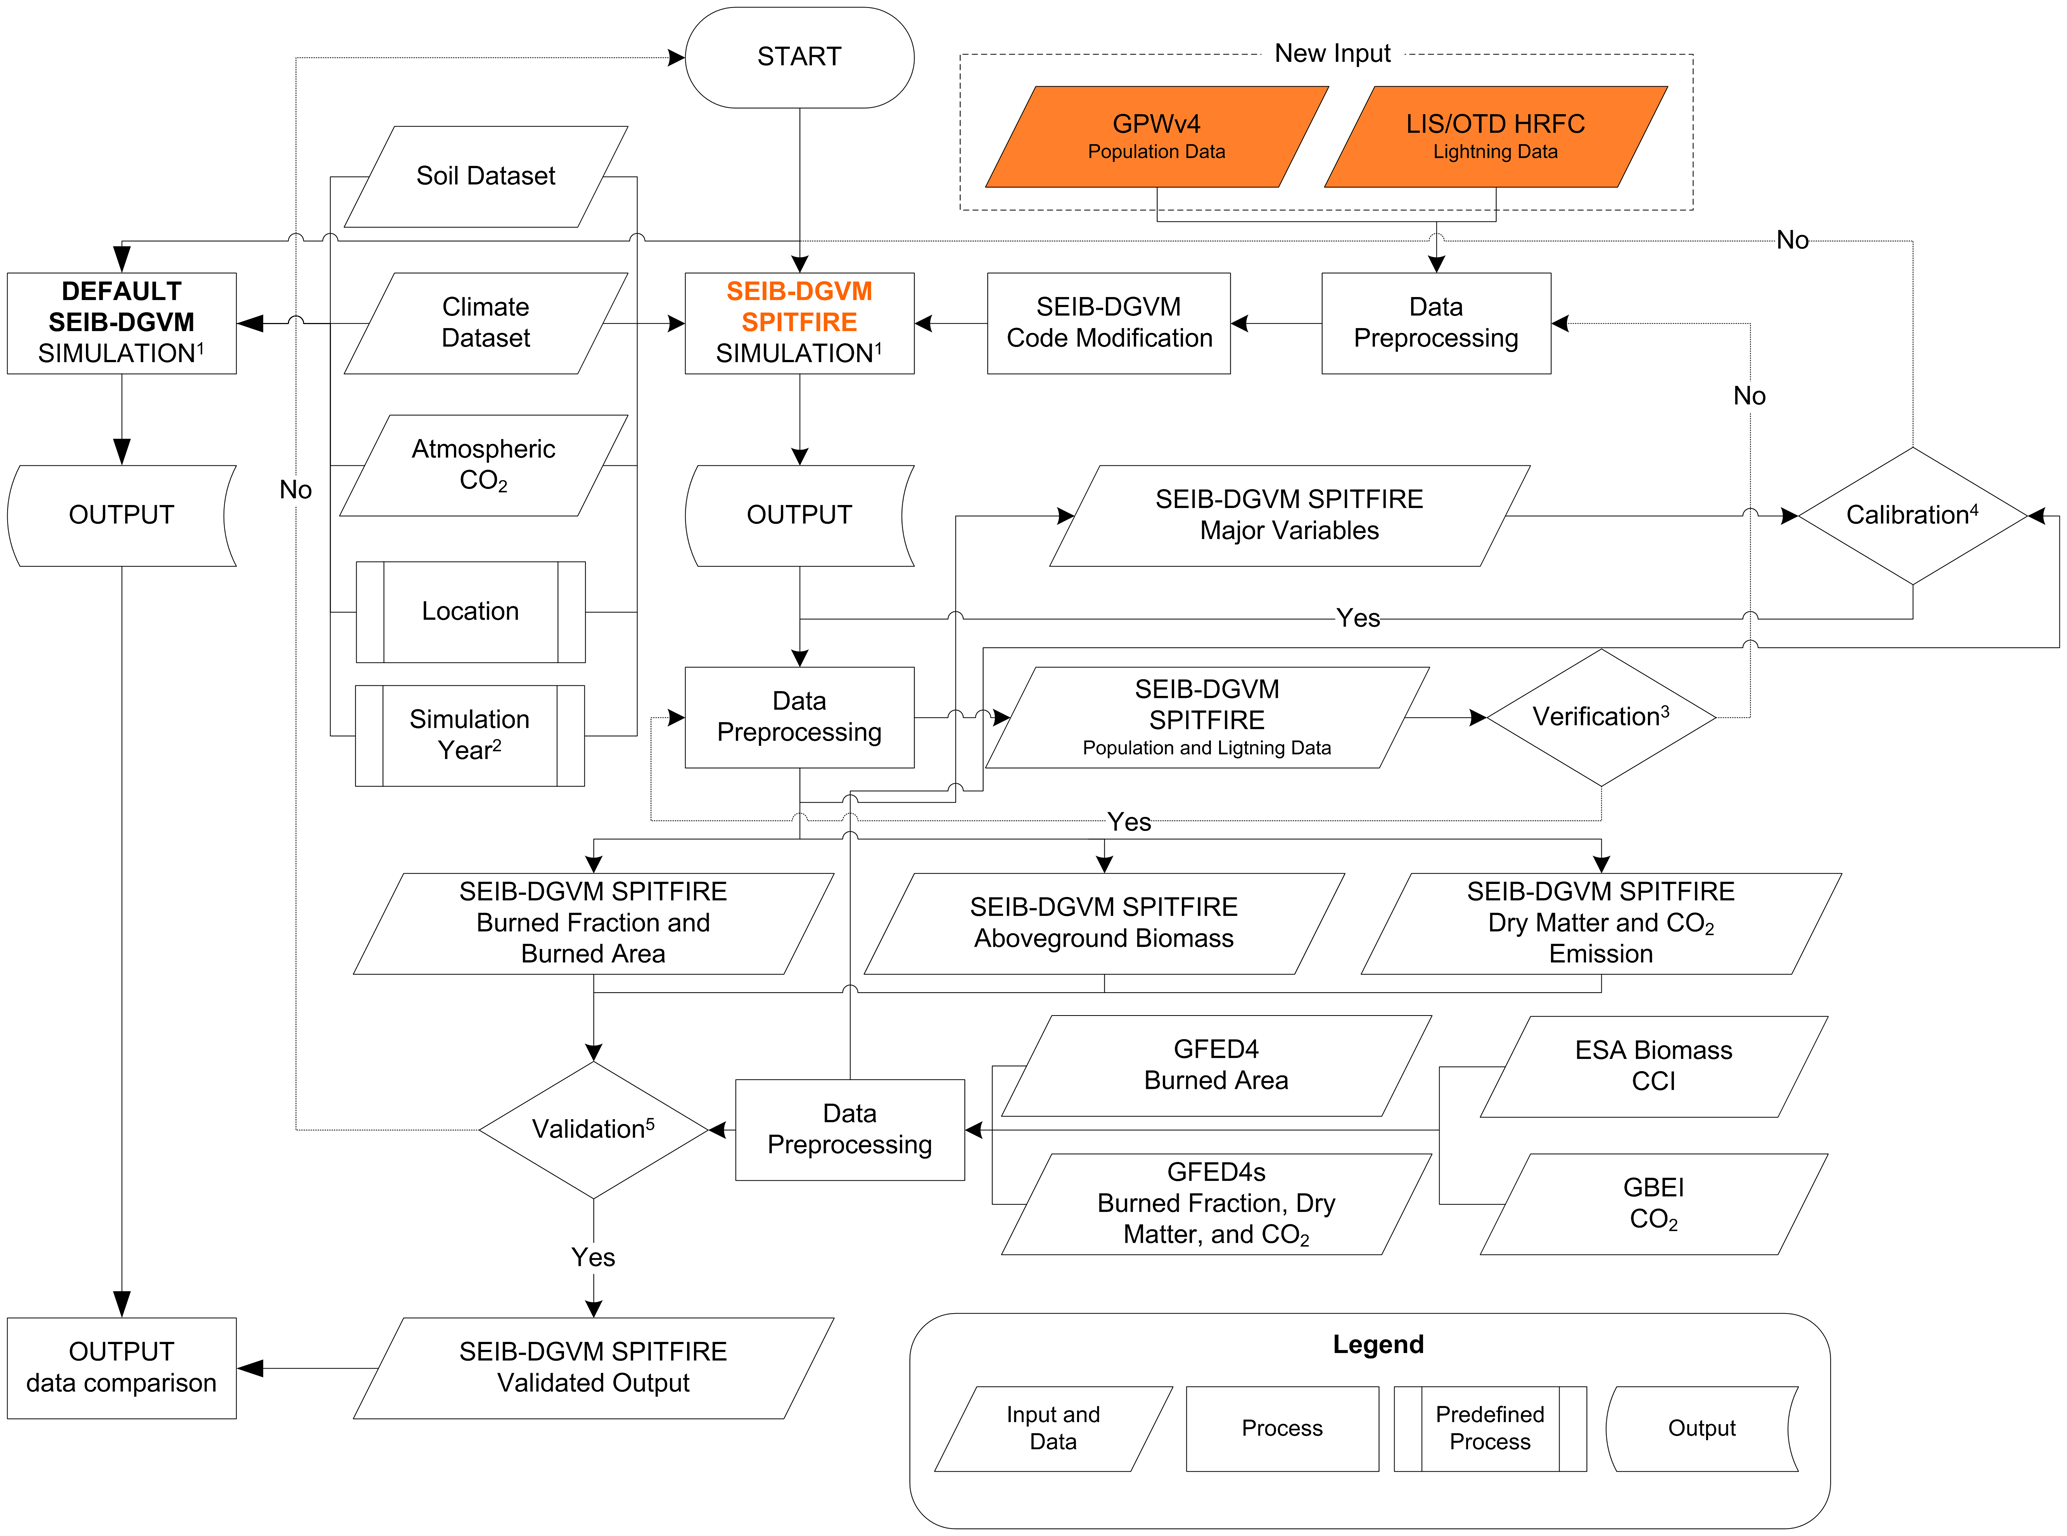
We ran the improved model (SEIB-DGVM SPITFIRE) and the default model (SEIB-DGVM GlobFIRM) under the same protocols to equally compare and assess their fire products (Fig. S3 in the Supplement). Simulations were run in three phases (spin-up, historical, and future), and the simulation was run with the fire mode on and fire mode off to compare and assess the vegetation products during fire, and also each phase was replicated five times to minimize bias due to random variables in the tree morality1 (see reference marks in Fig. 3). The model was run in three phases2: (1) a 1000-year spin-up phase to bring the soil and vegetation carbon pools into equilibrium with the climate using daily baseline CRU TS3.22 (Climatic Research Unit Time-Series) climate data; (2) a 156-year historical phase also using daily baseline CRU TS3.22 climate data and spin-up simulation results as inputs; and (3) a 95-year future phase using daily MIROC5 output submitted for the IPCC Fifth Assessment Report (AR5) (MirocAR5 base V3) with RCP8.5, RCP6.0, RCP4.5, and RCP2.6 climate data and historical simulation results as inputs (Fig. 3). The MirocAR5 base V3 dataset has been bias-corrected with CRU TS3.22 climate data, so using these two datasets consecutively in spin-up, historical, and future simulations ensures the harmony of the input climate data. Five different types of RCP scenario climate data were used to determine the impact of fire and climate on forest structure and their interactions.
In the previous SEIB-DGVM study, a 2000-year spin-up was needed to obtain the convergence amount of soil organic matter (Sato et al., 2010). However, we have conducted preliminary simulations with the same study area by setting the spin-up years to 1000 and 2000 years. We confirmed that the outputs of the 1000-year and 2000-year spin-up simulations were very similar; thus, the 1000-year spin-up was enough to reach carbon stock equilibrium. This parameter setting is also in line with the simulation settings in other SEIB-DGVM studies: Sato et al. (2007) performed a 1000-year spin-up and combined it with all of the simulation phases to extract general trends of post-fire succession. Another study by Arakida et al. (2021) also confirmed that a spin-up period of 100 years was sufficient for the equilibrium of the LAI (leaf area index), aboveground biomass, and GPP (gross primary production) at all the study sites in Siberia.
In addition, we have a verification stage3 to ensure that the new input data can be read, produced, and processed properly (Rabin et al., 2017). Then, we calibrate all of the major emissions individually and sequentially with the benchmark dataset because each variable affects other variables and we need to ensure the final output is comparable with the benchmark datasets4. After verifying that the new module was incorporated seamlessly, we validated the model outputs (fire, vegetation, and emission variables) using the GFED4, GFED4s, ESA Biomass Climate Change Initiative (CCI), and Global Biomass Burning Emissions Inventory (GBEI) benchmark datasets5.
2.5 Model benchmarks
A common method for validating the outputs of dynamic global vegetation models (DGVMs) is to use satellite-based product datasets. For instance, direct observations of global fire occurrence by satellite-borne sensors can detect active fires, fire radiative power, and burned areas, and these observations have been available since the 1990s (Mouillot et al., 2014). The Fire Modeling Intercomparison Project (FireMIP) also used the satellite-based product database as a benchmark to evaluate the model simulation (Rabin et al., 2017; Li et al., 2019).
In the last few decades, several global biomass-burning emission datasets based on the detection of the burning area and fire radiative energy have been developed and used for many purposes, such as global climate and vegetation modeling, together with environmental, health, and security assessments (Ichoku et al., 2008; Mouillot et al., 2014). Although fire-related observation datasets are available and globally accessible, they have relatively large uncertainties and are poorly constrained, especially in models at the global and regional levels (Liousse et al., 2010; Petrenko et al., 2012, 2017; Bond et al., 2013; Zhang et al., 2014; Pan et al., 2015; Pereira et al., 2016).
Pan et al. (2020) reported that this uncertainty could be caused by various measurement and/or analysis processes, including the detection of fire or burned areas, retrieval of fire radiative power, emission factor information, biome type, burning stage, and fuel consumption estimation. The emission factor (EF) is considered an important factor for obtaining specific gaseous or particulate species of smoke emitted from burned dry matter in all major burned-biomass (BB) emission datasets. Some EFs originate from laboratory experiments where fuel samples are burned in combustion chambers (Christian et al., 2003; Freeborn et al., 2008), whereas others originate from large-scale, open biomass-burning and wildfire experiments. The combustion properties might differ greatly between these two categories; e.g., because of personnel security and other logistical considerations, some EF measurement locations are often not close enough to the biomass-burning source (Aurell et al., 2019). Another factor is the biome type, which affects the scaling factor of the emission coefficient for the FRP-based (fire radiative power) BB datasets (GFAS, Global Fire Assimilation System; FEER, Fire Energetics and Emissions Research; and QFED, Quick Fire Emissions Dataset). The emission factors of all BB datasets were assigned based on the type of biome, and most of the examined BB datasets had different definitions of major biome types, so uncertainty might be present at certain levels (Pan et al., 2020).
We validated the improved SEIB-DGVM fire module products using the burned-area (GFED4) and burned-fraction (GFED4s) datasets, corresponding to the model's output. These datasets have higher resolutions than other burned-area-based datasets, and all of the uncertainty probabilities regarding the selected database described by Pan et al. (2020) were adjusted with our model configurations. We used the emission factor (EF) from Andreae and Merlet (2001) with the latest update from Andreae (2019) and integrated the plant functional type (PFT) model with the land cover types (LCTs) used in the EF (Tables 1 and S2).
Furthermore, fire models should be evaluated together with their associated vegetation models because the former might produce burned areas perfectly but incorrectly simulate aboveground biomass (AGB) patterns. Fire products depend on AGB availability, and fire also affects AGB availability and succession after forest fires. Thus, to ensure that the model conducted correct assessments, we evaluated the aboveground biomass variable using the ESA Biomass Climate Change Initiative dataset (Table 3). The AGB data from the ESA Biomass Climate Change Initiative (CCI) v3 (2010, 2017, and 2018) include high-quality data with a large resolution of 100 m×100 m obtained from multiple remote sensing observations collected around the year 2010 (Santoro et al., 2021), making them suitable for validating our improved model product.
Overall, we validated the model spatially and numerically at the Siberian level and in smaller regions to determine the performance of the model in many points of view (spatial, numeric, wide, and small region). We classified Siberia into three regions: west region (60–90° E, 45–80° N), central region (90–120° E, 45–80° N), and east region (120–180° E, 45–80° N) (Fig. S12).
Table 3Description of the observational datasets used for model evaluation.
3.1 Improved model validation
3.1.1 Fire products
We compared the annual average distribution patterns of the burned-fraction variable (1997–2016) in the SEIB-DGVM SPITFIRE and GFED4s data, and most patterns differed only in the east region of Siberia (Figs. 4, S10). Compared to the burned-fraction variable, burned-area GFED4 has a smaller distribution pattern because it does not consider small fires (Fig. S9a). Comparison analysis of burned-fraction variables between SEIB-DGVM SPITFIRE and GFED4s showed a linear relationship with a correlation coefficient of R=0.87 (R2=0.75) (Fig. S11a). Similar to the comparison with GFED4s, the comparison of the SEIB-DGVM SPITFIRE output of burned-area variables with GFED4 data (1996–2016) shows a linear relationship with a correlation coefficient of R=0.78 (R2=0.61) (Fig. S11b). Furthermore, in the three regions (west, central, and east), the partial comparison of the burned-fraction variable with GFED4s showed values of R2=0.68, R2=0.51, and R2=0.58 (Fig. S13), while for the burned-area variable showed values of R2=0.51, R2=0.54, and R2=0.506 (Fig. S14), respectively. The burned fraction correlated better because both the GFED4s and the model's fire module considered small fires; scattered fire data with values less than 0.1 and approximately 0.1 were found in both the model's output and the GFED4s data.
The fire products (burned fraction and burned area) in the improved model have the same spatial distribution because they are calculated based on one core variable (fire probability) (Eq. 1). However, the spatial distributions of GFED4s (burned fraction) and GFED4 (burned area) differ for two reasons: first, because GFED4 does not consider small fires (Giglio et al., 2013), while GFED4s does, and, second, because GFED4s uses the modified burned-fraction equation, which is able to calculate the exact fire fraction and fuel load (not uniformized) in a grid cell (Van Der Werf et al., 2017).
Although the spatial distributions and patterns of the fire products (burned fraction and burned area) in the model and benchmark datasets (GFED4s and GFED4) data slightly differed, the model was able to produce annual mean value data that were similar to both benchmark datasets. The mean average burned fraction during 1997–2016 was 0.0137 in the simulations, compared to the GFED4s, which recorded the same value of 0.0137 with an RMSE value of . Furthermore, the mean average burned area of the model in 1996–2016 was 1428.5 ha per grid per year, compared to the GFED4 burned-area data, which closely recorded value of 1425.1 ha per grid per year by an RMSE value of 70.2 ha per grid per year. In summary, the model was able to produce mean average data that precisely resembled observational data.
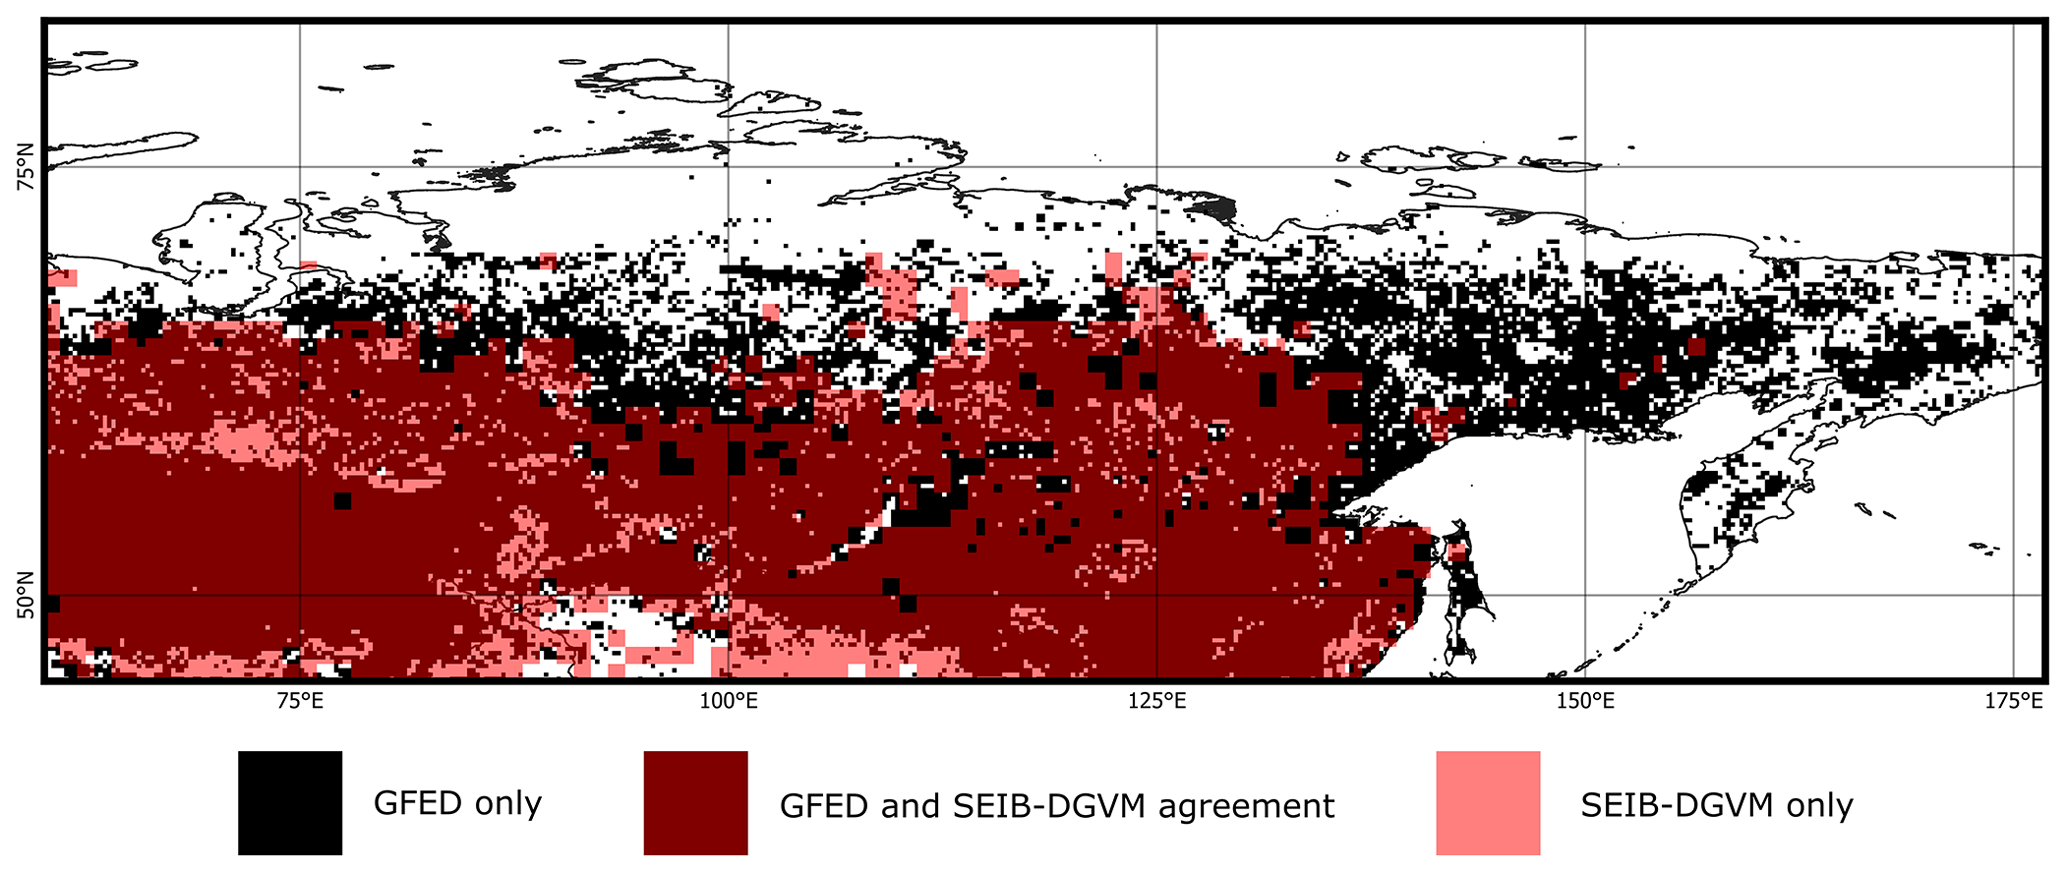
Figure 4Spatial distribution comparison of the annual average burned-fraction variable (1997–2016) from SEIB-DGVM SPITFIRE and GFED4s.
3.1.2 Aboveground biomass
The improved model simulated aboveground biomass values similar to those of the benchmark data. In 2010, 2017, and 2018, the simulations predicted 63.714±64.89, 64.141±65.54, and 64.313±65.61 Mg DM ha−1 yr−1, respectively, while the ESA Biomass CCI data showed 64.027±56.95, 64.548±54.69, and 65.05±55.78 Mg DM ha−1 yr−1, respectively, for the same years. The annual average AGB of the model in these years also showed the same increasing trend as the benchmark data, and the spatial distributions of the AGB model under CRU TS3.22 climate data and ESA Biomass CCI also agreed, with values of 83 %, 85 %, and 85 %, respectively (Figs. S15 and S16). Furthermore, when viewed on a smaller regional scale, the model is able to project better values in the west, central, and east regions, with average values of R2=0.73, R2=0.69, and R2=0.74, respectively (Fig. S17). Although there was an annual average increase in the number of forest fires, there was a high-variability trend in the model AGB values indicating succession after forest fires and a correct response to climate inputs variables based on each RCP scenario (Fig. 9d).
3.1.3 Annual and seasonal fluctuations in burned dry matter
The model's dry-matter data have a spatial distribution pattern similar to that of the model's fire products (burned fraction and burned biomass), as calculated from the available fire and fuel load data (fire product derivatives). The annual average dry-matter variability from the 1997–2016 model (under the historical climate product CRU TS3.22) and the GFED4s data agreed with 6.24 %, similar to the agreement of the fire products (Fig. S20). Spatial comparisons at the regional scale in the west, central, and east regions of Siberia show lower values than the Siberian region as a whole, with an agreement of 60.2 %, 64.4 %, and 58.8 % (Fig. S21).
We also compared seasonal dry-matter data to ensure that the monthly outputs of SEIB-DGVM SPITFIRE agree with the observations, as this difference influences seasonal aerosol emissions. Between 1997 and 2016, the GFED4s data exhibited high fluctuations and dynamics depending on the month and year, while SEIB-DGVM SPITFIRE was not able to reproduce these dynamics or accurately predict the occurrence of extreme events (Fig. S18a). For example, intense forest fires were recorded in 2003, 2012, and 2016. The monthly burned-dry-matter data for these years peaked in 2003 in May and in 2012 and 2016 in July (Fig. S18b–d). Severe wildfires in 2003 were due to low precipitation, as total precipitation reached only 36.0 mm in the Republic of Buryatia and 45.7 mm in the Chita Region between August 2002 and May 2003 (IFFN, 2003). The 41-year average precipitation between August and May (1981–2022) in the Republic of Buryatia was approximately 332.23 mm, and in the Chita Region was approximately 119.45 mm. Thus, the low precipitation in 2003 was an anomaly outside of the annual average range.
Furthermore, the improved model's monthly average burned dry matter in 2003, 2012, and 2016 was also lower compared to the GFED4s data. The burned-dry-matter values of the improved model were 58.64±5.86, 59.41±5.9, and 59.98±5.99 kg DM m−2, while the benchmark data showed values of 122.36, 101.7, and 69.95 kg DM m−2, respectively.
However, considering the entire period from 1997 to 2016, not only during years with extreme fire events but also for multiple years and time-series data was the model also able to reproduce similar average values. When comparing the monthly averages during 1997–2016, the model data yielded a value of 58.94±5.89 kg DM m−2, while the GFED4s data yielded 59.12 kg DM m−2. The model is not yet able to reproduce the exact value at a specific time of year or month because it runs in a long-term phase and is not yet able to predict sudden natural and anthropogenic conditions (factors). Overall, the spatial distribution comparison of the monthly dry-matter variables from GFED4s and SEIB-DGVM SPITFIRE for 20 years (1997–2016) revealed a correlation of 99 % (Fig. 5); therefore, the model was able to approximate the monthly averages.
3.1.4 Carbon dioxide (CO2) and PM2.5 emissions
Emissions from biomass burning contribute significantly to the global budget for residual gases and aerosols that affect the climate. It is estimated that biomass burning contributed up to 50 % of global CO and NOx emissions in the troposphere (Galanter et al., 2000), and the most emitted gas during biomass burning is CO2 (Ritchie et al., 2020). Since CO2 emissions are the primary emissions that contribute to climate change, it is critical to assess and monitor them continuously.
In this study, out of 33 projected emissions (Tables 4 and S6), we validated the CO2 variable that is able to represent all projected emissions because all estimated emissions are derived from the same burned-dry-matter variable, which differs only in the emission factor value of each gaseous emission. The highest annual average value of CO2 emissions from 1997 to 2020 is from GFED4 data, followed by SEIB-DGVM SPITFIRE and then the GBEI product, with values of , , and g CO2, respectively (Table S3). The GFED4s and GBEI data have higher standard deviation values than the SEIB-DGVM SPITFIRE data and appear to have a large difference.
Spatially, the annual average CO2 emission model data were 61.3 % (Fig. 6a) and 79.8 % (Fig. 6b) correlated with the GFED4s and GBEI data, respectively. Furthermore, CO2 emissions of the model compared to the GFED4s in the three regions (west, central, and east) showed lower agreement than Siberia as a whole, at 62.7 %, 62.5 %, and 61.6 %, respectively (Fig. S29), whereas the comparison to GBEI data at the three regions showed agreements of 74.7 %, 77.6 %, and 64.3 %, respectively (Fig. S30). In addition, spatial comparison of annual mean data over 95 years (2006–2100) from SEIB-DGVM SPITFIRE, GFED4s, and GBEI datasets reveals similar values of 141.1±11.5, 157.2±14.8, and 148.7±7.12 Gg CO2 yr−1, respectively.
Our study area covers the boreal Asia (BOAS) area and a small part of central Asia (CEAS), differing from the GFED4 basis region classification; therefore, we extracted these areas from the GFED4s data for comparison (Fig. S22). A comparison of the GFED4s CO2 data between the BOAS area and the Siberian area showed that the two datasets had a similarity of 98.2 % (Fig. S26), confirming the accuracy of the GFED4s validation data.
As all emission products are derived from fire products (dry-matter variables), emission factors displayed spatial and value dynamics similar to those of the fire products (Figs. S19, S27, and S43). When comparing the annual average dry-matter emission data and CO2 emissions generated by the model, the results correlated perfectly (100 %, Fig. S31), indicating that the model runs well according to Eq. (3) and that the projected CO2 and other emissions have the same distribution patterns as the dry-matter variable because all of the emission calculations are based on the dry-matter variable. However, they differ in their values because each emission species has a different emission factor.
We also compared the modeled PM2.5 emissions and their distribution patterns with the Copernicus Atmosphere Monitoring Service (CAMS) (Romanov et al., 2022) data in seven Russian territories (Amur Region, Republic of Buryatia, Irkutsk Region, Khabarovsk Territory, Krasnoyarsk Territory, Transbaikal Territory, Yakutia (Republic of Sakha)) during 2010–2021. The improved model data and CAMS data both exhibited an increasing trend (Figs. 7a and 2 in Romanov et al., 2022) and a correlation of 85.8 % (Fig. 7b).
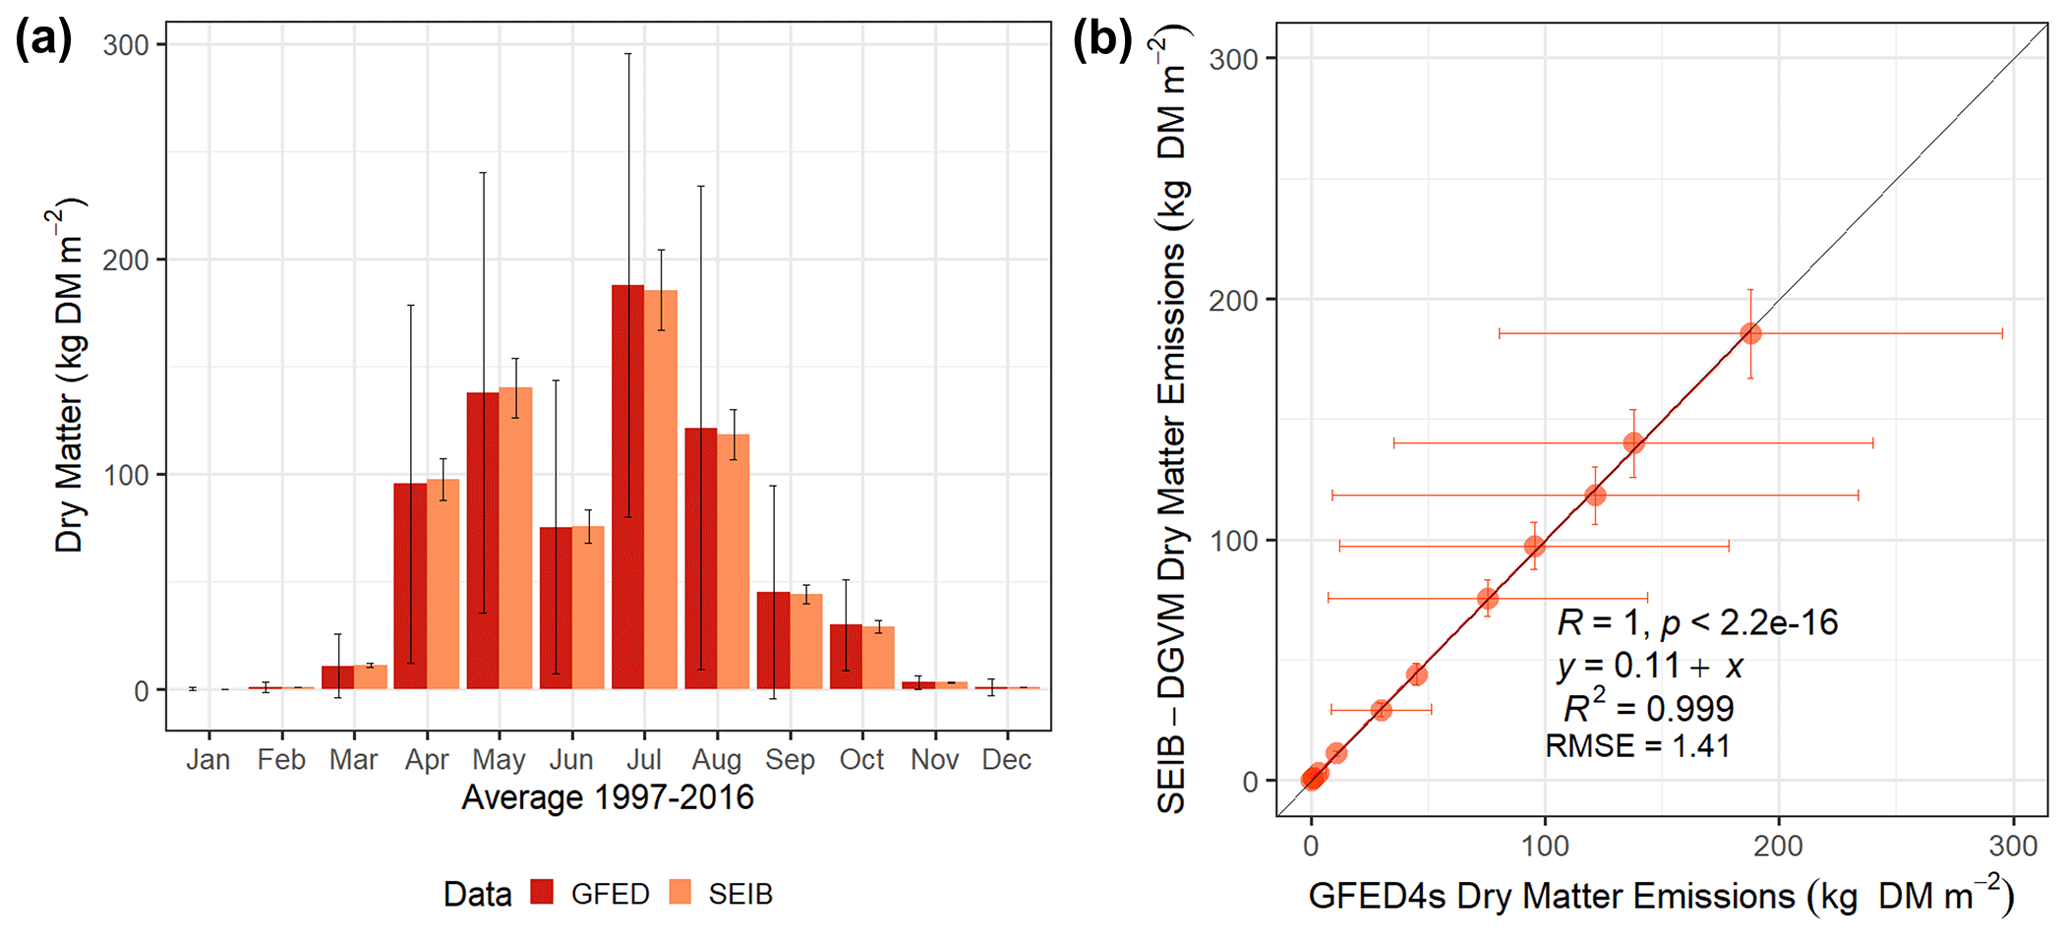
Figure 5(a) Monthly average temporal-variation dry-matter emissions from GFED4s and SEIB-DGVM from 1997 to 2016. (b) Comparison of monthly average dry-matter emissions from GFED4s and SEIB-DGVM from 1997 to 2016. Standard deviation obtained from the monthly data from 1997 to 2016.
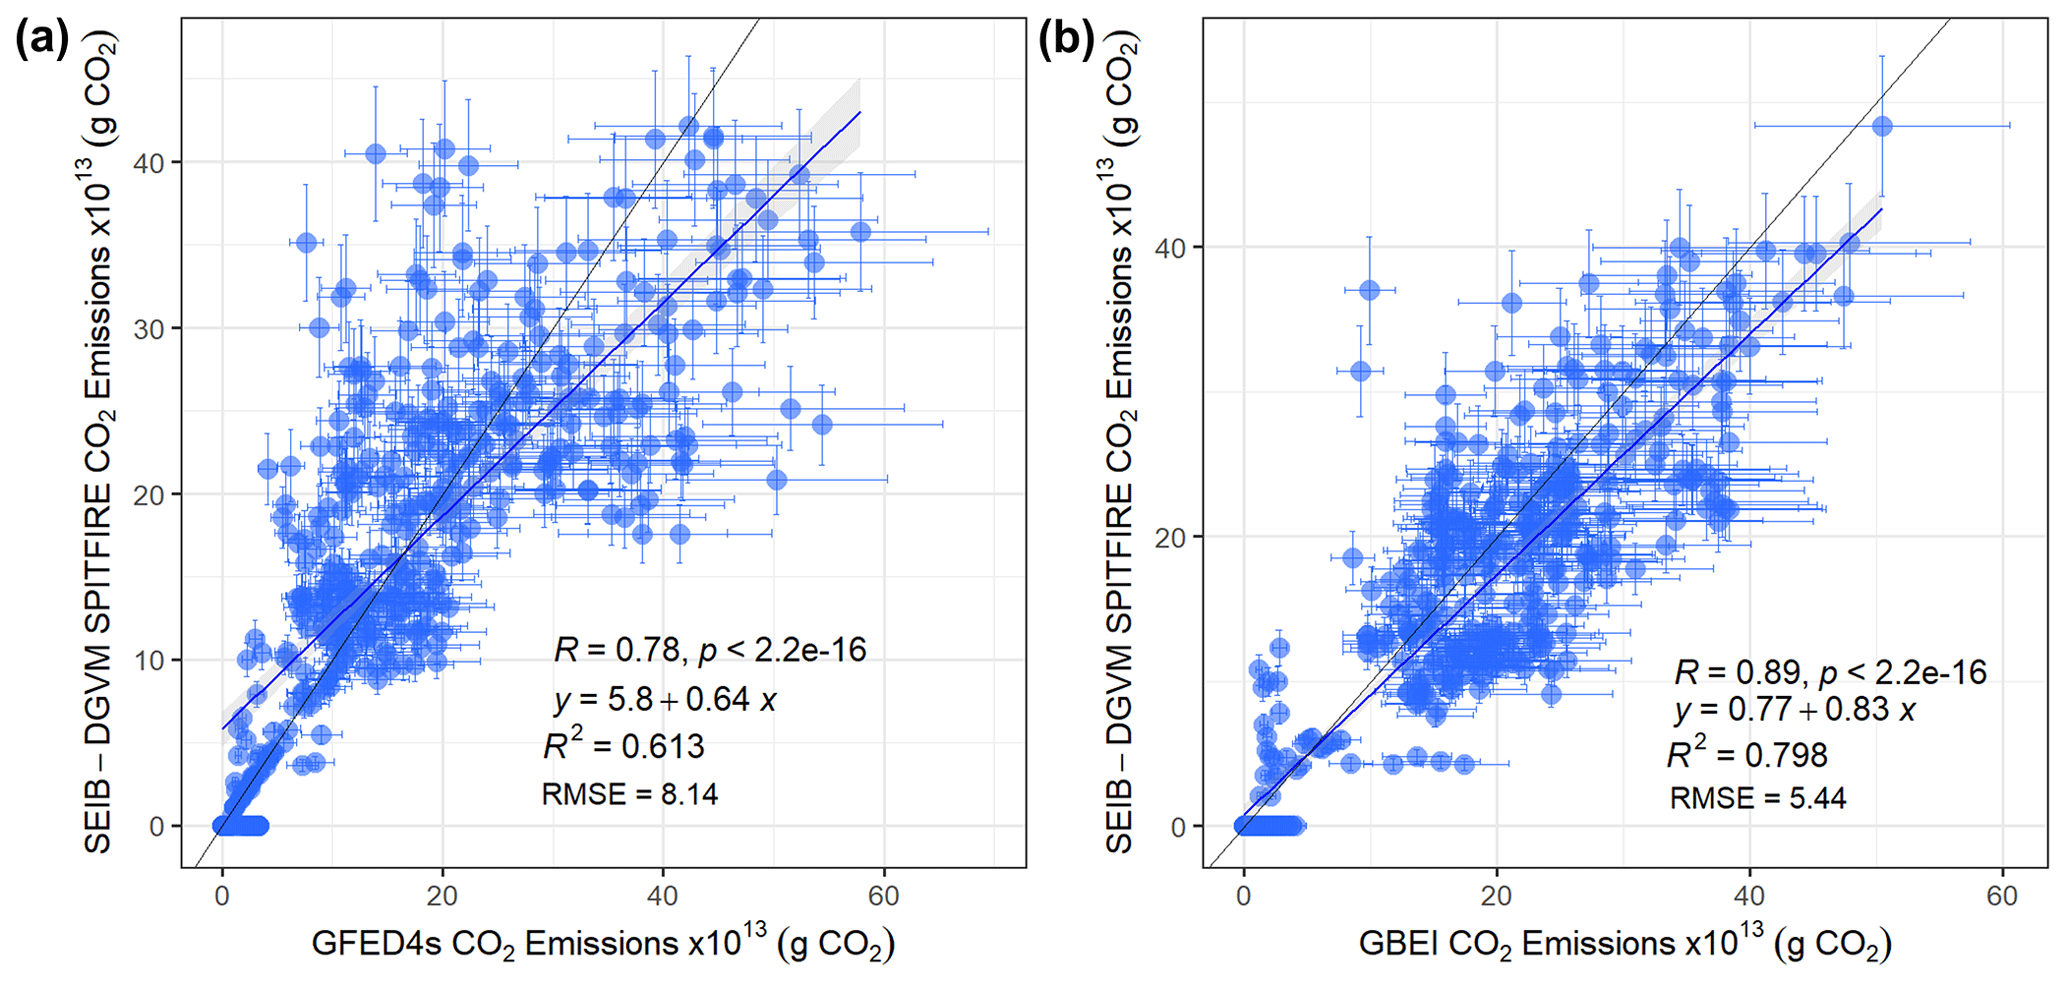
Figure 6Latitude average spatial comparison of simulated CO2 emissions from SEIB-DGVM SPITFIRE with (a) GFED4s from 1997 to 2016 and (b) GBEI from 2001 to 2020. Standard deviation obtained from the annual CO2 emission data of each dataset.
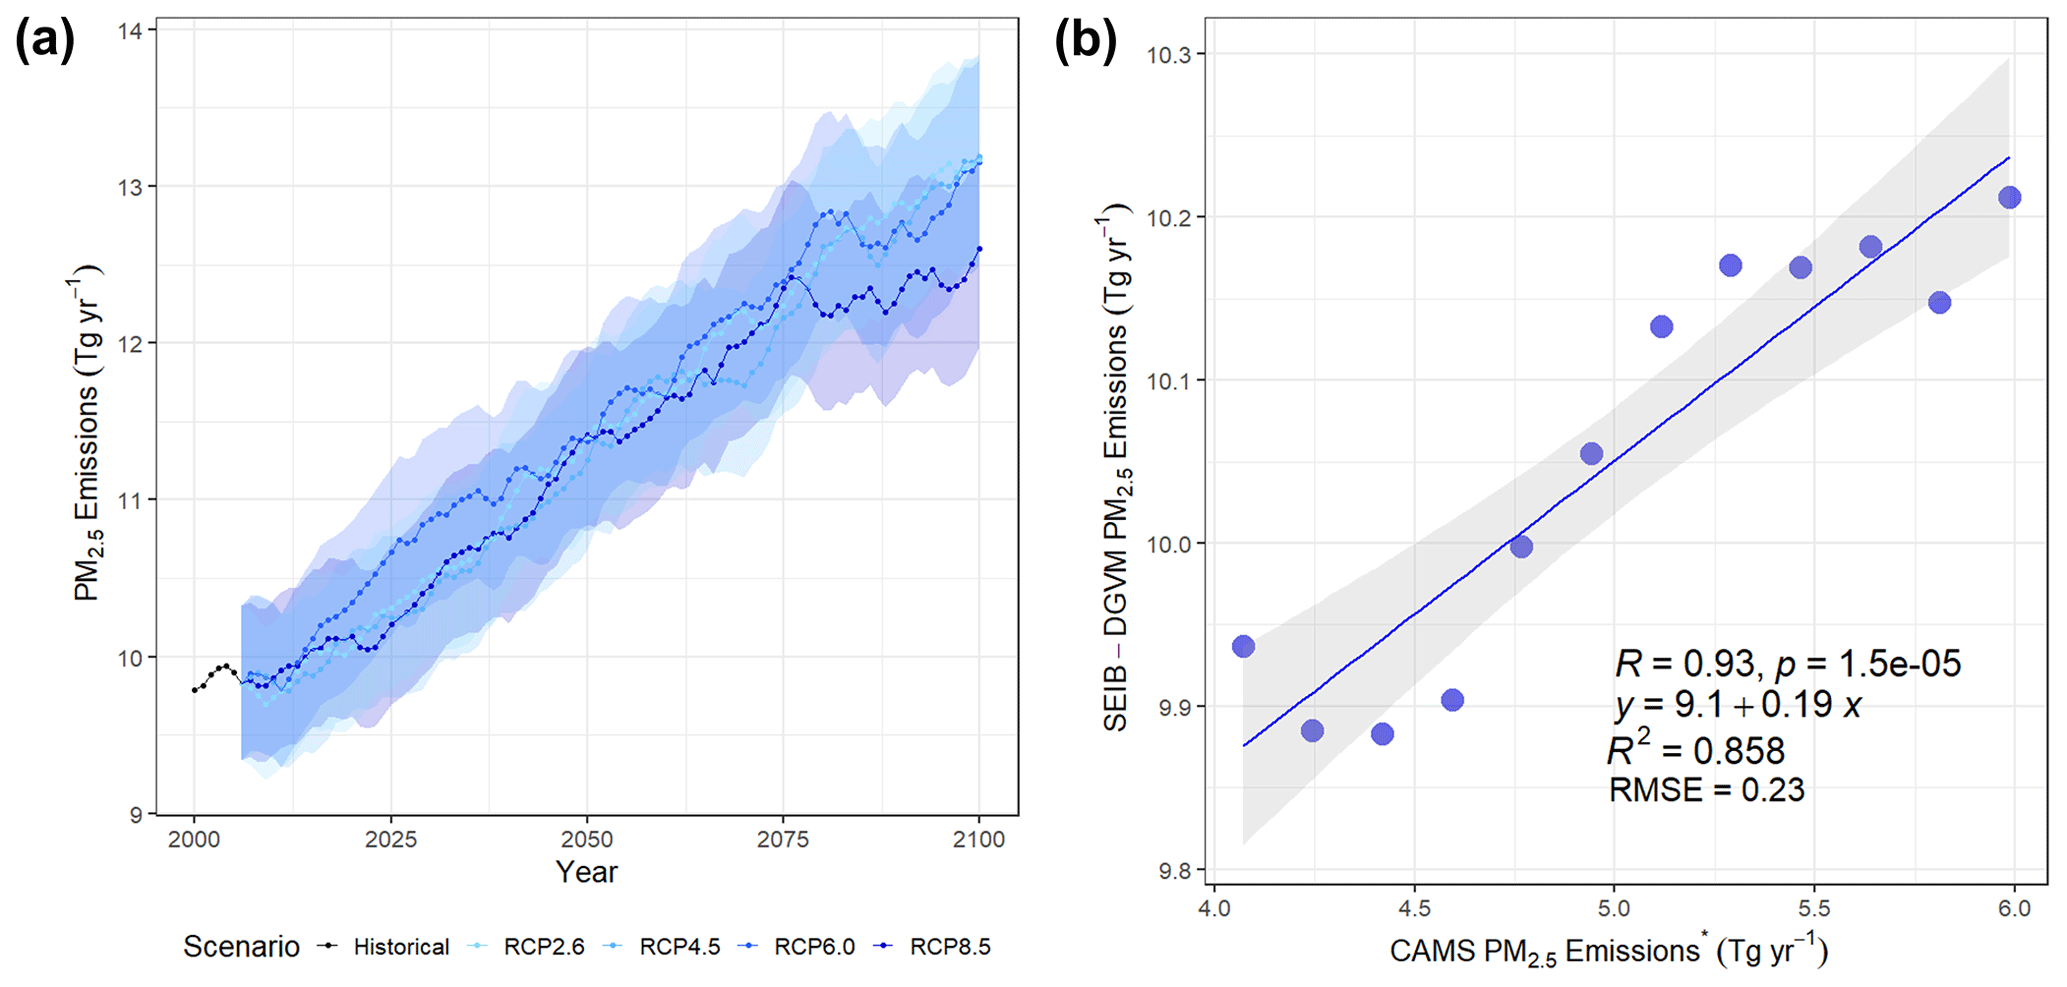
Figure 7(a) Temporal variation in projected PM2.5 emissions under several climate scenarios from 2000 to 2100. Standard deviation obtained from the annual PM2.5 emission value of each climate scenario (RCP8.5, RCP6.0, RCP4.5, and RCP2.6). (b) Comparison of PM2.5 emissions from SEIB-DGVM SPITFIRE with the trend line of processed data from the Copernicus Atmosphere Monitoring Service in seven regions in Russia from 2010 to 2021 (Romanov et al., 2022).
3.2 Burned fraction
The improved model (SEIB-DGVM SPITFIRE) produces burned-fraction variables more accurately than the default model (SEIB-DGVM GlobFIRM). A spatial comparison of the average burned-fraction variables from 1997–2016 between GFED4s, SEIB-DGVM SPITFIRE, and the default SEIB-DGVM shows that SEIB-DGVM SPITFIRE achieves a 75 % similarity with GFED4s data, whereas the default model achieves only 68 % (Fig. S5).
The burned-fraction variable in the improved model exhibited a spatial distribution pattern different from that in the default model (Fig. S4a). According to the improved model, the burned-fraction data were distributed in the west, central, and southern areas (Fig. S4b). We compared the burned-fraction variable with the lightning flash rate and population density data to confirm that the produced variable considered the new ignition factor. The burned fraction showed a 46 % correlation with the lightning flash rate and a 6 % correlation with population density between 2006 and 2100 (Fig. S7a and b). In general, the burned fraction under all the RCP scenarios exhibited an increasing trend from 2006 to 2100, with the highest value occurring under the RCP4.5 scenario. Under the RCP4.5 scenario, the lowest value was 0.01371 and the highest value was 0.01427, with an average value of 0.01398 (Fig. S4d).
In contrast to the results produced from the improved model, the burned-fraction data from the default model were spread throughout most of the area (Fig. S4a). From 2006 to 2100 under all RCP scenarios, the burned fraction in the default model also exhibited an increasing trend. Under the RCP4.5 scenario, the lowest value is 0.002996 and the highest value is 0.003113, with an average value of 0.00306 (Fig. S4c), which is well below the outputs of the improved model.
3.3 Burned area
The burned area of the improved model showed a similar spatial distribution pattern under all the RCP scenarios (Fig. S6a). The distribution pattern of the burned-area variable was also similar to that of the burned-fraction variable, as the burned-area and burned-fraction calculation processes are both based on fire probability (Eq. 1). Overall, under all the scenarios, the burned area exhibited the same increasing trend, with the RCP4.5 scenario reaching the highest value. Under the RCP4.5 scenario from 2006 to 2100, the burned area has an average value of 1945.9 ha per grid per year and is projected to increase with values of 79.7 to 83.8×10⁵ ha (Fig. S6b). Since the default model does not compute burned area, this variable could not be compared between the improved model and the default model.
3.4 Burned biomass
The improved model confirmed uniform spatial distribution patterns for the fire variables: burned fraction (Fig. S4b), burned area (Fig. S6a), and burned biomass (Fig. 8b). All of the improved module fire variables confirmed to be mutually integrated because the calculation process comes from the first fire variable (burned fraction). Compared to the improved model, the spatial distribution pattern of the burned-biomass variable from the default model was wider and spread across the entire Siberian region (Fig. 8a). The spatial distribution pattern of the burned fraction (Fig. S4a) and burned biomass (Fig. 8a) in the default model is different and exhibited a box-like pattern in the center of the map. The internal model calculation flow relationship between the burned-fraction and burned-biomass variables in both the default and improved models shows a positive linear correlation, indicating harmony between these variables. A higher burned fraction corresponds to a higher burned biomass. The default model (SEIB-DGVM GlobFIRM) has an R2 value of 0.83, while the improved model (SEIB-DGVM SPITFIRE) demonstrates better integration, with an R2 value of 0.93 (Fig. S8a and d). Under all RCP scenarios from 2006 to 2100, the burned-biomass variable in both the default and improved models exhibited an increasing trend (Fig. 8c and d). This indicates correct integration between the burned-fraction and burned-area variables and an appropriate response to the climate input data. Furthermore, under the RCP6.0 climate scenario from 2000 to 2100, the burned-biomass value in the default model increases from 50.4 to 60.6 kg DM m−2 (Fig. 8dc), while in the improved model it increases from 53 to 73.98 kg DM m−2 (Fig. 8d). The 20-year variations and their trends of dry-matter emissions up to 2100 in the improved model (SEIB-DGVM SPITFIRE) are 55.90±1.31 (10.5 %), 60.52±1.12 (11.4 %), 64.43±1.36 (12.1 %), 69.23±1.37 (13 %), and 71.81±0.94 (13.5 %) (Fig. S32).
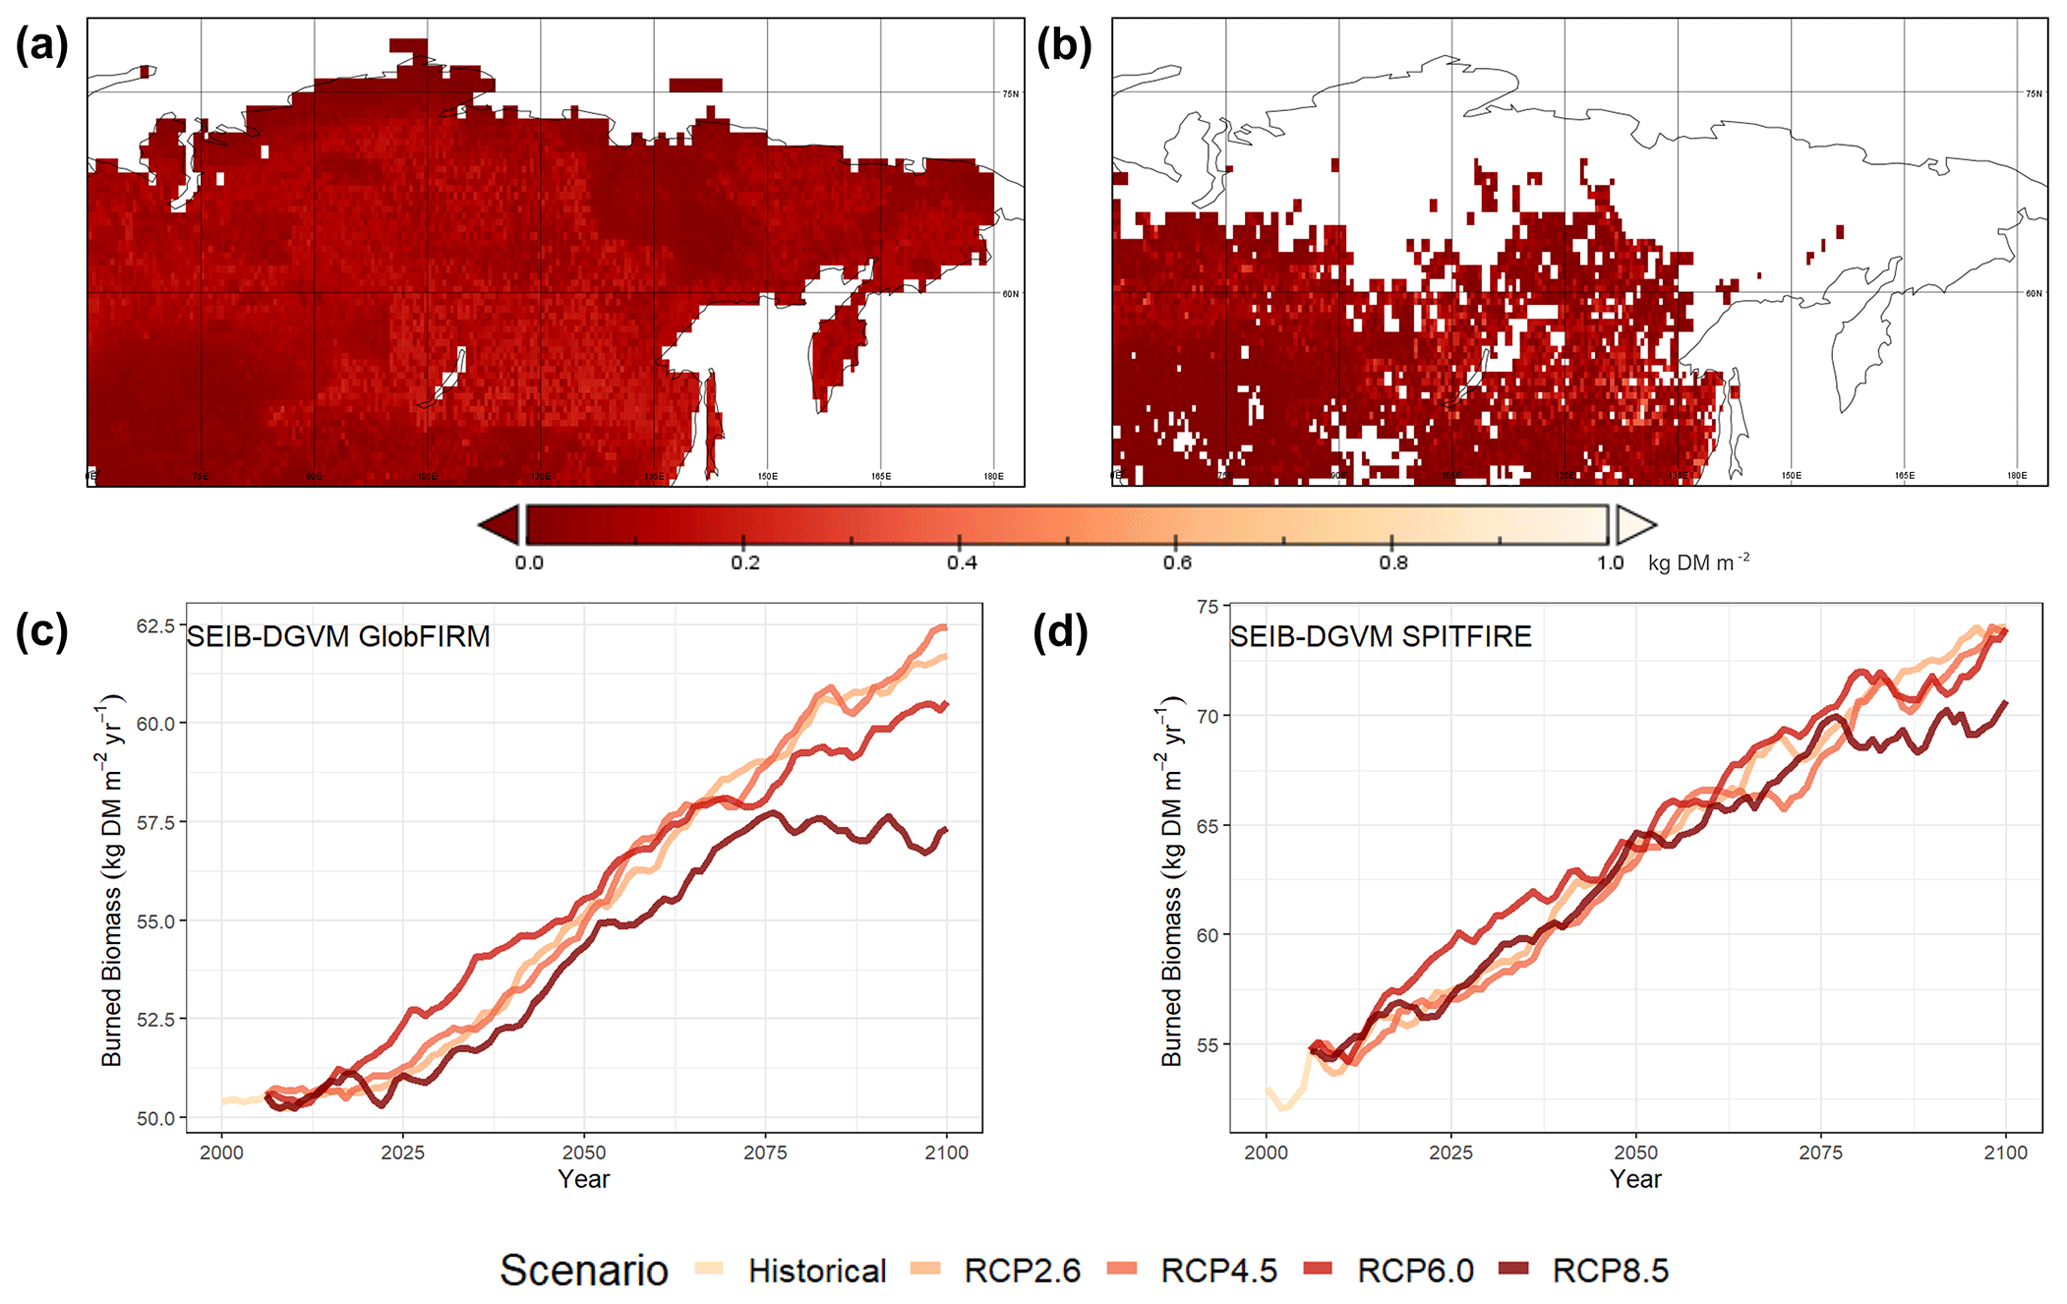
Figure 8(a) Spatial distribution of annual average burned biomass from SEIB-DGVM GlobFIRM from 2000 to 2100. (b) Spatial distribution of annual average burned biomass from SEIB-DGVM SPITFIRE from 2000 to 2100. (c) Temporal variation in annual average burned biomass from SEIB-DGVM GlobFIRM from 2000 to 2100. (d) Temporal variation in annual average burned biomass from SEIB-DGVM SPITFIRE from 2000 to 2100.
3.5 Aboveground biomass
The aboveground biomass calculations in the default model and improved model used the same estimation process because the trunk biomass in SEIB-DGVM included coarse-root biomass; therefore, only approximately two-thirds of the trunk biomass was classified as aboveground biomass (Sato et al., 2007). However, during the calibration of the aboveground biomass variable with the ESA Biomass CCI benchmark dataset, we adjusted the calculation impact of fire and its distribution pattern (based on natural- and anthropogenic-ignition factors) on the availability of aboveground biomass.
According to the default model, the AGB distribution pattern appears to be the same as that of the fire variable; a box-like pattern still occurs on the map (Fig. 9a). Under the RCP8.5 scenario, from 2000 to 2100, the AGB increased from 63.72 to 120.1 Mg DM ha−1 and the average value was 86.3 Mg DM ha−1 (Fig. 9c). The aboveground biomass (AGB) variables in both the default and improved models exhibit an increasing trend and vary across RCP scenarios, with the highest values observed under RCP8.5 and the lowest under RCP2.6. This indicates that the models effectively read and process the RCP input climate data.
Compared to the default model, the improved AGB model has distribution patterns that are a bit different (Fig. 9b). In the central region of Siberia, some locations that have high AGB have been reduced due to the impact of forest fires so that the box-like pattern is no longer visible (Fig. 9b). The temporal variation in aboveground biomass in the improved model also shows an increasing trend due to the warming scenario of each RCP climate data input. The AGB under the RCP8.5 scenario from 2000 to 2100 increased from 59.08 to 126.7 Mg DM ha−1 (Fig. 9d), and the mean was 88.68 Mg DM ha−1. The 20-year variations and their trends of aboveground biomass up to 2100 are 65.45±1.19 (10.8 %), 71.69±2.90 (11.8 %), 83.38±3.61 (13.7 %), 99.17±5.06 (16.3 %), and 117.92±5.41 (19.4 %) (Fig. S33).
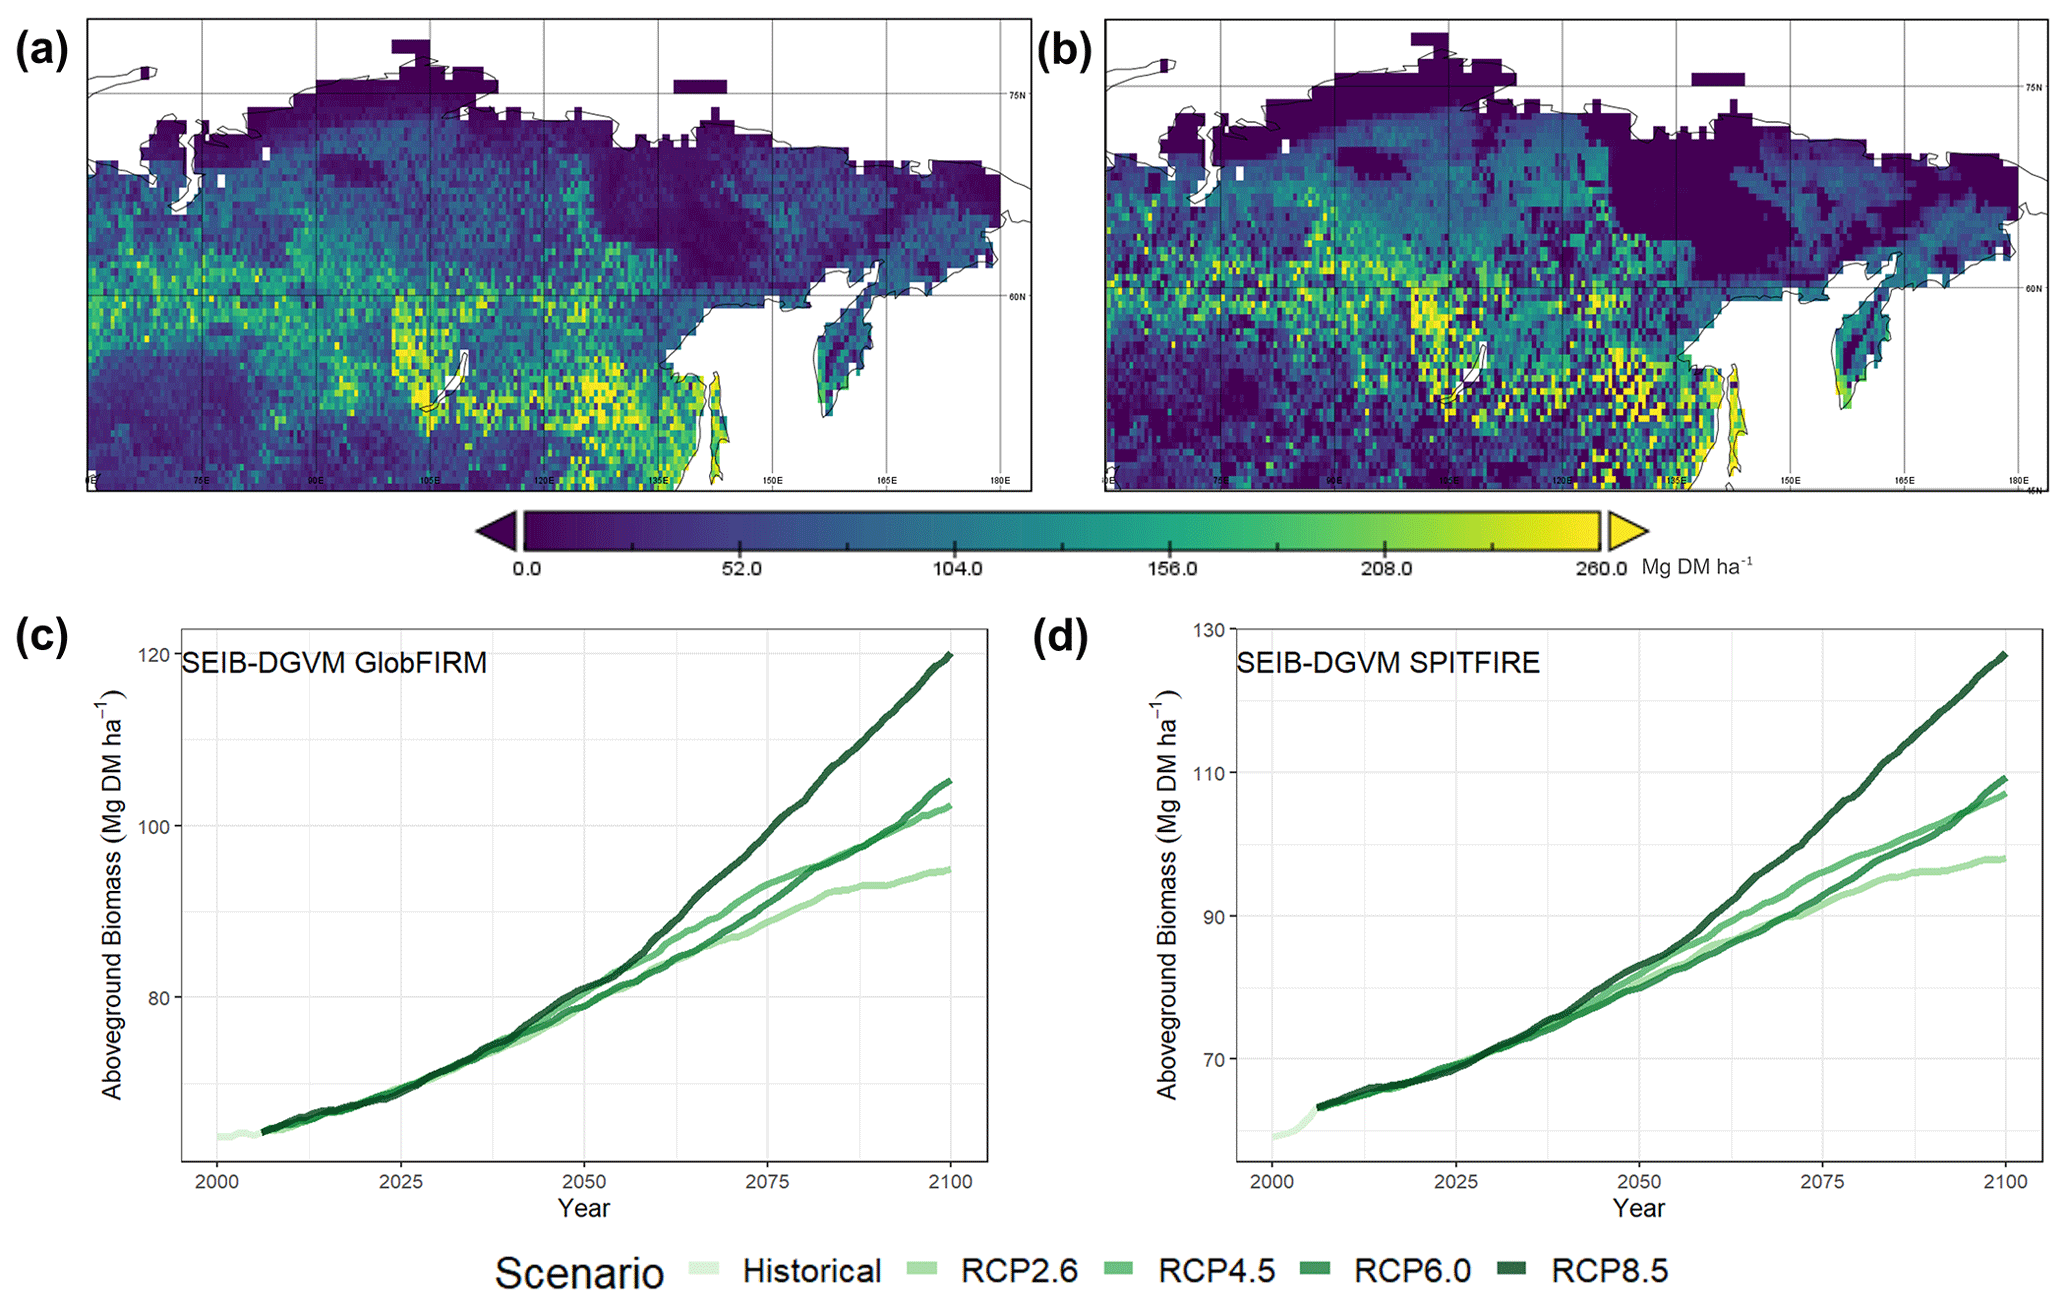
Figure 9(a) Spatial distribution of annual average aboveground biomass from SEIB-DGVM GlobFIRM from 2000 to 2100. (b) Spatial distribution of annual average aboveground biomass from SEIB-DGVM SPITFIRE from 2000 to 2100. (c) Temporal variation in aboveground biomass from SEIB-DGVM GlobFIRM from 2000 to 2100. (d) Temporal variation in aboveground biomass from SEIB-DGVM SPITFIRE from 2000 to 2100.
3.6 Forest ecological variables under fire-on and fire-off simulations
We conducted complete simulations under fire-on and fire-off modes to compare and assess vegetation dynamics during forest fires. Assessing vegetation dynamics can be done by understanding the carbon pools in the certain region or globally, where carbon pools are easier to measure than carbon fluxes. In this study, the net primary production (NPP) is used as a reference variable because it is an important metric of the global carbon cycle (Running, 2022) and measures the rate of global plant growth. We obtained the NPP loss variable due to wildfire from fire-on and fire-off simulations. The NPP loss variable under all RCP scenarios shows an increasing trend. Under the RCP8.5 scenario, an average NPP loss of 385.19±40.4 g C m−2 yr−1 occurred during 2000–2100 (Fig. S25a). In addition to the NPP variable, the improved model (SEIB-DGVM SPITFIRE) can also simulate net biome production (NBP). Under the same RCP8.5 scenario, the annual average NBP from 2000–2100 shows a positive value of 307.7±43 Tg C yr−1 (Fig. S25b), with a continuous increasing trend.
In relation to wildfires, assessing pre- and post-fire tree density variables is critical for measuring the impact of fires. Under the RCP8.5 scenario, in the fire-on simulation from 1997 to 2100, it is projected that the tree density in Siberia was 2181 trees ha−1. However, under the same RCP and time range in the fire-off simulation, the tree density was 2363 trees ha−1. We also compared the tree density between the fire-on and fire-off simulations under all the RCP scenarios and found that the tree density increased in the fire-off simulations compared to that in the fire-on simulations. Under the RCP8.5 scenario, on average, 174 trees ha−1 yr−1 died due to the fire (Fig. S25c).
We also conducted a more detailed assessment of several forest structure variables, such as the tree diameter at breast height (DBH), crown area, and tree height, from 2006 to 2100 under all the RCP scenarios. Under the RCP8.5 scenario, in the fire-on simulation, the results showed that tree DBH values varied from 0 to 4.7 m (average of 0.9 m), tree height varied from 0 to 75.4 m (average of 24.2 m), and crown area varied from 0 to 15.1 m2 (average of 5.7 m2). The average tree structure in the fire-off simulation was greater than that in the fire-on simulation, with an average tree DBH, tree height, and crown area of 0.97 m, 24.1 m, and 6.5 m2, respectively. The correlations between the tree structure variables under fire-on and fire-off simulation conditions were similar and highly correlated; the overall average correlation among the tree DBH, tree height, and crown area variables was 97 % (Fig. 10). Specifically, according to region classification, from the highest to the lowest, the values of tree height, tree DBH, and crown area are in the west region, central region, and east region. On average for 2081–2100 under RCP8.5 in each region, the tree height, tree DBH, and crown area variables show values of 28.43±0.8 m, 1.1±0.004 m, and 5.7±0.01 m2 (west region); 28.3±0.9 m, 1.2±0.04 m, and 7.8±0.08 m2 (central region); and 30.2±1.0 m, 1.2±0.06 m, and 8.5±0.2 m2 (east region) (Figs. S37, S38, and S39). Furthermore, we found an interesting pattern; the simulated tree allometry variables (tree height, tree DBH, and crown area) in the east region of Siberia exhibit a greater range of values compared to those in the central and west regions of Siberia (Figs. S37, S38, and S39). Overall, all tree allometry variables in Siberia exhibit an increasing trend, and the differences between fire-on and fire-off simulations for all tree allometry variables are most pronounced in the east region of Siberia.
In addition, the relationship between the three variables (tree height, tree DBH, and crown area) in the west region and central region shows a linear trend where the higher the tree height, the greater the tree DBH and the wider the crown area (Fig. 11). The east region shows an interesting pattern, different from other regions, where there is low tree height (Fig. 11c). The west and central regions of Siberia exhibit a greater range of tree height values compared to the east region of Siberia (Fig. 11a and b). An interesting pattern was observed in the west region of Siberia, where trees with high tree height and a large DBH but low crown area were detected in some locations (Fig. 11a).
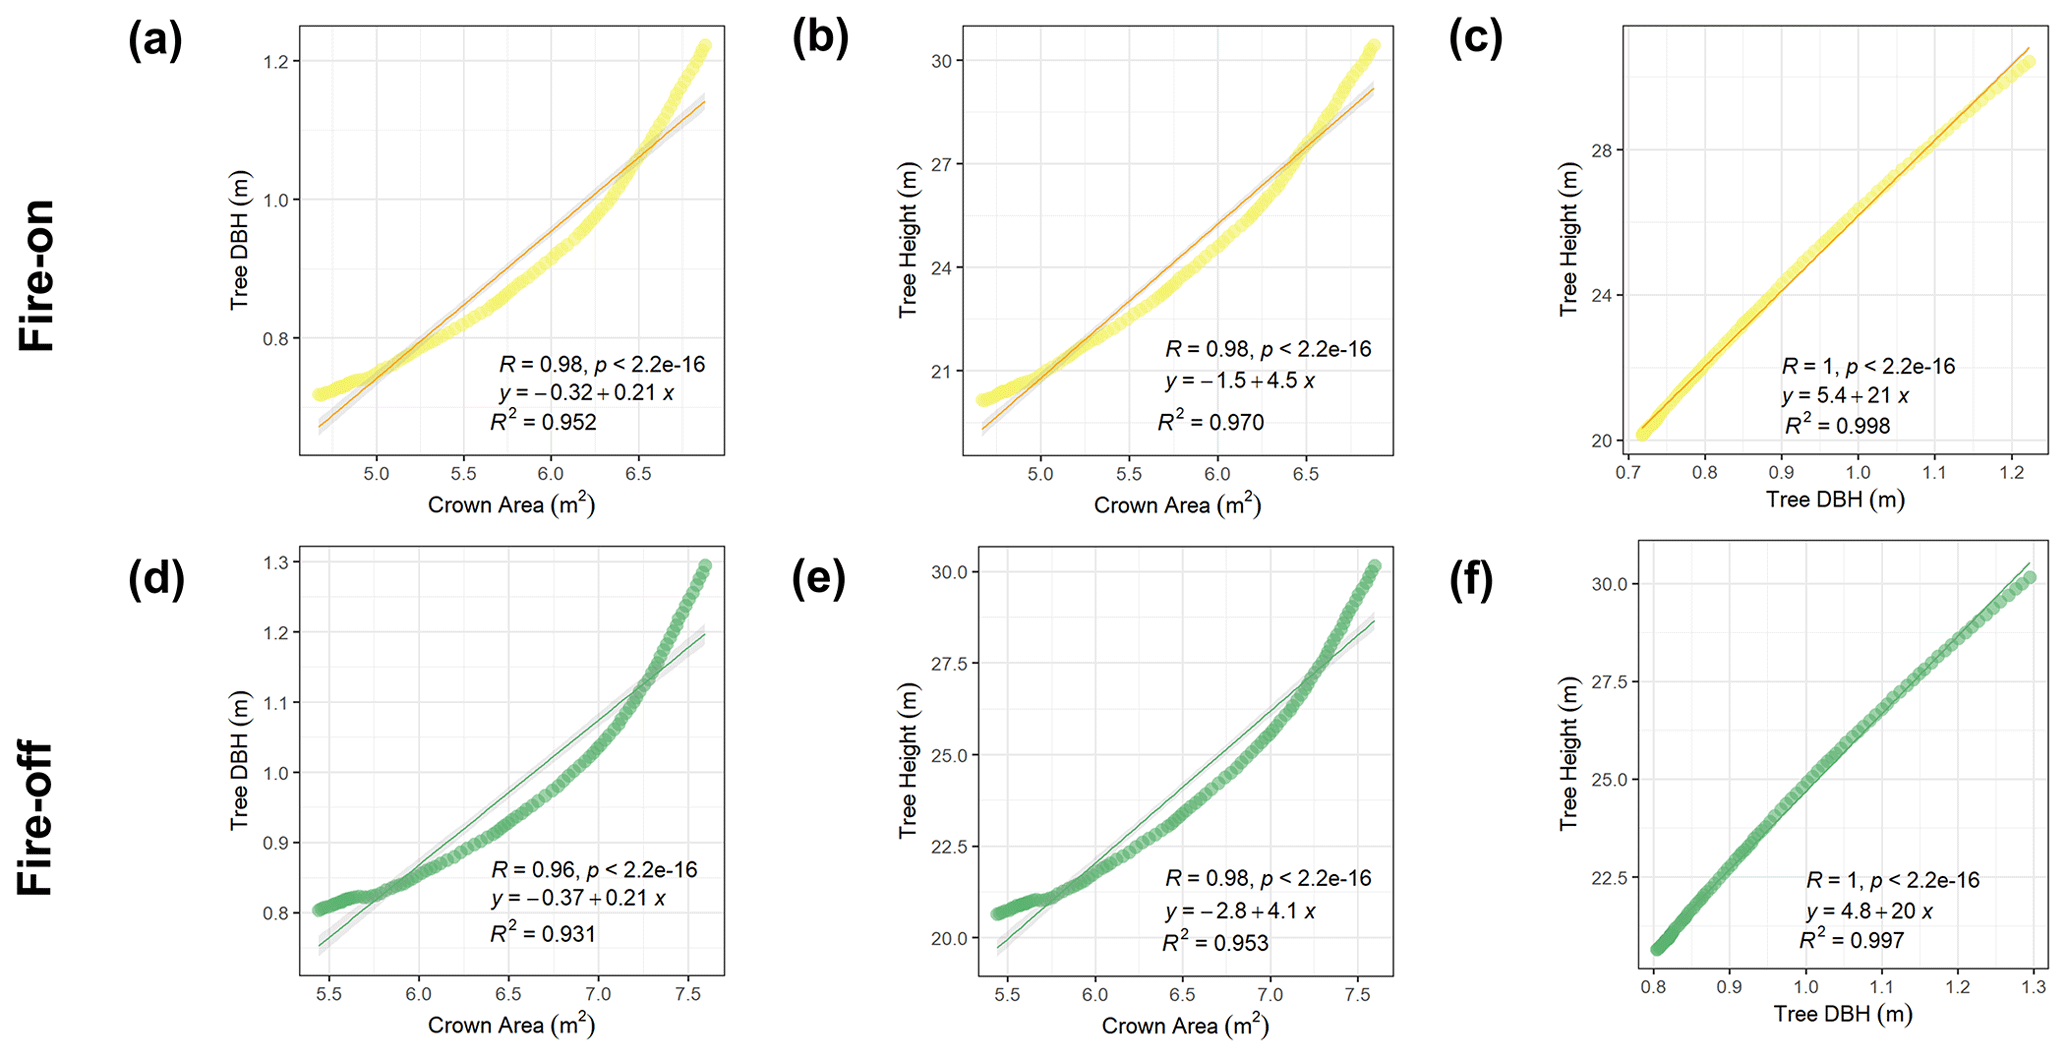
Figure 10Annual average comparison of tree DBH, tree height, and crown area variables in (a–c) fire-on and (d–f) fire-off simulations (2006–2100). Each point represents one grid latitude average of each variable.
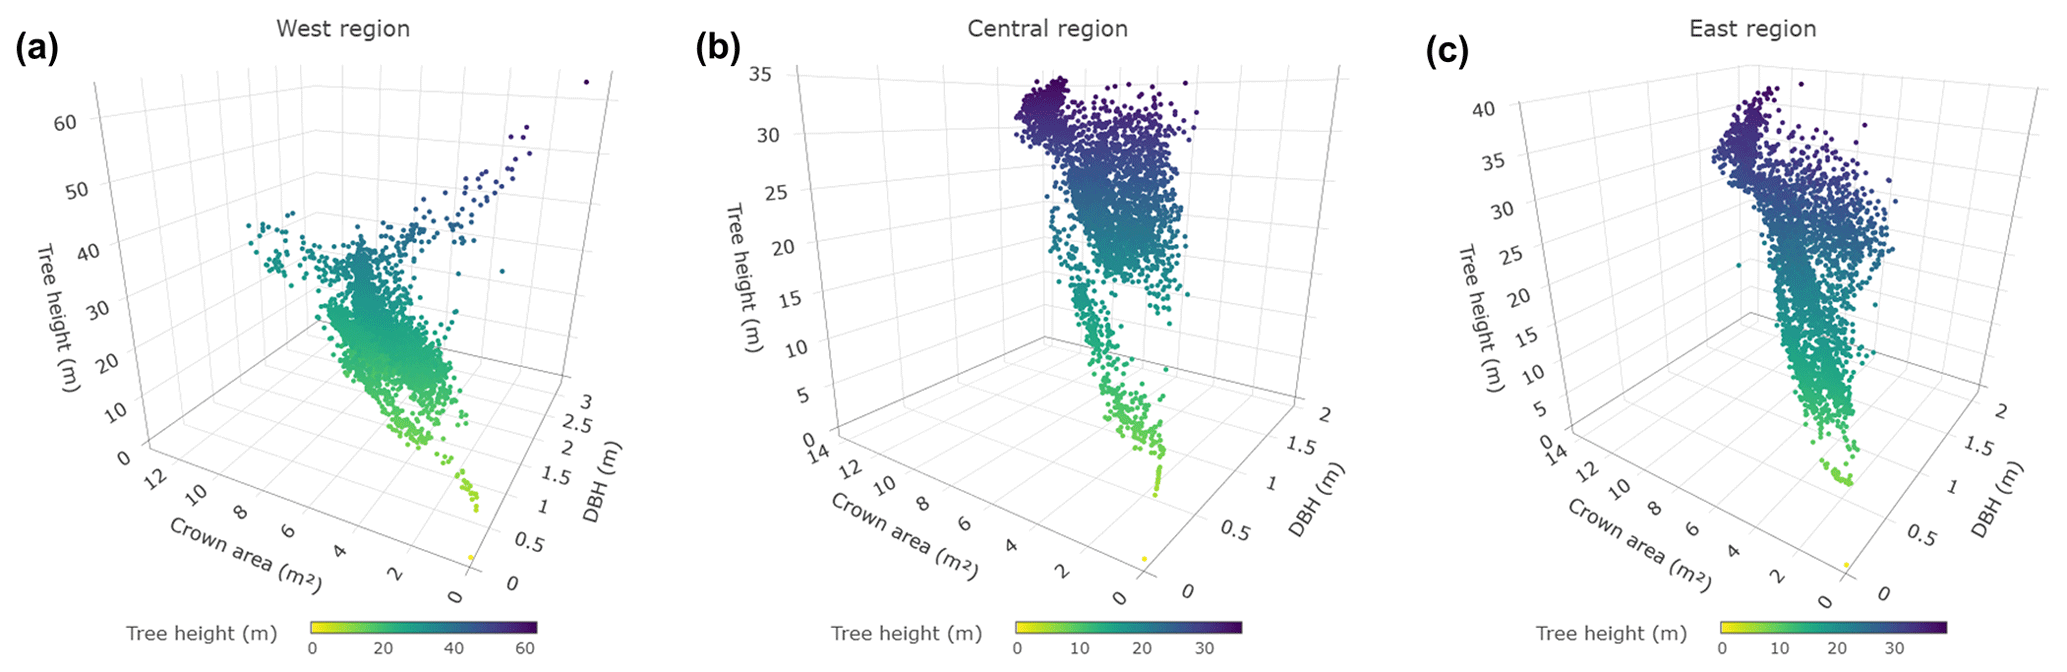
Figure 11Relationships between simulated tree height, tree DBH, and crown area under the fire-on simulation and RCP8.5 scenario from 2000 to 2100 in the (a) west region, (b) central region, and (c) east region of Siberia.
3.7 Fire and AGB variable comparisons
We performed internal comparisons of fire and AGB variables within the improved model to ensure that the model worked properly and that the variable calculation processes were interrelated. The east region of Siberia had low fire patterns (Fig. S23), and, when compared with the AGB, this area also had very low AGB. We extracted the AGB data in the marked area with coordinates of 130–142° E, 65–80° N and discovered that the average simulated aboveground biomass in the area was 65.59 g C m−2 from 1997 to 2023, compared to 416.4 g C m−2 in the one-grid high-AGB areas. Furthermore, we assessed the fire danger index (FDI) variable in these low AGB areas and found that the mentioned region had a value of 0, indicating that it had a very low fire potential (Fig. S24a).
We also compared the fire variables (burned fraction, burned biomass) and AGB variables between the improved model and the default model. According to the default model, the correlation between the burned fraction and burned biomass was 0.83, the correlation between the burned fraction and AGB was 0.82, and the correlation between burned biomass and the AGB was 0.88 (Fig. S8a–c). According to the improved model, the correlation between the burned fraction and burned biomass was 0.93, the correlation between the burned fraction and AGB was 0.96, and the correlation between burned biomass and the AGB was 0.9 (Fig. S8d–f). Overall, both the default and improved models are well integrated, with the improved model demonstrating superior integration compared to the default model.
3.8 Future projection of burned-biomass emissions
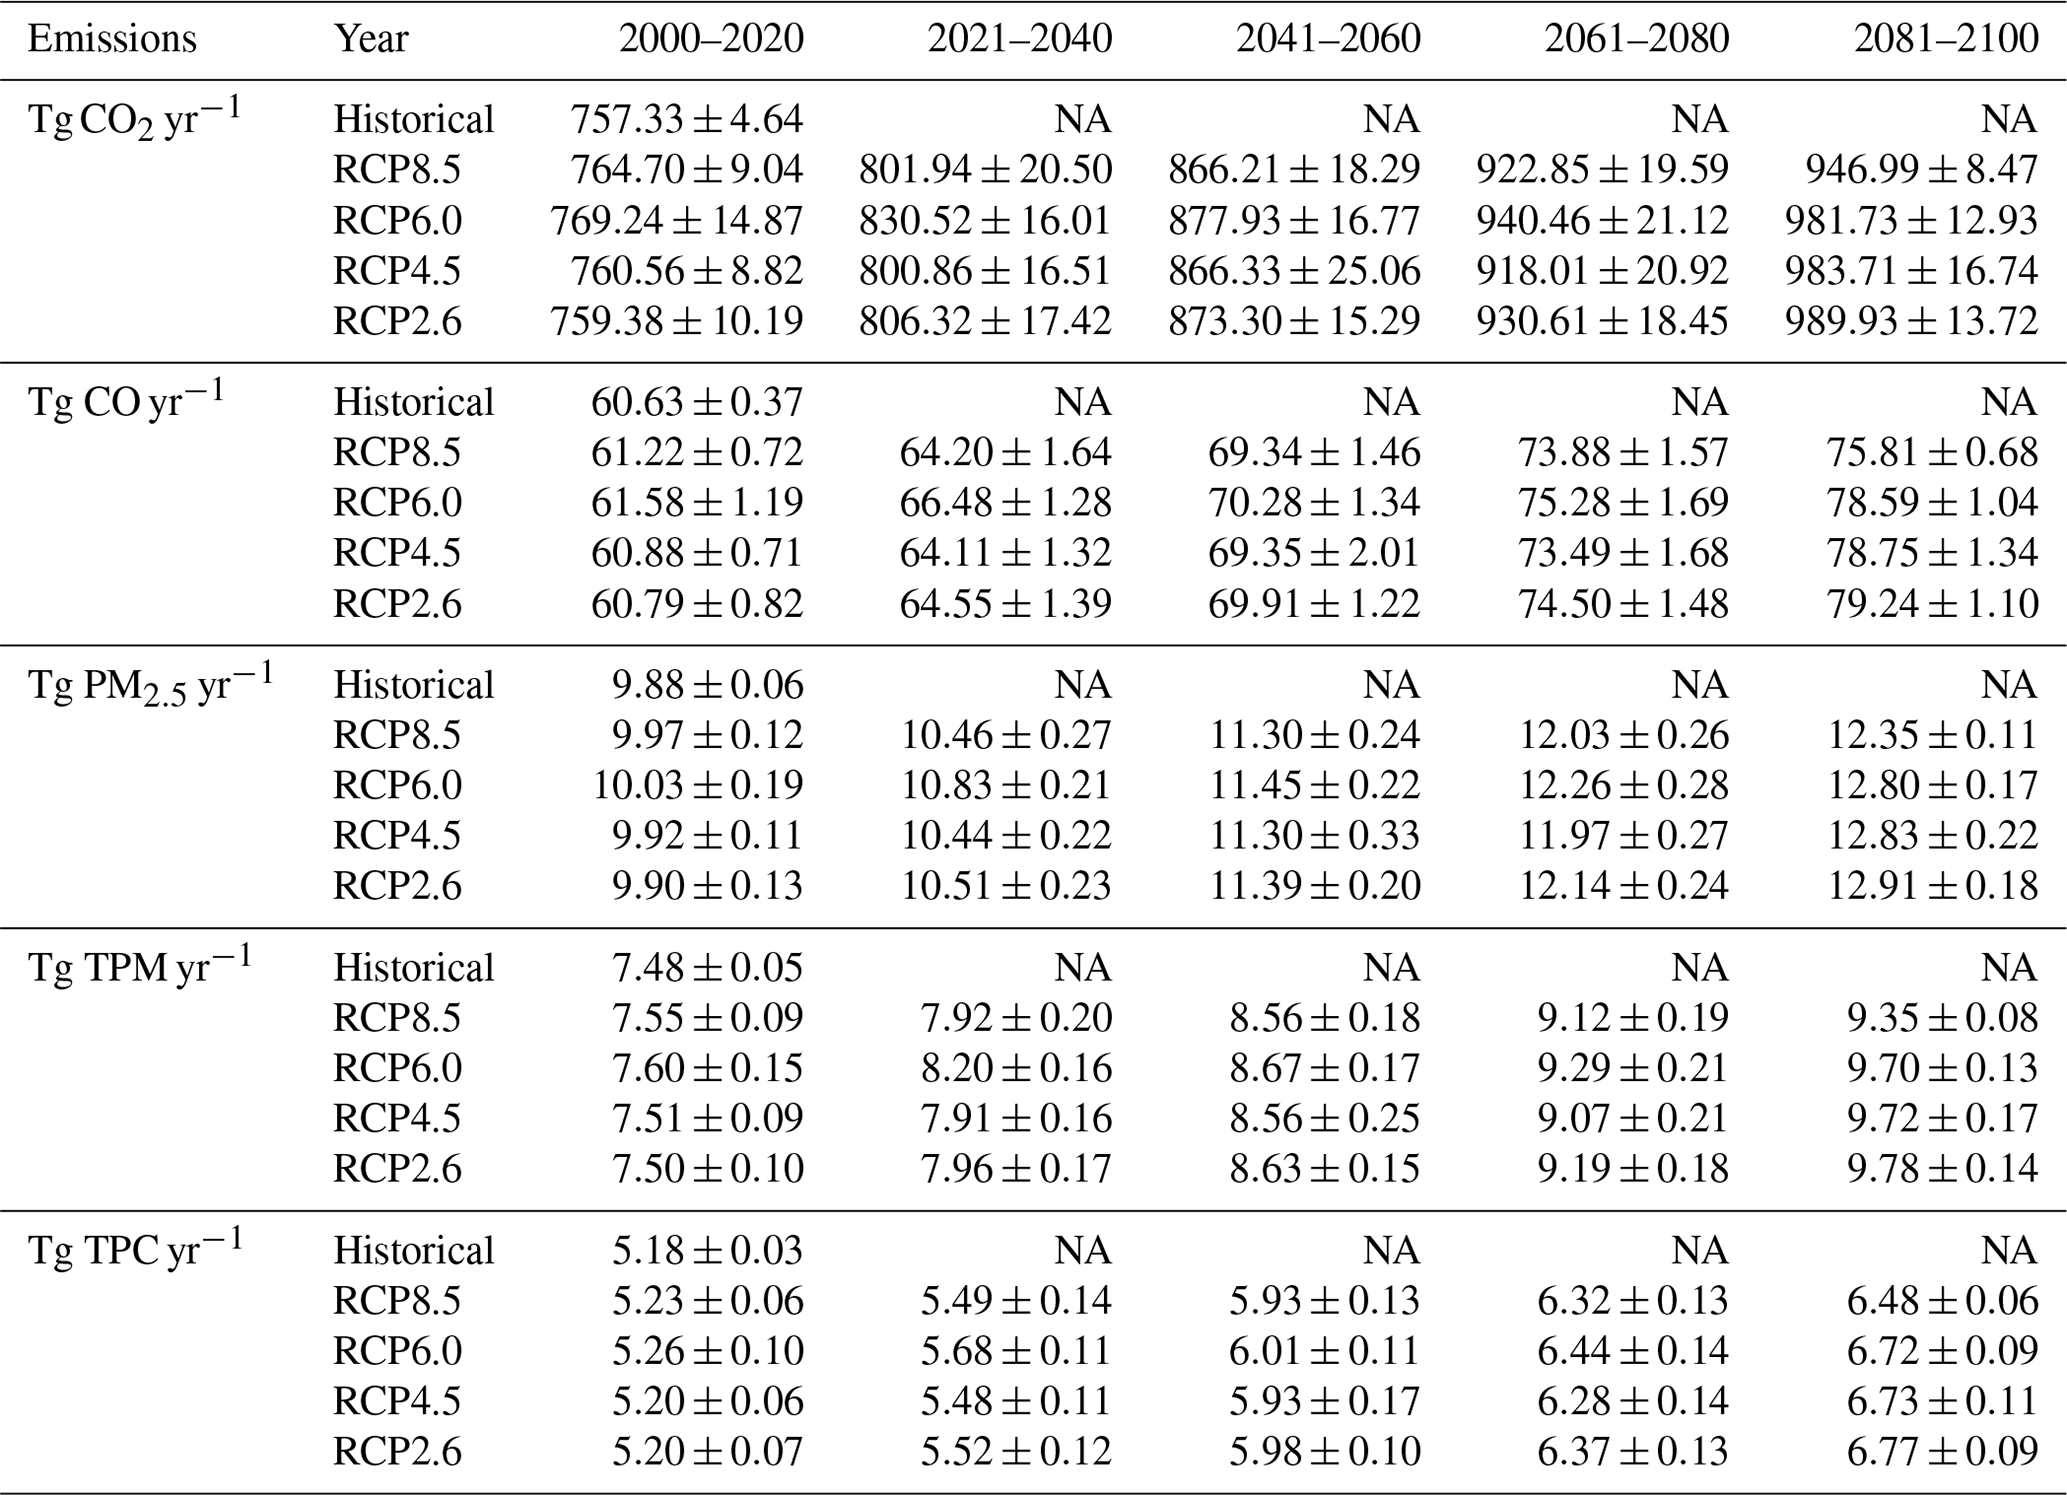
Our model projects that from 2000 to 2100, regions in Siberia will produce CO2 emissions ranging from 10 to 11 000×108 g CO2 yr−1 (Fig. 12). The distribution patterns of CO2 and other emissions are similar because all emissions are calculated based on the same variable dry-matter emissions. Over the 20-year period, we projected an increasing trend in CO2 emissions across the various RCP scenarios, which aligns with the projected increase in forest fires through 2100.
The average from 2000 to 2100 shows that CO2 emissions are highest under the RCP6.0, RCP2.6, RCP4.5, and RCP8.5 scenarios, with values of 885.8±75.4, 877.82±82.6, 871.4±80.6, and 865.5±69.6 Tg CO2, respectively. Specifically, under the RCP6.0 scenario, the highest projected emissions are expected in the periods 2021–2040, 2041–2060, 2061–2080, and 2081–2100, with Siberia producing CO2 emissions of 769.24±14.37, 830.52±15.61, 877.93±16.34, 940.46±20.59, and 981.73±12.61 Tg CO2, respectively (Fig. 13).
The gaseous species with the highest emissions were CO2, CO, PM2.5, TPM, and TPC, and all of them exhibited similar increasing trends from 2000 to 2100 under all RCP scenarios. Under the RCP6.0 scenario, these emissions are expected to increase by 2.58±0.75, 0.21±0.06, 0.03±0.01, 0.02±0.01, and 0.014±0.006 Tg species yr−1, respectively. The increasing trend of emission production until 2100 is also in line with the FDI variable, which shows the same increasing trend (Fig. S24b). Overall, by 2100, under the RCP6.0 scenario, the production of CO2, CO, PM2.5, TPM, and TPC emissions from forest biomass-burning combustion is projected to reach 1009.00±75.44, 80.74±6.04, 12.60±0.91, 9.54±0.69, and 6.61±0.48 Tg, respectively. The 20-year averages of the CO2, CO, PM2.5, TPM, and TPC emission data under all the RCP scenarios are provided in Table 4, and the other 28 emissions are provided in Table S6.
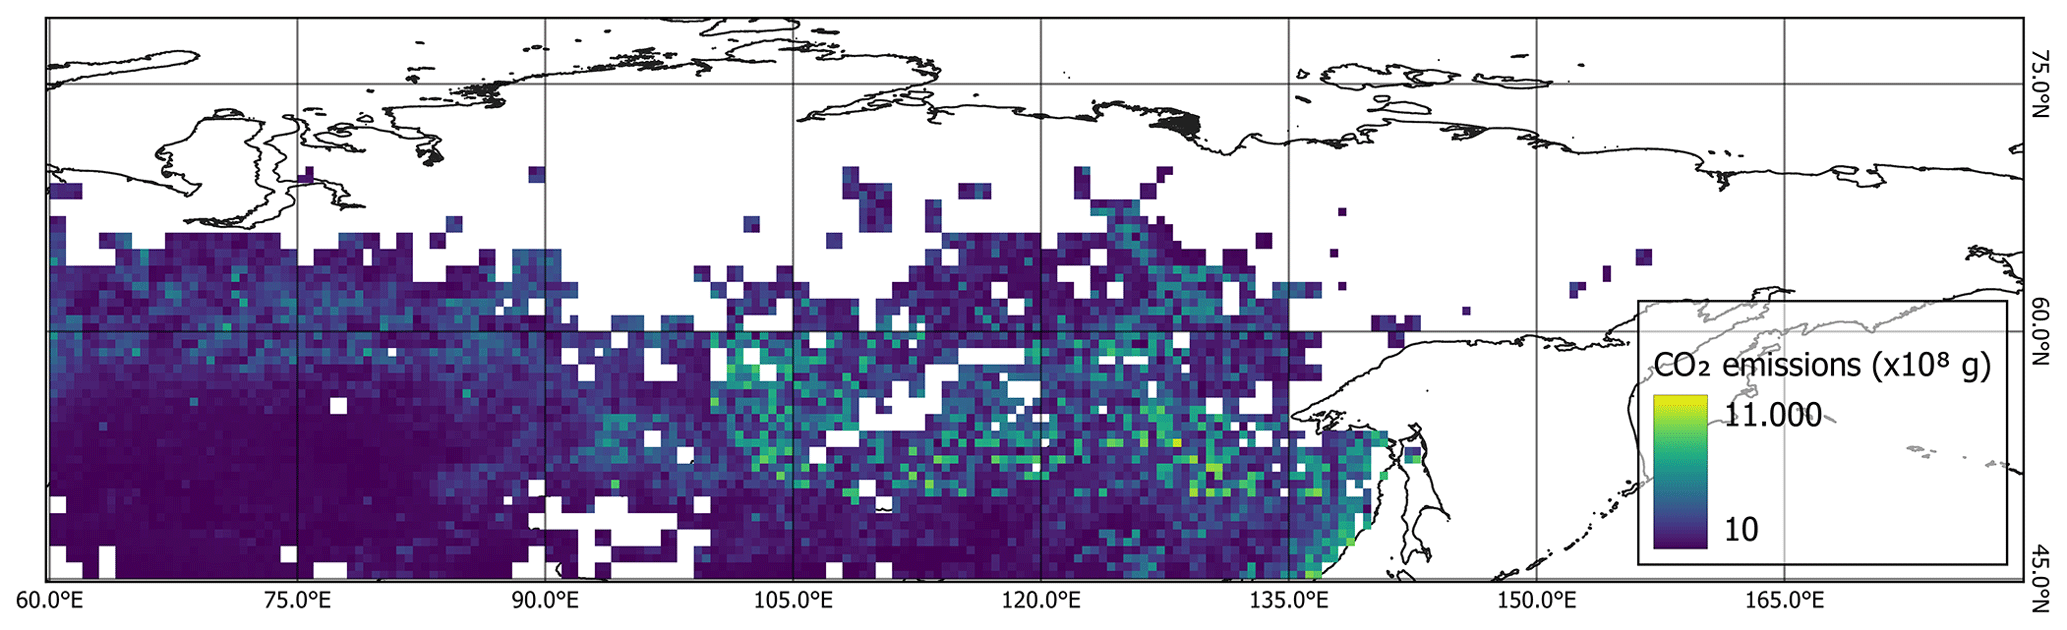
Figure 12Spatial distribution of annual average projected CO2 emissions (2000–2100) under the RCP8.5 scenario.
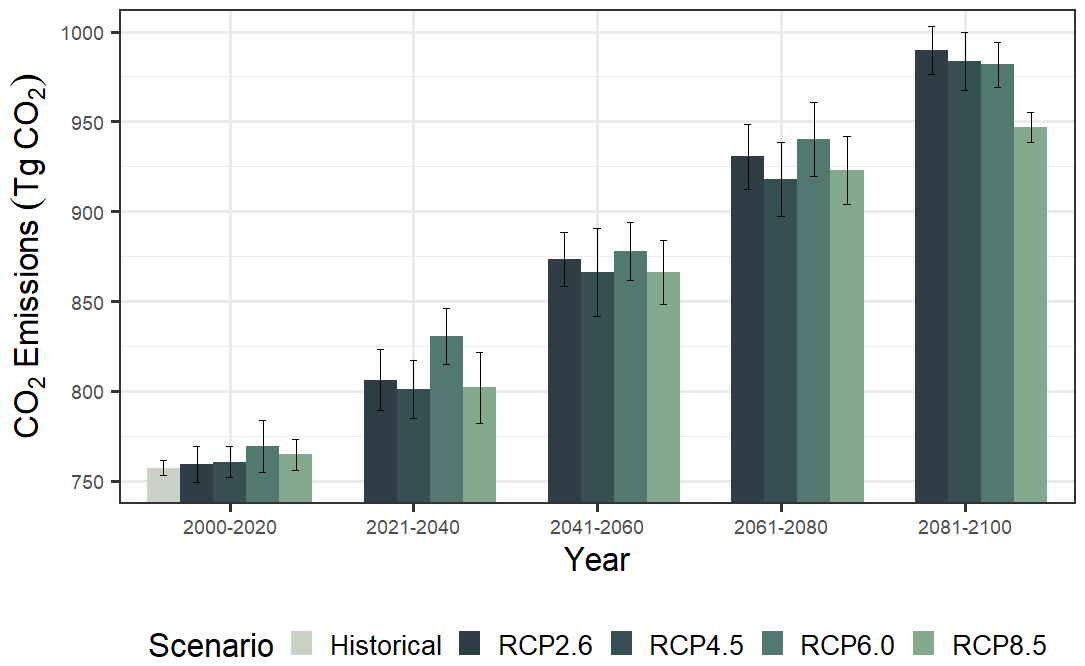
Figure 13Temporal variation in projected CO2 emissions from 2000 to 2100 under different RCPs scenarios.
Table 4The 20-year average (±2 standard deviations) of projected emissions of CO2, CO, PM2.5, TPM, and TPC species from forest fires in Siberia (2023–2100). The emissions of the remaining 28 species are listed in Table S6. NA – not available.
4.1 Feasibility of fire simulation
According to the default module, the fires spread throughout almost all of Siberia (Figs. S4a, 8a) because the module considered only the fuel amount and fuel moisture content. Thus, if the fuel load met the threshold requirement in any random grid, a fire appeared and could spread to other areas. Furthermore, the spatial distribution and trend of burned biomass under all of the RCP scenarios in the default fire module were not consistent with the burned-fraction data. Areas with high burned-fraction values should also have high values of burned biomass and vice versa.
However, in the improved module, the fires ignited only in areas that were covered in the lightning ignition and population ignition datasets based on the calculation of each ignition factor. This is confirmed by the comparison of the fire variable with the ignition factor variables. The comparison of the burned-fraction variable with the lightning flash strikes variable shows a strong correlation of 0.68 (R2=0.45), and the comparison of the burned-fraction variable with the population density variable shows a correlation of 0.24 (R2=0.06) (Fig. S7). These relatively low correlation values are due to the fact that the presence of an ignition factor does not guarantee that a fire will start; the area needs to have sufficient dry litter to feed the fire. Apart from these variables in the improved model, other factors also influence fire occurrence and spread in real life, such as slope and solar aspect (Rothermell, 1972), but their inclusion at this point was not possible due to the limitations of the model. In addition, when comparing the fire and AGB distributions, SEIB-DGVM SPITFIRE showed greater agreement than the default fire module.
However, differences remained between the spatial distribution patterns of the simulated fires and the GFED4s data in the east region of Siberia. We believe that the main reason for the lack of simulated fires in the east region of Siberia was the scarcity of available fuel and biomass for the ignition and spread of fires. We found that the AGB in these areas (130–142° E, 65–80° N; Fig. S23) was very low, averaging 65.59 g C m−2. This value was far below the model minimum fuel load threshold requirement of 200 g C m−2 (Sato et al., 2007) for fire ignition or spread. All three benchmark datasets, ESA Biomass CCI (aboveground biomass), GFED4 (burned area), and GFED4s (burned fraction), indicate that fire is present in this area, with ESA Biomass CCI showing an AGB of 2309.67 g DM m−2. It is challenging to produce a model product that precisely predicts observations, as the simulations are highly dependent on the input data and dynamics, while the benchmark datasets were obtained from satellite image estimations that are able to capture natural conditions and events in real time. Even predictions based on satellite observations can differ significantly from field-based observations. For example, the International Forest Fire News (IFFN) for the Russian Federation reported that 2003 had extremely severe fires in Siberia based both on ground and aerial observation. However, the burned area was determined to be 2 654 000 ha based on field observations and 17 406 900 ha based on satellite-derived observations (NOAA AVHRR, Advanced Very High Resolution Radiometer) (IFFN, 2003; Siegert and Huang, 2005). The difference between ground observation data and satellite-derived data is due to differences in the data collection time and continuity. Ground-based observations are carried out only for a short time due to technical difficulties, while observations based on satellite data are carried out without any significant difficulties (IFFN, 2003). In this case, SEIB-DGVM SPITFIRE reported a burned area of 7 969 785 ha, an estimation centered between the observational and satellite data.
Overall, based on the fire variable outputs (burned fraction and burned area) from the improved model generated and validated with benchmark data, we project that Siberia will have an increasing trend until 2100 (Fig. S4d, S6b, and 8d). Yasunari et al. (2024) in a comprehensive assessment of the impacts of the Siberian wildfire using MIROC5 stated that there is high probability of increased Siberian wildfires in the future, and this estimate implies that worse air quality due to wildfires is predicted in the future, with frequent exceedances of air quality environmental standards (ESs).
Kasischke and Bruhwiler (2003) stated that the level of uncertainty in the burned-area parameter for estimating fire emissions in the Russian boreal forest is ±30 % for satellite imagery, while the uncertainty in the parameter is −300 % according to official government statistics, resulting in fires being largely underestimated. This difference in uncertainty was caused by the diverse parameters and equations used for estimation; the varying levels of detail of the analysis; and other factors, such as forest type, location, fuel load, fire type, and aboveground biomass density. Differences are also extrapolated when estimations for large areas are based on individual fires (Kasischke and Bruhwiler, 2003; Kukavskaya et al., 2013). Therefore, uncertainties will inevitably persist in model- or simulation-based research when comparing model- or simulation-based data with direct observations.
4.2 Forest resilience under fire and climate change
Terrestrial NPP is an essential element of the carbon cycle and global climate dynamics, as it directly affects the CO2 content of the atmosphere, resulting in delayed climatic changes (Running, 2022). If NPP decreases, the land's ability to absorb CO2 will decrease, causing atmospheric CO2 to increase faster and thereby contributing to climate change (Running, 2022). Based on the comparison between the fire-on and fire-off simulation, under the RCP8.5 scenario, from 2000 to 2100 the NPP will decrease by 385.11±40.4 g C m−2 (5.03±1.5 g C m−2 yr−1) due to wildfires until 2100. Satellite observations 1 year after boreal forest fires in Alaska and Canada recorded a 60–260 g C m−2 loss of NPP (Hicke et al., 2003). In the coniferous forests of the western United States, post-fire NPP loss was also recorded and ranged from 67 to 312 g C m−2 yr−1 (Sparks et al., 2018). These data indicate that the NPP simulation results of SEIB-DGVM SPITFIRE are also consistent with some observational data in different areas.
NPP and NBP are both significant elements of the global C cycle and are used as indicators of ecosystem function and are linked to biodiversity, biogeochemical cycling, ecosystem resilience, and other aspects of ecosystem services (Pan et al., 2011; Richmond et al., 2007; Ito, 2011). However specifically, the mitigation ability of ecosystems is determined by net biome productivity (NBP) (Chapin et al., 2006; Fisher et al., 2014), and climate-driven large anomalies in NBP could impact the structure, composition, and function of terrestrial ecosystems (Frank et al., 2015). The 20-year average NBP from 2000–2100 shows a carbon sink in Siberia with an increasing trend (Fig. S34). Overall, from 2000 to 2100, RCP8.5 produces the highest value, followed by RCP6.0, RCP4.5, and RCP2.6, with values of 304.61±11.77, 286.78±10.64, 286.17±10.99, and 274.95±9.36 Tg C yr−1, respectively (Table S4). The historical annual mean value of NBP in Siberia for 2000–2021 of 136.39±83.4 Tg C yr−1 is also similar to the CLM4CN simulations (annual average of 1981–2006) in Eurasia and Boreal and Arctic of 204 and 284 Tg C yr−1, respectively (Kantzas et al., 2013).
Under all climate scenarios from 2000 to 2100, we estimate that the net biome productivity (NBP) will continue to increase, indicating a continued flux of CO2 from the atmosphere to the land (Fig. S34). The classification of NBP variables based on climate input data also shows the correct order, from the smallest under RCP2.6 to the largest under RCP8.5 (Fig. S35). This is because climate factors, such as temperature and precipitation, have a positive impact on vegetation (Yuan et al., 2021). On average, from 2000 to 2100, under the RCP8.5 climate scenario, the NBP in Siberia is estimated at 301.3±49.1 Tg C (equivalent to 3.01±0.5 Tg C yr−1). Other studies have similar estimation that the NBP across northern peatlands, including the Russian Far East (RFE) and West Siberian Lowlands (WSL), ranges from 10 to 220 Tg C yr−1 (Qiu et al., 2022). Additionally, we estimate that the heterotrophic respiration (HTR) in Siberia will continue to increase until 2100. On average under RCP8.5, from 2000 to 2100, the HTR value in Siberia is estimated at 4002.7±967.7 Tg C (equivalent to an increase of 40±9.7 Tg C yr−1) (Fig. S36). We suggest that the high HTR values during those years were attributable to an elevated fuel load (Fig. S40a), followed by significant precipitation (Fig. S40b), which increased litter moisture content (Fig. S41a) and consequently accelerated the decomposition rates of litter and soil organic carbon. Increased heterotrophic respiration, tree mortality, and increased disturbance (drought and fire) contribute significantly to negative carbon fluxes from the ecosystem due to increased temperature and atmospheric CO2 (Sharma et al., 2023). Overall, SEIB-DGVM SPITFIRE simulates that until the end of the 21st century, there will continue to be a strengthening of the land carbon sink in Siberia under all RCP scenarios. Boreal forests (1135 Mha) consistently acted as an average carbon sink of 0.5±0.1 Pg C yr−1 over the 2 decades from 1990 to 2010. Furthermore, Asian Russia had the largest boreal carbon sink, which showed no overall change despite increased emissions from wildfire disturbances (Pan et al., 2011).
Boreal forest vegetation is naturally influenced by a variety of periodic disturbances, such as wildfires (Kasischke et al., 1995), insect outbreaks, and windthrow. Wildfires and insect outbreaks are not necessarily independent; there is a likelihood of wildfires often increasing or decreasing after insect outbreaks (Meigs et al., 2015, 2016). However, wildfires are among the main disturbances that drive forest dynamics, shape forest composition and structure, and affect biomass and productivity (Burns and Honkala, 1990; Greene and Johnson, 1999). Circumpolar northern boreal forests and tundra are likely to continue to warm more than most other terrestrial biomes according to available data from models and observations (Chapin et al., 2005; Foley, 2005; Meehl et al., 2007; Trenberth et al., 2007; Lee et al., 2021). Based on the observations and changes in regional attributes from 1950 to the present, it is projected that during 2071–2100, the WSB (west region of Siberia), ESB (east region of Siberia), and RFE (Russian Far East) will experience an increase in extreme temperatures with a high confidence of more than 7 °C for all seasons under the RCP8.5 scenario. Projected warming is most evident on the large continental Siberian Plateau, which has boreal and subboreal climates and biomes (i.e., taiga forests and tundra), during the winter season (Ozturk et al., 2017; IPCC, 2021). Such changes in climatic extreme scenarios and seasonality are also likely to have multiple effects, including extended but drier growing seasons, the occurrence of more intense convective storms leading to more lightning-caused fires (Hessilt et al., 2021; Kharuk et al., 2022), and decreased forest productivity (Orangeville et al., 2018); additionally, longer, warmer, and drier summers may cause an increase in fire frequency and size in some areas of boreal forests (Krawchuk et al., 2009; Flannigan et al., 2016; Wotton et al., 2017). This finding is in line with our results, which show that the assessment of forest ecology variables indicates tree mortality due to fire and succession as well as post-fire vegetation (Fig. S25c) affects NPP dynamics in Siberia (Fig. S25a).
Under the RCP2.6 scenario, SEIB-DGVM estimated the average tree density to be 2166 trees ha−1 between 200 and 2023 in Siberia. The tree density is greater in northeastern Siberia (1197 trees ha−1) than in southern Siberia (Miesner et al., 2022). Our simulation resulted in higher tree densities than did the observations in northeastern Siberia, as we covered a larger area of forest at 60–180° E, 45–80° N. The number of trees is affected by the frequency of fires at a certain location. Additionally, the number of trees destroyed by wildfires depended upon the climate scenario used in the simulations but naturally increased with fire frequency and size. In all the RCP scenarios, the number of destroyed trees was greater than that in the historical simulation and the number of destroyed trees increased annually, indicating that changes in climatic factors affected the density of surviving trees. The projected increase in the number of trees destroyed annually is consistent with the modeled fire product data, which exhibit an increasing trend until 2100. The difference in tree mortality data between climate scenarios is due to each climate scenario having a different projected temperature increase. In Siberia, under the RCP8.5 scenario, we simulate that the 2 m surface temperature will increase by 4.67 °C by 2100 (Fig. S42). This estimate aligns with the IPCC projections, which predict air temperature increases by 2100 ranging from 0.3–1.7 °C (average of 1.0 °C) under the RCP2.6 scenario, 1.1–2.6 °C (average of 1.8 °C) under the RCP4.5 scenario, 1.4–3.1 °C (average of 2.2 °C) under the RCP6.0 scenario, and 2.6–4.8 °C (average of 3.7 °C) under the RCP8.5 scenario (IPCC, 2021).
The DBH ranges of the trees in the fire-on and fire-off simulations were comparable to those in northeastern Siberia, where the DBH ranged up to 71.6 cm, the tree height ranged up to 28.5 m, and the crown area averaged 4.77 m2 (Miesner et al., 2022). As the average DBH variable was similar in the fire-on and fire-off simulations, trees with large DBHs are resistant to fire. This was also confirmed based on observational research in Yenisei Siberia, where trees with a DBH greater than 18.1 cm were the most resistant to further post-fire succession (Bryukhanov et al., 2018). Specifically, based on the division of regions, we found an interesting pattern, in which the east region of Siberia has the highest value of allometry variables (tree height, tree DBH, and crown area), followed by the central region, with the lowest in the west region (Figs. S37, S38, and S39). An interesting pattern was observed in the west region of Siberia, where trees with high height and a large DBH but low crown area were detected in some locations (Fig. 11a). We suggest that this happens because of the wildfire; the central region of Siberia has the highest wildfire frequency, followed by the west region, then the east region. The major Siberian forest types are formed by larch (Larix sibirica, L. gmelinii, and L. cajanderi), with the majority distributed in the west and central regions of Siberia (Fig. 1, and Fig. 1: Kharuk et al., 2021). Furthermore, larch is classified as pyrophytic species that have adapted or evolved under conditions of periodic forest fires; they have adapted and gained a competitive edge over non-fire-adapted species in regenerating and growing in burned areas (Kharuk et al., 2021). The abundance of species and high frequency of wildfires in the central and west regions of Siberia led to excellent larch succession and regeneration as evidenced by the high tree allometry variables, but the projected continuity of wildfires led to a downward trend. On the other hand, in the east region, very few wildfires are simulated, partly due to the low aboveground biomass available in some areas, which affects ignition and fire spread (Fig. S23). However, due to the low frequency of wildfires, allometric variables are projected to have an increasing trend until 2100 in the east region of Siberia. The unique relationship between allometric variables, which are naturally distributed without a wide gap between grid plots (Fig. 11c), in the east region is also due to the area's low wildfire frequency. The forest in the east region of Siberia appears to grow and spread naturally without a high impact from the wildfire. While the majority of tree species in Siberia (larch) regenerate extremely well on post-fire-mineralized soil, they regenerate very slowly over a ground floor covered in lichen and moss (where the soil's surface is tough for sapling roots to reach) (Kharuk et al., 2016).
4.3 Spatial distribution and temporal variation in biomass-burning emissions under climate change scenarios
The spatiotemporal dynamics of the biomass-burning emissions under all RCP scenarios had similar patterns and trends, but they had slightly different variations in dynamics because climate affects the frequency and distribution of fires. This is evidenced by all fire variables produced by the model, from the burned fraction to burned-biomass emissions. In the last 20 years of the projection (2080–2100), the highest values were obtained from simulations using the climate inputs of RCP2.6, RCP4.5, RCP6.0, and RCP8.5. This occurs because each RCP scenario exhibits varying radiative forcing, with RCP8.5 notably experiencing the highest temperature increase (Fig. S42) and also projecting the highest precipitation levels (Fig. S40b). The fuel load variable follows a corresponding order reflective of RCP forcing levels, with RCP8.5 showing the highest and RCP2.6 showing the lowest (Fig. S40a). However, due to increased precipitation and temperature-induced snowmelt, the moisture content of litter fractions in RCP8.5 simulations attains the highest values, contrasting with the lowest values in RCP2.6. Consequently, available fuel loads may not ignite in areas with high moisture content, leading to projections of the highest burned-biomass emissions in the last 20 years of RCP climate projections (2080–2100) for RCP2.6, RCP4.5, RCP6.0, and RCP8.5, respectively. The difference in emission values between climate scenarios in the same year shows that temperature has an impact on vegetation succession and climate-sensitive emission production from wildfires (Gutierrez et al., 2021; Stocker et al., 2021). Thus, the model is able to simulate and integrate fire disturbance, forest dynamics or vegetation succession, and burned-biomass emissions well.
Over a 20-year average from 2080 to 2100, under RCP6.0 in Siberia, our simulation predicts that forest fires will emit CO2, CO, PM2.5, TPM, and TPC in amounts of 989.93±13.72, 79.24±1.10, 12.91±0.18, 9.78±0.14, and 6.77±0.09 Tg, respectively (Table 4). Spatially, the projections depict heterogeneous patterns of burned-biomass emissions, with regions of high emission intensity concentrated in areas of larch forest (Larix spp.), consistent with Fig. 1 and our simulation results, where the fire and emission variables show high values in the central region to southern Siberia (Figs. S4b, 8b, and S6b). This is reinforced by field-based estimation data showing that fires in this region result in high tree mortality (76 %), with Siberian larch forests experiencing greater aboveground carbon loss after fire than North American forests, both in absolute and relative levels (Webb et al., 2024). We also visualized all the 33 graphs depicting projected burned-biomass emissions, offering valuable insights into the future dynamics of the burned-biomass emissions in Siberia. Across these graphs, we observe distinct temporal patterns, revealing trends in burned-biomass emissions over time. Under the RCP8.5 to RCP2.6 scenarios, the 20-year average comparison of overall burned-biomass emission data from 2080–2100, compared to data from 2000–2020, shows projected increases of 23.87 %, 27.63 %, 29.34 %, and 30.36 %, respectively (Fig. S43). The 20-year dynamics are summarized in Tables 4 and S6. Furthermore, each year, various climate scenarios predicted differing emissions based on the respective radiative forcing values (from lowest to highest). The RCP8.5, RCP6.0, RCP4.0, and RCP2.6 scenarios exhibited average annual increases of 0.295 %, 0.354 %, 0.358 %, and 0.361 % yr−1, respectively, from 2000 to 2100.
Under the RCP4.5 scenario, radiative forcing stabilized until 2100 (Thomson et al., 2011), which is consistent with our results, as emissions under the RCP4.5 scenario were more stable than those under the other RCP scenarios. Therefore, it is indicated that the trend in fire emissions is consistent with the different scenario-dependent trends in radiative forcings. Overall, based on the RCPs climate scenario data used (MirocAR5), the emission scenario projected an increase in global mean surface temperature in the range of 1.0–3.7 (0.3–4.8) °C (IPCC, 2014) and currently ranges between 1.5 and 6.0 °C by 2100 compared to 1850–1900 mean value (Lee et al., 2021). One of the impacts of rising global temperatures is the increased occurrence and severity of forest fires, which lead to a greater prevalence of wildfire (Schoennagel et al., 2017; Haider et al., 2019). The global land area burned by wildfires is expected to increase by 35 % if the global temperature increases by 2 °C and precipitation patterns change (Pörtner et al., 2022). Extremely high temperatures increase the frequency of severe droughts and proliferate wildfires in several regions, such as southern Europe, northern Eurasia, the USA, and Australia (IPCC, 2021). These frequent and severe wildfires will inevitably lead to an increase in the atmospheric concentration of biomass-burning products (Marlon et al., 2008; Amiro et al., 2009; Tian et al., 2023).
Forests in Siberia are very important for continuous monitoring and assessing because they have a significant impact on regional (short-term) and global (long-term) air quality and human health due to the large amounts of carbon emissions, smoke aerosols, and trace gases in the atmosphere. In addition to the observed amount of emissions, organic carbon–elemental carbon emissions exceeded 3 times greater and emissions of inorganic ions (SO and NH) were found to be 5 times greater than the annual average wildfire emissions from August 2010 to August 2011 (Popovicheva et al., 2014). Increased Siberian wildfire aerosols would significantly degrade air quality, particularly in the surrounding and downwind regions of Siberia (Yasunari et al., 2024). The emitted substances can be transported over long distances and affect air quality in other regions, including North America and northeastern China (Teakles et al., 2017; Johnson et al., 2021; Sun et al., 2023).
Estimating future fire emissions and their impact on air quality is challenging due to model limitations and uncertainties in estimation methods, potential mixing of emissions in the atmosphere, climate radiative forcing factors, and emission transport (Winiger et al., 2017; Schacht et al., 2019). SEIB-DGVM SPITFIRE was not able to reproduce the events in the validation data for the same year or month but simulated similar dynamic patterns and values. This difference occurs because the benchmark data obtained from satellite image data closely follow natural conditions, while the model accumulates uncertainties due to its long simulation period. The emission estimation method used in the model refers to the dry-matter variable and the emission factor from Andreae and Merlet (2001) and Andreae (2019), where the emission factors are obtained from laboratory and small field experiments. Each species has specific characteristics that require different assessment methods, and the combustion characteristics can be very different from those of large-scale open biomass burning and wildfires. Kasischke and Bruhwiler (2003) reported that the level of uncertainty in the emission factor parameters for estimating emissions from fires in Russian boreal forests was ±20 %–50 %, which agrees with the ±50 % uncertainty level for major emissions presented by Andreae and Merlet (2001). However, in SEIB-DGVM SPITFIRE, we also used the latest emission factor from Andreae (2019), which was developed for oxygenated volatile organic compounds and for HCN; this approach improved all assessment compound emissions significantly with more accurate measurements and has been widely used by various dynamic global vegetation models to estimate biomass-burning emissions globally. Overall, the comparison between different climate RCP scenarios provides further insight into uncertainties and variability in the projections, offering valuable information for understanding the potential impacts of future burned-biomass emissions on air quality, climate dynamics, and ecosystem health. Through this analysis, our study contributes to a better understanding of the drivers and implications of burned-biomass emissions, informing policy decisions and management strategies aimed at mitigating their environmental and societal impacts.
4.4 Model uncertainty
Our study is a process of combining and improving SEIB-DGVM with the SPITFIRE fire module, each of which has different characteristics and some default variables, parameters, and inputs. The implementation of any complex model improvement inherently introduces uncertainty, stemming from various sources such as parameterization choices, model structure, new model input, and the representation of complex biophysical processes. Specifically in the context of the fire module enhancement, uncertainties may arise from the characterization of ignition sources, fire behavior, fuel dynamics, and fire spread mechanisms. These uncertainties can significantly influence the accuracy and reliability of model projections, particularly in simulating the spatial and temporal patterns of fire occurrence, intensity, and impacts on vegetation dynamics and carbon cycling.
Kasischke and Bruhwiler (2003) mentioned that, in some cases, the data needed to generate input parameters for those equations are very well defined, whereas in others, they are based on a very limited set of the observations data. Thus, the input data selection and the parameter setting for those equation calculations are the source of the uncertainty, with the provided emission range (Table 5 in Kasischke and Bruhwiler, 2003). In more detail Kasischke and Bruhwiler (2003) stated that uncertainty can be classified into two groups. First, there are environmental characteristics (direct or indirect observations) including location, fire type, and aboveground/ground layer biomass. Second, there are uncertainties from parameters that can be measured in individual biomass combustion processes, while the application on a large scale, with time differences and climatic influences, is very challenging, and the combustion process consists of several stages, with different emissions for each stage.
To mitigate model uncertainty, we have employed rigorous model verification, calibration, and evaluation procedures, comparing model outputs with several benchmark datasets (Table 3). The verification helps to ensure the new inputs (ignition factors) can be read, processed, and output properly. The process of calibrating all major variables with benchmark datasets is carried out sequentially and with several iterations, ensuring that the output of individual variables matches the benchmark dataset that is the target of validation. This validation process helps assess the model's ability to reproduce historical fire patterns and dynamics accurately.
However, this does not eliminate the uncertainty in the model we have developed, and we still have limitations where the emission variable distribution pattern of emissions is strongly influenced by the pattern of the resulting fire because the emission variable is calculated with the same dry-matter emissions. This spatial distribution also affected other vegetation variables, due to the relationship calculation between fire and vegetation variables. This is a potential further study for adjusting the factors that affect the distribution of fire to be similar to the benchmark data. In addition, natural factors that affect the dynamics of significant fire disturbances at specific times are still not well simulated by our model. Inversely, our model also has the advantage of being able to numerically simulate averaged data in the long term very accurately; based on the results of numerical comparisons with benchmark data, the model is able to simulate with a value of 99 %.
We introduced the SPITFIRE fire module into SEIB-DGVM and achieved a better representation of fire dynamics in Siberia between 1996 and 2100 by creating monthly outputs and producing several new outputs related to fires at a 0.5° spatial resolution, such as vegetation and burned-biomass emission variables. Our modifications have led to a more realistic depiction of fire frequency, intensity, and extent, aligning the model outputs more closely with benchmark datasets. Compared to the default model, the improved model (SEIB-DGVM SPITFIRE) demonstrates a higher accuracy in simulating the burned fraction, achieving a 75 % agreement with the GFED4s data, whereas the default model only shows a 68 % agreement. Overall, the major fire-related variables (vegetation, CO2 and PM2.5 emissions, burned area, burned fraction, aboveground biomass, and dry matter) all achieved an average spatial agreement of 70.7 % or higher with the observational data. Additionally, the improved model accurately simulated forest structure, increasing the agreement between the simulated and observed dataset patterns and further emphasizing the reliability of our model and its emission projections. Under the RCP2.6 scenario, we estimated that the CO2, CO, PM2.5, total particulate matter (TPM), and total particulate carbon (TPC) emissions in Siberia will continue to increase annually until 2100 by an average of 2.71±0.87, 0.22±0.07, 0.04±0.01, 0.03±0.01, and 0.02±0.01 Tg species yr−1, respectively. Moreover, forest fires in Siberia in 2100 are projected to emit all five of these compounds under the RCP8.5 scenario, amounting to 1010.00±82.64, 80.84±6.61, 13.17±1.08, 9.97±0.82, and 6.91±0.57 Tg, respectively.
Although our research has taken significant steps, there are several limitations that require further research. Future studies should minimize the uncertainty in the simulations and achieve better fits with benchmark datasets of fire, vegetation, and emission products. Specific parameter settings need to also be developed to emphasize regional and seasonal differences. Continued improvement in the fire module and consideration of feedback loops will be crucial for continuously enhancing the accuracy of our models. Our work contributes to a more comprehensive understanding of the intricate interactions between fire dynamics, ecosystems, and climate, creating a new path for informed decision-making and broadening the field of biogeochemistry and global elemental cycles, as well as highlighting the importance of accurate vegetation dynamic modeling.
A1 Input
The following is the input of SEIB-DGVM SPITFIRE:
-
location – latitude and altitude;
-
soil (fixed in time) – soil moisture at the saturation point, field capacity, matrix potential, wilting point, and albedo;
-
climatic data (daily) – air temperature, soil temperature, fraction of cloud cover, precipitation, humidity, and wind velocity;
-
atmospheric carbon dioxide (CO2) concentrations;
-
fire ignition factors – population density (GPWv4) and lightning flash rate (LIS/OTD HRFC).
A2 Output
The following is the output of SEIB-DGVM SPITFIRE:
-
carbon dynamics (daily–yearly) – terrestrial carbon pool (woody biomass, grass biomass, litter, and soil organic matter) and CO2 absorption and emission rates;
-
water dynamics (daily) – soil moisture content (in three layers), interception rate, evaporation rate, transpiration rate, interception rate, and runoff rate;
-
radiation (daily) – albedo from the terrestrial surface;
-
properties of vegetation (daily–yearly) – vegetation type, dominant plant functional type, leaf area index, tree density, size distribution of trees, age distribution of trees, woody biomass for each tree, and grass biomass per unit area;
-
disturbances (monthly–yearly) – fire fraction, burned area, burned biomass, FDI, complete SPITFIRE variables, and 33 types of burned-biomass emissions.
Table A1Processes in SEIB-DGVM SPITFIRE and the approaches used to represent each process.
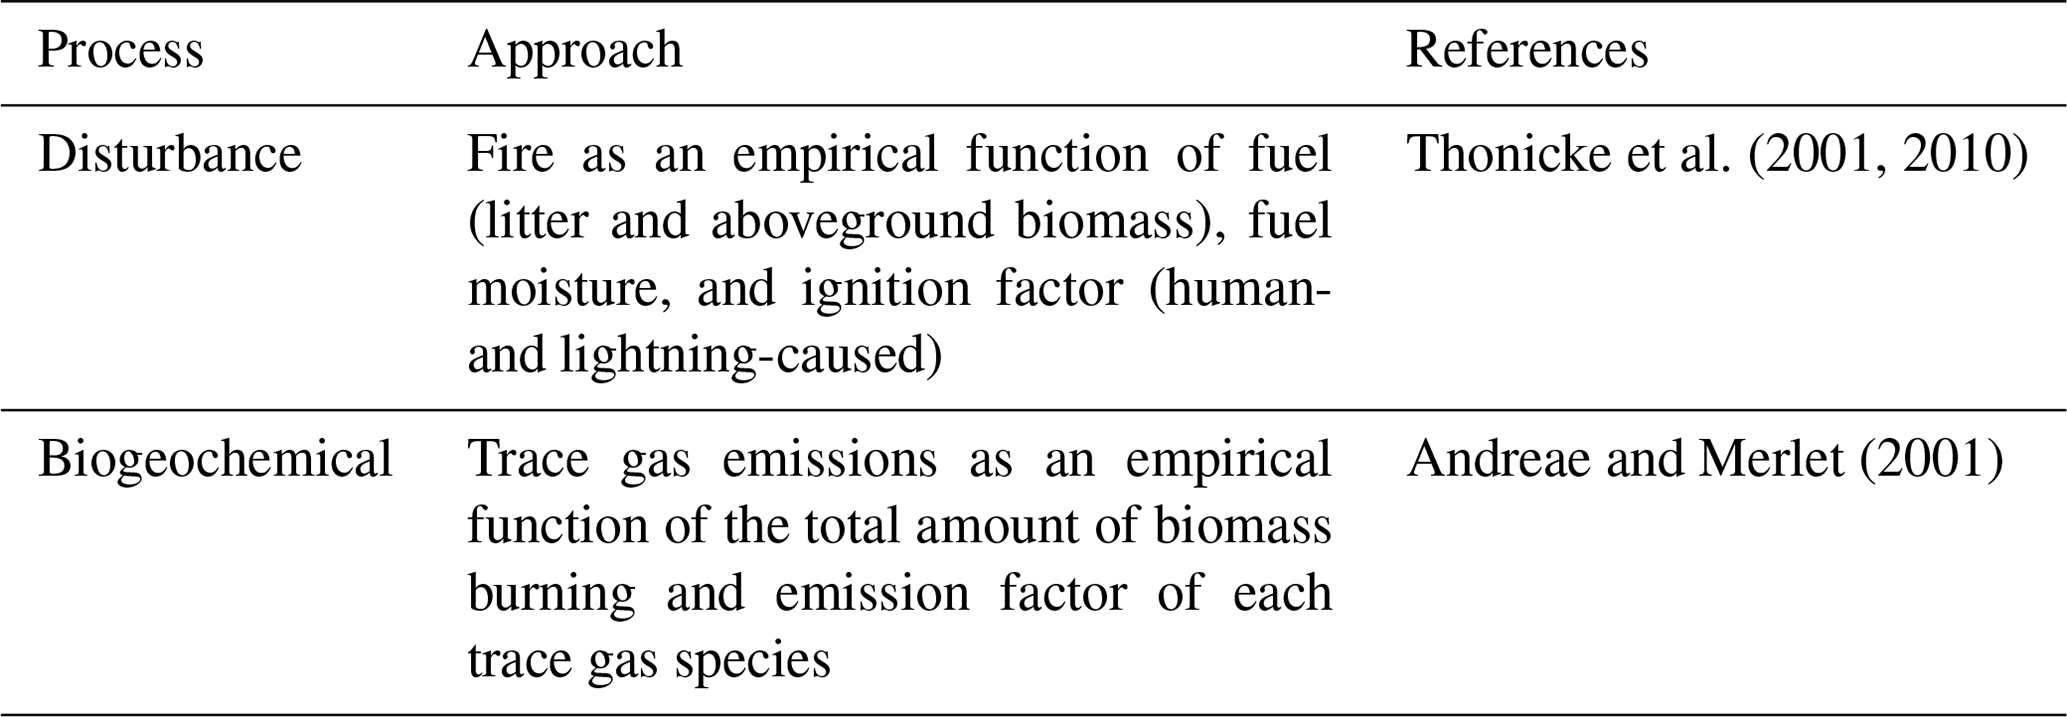
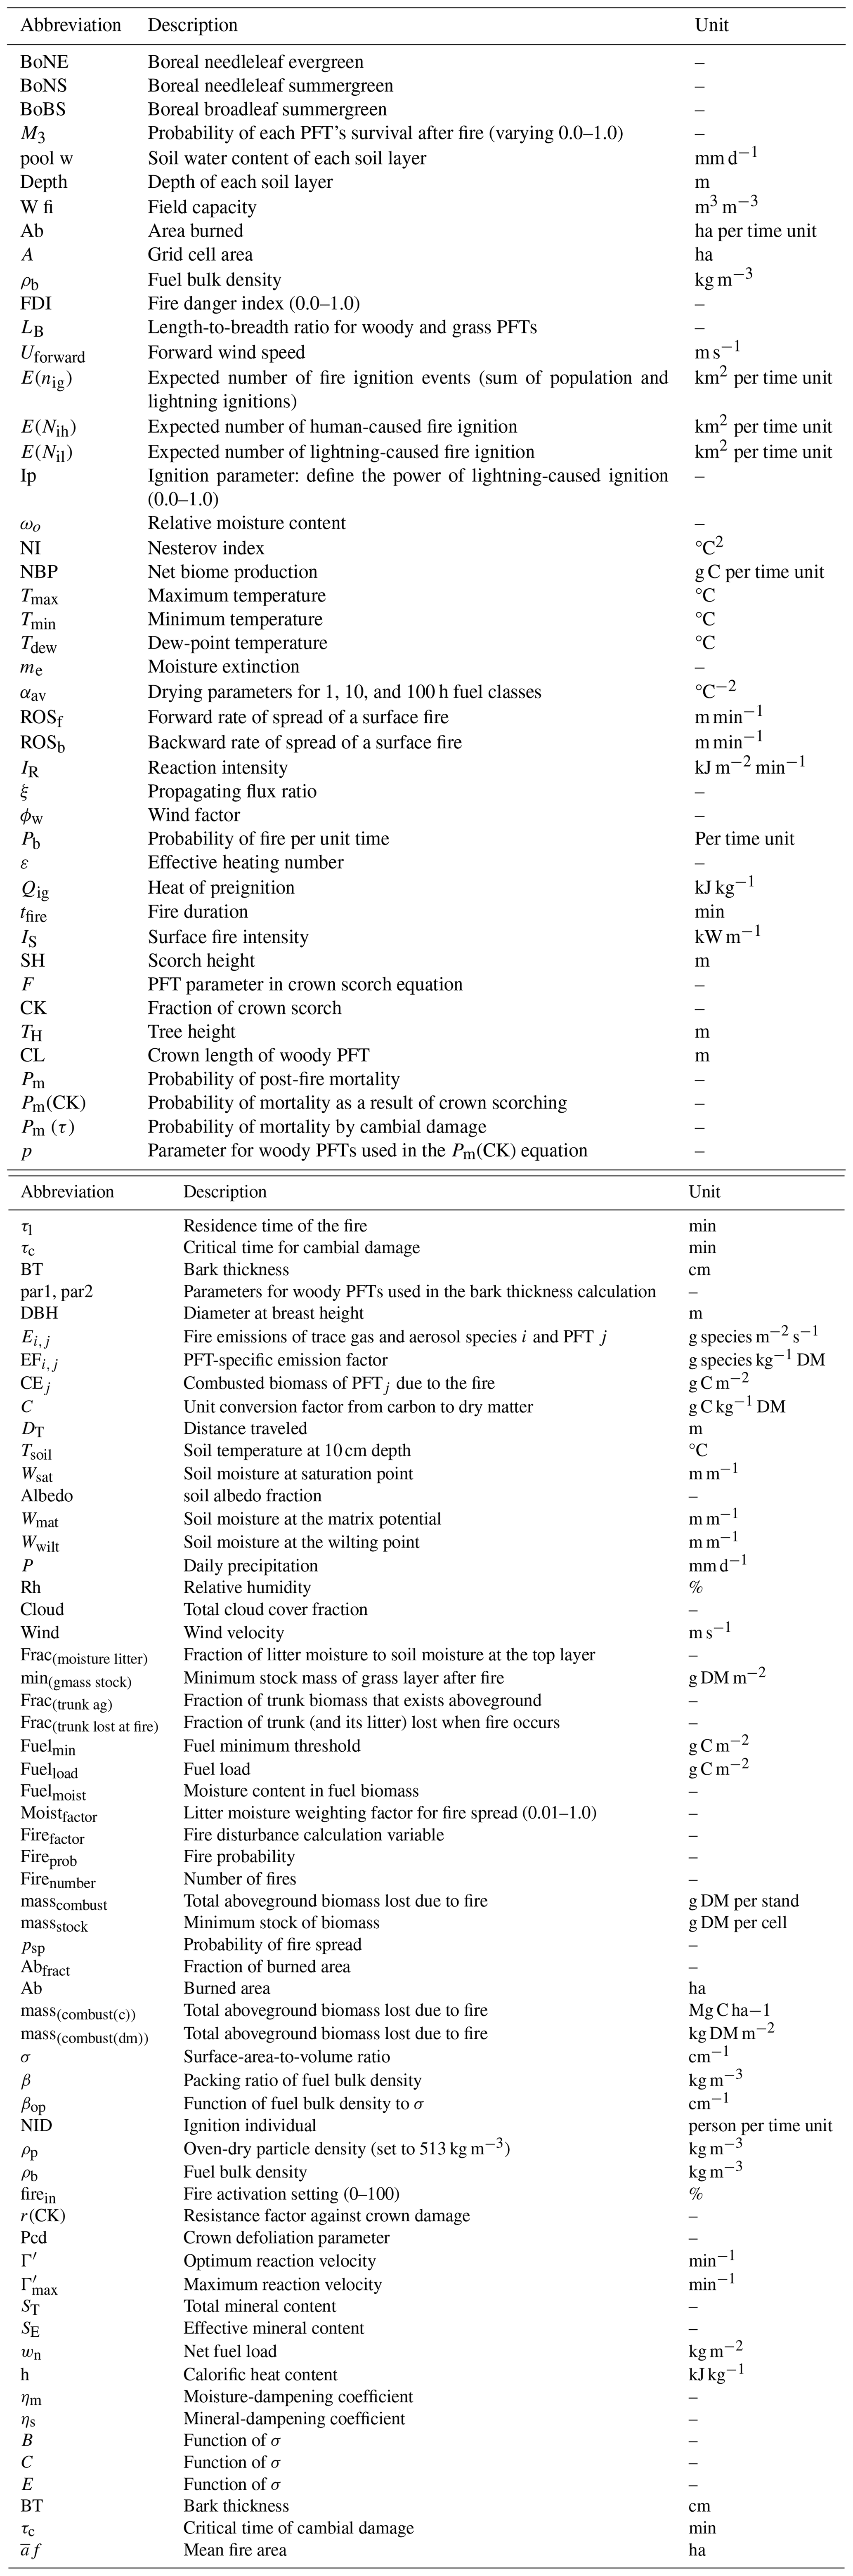
Additional equations and variables of the implemented SPITFIRE module are adjustments to Thonicke et al. (2010) and are found in Table A2 and the Supplement.
The spatially explicit individual-based dynamic global vegetation model (SEIB-DGVM) SPITFIRE code and data generated from this study (fire, vegetation, and 33 emission variables in Siberia) are available at https://doi.org/10.5281/zenodo.13131614 (Nurrohman, 2024).
The supplement related to this article is available online at: https://doi.org/10.5194/bg-21-4195-2024-supplement.
TK conceptualized the project and experimental design with assistance from ND and HS. HN, LV, and TM contributed to model coding and writing. RKN developed the model code, performed the model simulations, and analyzed the model output using validation data from TS and RH. RKN prepared the manuscript with contributions from all co-authors.
The contact author has declared that none of the authors has any competing interests.
Publisher's note: Copernicus Publications remains neutral with regard to jurisdictional claims made in the text, published maps, institutional affiliations, or any other geographical representation in this paper. While Copernicus Publications makes every effort to include appropriate place names, the final responsibility lies with the authors.
We would like to thank David McLagan and three anonymous reviewers for their constructive comments and feedback during the review process. We also extend our gratitude to Tomohiro Hajima and Junko Mori from the Japan Agency for Marine-Earth Science and Technology (JAMSTEC) for providing the climate datasets used in this study.
This research has been supported by a Grant-in-Aid for Scientific Research (KAKENHI) from the Japan Society for the Promotion of Science (JSPS) (no. (B) 20H04317).
This paper was edited by David McLagan and reviewed by three anonymous referees.
Abaimov, A. P. and Sofronov, M. A.: The Main Trends of Post-Fire Succession in Near-Tundra Forests of Central Siberia, in: Fire in Ecosystems of Boreal Eurasia, edited by: Goldammer, J. G. and Furyaev, V. V., Forestry Sciences, vol 48, Springer, Dordrecht, 372–386, https://doi.org/10.1007/978-94-015-8737-2_33, 1996.
Abaimov, A. P., Lesinski, J. A., Martinsson, O., and Milyutin, L. I.: Variability and ecology of Siberian larch species, Swedish Univ. of Agricultural Sciences, Umeaa (Sweden), Dept. of Silviculture, ISSN 0348-8969, 1998.
Amiro, B. D., Cantin, A., Flannigan, M. D., and De Groot, W. J.: Future emissions from Canadian boreal forest fires, Can. J. Forest Res., 39, 383–395, https://doi.org/10.1139/X08-154, 2009.
Andreae, M. O.: Emission of trace gases and aerosols from biomass burning – an updated assessment, Atmos. Chem. Phys., 19, 8523–8546, https://doi.org/10.5194/acp-19-8523-2019, 2019.
Andreae, M. O. and Merlet, P.: Emission of trace gases and aerosols from biomass burning, Global Biogeochem. Cy., 15, 955–966, 2001.
Arakida, H., Kotsuki, S., Otsuka, S., Sawada, Y., and Miyoshi, T.: Regional-scale data assimilation with the Spatially Explicit Individual-based Dynamic Global Vegetation Model (SEIB-DGVM) over Siberia, Prog. Earth Planet. Sci., 8, 52, https://doi.org/10.1186/s40645-021-00443-6, 2021.
Archibald, S., Lehmann, C. E. R., Gómez-Dans, J. L., and Bradstock, R. A.: Defining pyromes and global syndromes of fire regimes, P. Natl. Acad. Sci. USA, 110, 6442–6447, https://doi.org/10.1073/pnas.1211466110, 2013.
Aurell, J., Mitchell, B., Greenwell, D., Holder, A., Tabor, D., Kiros, F., and Gullett, B.: Measuring emission factors from open fires and detonations, AQM 2019 – Air Qual. Meas. Methods Technol. Conf. 2019, 2019.
Bartalev, S. A., Belward, A. S., Erchov, D. V., and Isaev, A. S.: A new SPOT4-VEGETATION derived land cover map of Northern Eurasia, Int. J. Remote Sens., 24, 1977–1982, https://doi.org/10.1080/0143116031000066297, 2003.
Bergeron, Y., Gauthier, S., Flannigan, M., and Kafka, V.: Fire regimes at the transition between mixedwood and coniferous boreal forest in northwestern Quebec, Ecology, 85, 1916–1932, https://doi.org/10.1890/02-0716, 2004.
Bonan, G. B.: Forests and climate change: Forcings, feedbacks, and the climate benefits of forests, Science, 320, 1444–1449, https://doi.org/10.1126/science.1155121, 2008.
Bond, T. C., Doherty, S. J., Fahey, D. W., Forster, P. M., Berntsen, T., Deangelo, B. J., Flanner, M. G., Ghan, S., Kärcher, B., Koch, D., Kinne, S., Kondo, Y., Quinn, P. K., Sarofim, M. C., Schultz, M. G., Schulz, M., Venkataraman, C., Zhang, H., Zhang, S., Bellouin, N., Guttikunda, S. K., Hopke, P. K., Jacobson, M. Z., Kaiser, J. W., Klimont, Z., Lohmann, U., Schwarz, J. P., Shindell, D., Storelvmo, T., Warren, S. G., and Zender, C. S.: Bounding the role of black carbon in the climate system: A scientific assessment, J. Geophys. Res.-Atmos., 118, 5380–5552, https://doi.org/10.1002/jgrd.50171, 2013.
Bowman, D. M. J. S., Balch, J. K., Artaxo, P., Bond, W. J., Carlson, J. M., Cochrane, M. A., D'Antonio, C. M., DeFries, R. S., Doyle, J. C., Harrison, S. P., Johnston, F. H., Keeley, J. E., Krawchuk, M. A., Kull, C. A., Marston, J. B., Moritz, M. A., Prentice, I. C., Roos, C. I., Scott, A. C., Swetnam, T. W., Van Der Werf, G. R., and Pyne, S. J.: Fire in the earth system, Science, 324, 481–484, https://doi.org/10.1126/science.1163886, 2009.
Bryukhanov, A. V., Panov, A. V., Ponomarev, E. I., and Sidenko, N. V.: Wildfire Impact on the Main Tree Species of the Near-Yenisei Siberia, Izv. Atmos. Ocean. Phy., 54, 1525–1533, https://doi.org/10.1134/S0001433818110026, 2018.
Burns, R. M. and Honkala, B. H.: Silvics of North America: Volume 2. Hardwoods, Agric. Handb., 654, U.S. Department of Agriculture, Forest Service, Washington, vol. 2, 877, 1990.
Carnicer, J., Alegria, A., Giannakopoulos, C., Di Giuseppe, F., Karali, A., Koutsias, N., Lionello, P., Parrington, M., and Vitolo, C.: Global warming is shifting the relationships between fire weather and realized fire-induced CO2 emissions in Europe, Sci. Rep., 12, 8–13, https://doi.org/10.1038/s41598-022-14480-8, 2022.
Cecil, D. J.: LIS/OTD 0.5 Degree High Resolution Full Climatology (HRFC) V2.3.2015, NASA Global Hydrometeorology Resource Center DAAC, Huntsville, Alabama, USA, https://doi.org/10.5067/LIS/LIS-OTD/DATA302, 2001.
Chapin, F. S., Sturm, M., Serreze, M. C., McFadden, J. P., Key, J. R., Lloyd, A. H., McGuire, A. D., Rupp, T. S., Lynch, A. H., Schimel, J. P., Beringer, J., Chapman, W. L., Epstein, H. E., Euskirchen, E. S., Hinzman, L. D., Jia, G., Ping, C. L., Tape, K. D., Thompson, C. D. C., Walker, D. A., and Welker, J. M.: Role of Land-Surface Changes in Arctic Summer Warming, Sci. Rep., 310, 657–660, https://doi.org/10.1126/science.1117368, 2005.
Chapin, F. S., Woodwell, G. M., Randerson, J. T., Rastetter, E. B., Lovett, G. M., Baldocchi, D. D., Clark, D. A., Harmon, M. E., Schimel, D. S., Valentini, R., Wirth, C., Aber, J. D., Cole, J. J., Goulden, M. L., Harden, J. W., Heimann, M., Howarth, R. W., Matson, P. A., McGuire, A. D., Melillo, J. M., Mooney, H. A., Neff, J. C., Houghton, R. A., Pace, M. L., Ryan, M. G., Running, S. W., Sala, O. E., Schlesinger, W. H., and Schulze, E. D.: Reconciling carbon-cycle concepts, terminology, and methods, Ecosystems, 9, 1041–1050, https://doi.org/10.1007/s10021-005-0105-7, 2006.
Christian, T. J., Kleiss, B., Yokelson, R. J., Holzinger, R., Crutzen, P. J., Hao, W. M., Saharjo, B. H., and Ward, D. E.: Comprehensive laboratory measurements of biomass-burning emissions: 1. Emissions from Indonesian, African, and other fuels, J. Geophys. Res.-Atmos., 108, 4719, https://doi.org/10.1029/2003jd003704, 2003.
Chylek, P., Folland, C., Klett, J. D., Wang, M., Hengartner, N., Lesins, G., and Dubey, M. K.: Annual Mean Arctic Amplification 1970–2020: Observed and Simulated by CMIP6 Climate Models, Geophys. Res. Lett., 49, 1–8, https://doi.org/10.1029/2022GL099371, 2022.
CIESIN: Gridded Population of the World, Version 4.11 (GPWv4): Population Count, Revision 11, Palisades, New York: NASA Socioeconomic Data and Applications Center (SEDAC), https://doi.org/10.7927/H4JW8BX5, 2018.
Clark, J. S. and Richard, P. J. H.: The Role of Paleofire in Boreal and Other Cool-Coniferous Forests, in: Fire in Ecosystems of Boreal Eurasia, edited by: Goldammer, J. G. and Furyaev, V. V., Forestry Sciences, vol 48., Springer, Dordrecht, 65–89, https://doi.org/10.1007/978-94-015-8737-2_5, 1996.
Cleve, K. V. and Viereck, L. A.: Forest Succession in Relation to Nutrient Cycling in the Boreal Forest of Alaska, in: Forest Succession. Springer Advanced Texts in Life Sciences, edited by: West, D. C., Shugart, H. H., and Botkin, D. B., Springer, New York, NY, 185–211, https://doi.org/10.1007/978-1-4612-5950-3_13, 1981.
Cochrane, M. A.: Fire science for rainforests, Nature, 421, 913–919, https://doi.org/10.1038/nature01437, 2003.
Cramer, W., Bondeau, A., Woodward, F. I., Prentice, I. C., Betts, R. A., Brovkin, V., Cox, P. M., Fisher, V., Foley, J. A., Friend, A. D., Kucharik, C., Lomas, M. R., Ramankutty, N., Sitch, S., Smith, B., White, A., and Young-Molling, C.: Global response of terrestrial ecosystem structure and function to CO2 and climate change: Results from six dynamic global vegetation models, Glob. Change Biol., 7, 357–373, https://doi.org/10.1046/j.1365-2486.2001.00383.x, 2001.
Crutzen, P. J. and Goldammer, J. G.: Fire in the Environment: The Ecological, Atmospheric, and Climatic Importance of Vegetation Fires, New York, NY, John Wiley & Sons, 400 pp., https://doi.org/10.2307/2261611, 1993.
De Groot, W. J., Cantin, A. S., Flannigan, M. D., Soja, A. J., Gowman, L. M., and Newbery, A.: A comparison of Canadian and Russian boreal forest fire regimes, Forest Ecol. Manage., 294, 23–34, https://doi.org/10.1016/j.foreco.2012.07.033, 2013.
Dickinson, M. B. and Johnson, E. A.: Fire Effects on Trees, in: Forest Fires, edited by: Johnson, E. A., Kiyoko Miyanishi, Academic Press, 477–525, https://doi.org/10.1016/b978-012386660-8/50016-7, 2001.
Dixon, A. R. K., Brown, S., Houghton, R. A., Solomon, A. M., and Trexler, M. C.: Carbon Pools and Flux of Global Forest Ecosystems, American Association for the Advancement of Science, Adv. Sci., 263, 185–190, 1994.
Fisher, J. B., Huntzinger, D. N., Schwalm, C. R., and Sitch, S.: Modeling the terrestrial biosphere, Annu. Rev. Env. Resour., 39, 91–123, https://doi.org/10.1146/annurev-environ-012913-093456, 2014.
Flannigan, M., Stocks, B., Turetsky, M., and Wotton, M.: Impacts of climate change on fire activity and fire management in the circumboreal forest, Glob. Change Biol., 15, 549–560, https://doi.org/10.1111/j.1365-2486.2008.01660.x, 2009.
Flannigan, M. D., Wotton, B. M., Marshall, G. A., Groot, W. J. de, Johnston, J., Jurko, N., and Cantin, A. S.: Fuel moisture sensitivity to temperature and precipitation: climate change implications, Clim. Change, 134, 59–71, https://doi.org/10.1007/s10584-015-1521-0, 2016.
Foley, J. A.: Tipping Points in the Tundra, Sci. Per., 310, 627–628, https://doi.org/10.1126/science.1120104, 2005.
Forster, P., Ramaswamy, V., Artaxo, P., Berntsen, T., Betts, R., Fahey, D. W., Haywood, J., Lean, J., Lowe, D. C., Myhre, G., Nganga, J., Prinn, R., Raga, G., Schulz, M., and Van Dorland, R.: Changes in Atmospheric Constituents and in Radiative Forcing, Cancer Biol. Med., 15, 228–237, https://doi.org/10.20892/j.issn.2095-3941.2017.0150, 2018.
Frank, D., Reichstein, M., Bahn, M., Thonicke, K., Frank, D., Mahecha, M. D., Smith, P., van der Velde, M., Vicca, S., Babst, F., Beer, C., Buchmann, N., Canadell, J. G., Ciais, P., Cramer, W., Ibrom, A., Miglietta, F., Poulter, B., Rammig, A., Seneviratne, S. I., Walz, A., Wattenbach, M., Zavala, M. A., and Zscheischler, J.: Effects of climate extremes on the terrestrial carbon cycle: Concepts, processes and potential future impacts, Glob. Chang. Biol., 21, 2861–2880, https://doi.org/10.1111/gcb.12916, 2015.
Freeborn, P. H., Wooster, M. J., Hao, W. M., Ryan, C. A., Nordgren, B. L., Baker, S. P., and Ichoku, C.: Relationships between energy release, fuel mass loss, and trace gas an aerosol emissions during laboratory biomass fires, J. Geophys. Res.-Atmos., 113, 1–17, https://doi.org/10.1029/2007JD008679, 2008.
Friedlingstein, P., O'Sullivan, M., Jones, M. W., Andrew, R. M., Hauck, J., Olsen, A., Peters, G. P., Peters, W., Pongratz, J., Sitch, S., Le Quéré, C., Canadell, J. G., Ciais, P., Jackson, R. B., Alin, S., Aragão, L. E. O. C., Arneth, A., Arora, V., Bates, N. R., Becker, M., Benoit-Cattin, A., Bittig, H. C., Bopp, L., Bultan, S., Chandra, N., Chevallier, F., Chini, L. P., Evans, W., Florentie, L., Forster, P. M., Gasser, T., Gehlen, M., Gilfillan, D., Gkritzalis, T., Gregor, L., Gruber, N., Harris, I., Hartung, K., Haverd, V., Houghton, R. A., Ilyina, T., Jain, A. K., Joetzjer, E., Kadono, K., Kato, E., Kitidis, V., Korsbakken, J. I., Landschützer, P., Lefèvre, N., Lenton, A., Lienert, S., Liu, Z., Lombardozzi, D., Marland, G., Metzl, N., Munro, D. R., Nabel, J. E. M. S., Nakaoka, S.-I., Niwa, Y., O'Brien, K., Ono, T., Palmer, P. I., Pierrot, D., Poulter, B., Resplandy, L., Robertson, E., Rödenbeck, C., Schwinger, J., Séférian, R., Skjelvan, I., Smith, A. J. P., Sutton, A. J., Tanhua, T., Tans, P. P., Tian, H., Tilbrook, B., van der Werf, G., Vuichard, N., Walker, A. P., Wanninkhof, R., Watson, A. J., Willis, D., Wiltshire, A. J., Yuan, W., Yue, X., and Zaehle, S.: Global Carbon Budget 2020, Earth Syst. Sci. Data, 12, 3269–3340, https://doi.org/10.5194/essd-12-3269-2020, 2020.
Galanter, M., Levy II, H., and Carmichael, G. R.: Impact of biomass burning of tropospheric CO, NOx, and O3, J. Geophys. Res.-Atmos., 105, 6633–6653, https://doi.org/10.1029/1999JD901113, 2000.
Gauthier, S., Bernier, P., Kuuluvainen, T., Shvidenko, A. Z., and Schepaschenko, D. G.: Boreal forest health and global change, Science, 349, 819–822, https://doi.org/10.1126/science.aaa9092, 2015.
Giglio, L., Randerson, J. T., and Van Der Werf, G. R.: Analysis of daily, monthly, and annual burned area using the fourth-generation global fire emissions database (GFED4), J. Geophys. Res.-Biogeo., 118, 317–328, https://doi.org/10.1002/jgrg.20042, 2013.
Goldammer, J. G. and Furyaev, V. V: Fire in ecosystems of boreal Eurasia, Fire Ecosyst, Boreal Eurasia, Springer Dordrecht, Netherlands, 1–20, 1996.
Greene, D. F. and Johnson, E. A.: Modelling recruitment of Populus tremuloides, Pinus banksiana, and Picea mariana following fire in the mixedwood boreal forest, Can. J. Forest Res., 29, 462–473, https://doi.org/10.1139/cjfr-29-4-462, 1999.
Gutierrez, A. A., Hantson, S., Langenbrunner, B., Chen, B., Jin, Y., Goulden, M. L., and Randerson, J. T.: Wildfire response to changing daily temperature extremes in California's Sierra Nevada, Sci. Adv., 7, 1–11, https://doi.org/10.1126/sciadv.abe6417, 2021.
Haider, W., Knowler, D., Trenholm, R., Moore, J., Bradshaw, P., and Lertzman, K.: Climate change, increasing forest fire incidence, and the value of visibility: Evidence from British Columbia, Canada, Can. J. Forest Res., 49, 1242–1255, https://doi.org/10.1139/cjfr-2018-0309, 2019.
Hantemirov, R. M., Corona, C., Guillet, S., Shiyatov, S. G., Stoffel, M., Osborn, T. J., Melvin, T. M., Gorlanova, L. A., Kukarskih, V. V., Surkov, A. Y., von Arx, G., and Fonti, P.: Current Siberian heating is unprecedented during the past seven millennia, Nat. Commun., 13, 1–8, https://doi.org/10.1038/s41467-022-32629-x, 2022.
Hantson, S., Arneth, A., Harrison, S. P., Kelley, D. I., Prentice, I. C., Rabin, S. S., Archibald, S., Mouillot, F., Arnold, S. R., Artaxo, P., Bachelet, D., Ciais, P., Forrest, M., Friedlingstein, P., Hickler, T., Kaplan, J. O., Kloster, S., Knorr, W., Lasslop, G., Li, F., Mangeon, S., Melton, J. R., Meyn, A., Sitch, S., Spessa, A., van der Werf, G. R., Voulgarakis, A., and Yue, C.: The status and challenge of global fire modelling, Biogeosciences, 13, 3359–3375, https://doi.org/10.5194/bg-13-3359-2016, 2016.
Hély, C., Bergeron, Y., and Flannigan, M. D.: Effects of stand composition on fire hazard in mixed-wood Canadian boreal forest, J. Veg. Sci., 11, 813–824, https://doi.org/10.2307/3236551, 2000.
Heĺy, C., Flannigan, M., and Bergeron, Y.: Modeling tree mortality following wildfire in the southeastern Canadian mixed-wood boreal forest, Forest Sci., 49, 566–576, 2003.
Hessilt, T. D., van der Werf, G., Abatzoglou, J. T., Scholten, R. C., and Veraverbeke, S.: Future increases in lightning-ignited boreal fires from conjunct increases in dry fuels and lightning, EGU General Assembly 2021, online, 19–30 Apr 2021, EGU21-2218, https://doi.org/10.5194/egusphere-egu21-2218, 2021.
Hicke, J. A., Asner, G. P., Kasischke, E. S., French, N. H. F., Randerson, J. T., Collatz, G. J., Stocks, B. J., Tucker, C. J., Los, S. O., and Field, C. B.: Postfire response of North American boreal forest net primary productivity analyzed with satellite observations, Glob. Change Biol., 9, 1145–1157, https://doi.org/10.1046/j.1365-2486.2003.00658.x, 2003.
Ichoku, C., Giglio, L., Wooster, M. J., and Remer, L. A.: Global characterization of biomass-burning patterns using satellite measurements of fire radiative energy, Remote Sens. Environ., 112, 2950–2962, https://doi.org/10.1016/j.rse.2008.02.009, 2008.
IFFN: The Current Fire Situation in the Russian Federation: Implications for Enhancing International and Regional Cooperation in the UN Framework and the Global Programs on Fire Monitoring and Assessment, International Forest Fire News (IFFN), 89–111 pp., ISSN 1029-0864, 2003.
IPCC: Climate Change 2013: The Physical Science Basis, Contribution of Working Group I to the Fifth Assessment Report of the Intergovernmental Panel on Climate Change, edited by: Stocker, T. F., Qin, D., Plattner, G.-K., Tignor, M., Allen, S. K., Boschung, J., Nauels, A., Xia, Y., Bex, V., and Midgley, P. M., Cambridge University Press, UK, and New York, USA, 1–14, https://doi.org/10.1017/CBO9781107415324, 2013.
IPCC: Climate Change 2014: Synthesis Report, Contribution of Working Groups I, II and III to the Fifth Assessment Report of the Intergovernmental Panel on Climate Change, edited by: Core Writing Team, Pachauri, R. K., and Meyer, L. A., Switzerland, 151 pp., ISBN 978-92-9169-143-2, 2014.
IPCC: Summary for Policymakers, Climate Change 2021: The Physical Science Basis. Contribution of Working Group I to the Sixth Assessment Report of the Intergovernmental Panel on Climate Change, edited by: Masson-Delmotte, V., Zhai, P., Pirani, A., Connors, S. L., Péan, C., Berger, S., Caud, N., Chen, Y., 3–32, https://doi.org/10.1017/9781009157896.001, 2021.
Ito, A.: Mega fire emissions in Siberia: potential supply of bioavailable iron from forests to the ocean, Biogeosciences, 8, 1679–1697, https://doi.org/10.5194/bg-8-1679-2011, 2011.
Ivanov, V., Milyaev, I., Konstantinov, A., and Loiko, S.: Land-Use Changes on Ob River Floodplain (Western Siberia, Russia) in Context of Natural and Social Changes over Past 200 Years, Land, 11, 1–18, https://doi.org/10.3390/land11122258, 2022.
Johnson, M. S., Strawbridge, K., Knowland, K. E., Keller, C., and Travis, M.: Long-range transport of Siberian biomass burning emissions to North America during FIREX-AQ, Atmos. Environ., 252, 1–15, https://doi.org/10.1016/j.atmosenv.2021.118241, 2021.
Kaiser, J. W., Heil, A., Andreae, M. O., Benedetti, A., Chubarova, N., Jones, L., Morcrette, J.-J., Razinger, M., Schultz, M. G., Suttie, M., and van der Werf, G. R.: Biomass burning emissions estimated with a global fire assimilation system based on observed fire radiative power, Biogeosciences, 9, 527–554, https://doi.org/10.5194/bg-9-527-2012, 2012.
Kantzas, E., Lomas, M., and Quegan, S.: Fire at high latitudes: Data-model comparisons and their consequences, Global Biogeochem. Cy., 27, 677–691, https://doi.org/10.1002/gbc.20059, 2013.
Kasischke, E. S.: Boreal Ecosystems in the Global Carbon Cycle, in: Fire, Climate Change, and Carbon Cycling in the Boreal Forest, Springer, New York, 19–30, https://doi.org/10.1007/978-0-387-21629-4_2, 2000.
Kasischke, E. S. and Bruhwiler, L. P.: Emissions of carbon dioxide, carbon monoxide, and methane from boreal forest fires in 1998, J. Geophys. Res.-Atmos., 108, 8146, https://doi.org/10.1029/2001jd000461, 2003.
Kasischke, E. S., Christensen, N. L., and Stocks, B. J.: Fire, global warming, and the carbon balance of boreal forests, Ecol. Appl., 5, 437–451, https://doi.org/10.2307/1942034, 1995.
Keane, R. E., Arno, S. F., and Brown, J. K.: Simulating Cumulative Fire Effects in Ponderosa Pine/Douglas-Fir Forests, Ecology, 71, 189–203, 1990.
Kharuk, V. I., Ranson, K. J., Dvinskaya, M. L., and Im, S. T.: Wildfires in northern Siberian larch dominated communities, Environ. Res. Lett., 6, 045208, https://doi.org/10.1088/1748-9326/6/4/045208, 2011.
Kharuk, V. I., Mariya, L. D., Ilya, A. P., Sergei, T. I., and Kenneth, J. R.: Larch Forests of Middle Siberia: Long-Term Trends in Fire Return Intervals, Reg. Environ. Change, 16, 2389–2397, https://doi.org/10.1007/s10113-016-0964-9, 2016.
Kharuk, V. I., Ponomarev, E. I., Ivanova, G. A., Dvinskaya, M. L., Coogan, S. C. P., and Flannigan, M. D.: Wildfires in the Siberian taiga, Ambio, 50, 1953–1974, https://doi.org/10.1007/s13280-020-01490-x, 2021.
Kharuk, V. I., Dvinskaya, M. L., Im, S. T., Golyukov, A. S., and Smith, K. T.: Wildfires in the Siberian Arctic, Fire, 5, 1–16, https://doi.org/10.3390/fire5040106, 2022.
Krawchuk, M. A., Cumming, S. G., and Flannigan, M. D.: Predicted changes in fire weather suggest increases in lightning fire initiation and future area burned in the mixedwood boreal forest, Clim. Change, 92, 83–97, https://doi.org/10.1007/s10584-008-9460-7, 2009.
Krylov, A., McCarty, J. L., Potapov, P., Loboda, T., Tyukavina, A., Turubanova, S., and Hansen, M. C.: Remote sensing estimates of stand-replacement fires in Russia, 2002–2011, Environ. Res. Lett., 9, 105007, https://doi.org/10.1088/1748-9326/9/10/105007, 2014.
Kukavskaya, E. A., Soja, A. J., Petkov, A. P., Ponomarev, E. I., Ivanova, G. A., and Conard, S. G.: Fire emissions estimates in siberia: Evaluation of uncertainties in area burned, land cover, and fuel consumption, Can. J. Forest Res., 43, 493–506, https://doi.org/10.1139/cjfr-2012-0367, 2013.
Landrum, L. and Holland, M. M.: Extremes become routine in an emerging new Arctic, Nat. Clim. Change, 10, 1108–1115, https://doi.org/10.1038/s41558-020-0892-z, 2020.
Lee, J.-Y., Marotzke, J., Bala, G., Cao, L., Corti, S., Dunne, J. P., Engelbrecht, F., Fischer, E., Fyfe, J. C., Jones, C., Maycock, A., Mutemi, J., Ndiaye, O., Panickal, S., and Zhou, T.: Future Global Climate: Scenario-based Projections and Near-term Information, in: Climate Change 2021 – The Physical Science Basis, Contribution of Working Group I to the Sixth Assessment Report of the Intergovernmental Panel on Climate Change, edited by: Masson-Delmotte, V., Zhai, P., Pirani, A., Connors, S. L., Péan, C., Berger, S., Caud, N., and Chen, Y., Cambridge University Press, UK, and New York, USA, 553–672, https://doi.org/10.1017/9781009157896.006, 2021.
Li, F., Val Martin, M., Andreae, M. O., Arneth, A., Hantson, S., Kaiser, J. W., Lasslop, G., Yue, C., Bachelet, D., Forrest, M., Kluzek, E., Liu, X., Mangeon, S., Melton, J. R., Ward, D. S., Darmenov, A., Hickler, T., Ichoku, C., Magi, B. I., Sitch, S., van der Werf, G. R., Wiedinmyer, C., and Rabin, S. S.: Historical (1700–2012) global multi-model estimates of the fire emissions from the Fire Modeling Intercomparison Project (FireMIP), Atmos. Chem. Phys., 19, 12545–12567, https://doi.org/10.5194/acp-19-12545-2019, 2019.
Lin, N. H., Tsay, S. C., Maring, H. B., Yen, M. C., Sheu, G. R., Wang, S. H., Chi, K. H., Chuang, M. T., Ou-Yang, C. F., Fu, J. S., Reid, J. S., Lee, C. Te, Wang, L. C., Wang, J. L., Hsu, C. N., Sayer, A. M., Holben, B. N., Chu, Y. C., Nguyen, X. A., Sopajaree, K., Chen, S. J., Cheng, M. T., Tsuang, B. J., Tsai, C. J., Peng, C. M., Schnell, R. C., Conway, T., Chang, C. T., Lin, K. S., Tsai, Y. I., Lee, W. J., Chang, S. C., Liu, J. J., Chiang, W. L., Huang, S. J., Lin, T. H., and Liu, G. R.: An overview of regional experiments on biomass burning aerosols and related pollutants in Southeast Asia: From BASE-ASIA and the Dongsha Experiment to 7-SEAS, Atmos. Environ., 78, 1–19, https://doi.org/10.1016/j.atmosenv.2013.04.066, 2013.
Liousse, C., Guillaume, B., Grégoire, J. M., Mallet, M., Galy, C., Pont, V., Akpo, A., Bedou, M., Castéra, P., Dungall, L., Gardrat, E., Granier, C., Konaré, A., Malavelle, F., Mariscal, A., Mieville, A., Rosset, R., Serça, D., Solmon, F., Tummon, F., Assamoi, E., Yoboué, V., and Van Velthoven, P.: Updated African biomass burning emission inventories in the framework of the AMMA-IDAF program, with an evaluation of combustion aerosols, Atmos. Chem. Phys., 10, 9631–9646, https://doi.org/10.5194/acp-10-9631-2010, 2010.
Lobert, J. M., Scharffe, D. H., Hao, W. M., Kuhlbusch, T. A., Seuwen, R., Warneck, P., and Crutzen, P. J.: Experimental Evaluation of Biomass Burning Emissions: Nitrogen and Carbon Containing Compounds, in: Global Biomass Burning: Atmospheric, Climatic, and Biospheric Implications, MIT Press, 289–304, https://doi.org/10.7551/mitpress/3286.003.0041, 1991.
Marlon, J. R., Bartlein, P. J., Carcaillet, C., Gavin, D. G., Harrison, S. P., Higuera, P. E., Joos, F., Power, M. J., and Prentice, I. C.: Climate and human influences on global biomass burning over the past two millennia, Nat. Geosci., 1, 697–702, https://doi.org/10.1038/ngeo313, 2008.
Meehl, G. A., Stocker, T. F., Collins, W. D., Friedlingstein, P., Gaye, A. T., Gregory, J. M., Kitoh, A., Knutti, R., Murphy, J. M., Noda, A., Raper, S. C. B., Watterson, I. G., Weaver, A. J., and Zhao, Z.-C.: Global Climate Projections, in: Climate Change 2007: The Physical Science Basis, Contribution of Working Group I to the Fourth Assessment Report of the Intergovernmental Panel on Climate Change, edited by: Solomon, S., Qin, D., Manning, M., Chen, Z., Marquis, M., Averyt, K. B., Tignor, M., and Miller, H. L., Cambridge University Press, United Kingdom and New York, USA, 2007.
Meigs, G. W., Campbell, J. L., Zald, H. S. J., Bailey, J. D., Shaw, D. C., and Kennedy, R. E.: Does wildfire likelihood increase following insect outbreaks in conifer forests?, Ecosphere, 6, 1–24, https://doi.org/10.1890/ES15-00037.1, 2015.
Meigs, G. W., Zald, H. S. J., Campbell, J. L., Keeton, W. S., and Kennedy, R. E.: Do insect outbreaks reduce the severity of subsequent forest fires?, Environ. Res. Lett., 11, 045008, https://doi.org/10.1088/1748-9326/11/4/045008, 2016.
Melillo, J. M., A. David, M., David, W. K., Berrien M. I., Charles J. V., and Annette L. S.: Global climate change and terrestrial net primary production, Nature, 363, 234–240, https://doi.org/10.2307/2800863, 1993.
Miesner, T., Herzschuh, U., Pestryakova, L. A., Wieczorek, M., Zakharov, E. S., Kolmogorov, A. I., Davydova, P. V., and Kruse, S.: Forest structure and individual tree inventories of northeastern Siberia along climatic gradients, Earth Syst. Sci. Data, 14, 5695–5716, https://doi.org/10.5194/essd-14-5695-2022, 2022.
Miller, C. and Urban, D. L.: Interactions between forest heterogeneity and surface fire regimes in the southern Sierra Nevada, Can. J. Forest Res., 29, 202–212, https://doi.org/10.1139/x98-188, 1999.
Morton, D. C., Defries, R. S., Randerson, J. T., Giglio, L., Schroeder, W., and van der Werf, G. R.: Agricultural intensification increases deforestation fire activity in Amazonia, Glob. Change Biol., 14, 2262–2275, https://doi.org/10.1111/j.1365-2486.2008.01652.x, 2008.
Mouillot, F., Schultz, M. G., Yue, C., Cadule, P., Tansey, K., Ciais, P., and Chuvieco, E.: Ten years of global burned area products from spaceborne remote sensing-A review: Analysis of user needs and recommendations for future developments, Int. J. Appl. Earth Obs., 26, 64–79, https://doi.org/10.1016/j.jag.2013.05.014, 2014.
Natali, S. M., Watts, J. D., Rogers, B. M., Potter, S., Ludwig, S. M., Selbmann, A. K., Sullivan, P. F., Abbott, B. W., Arndt, K. A., Birch, L., Björkman, M. P., Bloom, A. A., Celis, G., Christensen, T. R., Christiansen, C. T., Commane, R., Cooper, E. J., Crill, P., Czimczik, C., Davydov, S., Du, J., Egan, J. E., Elberling, B., Euskirchen, E. S., Friborg, T., Genet, H., Göckede, M., Goodrich, J. P., Grogan, P., Helbig, M., Jafarov, E. E., Jastrow, J. D., Kalhori, A. A. M., Kim, Y., Kimball, J. S., Kutzbach, L., Lara, M. J., Larsen, K. S., Lee, B. Y., Liu, Z., Loranty, M. M., Lund, M., Lupascu, M., Madani, N., Malhotra, A., Matamala, R., McFarland, J., McGuire, A. D., Michelsen, A., Minions, C., Oechel, W. C., Olefeldt, D., Parmentier, F. J. W., Pirk, N., Poulter, B., Quinton, W., Rezanezhad, F., Risk, D., Sachs, T., Schaefer, K., Schmidt, N. M., Schuur, E. A. G., Semenchuk, P. R., Shaver, G., Sonnentag, O., Starr, G., Treat, C. C., Waldrop, M. P., Wang, Y., Welker, J., Wille, C., Xu, X., Zhang, Z., Zhuang, Q., and Zona, D.: Large loss of CO2 in winter observed across the northern permafrost region, Nat. Clim. Change, 9, 852–857, https://doi.org/10.1038/s41558-019-0592-8, 2019.
Neto, T. G. S., Carvalho, J. A., Veras, C. A. G., Alvarado, E. C., Gielow, R., Lincoln, E. N., Christian, T. J., Yokelson, R. J., and Santos, J. C.: Biomass consumption and CO2, CO and main hydrocarbon gas emissions in an Amazonian forest clearing fire, Atmos. Environ., 43, 438–446, https://doi.org/10.1016/j.atmosenv.2008.07.063, 2009.
Nguyen, H. M. and Wooster, M. J.: Advances in the estimation of high Spatio-temporal resolution pan-African top-down biomass burning emissions made using geostationary fire radiative power (FRP) and MAIAC aerosol optical depth (AOD) data, Remote Sens. Environ., 248, 111971, https://doi.org/10.1016/j.rse.2020.111971, 2020.
Ninomiya, H., Kato, T., Végh, L., and Wu, L.: Modeling of non-structural carbohydrate dynamics by the spatially explicit individual-based dynamic global vegetation model SEIB-DGVM (SEIB-DGVM-NSC version 1.0), Geosci. Model Dev., 16, 4155–4170, https://doi.org/10.5194/gmd-16-4155-2023, 2023.
Nitzbon, J., Westermann, S., Langer, M., Martin, L. C. P., Strauss, J., Laboor, S., and Boike, J.: Fast response of cold ice-rich permafrost in northeast Siberia to a warming climate, Nat. Commun., 11, 1–11, https://doi.org/10.1038/s41467-020-15725-8, 2020.
Nurrohman, R. K.: SEIB-DGVM with SPITFIRE Code, Zenodo [code], https://doi.org/10.5281/zenodo.13131614, 2024.
Orangeville, L. D., Houle, D., Duchesne, L., Phillips, R. P., Bergeron, Y., and Kneeshaw, D.: Beneficial effects of climate warming on boreal tree growth may be transitory, Nat. Commun., 1–10, https://doi.org/10.1038/s41467-018-05705-4, 2018.
Ozturk, T., Turp, M. T., Türke, M., and Kurnaz, M. L.: Projected changes in temperature and precipitation climatology of Central Asia CORDEX Region 8 by using RegCM4.3.5, Atmos. Res., 183, 296–307, https://doi.org/10.1016/j.atmosres.2016.09.008, 2017.
Pan, X., Chin, M., Gautam, R., Bian, H., Kim, D., Colarco, P. R., Diehl, T. L., Takemura, T., Pozzoli, L., Tsigaridis, K., Bauer, S., and Bellouin, N.: A multi-model evaluation of aerosols over South Asia: common problems and possible causes, Atmos. Chem. Phys., 15, 5903–5928, https://doi.org/10.5194/acp-15-5903-2015, 2015.
Pan, X., Ichoku, C., Chin, M., Bian, H., Darmenov, A., Colarco, P., Ellison, L., Kucsera, T., da Silva, A., Wang, J., Oda, T., and Cui, G.: Six global biomass burning emission datasets: intercomparison and application in one global aerosol model, Atmos. Chem. Phys., 20, 969–994, https://doi.org/10.5194/acp-20-969-2020, 2020.
Pan, Y., Birdsey, R., Fang, J., Houghton, R., Kauppi, P., Kurz, W. A., Phillips, O., Shvidenko, A., Lewis, S., Canadell, J., Ciais, P., Jackson, R. B., Pacala, S. W., McGuire, A. D., Piao, S., Rautiainen, A., Sitch, S., and Daniel, H.: A Large and Persistent Carbon Sink in the World's Forests, Science, 333, 988–993, https://doi.org/10.1126/science.1201609, 2011.
Pastor, J. and Post, W. M.: Influence of climate, soil moisture, and succession on forest carbon and nitrogen cycles, Biogeoschemistry, 2, 3–27, https://doi.org/10.1007/BF02186962, 1986.
Pellegrini, A. F. A., Harden, J., Georgiou, K., Hemes, K. S., Malhotra, A., Nolan, C. J., and Jackson, R. B.: Fire effects on the persistence of soil organic matter and long-term carbon storage, Nat. Geosci., 15, 5–13, https://doi.org/10.1038/s41561-021-00867-1, 2021.
Pereira, G., Siqueira, R., Rosário, N. E., Longo, K. L., Freitas, S. R., Cardozo, F. S., Kaiser, J. W., and Wooster, M. J.: Assessment of fire emission inventories during the South American Biomass Burning Analysis (SAMBBA) experiment, Atmos. Chem. Phys., 16, 6961–6975, https://doi.org/10.5194/acp-16-6961-2016, 2016.
Petrenko, M., Kahn, R., Chin, M., Soja, A., Kucsera, T., and Harshvardhan: The use of satellite-measured aerosol optical depth to constrain biomass burning emissions source strength in the global model GOCART, J. Geophys. Res.-Atmos., 117, D18212, https://doi.org/10.1029/2012JD017870, 2012.
Petrenko, M., Kahn, R., Chin, M., and Limbacher, J.: Refined Use of Satellite Aerosol Optical Depth Snapshots to Constrain Biomass Burning Emissions in the GOCART Model, J. Geophys. Res.-Atmos., 122, 10983–11004, https://doi.org/10.1002/2017JD026693, 2017.
Pickett, S. T., Wu, J., and Cadenasso., M. L.: Patch dynamics and the ecology of disturbed ground: a framework for synthesis, in: Ecosystems of Disturbed Ground, edited by: Walker, L. R., Elsevier, Amsterdam, 707–722, 1999.
Popovicheva, O., Kistler, M., Kireeva, E., Persiantseva, N., Timofeev, M., Kopeikin, V., and Kasper-Giebl, A.: Physicochemical characterization of smoke aerosol during large-scale wildfires: Extreme event of August 2010 in Moscow, Atmos. Environ., 96, 405–414, https://doi.org/10.1016/j.atmosenv.2014.03.026, 2014.
Pörtner, H.-O., Roberts, D. C., Adams, H., Adelekan, I., Adler, C., Adrian, R., Aldunce, P., Ali, E., Begum, R. A., BednarFriedl, B., Kerr, R. B., Biesbroek, R., Birkmann, J., Bowen, K., Caretta, M. A., Carnicer, J., Castellanos, E., Cheong, T. S., Chow, W., Cissé, G., Clayton, S., Constable, A., Cooley, S. R., Costello, M. J., Craig, M., Cramer, W., Dawson, R., Dodman, D., Efitre, J., Garschagen, M., Gilmore, E. A., Glavovic, B. C., Gutzler, D., Haasnoot, M., Harper, S., Hasegawa, T., Hayward, B., Hicke, J. A., Hirabayashi, Y., Huang, C., Kalaba, K., Kiessling, W., Kitoh, A., Lasco, R., Lawrence, J., Lemos, M. F., Lempert, R., Lennard, C., Ley, D., Lissner, T., Liu, Q., Liwenga, E., Lluch-Cota, S., Löschke, S., Lucatello, S., Luo, Y., Mackey, B., Mintenbeck, K., Mirzabaev, A., Möller, V., Vale, M. M., Morecroft, M. D., Mortsch, L., Mukherji, A., Mustonen, T., Mycoo, M., Nalau, J., New, M., Okem, A., Ometto, J. P., O'Neill, B., Pandey, R., Parmesan, C., Pelling, M., Pinho, P. F., Pinnegar, J., Poloczanska, E. S., Prakash, A., Preston, B., Racault, M.-F., Reckien, D., Revi, A., Rose, S. K., Schipper, E. L. F., Schmidt, D. N., Schoeman, D., Shaw, R., Simpson, N. P., Singh, C., Solecki, W., Stringer, L., Totin, E., Trisos, C. H., Trisurat, Y., Aalst, M. van, Viner, D., Wairiu, M., Warren, R., Wester, P., Wrathall, D., and Ibrahim, Z. Z.: Technical Summary of IPCC Sixth Assessment Report, Cambridge University Press, UK, and New York, USA, 35–74 pp., https://doi.org/10.1017/9781009325844.002, 2022.
Qiu, C., Ciais, P., Zhu, D., Guenet, B., Chang, J., Chaudhary, N., Kleinen, T., Li, X. Y., Müller, J., Xi, Y., Zhang, W., Ballantyne, A., Brewer, S. C., Brovkin, V., Charman, D. J., Gustafson, A., Gallego-Sala, A. V., Gasser, T., Holden, J., Joos, F., Kwon, M. J., Lauerwald, R., Miller, P. A., Peng, S., Page, S., Smith, B., Stocker, B. D., Sannel, A. B. K., Salmon, E., Schurgers, G., Shurpali, N. J., Wårlind, D., and Westermann, S.: A strong mitigation scenario maintains climate neutrality of northern peatlands, One Earth, 5, 86–97, https://doi.org/10.1016/j.oneear.2021.12.008, 2022.
Rabin, S. S., Melton, J. R., Lasslop, G., Bachelet, D., Forrest, M., Hantson, S., Kaplan, J. O., Li, F., Mangeon, S., Ward, D. S., Yue, C., Arora, V. K., Hickler, T., Kloster, S., Knorr, W., Nieradzik, L., Spessa, A., Folberth, G. A., Sheehan, T., Voulgarakis, A., Kelley, D. I., Prentice, I. C., Sitch, S., Harrison, S., and Arneth, A.: The Fire Modeling Intercomparison Project (FireMIP), phase 1: experimental and analytical protocols with detailed model descriptions, Geosci. Model Dev., 10, 1175–1197, https://doi.org/10.5194/gmd-10-1175-2017, 2017.
Randerson, J. T., Liu, H., Flanner, M. G., Chambers, S. D., Jin, Y., Hess, P. G., Pfister, G., Mack, M. C., Treseder, K. K., Welp, L. R., Chapin, F. S., Harden, J. W., Goulden, M. L., Lyons, E., Neff, J. C., Schuur, E. A. G., and Zender, C. S.: The impact of boreal forest fire on climate warming, Science, 314, 1130–1132, https://doi.org/10.1126/science.1132075, 2006.
Randerson, J. T., Chen, Y., Van Der Werf, G. R., Rogers, B. M., and Morton, D. C.: Global burned area and biomass burning emissions from small fires, J. Geophys. Res.-Biogeo., 117, G04012, https://doi.org/10.1029/2012JG002128, 2012.
Reddington, C. L., Spracklen, D. V., Artaxo, P., Ridley, D. A., Rizzo, L. V., and Arana, A.: Analysis of particulate emissions from tropical biomass burning using a global aerosol model and long-term surface observations, Atmos. Chem. Phys., 16, 11083–11106, https://doi.org/10.5194/acp-16-11083-2016, 2016.
Reinhardt, E. D., Keane, R. E., and Brown, J. K.: First order fire effects model: FOFEM 4.0, user's guide, USDA For. Serv. Intermt. Res. Stn., INT-GTR-344, https://doi.org/10.2737/INT-GTR-344, 1997.
Richmond, A., Kaufmann, R. K., and Myneni, R. B.: Valuing ecosystem services: A shadow price for net primary production, Ecol. Econ., 64, 454–462, https://doi.org/10.1016/j.ecolecon.2007.03.009, 2007.
Ritchie, H., Roser, M., and Rosado, P.: CO2 and Greenhouse Gas Emissions, https://www.ourworldindata.org (last access: 28 November 2023), 2020.
Romanov, A. A., Tamarovskaya, A. N., Gusev, B. A., Leonenko, E. V., Vasiliev, A. S., and Krikunov, E. E.: Catastrophic PM2.5 emissions from Siberian forest fires: Impacting factors analysis, Environ. Pollut., 306, 119324, https://doi.org/10.1016/j.envpol.2022.119324, 2022.
Rothermell, R. C.: A Mathematical Model for Predicting Fire Spread, Res. Pap. INT-115. Ogden, UT: U.S. Department of Agriculture, Intermountain Forest and Range Experiment Station. 40 p., 1972.
Running, S. W.: Global aridification and the decline of NPP: A commentary on Projected increases in global terrestrial net primary productivity loss caused by drought under climate change by Dan Cao, Jiahua Zhang, Jiaqi Han, Tian Zhang, Shanshan Yang, Jingwen Wang, Foyez, Earth's Future, 10, 1–3, https://doi.org/10.1029/2022EF003113, 2022.
Santoro, M. and Cartus, O.: ESA Biomass Climate Change Initiative (Biomass_cci): Global datasets of forest above-ground biomass for the years 2010, 2017 and 2018, v3, NERC EDS Centre for Environmental Data Analysis, https://doi.org/10.5285/5f331c418e9f4935b8eb1b836f8a91b8, 2021.
Santoro, M., Cartus, O., Carvalhais, N., Rozendaal, D. M. A., Avitabile, V., Araza, A., de Bruin, S., Herold, M., Quegan, S., Rodríguez-Veiga, P., Balzter, H., Carreiras, J., Schepaschenko, D., Korets, M., Shimada, M., Itoh, T., Moreno Martínez, Á., Cavlovic, J., Cazzolla Gatti, R., da Conceição Bispo, P., Dewnath, N., Labrière, N., Liang, J., Lindsell, J., Mitchard, E. T. A., Morel, A., Pacheco Pascagaza, A. M., Ryan, C. M., Slik, F., Vaglio Laurin, G., Verbeeck, H., Wijaya, A., and Willcock, S.: The global forest above-ground biomass pool for 2010 estimated from high-resolution satellite observations, Earth Syst. Sci. Data, 13, 3927–3950, https://doi.org/10.5194/essd-13-3927-2021, 2021.
Sato, H. and Kobayashi, H.: Topography Controls the Abundance of Siberian Larch Forest, J. Geophys. Res.-Biogeo., 123, 106–116, https://doi.org/10.1002/2017JG004096, 2018.
Sato, H., Itoh, A., and Kohyama, T.: SEIB-DGVM: A new Dynamic Global Vegetation Model using a spatially explicit individual-based approach, Ecol. Model., 200, 279–307, https://doi.org/10.1016/j.ecolmodel.2006.09.006, 2007.
Sato, H., Kobayashi, H., and Delbart, N.: Simulation study of the vegetation structure and function in eastern Siberian larch forests using the individual-based vegetation model SEIB-DGVM, Forest Ecol. Manage., 259, 301–311, https://doi.org/10.1016/j.foreco.2009.10.019, 2010.
Sato, H., Kobayashi, H., Iwahana, G., and Ohta, T.: Endurance of larch forest ecosystems in eastern Siberia under warming trends, Ecol. Evol., 6, 5690–5704, https://doi.org/10.1002/ece3.2285, 2016.
Sato, H., Kobayashi, H., Beer, C., and Fedorov, A.: Simulating interactions between topography, permafrost, and vegetation in Siberian larch forest, Environ. Res. Lett., 15, 095006, https://doi.org/10.1088/1748-9326/ab9be4, 2020.
Schacht, J., Heinold, B., Quaas, J., Backman, J., Cherian, R., Ehrlich, A., Herber, A., Huang, W. T. K., Kondo, Y., Massling, A., Sinha, P. R., Weinzierl, B., Zanatta, M., and Tegen, I.: The importance of the representation of air pollution emissions for the modeled distribution and radiative effects of black carbon in the Arctic, Atmos. Chem. Phys., 19, 11159–11183, https://doi.org/10.5194/acp-19-11159-2019, 2019.
Schimel, D. S., House, J. I., Hibbard, K. A., Bousquet, P., Ciais, P., Peylin, P., Braswell, B. H., Apps, M. J., Baker, D., Bondeau, A., Canadell, J., Churkina, G., Cramer, W., Denning, A. S., Field, C. B., Friedlingstein, P., Goodale, C., Heimann, M., Houghton, R. A., Melillo, J. M., Moore, B., Murdiyarso, D., Noble, I., Pacala, S. W., Prentice, I. C., Raupach, M. R., Rayner, P. J., Scholes, R. J., Steffen, W. L., and Wirth, C.: Recent patterns and mechanisms of carbon exchange by terrestrial ecosystems, Nature, 414, 169–172, https://doi.org/10.1038/35102500, 2001.
Schoennagel, T., Balch, J. K., Brenkert-Smith, H., Dennison, P. E., Harvey, B. J., Krawchuk, M. A., Mietkiewicz, N., Morgan, P., Moritz, M. A., Rasker, R., Turner, M. G., and Whitlock, C.: Adapt tomore wildfire in western North American forests as climate changes, P. Natl. Acad. Sci. USA, 114, 4582–4590, https://doi.org/10.1073/pnas.1617464114, 2017.
Schultz, M. G., Heil, A., Hoelzemann, J. J., Spessa, A., Thonicke, K., Goldammer, J. G., Held, A. C., Pereira, J. M. C., and van Het Bolscher, M.: Global wildland fire emissions from 1960 to 2000, Global Biogeochem. Cy., 22, 1–17, https://doi.org/10.1029/2007GB003031, 2008.
Schuur, E. A. G., McGuire, A. D., Schädel, C., Grosse, G., Harden, J. W., Hayes, D. J., Hugelius, G., Koven, C. D., Kuhry, P., Lawrence, D. M., Natali, S. M., Olefeldt, D., Romanovsky, V. E., Schaefer, K., Turetsky, M. R., Treat, C. C., and Vonk, J. E.: Climate change and the permafrost carbon feedback, Nature, 520, 171–179, https://doi.org/10.1038/nature14338, 2015.
Seiler, W. and Crutzen, P.: Estimates of Gross and Net Fluxes of Carbon Between, Clim. Change, 2, 207–247, 1980.
Sharma, B., Kumar, J., Ganguly, A. R., and Hoffman, F. M.: Carbon cycle extremes accelerate weakening of the land carbon sink in the late 21st century, Biogeosciences, 20, 1829–1841, https://doi.org/10.5194/bg-20-1829-2023, 2023.
Shiraishi, T., Hirata, R., and Hirano, T.: New inventories of global carbon dioxide emissions through biomass burning in 2001–2020, Remote Sens., 13, 1914, https://doi.org/10.3390/rs13101914, 2021.
Shorohova, E., Kuuluvainen, T., Kangur, A., and Jõgiste, K.: Natural stand structures, disturbance regimes and successional dynamics in the Eurasian boreal forests: A review with special reference to Russian studies, Ann. For. Sci., 66, 201–201, https://doi.org/10.1051/forest/2008083, 2009.
Shorohova, E., Kneeshaw, D., Kuuluvainen, T., and Gauthier, S.: Variability and dynamics of old- growth forests in the circumboreal zone: Implications for conservation, restoration and management, Silva Fenn., 45, 785–806, https://doi.org/10.14214/sf.72, 2011.
Shvidenko, A. and Nilsson, S.: A synthesis of the impact of Russian forests on the global carbon budget for 1961–1998, Tellus B, 55, 391, https://doi.org/10.3402/tellusb.v55i2.16722, 2003.
Siegert, F. and Huang, S.: Large-Scale Forest Fires in Siberia Analysed by MODIS, MERIS and ASTER Multiresolution Satellite Imagery, Proceeding 2004 Envisat ERS Symp., Salzburg, Austria, 6–10 September 2004, 1–7, 2005ESASP.572E.307S, 2005.
Sparks, A. M., Kolden, C. A., Smith, A. M. S., Boschetti, L., Johnson, D. M., and Cochrane, M. A.: Fire intensity impacts on post-fire temperate coniferous forest net primary productivity, Biogeosciences, 15, 1173–1183, https://doi.org/10.5194/bg-15-1173-2018, 2018.
Stocker, M., Ladstädter, F., and Steiner, A. K.: Observing the climate impact of large wildfires on stratospheric temperature, Sci. Rep., 11, 1–11, https://doi.org/10.1038/s41598-021-02335-7, 2021.
Sun, L., Yang, L., Wang, D., and Zhang, T.: Influence of the Long-Range Transport of Siberian Biomass Burnings on Air Quality in Northeast China in June 2017, Sensors, 23, 1–13, https://doi.org/10.3390/s23020682, 2023.
Teakles, A. D., So, R., Ainslie, B., Nissen, R., Schiller, C., Vingarzan, R., McKendry, I., Macdonald, A. M., Jaffe, D. A., Bertram, A. K., Strawbridge, K. B., Leaitch, W. R., Hanna, S., Toom, D., Baik, J., and Huang, L.: Impacts of the July 2012 Siberian fire plume on air quality in the Pacific Northwest, Atmos. Chem. Phys., 17, 2593–2611, https://doi.org/10.5194/acp-17-2593-2017, 2017.
Thomson, A. M., Calvin, K. V., Smith, S. J., Kyle, G. P., Volke, A., Patel, P., Delgado-Arias, S., Bond-Lamberty, B., Wise, M. A., Clarke, L. E., and Edmonds, J. A.: RCP4.5: A pathway for stabilization of radiative forcing by 2100, Clim. Change, 109, 77–94, https://doi.org/10.1007/s10584-011-0151-4, 2011.
Thonicke, K., Venevsky, S., and Sitch, S.: The role of fire disturbance for global vegetation dynamics: coupling fire into a Dynamic Global Vegetation Model, Glob. Ecol. Biogeogr., 10, 661–677, 2001.
Thonicke, K., Spessa, A., Prentice, I. C., Harrison, S. P., Dong, L., and Carmona-Moreno, C.: The influence of vegetation, fire spread and fire behaviour on biomass burning and trace gas emissions: results from a process-based model, Biogeosciences, 7, 1991–2011, https://doi.org/10.5194/bg-7-1991-2010, 2010.
Tian, C., Yue, X., Zhu, J., Liao, H., Yang, Y., Chen, L., Zhou, X., Lei, Y., Zhou, H., and Cao, Y.: Projections of fire emissions and the consequent impacts on air quality under 1.5 ° C and 2 ° C global warming, Environ. Pollut., 323, 121311, https://doi.org/10.1016/j.envpol.2023.121311, 2023.
Trenberth, K. E., Jones, P. D., Ambenje, P., Bojariu, R., Easterling, D., Klein Tank, A., Parker, D., Rahimzadeh, F., Renwick, J. A., Rusticucci, M., Soden, B., and Zhai, P.: Observations: Surface and Atmospheric Climate, in: Climate Change 2007: The Physical Science Basis. Contribution of Working Group I to the Fourth Assessment Report of the Intergovernmental Panel on Climate Change, edited by: Solomon, S., Qin, D., Manning, M., Chen, Z., Marquis, M., Averyt, K. B., Tignor, M., and Miller, H. L., Cambridge University Press, UK, and New York, USA, 237–336, 2007.
University of East Anglia Climatic Research Unit: CRU TS3.22: Climatic Research Unit (CRU) Time-Series (TS) Version 3.22 of High Resolution Gridded Data of Month-by-month Variation in Climate (Jan. 1901–Dec. 2013), NCAS British Atmospheric Data Centre, https://doi.org/10.5285/18BE23F8-D252-482D-8AF9-5D6A2D40990C, 2014.
van der Werf, G. R., Randerson, J. T., Giglio, L., Collatz, G. J., Kasibhatla, P. S., and Arellano Jr., A. F.: Interannual variability in global biomass burning emissions from 1997 to 2004, Atmos. Chem. Phys., 6, 3423–3441, https://doi.org/10.5194/acp-6-3423-2006, 2006.
van der Werf, G. R., Randerson, J. T., Giglio, L., Collatz, G. J., Mu, M., Kasibhatla, P. S., Morton, D. C., DeFries, R. S., Jin, Y., and van Leeuwen, T. T.: Global fire emissions and the contribution of deforestation, savanna, forest, agricultural, and peat fires (1997–2009), Atmos. Chem. Phys., 10, 11707–11735, https://doi.org/10.5194/acp-10-11707-2010, 2010.
van der Werf, G. R., Randerson, J. T., Giglio, L., van Leeuwen, T. T., Chen, Y., Rogers, B. M., Mu, M., van Marle, M. J. E., Morton, D. C., Collatz, G. J., Yokelson, R. J., and Kasibhatla, P. S.: Global fire emissions estimates during 1997–2016, Earth Syst. Sci. Data, 9, 697–720, https://doi.org/10.5194/essd-9-697-2017, 2017.
Végh, L. and Kato, T.: Modified SEIB-DGVM enables simulation of masting in a temperate forest, Ecol. Modell., 488, 110577, https://doi.org/10.1016/j.ecolmodel.2023.110577, 2024.
Ward, D. E. and Hardy, C. C.: Smoke emissions from wildland fires, Environ. Int., 17, 117–134, https://doi.org/10.1016/0160-4120(91)90095-8, 1991.
Watanabe, S., Hajima, T., Sudo, K., Nagashima, T., Takemura, T., Okajima, H., Nozawa, T., Kawase, H., Abe, M., Yokohata, T., Ise, T., Sato, H., Kato, E., Takata, K., Emori, S., and Kawamiya, M.: MIROC-ESM 2010: model description and basic results of CMIP5-20c3m experiments, Geosci. Model Dev., 4, 845–872, https://doi.org/10.5194/gmd-4-845-2011, 2011.
Webb, E. E., Alexander, H. D., Paulson, A. K., Loranty, M. M., DeMarco, J., Talucci, A. C., Spektor, V., Zimov, N., and Lichstein, J. W.: Fire-Induced Carbon Loss and Tree Mortality in Siberian Larch Forests, Geophys. Res. Lett., 51, 1–12, https://doi.org/10.1029/2023GL105216, 2024.
Westerling, A. L., Hidalgo, H. G., Cayan, D. R., and Swetnam, T. W.: Warming and earlier spring increase Western U.S. forest wildfire activity, Science, 313, 940–943, https://doi.org/10.1126/science.1128834, 2006.
Whelan, R. J.: The ecology of fire-developments since 1995 and outstanding questions, Proc. R. Soc. Queensl., 115, 59–68, 2009.
Winiger, P., Andersson, A., Eckhardt, S., Stohl, A., Semiletov, I. P., Dudarev, O. V., Charkin, A., Shakhova, N., Klimont, Z., Heyes, C., and Gustafsson, Ö.: Siberian Arctic black carbon sources constrained by model and observation, P. Natl. Acad. Sci. USA, 114, E1054–E1061, https://doi.org/10.1073/pnas.1613401114, 2017.
Wotton, B. M., Flannigan, M. D., and Marshall, G. A.: Potential climate change impacts on fire intensity and key wildfire suppression thresholds in Canada, Environ. Res. Lett., 12, 1–13, https://doi.org/10.1088/1748-9326/aa7e6e, 2017.
Wu, L., Kato, T., Sato, H., Hirano, T., and Yazaki, T.: Sensitivity analysis of the typhoon disturbance effect on forest dynamics and carbon balance in the future in a cool-temperate forest in northern Japan by using SEIB-DGVM, Forest Ecol. Manage., 451, 117529, https://doi.org/10.1016/j.foreco.2019.117529, 2019.
Yasunari, T. J., Narita, D., Takemura, T., Wakabayashi, S., and Takeshima, A.: Comprehensive Impact of Changing Siberian Wildfire Severities on Air Quality, Climate, and Economy: MIROC5 Global Climate Model's Sensitivity Assessments, Earth's Futur., 12, 1–15, https://doi.org/10.1029/2023EF004129, 2024.
Yuan, Z., Wang, Y., Xu, J., and Wu, Z.: Effects of climatic factors on the net primary productivity in the source region of Yangtze River, China, Sci. Rep., 11, 1–11, https://doi.org/10.1038/s41598-020-80494-9, 2021.
Zhang, F., Wang, J., Ichoku, C., Hyer, E. J., Yang, Z., Ge, C., Su, S., Zhang, X., Kondragunta, S., Kaiser, J. W., Wiedinmyer, C., and Da Silva, A.: Sensitivity of mesoscale modeling of smoke direct radiative effect to the emission inventory: A case study in northern sub-Saharan African region, Environ. Res. Lett., 9, 1–14, https://doi.org/10.1088/1748-9326/9/7/075002, 2014.
Zheng, B., Ciais, P., Chevallier, F., Chuvieco, E., Chen, Y., and Yang, H.: Increasing forest fire emissions despite the decline in global burned area, Sci. Adv., 7, 1–8, https://doi.org/10.1126/sciadv.abh2646, 2021.