the Creative Commons Attribution 4.0 License.
the Creative Commons Attribution 4.0 License.
 | 25 Jan 2024
Large contribution of soil N2O emission to the global warming potential of a large-scale oil palm plantation despite changing from conventional to reduced management practices
Edzo Veldkamp
Muhammad Damris
Bambang Irawan
Aiyen Tjoa
Marife D. Corre
Conventional management of oil palm plantations, involving high fertilization rate and herbicide application, results in high yield but with large soil greenhouse gas (GHG) emissions. This study aimed to assess a practical alternative to conventional management, namely reduced fertilization with mechanical weeding, to decrease soil GHG emissions without sacrificing production. We established a full factorial experiment with two fertilization rates (conventional and reduced fertilization, equal to nutrients exported via fruit harvest) and two weeding methods (herbicide and mechanical), each with four replicate plots, since 2016 in a ≥ 15-year-old, large-scale oil palm plantation in Indonesia. Soil CO2, N2O, and CH4 fluxes were measured during 2019–2020, and yield was measured during 2017–2020. Fresh fruit yield (30 ± 1 ) and soil GHG fluxes did not differ among treatments (P≥ 0.11), implying legacy effects of over a decade of conventional management prior to the start of the experiment. Annual soil GHG fluxes were 5.5 ± 0.2 Mg CO2-C ha−1 yr−1, 3.6 ± 0.7 kg N2O-N ha−1 yr−1, and −1.5 ± 0.1 kg CH4-C ha−1 yr−1 across treatments. The palm circle, where fertilizers are commonly applied, covered 18 % of the plantation area but accounted for 79 % of soil N2O emission. The net primary production of this oil palm plantation was 17 150 ± 260 , but 62 % of this was removed by fruit harvest. The global warming potential of this planation was 3010 ± 750 , of which 55 % was contributed by soil N2O emission and only < 2 % offset by the soil CH4 sink.
- Article
(2821 KB) - Full-text XML
-
Supplement
(778 KB) - BibTeX
- EndNote


With increasing demand for vegetable oil, oil palm as a productive woody oil crop is widely planted in the tropics (Descals et al., 2021). Globally, the oil palm planted area rapidly increased from 4×10⁶ ha in 1980 to 28×106 ha in 2019 (FAO, 2021), and oil palm plantations are expected to continue to expand to meet the increasing demand of a growing world population (OECD, 2022). Oil palm expansion drives tropical deforestation (Vijay et al., 2016) and is accompanied by serious reductions in multiple ecosystem functions, e.g., decreases in C storage (Kotowska et al., 2015; van Straaten et al., 2015), nutrient cycling and retention (Allen et al., 2015; Kurniawan et al., 2018), and biodiversity losses (Clough et al., 2016). Despite these losses of ecosystem multifunctionality, profit gains increase under oil palm plantations (Grass et al., 2020), which increase farm and non-farm households' income and improve their livelihood (Bou Dib et al., 2018). Moreover, the high yield of oil palm plays an invaluable role in meeting human demand for vegetable oil (Thomas et al., 2015; Rochmyaningsih, 2019). However, there is a need for a balance between economic gains and maintaining or avoiding further degradation of ecosystem functions (Bessou et al., 2017). Conventional management practices of large-scale oil palm plantations (> 50 ha planted area, can be up to 20 000 ha and owned by corporations), particularly high fertilization rates and herbicide application, are agents of these decreases in ecosystem functions (Tao et al., 2016; Ashton-Butt et al., 2018; Rahman et al., 2019). Thus, there is a need for practical solutions that can easily be implemented in order to reduce these negative impacts on ecosystem functions without sacrificing productivity and profit.
Soil greenhouse gas (GHG) emissions are a concern in oil palm plantations (Kaupper et al., 2020; Skiba et al., 2020). Compared to forests, the reductions in plant biomass production, soil organic carbon (SOC), and soil microbial biomass, as well as C removal from the field via fruit harvest and increase in soil bulk density in oil palm plantations, largely decrease the latter's GHG abatement capability (Kotowska et al., 2015; van Straaten et al., 2015; Clough et al., 2016). This capability is influenced by agricultural management practices, especially fertilization rates (Sakata et al., 2015; Hassler et al., 2017; Rahman et al., 2019). N fertilization in oil palm plantations during the wet season can increase soil N2O emissions (Aini et al., 2015; Hassler et al., 2017), a potent GHG and agent of ozone depletion (Davidson et al., 2000). Soil N2O emissions from tropical agriculture are largely controlled by soil mineral N availability, which in turn is influenced by N fertilization rate and soil moisture, as N2O production processes of denitrification and nitrification in the soil are favored under high soil mineral N and moisture levels (Khalil et al., 2002; Liyanage et al., 2020; Quiñones et al., 2022). In Indonesia, a large-scale oil palm plantation with commonly high N fertilization rates has higher soil N2O emissions than smallholder oil palm plantations (< 5 ha of planted area per household) with low N fertilization rates (Hassler et al., 2017).
Soil CO2 emissions originate from heterotrophic and root respiration (Bond-Lamberty et al., 2004). The temporal pattern of soil CO2 emission follows the seasonal dynamics of soil moisture and/or soil temperature, exhibiting low soil CO2 emissions at low soil moisture content, increases toward an optimum soil moisture, and decreases towards water saturation when oxygen availability and gas diffusion limit soil CO2 emissions (Sotta et al., 2007; van Straaten et al., 2011). The spatial pattern of soil CO2 emissions in tropical ecosystems is influenced by the spatial variation in soil organic matter, bulk density, root biomass, and available N and P levels in the soil (Adachi et al., 2006; Hassler et al., 2015; Cusack et al., 2019; Tchiofo Lontsi et al., 2020). Another important GHG that is influenced by management practices in tropical plantations or croplands is CH4 (Hassler et al., 2015; Quiñones et al., 2022). Soil surface CH4 flux is the net effect of CH4 production by methanogenic archaea and CH4 oxidation by methanotrophic bacteria (Hanson and Hanson, 1996). In well-drained tropical soils, CH4 oxidation usually is more dominant than CH4 production, resulting in a net soil CH4 uptake or negative CH4 flux (Veldkamp et al., 2013). The seasonal pattern of soil surface CH4 flux in smallholder oil palm plantations in Indonesia reflects the seasonal variation in soil moisture, with lower CH4 uptake during the wet season than the dry season (Hassler et al., 2015). In well-drained tropical soils with low N availability, soil CH4 uptake or methanotrophic activity is enhanced with increases in soil mineral N content (Veldkamp et al., 2013; Hassler et al., 2015; Tchiofo Lontsi et al., 2020). However, in tropical agricultural soils with high soil mineral N levels ( and ) from high N fertilization, competition of against CH4 for the active site of the mono-oxygenase enzyme can reduce soil CH4 uptake (Hanson and Hanson, 1996). Veldkamp et al. (2001) observed a temporary inhibition of CH4 uptake for approximately 3 weeks following -based fertilizer application in tropical pasture soils. In contrast, high soil levels (e.g., resulting from nitrification of applied N fertilizer) can inhibit CH4 production in the soil since is preferred over bicarbonate as an electron acceptor (Martinson et al., 2021; Quiñones et al., 2022). Nonetheless, across forests and smallholder rubber and oil palm plantations in Indonesia, the overriding pattern is the increase in soil CH4 uptake with increase in soil mineral N, suggesting the prevailing control of N availability on methanotrophic activity in the soil (Hassler et al., 2015). The spatial patterns of soil surface CH4 fluxes depict the spatial variations in soil properties that affects soil moisture content and gas diffusivity, such as soil texture (Veldkamp et al., 2013; Tchiofo Lontsi et al., 2020), soil bulk density, and organic matter (e.g., at a plot or landscape scale; Tchiofo Lontsi et al., 2020).
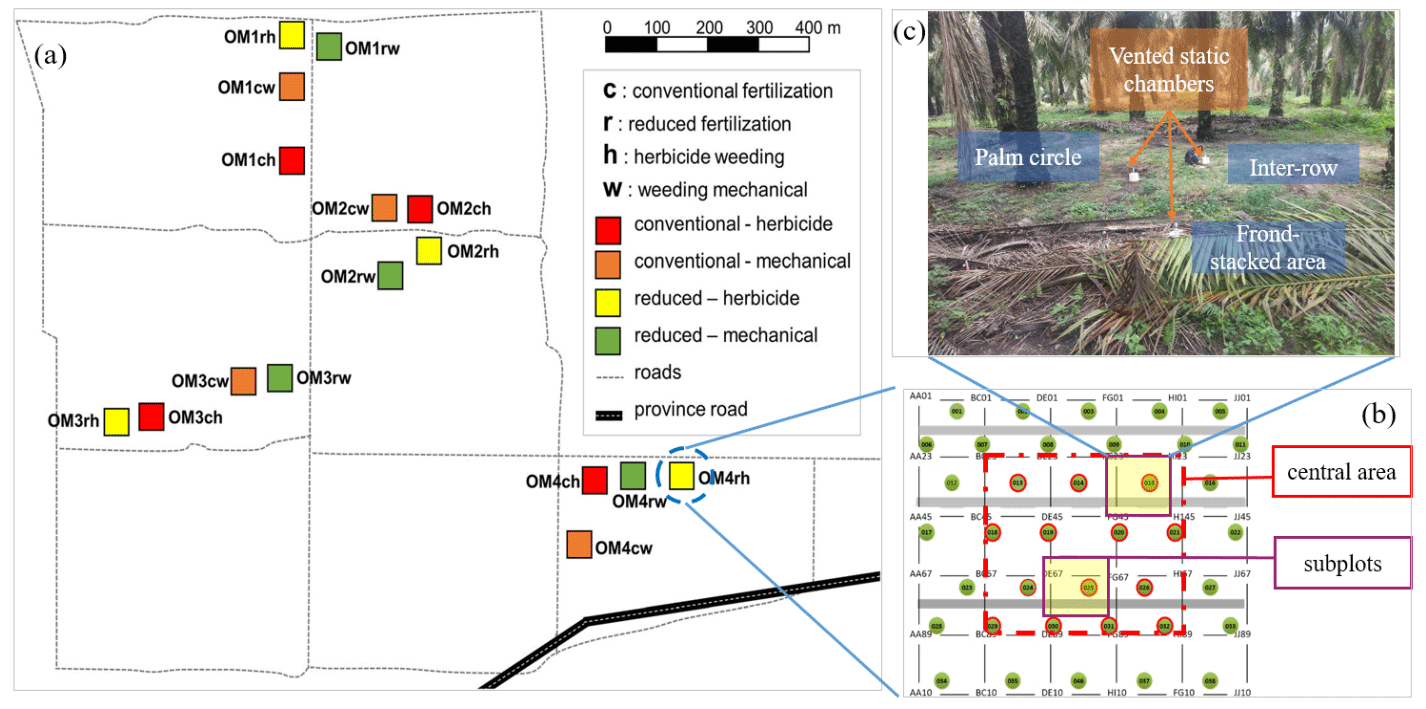
Figure 1Experimental setup. A 2 × 2 factorial experiment design with four blocks (OM1–4) within which are the four treatments (each plot was 50 m × 50 m; ch: conventional fertilization–herbicide weeding; cw: conventional fertilization–mechanical weeding; rh: reduced fertilization–herbicide weeding; rw: reduced fertilization–mechanical weeding) (a). All plant parameters were measured within the central 30 m × 30 m area of a replicate plot to avoid the edge effect. Two subplots were selected in the central 30 m × 30 m area in each plot (b). In each subplot, soil GHG flux measurements were conducted at each management zone (palm circle, inter-row, and frond-stacked area) using vented static chambers (c).
In large-scale oil palm plantations, the typical management practices of fertilization, weeding, and pruning of senesced fronds result in three distinctive spatial management zones: palm circle (weeded and fertilizers are applied), inter-row (weeded but not fertilized), and frond-stacked area (where pruned fronds are piled) (Fig. 1; Formaglio et al., 2021). In the palm circle and inter-row, frequent management activities (weeding, pruning, and harvesting) result in soil compaction by foot traffic (increased soil bulk density), and the low litter input in these zones exhibits low SOC and microbial biomass, as well as low soil N cycling rate (Formaglio et al., 2021). Additionally, root biomass is high in the palm circle (Dassou et al., 2021). In the frond-stacked area, decomposition of fronds results in large SOC (with decreased soil bulk density), large microbial and fine root biomass, and high soil N cycling rate (Moradi et al., 2014; Rüegg et al., 2019; Formaglio et al., 2020; Dassou et al., 2021). Overall, the differences in soil properties and root biomass among these spatially distinct management zones (Formaglio et al., 2021) potentially drive the spatial variation in soil GHG fluxes from oil palm plantations (Hassler et al., 2015, 2017; Aini et al., 2020). Thus, estimating soil GHG emissions from oil palm plantations should take into account the spatial variability among management zones within a site or plot.
This study aimed to (1) assess differences in soil GHG fluxes from conventional high fertilization rates with herbicide application compared to alternative management of reduced fertilization rates (equal to nutrient exported via fruit harvest) with mechanical weeding and (2) determine the controlling factors of the soil GHG fluxes from a large-scale oil palm plantation. A 2 × 2 factorial field experiment with conventional and reduced fertilization rates as well as herbicide and mechanical weed control was established in a ≥ 15-year-old, large-scale oil palm plantation in Jambi, Indonesia, starting in November 2016. The earlier studies during the first 1.5 years of this oil palm management experiment show comparable gross rates of soil N cycling, microbial biomass (Formaglio et al., 2021), and root biomass (Ryadin et al., 2022) among treatments. Thus, we tested these hypotheses: (1) during 2.5–3.5 years of this management experiment, the reduced fertilization with mechanical weeding will have comparable soil CO2 and CH4 fluxes but lower soil N2O emissions than the conventional fertilization with herbicide weeding. (2) The three management zones will differ in soil GHG fluxes, reflecting their inherent soil characteristics. Specifically, (2a) the fertilized palm circle that has high soil bulk density and root biomass but low SOC, soil microbial biomass, and soil N cycling rate (Dassou et al., 2021; Formaglio et al., 2021) will have large soil CO2 and N2O emissions but small soil CH4 uptake; (2b) the unfertilized inter-row that has high soil bulk density but low SOC, microbial biomass, and soil N cycling rate (Formaglio et al., 2021) will have low soil CO2 and N2O emissions and CH4 uptake; (2c) the frond-stacked area (i.e., unfertilized but piled with pruned fronds) that has large SOC, microbial biomass, and soil N cycling rate but low soil bulk density (Formaglio et al., 2021) will have large soil CO2 emissions and CH4 uptake but low soil N2O emissions. In this study, we assessed the soil GHG footprint and the global warming potential (GWP) of a typical large-scale oil palm plantation in order to evaluate reduced management (i.e., reduced fertilization rate with mechanical weeding) against the commonly employed conventional management (i.e., high fertilization rate with herbicide application).
2.1 Site description and experimental design
This study was conducted in a large-scale oil palm plantation in Jambi, Indonesia (1∘43′8′′ S, 103∘23′53′′ E; 73 m above sea level). The plantation was 2025 ha and established between 1998 and 2002 and thus was ≥ 18 years old during our measurement of soil GHG fluxes from July 2019 to June 2020. The oil palms were planted in a triangular pattern with 8 m spacing between palms, and the planting density was 142 palms ha−1. Mean annual (2010–2020) air temperature is 26.9 ± 0.2 ∘C, and mean annual precipitation is 2078 ± 155 mm. The soil is Acrisol with a sandy clay loam texture (Table S1 in the Supplement). More than 18 years of management induced three distinct zones within this oil palm plantation: palm circle, inter-row, and frond-stacked area (Fig. 1) (Formaglio et al., 2020). The palm circle (a 2 m radius from the palm base) is the zone where fertilizers and lime are applied (in April and October of each year) and is weeded every 3 months; this represents 18 % of the plantation area. The inter-row (outside the palm circle and not used for placing cut fronds) is unfertilized but weeded every 6 months; this represents 67 % of the plantation area. The frond-stacked area is where senesced fronds are piled and is neither fertilized nor weeded; this represents 15 % of the plantation area. As consequences of these management activities, SOC and total N stocks are higher, whereas soil bulk density is lower in the frond-stacked area than the palm circle and inter-row. The effective cation exchange capacity and pH, influenced by the applied lime as well as from decomposed leaf litter, are higher in the palm circle and frond-stacked area than the inter-row (Table S1) (Formaglio et al., 2020).
This oil palm management experiment started in November 2016 – a 2 × 2 factorial design of two fertilization rates and two weeding methods: conventional fertilization–herbicide weeding (ch), conventional fertilization–mechanical weeding (cw), reduced fertilization–herbicide weeding (rh), and reduced fertilization–mechanical weeding (rw). These four treatments were randomly assigned to four plots (50 m × 50 m each) in a block, and there were four replicate blocks (Fig. 1a). All parameters were measured within the inner 30 m × 30 m area of a replicate plot to avoid the edge effect (Fig. 1b). We selected two subplots in the inner 30 m × 30 m area, and each subplot included the three management zones (Fig. 1c), where soil GHG fluxes and soil variables were measured (see below).
Conventional fertilization rates were 260 kg N, 50 kg P, and 220 , commonly practiced in large-scale oil palm plantations in Jambi, Indonesia (Formaglio et al., 2020). Reduced fertilization rates were 136 kg N, 17 kg P, and 187 , equal to the nutrients exported by fruit harvest (detail calculation given by Formaglio et al., 2021). The fertilizer sources were urea, triple superphosphate, muriate of potash, or NPK complete. For herbicide weed control, glyphosate was used at a rate of 1.5 in the palm circle (split into four applications per year) and 0.75 in the inter-row (split into two applications per year). Mechanical weeding used a brush cutter with the same weeding frequencies as the herbicide applications. All treatments received the same rates of lime (426 ) and micronutrients (142 with 0.5 % B2O3, 0.5 % CuO, 0.25 % Fe2O3, 0.15 % ZnO, 0.1 % MnO, and 18 % MgO), applied only in the palm circle.
2.2 Soil greenhouse gas fluxes
Soil CO2, N2O, and CH4 fluxes were measured monthly from July 2019 to June 2020 using vented static chambers. Measurement schedules were random among plots (i.e., 16 plots, each with two subplots that each encompassed three management zones) such that we covered the temporal variability in soil GHG fluxes (e.g., peak of soil N2O emissions during 2 weeks following fertilization), as observed in our earlier study (Hassler et al., 2017). During the year-round measurements, chamber bases (0.04 m2 area) were installed permanently at each management zone (i.e., palm circle, inter-row, and frond-stacked area) in all subplots of 16 plots (Fig. 1), totaling 96 chambers, by inserting these into the soil at approximately 0.02 m depth. This insertion depth is sufficient to fix the chamber base while avoiding cutting off roots (Hassler et al., 2015; 2017; van Straaten et al., 2011). The chamber base in the palm circle was placed at 1.7 m away from the oil palm tree, and the chamber base in the inter-row was about 5 m from the oil palm trees (Fig. 1). Any aboveground vegetation inside the chambers was carefully cut during the study period, but root and litter remained as normal. The chamber base in the frond-stacked area was kept covered with senesced fronds except during the time of soil GHG flux measurement. During the measurement, the chamber bases were covered for 28 min with polyethylene covers (11 L total volume) that were equipped with a Luer-lock sampling port. Four gas samples (23 mL each) were taken using syringes at 1, 10, 19, and 28 min following chamber closure and injected into pre-evacuated 12 mL glass vials (Labco Exetainers, Labco Limited, Lampeter, UK) with rubber septa. On each monthly measurement, 384 gas samples were taken (i.e., 16 plots × 2 subplots × 3 management zones × 4 chamber headspace-sampling intervals). As a check for possible leakage, we also stored standard gases into pre-evacuated 12 mL glass vials in the same period as the field gas samples. All gas samples were transported to the University of Göttingen, Germany, for analysis.
Gas samples were analyzed using a gas chromatograph (SRI 8610C, SRI Instruments Europe GmbH, Bad Honnef, Germany) equipped with a flame ionization detector to measure CH4 and CO2 concentrations (with a methanizer), as well as an electron capture detector for N2O analysis (with a make-up gas of 5 % CO2–95 % N2). Soil CO2, N2O, and CH4 fluxes were calculated from the linear change in concentrations with chamber closure time, adjusted with the measured air temperature and atmospheric pressure during sampling. We found that the concentrations of all standard gases stored for the same duration as the field gas samples stayed the same as those in the standard gases at our laboratory. The quality check for each flux measurement was based on the linear increase in CO2 concentrations with chamber closure time (R2≥0.9). For soil CH4 and N2O, all flux measurements (including zero and negative fluxes) were included in the data analysis. For an overall value of soil CO2, N2O, and CH4 fluxes in a plot, fluxes were weighted by the areal coverages of the three management zones (see above). Area-weighted annual soil CO2, N2O, and CH4 fluxes were estimated based on trapezoidal extrapolations between measured fluxes and sampling day intervals.
2.3 Soil variables
Concurrent with soil GHG flux measurement, soil temperature, mineral N, and moisture content in the top 5 cm depth were determined. Soil temperature was recorded using a portable thermometer (Greisinger GMH 3210, Greisinger Messtechnik GmbH, Regenstauf, Germany). At about 1 m away from each chamber, soil samples were collected and pooled from the two subplots for each management zone. Part of each soil sample was added to a prepared bottle containing 150 mL 0.5 M K2SO4 for immediate mineral N extraction. Upon arrival at the field laboratory, the bottles were shaken for 1 h, filtered and the extracts were immediately frozen. The remaining soil sample was oven-dried at 105 ∘C for 24 h to determine the gravimetric moisture content, which was used to calculate the dry mass of the soil extracted for mineral N. The moisture content was expressed as water-filled pore space (WFPS), using the mineral soil particle density of 2.65 g cm−3 and the average soil bulk density in the top 5 cm (1.23 g cm−3 in the palm circle, 1.20 g cm−3 in the inter-row, and 0.52 g cm−3 in the frond-stacked area). In April and May 2020, we were unable to conduct WFPS and mineral N measurements due to restrictions from the COVID-19 pandemic. The frozen extracts were transported by air to the University of Göttingen and analyzed for and concentrations using continuous flow injection colorimetry (SEAL Analytical AA3, SEAL Analytical GmbH, Norderstedt, Germany).
2.4 Global warming potential estimation
First, the net primary production (NPP) was determined. Within the inner 30 m × 30 m area in each replicate plot (Fig. 1b), all the palms were measured for their stem height, harvested fruit weight, and the number of pruned fronds during 2017–2020 (Iddris et al., 2023). Aboveground biomass per palm was calculated using the allometric growth equation given by Asari et al. (2013). Annual aboveground biomass production per palm is the difference in aboveground biomass between 2 consecutive years, averaged over a 2-year period (2018–2019 and 2019–2020).
Second, the net ecosystem productivity (NEP) was calculated following Malhi et al. (1999), which was applied by Quiñones et al. (2022) for agricultural land use.
Our measured soil CO2 fluxes included both autotrophic and heterotrophic respirations. We assumed 70 % heterotrophic contribution to soil CO2 efflux, based on a long-term quantification in a forest in Sulawesi, Indonesia (van Straaten et al., 2011). As the frond litter also contributes to heterotrophic respiration upon decomposition, we assumed this fraction to be 80 % of frond litter biomass C, based on the frond litter decomposition rate in the same plantation (Iddris et al., 2023). We used the area-weighted value (based on the areal coverages of the three management zones; see Sect. 2.1 above) of the annual heterotrophic respiration to calculate NEP for each replicate plot.
Third, the GWP was calculated following Meijide et al. (2020) and Quiñones et al. (2022).
where 3.67 is C-to-CO2 conversion, and 298 and 25 are CO2 equivalents of N2O and CH4, respectively, for a 100-year time horizon (IPCC, 2006). Similarly, we used the area-weighted values of the annual soil N2O and CH4 fluxes (see Sect. 2.2 above) to calculate GWP for each replicate plot. Negative and positive symbols indicate the direction of the flux: (−) for C uptake and (+) for C export or emission from the plantation.
Table 1Soil CO2, N2O, and CH4 fluxes (means ± SE, n = 4 plots) from different fertilization and weeding treatments in an ≥ 18-year-old, large-scale oil palm plantation, Jambi, Indonesia, measured monthly from July 2019 to June 2020.
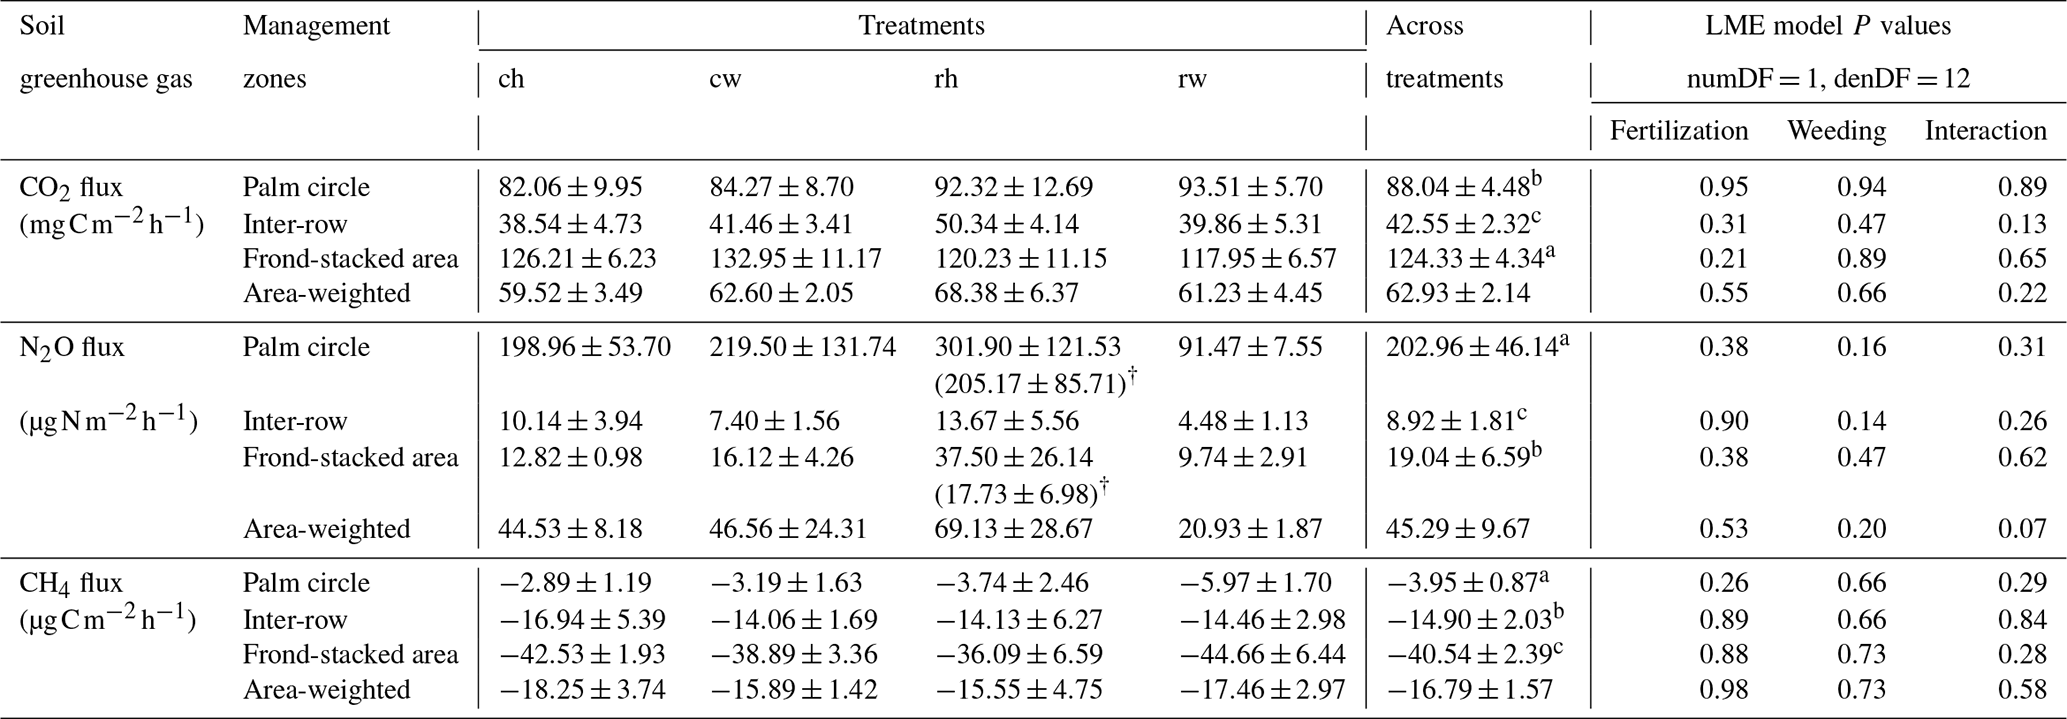
For each soil greenhouse gas, different letters within each column indicate significant differences among management zones across treatments (22 factorial ANOVA with linear mixed-effects models and Tukey's HSD test at P≤ 0.05); numDF and denDF are numerator and denominator degrees of freedom, respectively. ch: conventional fertilization–herbicide weeding; cw: conventional fertilization–mechanical weeding; rh: reduced fertilization–herbicide weeding; rw: reduced fertilization–mechanical weeding. † For soil N2O fluxes, values in parentheses excluded two extreme outliers in the palm circle (5311 and 4325 ) and one extreme outlier in the frond-stacked area (1934 ).
2.5 Statistical analysis
The mean value of two subplots for the soil GHG fluxes and soil temperature was used to represent each plot and management zone on each sampling day. The normality of distribution and equality of variance were first tested using Shapiro–Wilk's test and Levene's test, respectively. Linear mixed-effects (LME) models with Tukey's HSD test were used to assess the differences in soil GHG fluxes and soil variables (WFPS, soil temperature, and mineral N content) among treatments (Crawley, 2013). In the LME models, management (2 × 2 factorial of fertilization rates, weed control, and their interaction) was considered the fixed effect, whereas plot and sampling day were taken as random effects, and statistical analyses were conducted for each management zone. As there were no significant differences among treatments (Table 1), we tested differences among the three management zones across treatments; for the latter, management zone was the fixed effect in the LME model, and plot and sampling day were random effects. We also assessed if there were seasonal differences, and the year-round measurements were categorized into dry (precipitation ≤ 80 mm per month) and wet seasons; this was conducted for each management zone, and season was the fixed effect in the LME model, and plot and sampling day were random effects. For all the above analyses, the LME models further included a variance function that allows variance heteroscedasticity of the fixed effect and/or a first-order temporal autoregressive process that assumes decreasing auto-correlation between sampling days with increasing time difference, if these improve the model performance based on the Akaike information criterion. The model residual was checked using diagnostic plots and finally soil CO2 and N2O fluxes, and soil and concentrations were re-analyzed after log transformation as the model residual distributions approximated the normal distribution.
The relationships between soil GHG fluxes and soil variables were determined by Spearman's rank correlation test. Correlations tests were conducted on the means of the four replicate plots on each measurement day for each management zone (n = 144 for soil temperature, from 4 treatments × 3 management zones × 12 monthly measurements; n = 120 for WFPS and mineral N content, from 4 treatments × 3 management zones × 10 monthly measurements). All data analyses were performed using R version 4.0.5 (R core Team, 2021). The statistical significance for all the tests was set at P≤0.05.
3.1 Soil greenhouse gas fluxes and global warming potential estimate
Soil CO2 emissions from the palm circle and frond-stacked area were higher in the wet season than in the dry season (P≤0.03; Fig. S1 in the Supplement). Soil N2O emissions from the palm circle sharply increased after fertilizer application and returned to background levels after 2 months (Fig. S2 in the Supplement). Excluding the direct effects after fertilization, the palm circle had higher soil N2O emissions in the wet season than the dry season (P = 0.03; Fig. S2). Soil CH4 uptake was higher in the dry season than the wet season in all three management zones (P≤0.01; Fig. S3 in the Supplement). The frond-stacked area showed consistent CH4 uptake throughout the measurement period, whereas 33 % and 17 % of measured soil CH4 fluxes in the palm circle and inter-row, respectively, were net CH4 emissions (Fig. S3).
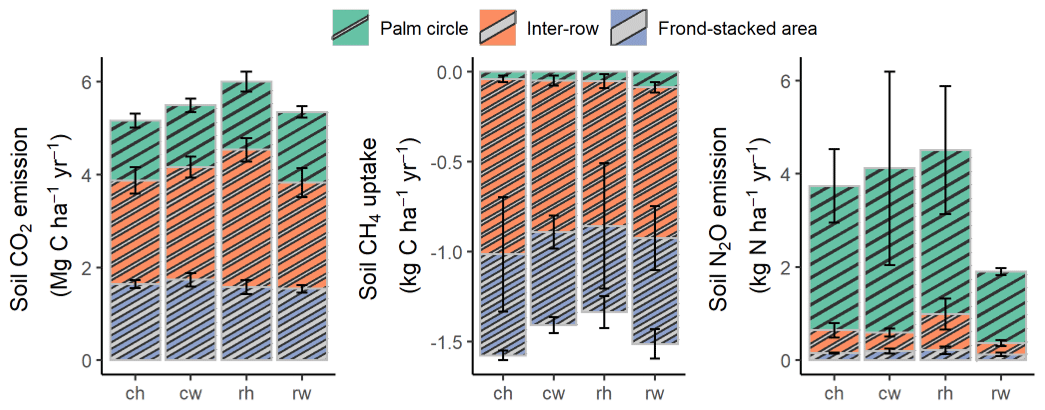
Figure 2Annual soil CO2, N2O, and CH4 fluxes (means ± SE, n = 4 plots), weighted by the areal coverages of the palm circle (18 %), inter-row (67 %), and frond-stacked area (15 %) under different fertilization and weeding treatments in an ≥ 18-year-old, large-scale oil palm plantation, Jambi, Indonesia. ch: conventional fertilization–herbicide weeding; cw: conventional fertilization–mechanical weeding; rh: reduced fertilization–herbicide weeding; rw: reduced fertilization–mechanical weeding. Annual soil N2O emissions from rh were calculated excluding three extreme outliers: 5311 and 4325 in the palm circle and 1934 in the frond-stacked area. Annual soil CO2, N2O, and CH4 fluxes were not statistically tested since these are trapezoidal extrapolations between measurement periods.
Reduced and conventional management had comparable soil CO2 emissions (fertilization, weeding, and their interaction: P≥0.13), N2O emissions (fertilization, weeding, and their interaction: P≥0.14), and CH4 fluxes (fertilization, weeding, and their interaction: P≥0.26) in each management zone (Table 1). However, there were clear differences in soil GHG fluxes among the three management zones. The palm circle had the highest soil N2O emissions and lowest soil CH4 uptake (P≤0.01; Table 1), the inter-row had the lowest soil CO2 and N2O emissions (P≤0.01; Table 1), and the frond-stacked area had the highest soil CO2 emissions and CH4 uptake (P≤0.01; Table 1). The palm circle accounted for 25 %, the inter-row for 45 %, and the frond-stacked area for 30 % of the annual soil CO2 emissions (Fig. 2). The palm circle comprised 79 % of the annual soil N2O emissions, although it only accounted for 18 % of the plantation area (Fig. 2). The frond-stacked area with 15 % areal coverage contributed 41 % of the annual soil CH4 uptake, and the palm circle with 18 % of plantation area contributed 5 % of the annual soil CH4 uptake (Fig. 2).
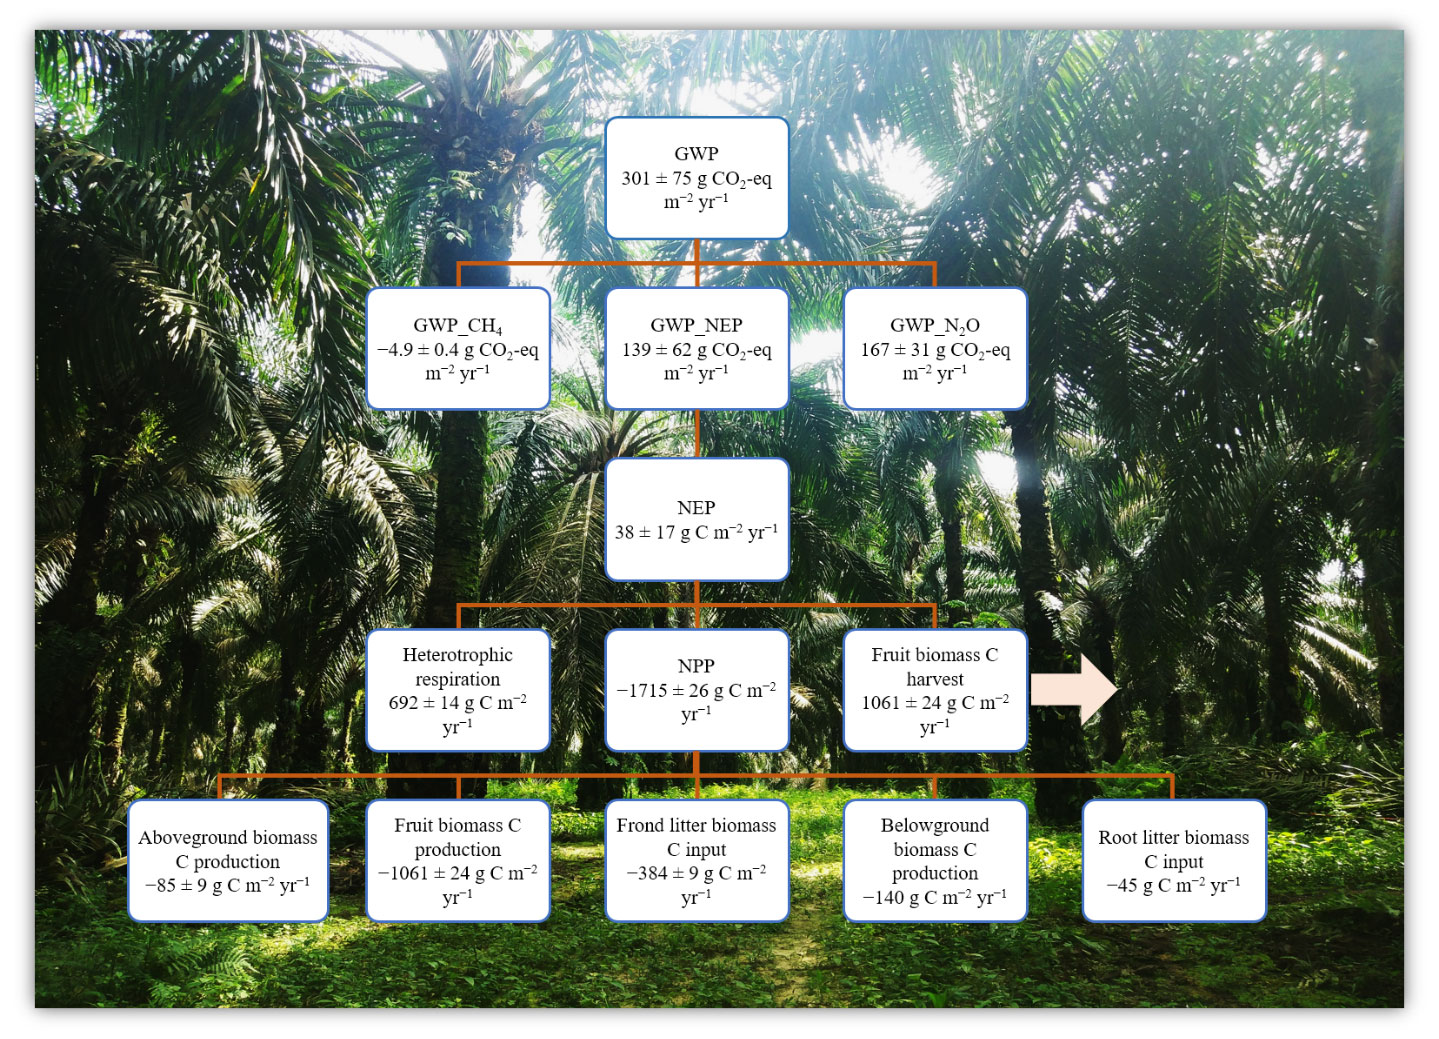
Figure 3Ecosystem net global warming potential (GWP) from an ≥ 18-year-old, large-scale oil palm plantation, Jambi, Indonesia (means ± SE, n = 16 plots). Negative and positive symbols indicate the direction of the flux: (−) for C uptake and (+) for C export or emission from the plantation. Net primary productivity (NPP, ) = aboveground biomass C production + fruit biomass C + frond litter biomass C + belowground biomass C production + root litter biomass C. Aboveground biomass C production = annual biomass production per palm (2019–2020) × planting density × tissue C concentration. Annual fruit biomass C = annual fruit production per palm (mean of 2019–2020) × planting density × tissue C concentration. Frond litter biomass C = annual litter production per palm (mean of 2019–2020) × planting density × tissue C concentration. Belowground biomass C production and root litter C were taken from oil palm sites in the same area (Kotowska et al., 2015). Net ecosystem productivity (NEP, ) = heterotrophic respiration – (NPP – fruit biomass C) (Malhi et al., 1999; Quiñones et al., 2022). Heterotrophic respiration was assumed to be 70 % of soil CO2 efflux (van Straaten et al., 2011) plus 80 % from decomposition of frond litter (Iddris et al., 2023). GWP () = NEP_in CO2 + N2O_CO2 eq + CH4_CO2 eq, where the CO2 equivalents for N2O and CH4 are their annual fluxes multiplied by 298 and 25, respectively, for a 100-year time frame (IPCC 2006).
We calculated the GWP across 16 plots (Fig. 3) as there were no significant differences in soil GHG fluxes among treatments (Table 1). Additionally, the reduced and conventional management had also comparable fruit yield during 4 years (2017–2020) of treatments (fertilization, weeding, and their interaction: P≥0.07; Table S2 in the Supplement). The NPP was larger than the soil heterotrophic respiration (which was assumed to be 70 % of the measured soil CO2 efflux plus 80 % C emissions from decomposition of frond litter), but 62 % of this NPP was removed from the field via fruit harvest (Fig. 3). Thus, this oil palm plantation turned into a net C source (i.e., positive NEP value; Fig. 3). Summing the NEP, soil N2O emissions, and soil CH4 uptake in terms of CO2 equivalent (100-year time horizon), the GWP of this ≥ 18-year-old, large-scale oil palm plantation was contributed by 55 % soil N2O emissions and only counterbalanced by < 2 % soil CH4 sink (Fig. 3).
Table 2Soil temperature, water content, and mineral N concentrations (means ± SE, n = 4 plots) measured in the top 5 cm from different fertilization and weeding treatments in an ≥ 18-year-old, large-scale oil palm plantation, Jambi, Indonesia, measured monthly from July 2019 to June 2020.
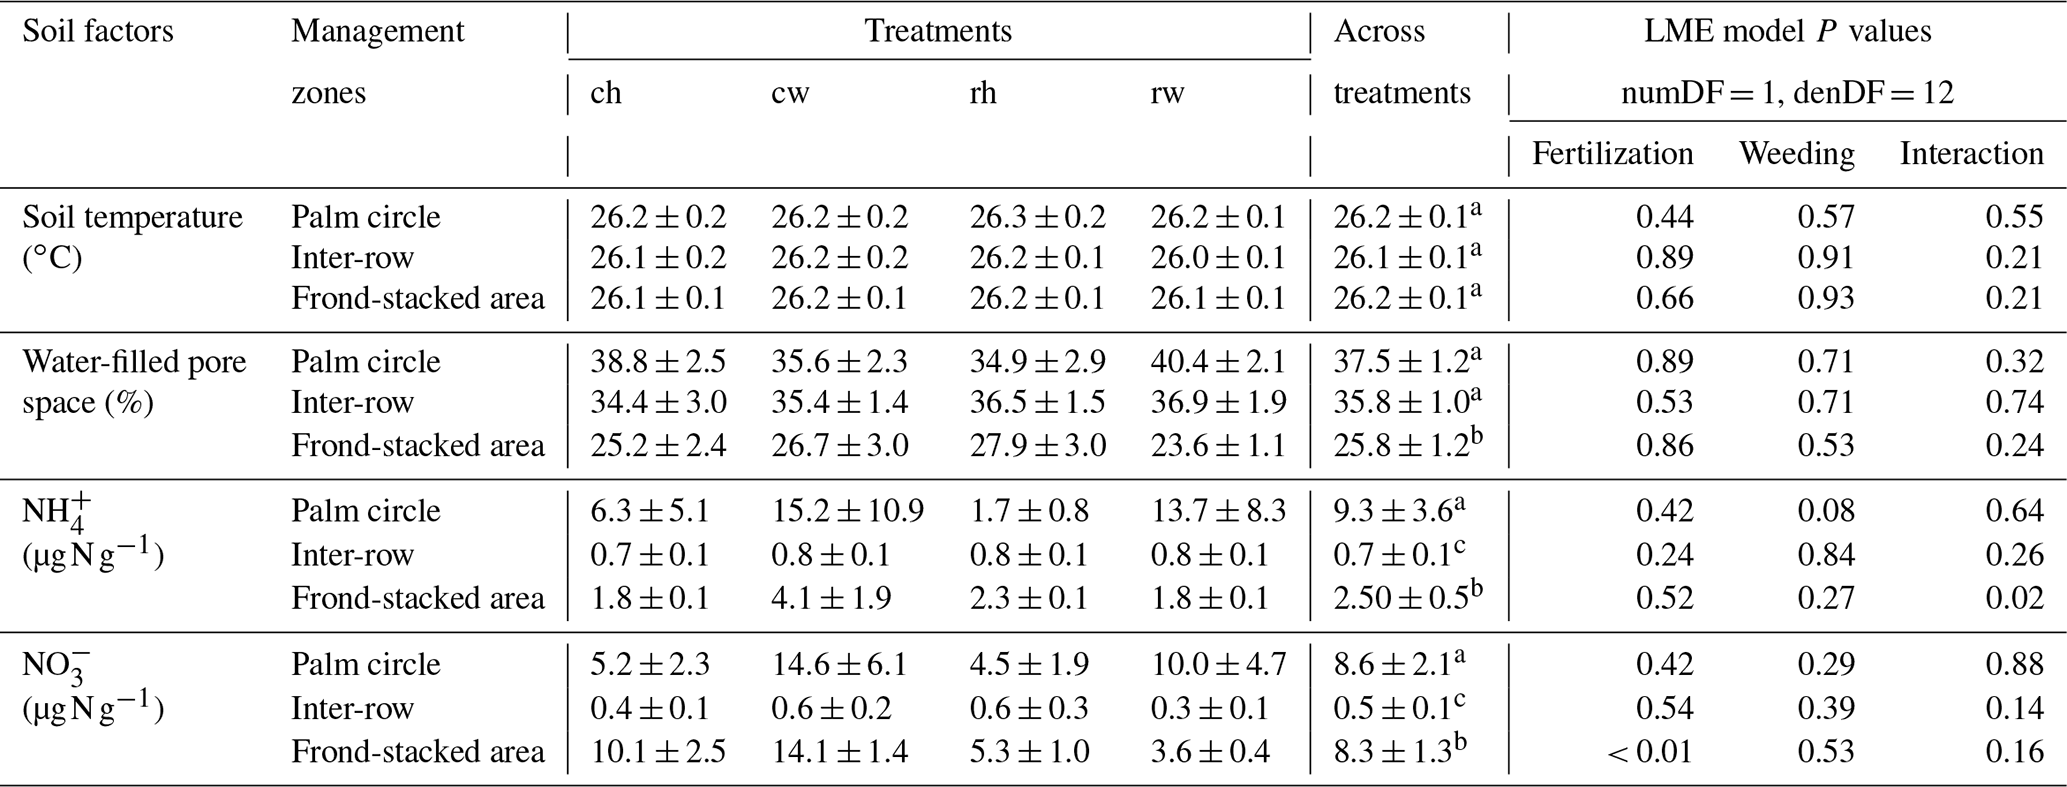
For each soil factor, different letters within each column indicate significant differences among management zones across treatments (22 factorial ANOVA with linear mixed-effects models and Tukey's HSD test at P≤ 0.05); numDF and denDF are numerator and denominator degrees of freedom, respectively. ch: conventional fertilization–herbicide weeding; cw: conventional fertilization–mechanical weeding; rh: reduced fertilization–herbicide weeding; rw: reduced fertilization–mechanical weeding.
3.2 Soil variables
Fertilization and weeding treatments did not affect soil temperature (fertilization, weeding, and their interaction: P≥0.21) and WFPS (fertilization, weeding, and their interaction: P≥0.24) in any of the management zones (Table 2). Soil concentration was lower in reduced than conventional fertilization, particularly in the frond-stacked area (P≤0.01; Table 2). There was an interaction effect of fertilization and weeding on soil concentration in the frond-stacked area (P = 0.02; Table 2); however, neither fertilization nor weeding solely affects soil concentration in any of the management zones (P≥0.08; Table 2). Across treatment plots, the three management zones showed comparable soil temperature, while the palm circle and inter-row had higher WFPS than the frond-stacked area (P≤0.01; Table 2). The soil and concentrations in the palm circle and frond-stacked area were larger than the inter-row (P≤0.01; Table 2).
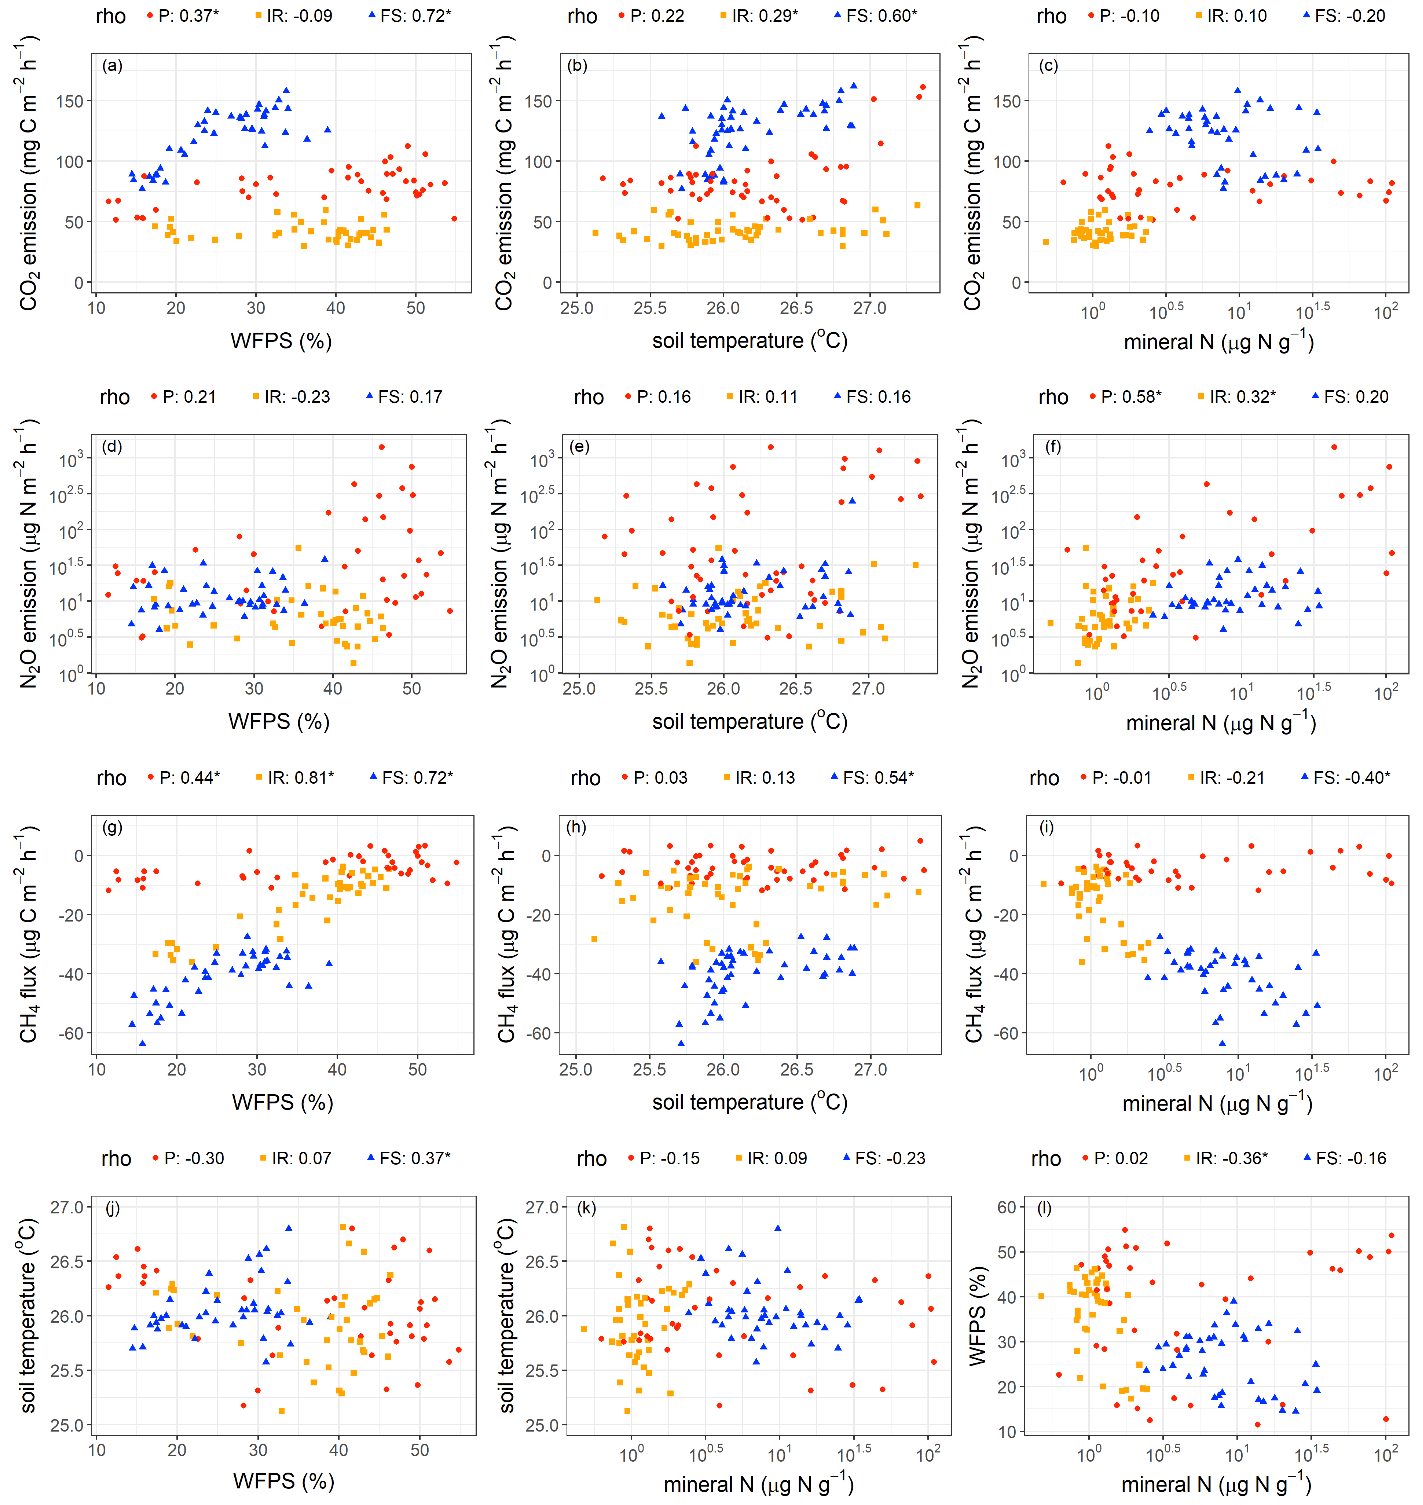
Figure 4Relationships among soil CO2, N2O, and CH4 fluxes and soil factors. Spearman rank coefficients (rho) marked by ∗ indicate P≤0.05. Each data point was the average of four replicate plots per treatment in each measurement period (n = 48 (i.e., 4 treatments × 12 months) for soil temperature; n = 40 (i.e., 4 treatments × 10 months) for soil water-filled pore space (WFPS) and total mineral N). P – palm circle; IR – inter-row; FS – frond-stacked area.
Soil CO2 emissions were positively correlated with WFPS in the palm circle (rho = 0.37, P = 0.02) and frond-stacked area (rho = 0.72, P≤0.01; Fig. 4a) and were positively correlated with soil temperature in the frond-stacked area (rho = 0.60, P≤0.01) and inter-row (rho = 0.29, P = 0.05; Fig. 4b). Soil N2O emissions were positively correlated with soil mineral N in the palm circle (rho = 0.58, P≤0.01) and inter-row (rho = 0.32, P = 0.04; Fig. 4f). Soil CH4 uptake decreased with the increase in WFPS in all three management zones (rho = 0.44–0.81, P≤0.01; Fig. 4g). In the frond-stacked area, soil CH4 uptake decreased with the increase in soil temperature (rho = 0.54, P≤0.01; Fig. 4h) but increased with the increase in soil mineral N (rho = −0.40, P = 0.01; Fig. 4i); also in the frond-stacked area, a positive relationship between soil temperature and WFPS was observed (rho = 0.37, P = 0.02; Fig. 4j). We did not find any other significant correlations between soil GHG fluxes and the measured soil variables.
4.1 Soil CO2 emissions
Area-weighted soil CO2 emissions (Table 1) were only about one-third of the soil CO2 emissions from forests in the same study area (187–196 ; Hassler et al., 2015) but within the range reported for oil palm plantations on mineral soils in Southeast Asia (45–195 ; Hassler et al., 2015; Sakata et al., 2015; Aini et al., 2020; Drewer et al., 2021b). Specifically, soil CO2 emissions from the inter-row were in the lower end of this range, and soil CO2 fluxes from the frond-stacked area were in the middle of this range. These earlier studies deployed different spatial sampling designs for measuring soil GHG fluxes from oil palm plantations. Sakata et al. (2015) measured soil CO2 fluxes at 1 m away from the palm base, and Hassler et al. (2015) measured soil CO2 fluxes at 1.8–5 m away from the palm base. Aini et al. (2020) measured soil CO2 fluxes from the fertilized area (within 1 m from the palm base) and unfertilized area, whereas no information on sampling location was given by Drewer et al. (2021b). Measurement locations to represent spatial management zones should be stated when reporting soil GHG fluxes from oil palm plantations in order to facilitate comparisons as well as to warrant spatial extrapolation.
The three management zones differed in soil CO2 fluxes caused by their differences in SOC (Table S1; Formaglio et al., 2020), microbial biomass (Fig. S4 in the Supplement; Formaglio et al., 2021) as drivers of heterotrophic respiration, and root biomass (Nelson et al., 2014) that influences autotrophic respiration. In this mature large-scale oil palm plantation, senesced fronds have been piled on the frond-stacked area for more than a decade. This results in 40 % larger SOC stocks (Table S1) and 3–5 times larger microbial biomass (Fig. S4) in the frond-stacked area than in the palm circle and inter-row (Formaglio et al., 2020, 2021). The positive correlation of microbial biomass C (MBC) to soil CO2 fluxes (Fig. S4) supported our second hypothesis, whereby differences in soil CO2 emissions among management zones are driven in part by microbial biomass size and available organic C for heterotrophic respiration. Substantial heterotrophic respiration as well as presence of roots in the frond-stacked area (Rüegg et al., 2019; Dassou et al., 2021) explained its highest soil CO2 emissions (Table 1), supporting hypothesis 2c. On the other hand, the palm circle has higher root biomass than the inter-row (Nelson et al., 2014), and the higher soil CO2 emissions from the palm circle than the inter-row (Table 1) may be caused by their disparate autotrophic respiration as their soil SOC stocks (Table S1) and MBC did not differ (Formaglio et al., 2021). These supported hypotheses 2a and b. However, in the same oil palm plantation, the different fertilization and weeding treatments, analyzed across the three management zones, did not influence soil MBC (Formaglio et al., 2021), as well as the fine root biomass in the top 10 cm depth (Ryadin et al., 2022) after 1 year of this management experiment. These findings support our first hypothesis, whereby there were no short-term differences between reduced and conventional management for soil CO2 emissions. Nonetheless, we emphasize that the lower soil CO2 efflux in oil palm plantations compared to the forests (Hassler et al., 2015) is supported by its decreases in SOC (van Straaten et al., 2015; Allen et al., 2016), root and litter production (Kotowska et al., 2015), and microbial biomass (Allen et al., 2015; Formaglio et al., 2021). Also, the higher soil 15N natural abundance and lower soil C:N ratio in oil palm plantations than the forests (Hassler et al., 2015; van Straaten et al., 2015) signify a highly decomposed organic matter which, combined with reduced SOC, suggests reduced available C for microbial biomass and heterotrophic activity (Allen et al., 2015; Formaglio et al., 2021).
The seasonal pattern of soil CO2 emissions from land uses in Indonesia is commonly influenced by soil moisture (Hassler et al., 2015; van Straaten et al., 2011). In our present study, the positive correlation between soil CO2 emissions and soil moisture (ranging from 10 %–55 % WFPS; Fig. 4a) depicted a reduced soil CO2 efflux during the dry season, particularly in the palm circle and frond-stacked area, suggesting diminished autotrophic and heterotrophic respiration in these management zones when soil moisture was low (Figs. 4a and S1). Previous studies have shown that autotrophic and heterotrophic respiration increase toward an optimum WFPS (e.g., WFPS between 50 %–55 %; Sotta et al., 2007; van Straaten et al., 2011). Unlike the previous study conducted in 2013 in the same area (Hassler et al., 2015), our measured WFPS did not reach beyond 55 %, as the annual rainfall during our study year (2019–2020) was lower than in 2013 and the sandy clay loam texture of our present soil may facilitate well-drained conditions. Thus, we did not observe a parabolic relationship of soil CO2 emissions with WFPS beyond 55 % as observed by Hassler et al. (2015). Although we observed a positive relationship between soil CO2 emissions and soil temperature (Fig. 4b), largely in the frond-stacked area, this maybe was confounded by WFPS as the soil temperature and WFPS were auto-correlated (Fig. 4j). Thus, soil temperature was not a dominant controlling factor for the seasonal pattern of soil CO2 emissions in this oil palm plantation where soil temperature also only varied narrowly during our measurement period (25–28 ∘C; Fig. 4b).
4.2 Soil N2O emissions
Area-weighted soil N2O emissions (Table 1) were within the range reported for oil palm plantations on mineral soils (8–117 ; Aini et al., 2015; Sakata et al., 2015; Hassler et al., 2017; Rahman et al., 2019; Drewer et al., 2021b). Specifically, the soil N2O emissions from the unfertilized inter-row and frond-stacked areas at our site were close to the lower end of this range, whereas those from the fertilized palm circle were larger than the upper end of this range (Fig. S2). This pattern supported our second hypothesis, whereby soil N2O emission was primarily influenced by soil N availability (i.e., mineral N; Table 2; Fig. 4f). These pulses of soil N2O emissions usually peaked at around 2 weeks following N fertilization and went down to the background emissions after at most 8 weeks (Aini et al., 2015; Hassler et al., 2017; Rahman et al., 2019). In our present study, we have captured these peaks of soil N2O emissions within 2 weeks following fertilization on the palm circle, and these elevated N2O emissions remained within 2 months from fertilization (Fig. S2), supporting hypothesis 2a. Although both the inter-row and frond-stacked areas had no direct N fertilizer application, litter decomposition in the frond-stacked area resulted in higher gross rates of N mineralization and nitrification, indicating higher soil N availability than in the inter-row (Formaglio et al., 2021). This explained the higher soil N2O emissions from the frond-stacked area than the inter-row (Table 1), corroborating hypotheses 2b and c. However, these internal soil N cycling processes provide slow release of mineral N as opposed to the pulse release of mineral N level from N fertilization, and hence the soil N2O emissions and mineral N levels were larger in the palm circle than the frond-stacked area (Tables 1 and 2). These findings signified the main control of soil N availability on soil N2O emissions (Fig. 4f) (Davidson et al., 2000). We did not observe a correlation of soil N2O emissions with WFPS (Fig. 4d) possibly because our sandy clay loam soil was relatively dry to moist in the top 5 cm depth (≤ 55 % WFPS) during our measurement period. In sum, the direct N fertilizer application on the palm circle (although covering only 18 % of the plantation area) caused the extremely high soil N2O emissions (Fig. S2), accounting for 79 % of the annual soil N2O emission at the plantation level (Fig. 2). Our findings highlight that the palm circle was a hot spot of soil N2O emissions, and such management-induced spatial heterogeneity must be accounted for in accurately quantifying soil N2O emissions from large-scale oil palm plantations.
The large and comparable soil N2O emissions between the conventional and reduced fertilization treatments (Table 1; Fig. 2) were contrary to our first hypothesis. However, this finding was consistent with the soil N availability, i.e., mineral N (Table 2) as well as gross and net rates of soil N mineralization and nitrification, which did not differ among treatments during 1–4 years of this management experiment (Formaglio et al., 2021; Chen, 2023). These results implied a substantial legacy effect of the past decade of conventional management (high fertilization rate and herbicide application) prior to the start of this management experiment. It is important to note that reduced fertilization treatment was still 1.5–3 times higher than the N fertilization rates in smallholder oil palm plantations, and this reduced fertilization treatment displayed 2–4 times larger soil N2O emissions than the smallholder plantations (Hassler et al., 2017). Also, the soil mineral N levels in this large-scale oil palm plantation were larger in all of the management treatments (Table 2) compared to smallholder oil palm plantations (Hassler et al., 2017). In the reduced fertilization treatment, soil mineral N was not the limiting factor for N2O production, since the peaks of soil N2O emissions following fertilization in both reduced and conventional fertilization treatments were comparable (Fig. S2). This supports the conclusion of Formaglio et al. (2020) that the decadal over-fertilization of this large-scale oil palm plantation causes large stocks of mineral N, leached below the root zone, and despite 4 years of reduced fertilization, mineral N stored at deeper depths can contribute to microbial production of N2O. These findings imply the need to adjust fertilization rates with the age of the oil palm plantation to maintain good yield while reducing the environmental impact. Apparently, years of over fertilization can have lasting effects on soil N2O emission well beyond the period when fertilization management changes. As the palm circle is a hotspot of N2O emissions, improved nutrient management in this zone may have the potential to minimize fertilizer-induced N2O emissions, e.g., through the application of slow-release N fertilizers, use of nitrification inhibitors, adjusting N application rate with the age of the plantation, and understory vegetation to take up and recycle excess mineral N (Sakata et al., 2015; Ashton-Butt et al., 2018; Cassman et al., 2019). Moreover, return of organic residues (empty fruit bunches or mill effluent) should be encouraged to improve nutrient retention and recycling and to reduce dependency on chemical fertilizers (Bakar et al., 2011; Formaglio et al., 2021).
4.3 Soil CH4 uptake
Area-weighted soil CH4 uptake (Table 1) was comparable to CH4 uptake reported for oil palm plantations (−15 ± 3 ) but lower than soil CH4 uptake in forests on similar loam Acrisol soils in Jambi, Indonesia (−29 ± 12 ) (Hassler et al., 2015). The soil CH4 uptake at our site was larger than that reported by Drewer et al. (2021a) (−3 ± 1 ) from ≤ 12-year-old oil palm plantations on clay Acrisol soil in Malaysian Borneo, which they attributed to very high CH4 emissions from a plot adjacent to a riparian area. Also, the soil CH4 uptake at our site was larger than that reported by Aini et al. (2020) (ranging from −1 to 13 ) for an oil palm plantation on sandy clay loam Cambisol soil in Jambi, Indonesia, which they explained by the high WFPS (> 80 %) during their measurement period. Clay content or soil texture is the main site factor that correlates positively with soil CH4 fluxes (Veldkamp et al., 2013), indicating that the higher the clay content, the lower the soil CH4 uptake is. High-clay-content soils have a low proportion of coarse pores (Hillel, 2003), which are important for gas diffusive transport. Furthermore, soils with high clay content have high water-holding capacity, which hinders gas diffusion from the atmosphere to the soil and limits CH4 availability to methanotrophic activity in the soil (Keller and Reiners, 1994; Veldkamp et al., 2013). Thus, the disparity of soil CH4 uptake between our present site and these above-mentioned studies was attributed to their differences in soil texture or drainage status as well as rainfall conditions or WFPS during the measurement periods, which all influence CH4 diffusion from the atmosphere to the soil and thereby its uptake.
The positive correlation between soil CH4 fluxes and WFPS (Fig. 4g), which reflected the same spatial pattern and positive correlation between soil CH4 fluxes and soil bulk densities (Fig. S5 in the Supplement), was attributed to the reduction in CH4 diffusion from the atmosphere to the soil with increases in WFPS and soil bulk density (Veldkamp et al., 2013; Martinson et al., 2021). Differences in soil bulk density that result from management practices in oil palm plantations (Table S1) (Formaglio et al., 2021) affect soil total porosity, WFPS, and gas diffusivity (Keller and Reiners, 1994; Hassler et al., 2015). The frond-stacked area has large SOC (Table S1) and low soil bulk density (Fig. S5) or high porosity (Formaglio et al., 2021), resulting in low WFPS (Table 2). Thus, with the high soil porosity in the frond-stacked area, gas diffusion may not limit CH4 availability to methanothrophic activity in the soil, resulting in the highest soil CH4 uptake among the management zones (Table 1) and supporting hypothesis 2c. Where gas diffusion was favorable in the frond-stacked area, the increase in soil mineral N had increased CH4 uptake (Fig. 4i), suggesting that mineral N availability enhanced CH4 uptake once gas diffusion is not limiting (Veldkamp et al., 2013; Hassler et al., 2015). Conversely, the palm circle and inter-row have small SOC (Table S1) and high soil bulk density (Fig. S5) or low porosity (Formaglio et al., 2021), resulting in high WFPS (Table 2), which may have limited gas diffusion and possibly created anaerobic microsites and thereby the occasional soil CH4 emissions during the wet season (Fig. S3). These findings corroborated hypotheses 2a and b. Thus, the observation that soil mineral N did not influence soil CH4 fluxes from the palm circle and inter-row (Fig. 4i) was possibly because gas diffusion limitation was the overriding factor controlling soil CH4 uptake. Aside from improving the soil biochemical properties with the decadal piling of senesced fronds on the frond-stacked area (Table S1), which favor for increases in soil microbial biomass (Fig. S4) and N cycling rate (Formaglio et al., 2021), stimulating soil CH4 sink or methanotrophic activity is one proof of the multiple benefits of conserving soil organic matter, e.g., its role in soil GHG abatement (Veldkamp et al., 2020). Foot traffic from management practices in the palm circle and inter-row, as well as reduced litter inputs, increased soil bulk density and decreased SOC (Table S1), accompanied by reductions in microbial biomass and its activity (e.g., low soil N cycling rate; Formaglio et al., 2021), including reduced methanotrophic activity (Table 1). At the plantation level, the overall comparable soil CH4 uptake between the reduced and conventional management treatments (supporting the first hypothesis) indicated that changes in fertilization rates and weeding methods did not yet affect the drivers of soil CH4 uptake (e.g., comparable soil mineral N and WFPS among treatments; Table 2) at least during the first 4 years of this experiment. Instead, the spatial differences in soil CH4 uptake suggest that restoring the function of soil as a CH4 sink should be geared towards increasing soil organic matter, e.g., alternating locations of piled fronds with unused inter-rows, returning empty fruit bunches and other processing by-products, and avoiding plant biomass burning in establishing the next generation of the oil palm plantation (Bakar et al., 2011; Carron et al., 2015; Bessou et al., 2017).
4.4 Global warming potential
The GWP of this ≥ 18-year-old, large-scale oil palm plantation (GWP of 301 ± 75 ; Fig. 3) was in the lower end of the estimate from another part of this plantation near a peat soil (GWP of 686 ± 353 ; Meijide et al., 2020). The slight difference between our estimated GWP and this previous study, aside from the latter's proximity to a peat soil, can be due to plantation age, different climatic conditions during separate study years, and different methods employed. First, as to plantation age, oil palm acts as a net C source 1 year after forest conversion with a net ecosystem exchange (NEE) of 1012 ± 51 and becomes a net C sink at 12 years old (NEE of −754 ± 38 ; Meijide et al., 2020). However, C removed from the field via fruit harvest turns this plantation into a net C source (NEP of 146 ± 94 ; Meijide et al., 2020). At our study plots, the average annual yield during 2017–2020 across treatments (Fig. 3; Table S2) was higher than that of Meijide et al. (2020) (900 ± 49 ), and our estimated NEP (Fig. 3) was in the lower end of Meijide et al.'s (2020) NEP estimate. The small NEP in our present study was due to large biomass and yield production as oil palm trees aged and also possibly due to reduced heterotrophic respiration as SOC had already decreased and attained a steady-state low level after ∼ 15 years from forest conversion (van Straaten et al., 2015). Secondly, the different climate conditions during our study year compared to the study by Meijide et al. (2020) may also have contributed to the differences in biomass and yield production, as well as heterotrophic respiration. Our measurement period (2019–2020) had annual rainfall within the 10-year average, whereas Meijide et al.'s (2020) study years (2014–2016) included a severe drought in 2015 caused by a strong El Niño–Southern Oscillation that induced prolonged smog events in Jambi, Indonesia (Field et al., 2016). Drought combined with smoke haze reduces the productivity and CO2 uptake in this oil palm plantation (Stiegler et al., 2019), supporting the low fruit yield measured by Meijide et al. (2020). Thirdly, our different estimation methods may have contributed to the small disparity between our GWP estimate and that by Meijide et al. (2020), who measured NEE with the eddy covariance technique. Our method and theirs both have advantages and disadvantages; ours based on measurements of NPP components and assumption of heterotrophic respiration contribution to measured soil CO2 emissions (van Straaten et al., 2011) was spatially replicated, inexpensive, and practicable to deploy without a need for an electricity source in the field (Baldocchi, 2014), e.g., for plot-scale experiments on different fertilization regimes and weeding practices.
As soil N2O emissions contributed substantially (55 %) to the GWP of this large-scale oil palm plantation, while the soil CH4 sink had only a minor offset (< 2 %) (Fig. 3), reducing its GHG footprint could be achieved by decreasing soil N2O emissions and increasing soil CH4 uptake (see above). Finally, the large NPP of this ≥ 18-year-old, large-scale oil palm plantation and reduced heterotrophic respiration (due to reduced SOC after ∼ 15 years from forest conversion; van Straaten et al., 2015) contributed to its small NEP that accounted for 46 % of the GWP. In the perspective of long-term oil palm management, extending the rotation period from 25 years to 30 years to prolong accumulation of plant biomass C (Meijide et al., 2020), avoiding large biomass loss during the establishment of the next generation of the oil palms (e.g., not burning but leaving cut palm trees in the field), and enhancing SOC stocks will reduce the GHG footprint of oil palm plantations.
During the 3–4 years of this management experiment, soil GHG fluxes, GWP, and yield in reduced fertilization with mechanical weeding remained similar to conventional fertilization with herbicide application, signifying the strong legacy effect of over a decade of a high-fertilization regime prior to the start of our experiment in this mature oil palm plantation. Reducing soil N2O emissions is the key to reducing the GHG footprint in this oil palm plantation as soil N2O emissions contributed substantially to the GWP of this oil palm plantation. The palm circle and frond-stacked area both showed high mineral N availability, but the palm circle was driven by the high fertilization rates, rendering it as a hotspot of soil N2O emissions. Thus, improved nutrient management in this zone can minimize fertilizer-induced N2O emissions, e.g., through the application of slow-release N fertilizers, use of nitrification inhibitors, adjusting N application rate with the age of the plantation, and understory vegetation to take up and recycle excess mineral N. In contrast, the frond-stacked area supports high root and microbial biomass, low soil N2O emissions, and high soil CH4 uptake. Thus, reasonably expanding the frond-stacked area and returning organic residues from oil palm fruit processing in order to reduce dependency on chemical fertilizers will help reduce the GHG footprint while maintaining high production in oil palm plantations. The GHG footprint of the next generation of the oil palm plantation can be reduced by extending the rotation period from beyond the common practice of 25 years in order to prolong accumulation of plant biomass C (Meijide et al., 2020) and by not burning palm biomass but leaving cut palm trees in the field during the establishment of the subsequent oil palms to minimize biomass C and SOC losses.
All data of this study are deposited on the GRO Göttingen Research Online data repository (https://data.goettingen-research-online.de, last access: 19 December 2023) and under the following DOI: https://doi.org/10.25625/NR8SRD (Chen, 2022), which is accessible to all members of the Collaborative Research Center (CRC) 990. Based on the data-sharing agreement within the CRC 990, these data are currently not publicly accessible but will be made available through a written request to the senior author.
The supplement related to this article is available online at: https://doi.org/10.5194/bg-21-513-2024-supplement.
EV and MDC conceptualized the study and implemented the field-plot design and measurement methodologies. AT, BI, and MD facilitated field access, logistical support, collaborator agreements, and material exports. GC conducted the field works and data analysis and wrote the first draft of the manuscript. MDC and EV revised extensively the manuscript, and all co-authors approved the final manuscript.
At least one of the (co-)authors is a member of the editorial board of Biogeosciences. The peer-review process was guided by an independent editor, and the authors also have no other competing interests to declare.
Publisher's note: Copernicus Publications remains neutral with regard to jurisdictional claims made in the text, published maps, institutional affiliations, or any other geographical representation in this paper. While Copernicus Publications makes every effort to include appropriate place names, the final responsibility lies with the authors.
This study was funded by the Deutsche Forschungsgemeinschaft (DFG) project number 192626868—SFB 990/2-3) in the framework of the Collaborative Research Center 990 EFForTS as part of project A05. Guantao Chen was supported by China Scholarship Council. The PT Perkebunan Nusantara VI company provided no funding and did not have any influence on the study design, data collection, analysis, or interpretation. We thank PTPN VI for allowing us to conduct research in their plantation. We are especially thankful to our Indonesian field and laboratory assistants, Fajar Sidik and Mohammed Fatoni, as well as the project Z01 field personnel, for managing the field implementation of this experiment. We thank Andrea Bauer, Dirk Böttger, Kerstin Langs, and Natalia Schröder for their assistance in the laboratory analysis. This study was conducted under the research permit 148/E5/E5.4/SIP/2019.
This research has been supported by the Deutsche Forschungsgemeinschaft (grant no. 192626868).
This open-access publication was funded by the University of Göttingen.
This paper was edited by Ivonne Trebs and reviewed by two anonymous referees.
Adachi, M., Bekku, Y. S., Rashidah, W., Okuda, T., and Koizumi, H.: Differences in soil respiration between different tropical ecosystems, Appl. Soil Ecol., 34, 258–265, https://doi.org/10.1016/j.apsoil.2006.01.006, 2006.
Aini, F. K., Hergoualc'h, K., Smith, J. U., and Verchot, L.: Nitrous oxide emissions along a gradient of tropical forest disturbance on mineral soils in Sumatra, Agr. Ecosyst. Environ., 214, 107–117, https://doi.org/10.1016/j.agee.2015.08.022, 2015.
Aini, F. K., Hergoualc'h, K., Smith, J. U., Verchot, L., and Martius, C.: How does replacing natural forests with rubber and oil palm plantations affect soil respiration and methane fluxes?, Ecosphere, 11, e03284, https://doi.org/10.1002/ecs2.3284, 2020.
Allen, K., Corre, M. D., Tjoa, A., and Veldkamp, E.: Soil Nitrogen-Cycling Responses to Conversion of Lowland Forests to Oil Palm and Rubber Plantations in Sumatra, Indonesia, PLOS One, 10, e0133325, https://doi.org/10.1371/journal.pone.0133325, 2015.
Allen, K., Corre, M. D., Kurniawan, S., Utami, S. R., and Veldkamp, E.: Spatial variability surpasses land-use change effects on soil biochemical properties of converted lowland landscapes in Sumatra, Indonesia, Geoderma, 284, 42–50, https://doi.org/10.1016/j.geoderma.2016.08.010, 2016.
Asari, N., Suratman, M. N., Jaafar, J., and Khalid, M. Md.: Estimation of Above Ground Biomass for Oil Palm Plantations Using Allometric Equations, Int. Proc. Chem. Biol. Environ. Eng., 32, 12–16, https://doi.org/10.7763/IPCBEE.2013.V58.22, 2013.
Ashton-Butt, A., Aryawan, A. A. K., Hood, A., Naim, M., Purnomo, D., Suhardi, Wahyuninghsi, R., Willcock, S., Poppy, G. M., Caliman, J.-P., Turner, E. C., Foster, W. A., Peh, K. S.-H., and Snaddon, J. L.: Understory vegetation in oil palm plantations benefits soil biodiversity and decomposition rates, Front. For. Glob. Chang., 1, 10, https://doi.org/10.3389/ffgc.2018.00010, 2018.
Bakar, R. A., Darus, S. Z., Kulaseharan, S., and Jamaluddin, N.: Effects of ten year application of empty fruit bunches in an oil palm plantation on soil chemical properties, Nutr. Cycl. Agroecosys., 89, 341–349, https://doi.org/10.1007/s10705-010-9398-9, 2011.
Baldocchi, D.: Measuring fluxes of trace gases and energy between ecosystems and the atmosphere – the state and future of the eddy covariance method, Glob. Chang. Biol., 20, 3600–3609, https://doi.org/10.1111/gcb.12649, 2014.
Bessou, C., Verwilghen, A., Beaudoin-Ollivier, L., Marichal, R., Ollivier, J., Baron, V., Bonneau, X., Carron, M. P., Snoeck, D., Naim, M., Aryawan, A. A. K., Raoul, F., Giraudoux, P., Surya, E., Sihombing, E., and Caliman, J. P.: Agroecological practices in oil palm plantations: Examples from the field, OCL – Oilseeds and Fats, Crops and Lipids, 24, D305, https://doi.org/10.1051/ocl/2017024, 2017.
Bond-Lamberty, B., Wang, C., and Gower, S. T.: A global relationship between the heterotrophic and autotrophic components of soil respiration? Glob. Chang. Biol., 10, 1756–1766, https://doi.org/10.1111/j.1365-2486.2004.00816.x, 2004.
Bou Dib, J., Alamsyah, Z., and Qaim, M.: Land-use change and income inequality in rural Indonesia, Forest Policy Econ., 94, 55–66, https://doi.org/10.1016/j.forpol.2018.06.010, 2018.
Carron, M. P., Pierrat, M., Snoeck, D., Villenave, C., Ribeyre, F., Suhardi, Marichal, R., and Caliman, J. P.: Temporal variability in soil quality after organic residue application in mature oil palm plantations, Soil Res., 53, 205–215, https://doi.org/10.1071/SR14249, 2015.
Cassman, N. A., Soares, J. R., Pijl, A., Lourenço, K. S., van Veen, J. A., Cantarella, H., and Kuramae, E. E.: Nitrification inhibitors effectively target N 2 O-producing Nitrosospira spp. in tropical soil, Environ. Microbiol., 21, 1241–1254, https://doi.org/10.1111/1462-2920.14557, 2019.
Chen, G.: A05_Soil CO2, CH4, N2O fluxes_soil temperature, WFPS, mineral N (OPMX), GRO.data [data set], V1, https://doi.org/10.25625/NR8SRD, 2022.
Chen, G.: Nutrient response efficiency, soil greenhouse gas fluxes, and nutrient leaching losses from a large-scale oil palm plantation under conventional and reduced management practices, eDiss, https://doi.org/10.53846/goediss-9973, 2023.
Clough, Y., Krishna, V. V., Corre, M. D., Darras, K., Denmead, L. H., Meijide, A., Moser, S., Musshoff, O., Steinebach, S., Veldkamp, E., Allen, K., Barnes, A. D., Breidenbach, N., Brose, U., Buchori, D., Daniel, R., Finkeldey, R., Harahap, I., Hertel, D., Holtkamp, A. M., Hörandl, E., Irawan, B., Jaya, I. N. S., Jochum, M., Klarner, B., Knohl, A., Kotowska, M. M., Krashevska, V., Kreft, H., Kurniawan, S., Leuschner, C., Maraun, M., Melati, D. N., Opfermann, N., Pérez-Cruzado, C., Prabowo, W. E., Rembold, K., Rizali, A., Rubiana, R., Schneider, D., Tjitrosoedirdjo, S. S., Tjoa, A., Tscharntke, T., and Scheu, S.: Land-use choices follow profitability at the expense of ecological functions in Indonesian smallholder landscapes, Nat. Commun., 7, 13137, https://doi.org/10.1038/ncomms13137, 2016.
Crawley, M. J.: The R book second edition, John Wiley & Sons Ltd, Chichester, UK, ISBN: 978-0-470-97392-9, 2013.
Cusack, D. F., Ashdown, D., Dietterich, L. H., Neupane, A., Ciochina, M., and Turner, B. L.: Seasonal changes in soil respiration linked to soil moisture and phosphorus availability along a tropical rainfall gradient, Biogeochemistry, 145, 235–254, https://doi.org/10.1007/s10533-019-00602-4, 2019.
Dassou, O., Nodichao, L., Aholoukpè, H., Cakpo, Y., and Jourdan, C.: Improving the methodology for root biomass estimation in monocotyledonous tree plantations: case of oil palm (Elaeis guineensis. Jacq) in West Africa, Plant Soil, 465, 593–611, https://doi.org/10.1007/s11104-021-04939-4, 2021.
Davidson, E. A., Keller, M., Erickson, H. E., Verchot, L. V., and Veldkamp, E.: Testing a Conceptual Model of Soil Emissions of Nitrous and Nitric Oxides, Bioscience, 50, 667–680, 2000.
Descals, A., Wich, S., Meijaard, E., Gaveau, D. L. A., Peedell, S., and Szantoi, Z.: High-resolution global map of smallholder and industrial closed-canopy oil palm plantations, Earth Syst. Sci. Data, 13, 1211–1231, https://doi.org/10.5194/essd-13-1211-2021, 2021.
Drewer, J., Kuling, H. J., Cowan, N. J., Majalap, N., Sentian, J., and Skiba, U.: Comparing Soil Nitrous Oxide and Methane Fluxes From Oil Palm Plantations and Adjacent Riparian Forests in Malaysian Borneo, Front. For. Glob. Chang., 4, 145, https://doi.org/10.3389/ffgc.2021.738303, 2021a.
Drewer, J., Leduning, M. M., Griffiths, R. I., Goodall, T., Levy, P. E., Cowan, N., Comynn-Platt, E., Hayman, G., Sentian, J., Majalap, N., and Skiba, U. M.: Comparison of greenhouse gas fluxes from tropical forests and oil palm plantations on mineral soil, Biogeosciences, 18, 1559–1575, https://doi.org/10.5194/bg-18-1559-2021, 2021b.
FAO: Food and agriculture data, Food and Agricolture Organization, FAOSTAT, https://www.fao.org/faostat/en/#data/QCL (last access: 26 April 2021), 2021.
Field, R. D., Van Der Werf, G. R., Fanin, T., Fetzer, E. J., Fuller, R., Jethva, H., Levy, R., Livesey, N. J., Luo, M., Torres, O., and Worden, H. M.: Indonesian fire activity and smoke pollution in 2015 show persistent nonlinear sensitivity to El Niño-induced drought, P. Natl. Acad. Sci. USA, 113, 9204–9209, https://doi.org/10.1073/pnas.1524888113, 2016.
Formaglio, G., Veldkamp, E., Duan, X., Tjoa, A., and Corre, M. D.: Herbicide weed control increases nutrient leaching compared to mechanical weeding in a large-scale oil palm plantation, Biogeosciences, 17, 5243–5262, https://doi.org/10.5194/bg-17-5243-2020, 2020.
Formaglio, G., Veldkamp, E., Damris, M., Tjoa, A., and Corre, M. D.: Mulching with pruned fronds promotes the internal soil N cycling and soil fertility in a large-scale oil palm plantation, Biogeochemistry, 154, 63–80, https://doi.org/10.1007/s10533-021-00798-4, 2021.
Grass, I., Kubitza, C., Krishna, V. V., Corre, M. D., Mußhoff, O., Pütz, P., Drescher, J., Rembold, K., Ariyanti, E. S., Barnes, A. D., Brinkmann, N., Brose, U., Brümmer, B., Buchori, D., Daniel, R., Darras, K. F. A., Faust, H., Fehrmann, L., Hein, J., Hennings, N., Hidayat, P., Hölscher, D., Jochum, M., Knohl, A., Kotowska, M. M., Krashevska, V., Kreft, H., Leuschner, C., Lobite, N. J. S., Panjaitan, R., Polle, A., Potapov, A. M., Purnama, E., Qaim, M., Röll, A., Scheu, S., Schneider, D., Tjoa, A., Tscharntke, T., Veldkamp, E., and Wollni, M.: Trade-offs between multifunctionality and profit in tropical smallholder landscapes, Nat. Commun., 11, 1186, https://doi.org/10.1038/s41467-020-15013-5, 2020.
Hanson, R. S. and Hanson, T. E.: Methanotrophic bacteria, Microbiol. Rev., 60, 439–471, https://doi.org/10.1128/mmbr.60.2.439-471.1996, 1996.
Hassler, E., Corre, M. D., Tjoa, A., Damris, M., Utami, S. R., and Veldkamp, E.: Soil fertility controls soil–atmosphere carbon dioxide and methane fluxes in a tropical landscape converted from lowland forest to rubber and oil palm plantations, Biogeosciences, 12, 5831–5852, https://doi.org/10.5194/bg-12-5831-2015, 2015.
Hassler, E., Corre, M. D., Kurniawan, S., and Veldkamp, E.: Soil nitrogen oxide fluxes from lowland forests converted to smallholder rubber and oil palm plantations in Sumatra, Indonesia, Biogeosciences, 14, 2781–2798, https://doi.org/10.5194/bg-14-2781-2017, 2017.
Hillel, D.: Introduction to Environmental Soil Physics, Elsevier, https://doi.org/10.1016/B978-0-12-348655-4.X5000-X, 2003.
Iddris, N. A., Formaglio, G., Paul, C., von Groß, V., Chen, G., Angulo-Rubiano, A., Berkelmann, D., Brambach, F., Darras, K. F. A., Krashevska, V., Potapov, A., Wenzel, A., Irawan, B., Damris, M., Daniel, R., Grass, I., Kreft, H., Scheu, S., Tscharntke, T., Tjoa, A., Veldkamp, E., and Corre, M. D.: Mechanical weeding enhances ecosystem multifunctionality and profit in industrial oil palm, Nat. Sustain., 6, 683–695, https://doi.org/10.1038/s41893-023-01076-x, 2023.
IPCC: Guidelines for national greenhouse gas inventories chapter 11: N2O emissions from managed soils, and CO2 emissions from lime and urea application, 2006.
Kaupper, T., Hetz, S., Kolb, S., Yoon, S., Horn, M. A., and Ho, A.: Deforestation for oil palm: impact on microbially mediated methane and nitrous oxide emissions, and soil bacterial communities, Biol. Fert. Soils, 56, 287–298, https://doi.org/10.1007/s00374-019-01421-3, 2020.
Keller, M. and Reiners, W. A.: Soil-atmosphere exchange of nitrous oxide, nitric oxide, and methane under secondary succession of pasture to forest in the Atlantic lowlands of Costa Rica, Global Biogeochem. Cy., 8, 399–409, https://doi.org/10.1029/94GB01660, 1994.
Khalil, M. I., Rosenani, A. B., Van Cleemput, O., Fauziah, C. I., and Shamshuddin, J.: Nitrous Oxide Emissions from an Ultisol of the Humid Tropics under Maize-Groundnut Rotation, J. Environ. Qual., 31, 1071–1078, https://doi.org/10.2134/jeq2002.1071, 2002.
Kotowska, M. M., Leuschner, C., Triadiati, T., Meriem, S., and Hertel, D.: Quantifying above- and belowground biomass carbon loss with forest conversion in tropical lowlands of Sumatra (Indonesia), Glob. Chang. Biol., 21, 3620–3634, https://doi.org/10.1111/gcb.12979, 2015.
Kurniawan, S., Corre, M. D., Matson, A. L., Schulte-Bisping, H., Utami, S. R., van Straaten, O., and Veldkamp, E.: Conversion of tropical forests to smallholder rubber and oil palm plantations impacts nutrient leaching losses and nutrient retention efficiency in highly weathered soils, Biogeosciences, 15, 5131–5154, https://doi.org/10.5194/bg-15-5131-2018, 2018.
Liyanage, A., Grace, P. R., Scheer, C., de Rosa, D., Ranwala, S., and Rowlings, D. W.: Carbon limits non-linear response of nitrous oxide (N2O) to increasing N inputs in a highly-weathered tropical soil in Sri Lanka, Agr. Ecosyst. Environ., 292, 106808, https://doi.org/10.1016/j.agee.2019.106808, 2020.
Malhi, Y., Baldocchi, D. D., and Jarvis, P. G.: The carbon balance of tropical, temperate and boreal forests, Plant Cell Environ., 22, 715–740, https://doi.org/10.1046/j.1365-3040.1999.00453.x, 1999.
Martinson, G. O., Müller, A. K., Matson, A. L., Corre, M. D., and Veldkamp, E.: Nitrogen and phosphorus control soil methane uptake in tropical montane forests, J. Geophys. Res.-Biogeo., 126, e2020JG005970, https://doi.org/10.1029/2020JG005970, 2021.
Meijide, A., de la Rua, C., Guillaume, T., Röll, A., Hassler, E., Stiegler, C., Tjoa, A., June, T., Corre, M. D., Veldkamp, E., and Knohl, A.: Measured greenhouse gas budgets challenge emission savings from palm-oil biodiesel, Nat. Commun., 11, 1089, https://doi.org/10.1038/s41467-020-14852-6, 2020.
Moradi, A., Teh, C. B. S., Goh, K. J., Husni, M. H. A., and Ishak, C. F.: Decomposition and nutrient release temporal pattern of oil palm residues, Ann. Appl. Biol., 164, 208–219, https://doi.org/10.1111/aab.12094, 2014.
Nelson, P. N., Webb, M. J., Banabas, M., Nake, S., Goodrick, I., Gordon, J., O'Grady, D., and Dubos, B.: Methods to account for tree-scale variability in soil- and plant-related parameters in oil palm plantations, Plant Soil, 374, 459–471, https://doi.org/10.1007/s11104-013-1894-7, 2014.
OECD: Oilseeds and oilseed products, in: OECD-FAO Agricultural Outlook 2022–2031, OECD Publishing, Paris, https://doi.org/10.1787/5778f78d-en, 2022.
Quiñones, C. M. O., Veldkamp, E., Lina, S. B., Bande, M. J. M., Arribado, A. O., and Corre, M. D.: Soil greenhouse gas fluxes from tropical vegetable farms, using forest as a reference, Nutr. Cycl. Agroecosys., 124, 59–79, https://doi.org/10.1007/s10705-022-10222-4, 2022.
R Core Team: A language and environment for statistical computing, Foundation for Statistical Computing, Vienna, Austria, 2021.
Rahman, N., Bruun, T. B., Giller, K. E., Magid, J., van de Ven, G. W. J. J., and de Neergaard, A.: Soil greenhouse gas emissions from inorganic fertilizers and recycled oil palm waste products from Indonesian oil palm plantations, GCB Bioenergy, 11, 1056–1074, https://doi.org/10.1111/gcbb.12618, 2019.
Rochmyaningsih, D.: Making peace with oil palm, Science, 365, 112–115, https://doi.org/10.1126/science.365.6449.112, 2019.
Rüegg, J., Quezada, J. C., Santonja, M., Ghazoul, J., Kuzyakov, Y., Buttler, A., and Guillaume, T.: Drivers of soil carbon stabilization in oil palm plantations, Land Degrad. Dev., 30, 1904–1915, https://doi.org/10.1002/ldr.3380, 2019.
Ryadin, A. R., Janz, D., Schneider, D., Tjoa, A., Irawan, B., Daniel, R., and Polle, A.: Early effects of fertilizer and herbicide reduction on root-associated biota in oil palm plantations, Agronomy, 12, 199, https://doi.org/10.3390/agronomy12010199, 2022.
Sakata, R., Shimada, S., Arai, H., Yoshioka, N., Yoshioka, R., Aoki, H., Kimoto, N., Sakamoto, A., Melling, L., and Inubushi, K.: Effect of soil types and nitrogen fertilizer on nitrous oxide and carbon dioxide emissions in oil palm plantations, Soil Sci. Plant Nutr., 61, 48–60, https://doi.org/10.1080/00380768.2014.960355, 2015.
Skiba, U., Hergoualc'h, K., Drewer, J., Meijide, A., and Knohl, A.: Oil palm plantations are large sources of nitrous oxide, but where are the data to quantify the impact on global warming?, Curr. Opin. Env. Sust., 47, 81–88, https://doi.org/10.1016/j.cosust.2020.08.019, 2020.
Sotta, E. D., Veldkamp, E., Schwendenmann, L., Guimarães, B. R., Paixão, R. K., Ruivo, M. de L. P., Lola da Costa, A. C., and Meir, P.: Effects of an induced drought on soil carbon dioxide (CO2) efflux and soil CO2 production in an Eastern Amazonian rainforest, Brazil, Glob. Chang. Biol., 13, 2218–2229, https://doi.org/10.1111/j.1365-2486.2007.01416.x, 2007.
Stiegler, C., Meijide, A., Fan, Y., Ashween Ali, A., June, T., and Knohl, A.: El Niño–Southern Oscillation (ENSO) event reduces CO2 uptake of an Indonesian oil palm plantation, Biogeosciences, 16, 2873–2890, https://doi.org/10.5194/bg-16-2873-2019, 2019.
Tao, H. H., Slade, E. M., Willis, K. J., Caliman, J. P., and Snaddon, J. L.: Effects of soil management practices on soil fauna feeding activity in an Indonesian oil palm plantation, Agr. Ecosyst. Environ., 218, 133–140, https://doi.org/10.1016/j.agee.2015.11.012, 2016.
Tchiofo Lontsi, R., Corre, M. D., Iddris, N. A., and Veldkamp, E.: Soil greenhouse gas fluxes following conventional selective and reduced-impact logging in a Congo Basin rainforest, Biogeochemistry, 151, 153–170, https://doi.org/10.1007/s10533-020-00718-y, 2020.
Thomas, M., McLaughlin, D., Grubba, D., Buchanan, J., McLaughlin, D., Grubba. Don, Grubba, D., and Buchanan, J.: Sustainable sourcing guide for palm oil users: A practical handbook for US consumer goods and retail companies, Conservation International and WWF US, 83, 2015.
van Straaten, O., Veldkamp, E., and Corre, M. D.: Simulated drought reduces soil CO2 efflux and production in a tropical forest in Sulawesi, Indonesia, Ecosphere, 2, art119, https://doi.org/10.1890/ES11-00079.1, 2011.
van Straaten, O., Corre, M. D., Wolf, K., Tchienkoua, M., Cuellar, E., Matthews, R. B., and Veldkamp, E.: Conversion of lowland tropical forests to tree cash crop plantations loses up to one-half of stored soil organic carbon, P. Natl. Acad. Sci. USA, 112, 9956–9960, https://doi.org/10.1073/pnas.1504628112, 2015.
Veldkamp, E., Weitz, A. M., and Keller, M.: Management effects on methane fluxes in humid tropical pasture soils, Soil Biol. Biochem., 33, 1493–1499, https://doi.org/10.1016/S0038-0717(01)00060-8, 2001.
Veldkamp, E., Koehler, B., and Corre, M. D.: Indications of nitrogen-limited methane uptake in tropical forest soils, Biogeosciences, 10, 5367–5379, https://doi.org/10.5194/bg-10-5367-2013, 2013.
Veldkamp, E., Schmidt, M., Powers, J. S., and Corre, M. D.: Deforestation and reforestation impacts on soils in the tropics, Nat. Rev. Earth Environ., 1, 590–605, https://doi.org/10.1038/s43017-020-0091-5, 2020.
Vijay, V., Pimm, S. L., Jenkins, C. N., and Smith, S. J.: The impacts of oil palm on recent deforestation and biodiversity loss, PLOS ONE, 11, e0159668, https://doi.org/10.1371/journal.pone.0159668, 2016.