the Creative Commons Attribution 4.0 License.
the Creative Commons Attribution 4.0 License.
 | 26 Jan 2024
Observational relationships between ammonia, carbon dioxide and water vapor under a wide range of meteorological and turbulent conditions: RITA-2021 campaign
Ruben B. Schulte
Jordi Vilà-Guerau de Arellano
Susanna Rutledge-Jonker
Shelley van der Graaf
Jun Zhang
Margreet C. van Zanten
We present a comprehensive observational approach that aims to establish relationships between the surface–atmosphere exchange of ammonia (NH3) and CO2 uptake and transpiration by vegetation. In doing so, we study relationships useful for the improvement and development of NH3 flux representations in models. The NH3 concentration and flux are measured using a novel open-path miniDOAS (differential optical absorption spectroscopy) measurement setup, taken during the 5-week Ruisdael Land–Atmosphere Interactions Intensive Trace-gas and Aerosol measurement (RITA-2021) campaign (25 August until 12 October 2021) at the Ruisdael Observatory in Cabauw, the Netherlands. After filtering for unobstructed flow, sufficient turbulent mixing and CO2 uptake, we find the diurnal variability in the NH3 flux to be characterized by daytime emissions (0.05 on average) and deposition at sunrise and sunset (−0.05 on average). We first compare the NH3 flux to the observed gross primary production (GPP), representing CO2 uptake, and latent heat flux (LvE), representing net evaporation. Next, we study the observations following the main drivers of the dynamic vegetation response, which are photosynthetically active radiation (PAR), temperature (T) and the water vapor pressure deficit (VPD). Our findings indicate the dominance of the stomatal emission of NH3, with a high correlation between the observed emissions and both LvE (0.70) and PAR (0.72), as well as close similarities in the diurnal variability in the NH3 flux and GPP. However, efforts to establish relationships are hampered by the high diversity in the NH3 sources of the active agricultural region and the low data availability after filtering. Our findings show the need to collocate meteorological, carbon and nitrogen studies to advance our understanding of NH3 surface exchange and its representation.
- Article
(6855 KB) - Full-text XML
- BibTeX
- EndNote


While nitrogen is an essential nutrient for the growth of plants, acting as a fertilizer, excess nitrogen deposition causes environmental damage and leads to an increased public health risk via the formation of particulate matter (Bobbink et al., 2003; Behera et al., 2013; Erisman and Schaap, 2004; Erisman et al., 2013; Smit and Heederik, 2017). When nitrogen critical loads are exceeded, excess nitrogen deposition threatens biodiversity through acidification and eutrophication of soils. When mitigation of the harmful effects of nitrogen fails, there can be serious political, economic and societal consequences, as demonstrated by the current Dutch nitrogen crisis (Stokstad, 2019). Atmospheric ammonia (NH3) plays a key role in the deposition of nitrogen, mainly originating from agricultural activity. This is especially true in the Netherlands, where NH3 deposition accounts for about three-quarters of all nitrogen deposition (Wichink Kruit and van Pul, 2018; RIVM et al., 2019).
Efforts to mitigate the harmful effects of nitrogen deposition heavily rely on models representing the concentration and deposition of nitrogen compounds, supported by a network of concentration and surface–atmosphere exchange measurements. The surface–atmosphere exchange in such models is represented by parameterizations, which are developed, validated and improved based on advanced high-resolution observations. In the case of atmospheric ammonia, taking accurate high-resolution measurements is notoriously difficult, due to the reactive nature of gaseous NH3 causing the gas to “stick” to the inlet walls of conventional instruments (Parrish and Fehsenfeld, 2000; von Bobrutzki et al., 2010). These challenges are amplified when measuring the NH3 surface–atmosphere exchange flux (deposition or emission), where high precision is particularly important (Nemitz et al., 2004; Whitehead et al., 2008).
Recent developments in advanced instrumental techniques resolve these inlet issues by using optical open-path analyzers. Swart et al. (2023) presents an intercomparison of two novel open-path measurement setups aimed at measuring the NH3 flux at half-hourly resolution: the RIVM-miniDOAS 2.2D (where DOAS denotes differential optical absorption spectroscopy) and the commercial Healthy Photon HT8700E. The two setups showed very similar results, despite being widely different in their measurement principle and approach to deriving the flux from concentrations: the Healthy Photon uses the eddy-covariance technique, whereas the miniDOAS applies the flux-gradient method to line-average concentration measurements over a 22 m open path at two heights. In this study, we continue the analysis of the observations of the miniDOAS system presented by Swart et al. (2023), as the system provides reliable measurements of both the concentration and flux with a high operational uptime.
In a previous study, based on measurements from the predecessor of the miniDOAS system at the Veenkampen meteorological site in the Netherlands, we identified that the mechanisms behind the stomatal exchange of NH3 are not yet fully understood (Schulte et al., 2021). Here, we continue to study this stomatal exchange pathway by linking the observed NH3 flux () to photosynthesis, i.e., the stomatal exchange of CO2 and water vapor (plant transpiration). The similarities between the stomatal exchange of NH3 and CO2 have long been recognized (San José et al., 1991; Schrader et al., 2020). However, there are very few parallel measurements of NH3 and CO2 fluxes, and research into the two gases is generally conducted by separate scientific communities (Milford et al., 2001). Milford et al. (2001) performed one of the few attempts to develop a simple parameterization for both the CO2 and NH3 flux, but they were unsuccessful with respect to finding such relationships for NH3, as the observed NH3 flux over Scottish heathland was dominated by non-stomatal exchange. Further, Zöll et al. (2019) performed an analysis to study whether the biosphere–atmosphere exchange of total reactive nitrogen was driven by the same variables as CO2.
Our aim is to relate NH3 and CO2 fluxes in order to advance our understanding of NH3 stomatal exchange. These surface exchanges need to be related to the sensible and latent heat fluxes and to the diurnal boundary layer dynamics (Vilà-Guerau de Arellano et al., 2023). Utilizing recent developments in NH3 measurement techniques, we combine high-quality miniDOAS observations with measurements of both CO2 and water vapor fluxes as well as with other meteorological variables. As our dataset is limited due to diverse weather conditions and the complexity associated with nearby multiple sources of ammonia, our analysis acts as a proof of concept, serving as an example of the need for combined high-quality NH3 flux measurements with auxiliary measurements of CO2, water vapor fluxes and other meteorological variables. As such, we decided to guide our analysis solely using observations and to keep the use of the representation of processes to interpret our data to a minimum. We first describe the observations, after which we link the observed to stomatal exchange, with the intention of establishing relationships between the stomatal exchange of ammonia and the processes of CO2 uptake and transpiration by vegetation. As these processes of photosynthesis are well understood, we explore how this understanding can lead to further improvement of the parameterization of the NH3 stomatal exchange.
2.1 Site description and measurement strategy
In September 2021, the Ruisdael Land–Atmosphere Interactions Intensive Trace-gas and Aerosol measurement campaign, known as RITA-2021, took place at the Cabauw Observatory (https://ruisdael-observatory.nl/cabauw/, last access: 15 January 2024). The Cabauw Observatory, one of the six sites within the Ruisdael Observatory, is located on flat grassland in the Netherlands (51.971∘ N, 4.927∘ E), with an average grass height of 0.1 m. The site provides a unique set of surface and upper-air observations, matched by very few stations worldwide. This includes measurements of thermodynamic variables along the 213 m mast, radiation, surface fluxes, clouds and trace gases. Surface elevation changes are, at most, a few meters over 20 km, and the nearby region is agricultural. An overview of the Cabauw site, the instruments stationed at the site and its 50 years of observations is given in Bosveld et al. (2020).
During the campaign, 48 d (from 25 August to 12 October) of ammonia measurements are taken using the miniDOAS flux measurement setup (Berkhout et al., 2017). The measurement setup and more details on the measurement campaign are described in Swart et al. (2023). In short, the miniDOAS is an optical instrument, measuring the line-average concentration (mass density) over a 22 m open path from the instrument to its retroreflector. The 30 min average NH3 concentrations have an accuracy of 3 % (e.g., 0.15 µg m−3 at the median NH3 concentration of 5 µg m−3 during the campaign; for further details, see Swart et al., 2023). The flux measurement setup uses two miniDOAS instruments that measure the concentration over parallel paths at different heights, i.e., 0.76 and 2.29 m, respectively. Regular intercalibration between the miniDOAS instruments allowed quantification and correction of any potential bias between the two instruments. The remaining random uncertainty in the ΔNH3 was 0.088 µg m−3 (1σ; for further details, see Swart et al., 2023). is then inferred using the flux-gradient method, based on the Monin–Obukhov similarity theory (Moene and Van Dam, 2014). The flux-gradient method combines the observed vertical NH3 gradient with turbulent measurements of a sonic anemometer (model Gill WindMaster Pro™, Gill Instruments, Lymington, UK) (Wyers et al., 1993; Nemitz et al., 2004; Wichink Kruit et al., 2007; Schulte et al., 2021). The sonic anemometer was mounted at 2.8 m above the ground alongside the mini-DOAS measurement path. Temperature data are based on the corrected air temperature as calculated by the EddyPro software from the sonic data. The 10 Hz open-path H2O and CO2 analyzer (LI-7500DS, LI-COR Biosciences, Lincoln, USA) was placed at a similar height, 15 cm away from the sonic (for more details, see information on sonic no. 1 in Swart et al., 2023). The CO2 and water vapor fluxes and other micrometeorological parameters were calculated using EddyPro software (LI-COR Biosciences, 2024) at 30 min intervals with the 10 Hz raw data. The flux calculation procedure followed the general best practices as applied across the FluxNet network (e.g., Mauder et al., 2022), including coordinate rotation (Wilczak et al., 2001), spectral corrections for both filtering (Moncrieff et al., 2004) and low-pass filtering (Moncrieff et al., 1997), and addition of the Webb–Pearman–Leuning density term (Webb et al., 1980).
The measurement field and its surroundings are shown in Fig. 1. The miniDOAS light paths are aimed north-northwest (right panel) to ensure unobstructed flow for wind coming from the west, which is the dominant wind direction in the Netherlands. North of the light path, shown in yellow in Fig. 1, the flow of air is obstructed by several instruments, including the aforementioned sonic anemometer. To the east and south, the airflow is obstructed by a trailer, the 213 m high meteorological tower and the container which houses the miniDOAS instruments. The unobstructed region west of the measurement field is mainly characterized by actively managed agricultural grassland and the small town of Cabauw (about 750 inhabitants), as shown in the left panel of Fig. 1. Several farms can be seen northwest and west of the measurement field, with varying emission strengths that reach over 1200 kg NH3 yr−1. Sheep and cattle graze on these agricultural fields, which are actively maintained and fertilized. These activities were not documented; sporadic fertilization events do affect the NH3 measurements, as will be discussed later.
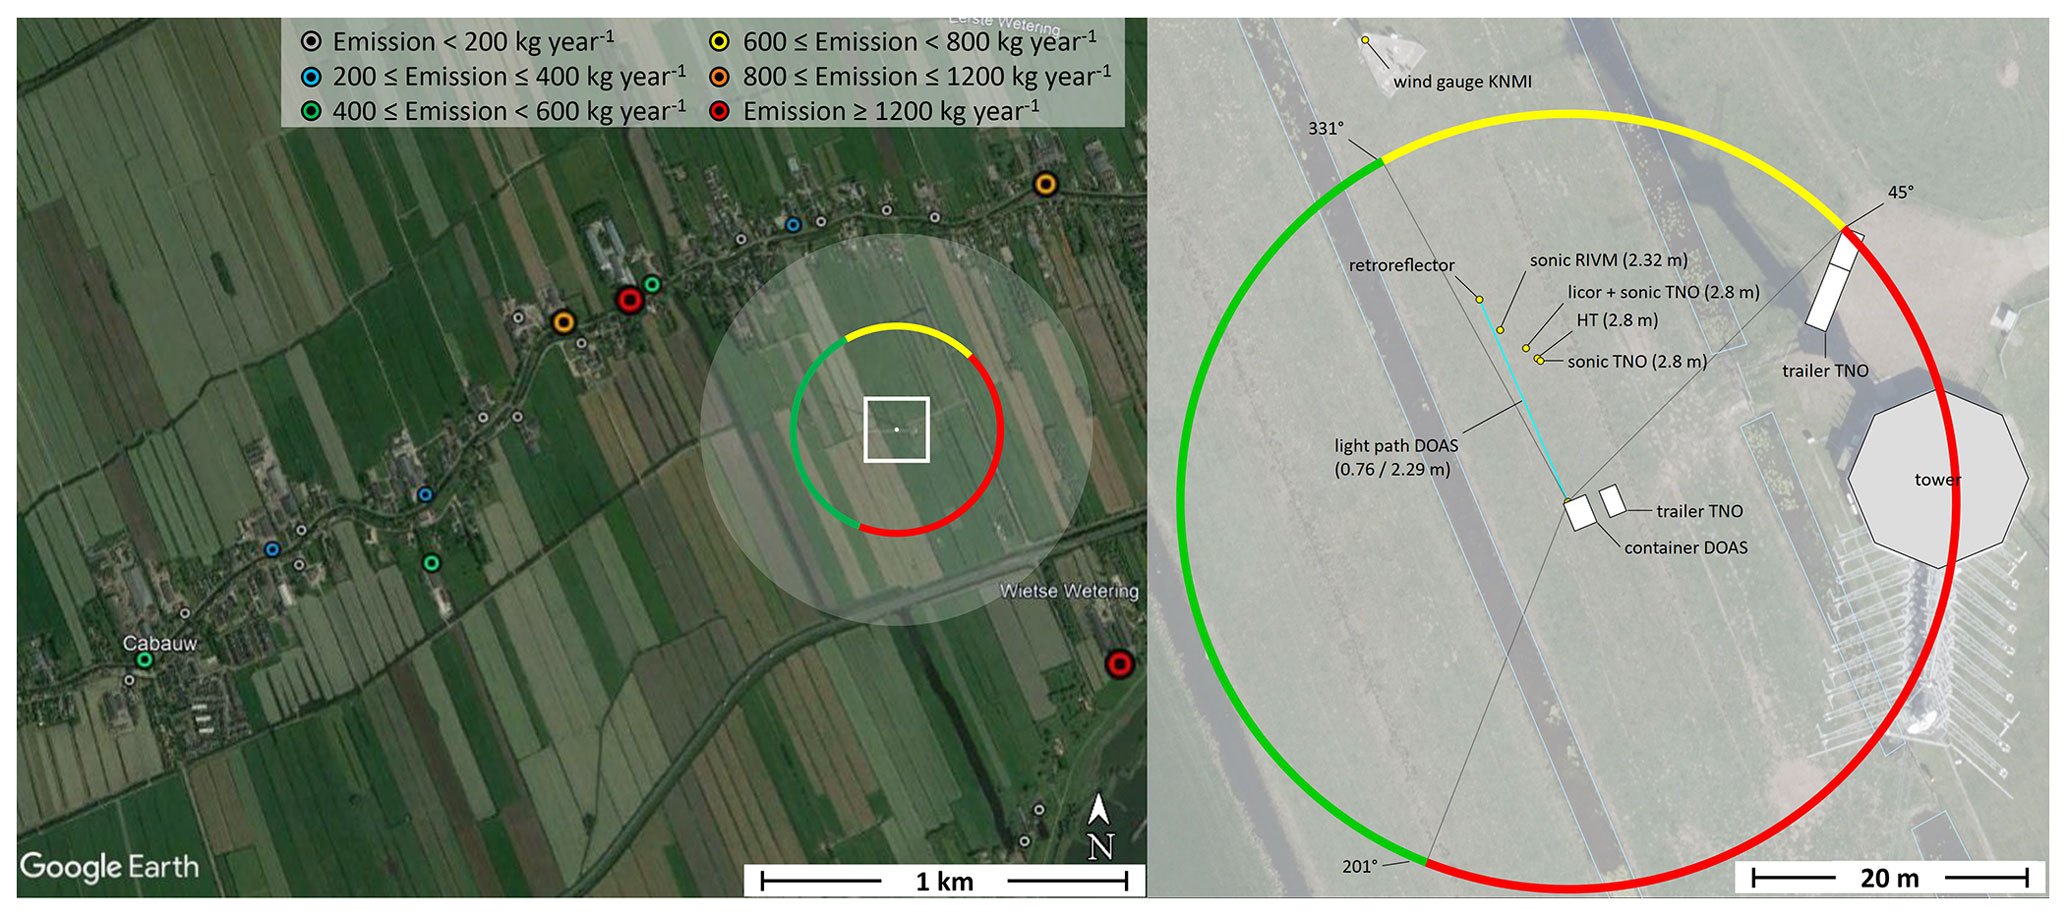
Figure 1The area surrounding the Cabauw Observatory (left) and the setup of the instruments at the measurement site (right). The transparent white circle represents a distance of 500 m from the NH3 measurements and the color-coded dots represent the locations of nearby farms; the emission strength at the latter locations is specified in kg NH3 yr−1 (source: Emissieregistratie, https://www.emissieregistratie.nl, last access: 21 January 2022). The colored circle in both panels indicates the wind directions in which the airflow towards the miniDOAS light path is obstructed by either other instruments (yellow) or larger structures such as the tower and containers (red). The information in the left panel was sourced from Cabauw Observatory (51.971∘ N, 4.927∘ E) (© Google Earth, 27 January 2022, Image by Landsat / Copernicus). The right panel presents modified information from Swart et al. (2023).
2.2 Data filtering
We apply several filter criteria to the RITA-2021 observations; these are shown in Table 1 along with the acceptance rates for each individual filter criterion. The miniDOAS flux setup requires several days of intercalibration measurements, as described in Swart et al. (2023). No ammonia flux can be inferred from these intercalibration measurements, leaving 65 % of the campaign observations suitable for flux measurements. Furthermore, we discard observations from 11 to 12 September, as these NH3 emission fluxes are outliers with respect to the average observed NH3 flux, indicating a fertilization event in close proximity to the measurement site.
Table 1Filter criteria, being applied in sequence, with filter acceptance rates (in percentages and hours).
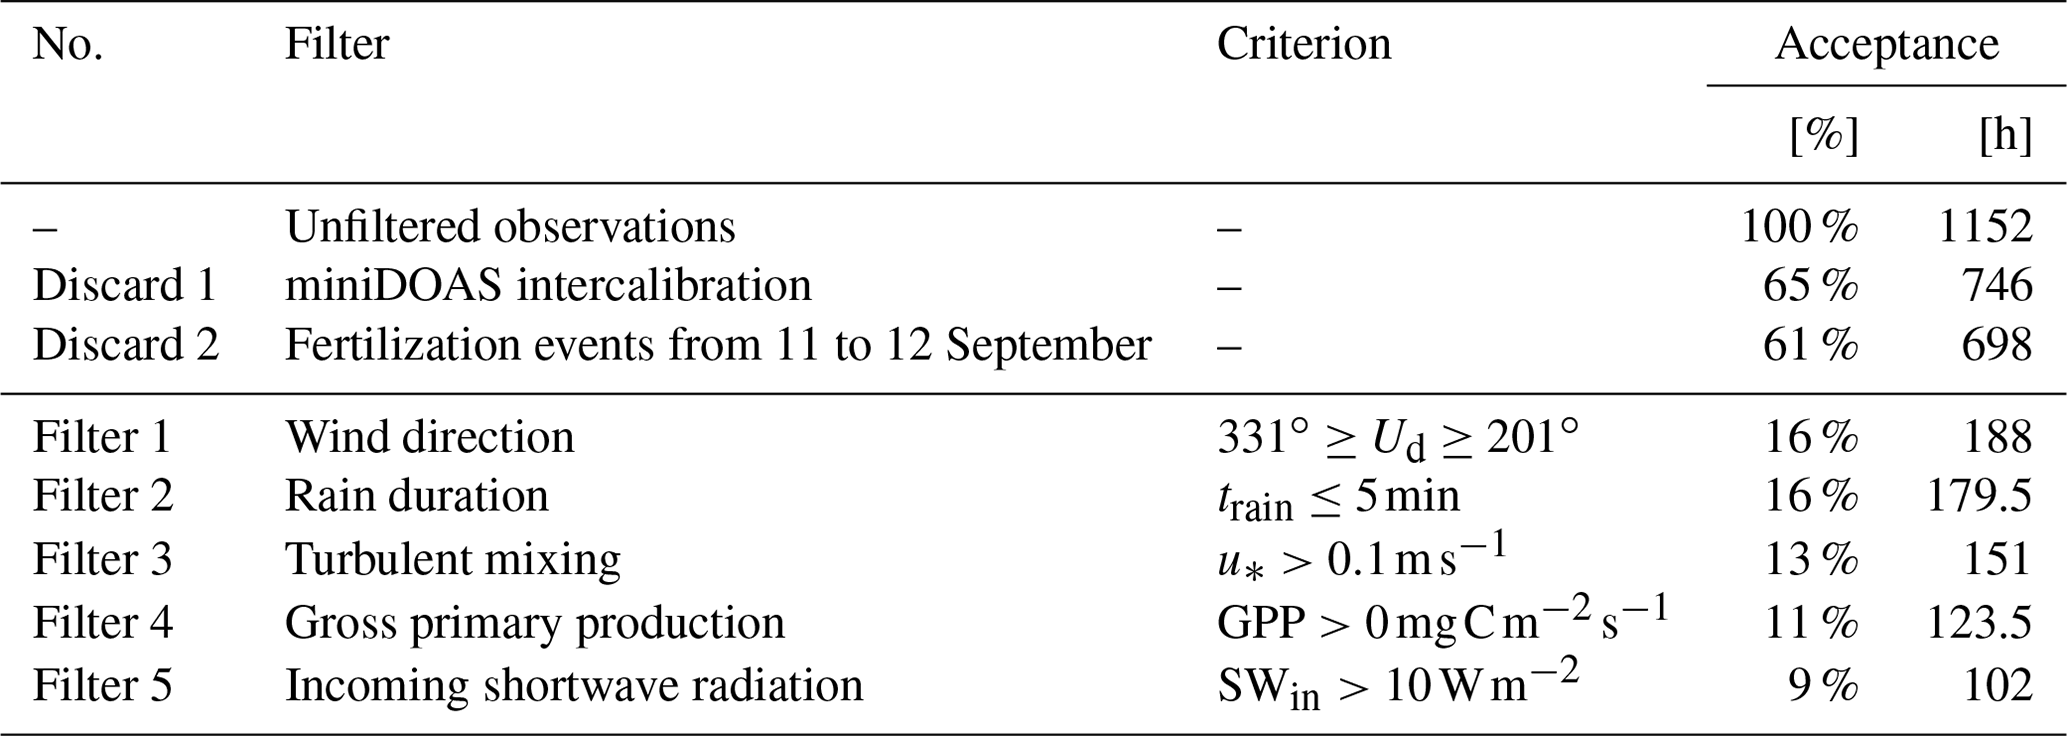
The remaining measurements are processed by applying five filters in total. The use of the flux-gradient method requires unobstructed upwind airflow with sufficient turbulent mixing. Figure 1 shows that the instruments were positioned anticipating winds from the southwest (green), with the obstacles located east (red) and north (yellow) of the miniDOAS optical path. Therefore, we apply a criterion filtering for wind directions between 201∘ and 331∘. This filter leads to a large reduction in the data available for analysis, decreasing the available data from 61 % to 16 %, as the prevalent wind direction during the campaign was from the northeast. As a secondary effect of this filter, the available observations are taken under synoptic weather conditions characterized by frontal passages with some rain events. The second filter excludes rain events lasting more than 5 min, as rain droplets can obstruct the light path of the miniDOAS. Finally, sufficient turbulent mixing is one of the main requirements for flux measurement using the flux-gradient method. Therefore, the third filter requires the friction velocity to have a value of at least 0.1 m s−1 ( m s−1). With these three filters, we ensure the quality of the ammonia measurements, observing the NH3 flux with an average precision of 0.015 (1σ; for further details, see Swart et al., 2023).
The fourth and fifth filter criteria focus on the ammonia surface–atmosphere exchange pathways. The NH3 flux follows three pathways: the stomatal pathway, the external leaf surface pathway and the soil pathway (Nemitz et al., 2001; Massad et al., 2010; van Zanten et al., 2010). The latter is generally assumed to be negligible for the over grass, as the dense vegetation completely covers the soil. The external leaf pathway represents the exchange of ammonia with a thin film of water and leaf surface waxes on the leaf surface and depends on the relative humidity (RH) (Van Hove et al., 1989). Finally, the stomatal pathway represents the exchange of NH3 through the plant stomata with ammonium dissolved in the apoplast fluids of the plant (Farquhar et al., 1980; Wichink Kruit et al., 2010). These processes occur at the leaf scale (micrometer or millimeter level) and, as such, require a representation of photosynthesis and stomatal aperture that needs to be evaluated with observations (Vilà-Guerau de Arellano et al., 2020). Upscaling to the canopy level allows it to be compared with observations inferred from eddy covariance, such as the GPP (Filter 4).
The NH3 exchange through the stomatal pathway is governed by the dynamic response of vegetation to meteorological conditions and is closely related to photosynthesis. The stomata open during the day in response to solar radiation, as the vegetation uses energy for photosynthesis, particularly the photosynthetically active radiation (PAR) (Hsiao, 1973; Cowan and Farquhar, 1977; Papaioannou et al., 1996; Ronda et al., 2001). Plants ingest CO2 through the stomata, but water from inside the plant can evaporate as the stomata are opened. The plant can reduce this loss of water by (partly) closing the stomata in the case of a high water vapor pressure deficit (VPD), or it can increase the evaporation rate by actively opening the stomata. Increasing the evaporation rate provides cooling, lowering the leaf temperature in order to reach the optimal conditions to perform photosynthesis (Jacobs and de Bruin, 1997; Takagi et al., 1998; de Groot et al., 2019; Vilà-Guerau de Arellano et al., 2020). As the temperature and VPD are often highest in the afternoon, the stomata often partly close to manage the loss of water. During the night, there is no PAR for photosynthesis, so the stomata are closed. As a result, the characteristics of ammonia surface–atmosphere exchange differ between day and night, with the stomatal pathway being dominant during the day and the external leaf pathway being the dominant pathway during the night and in the early morning.
The uptake of CO2 is represented by the gross primary production (GPP, in ). The GPP and the ecosystem respiration (ER) combined define the net ecosystem exchange (NEE) of CO2. Using the sign convention that the flux towards the surface is positive, we define the net ecosystem exchanges as follows: , where (under normal daytime grass field conditions) our observations are NEE>0, the inferred GPP values are positive and the inferred ER values are negative. The ER is estimated by taking the average campaign nighttime (defined when the net available radiation is zero, Qnet<0) CO2 flux, which is approximately −0.6 . The GPP is then estimated by combining the observed CO2 flux with the estimated respiration.
The approach described above fits with our aim of guiding the analysis using measurements alone. However, well-established methods exist to partition the NEE into the GPP and ER. In Appendix A, we show that using the Arrhenius-type relationship between temperature and nighttime CO2 flux to describe ER, as proposed by Lloyd and Taylor (1994), and then subtracting that from the NEE to arrive at the GPP only changes the GPP estimates slightly. Because of its limited impact on the results, we continue with the observation-based estimate of the GPP in the main text.
To capture observations with active stomatal exchange, Filter 4 is set to only accept GPP>0 . Due to the uncertainty in our GPP estimate, there are still some nighttime observations which pass the filter. Therefore, we add an additional fifth filter using incoming shortwave radiation (SWin). Only measurements with will pass in order to filter out these last remaining nighttime observations.
After filtering, 102 h (9 %) of all RITA-2021 observations, or 18 % of all daytime RITA-2021 observations, are available for analysis. These observations are taken over 17 unique days, spanning from 29 August to 30 September, with an average of 6 h and a maximum of 12 h of accepted measurement per day.
2.3 Characterization of the campaign meteorology
The summer months (June, July and August) leading up to the RITA-2021 campaign are characterized as an average Dutch summer, with average temperatures (17.7 ∘C), above-average precipitation (244 mm accumulated) and below-average hours of sunshine (618 h). Additionally, the ground and surface water levels are actively managed in order to sustain optimal conditions for the agricultural activity in the area (Brauer et al., 2014). Thus, it is expected that the role of long-term vegetation stress on stomatal exchange is negligible during the RITA-2021 campaign.
As discussed in Sect. 2.2, high temperatures or a high VPD can induce vegetation stress during the campaign. Therefore, we characterize the meteorological conditions of the 17 unique days on which the 102 h of filtered measurements were taken. The meteorological conditions of these days are summarized in Table 2, which shows the 17 d average and the observed range of the diurnal minimum/maximum of several variables. The 17 d average values provide a characterization of mild meteorological conditions with no indication that the vegetation is under stress. Additionally, Table 2 includes an estimate of the maximum daytime footprint determined using the sonic anemometer fluxes at a height of 2.8 m, following the method from Kljun et al. (2015). This footprint refers to the maximum upwind distance (in meters) encompassing the source area that contributed 70 % of the measured flux and serves as a first-order approximation of the footprint of the NH3 flux measurements.
Table 2A characterization of the meteorology of the 17 unique days for which observational data pass the filters, showing the 17 d average and the range of the diurnal minimum/maximum of several (meteorological) variables. Daily maximum flux footprint length (70 %) refers to the maximum upwind distance (in meters) encompassing the source area that contributed 70 % of the measured flux. For GPP and flux footprint length, nighttime is excluded.
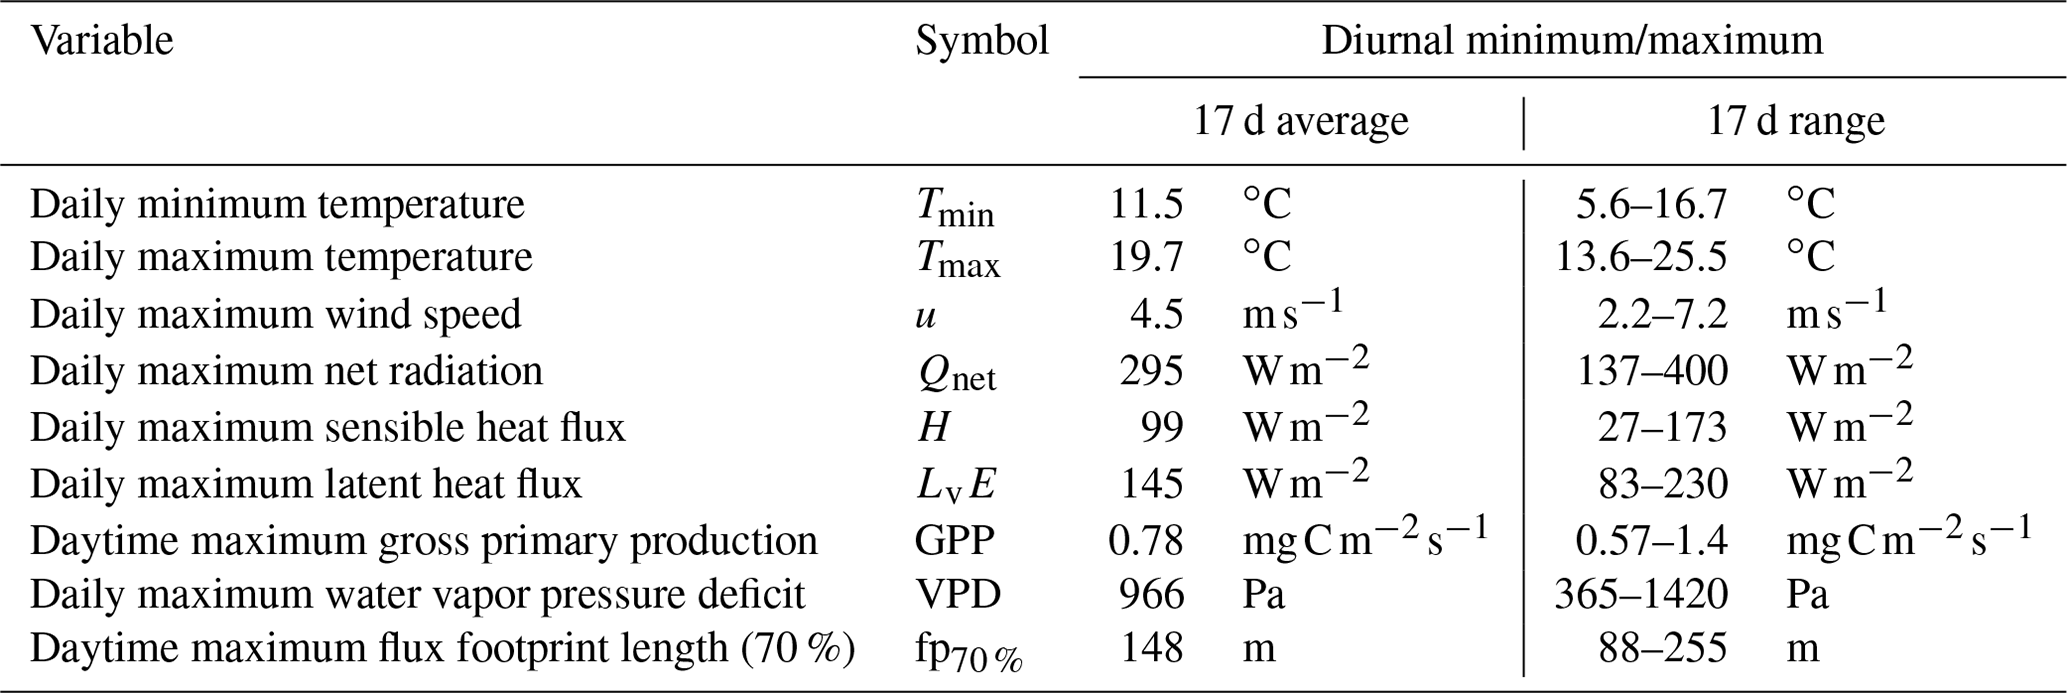
As the filtered campaign measurements are characterized by frontal passages, the weather conditions range from clear-sky summer conditions with moderately high temperatures to colder cloudy days with short precipitation events (not shown). Furthermore, the atmospheric stability for the 102 h of filtered measurements is classified using the measured Obukhov length (L) and the height of the sonic anemometer (z=2.8 m). In total, 4.5 h (4 %) can be classified as stable (), 61 h (60 %) can be classified as neutral () and 36.5 h (36 %) can be classified as unstable () conditions. This variation leads to a large spread in all variables shown in Table 2, as indicated by the column showing the 17 d range.
2.4 General characterization of the NH3 observations
The variety of meteorological conditions could be an explanation of the large day-to-day difference in the observed NH3 concentrations (shown in Fig. 2b). The histogram is highly skewed and shows that most observed NH3 concentrations are below 7 µg m−3, although higher concentrations with a maximum value of 24.7 µg m−3 are also present. Nevertheless, the mean (solid line) and median (dotted line) concentrations do indicate that the concentration decreases during the day, until the late afternoon. This would be in line with observations at several other sites, both in the Netherlands (Wichink Kruit et al., 2007; Schulte et al., 2021) and in other countries, e.g., Scotland (von Bobrutzki et al., 2010) or Italy (Ferrara et al., 2021). The large day-to-day differences in the NH3 measurements could be a result of the changing meteorological conditions, the nearby agricultural activity or a combination of both.
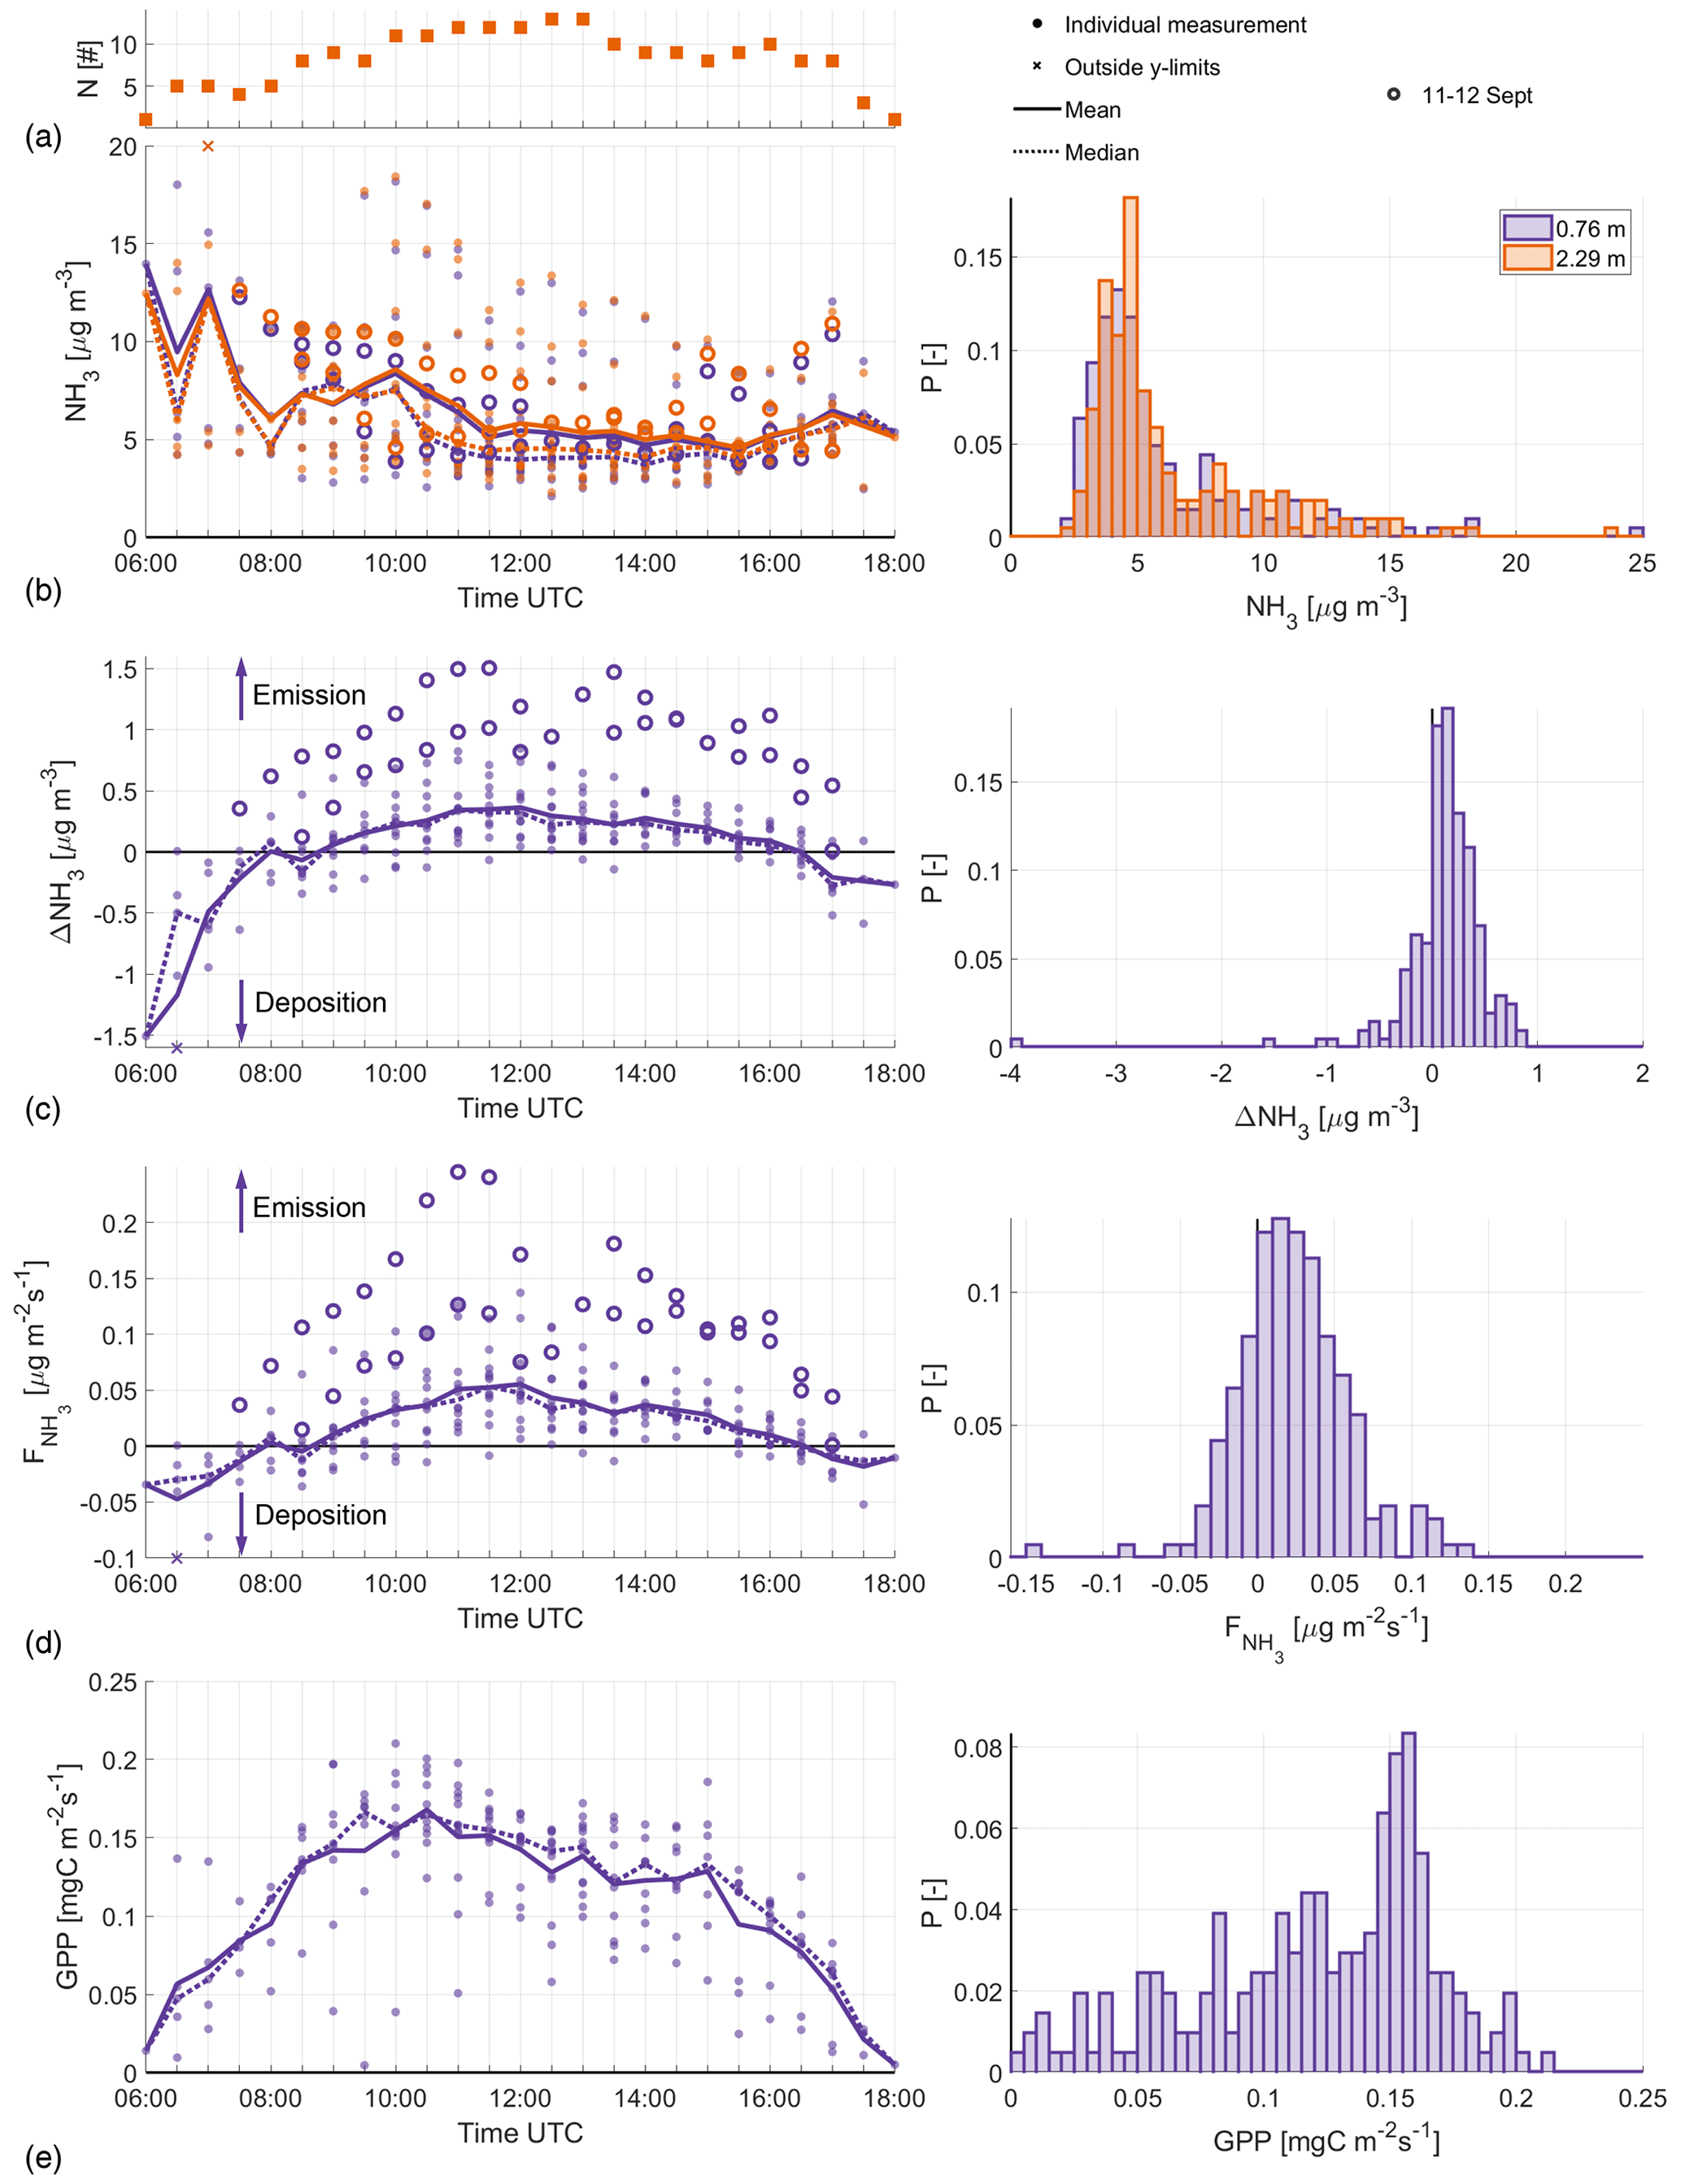
Figure 2The diurnal variability, from sunrise (06:00 UTC) to sunset (18:00 UTC), in the filtered NH3 concentration (b), NH3 gradient (c), (d) and the GPP, with the corresponding histogram to the right in each instance. At each moment in time, the multiday mean (solid line) and median (dotted line) are calculated. Highlighted are observations from the fertilization event on 11–12 September (open circles). The numbers (N) of observations over which these averages are calculated are displayed in panel (a). ΔNH3 is defined so that the sign matches that of , i.e., negative numbers indicate deposition and positive numbers indicate emission.
Despite the high variability in the NH3 concentration measurements, a consistent diurnal variability is observed in the NH3 gradient (ΔNH3) and corresponding flux in Fig. 2c and d, respectively. Both Fig. 2b and c indicate that the observed ΔNH3 is independent of the absolute NH3 concentration, i.e., high absolute concentrations do not lead to a large concentration difference between the two miniDOAS instruments. The average diurnal variability is characterized by negative ΔNH3 (deposition) in the early morning and late afternoon and positive (emission) ΔNH3 during the afternoon, with a typical range of about 0.5 µg m−3 in both directions. In total 79 % of the filtered observations have a positive ΔNH3, corresponding to NH3 emissions.
As is directly inferred from ΔNH3, the diurnal variability in Fig. 2c and d is very similar. The NH3 flux typically reaches its maximum around noon at a little over 0.05 on average, with individual noon observations ranging from −0.01 to 0.14 . Note that the measurements taken on 11–12 September, the aforementioned fertilization event, are approximately a factor 4 larger than the mean campaign values. Despite the large observed on these days, the observed concentrations are only slightly larger than the campaign averages. These 2 d will not be included in the analysis presented in this study, but they are shown as an illustration of how fertilization events can impact our analysis.
2.5 Characterization of the ammonia flux
In Fig. 3a, we show the observed ammonia flux against the air temperature, with the colors indicating the atmospheric NH3 concentration at 2.29 m. Despite our efforts to filter for observations where the stomatal pathway is dominant, it cannot be ruled out that the external leaf pathway still plays an important role in the morning, via deposition onto morning dew at the canopy level (van Zanten et al., 2010; Wentworth et al., 2016). Therefore, we use black circles to mark observations taken before 12:00 UTC with a RH>80 % in Fig. 3. These highlighted observations indeed generally correspond to measurements of deposition or weak emission, indicating that NH3 exchange through the external leaf pathway is still significant for these observations. While their involvement complicates our analysis of stomatal NH3 exchange, they are still included in the analysis, as this also offers an opportunity to test if the relationships found in the filtered dataset differ for the marked and unmarked observations. If that is the case, it shows that we are indeed able to attribute the unmarked observations to stomatal exchange.
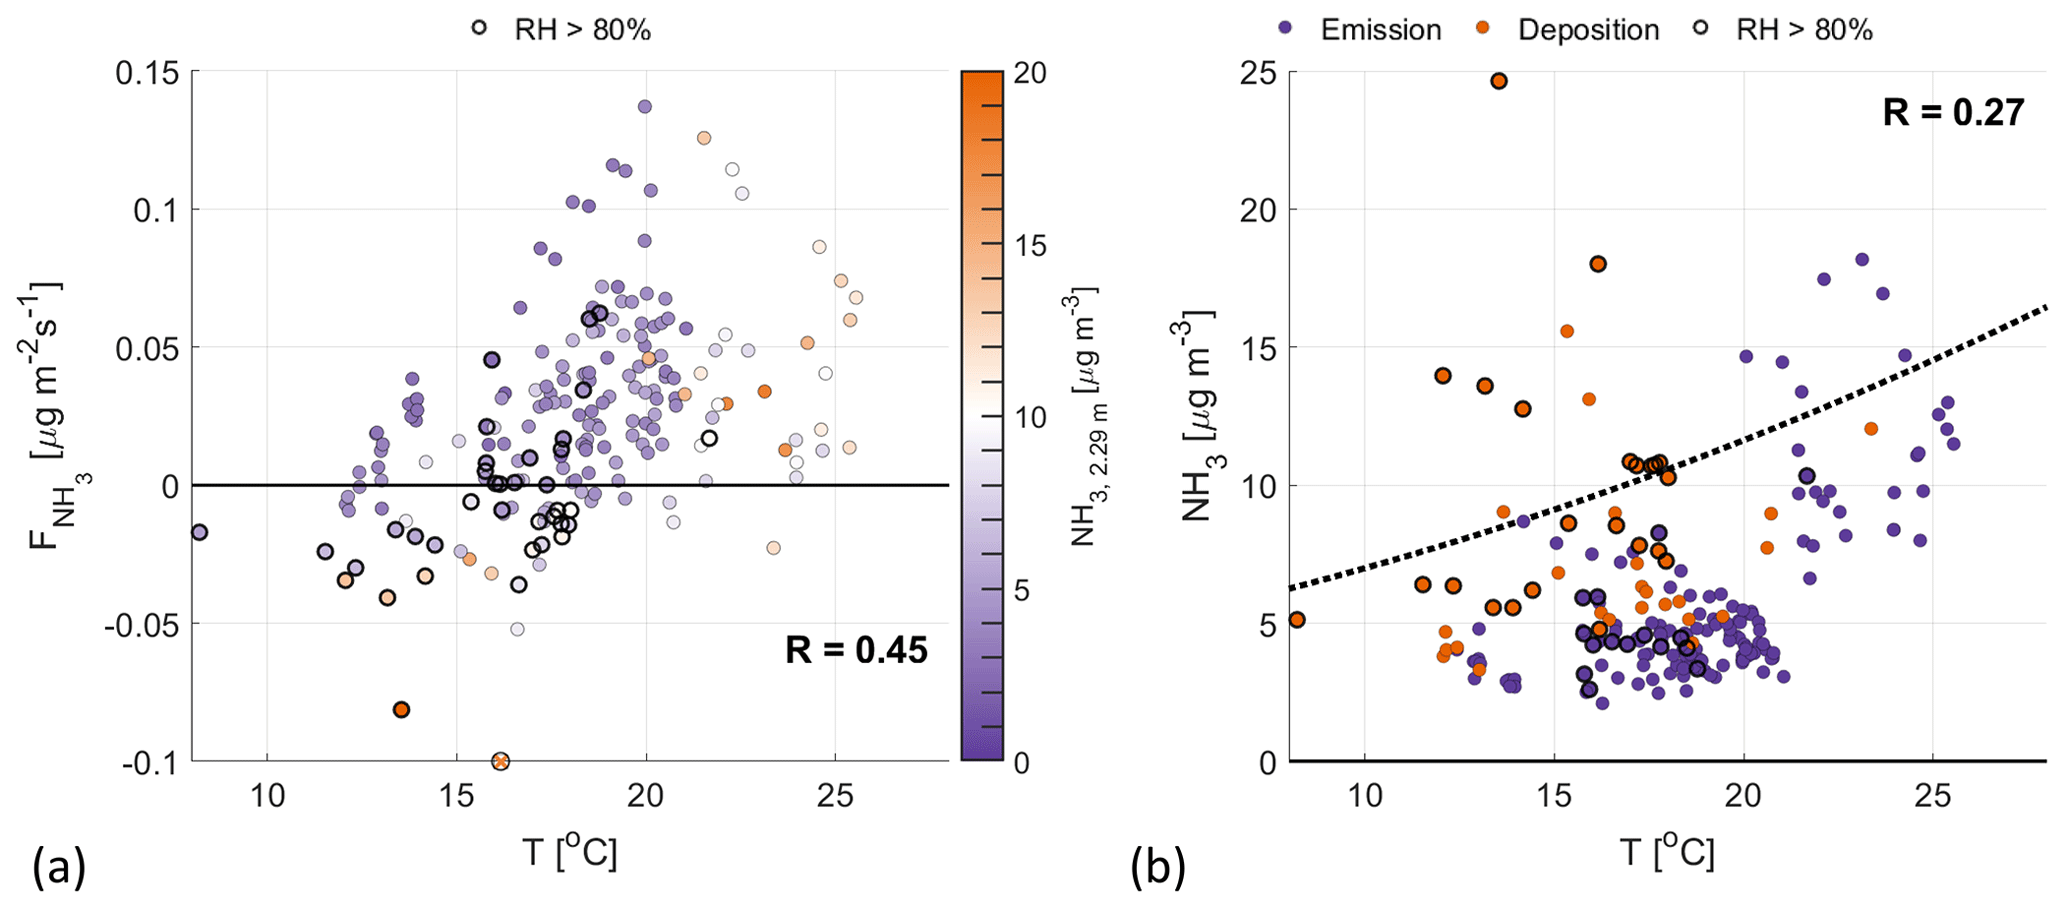
Figure 3The 2.8 m temperature plotted against (a) and the observed NH3, 2.29 m concentration (b). The color coding in panel (a) represents the NH3 concentration, observed at 2.29 m. In panel (b), the dotted line represents the theoretical stomatal compensation point (χs) for a long-term NH3 concentration of 7.7 µg m−3. Highlighted with black circles are observations with a RH>80 %, taken before noon, where NH3 exchange through the external leaf pathway can play a significant role.
Figure 3a shows that increases with temperature for a low atmospheric concentration (). We attribute this increase in NH3 emissions to the change in ΔNH3 for increasing temperature, i.e., the difference between the approximately constant atmospheric NH3 concentration and the stomatal compensation point. Following parameterizations of this compensation point, we find it to be related to the (leaf) temperature and some form of nitrogen availability parameter (e.g., actual or long-term NH3 concentration): increasing nonlinearly with increasing temperature or nitrogen input (Nemitz et al., 2001; Massad et al., 2010; van Zanten et al., 2010). In Fig. 3b, a theoretical stomatal compensation point (dotted line) is added, which is calculated following the DEPosition of Acidifying Compounds (DEPAC) parameterization (van Zanten et al., 2010), using air temperature and the campaign median NH3, 2.29 m (7.7 µg m−3). shows more scatter for measurements taken at high temperatures (>21 ∘C). While Fig. 3b shows only small variations in the NH3 concentration for temperatures below 21 ∘C, the NH3 concentrations for these warmer temperatures are higher than the campaign average (>7 µg m−3) and highly variable. As the NH3 flux is directly related to the difference between the atmospheric NH3 and the stomatal compensation point, the variability in the atmospheric concentration led to the scatter shown in Fig. 3a, where higher NH3 concentrations correspond to weaker emission fluxes.
The diurnal pattern of in Fig. 2d shows similarities to the diurnal variability in the GPP in Fig. 2e. To further study the role of stomatal exchange during the campaign, we link the observed to the dynamic vegetation responses. First, we relate the ammonia flux to the GPP, the latent heat flux (LvE) and the sensible heat flux (H). The GPP and (the transpirational part of) LvE are directly governed by the opening and closing of the stomata and represent stomatal exchange. Given the low data availability (9 %), we are aware that the analysis could be dominated by variations resulting from the diurnal variability in the fluxes. Therefore, we also include H in our analysis. The sensible heat flux is only indirectly related to the dynamic vegetation response through the surface energy balance, as the available energy from (solar) radiation and the soil heat flux is split between LvE and H. If the observed fluxes are indeed regulated through the opening and closing of stomata, the analysis of with respect to LvE and GPP should differ from the comparison with H.
Next, we organize the observations following current dynamic vegetation models, based on temperature, radiation and moisture (Jarvis et al., 1976; Stewart, 1988; Ronda et al., 2001). Here, we compare the responses of the four individual fluxes to temperature (T), PAR and VPD. As these three variables control the stomatal response at the canopy level in the models, we will use the responses of the fluxes to these variables as a guide to better understand the diurnal variability in the ammonia flux. Note that measurements taken on 11–12 September are not used to calculate correlation coefficients, but they are shown in the figures and included in the visual analysis.
3.1 Relating the ammonia flux to photosynthesis
Plotting against the GPP in Fig. 4a shows a low positive correlation between the two fluxes, with a correlation coefficient of 0.48. There is a large spread in the data, particularly for GPP values larger than 0.125 . Part of this spread is attributed to the high relative humidity (black circles), where is not yet dominated by stomatal exchange and the external leaf pathway is still expected to be significant. Note that the atmospheric stability (color coded) plays an important role in the GPP, as unstable conditions are typically characterized by clear skies and high PAR values, which favor photosynthesis (as discussed in Sect. 3.2). This relationship is not found in the observed , as there is a large spread in for both neutral and unstable conditions.
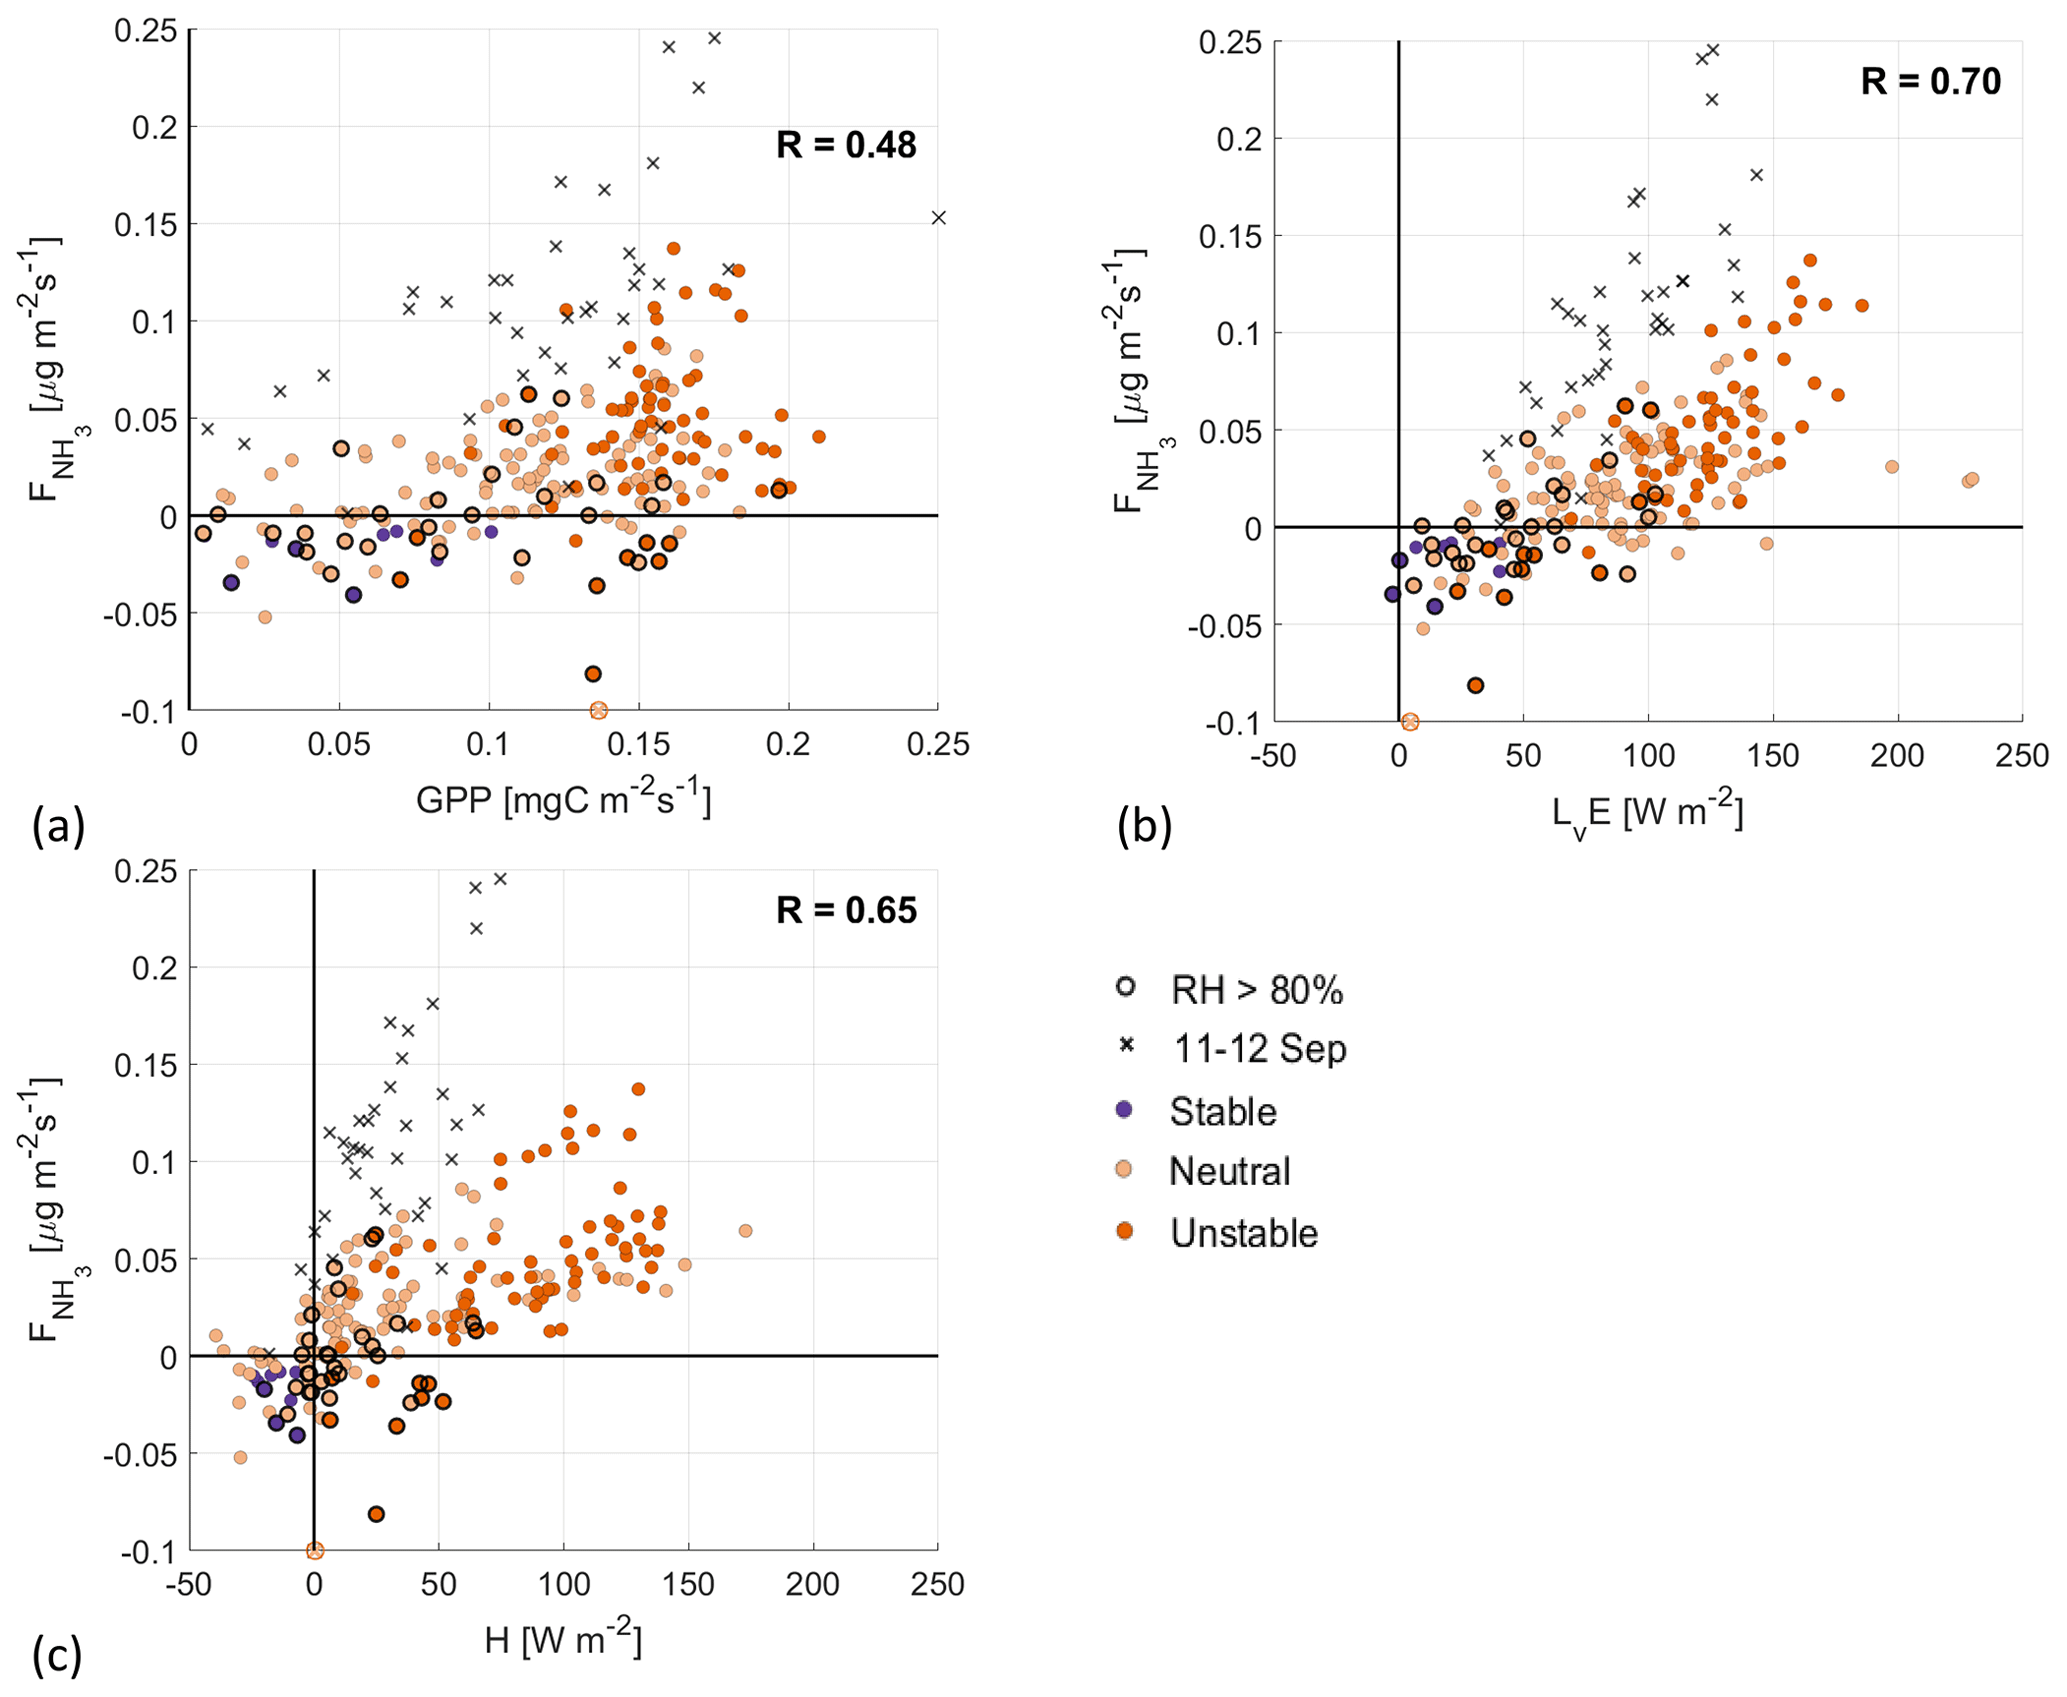
Figure 4Scatterplots of against the GPP (a), LvE (b) and H (c), with the colors indicating the atmospheric boundary layer (ABL) stability. Highlighted by black circles are observations with a RH>80 %, where deposition through the external leaf path can still play an important role. The black crosses are observations from the fertilization event observed on 11–12 September.
In Fig. 4b, a moderate positive correlation is found between and LvE. Our interpretation of this moderate correlation is that both transpiration and stomatal NH3 emissions follow a similar process. The opening of the stomata for photosynthesis allows for the exchange of several gases, including water vapor and ammonia, depending on the VPD or the difference between atmospheric NH3 and the stomatal compensation point (Cowan and Farquhar, 1977; Hsiao, 1973; Farquhar et al., 1980; Wichink Kruit et al., 2010). Note that LvE represents the net evaporation (Miralles et al., 2020), as evaporation from the soil plays a role as well. Assuming a vegetation cover of 90 % for grass, soil evaporation contributes with estimations that range from 10 % to 30 %. Despite this, the use of net LvE is acceptable as an indicator of the transpiration process. Note further that the observations with high relative humidity generally correspond to low LvE and that unstable conditions again correspond to high LvE values, related to the VPD between the leaf and stomata and to the atmosphere.
When plotting against H, two branches are found in the spread of the data, with a third branch being formed by the filtered out fertilization event on 11–12 September (black crosses). The smaller branch, with , could point towards another (weaker) fertilization event. Still, the second highest positive correlation is found at 0.65, indicating that the natural diurnal variability indeed plays an important role. Note that most of the measurements with high relative humidity are clustered around , i.e., there is little transfer of heat between the surface and atmosphere.
Based on the three scatterplots, we find the highest correlation between and LvE. Together with the diurnal variability in , transitioning from nighttime deposition to daytime emission from 08:30 to 16:30 UTC, this is the second indication of stomatal emission of NH3, opposed to emission from fertilization or animal droppings. However, the moderate correlation between and H indicates that the diurnal variability in the fluxes influences the correlation coefficient. Finally, we want to mention the observations on 11–12 September, which support the interpretation of the scatterplots with respect to showing how fertilization events affect our analysis.
3.2 The dynamic vegetation response to varying meteorological conditions
3.2.1 The dynamic response to temperature
We further investigate the stomatal exchange of NH3 by analyzing the response of to varying meteorological conditions. The optimal conditions (PAR, T, VPD) for photosynthesis are different for different vegetation types (Gates, 1980; Jacobs, 1994; Vilà-Guerau de Arellano et al., 2015). Starting with the 2.8 m temperature (T) in Fig. 5, we find a large spread for all four surface fluxes, resulting in low positive correlations (0.33–0.51). The lowest correlation coefficients are found for GPP and LvE, indicating that temperature has little impact on the opening and closing of the stomata. A slightly higher correlation is found for , which we attribute to the relationship between the stomatal compensation point and the NH3 flux (discussed in Sect. 2.5). Note that the NH3 emissions on 11–12 September stand out as outliers in Fig. 5a, whereas they are average for the other three subplots.
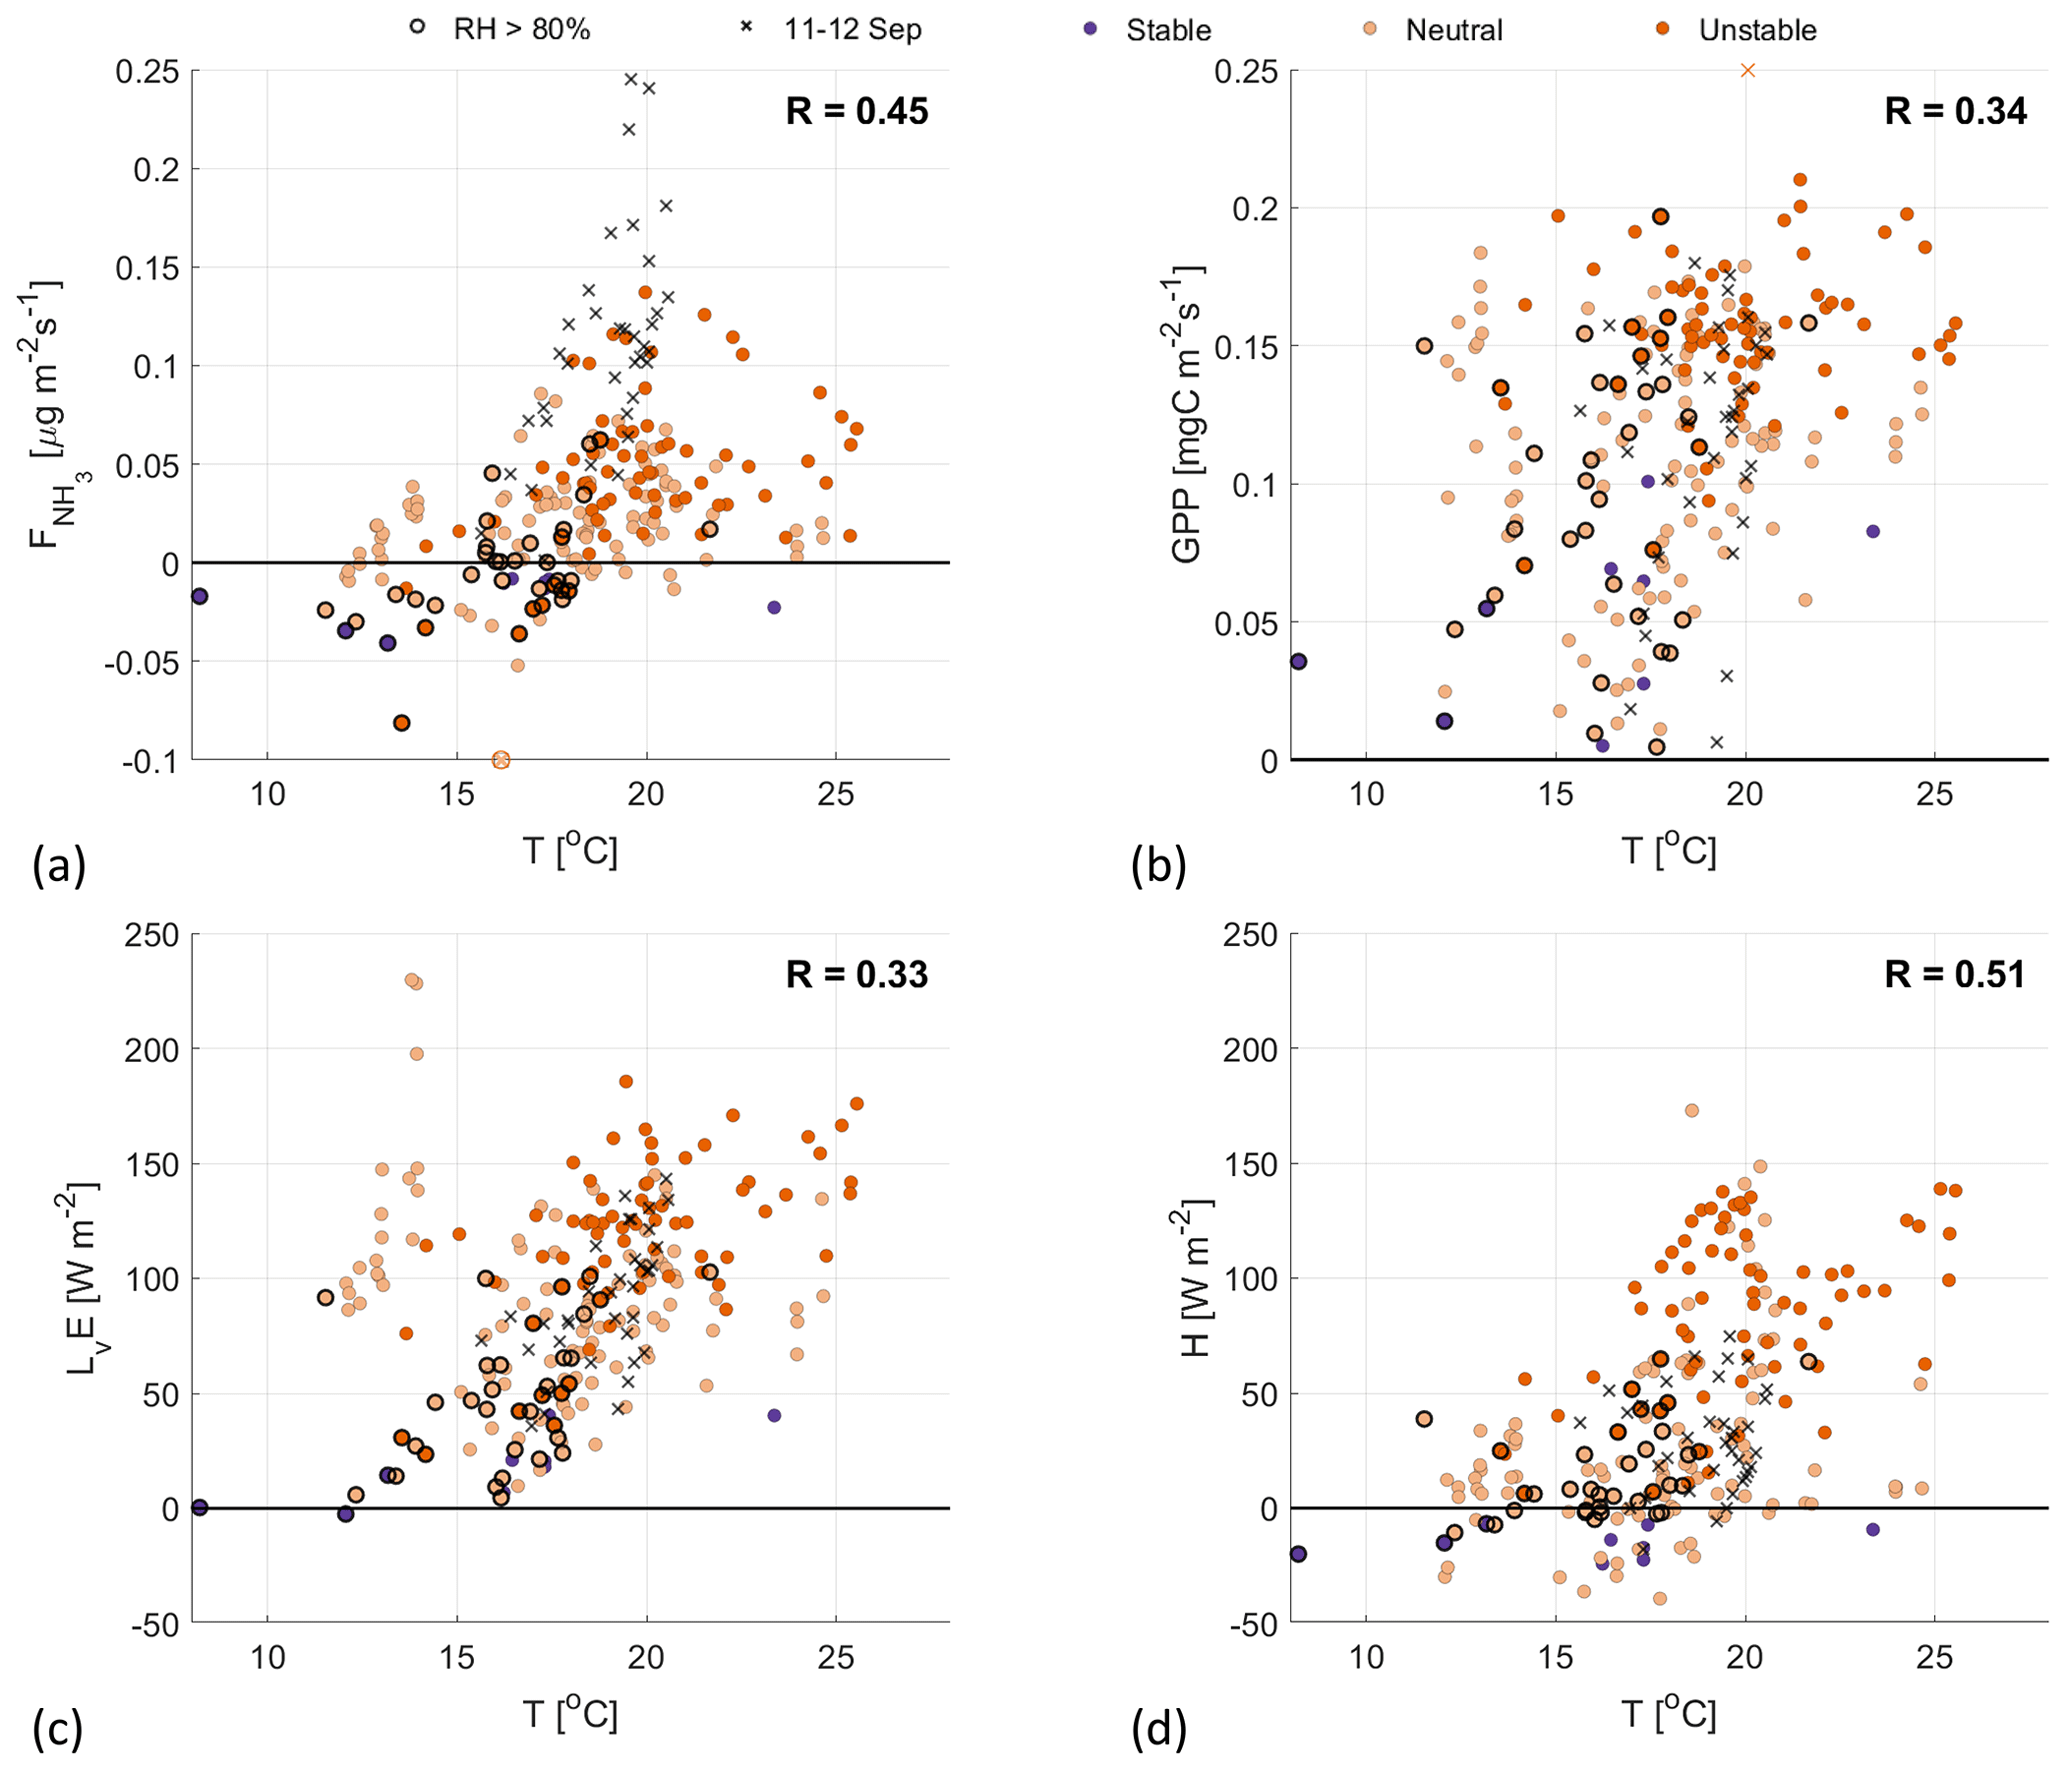
Figure 5Scatterplots of the temperature against (a), GPP (b), LvE (c) and H (d), with the colors indicating the ABL stability (see Fig. 4 for legend). Highlighted by black circles are observations with a RH>80 %. The black crosses are observations from the fertilization event on 11–12 September.
3.2.2 The dynamic response to the VPD
Moving on to analyzing the response of the four fluxes to the VPD, we find moderate correlation coefficients (0.42–0.53) in Fig. 6. In Fig. 6c, LvE shows a nonlinear relationship with the VPD, called the “evaporation hysteresis” (Zhang et al., 2014; de Groot et al., 2019). This hysteresis is driven by both the vegetation regulating the loss of water through evaporation, described in Sect. 2.2, and the time difference when the maximum values of LvE (12:00 UTC) and VPD (15:00 UTC) are reached. The same holds true for the other three fluxes (, GPP and H), as all three reach their maximum around noon.
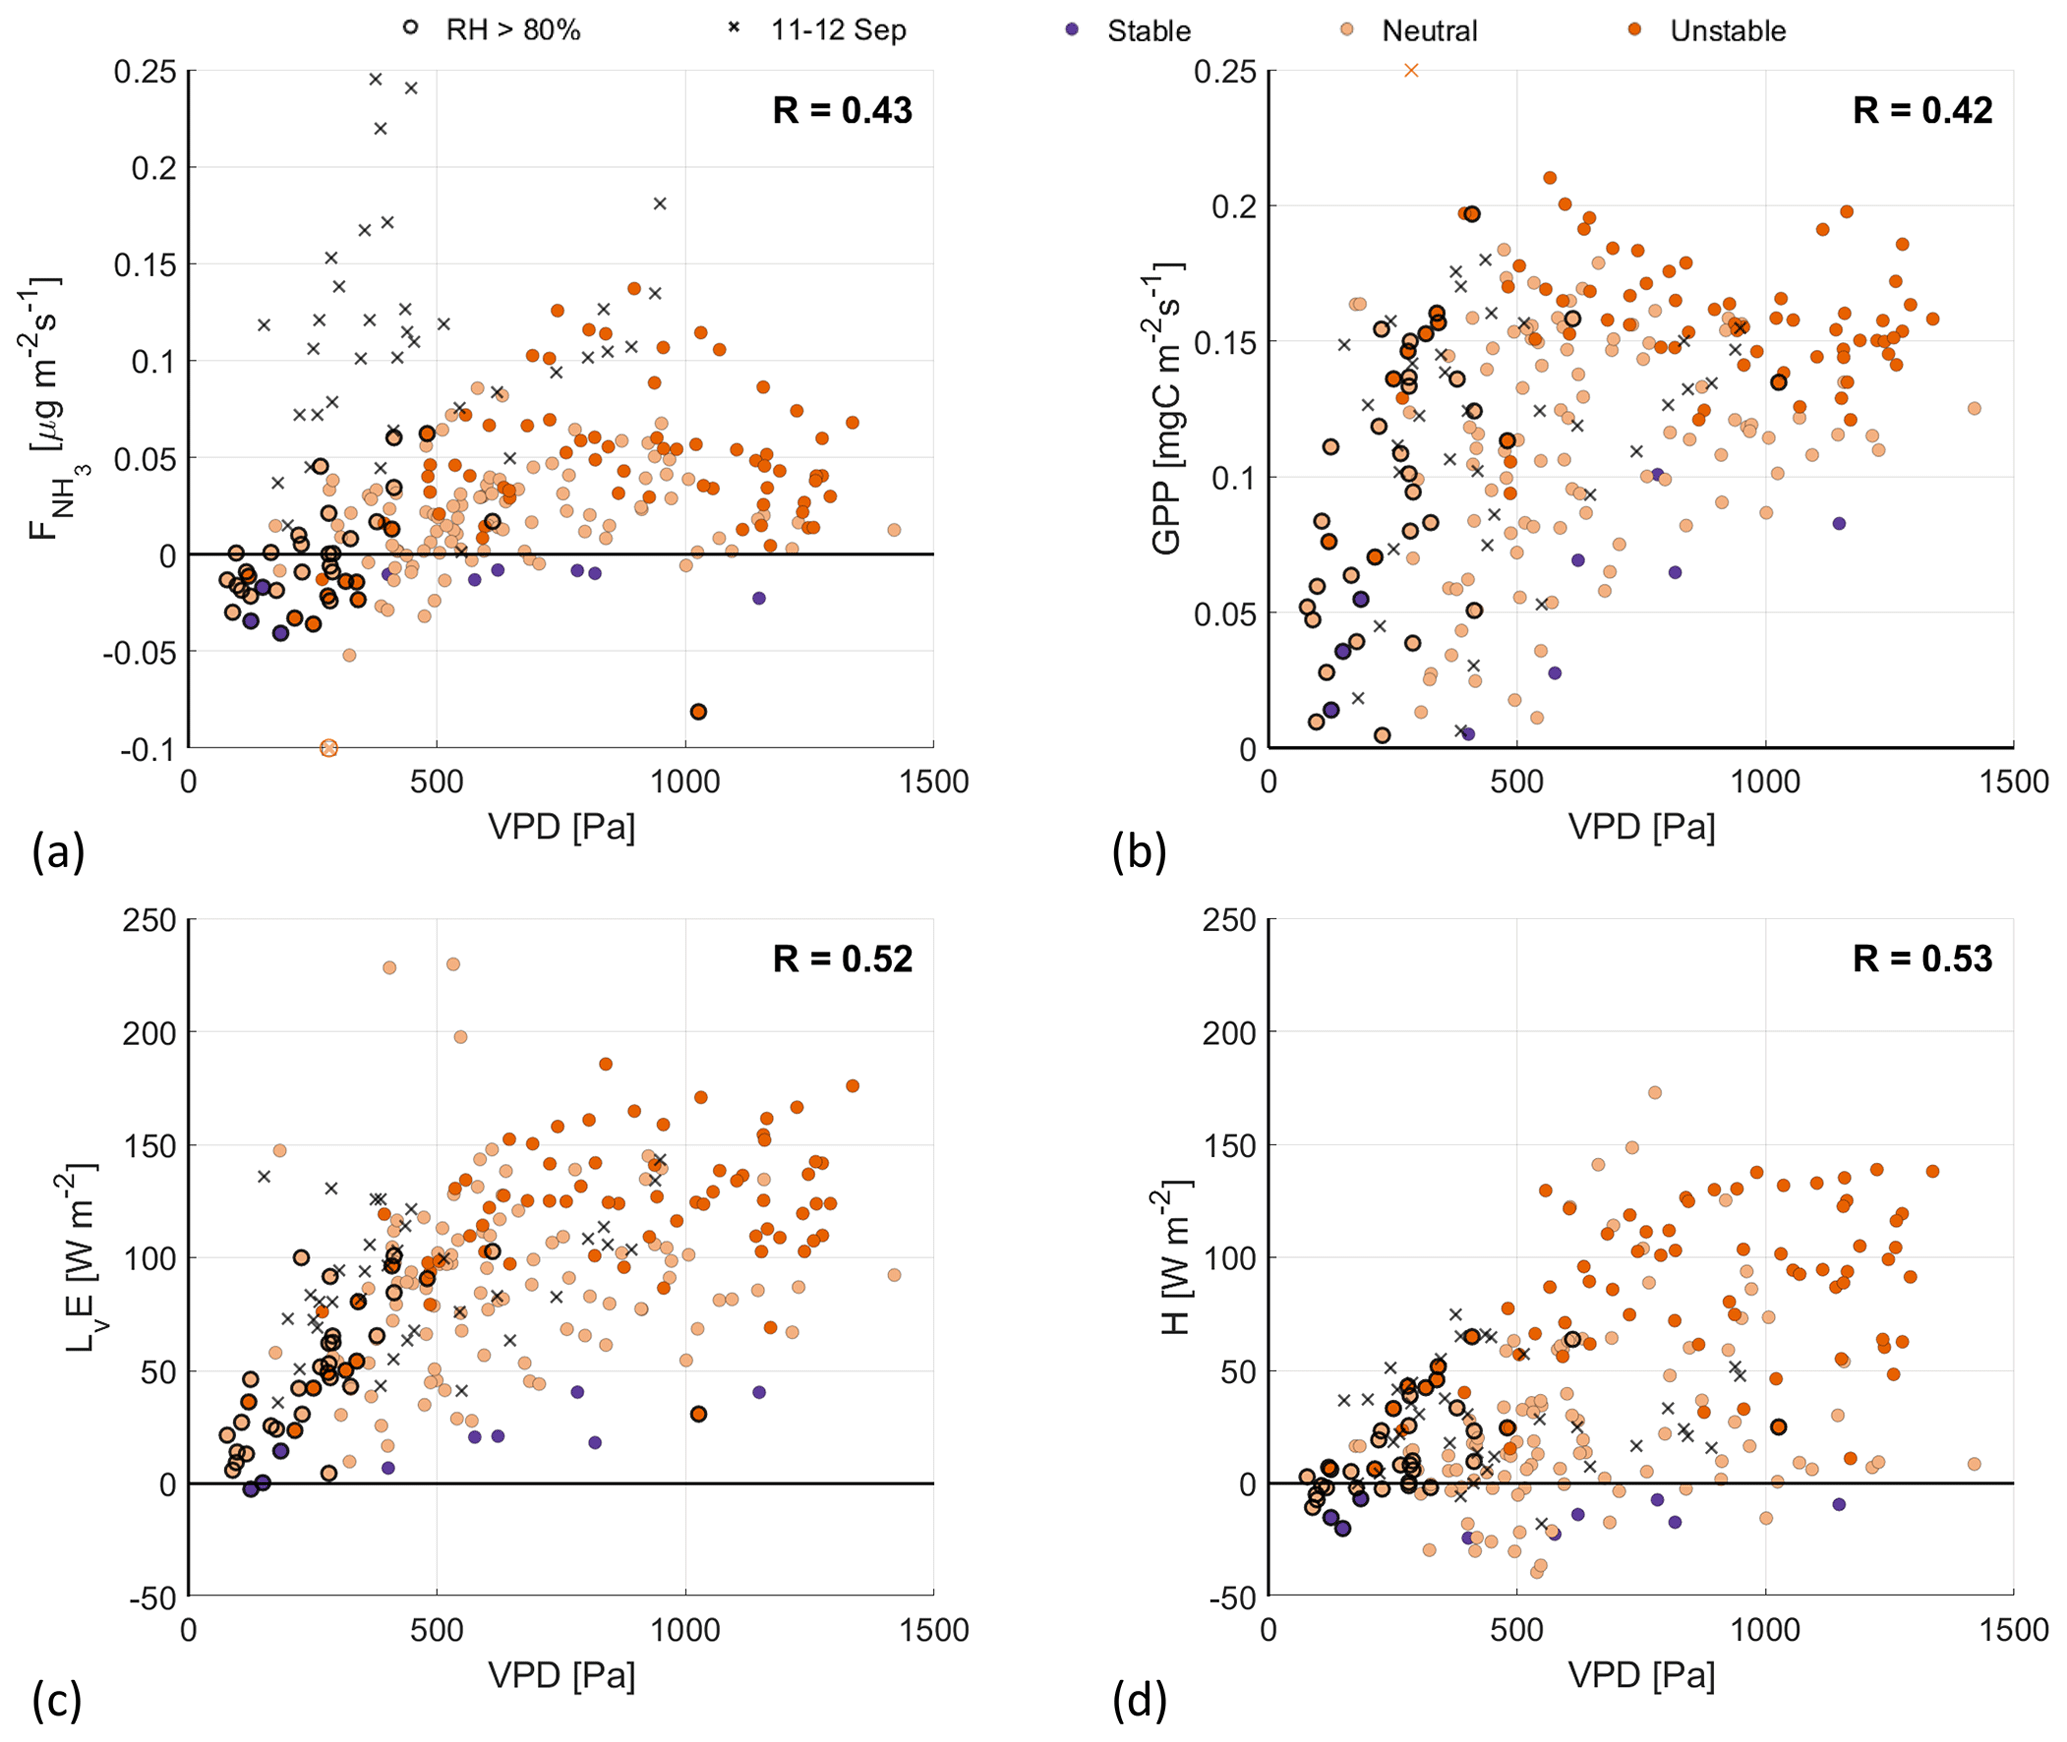
Figure 6Scatterplots of the VPD against (a), GPP (b), LvE (c) and H (d), with the colors indicating the ABL stability (see Fig. 4 for legend). Highlighted by black circles are observations with a RH>80 %. The black crosses are observations from the fertilization event on 11–12 September.
Note that the observations of 11–12 September are again clear outliers in Fig. 6a, forming two branches in the scatterplot. Also standing out are several observations with . These are the observations that appear as the small upper branch in the H– scatterplot in Fig. 4c and, again, form their separate branch in Fig. 6a. This further indicates that there is a second (weak) fertilization event in the filtered dataset of the RITA-2021 campaign.
3.2.3 The dynamic response to PAR
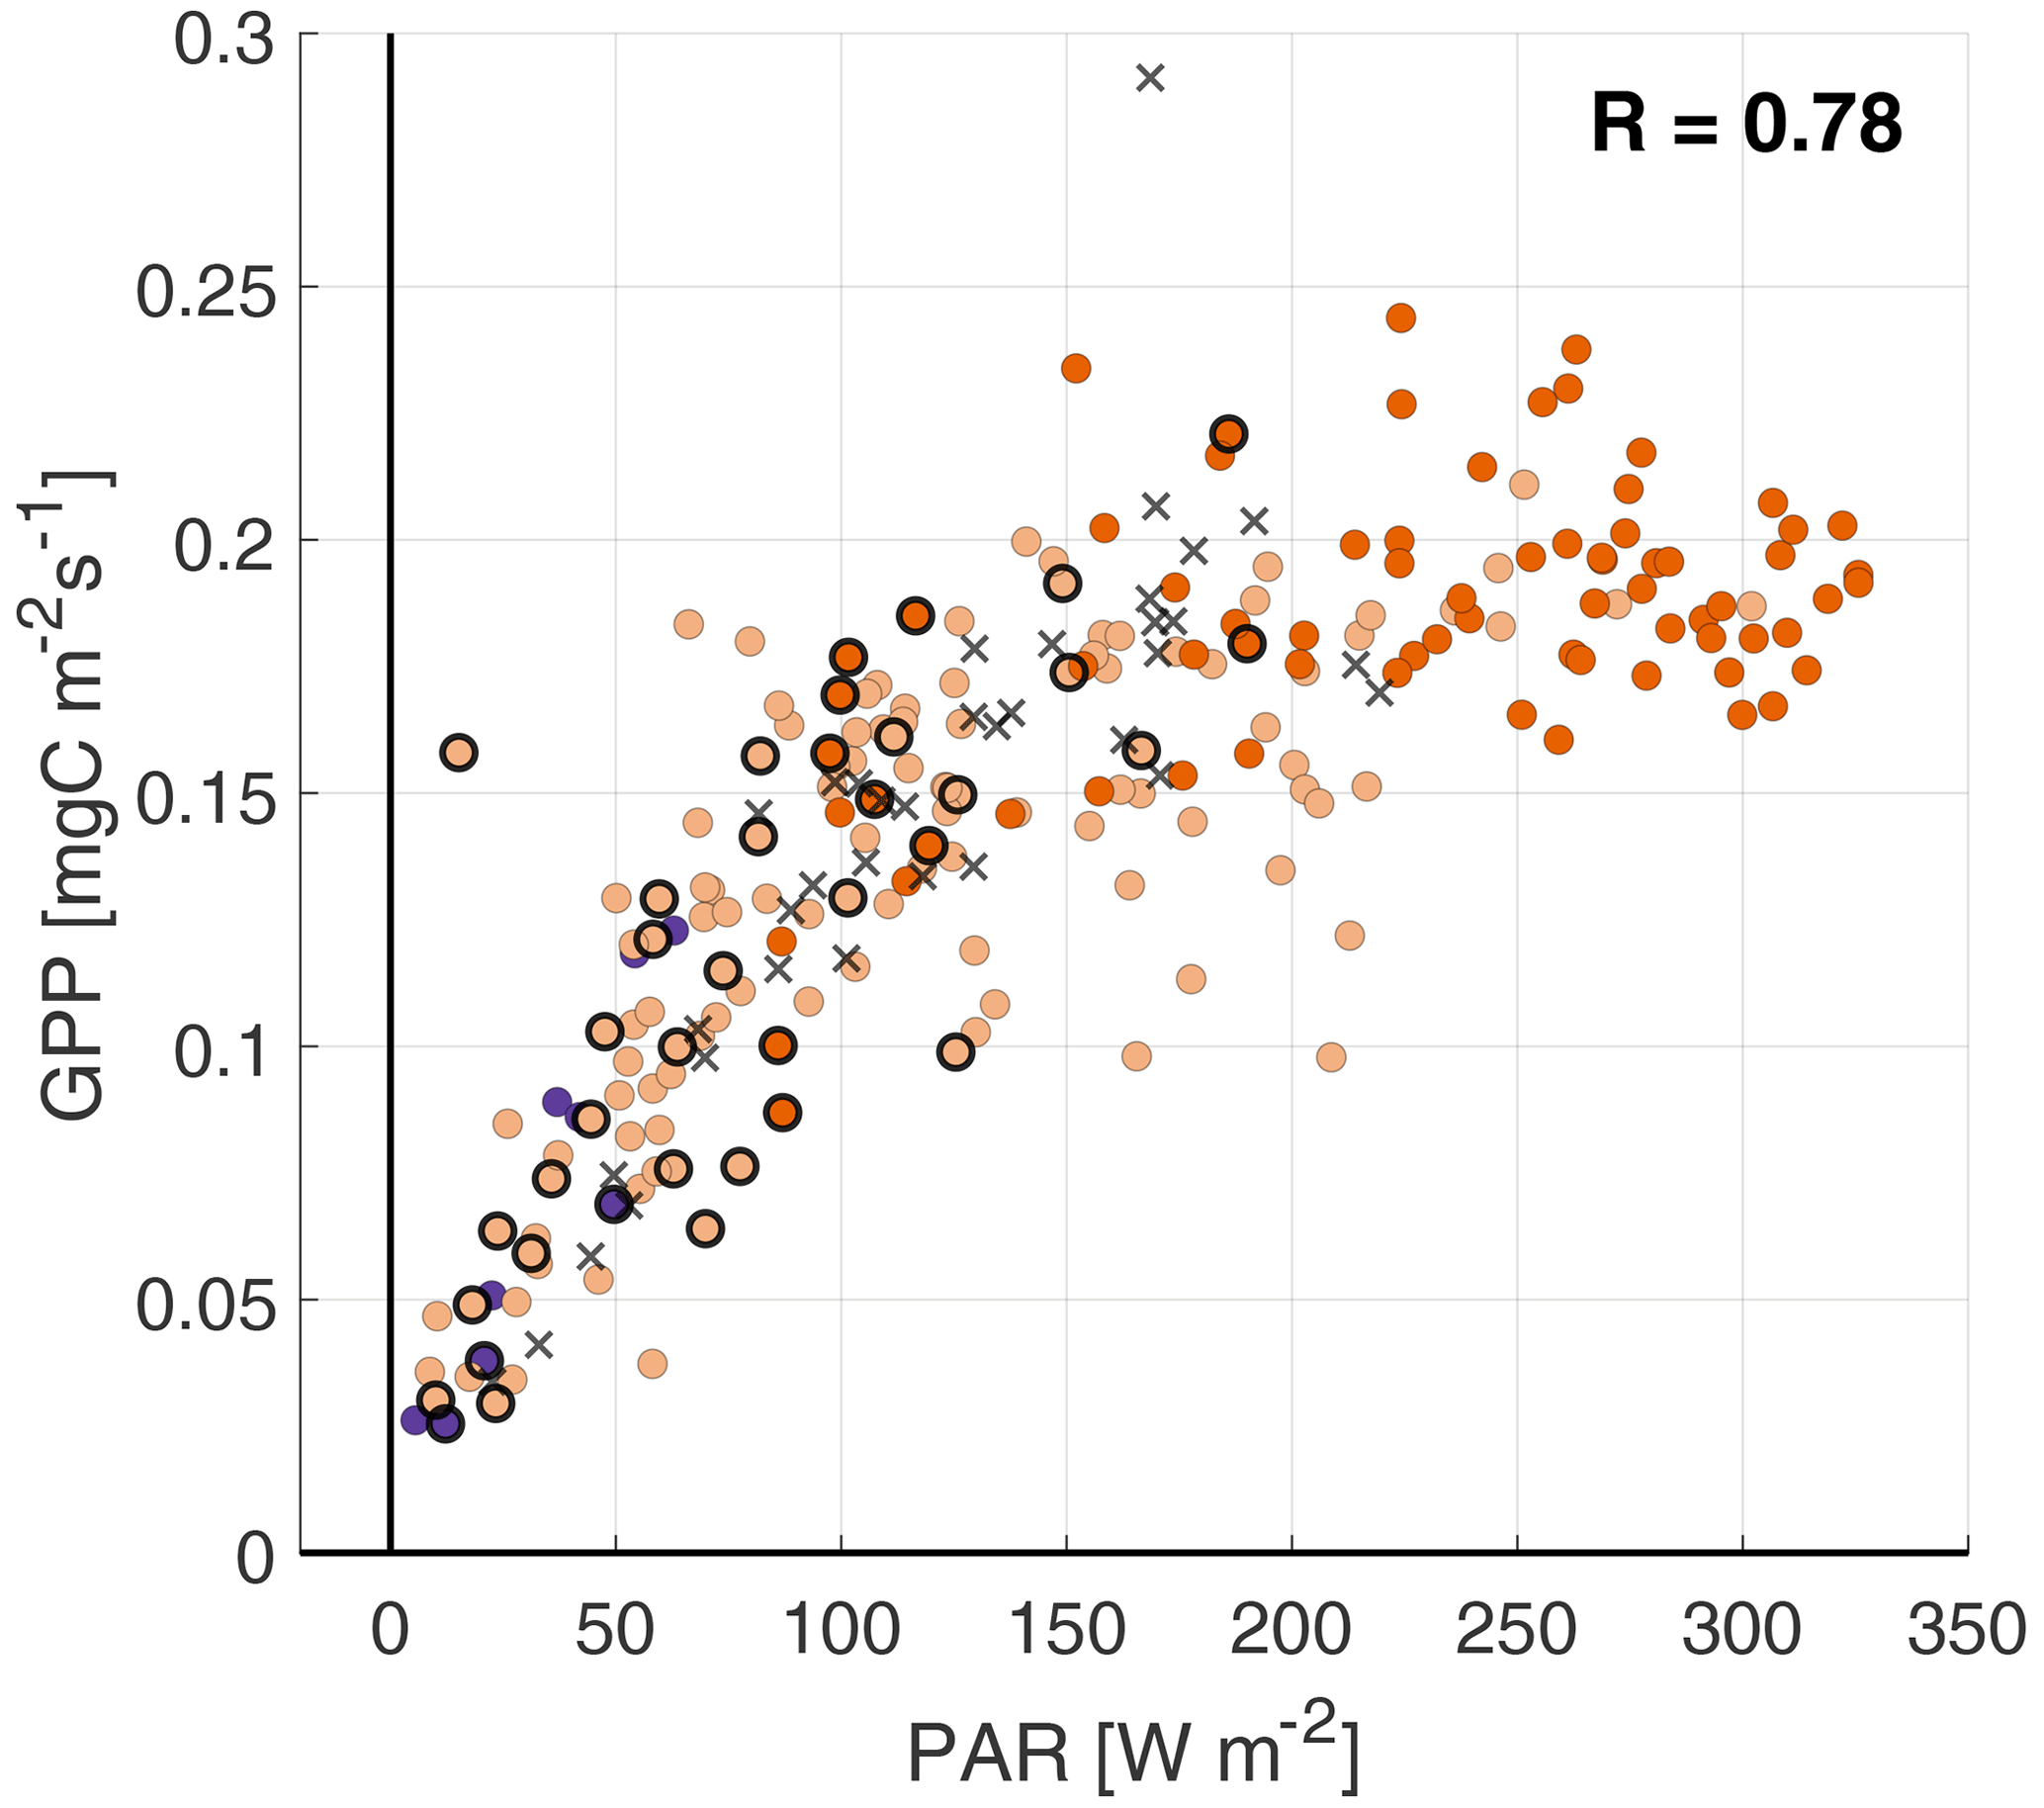
When relating the fluxes to PAR, we find high positive correlation coefficients for all four surface fluxes (0.72–0.93) (Fig. 7), indicating that PAR is the main driver of the dynamic vegetation response.
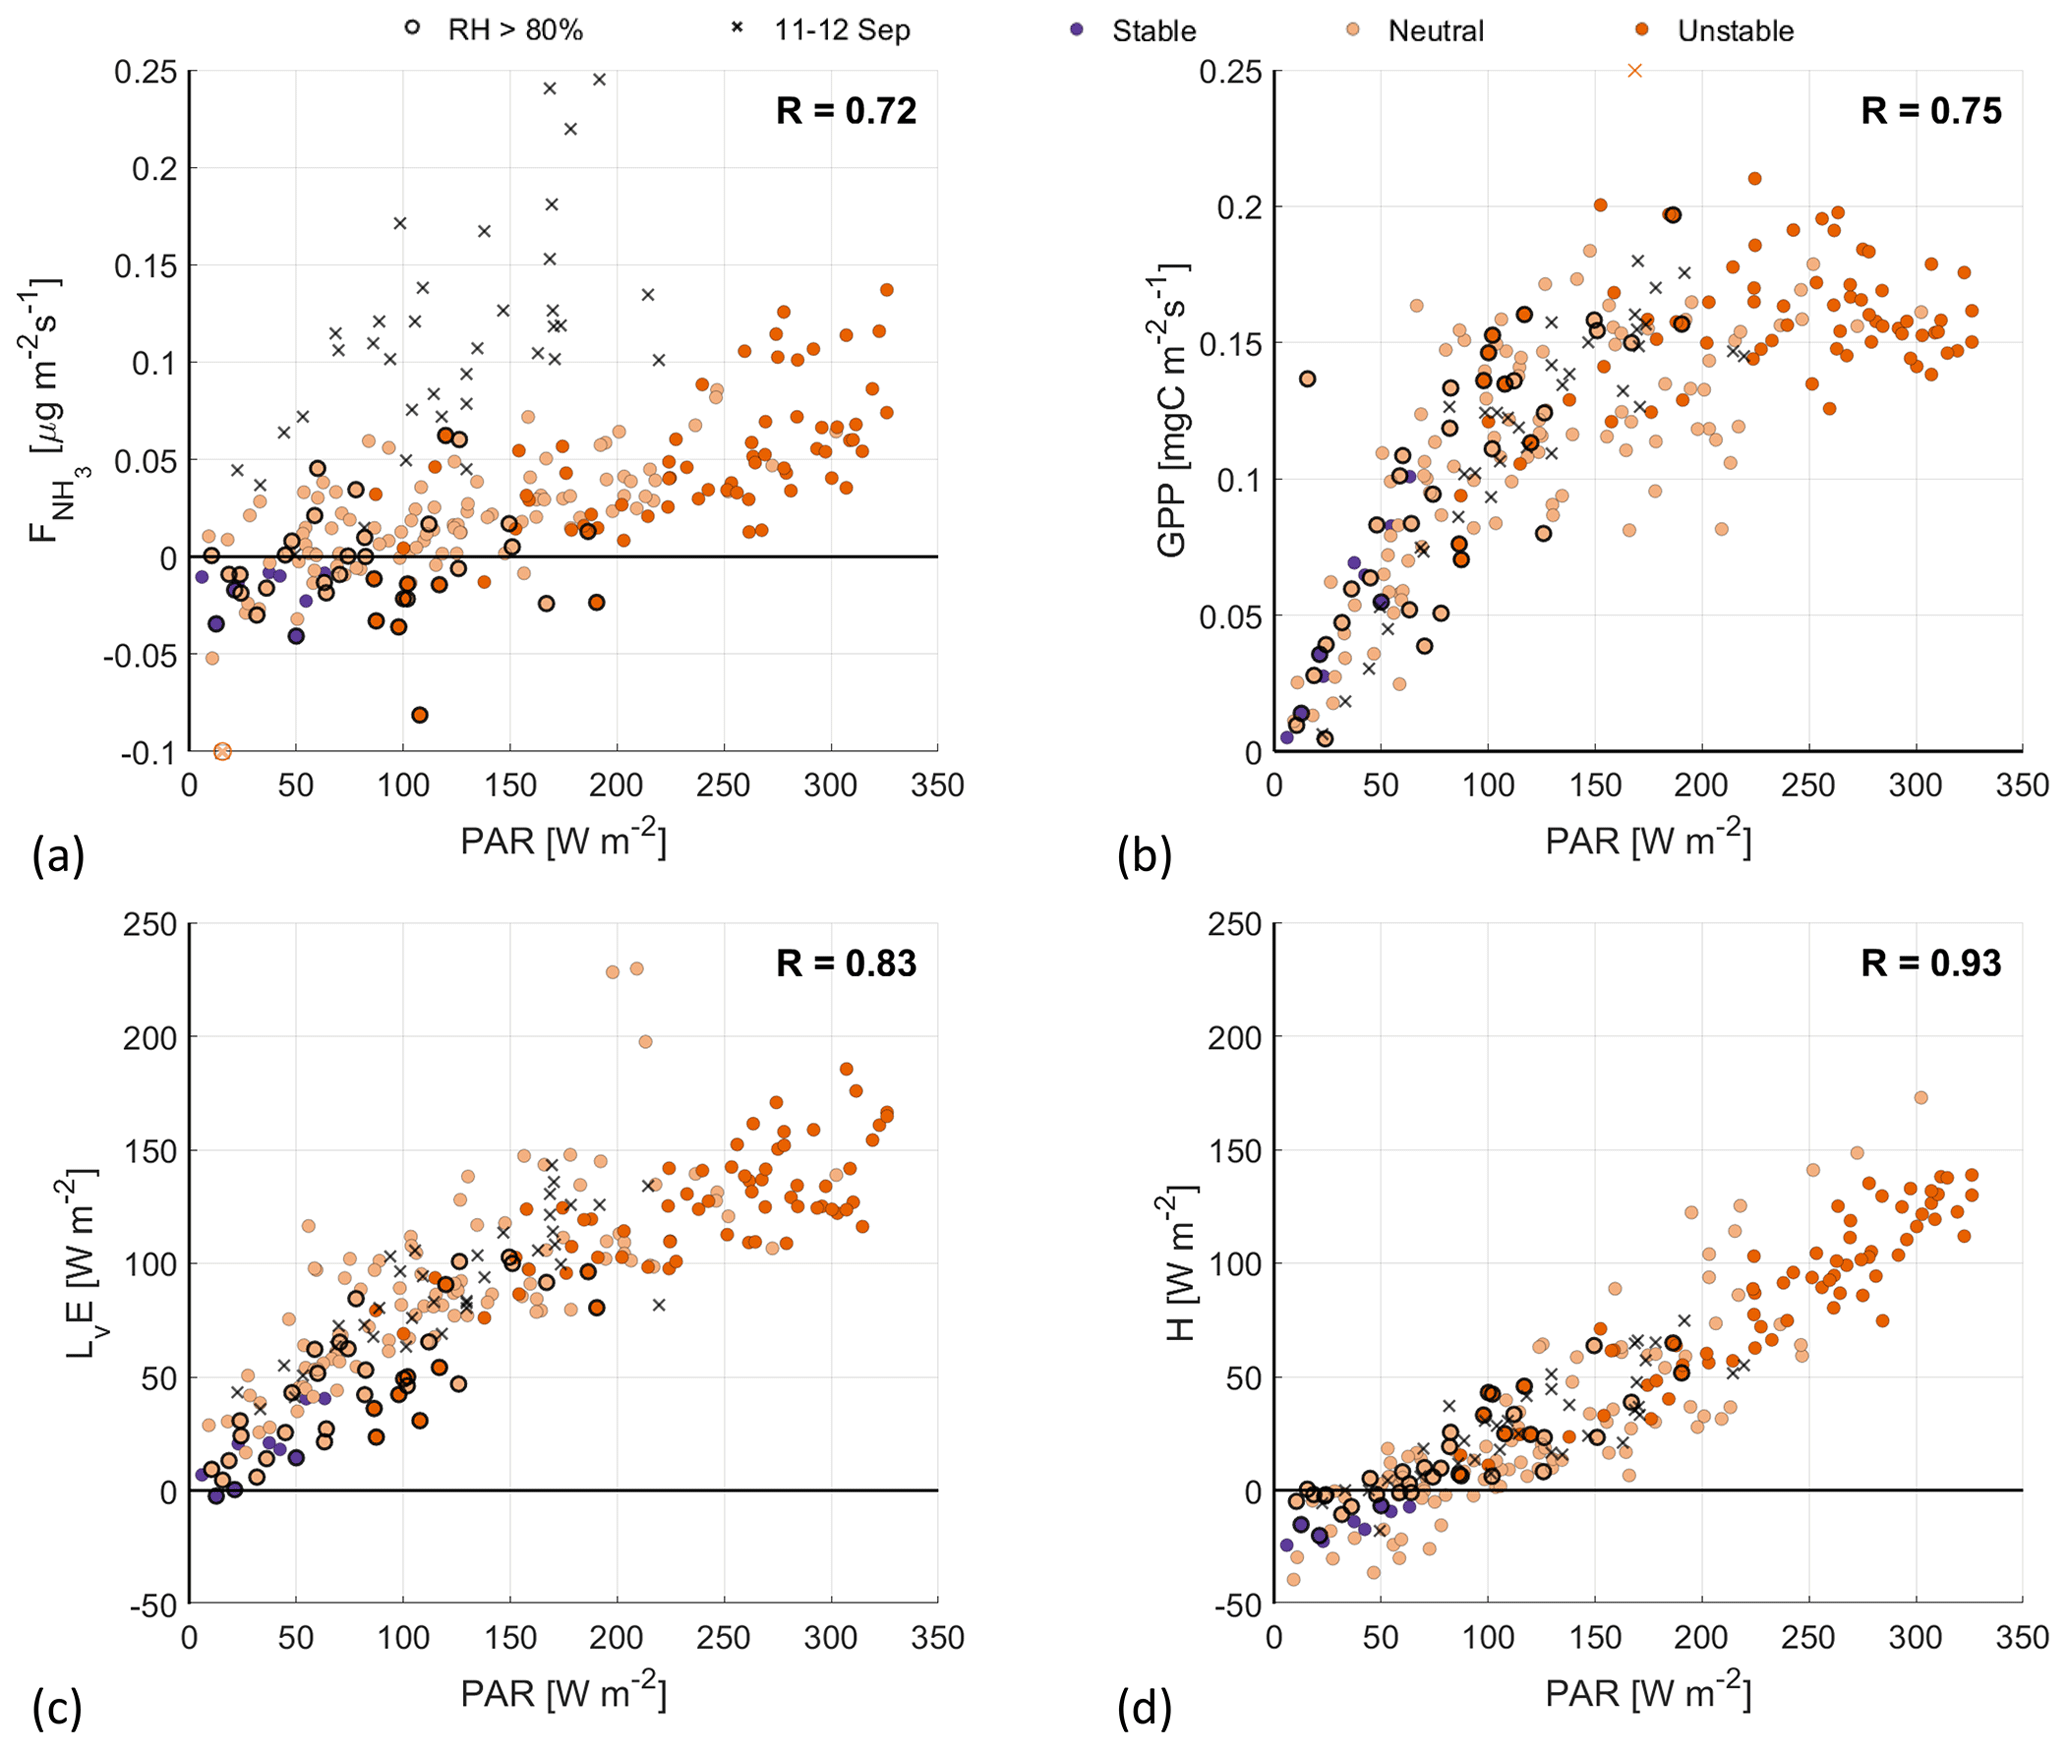
Figure 7Scatterplots of PAR against (a), GPP (b), LvE (c) and H (d), with the colors indicating the ABL stability (see Fig. 4 for legend). Highlighted by black circles are observations with a RH>80 %. The black crosses are observations from the fertilization event on 11–12 September.
The GPP has a strongly nonlinear response to PAR, as the GPP appears to reach a plateau for PAR>150 W m−2. There are several reasons for this GPP maximum. At constant temperature and PAR, the stomatal uptake of CO2 will increase the concentration within the plant to the point that the CO2 supply is no longer the limiting factor. The GPP then reaches a plateau of maximum photosynthesis rate (see Fig. 6.13a in Moene and Van Dam, 2014), similar to the observations in Fig. 7b. Additionally, the photosynthesis system can become light saturated for high PAR values, at constant temperature. Following this latter process, the GPP is expected to level off more gradually, compared with the plateau that is reached by CO2 saturation (see Fig. 6.13b in Moene and Van Dam, 2014). Finally, the (partial) closing of the stomata in response to high VPD could also reduce the GPP. However, as the VPD typically reaches its maximum at around 15:00 UTC (not shown), it is unlikely that this is a limiting factor for GPP at high PAR values, which peak around noon. All of these processes depend on the temperature, VPD and PAR and can explain the vertical spread in Fig. 7b.
When taking a close look at the response of LvE to PAR, it is possible to distinguish two phases in Fig. 7c. First, for PAR values up to about 100 W m−2, LvE increases linearly to roughly 75 W m−2, related to the opening/closing of the stomata around sunrise/sunset. The second phase shows a more gradual linear increase in LvE with respect to PAR. From the linear response and the small spread in Fig. 7c, we conclude that opening/closing of the stomata during the RITA-2021 campaign is governed by PAR and that the role of the VPD or temperature is small.
Similar to LvE, the NH3 flux generally shows a linear response: transitioning from weak deposition to emission as the stomata open in response to increasing PAR. The spread in the response is larger compared with the LvE response, which results in the lowest correlation coefficient at 0.72. We attribute this spread to three factors: the relationship between temperature and the stomatal compensation point, the variations in the NH3 concentration, and the measurements where RH>80 % (black circles). Furthermore, observations where , i.e., the possible (weak) fertilization event, again appear to form a second branch in the scatterplot. Based on the strong similarities between and LvE with respect to their response to PAR, we interpret the observed NH3 emission as stomatal (re)emission from vegetation.
Observations of the NH3 flux after filtering, taken over 17 individual days during the RITA-2021 campaign, are characterized by daytime emissions. The measurement site in Cabauw is located on flat grassland in an agricultural area, with the nearby fields being actively managed and/or grazed upon. It is therefore possible that the observed NH3 emissions originate from sources like fertilization events (e.g., manure application) or animal droppings. Clearly distinguishing between stomata-driven emission and the volatilization of ammonia due to fertilization events is complex due to the contributions of different paths (soil versus plant) and nonlinear effects (water vapor deficit dependence on temperature) that often offset each other. However, we identified the data which were most likely due to a fertilization event and labeled these data as outliers, whereas we retained other doubtful points in the analysis. Next, we also marked data which could have been due to exchange via the external pathway, once more trying to single out due to stomatal exchange.
Indications of stomatal emission are found in the diurnal variability in . The flux transitions from deposition to emission in the early morning (at around 08:00 UTC), reaches maximum emission around 12:00 UTC and transitions to deposition again just before sunset (at around 16:30 UTC), as shown in Fig. 2c. Our interpretation of this diurnal cycle is that the flux transitions from (nighttime) NH3 deposition, through the external leaf path, towards emission through the stomatal path during the day. This diurnal variability in shares similarities to the diurnal variability in the CO2 flux. As the stomata open for photosynthesis in response to PAR, the CO2 flux transitions from CO2 respiration to stomatal uptake of CO2. High correlations between and LvE (0.7) and between and PAR (0.72) further point towards stomatal NH3 emission and a possible relationship between and the photosynthesis fluxes.
4.1 Critical analysis of RITA-2021 dataset
The conditions during the RITA-2021 campaign present a challenge for the analysis conducted in this study. The site is located in an active agricultural region, with several potential emission sources within only a few hundred meters to a couple of kilometers distance upwind of the measurement site. The fields next to the site are actively managed, and the nitrogen contents of the soil and vegetation can differ on a field-to-field basis. This high level of surface heterogeneity within the estimated footprint of the flux measurements (up to about 250 m; Table 2) adds an additional level of complexity to the analysis (Swart et al., 2023). Furthermore, there are several farms located within 2 km of the site, some of which have yearly NH3 emissions of up to 1200 kg yr−1. Studies on the blending distance (i.e., the distance at which a plume can be considered well mixed with respect to the background) indicate that emission plumes from such strong local NH3 sources can affect flux measurements over distances of a couple of kilometers (Schulte et al., 2022). In this study, at least one instance of strong local emissions has been identified: the fertilization event on 11–12 September. Other potential weaker events have also been shown and discussed in Figs. 4a and c and 6a.
The analysis is further complicated by the complex meteorological conditions, characterized by frontal passages. As the miniDOAS setup was positioned anticipating winds from the southwest, the meteorology of the filtered data is characterized by frontal passages. As a result, most observations are taken under neutral-stability conditions (60 %), with clouds and some rain showers. While rain events are filtered out, wet deposition by rain does lead to a sudden change in the NH3 concentration and can lead to the re-emission of NH3 as the rainwater evaporates.
Finally, the southwestern orientation of the instruments leads to a significant loss in the availability of data suitable for analysis. Historically, southwesterly winds tend to be most common in September, but the wind direction during the campaign was highly variable. Filtering for unobstructed wind directions reduces the availability of viable data by 510 h, i.e., 44 % of all measurement data. As a result, the observed range in the measurements presented in the figures is strongly influenced by the natural diurnal variability in the variables. While we do address the role of the natural diurnal variability by including the sensible heat flux in our analysis, it does make the observed relationships between and the other variables somewhat speculative.
The high level of heterogeneity due to complex emission sources, the low data availability after filtering and the complex weather conditions make the RITA-2021 dataset unfavorable for establishing relationships between and the CO2 or water vapor flux. It also makes the dataset unsuitable to aid annual inventories. However, it highlights the importance of the homogeneity of the NH3 surface characteristics and that the proximity of NH3 emission sources should also be considered when selecting a measurement site, in addition to the availability of high-quality meteorological observations. Despite the challenges, the NH3 measurements are of unprecedented high quality (Swart et al., 2023), and analyzing the unique dataset following our approach is still worthwhile because we can establish relationships that significantly correlate with the main drivers of the stomatal aperture following current dynamic vegetation models.
4.2 Recommendations
Following the results presented in this study, we recommend a comprehensive approach to future NH3 flux measurements, including observations of the CO2 and water vapor flux as auxiliary measurements. The opening of the stomata for CO2 uptake through photosynthesis allows for the exchange of several other gases, including water vapor and ammonia. The process representations of photosynthesis have been widely researched, and its parameterizations have been better tested against sub-diurnal observations under different scales (Vilà-Guerau de Arellano et al., 2020). Combined observations of the NH3, CO2 and water vapor fluxes can be used to further our understanding of NH3 exchange through the individual exchange pathways, as was done for ozone deposition by Visser et al. (2021).
Furthermore, we recommend analyzing and comparing observations of the NH3 flux at different measurement (grassland) sites, similar to the intercomparison of CO2 exchange measurements by Jacobs et al. (2007). For example, the diurnal variability presented in this study significantly differs from measurements in 2013 at the Veenkampen meteorological site near the city of Wageningen (https://www.wur.nl/en/show/Weather-Station-De-Veenkampen.htm, last access: 15 January 2024). Located only 50 km east, the diurnal variability in at Veenkampen is characterized by weak morning deposition and strong afternoon deposition, up to about −0.3 , under clear-sky conditions over unfertilized grassland (Schulte et al., 2021). At the Haarweg meteorological site, the predecessor to Veenkampen, chemical wet denuder measurements of in 2004 were characterized by strong deposition in the early morning, attributed to morning dew, and weak stomatal emissions in the afternoon (Wichink Kruit et al., 2007). The differences between observed diurnal variability in these three studies stress the high variability at the local and regional scales and highlight the need for long-term, high-resolution observations at multiple locations.
Efforts to further our understanding of the NH3 exchange and its diurnal variability are already being made. The miniDOAS setup used in RITA-2021 will be taking long-term (>1 year) observations of the NH3 flux at the Veenkampen meteorological site, starting in the spring of 2023. This yearlong record of high-resolution observations will be analyzed, alongside a wide range of meteorological and turbulent measurements, including the CO2 and water vapor flux, aiming to improve the parameterization of the NH3 surface–atmosphere exchange. The collocation of surface and upper-atmospheric observations (Vilà-Guerau de Arellano et al., 2023) is key with respect to obtaining a comprehensive and complete understanding of NH3 flux. The analysis can be taken one step further in the context of the Ruisdael Observatory project via a process analysis combining the observations with both conceptual (Schulte et al., 2021) and high-resolution turbulence-resolved models (Schulte et al., 2022).
We analyzed over a month of ammonia flux measurements (), taken during the RITA-2021 campaign at the Ruisdael Observatory in Cabauw. The analysis is centered around observations from the miniDOAS flux measurement setup, which applies the flux-gradient method to line-average concentration measurements over a 22 m open path at two heights. Our objective was to find relationships between the observed NH3 flux and the main drivers of dynamic vegetation response, linking ammonia exchange through the main three variables that control the stomatal pathway to processes due to photosynthesis. The process of photosynthesis has been more widely studied; therefore, establishing robust relationships between photosynthesis drivers closely linked to stomatal aperture and NH3 surface exchange enables us to determine and quantify the role of this path in emitting or depositing ammonia.
After filtering, the observed is characterized by daytime emissions of about 0.05 and nighttime deposition of about −0.05 . We compare the NH3 flux to the observations inferred from CO2 uptake by vegetation and the net observed exchange of water vapor, represented by the gross primary production (GPP) and net latent heat flux (LvE), as well as the sensible heat flux (H), which is only indirectly related to the dynamic vegetation response. Here, we find a high and significant correlation between the observed daytime NH3 emissions and LvE (0.70) and the photosynthetically active radiation (PAR, 0.72). These results provide a first-order quantification of how NH3 exchange could follow similar paths to the exchange of CO2 and H2O through plant processes regulated by the stomatal aperture. It shows that auxiliary and co-located flux measurements of CO2 and water vapor are appropriate variables to distinguish stomatal NH3 exchange from non-stomatal exchange.
The analysis presented in this study is hampered by the challenging conditions during the RITA-2021 campaign. However, despite these conditions, the comprehensive approach presented in this study paves the way for the potential of combining high-quality NH3 observations with auxiliary flux measurements of CO2, water vapor and other meteorological variables. By organizing and analyzing the observations guided and constrained by the main meteorological drivers controlling the assimilation and transpiration in grass fields, we managed to attribute the observed NH3 emission to processes and variables associated with stomatal exchange and identify outliers. In order to establish more robust relationships between NH3 and the photosynthesis fluxes, the proposed framework in this study should be applied to measurements that are still representative of the nearby sources and sinks while also ensuring a blending distance that guarantees that these singular source and sink contributions are properly mixed with the NH3 background concentration. These distances range from 1000 to 3000 m (Schulte et al., 2022). Further, longer time series are needed in order to make a more robust distinction between days with and without the influence of nearby sources. Our findings and framework over grasslands are a first step to confirm patterns and relationships between meteorological drivers and NH3 exchange, but this work should be extended to longer and more dedicated field campaigns, including other ecosystems. The results presented in this study already indicate that there is room to find such patterns.
In Sect. 2.2, we describe our approach to arrive at an estimate of the GPP using observations only. Here, we examine the potential impact of using a regression model to describe the ecosystem respiration to examine the potential impact of using a different method on the results. We calculated the GPP by describing ecosystem respiration as a function of air temperature using the exponential regression model of Lloyd and Taylor (1994), hereafter LT94:
where R10 is the reference respiration at reference temperature Tref (set to 10 ∘C). To avoid over-parameterization, T0 is set to −46.02 ∘C, as in LT94. E0 is an empirical parameter related to the activation energy. Using the nighttime data collected during the campaign, filtered for , and a quality flag of 0 (Mauder and Foken, 2006), we obtained values of 5.3 for R10 and 124 for E0. In doing so, correlation coefficients in Fig. 4a, b and c (see Sect. 3.2.3 of the main text) slightly improved. Figures A1–A4 show the scatterplots using this alternative formulation of the GPP.
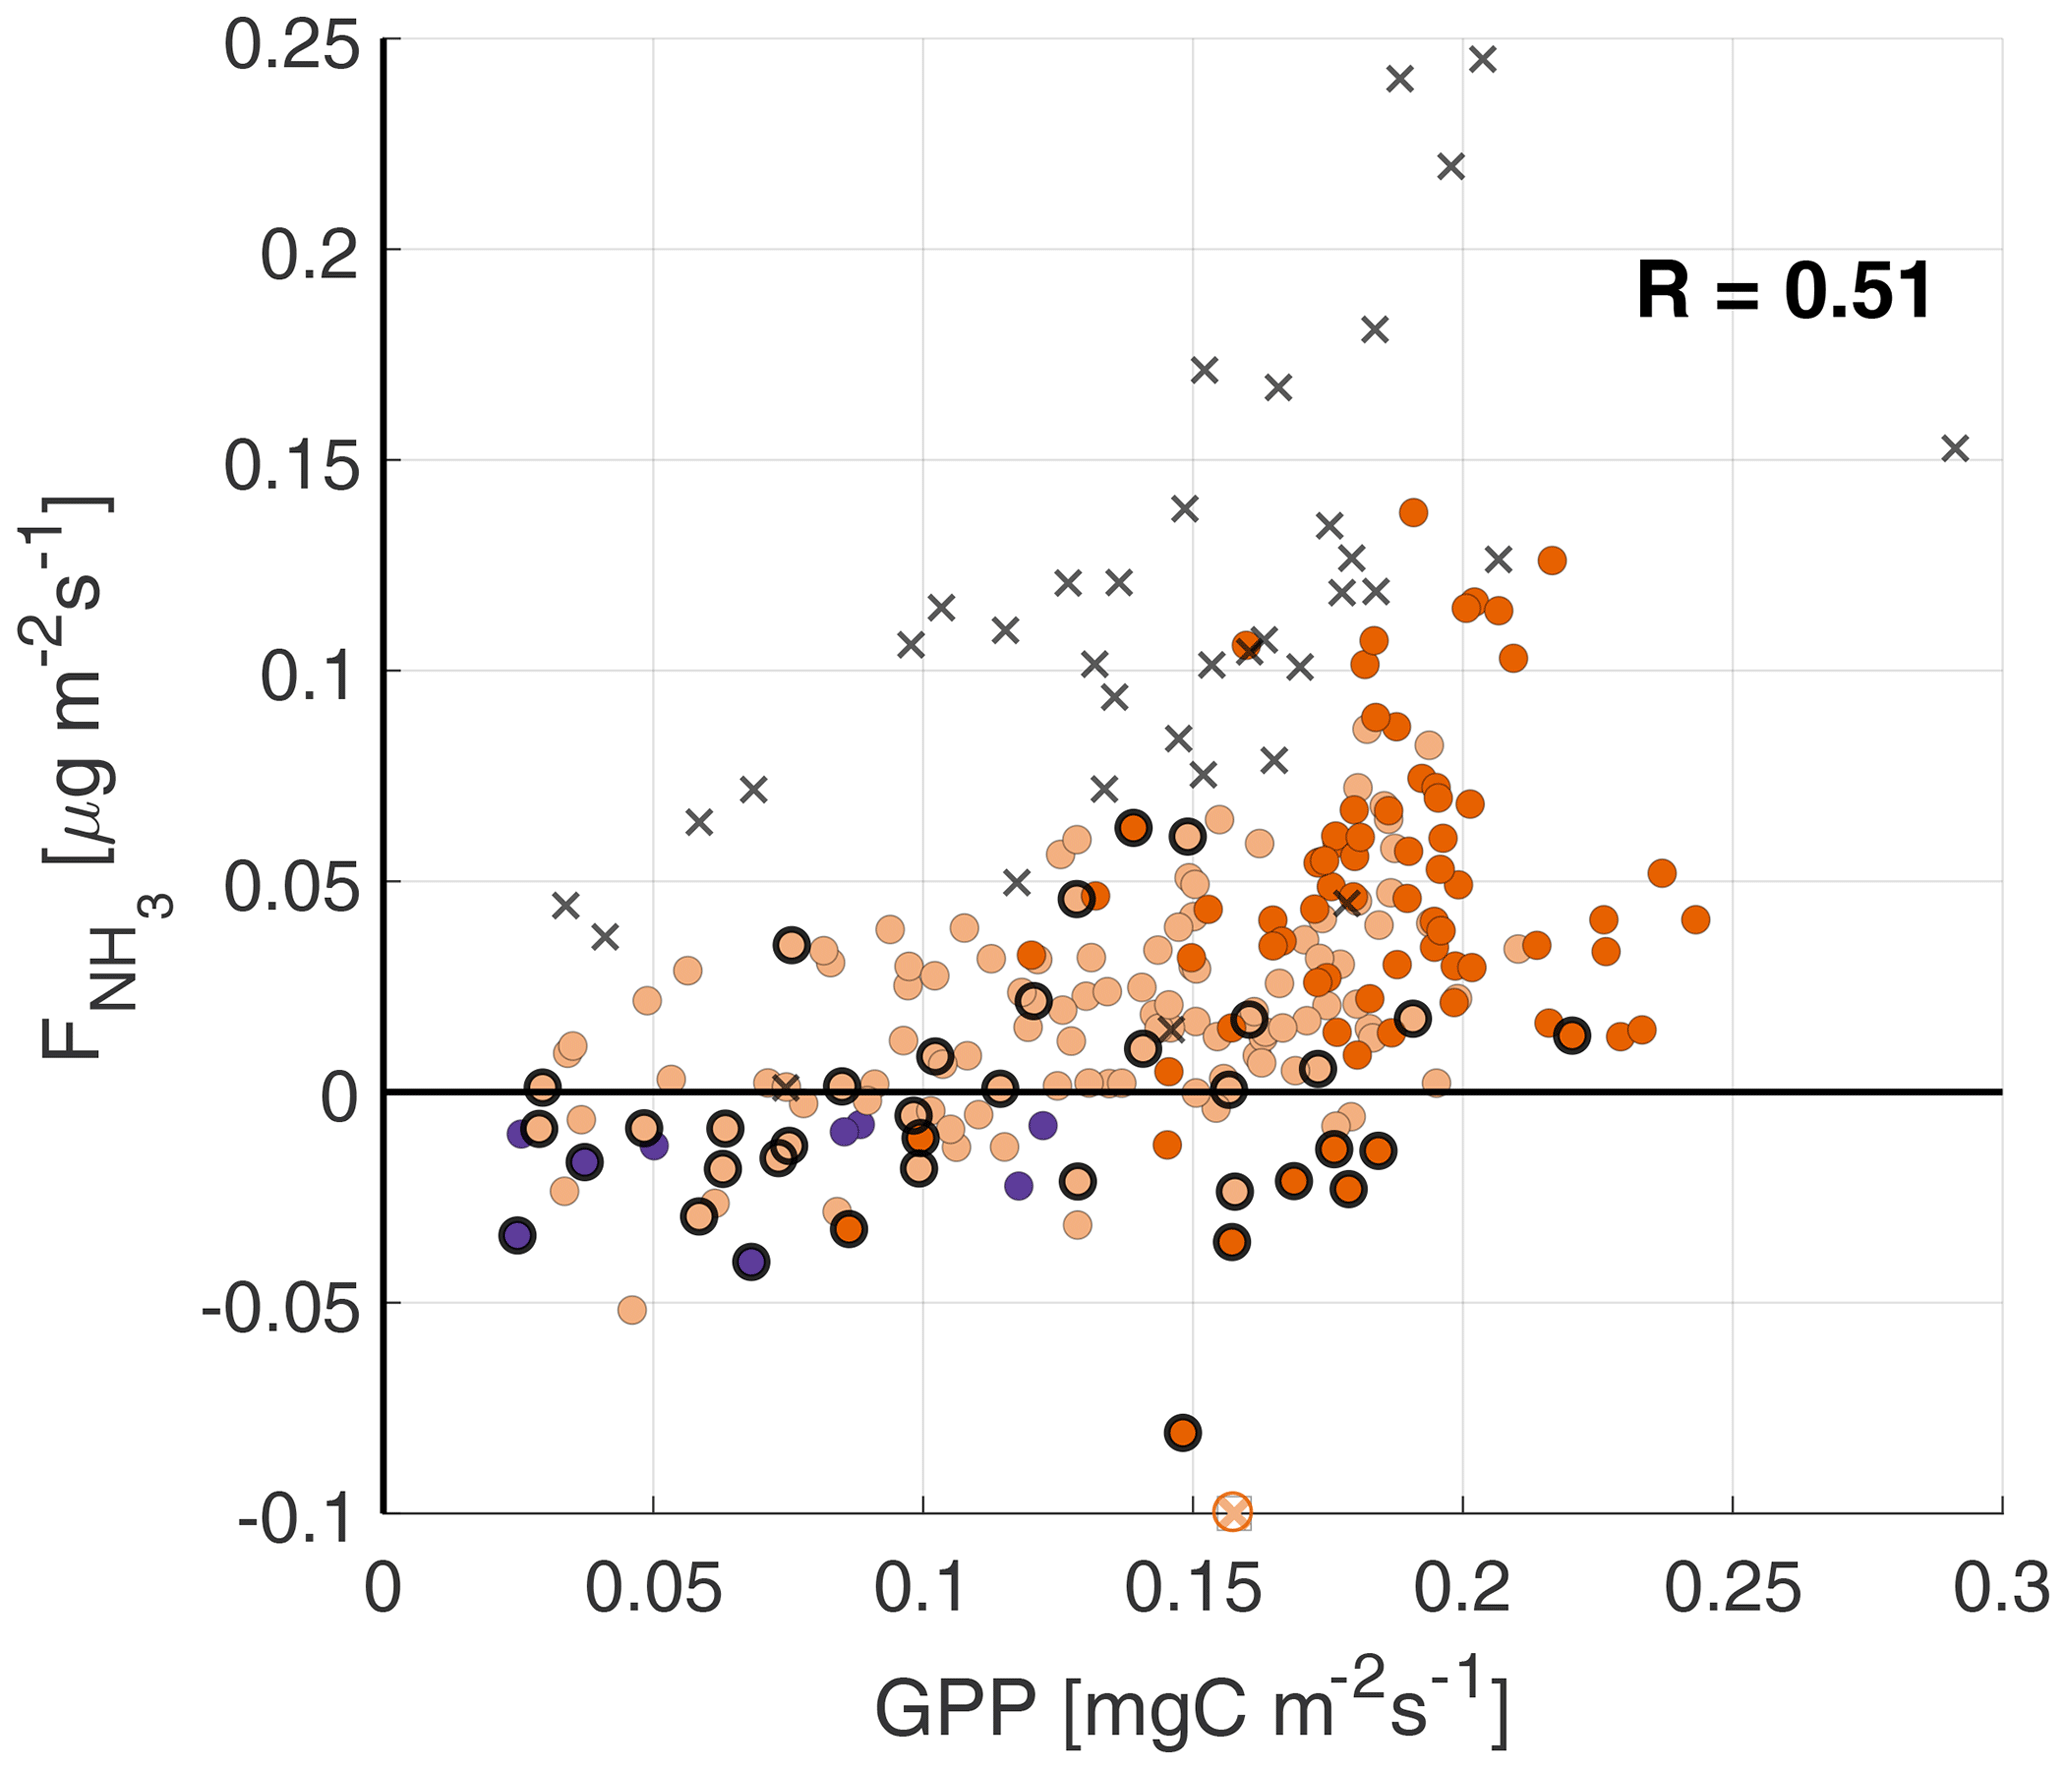
Figure A1Scatterplots of against the GPP, with the colors indicating the atmospheric boundary layer (ABL) stability (see Fig. 4 for legend). Highlighted by black circles are observations with a RH>80 %, where deposition through the external leaf path can still play an important role. The black crosses are observations from the fertilization event observed on 11–12 September.
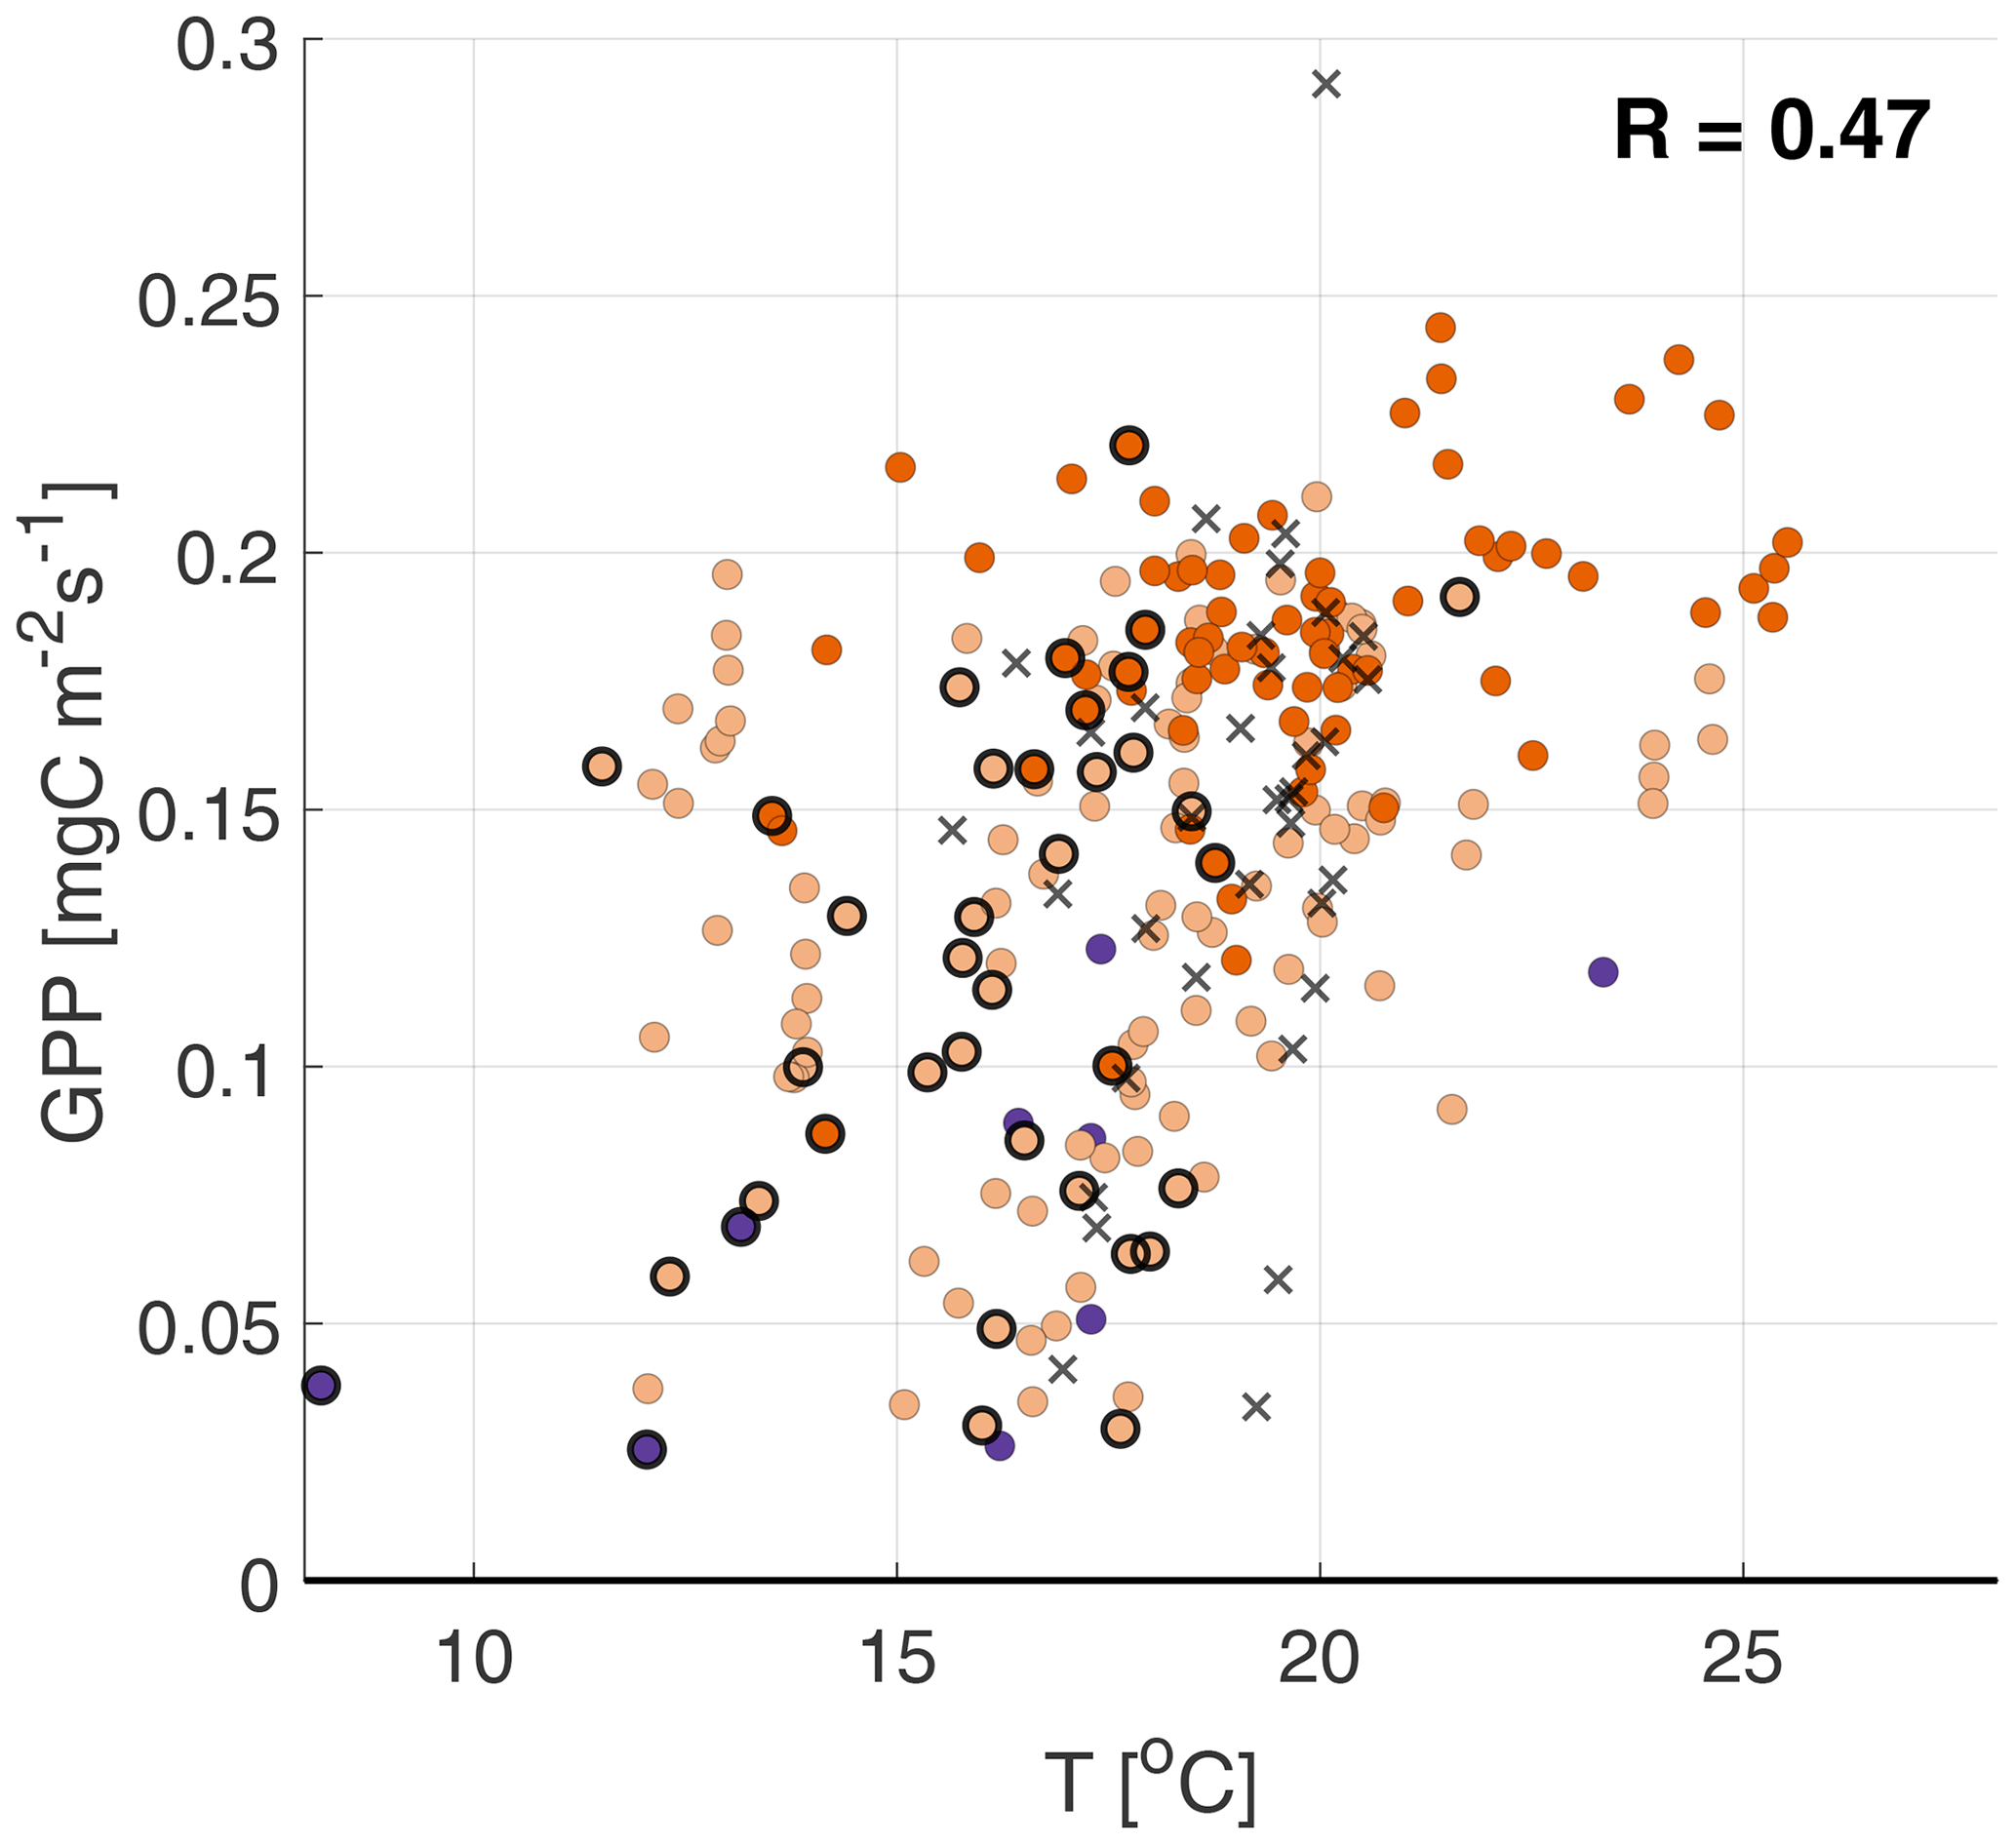
Figure A2Scatterplots of the temperature against the GPP, with the colors indicating the ABL stability (see Fig. 4 for legend). Highlighted by black circles are observations with a RH>80 %. The black crosses are observations from the fertilization event on 11–12 September.
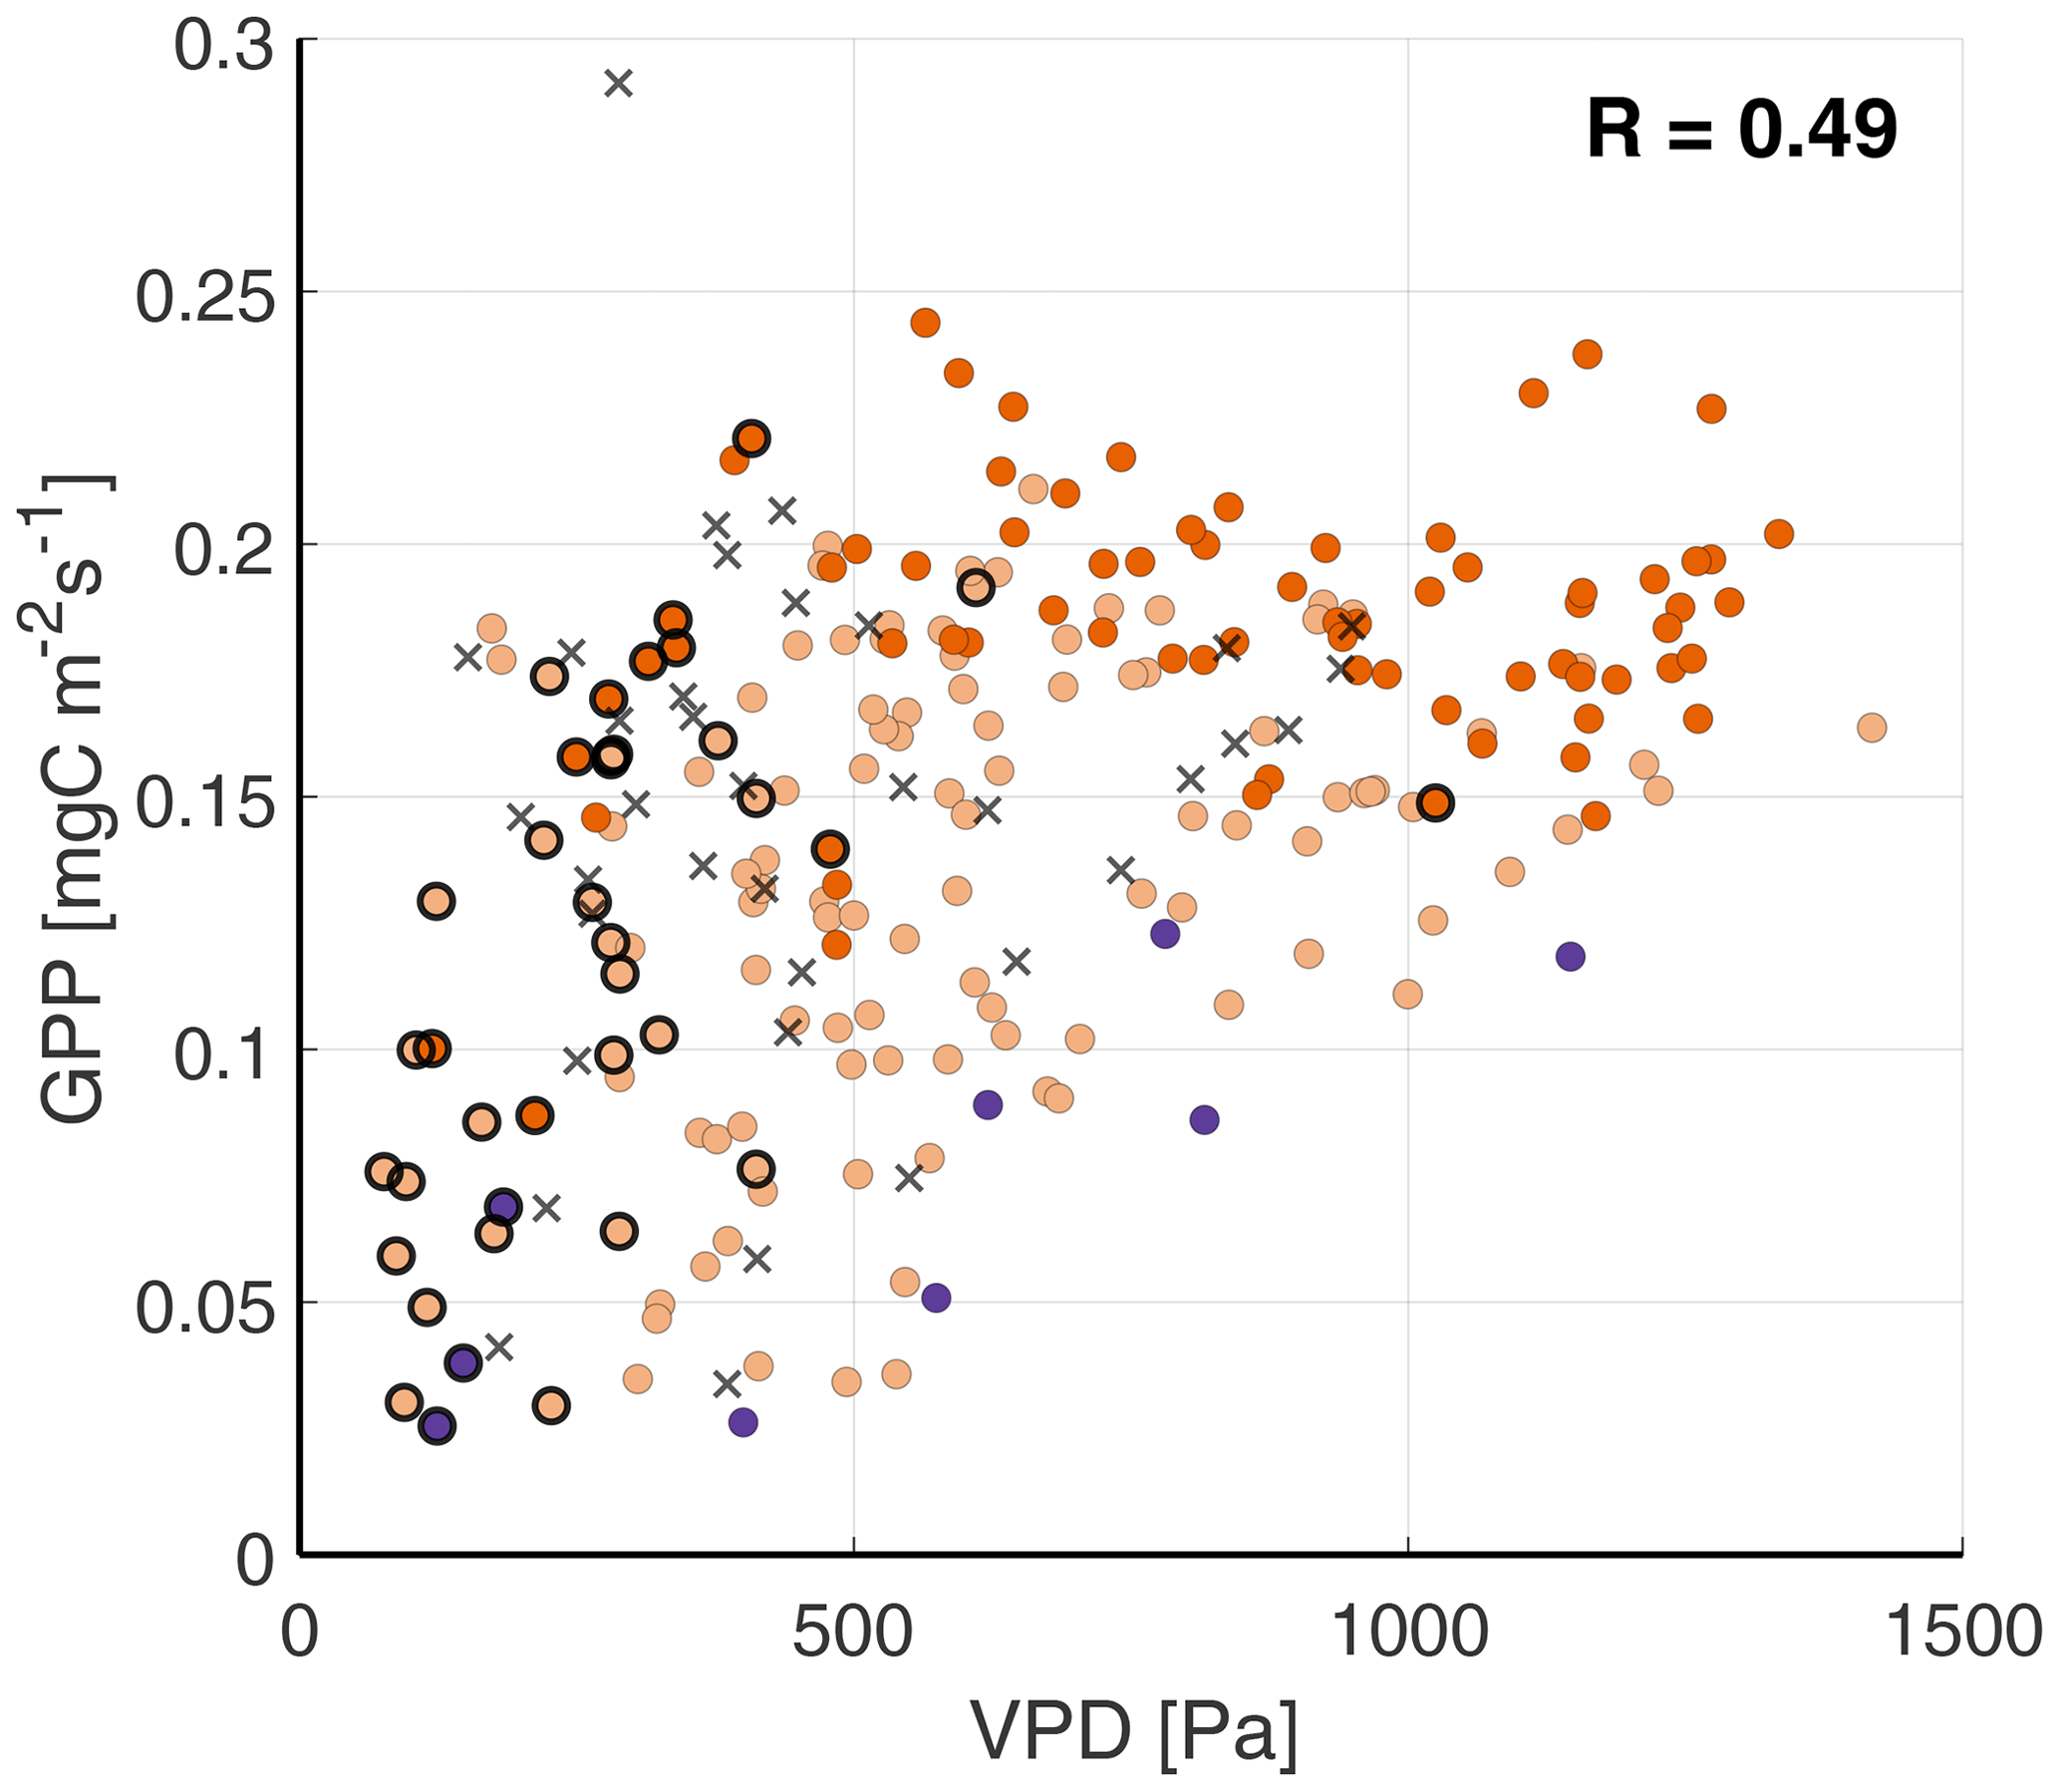
Figure A3Scatterplots of the VPD against the GPP, with the colors indicating the ABL stability (see Fig. 4 for legend). Highlighted by black circles are observations with a RH>80 %. The black crosses are observations from the fertilization event on 11–12 September.
The observations and codes used for the analysis are available in a repository (https://doi.org/10.5281/zenodo.10549048, Schulte et al., 2024).
RBS: conceptualization, formal analysis, investigation, methodology, visualization, and writing – original draft preparation; JVGdA: conceptualization, supervision, and writing – review and editing; SRJ: methodology and investigation (NH3 flux data); SvdG: investigation (NH3 flux data); JZ: investigation (CO2 flux and meteorological data); MCvZ: conceptualization, funding acquisition, and writing – review and editing.
The contact author has declared that none of the authors has any competing interests.
Publisher's note: Copernicus Publications remains neutral with regard to jurisdictional claims made in the text, published maps, institutional affiliations, or any other geographical representation in this paper. While Copernicus Publications makes every effort to include appropriate place names, the final responsibility lies with the authors.
We thank the Royal Netherlands Meteorological Institute (KNMI) for site access and assistance during the RITA-2021 campaign. All of the RIVM (Daan Swart, Stijn Berkhout, Rene van der Hoff and Marty Haaima) and TNO (Arjan Hensen, Pascal Wintjen, Arnoud Frumau and Pim van den Bulk) colleagues involved in this campaign are gratefully acknowledged for their support, dedicated work to make the campaign a success and fruitful discussions during the analysis of the data. This article has been accomplished using data generated by the Ruisdael Observatory, a scientific research infrastructure which is (partly) financed by the Dutch Research Council (NWO, grant no. 184.034.015).
This research has been supported by the Ministry of Agriculture, Nature and Food Quality (grant no. P36.7NAT).
This paper was edited by Ivonne Trebs and reviewed by two anonymous referees.
Behera, S. N., Sharma, M., Aneja, V. P., and Balasubramanian, R.: Ammonia in the atmosphere: a review on emission sources, atmospheric chemistry and deposition on terrestrial bodies, Environ. Sci. Pollut. R., 20, 8092–8131, https://doi.org/10.1007/s11356-013-2051-9, 2013. a
Berkhout, A. J. C., Swart, D. P. J., Volten, H., Gast, L. F. L., Haaima, M., Verboom, H., Stefess, G., Hafkenscheid, T., and Hoogerbrugge, R.: Replacing the AMOR with the miniDOAS in the ammonia monitoring network in the Netherlands, Atmos. Meas. Tech., 10, 4099–4120, https://doi.org/10.5194/amt-10-4099-2017, 2017. a
Bobbink, R., Hornung, M., and Roelofs, J. G. M.: The effects of air-borne nitrogen pollutants on species diversity in natural and semi-natural European vegetation, J. Ecol., 86, 717–738, https://doi.org/10.1046/j.1365-2745.1998.8650717.x, 2003. a
Bosveld, F., Baas, P., Beljaars, A., Holtslag, A., Vilà-Guerau de Arellano, J., and van de Wiel, B.: Fifty Years of Atmospheric Boundary-Layer Research at Cabauw Serving Weather, Air Quality and Climate, Bound.-Lay. Meteorol., 177, 583–612, https://doi.org/10.1007/s10546-020-00541-w, 2020. a
Brauer, C. C., Torfs, P. J. J. F., Teuling, A. J., and Uijlenhoet, R.: The Wageningen Lowland Runoff Simulator (WALRUS): application to the Hupsel Brook catchment and the Cabauw polder, Hydrol. Earth Syst. Sci., 18, 4007–4028, https://doi.org/10.5194/hess-18-4007-2014, 2014. a
Cowan, I. and Farquhar, G.: Stomatal function in relation to leaf metabolism and environment, Cambridge, University Press, Symp. Soc. Exp. Biol., PMID: 756635, 31, 471–505, 1977. a, b
de Groot, G. E., Vilà-Guerau de Arellano, J., de Roode, S. R., Coenders-Gerrits, A. M. J., and van de Wiel, B. J. H.: Evaporation Hysteresis over Vegetation: The Impact of Surface Processes and Boundary Layer Dynamics, Master's thesis, Delft University of Technology, the Netherlands, http://resolver.tudelft.nl/uuid:8284f137-2c64-48ab-ba8d-bf099d70c70c (last access: 15 January 2024), 2019. a, b
Erisman, J. and Schaap, M.: The need for ammonia abatement with respect to secondary PM reductions in Europe, Environ. Pollut., 129, 159–163, https://doi.org/10.1016/j.envpol.2003.08.042, 2004. a
Erisman, J. W., Galloway, J. N., Seitzinger, S., Bleeker, A., Dise, N. B., Petrescu, A. M. R., Leach, A. M., and de Vries, W.: Consequences of human modification of the global nitrogen cycle, Philos. T. Roy. Soc. B, 368, 20130116, https://doi.org/10.1098/rstb.2013.0116, 2013. a
Farquhar, G. D., Firth, P. M., Wetselaar, R., and Weir, B.: On the Gaseous Exchange of Ammonia between Leaves and the Environment: Determination of the Ammonia Compensation Point, Plant Physiol., 66, 710–714, https://doi.org/10.1104/pp.66.4.710, 1980. a, b
Ferrara, R., Di Tommasi, P., Famulari, D., and Rana, G.: Limitations of an Eddy-Covariance System in Measuring Low Ammonia Fluxes, Bound.-Lay. Meteorol., 180, 173–186, https://doi.org/10.1007/s10546-021-00612-6, 2021. a
Gates, D. M.: Biophysical ecology, Springer-Verlag, https://doi.org/10.1007/978-1-4612-6024-0, 1980. a
Hsiao, T.: Plant responses to water stress, Annu. Rev. Plant Physio., 24, 519–570, 1973. a, b
Jacobs, C.: Direct impact of atmospheric CO2 enrichment on regional transpiration, PhD thesis, Wageningen University, https://wur.on.worldcat.org/oclc/906644518 (last access: 15 January 2024), 1994. a
Jacobs, C. M. J. and de Bruin, H. A. R.: Predicting Regional Transpiration at Elevated Atmospheric CO2: Influence of the PBL–Vegetation Interaction, J. Appl. Meteorol., 36, 1663–1675, https://doi.org/10.1175/1520-0450(1997)036<1663:PRTAEA>2.0.CO;2, 1997. a
Jacobs, C. M. J., Jacobs, A. F. G., Bosveld, F. C., Hendriks, D. M. D., Hensen, A., Kroon, P. S., Moors, E. J., Nol, L., Schrier-Uijl, A., and Veenendaal, E. M.: Variability of annual CO2 exchange from Dutch grasslands, Biogeosciences, 4, 803–816, https://doi.org/10.5194/bg-4-803-2007, 2007. a
Jarvis, P. G., Monteith, J. L., and Weatherley, P. E.: The interpretation of the variations in leaf water potential and stomatal conductance found in canopies in the field, Philos. T. Roy. Soc. B, 273, 593–610, https://doi.org/10.1098/rstb.1976.0035, 1976. a
Kljun, N., Calanca, P., Rotach, M. W., and Schmid, H. P.: A simple two-dimensional parameterisation for Flux Footprint Prediction (FFP), Geosci. Model Dev., 8, 3695–3713, https://doi.org/10.5194/gmd-8-3695-2015, 2015. a
Lloyd, J. and Taylor, J.: On the temperature dependence of soil respiration, Funct. Ecol., 8, 315–323, https://doi.org/10.2307/2389824, 1994. a, b
LI-COR Biosciences: Eddy Covariance Processing Software (Version 7.0.6) [code], https://www.licor.com/env/products/eddy-covariance/eddypro, last access 15 January 2024.
Massad, R.-S., Nemitz, E., and Sutton, M. A.: Review and parameterisation of bi-directional ammonia exchange between vegetation and the atmosphere, Atmos. Chem. Phys., 10, 10359–10386, https://doi.org/10.5194/acp-10-10359-2010, 2010. a, b
Mauder, M. and Foken, T.: Impact of post-field data processing on eddy covariance flux estimates and energy balance closure, Meteorol. Z., 15, 597–609, https://doi.org/10.1127/0941-2948/2006/0167, 2006. a
Mauder, M., Foken, T., Aubinet, M., and Ibrom, A.: Eddy-covariance measurements, in: Springer Handbook of Atmospheric Measurements, Springer International Publishing, https://doi.org/10.1007/978-3-030-52171-4, 2022. a
Milford, C., Hargreaves, K. J., Sutton, M. A., Loubet, B., and Cellier, P.: Fluxes of NH3 and CO2 over upland moorland in the vicinity of agricultural land, J. Geophys. Res.-Atmos., 106, 24169–24181, https://doi.org/10.1029/2001JD900082, 2001. a, b
Miralles, D. G., Brutsaert, W., Dolman, A. J., and Gash, J. H.: On the use of the term “evapotranspiration”, Water Resour. Res., 56, https://doi.org/10.1029/2020WR028055, 2020. a
Moene, A. F. and Van Dam, J. C.: Transport in the Atmosphere-Vegetation-Soil Continuum, Camebridge University Press, https://doi.org/10.1017/CBO9781139043137, 2014. a, b, c
Moncrieff, J., Massheder, J., de Bruin, H., Ebers, J., Friborg, T., Heusinkveld, B., Kabat, P., Scott, S., Soegaard, H., and Verhoef, A.: A system to measure surface fluxes of momentum, sensible heat, water vapor and carbon dioxide, J. Hydrol., 188–189, 589–611, 1997. a
Moncrieff, J., Clement, R., Finnigan, J., and Meyers, T.: Averaging, detrending and filtering of eddy covariance time series, in: Handbook of micrometeorology: a guide for surface flux measurements, Kluwer Academic, https://doi.org/10.1007/1-4020-2265-4, 2004. a
Nemitz, E., Milford, C., and Sutton, M.: A two-layer canopy compensation point model for describing bi-directional biosphere-atmosphere exchange of ammonia, Q. J. Roy. Meteor. Soc., 127, 815–833, https://doi.org/10.1002/qj.49712757306, 2001. a, b
Nemitz, E., Sutton, M. A., Wyers, G. P., and Jongejan, P. A. C.: Gas-particle interactions above a Dutch heathland: I. Surface exchange fluxes of NH3, SO2, HNO3 and HCl, Atmos. Chem. Phys., 4, 989–1005, https://doi.org/10.5194/acp-4-989-2004, 2004. a, b
Papaioannou, G., Nikolidakis, G., Asimakopoulos, D., and Retalis, D.: Photosynthetically active radiation in Athens, Agr. Forest Meteorol., 81, 287–298, https://doi.org/10.1016/0168-1923(95)02290-2, 1996. a
Parrish, D. D. and Fehsenfeld, F. C.: Methods for gas-phase measurements of ozone, ozone precursors and aerosol precursors, Atmos. Environ., 34, 1921–1957, https://doi.org/10.1016/S1352-2310(99)00454-9, 2000. a
RIVM, CBS, PBL, and WUR: Nitrogen deposition, 1990–2018, Indicator 0189, version 18, 25 November 2019, RIVM National Institute for Public Health and the Environment, Bilthoven, Statistics Netherlands (CBS), The Hague, PBL Netherlands Environmental Assessment Agency, The Hague, and Wageningen University and Research, Wageningen, https://www.clo.nl/indicatoren/en018918 (last access: 17 August 2022), 2019. a
Ronda, R. J., de Bruin, H. A. R., and Holtslag, A. A. M.: Representation of the Canopy Conductance in Modeling the Surface Energy Budget for Low Vegetation, J. Appl. Meteorol., 40, 1431–1444, https://doi.org/10.1175/1520-0450(2001)040<1431:ROTCCI>2.0.CO;2, 2001. a, b
San José, J. J., Montes, R., and Nikonova-Crespo, N.: Carbon Dioxide and Ammonia Exchange in the Trachypogon Savannas of the Orinoco Llanos, Ann. Bot.-London, 68, 321–328, https://doi.org/10.1093/oxfordjournals.aob.a088259, 1991. a
Schrader, F., Erisman, J. W., and Brümmer, C.: Towards a coupled paradigm of NH3-CO2 biosphere–atmosphere exchange modelling, Global Change Biol., 26, 4654–4663, https://doi.org/10.1111/gcb.15184, 2020. a
Schulte, R., van Zanten, M., Rutledge-Jonker, S., Swart, D., Wichink Kruit, R., Krol, M., van Pul, W., and Vilà-Guerau de Arellano, J.: Unraveling the diurnal atmospheric ammonia budget of a prototypical convective boundary layer, Atmos. Environ., 249, 118153, https://doi.org/10.1016/j.atmosenv.2020.118153, 2021. a, b, c, d, e
Schulte, R. B., van Zanten, M. C., van Stratum, B. J. H., and Vilà-Guerau de Arellano, J.: Assessing the representativity of NH3 measurements influenced by boundary-layer dynamics and the turbulent dispersion of a nearby emission source, Atmos. Chem. Phys., 22, 8241–8257, https://doi.org/10.5194/acp-22-8241-2022, 2022. a, b, c
Schulte, R. B., Vilà-Guerau de Arellano, J., Rutledge-Jonker, S., van der Graaf, S., Zhang, J., and van Zanten, M.: Observational relationships between ammonia, carbon dioxide and water vapor under a wide range of meteorological and turbulent conditions: RITA-2021 campaign, Zenodo [data set and code], https://doi.org/10.5281/zenodo.10549048, 2024. a
Smit, L. A. M. and Heederik, D.: Impacts of Intensive Livestock Production on Human Health in Densely Populated Regions, GeoHealth, 1, 272–277, https://doi.org/10.1002/2017GH000103, 2017. a
Stewart, J.: Modelling surface conductance of pine forest, Agr. Forest Meteorol., 43, 19–35, https://doi.org/10.1016/0168-1923(88)90003-2, 1988. a
Stokstad, E.: Nitrogen crisis threatens Dutch environment- and economy, Science, 366, 1180–1181, https://doi.org/10.1126/science.366.6470.1180, 2019. a
Swart, D., Zhang, J., van der Graaf, S., Rutledge-Jonker, S., Hensen, A., Berkhout, S., Wintjen, P., van der Hoff, R., Haaima, M., Frumau, A., van den Bulk, P., Schulte, R., van Zanten, M., and van Goethem, T.: Field comparison of two novel open-path instruments that measure dry deposition and emission of ammonia using flux-gradient and eddy covariance methods, Atmos. Meas. Tech., 16, 529–546, https://doi.org/10.5194/amt-16-529-2023, 2023. a, b, c, d, e, f, g, h, i, j, k
Takagi, K., Tsuboya, T., and Takahashi, H.: Diurnal hystereses of stomatal and bulk surface conductances in relation to vapor pressure deficit in a cool-temperate wetland, Agr. Forest Meteorol., 91, 177–191, https://doi.org/10.1016/S0168-1923(98)00078-1, 1998. a
Van Hove, L., Adema, E., Vredenberg, W., and Pieters, G.: A study of the adsorption of NH3 and SO2 on leaf surfaces, Atmos. Environ. (1967), 23, 1479–1486, https://doi.org/10.1016/0004-6981(89)90407-1, 1989. a
van Zanten, M. C., Sauter, F. J., Wichink Kruit, R. J., van Jaarsveld, J. A., and van Pul, W. A. J.: Description of the DEPAC module: Dry deposition modelling with DEPAC-GCN2010, Tech. Rep. 680180001, National Institute for Public Health and the Environment (RIVM), https://www.rivm.nl/bibliotheek/rapporten/680180001.pdf (last access: 15 January 2024), 2010. a, b, c, d
Vilà-Guerau de Arellano, J., van Heerwaarden, C. C., van Stratum, B. J. H., and van den Dries, K.: Atmospheric Boundary Layer: Integrating Air Chemistry and Land Interactions, Cambridge University Press, https://doi.org/10.1017/CBO9781316117422, 2015. a
Vilà-Guerau de Arellano, J., Ney, P., Hartogensis, O., de Boer, H., van Diepen, K., Emin, D., de Groot, G., Klosterhalfen, A., Langensiepen, M., Matveeva, M., Miranda-García, G., Moene, A. F., Rascher, U., Röckmann, T., Adnew, G., Brüggemann, N., Rothfuss, Y., and Graf, A.: CloudRoots: integration of advanced instrumental techniques and process modelling of sub-hourly and sub-kilometre land–atmosphere interactions, Biogeosciences, 17, 4375–4404, https://doi.org/10.5194/bg-17-4375-2020, 2020. a, b, c
Vilà-Guerau de Arellano, J., Hartogensis, O., Benedict, I., de Boer, H., Bosman, P. J. M., Botía, S., Cecchini, M. A., Faassen, K. A. P., González-Armas, R., van Diepen, K., Heusinkveld, B. G., Janssens, M., Lobos-Roco, F., Luijkx, I. T., Machado, L. A. T., Mangan, M. R., Moene, A. F., Mol, W. B., van der Molen, M., Moonen, R., Ouwersloot, H. G., Park, S.-W., Pedruzo-Bagazgoitia, X., Röckmann, T., Adnew, G. A., Ronda, R., Sikma, M., Schulte, R., van Stratum, B. J. H., Veerman, M. A., van Zanten, M. C., and van Heerwaarden, C. C.: Advancing understanding of land–atmosphere interactions by breaking discipline and scale barriers, Ann. NY Acad. Sci., 1522, 1–24, https://doi.org/10.1111/nyas.14956, 2023. a, b
Visser, A. J., Ganzeveld, L. N., Goded, I., Krol, M. C., Mammarella, I., Manca, G., and Boersma, K. F.: Ozone deposition impact assessments for forest canopies require accurate ozone flux partitioning on diurnal timescales, Atmos. Chem. Phys., 21, 18393–18411, https://doi.org/10.5194/acp-21-18393-2021, 2021. a
von Bobrutzki, K., Braban, C. F., Famulari, D., Jones, S. K., Blackall, T., Smith, T. E. L., Blom, M., Coe, H., Gallagher, M., Ghalaieny, M., McGillen, M. R., Percival, C. J., Whitehead, J. D., Ellis, R., Murphy, J., Mohacsi, A., Pogany, A., Junninen, H., Rantanen, S., Sutton, M. A., and Nemitz, E.: Field inter-comparison of eleven atmospheric ammonia measurement techniques, Atmos. Meas. Tech., 3, 91–112, https://doi.org/10.5194/amt-3-91-2010, 2010. a, b
Webb, E., Pearman, G., and Leuning, R.: Correction of flux measurements for density effects due to heat and water vapour transfer, Q. J. Roy. Meteor. Soc., 106, 85–100, 1980. a
Wentworth, G. R., Murphy, J. G., Benedict, K. B., Bangs, E. J., and Collett Jr., J. L.: The role of dew as a night-time reservoir and morning source for atmospheric ammonia, Atmos. Chem. Phys., 16, 7435–7449, https://doi.org/10.5194/acp-16-7435-2016, 2016. a
Whitehead, J. D., Twigg, M., Famulari, D., Nemitz, E., Sutton, M. A., Gallagher, M. W., and Fowler, D.: Evaluation of Laser Absorption Spectroscopic Techniques for Eddy Covariance Flux Measurements of Ammonia, Environ. Sci. Technol., 42, 2041–2046, https://doi.org/10.1021/es071596u, 2008. a
Wichink Kruit, R. J. and van Pul, W. A. J.: Ontwikkelingen in de stikstofdepositie, Briefrapport 2018-0117, National Institute for Public Health and the Environment (RIVM), https://doi.org/10.21945/RIVM-2018-0117, 2018. a
Wichink Kruit, R. J., van Pul, W. A. J., Otjes, R. P., Hofschreuder, P., Jacobs, A. F. G., and Holtslag, A. A. M.: Ammonia fluxes and derived canopy compensation points over non-fertilized agricultural grassland in The Netherlands using the new GRadient Ammonia – High Accuracy – Monitoring (GRAHAM), Atmos. Environ., 41, 1275–1287, https://doi.org/10.1016/j.atmosenv.2006.09.039, 2007. a, b, c
Wichink Kruit, R. J., van Pul, W. A. J., Sauter, F. J., van den Broek, M., E., N., Sutton, M. A., Krol, M., and Holtslag, A. A. M.: Modeling the surface–atmosphere exchange of ammonia, Atmos. Environ., 44, 945–957, https://doi.org/10.1016/j.atmosenv.2009.11.049, 2010. a, b
Wilczak, J., Oncley, S., and Stage, S.: Sonic anemometer tilt correction algorithms, Bound.-Lay. Meteorol., 99, 127–150, 2001. a
Wyers, G., Otjes, R., and Slanina, J.: A continuous-flow denuder for the measurement of ambient concentrations and surface-exchange fluxes of ammonia, Atmos. Environ. A-Gen., 27, 2085–2090, https://doi.org/10.1016/0960-1686(93)90280-C, 1993. a
Zhang, Q., Manzoni, S., Katul, G., Porporato, A., and Yang, D.: The hysteretic evapotranspiration – Vapor pressure deficit relation, J. Geophys. Res.-Biogeo., 119, 125–140, https://doi.org/10.1002/2013JG002484, 2014. a
Zöll, U., Lucas-Moffat, A., Wintjen, P., Schrader, F., Beudert, B., and Bruemmer, C.: Is the biosphere-atmosphere exchange of total reactive nitrogen above forest driven by the same factors as carbon dioxide? An analysis using artificial neural networks, Atmos. Environ., 206, 108–118, https://doi.org/10.1016/j.atmosenv.2019.02.042, 2019. a
- Abstract
- Introduction
- Characterizing the RITA-2021 campaign observations
- Ammonia flux relationships to dynamic vegetation responses
- Discussion
- Conclusions
- Appendix A: An alternative way of calculating ecosystem respiration
- Code and data availability
- Author contributions
- Competing interests
- Disclaimer
- Acknowledgements
- Financial support
- Review statement
- References