the Creative Commons Attribution 4.0 License.
the Creative Commons Attribution 4.0 License.
 | 16 Feb 2024
Enhanced net CO2 exchange of a semideciduous forest in the southern Amazon due to diffuse radiation from biomass burning
Simone Rodrigues
Glauber Cirino
Demerval Moreira
Andrea Pozzer
Rafael Palácios
Sung-Ching Lee
Breno Imbiriba
José Nogueira
Maria Isabel Vitorino
George Vourlitis
Carbon cycling in the Amazon fundamentally depends on the functioning of ecosystems and atmospheric dynamics, which are highly intricate. Few studies have hitherto investigated or measured the radiative effects of aerosols on the Amazon and Cerrado. This study examines the effects of atmospheric aerosols on solar radiation and their effects on net ecosystem exchange (NEE) in an area of semideciduous tropical forest in the north of Mato Grosso. Our results show that for a relative irradiance (f) 1.10–0.67, a decrease in incident solar radiation is associated with a reduction in the NEE. However, an average increase of 25 %–110 % in NEE was observed when pollution levels and aerosol optical depth (AOD) were above ≈ 1.25 and f < 0.5. The increase NEE was attributed to the increase of up to 60 % in the diffuse fraction of photosynthetically active radiation. The change in AOD and f was mainly attributable to biomass burning organic aerosols from fires. Important influences on vapor pressure deficit (VPD) as well as air temperature (Tair) and canopy (LCT), induced by the interaction between solar radiation and high aerosol load in the observation area, were also noticed. On average, a cooling of about 3–4 ∘C was observed for Tair and LCT, and a decrease of up to 2–3 hPa was observed for VPD. Given the long-distance transport of aerosols emitted by burning biomass, significant changes in atmospheric optical properties and irradiance will impact the CO2 flux of semideciduous forests distributed in the region.
- Article
(9592 KB) - Full-text XML
-
Supplement
(6256 KB) - BibTeX
- EndNote


Carbon (C) is a key element in global biogeochemical cycles, and understanding the biosphere–atmosphere fluxes of mass and energy is essential to understanding current and future terrestrial C storage. The role of Amazonian forest ecosystems for global C storage has been widely debated (Booth et al., 2012; Huntingford et al., 2013; Brienen et al., 2015), especially for tropical forests (Doughty et al., 2015; Gatti et al., 2014, 2021). Redistribution of biomes and plant species (Davison et al., 2021), loss of biodiversity (Brando et al., 2014; Saatchi et al., 2021), increases in fires (Brando et al., 2019; Alencar et al., 2022; Sullivan et al., 2020), and outbreaks of pests and diseases (Anderegg et al., 2020) are examples of impacts, aggravated not only by climatic factors but also by anthropogenic ones (Ometto et al., 2022). These impacts have been threatening the largest pantropical CO2 sinks since 1990. Reductions from 1.26 to 0.29 PgC yr−1 are expected between 1990 and 2030, possibly reaching zero in the Amazon (Hubau et al., 2020). The result of increasing atmospheric CO2 levels provides important feedback on the future of greenhouse warming (Booth et al., 2012; Huntingford et al., 2013). In the Amazon biome, forest ecosystems play an important role in terrestrial C storage, and while these forests seem to have a uniform behavior, there are distinct climatic subregions that affect C storage (Brienen et al., 2015; Gatti et al., 2021). CO2 absorption through photosynthesis increases the vegetation and soil C stocks, representing a C sink, while plants, animals, microbial respiration, decomposition of dead biomass, and wildfires release CO2, representing a C source to the atmosphere (Artaxo et al., 2022; Venturini et al., 2023; Junior et al., 2020).
In general, the participation of forests in the global carbon cycle can only be adequately quantified by long-term studies monitoring C exchange at the plant–atmosphere interface. Forests are estimated to store 200–300 Pg C (Pan, 2011; Saatchi et al., 2011; Avitabile et al., 2016), about a third of what is contained in the atmosphere. This stock is very dynamic, and these trees process about 60 % of global photosynthesis, sequestering about 72 Pg C from the atmospheric component through gross primary production (GPP) every year (Beer et al., 2010) but releasing a similar amount back into the atmosphere from ecosystem (plant + animal + microbial) respiration (Nagy et al., 2018). With these large fluxes, a small proportionate change in CO2 uptake or release can result in a large change in net C storage. Carbon concentrations in the atmosphere have increased since the beginning of the industrial period and currently act with other C emission sources, such as the degradation of forests, mainly tropical ones. Recent reports (Gatti et al., 2021) show that some regions of the Amazon act as a source of CO2 to the atmosphere as a result of logging, land use change, and fires that occur in the region. However, regional numeric modeling (Moreira et al., 2017) and in situ studies indicate (Carswell et al., 2002; von Randow et al., 2004) that Amazonian forests can occasionally be net atmospheric CO2 sinks or approximately in equilibrium (Vourlitis et al., 2011). In general, the balance between rates of carbon emission or carbon fixation is delicate, so small external disturbances can change the dynamics of the forest and the state of the climate system.
Among the modulating agents of the CO2 balance, solar radiation is a fundamental component for both photosynthesis and respiration. In Brazil, especially in the Amazon region, biomass burning emits large quantities of gases and aerosols into the atmosphere, which can strongly alter radiative fluxes, impacting CO2 flux (Aragão et al., 2018; Malavelle et al., 2019; Morgan et al., 2019; de Magalhães et al., 2019). Atmospheric aerosols from biomass burning affect ecosystem light use efficiency (LUE) and productivity, influence the amount and nature of solar radiation received in the system, and affect other environmental conditions such as temperature and humidity (Kanniah et al., 2012; Mercado et al., 2009). Studies of the effects of aerosols on terrestrial C cycling processes have found positive, negative, and neutral effects, and most of the research in the Amazon has been conducted in the central (Cirino et al., 2014), eastern (Doughty et al., 2010; Oliveira et al., 2007), and southwestern (Yamasoe et al., 2006; Cirino et al., 2014) parts of the basin. However, little research has been done on the ecotones in the Amazon, e.g., in the Cerrado–Amazonian forest transition, which lies within the arc of deforestation, and other biomes such as Cerrado–Caatinga, Cerrado–Atlantic forests, and Pantanal forests. Numeric simulations have also demonstrated the impact of aerosols on GPP on the regional (Moreira et al., 2013; Rap, 2015; Bian et al., 2021) and global scales (Mercado et al., 2009; Rap et al., 2018), but physical representations of these impacts on transition ecosystems are still lacking.
The models, however, need improvements in parameterizing the radiative effects of aerosols and clouds on the NEE, e.g., a more realistic representation of the canopy structure as well as leaf physiological and morphological processes (Durand et al., 2021). Improvements in the aerosol optical model, its properties, secondary formation, lifetime, evolution, and absorption of aerosols are also critical (Drugé et al., 2022), especially those related to shape, size, and chemical composition. These improvements are fundamental for a more accurate and realistic spatial distribution of the atmospheric CO2 absorption potential by Amazonian forests (Procopio et al., 2004; Moreira et al., 2017). In this sense, the potential for fire-induced atmospheric aerosols to impact to CO2 absorption by tropical semideciduous (seasonal) forests in Mato Grosso (in the arc of deforestation) has not been evaluated either by direct observation or numerical modeling. It is known that these forests play a central role in preserving biodiversity (Fu et al., 2018), are located on the frontier of deforestation, and experience seasonal variations in NEE (Vourlitis et al., 2011). These attributes make this region an excellent laboratory to assess the effects of atmospheric aerosols on forest NEE.
This research focuses on studying the action of biomass burning aerosols in an area of semideciduous forest located in the southern portion of the Amazon Basin in the region of the arc of deforestation of northern Mato Grosso, Brazil. To this end, we specifically seek to (1) develop a clear-sky irradiance algorithm using a long observation period of aerosol optical depth (AOD); (2) quantify the increase in the diffuse fraction of solar radiation due to the presence of aerosols from fires in the experimental study area; (3) quantify net and relative changes in NEE from changes in direct and diffuse radiation; and (4) evaluate the influence of fires on biophysical variables that influence forest photosynthetic rates, such as leaf canopy temperature (LCT), air temperature (Tair), and the vapor pressure deficit (VPD). Aerosol data and micrometeorological measurements with carbon fluxes measured by the eddy covariance system were used from 2005 to 2008. All solar radiation measurements are evaluated in terms of aerosol depth (AOD), solar zenith angle (SZA), and relative irradiance (f). To our knowledge, this is the first study with this purpose.
2.1 Site descriptions
The study area was located in the south of the Amazon Basin 50 km northeast of Sinop in the municipality of Cláudia (lat. 11∘24.75′ S, long. 55∘19.50′ W) in the state of Mato Grosso (Fig. 1). This forest is located in the arc of deforestation, a region of continuous agricultural expansion (areas for soybean and cattle pasture, logging, and fires) (Barbosa et al., 2023; Nepstad et al., 2014; Balch et al., 2015; Alencar et al., 2022) (Figs. S1, S2, and S3) and is recognized as seasonal, dry, or semideciduous forest (Ackerly et al., 1989; Ratter et al., 1978). Supplement Figs. S3 and S4 show the study area's different aerosol loads during the dry and rainy seasons, respectively. These figures were obtained from the time series of the Terra and Aqua satellites (AODm, Table 1).
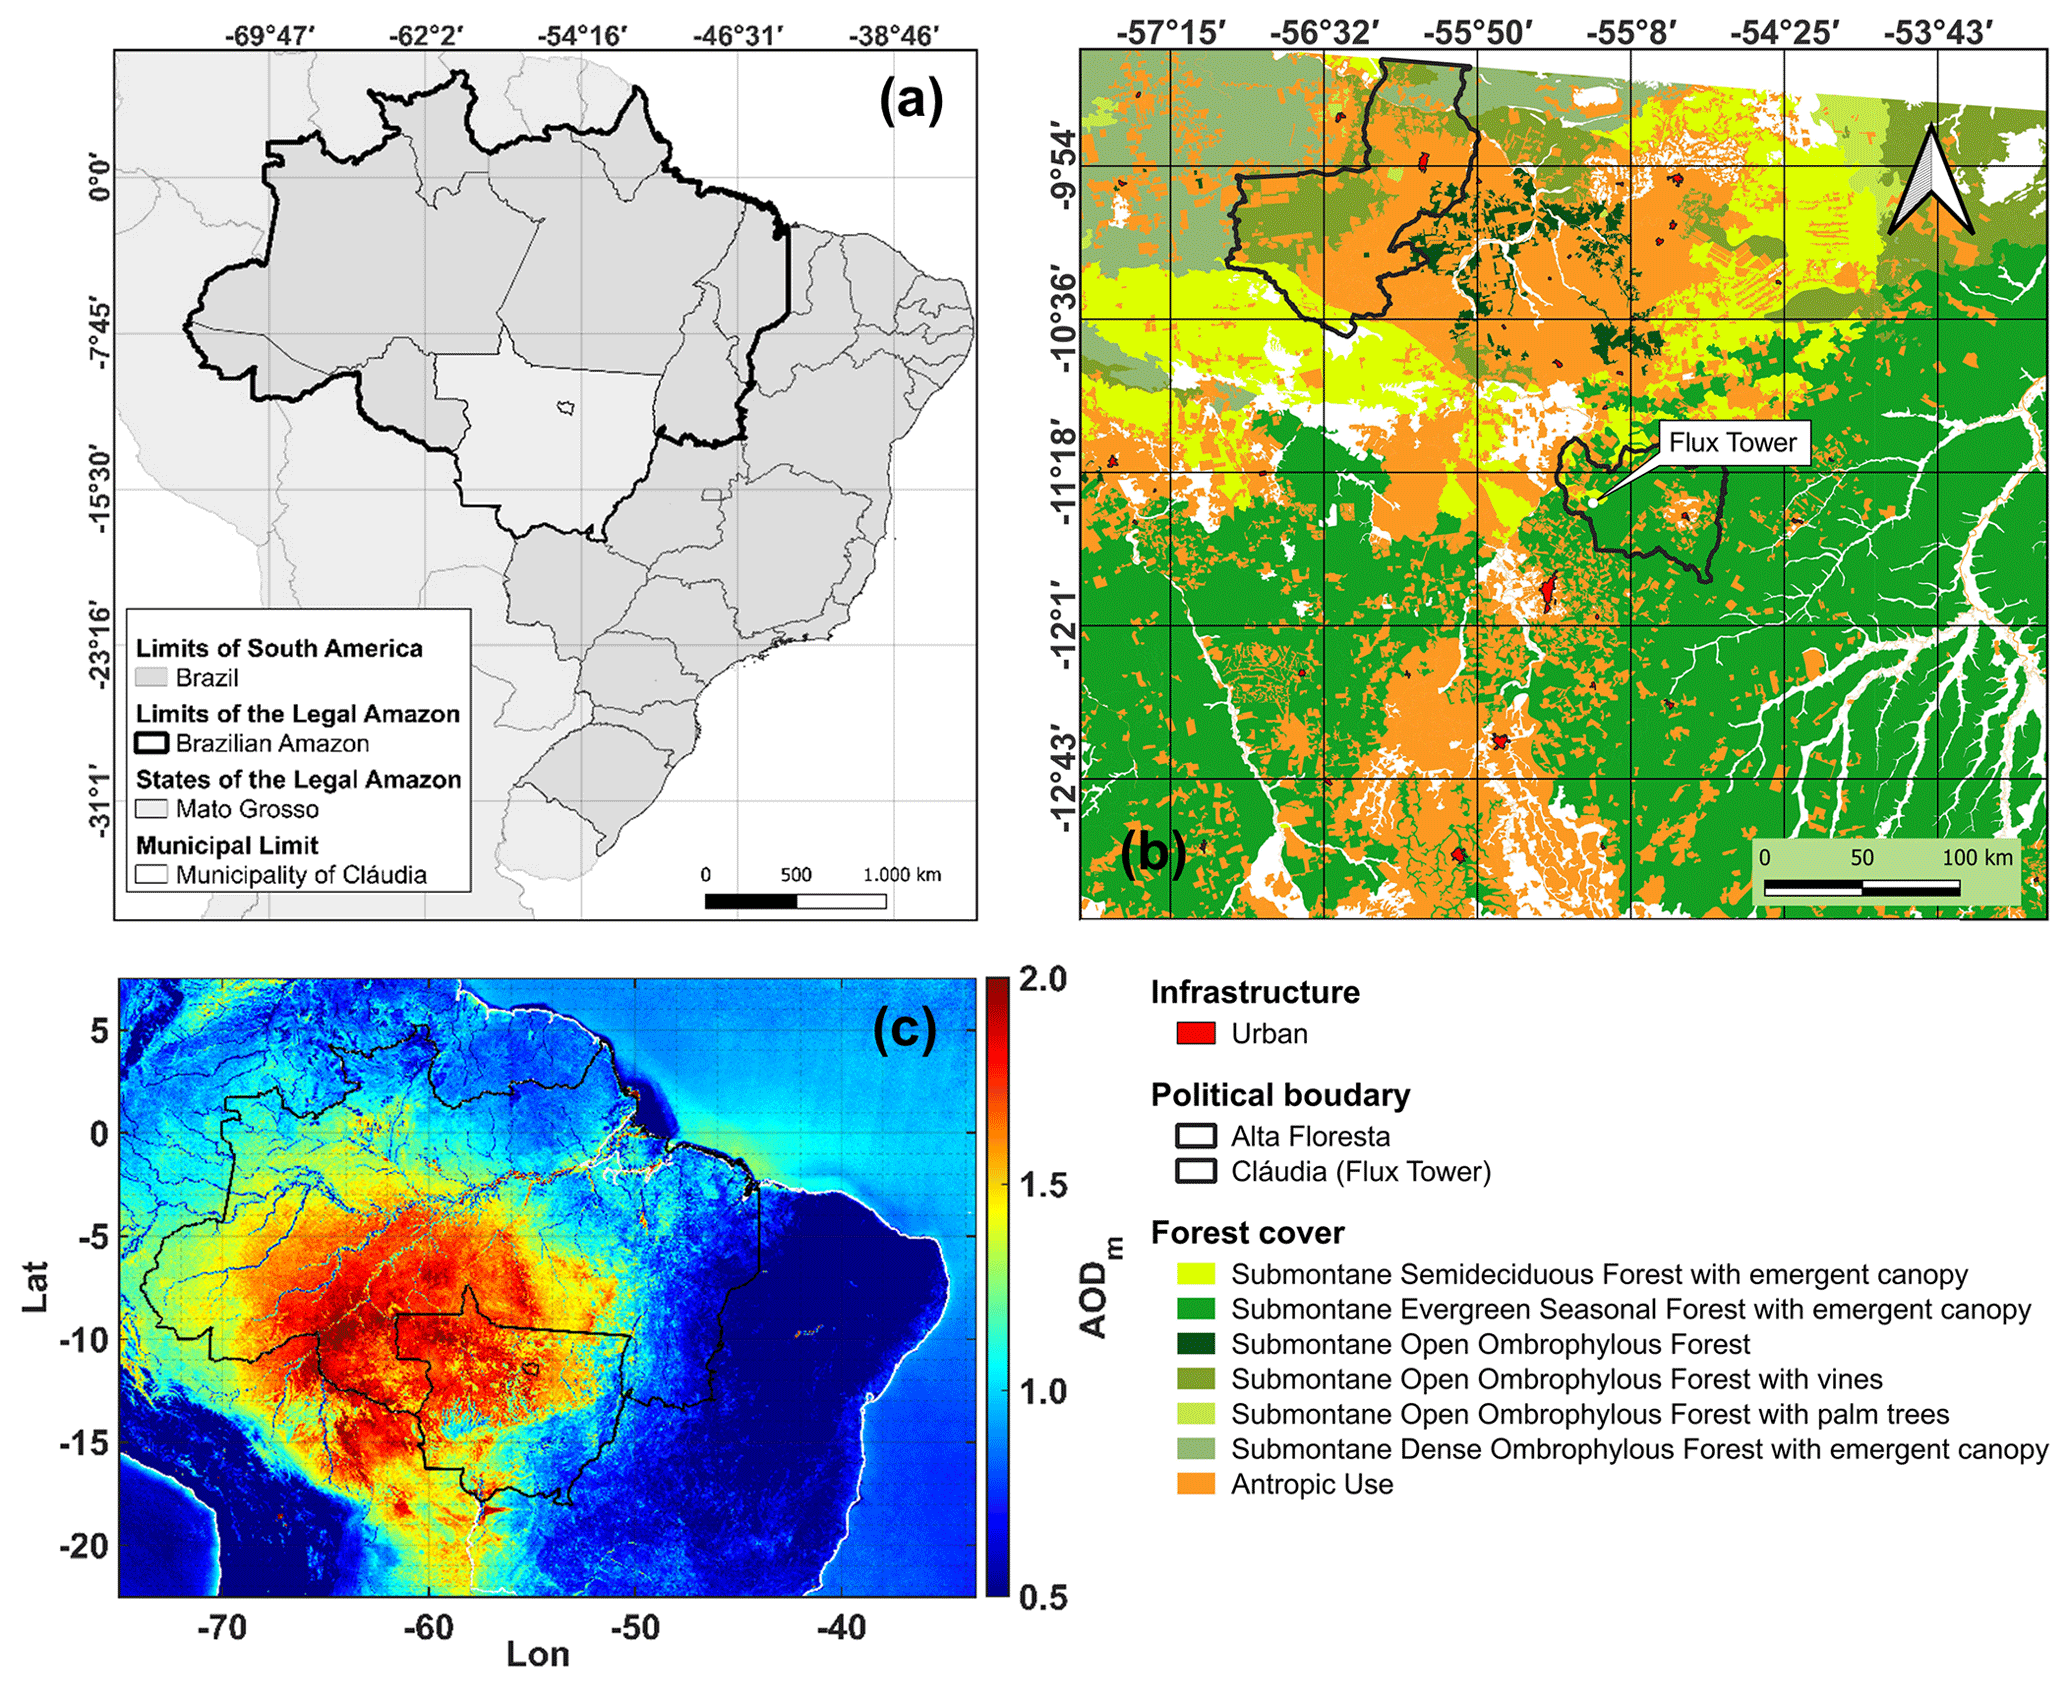
Figure 1(a) Map of South America and Brazil, highlighting the political limits of the studied region (clear gray). (b) Localization map micrometeorological tower in the Cláudia municipality (white point), ≈ 225 km southeast of Alta Floresta, Mato Grosso. Panel (c) shows the average regional distribution of AOD at 550 nm extracted from the Terra (Aqua) MOD04-3K (MYD04-3K) platforms between 2000 and 2020 at the studied area. Changes in land use and land cover are also shown (TerraBrasilis).
Previous studies report the characteristics of this type of forest (Vourlitis et al., 2011), which typically have trees with lower height, biomass, and floristic diversity compared to humid tropical forests (Murphy and Lugo, 1986; Nogueira et al., 2008) due to their well-defined seasonal variation in precipitation. The forest is 423 m above sea level in a transition where the vegetation consists of savannah (Cerrado), transitional vegetation (Cerradão), and Amazonian forest (Vourlitis et al., 2011).
The areas of transitional forests (Amazon forest–Cerrado) covered approximately 41 % (362 538 km2) of the state of Mato Grosso. Due to the advance of the agricultural frontier, 21 % of these areas suffered drastic reductions. Some of these forest areas are found in protected areas and territories of indigenous communities (approximately 17 %). The deciduous and semideciduous forests of the Cerrado biome initially covered 49 951 km2 in the state of Mato Grosso. Deforested areas represented ≈ 41 % of this total, with only 14 % located in conservation units (Alencar et al., 2004). The geographic positions of these forests are discontinuous due to climatic fluctuations that have occurred in the last 10 000 years (Prado and Gibbs, 1993). Trees at this location are typical of the semideciduous forest of the Amazon, with maximum canopy heights varying between 25 and 28 m. A comprehensive description of the species in the region was reported by Ackerly et al. (1989) and Lorenzi (2002). The soils are acidic with a pH measuring 4.2 and sandy (94 % sand), well-drained quartzarenic neosols that are poor in nutrients and have low organic matter (Vourlitis et al., 2001; Oliveira and Marquis, 2002), with a dry season that extends from May to September (Vourlitis et al., 2002). This area's 30-year average annual temperature is 24∘C, with precipitation of approximately 2000 mm yr−1 (Vourlitis et al., 2002). The Bolivian High (BH) and South Atlantic Convergence Zone (SACZ) are among the active atmospheric systems in northern Mato Grosso, while southern Mato Grosso is affected by extratropical systems, such as frontal systems (Reboita et al., 2012). The loss of leaves (deciduousness) during the dry season (July–September) is sensitive to water availability and temperatures (maximum and minimum) in the region. With the arrival of the rainy season (November–May), trees that have lost their leaves begin to sprout again and produce new leaves (Vourlitis et al., 2011).
2.2 Instrumentation and data
2.2.1 Aerosol measurements
This study used a long series of aerosol optical depth (AOD) measurements to assess the impact of atmospheric particles on the flux of solar radiation to the surface. Two types of remote sensors were used: the MODIS (Moderate Resolution Imaging Spectroradiometer) orbital sensor – available on board the Aqua and Terra satellites – products MOD04-3K and MYD04-3K (Remer et al., 2013) and an AERONET (Aerosol Robotic Network) solar photometer used as a standard measure of optical properties of atmospheric aerosols at the surface between June 1999 and March 2017 (Holben et al., 1998). All remote aerosol information required for this study was obtained and maintained by NASA (National Aeronautics and Space Administration).
The Terra and Aqua satellites have a heliosynchronous polar orbit, with a local time (LT) of passage over the study areas around 10 h 30 min and 13 h 30 min. These space platforms cover the Earth's surface every 1–2 d with radiance measurements in 36 spectral bands. The MOD and MYD04-3K aerosol products also feature the most current collection of data available from NASA at 3 km spatial resolution for AOD and other aerosol optical properties (Levy et al., 2013; Remer et al., 2013). Filters to exclude contamination of data by clouds are also applied during estimation processing. The AOD series from these satellites has 20 years of data on continents and oceans and is widely available on the open-access platform of the Atmospheric Files Distribution System – Level 1, located at the Distributed Active Files Center (LAADS-DAAC) from Goddard Space Flight Center (GSFC) in Greenbelt, Maryland (USA). In this work, satellite AOD spatializations were used to obtain regional information on the nature or type of aerosol acting over the study area between 2000 and 2020 (Fig. S4). More detailed information about the MODIS sensor, such as spectral models, validation, and operating period of the aforementioned products, can be found in Remer et al. (2005) and Remer et al. (2013).
A long series of AOD measurements (> 20 years of data) is available for the city of Alta Floresta in northern Mato Grosso through CIMEL Electronique solar photometers, maintained and operated by NASA (GSFC), through AERONET (1999–2017). This photometer network is intended for the monitoring and characterization of aerosol particles in various regions of the world. These sensors represent the standard measure of AOD and are widely used in the validation of satellite AOD estimates. The system operates solar radiation measurements and rotational interference filters to extract optical properties from aerosols in various spectral bands between 340 and 1020 nm (Schafer et al., 2008; Sinyuk et al., 2020). This makes it possible to evaluate the direct influence of atmospheric particles in real time on regions highly affected by fires, such as the region of the arc of deforestation. In this work, AOD was used at wavelengths of 500 nm (AERONET) and 550 nm (MODIS). Both satellite and photometer data cover the entire period of micrometeorological and flux data, described in the next section. In Alta Floresta, the AERONET system also has individual sensors and long-term measurements of incident shortwave solar radiation (SWi(t)), as described in Table 1.
2.2.2 Micrometeorological measurements
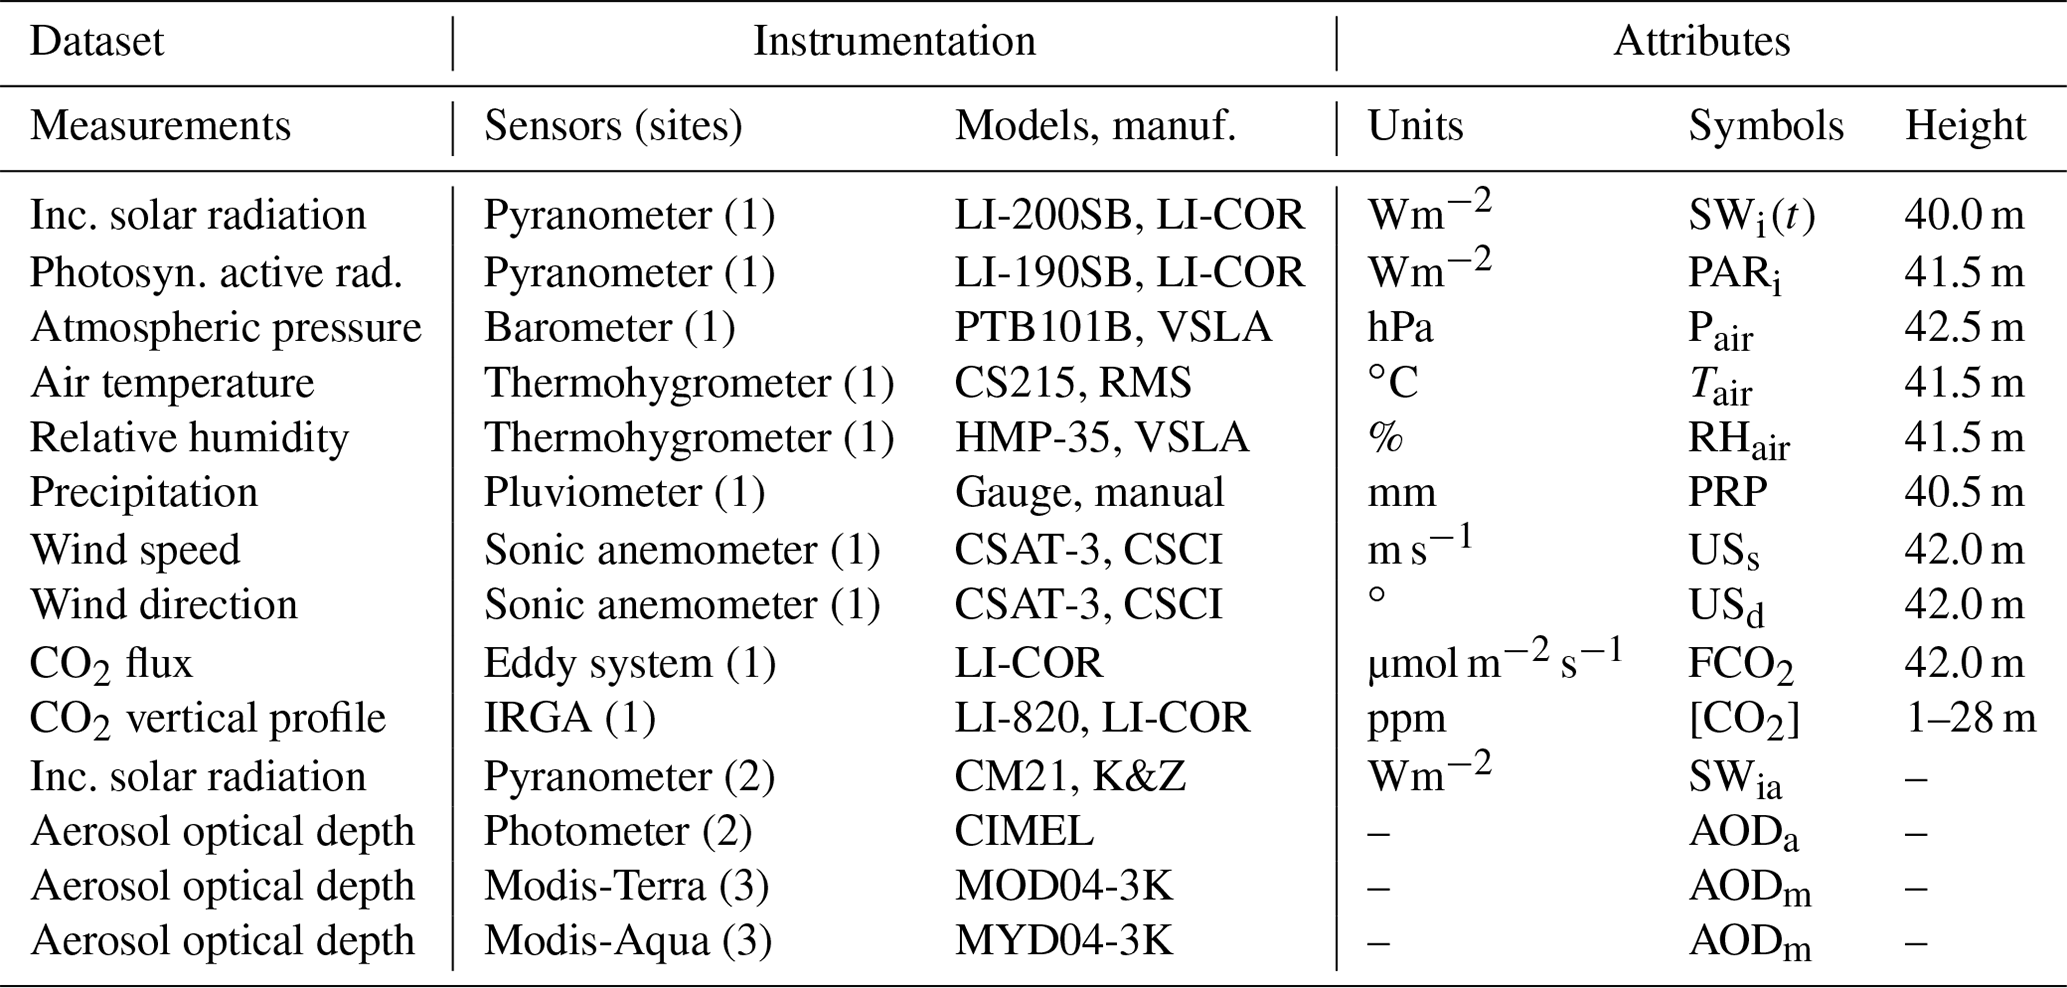
The CO2 flux datasets available for this research are widely used and cited by previous studies. Information regarding the systems installed in the micrometeorological tower is directly available in Vourlitis et al. (2011). An automatic weather station (ASW) to monitor the weather in the Cláudia municipality was used between June 2005 and July 2008. The implanted tower follows the standard of the micrometeorological measurement tower system of the Programa LBA (Nagy et al., 2016; Artaxo et al., 2022). In this research, the deployed tower consists of a pyranometer, thermometer, psychrometer, anemometer, pluviograph, and turbulent vortex system (eddy covariance). Herein, these measures were used to represent the biophysical factors that affect the photosynthetic rates of forests. Micrometeorological data were measured every 30–60 s and stored by data-logger systems (CR5000) and (CR-10X), both Campbell Scientific, Inc., from which hourly averages were calculated (Vourlitis et al., 2011). The micrometeorological dataset used in this work is the same used in the study prepared by Vourlitis et al. (2011), whose data are previously validated. Technical details such as precision, accuracy, and calibration can be found in Vourlitis et al. (2011) and Moreira et al. (2017). All direct measurements used are listed in Table 1.
Table 1List of measured variables and instrumentation used at the micrometeorological tower (at Cláudia Municipality) and AERONET station in Alta Floresta. The flags [1], [2], and [3] indicate the instrumentation used in the flux tower, AERONET system, and Aqua space platforms (Terra), respectively. See Table S5 to access the dataset (Cirino et al., 2023).
2.2.3 Measures of flux and concentration of CO2
The eddy covariance system has been widely used to measure the net CO2 flux by the ecosystem. This system performs measurements by correlation of turbulent vortices from a sonic anemometer and an infrared gas chamber (infrared gas analyzer, IRGA), from which flux measurements of CO2 (carbon), water vapor (H2O), and energy (sensible heat – H – and latent heat – LE) are determined at high frequency, usually 10 Hz. The data generated and recorded by the eddy system, deployed in flux towers, are normally adjusted by compilation software such as Alteddy 3.90 (Alterra, WUR, Netherlands). The carbon flux data from these micrometeorological towers are presented using the classical sign convention in atmospheric science (negative flux indicates net ecosystem CO2 uptake).
2.3 Computing the effects of aerosols on NEE
2.3.1 Method to determine the net exchange of CO2 in the ecosystem
The NEE is obtained from the eddy covariance system. The eddy system provides CO2 flux measurements at 10 Hz from a sonic anemometer (CSAT-3, Campbell Scientific, Inc., Logan, UT) integrated with an open-path gas analyzer (LI-7500, LI-COR Inc., Lincoln, NE). For NEE calculation, the storage term S[CO2]p is obtained according to Aubinet et al. (2012) and Araújo et al. (2010). For S[CO2]p term calculation, we considered continuous measures of the CO2 concentration vertically arranged between the ground and the top of the tower (Vourlitis et al., 2011). Under these conditions, the NEE of CO2 is approximated by Eq. (1):
where FCO2 is called the “CO2 turbulent flux” calculated by the eddy system above the treetops (Grace et al., 1996; Burba, 2013), and S[CO2]p is the vertical profile of the concentration of CO2 or storage term (storage), considered a non-turbulent term measured at discrete levels z at thicknesses Δzi from near the ground surface to the point of measurement of covariance of turbulent vortices in the tower (Finnigan, 2006; Araújo et al., 2010; Montagnani et al., 2018). In this work, the vertical profile S[CO2]p was stratified into five reference levels (1, 4, 12, 20, and 28 m) (Vourlitis et al., 2011). Typical diurnal conditions consist of vector winds with speeds of 2.0 m s−1 and u* ≥ 0.20 m s−1 and predominant SSW and SE directions. Approximately 72 % of the accumulated flux originates within 1 km and the representativeness of the measured CO2 flux (footprint) is approximately 520 m (upstream of the tower), following the model proposed by Schuepp et al. (1990). The concentrations [CO2] were calculated following Aubinet et al. (2001) and Araújo et al. (2010), as reported by Vourlitis et al. (2011).
Pair is the atmospheric pressure (Nm−2), R is the molar constant of the gas (Nm mol−1 K−1), and Tair the air temperature in Kelvin (K).
We also calculated GPP from the NEE data and estimates of ecosystem respiration (Reco) obtained from the nighttime NEE (see Supplement S2.2); however, relationships between the atmospheric optical properties and NEE were qualitative similar to those using estimated GPP. Given the potential errors associated with estimating GPP and Reco from the NEE data (Reichstein et al., 2005), we decided to use the measured values of NEE in our analysis of the impact of atmospheric aerosols on land–atmosphere CO2 exchange.
2.3.2 Method to determine the solar irradiance of clear sky
The term clear sky was used here to designate the minimal influence of clouds and aerosols on the solar radiation measured by the pyranometer. To estimate the amounts of direct solar radiation to the surface under minimally overcast-sky conditions, the measurements SWia of the AERONET 2.0 system observed under clear-sky (cloudless) conditions were used: that is, AOD ≤ 0.10 (Artaxo et al., 2022), lacking fire plumes. Under these conditions, we get Eq. (3): a polynomial fit of order 4, here considered representative of the entire solar spectrum (Meyers and Dale, 1983). The model S0(t) obtained was used to derive the clear-sky instants at the surface (Fig. S7) between 07:00 and 17:00 (LT), according to the formulation below:
where S0(t) is the clear-sky solar irradiance as a function of time in W m−2. The parameters (a, b, c, d, e) are the coefficients of the polynomial curve, and t is the time (LT). Figure 2 shows the mean diurnal cycle of the SWia obtained from long-term aerosol measurements by the AERONET system under different pollution conditions. The plot illustrates the sensitivity of the method applied to determine the expected irradiance levels on the canopy forest (S0(t)) under varied atmospheric aerosol loads (AOD), as well as C2, C4, and C6 curves. Markers C1, C3, and C5 represent averaged observations between 07:00 and 17:00 used to fit C2, C4, and C6 curves.
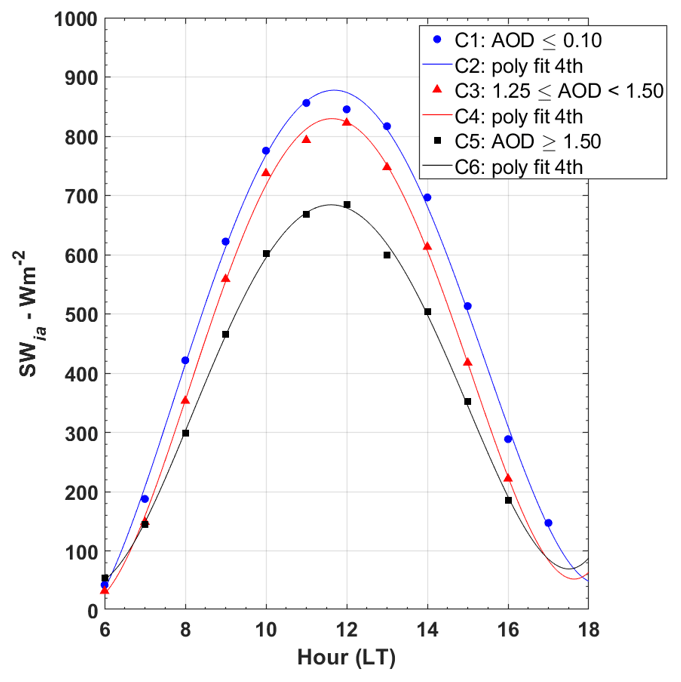
Figure 2Incident solar irradiance under different sky conditions in Alta Floresta (June 1997–March 2017): clear sky (C1 points and C2 curve, AOD ≤ 0.10) and polluted skies (C3 points and C4 curve, 1.25 ≤ AOD ≤ 1.50; C5 points and C6 curve, AOD > 1.50).
Our methods consider the cloud-screened database AERONET (Fig. 2). Using the long series of measurements of AODa, it was possible to obtain different curves S0(t) for each month of the year, considering the seasonal variations of the SWia given in Eq. (3). Figure S7 shows the seasonal variation of the S0(t) diurnal cycle throughout the year. The coefficients of the fit curves are listed in Table S1. To assess the consistency of the S0(t) model obtained by SWia AERONET dataset, we compared the outputs calculated by Eq. (3) with the clear-sky solar irradiance model available from Meteoexploration (Solar-Calculator). The Solar-Calculator is a free system used to compute the clear-sky solar irradiance, managed by the Meteoexploration company. The solar irradiance is calculated according to Bird and Hulstrom (1981), updated by Corripio (2003). The hyperlink for Solar-Calculator is listed in Table S5. We also state that our algorithm is not accurate enough to separate shallow clouds of biomass burning organic aerosol (BBOA) plumes. However, as the optical properties of deep clouds differ from aerosol (Palácios et al., 2020; Sinyuk et al., 2020), it is possible to distinguish them because the shading standard is notably different (Doughty et al., 2010). For example, deeper clouds often yield PAR(D)F∼1 (unit); meanwhile, high loads of BBOA are usually lower than < 1 (unit). In these conditions, the parameter f can be used as a sensible indicator of aerosol presence or entrance (Gu et al., 2003; Jing et al., 2010) but not to detect shallow clouds (translucent). In practice, the uncertainties for the radiative effects of aerosols on NEE are greater when PAR(D)F is near the unit. Thus, our algorithm cannot state the complete absence of clouds but is a crucial qualitative indicator of aerosols in the atmosphere when Sun photometers are not promptly available.
2.3.3 Determination of relative irradiance
In practical terms, the relative irradiance f expresses the relationship between incident solar radiation and that observed at the surface under a clear sky (AOD ≤ 0.10) and cloudless (f ≥ 1.0). It is a parameter indicating the presence of pollution plumes with aerosols that scatter solar radiation and clouds, generally used in areas without direct instrumentation of clouds. This parameter has been considered a key indicator in the detection of clouds and plumes of pollution from fires in the Amazon (Gu et al., 2001; Oliveira et al., 2007; Cirino et al., 2014). To this end, the observed amounts of SWi(t) on the forest canopy are normalized by the irradiance S0(t), thus determining the quotient f (a dimensionless parameter), according to Eq. (4). It is also highlighted that f can assume values as large as 1.2–1.3 (f∼ 20 %–30 %), typically due to the so-called “cloud gap effect” (Duchon and O’Malley, 1999; Gu et al., 2001). There is still no consensus on values in the literature about it. This term denotes the cloud-induced increase in surface irradiance. In general, there are multiple scatterings of solar radiation by the clouds around the study area but still outside the pyranometer's viewing angle. It will be seen in more detail a few sections ahead.
SWi(t) is the total incident solar irradiance measured by the pyranometer (W m−2) under any atmosphere and S0(t) is the clear-sky solar irradiance (W m−2) on a flat surface perpendicular to the Sun's rays, without the attenuating effects of the atmosphere (clouds and burned) for a given time and place, i.e., AODa≤0.10 (cloudless). Values close to zero represent cloudy and/or smoky-sky conditions, and values close to unity represent clear-sky conditions (Gu et al., 1999; Oliveira et al., 2007; Jing et al., 2010; Cirino et al., 2014; Gao et al., 2021).
Here, we used f as a basis for comparison to detect the joint presence of clouds and aerosols from fires over the study area since the experimental site does not have instrumentation for direct observation of cloud cover. Obtaining this parameter is extremely important because when using clear-sky solar radiation as a base, solar radiation measured under overcast skies becomes a new metric for observing cloudiness. This variable will be compared with the NEE to assess the photosynthetic responses of the ecosystem to variations in the external environment.
2.3.4 Determining the clarity index
To determine the brightness index kt the extraterrestrial solar irradiance Sext was first calculated depending only on orbital parameters. The index kt is a coefficient of proportionality between the measurements of direct solar radiation to the surface and Sext and expresses the direct solar radiation transmitted in the atmosphere (Gu et al., 1999; Cirino et al., 2014). In a first approximation, kt indicates the transmissivity, which is the degree of transparency of the atmosphere to solar radiation at a given time and place, while f is a parameter of comparison more sensitive to the presence of radiation-scattering aerosols and clouds. Here, kt and SZA were used as predictors of the diffuse component of radiation (Gu et al., 1999; Cirino et al., 2014). For the calculation of the irradiance Sext some parameters and variables are also needed such as the solar constant of the Earth (), the latitude of the location (φ), solar declination (δ), hour angle (h), and mean square distance between the Earth and the Sun (Gates, 1980). The determination of Sext takes into account the angle of incidence of the solar rays and therefore the variations in the amounts of solar radiation at the surface, modulated by the SZA. Under these conditions, kt can be expressed according to Eq. (5):
where SWi(t) is the shortwave radiation (W m−2) measured by the pyranometer (Table 1) and Sext the extraterrestrial solar irradiance (Wm−2) estimated on a surface perpendicular to the Sun's rays, without the attenuating effects of the atmosphere for a given time and place, expressed according to Eq. (6):
In this equation is the Earth's solar constant (≈ 1367 W m−2), is the average Earth–Sun distance (∼ 1.49×10⁶ km), D is the Earth–Sun distance on a given Julian day, and cos (z) in the cosine of the solar zenith angle (SZA), calculated as proposed by Bai et al. (2012). This calculated index was used to establish the diffuse solar radiation, as described in detail in the next section.
2.3.5 Determination of diffuse PAR
To determine the diffuse component of the total PAR (PAR(D)), we adopted the procedures of Spitters et al. (1986) and Reindl et al. (1990), widely used in the literature when there are no direct measurements of PAR(D) (Gu et al., 1999; Jing et al., 2010; Zhang et al., 2010; Bai et al., 2012). The detailed calculation can be found in Gu et al. (1999). The estimate is performed by deriving the diffuse PAR according to the formulation below (Spitters, 1986):
where PAR(D) is the incidence of the diffuse (total) PAR (µmol photon m−2 s−1) in the near-infrared range in a plane horizontal to the Earth's surface, while q is a coefficient of proportionality used to denote the ratio of the total diffuse radiation to a given amount of irradiance (SWi) at the surface given the sky conditions (W m−2). The parameter q is expressed considering ranges of variation for the index kt (Gu et al., 1999). To express the diffuse fraction of PAR (PAR(D)F) we use the relationship between PAR(D) and PARi (Spitters et al., 1986). In the absence of direct measurements of diffuse solar radiation, the procedures reported by these authors are still widely used (Jing et al., 2010; Cirino et al., 2014; Moreira et al., 2017).
2.3.6 Determining the efficiency of light use
Another important parameter in this study is the light use efficiency (LUE), which expresses the efficiency of light use in photosynthetic processes by the canopy and is defined as the ratio between NEE and PARi. Several other procedures have been used to approximate the LUE; some use the coefficient of proportionality between the NEE and the PAR(D) (Moreira et al., 2017), and others use temperature measurement directly on the leaf of the trees (LI-COR) to capture the photosynthetic response as a function of the variation in light intensity (Doughty et al., 2010). Canopy radiative transfer codes with a validated physical parameterization for different leaf types are also used (Mercado et al., 2009). Here, for practical reasons, we used the procedures applied by Jing et al. (2010) and Cirino et al. (2014), according to Eq. (8), where LUE is given in percentage values.
We also performed the same procedure with GPP, but as mentioned above our results with GPP were qualitatively similar to those obtained using NEE. Since NEE was measured directly we only assess LUE calculated from NEE.
2.3.7 Determining leaf canopy temperature
We used the parameterization proposed by Tribuzy (2005) to estimate leaf canopy temperature (LCT) obtained from field experiments carried out in central Amazonia 60–70 km NW from the center of Manaus-AM. Thermocouple temperature measurements on leaves provided a significant statistical relationship between PARi and RHair during both dry (July–August 2003) and wet seasons (December 2003–February 2004). The final equation (Eq. 9) obtained is expressed as a function of relative air humidity (RHair) and radiation (PARi), valid for dry and wet seasons:
where LCT is leaf temperature of canopy (∘C), and PARi and RUair are photosynthetically active radiation (µmol m−2 s−1) and relative humidity (%), respectively. Due to uncertainties and limitations underlying Eq. (9), we also used an alternative method based on the Stefan–Boltzmann equation (Eq. S1), following Doughty et al. (2010) and Cirino et al. (2014) (Figs. S9 and S10), with results discussed in Sect. S2.1
2.3.8 Determination of clear-sky NEE
The NEE observed on clear days (AOD ≤ 0.1 and clear) was also used as a basis for comparing days with high aerosol loading. Figure (3) illustrates the behavior of the NEE under clear-sky conditions (f ≈ 1.0) between 07:00 and 17:00 (LT). The obtained polynomial fits are used to determine the NEE0(SZA) as a function of SZA variations for each month of the year between June 2005 and July 2008 (Fig. 3). We list the curve coefficients in Table S2. The estimated curves and their goodness of fit are consistent with the behavior observed in previous studies (Gu et al., 1999; Cirino et al., 2014). We have used Eq. (10) to estimate the NEE0(SZA) throughout the year, considering the seasonal changes in biophysical factors, such as solar radiation, deciduousness, water, and heat stress, that may add time-dependent noise to the fitted model. Figure S8 shows seasonal changes in the NEE0(SZA) (hourly mean cycle).
NEE0(SZA) is the NEE typically found on clear-sky days (µmol m−2 s−1). The parameters p1, p2, and p3 are the coefficients of the polynomial curve equal to 0.0038, −0.99, and −12, respectively.
Like f, % NEE was used here as a basis for comparison for the maximum negative values observed during the study period, assuming the absence of water stress and nutrient deficiency (Gu et al., 1999; Oliveira et al., 2007; Doughty et al., 2010; Cirino et al., 2014).
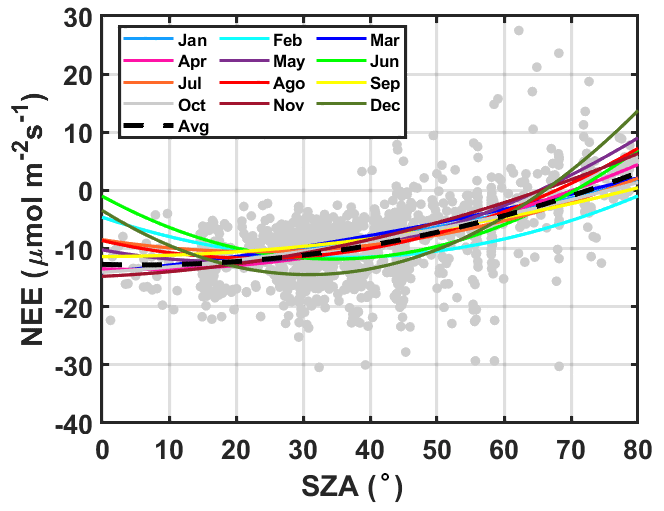
Figure 3The NEE monthly changes as an SZA function for clear-sky conditions (f ∼ 1.0) from 07:00–17:00 (LT) between June 2005 and July 2008. Fitted curve coefficients NEE0(SZA) are listed in Table S2. The dotted black line is the annual average curve for NEE0(SZA).
Changes in observed NEE versus NEE under clear-sky conditions were used to determine the percentage effect of aerosols on NEE. The % NEE was calculated by the following relationship (Bai et al., 2012; Gu et al., 1999; Oliveira et al., 2007):
To eliminate solar elevation angle interference in the analysis of changes in % NEE versus f, we grouped the data into SZA ranges of 20–25∘.This interval was small enough to minimize the effects of solar uplift during the day and to represent changes in NEE as a function of f in response to aerosols and/or clouds alone. This interval also ensured sufficient sample size for statistical analyses. SZA intervals smaller than 15∘ significantly reduced the sample size, making it impossible to develop a robust statistical analysis (Gu et al., 1999). Values above 50 or around 0 (solar angles very close to the horizontal and vertical plane, respectively) were generally very contaminated by clouds (Gu et al., 1999; Cirino et al., 2014).
2.4 Data analysis procedures
Computational routines were developed for compilation, certification, organization, and analysis of the variables presented in Table 1. We performed fitting curves and mathematical or statistical calculations with the packages available in MATLAB (2013). For data quality control, nonphysical values outside acceptable levels were excluded from the database, resulting in a loss of 3 % of the total set of valid measurements (approximately 3600 sampled points). We exclude unexpected maximum and minimum values for the region, e.g., values below and above 20–40 ∘C, 40 %–95 %, ± 40 (µmol m−2 s−1), 0–1000 (W m−2), and 0–3000 (µmol photon m−2 s−1) for Tair, RHair, FCO2, SWi(t), and PARi, respectively. Data analysis consists of three fundamental steps: (1) variation of solar radiation with optical depth AODa analyzed as a function of irradiance f; (2) effects of aerosols and clouds on the net exchange of CO2 at the forest–atmosphere interface; and finally (3) quantification of photosynthetic performance as a function of pollution loads and analysis of how pollution loads affected biological critical or optimal values for environmental factors such as Tair, LCT, and VPD (vapor pressure deficit). Photosynthetic performance, in all cases, is analyzed as a function of NEE. In the end, the net percentage variation of the photosynthetic activity of the forest (% NEE) is evaluated as a function of the irradiance f. Nonlinear regression was used to determine functional relationships between NEE and other radiation variables. The relationships found are evaluated from the Poisson correlation and tabulated in terms of basic descriptive statistical parameters such as the coefficient of determination (R2) and significance level (Pvalue) with confidence intervals of 95 %. Basic descriptive statistics are also applied to the data to obtain mean values, medians, percentiles, and standard deviations for the measured and estimated variables. Table 2 lists indirect variables, calculated from the dataset listed in Table 1.
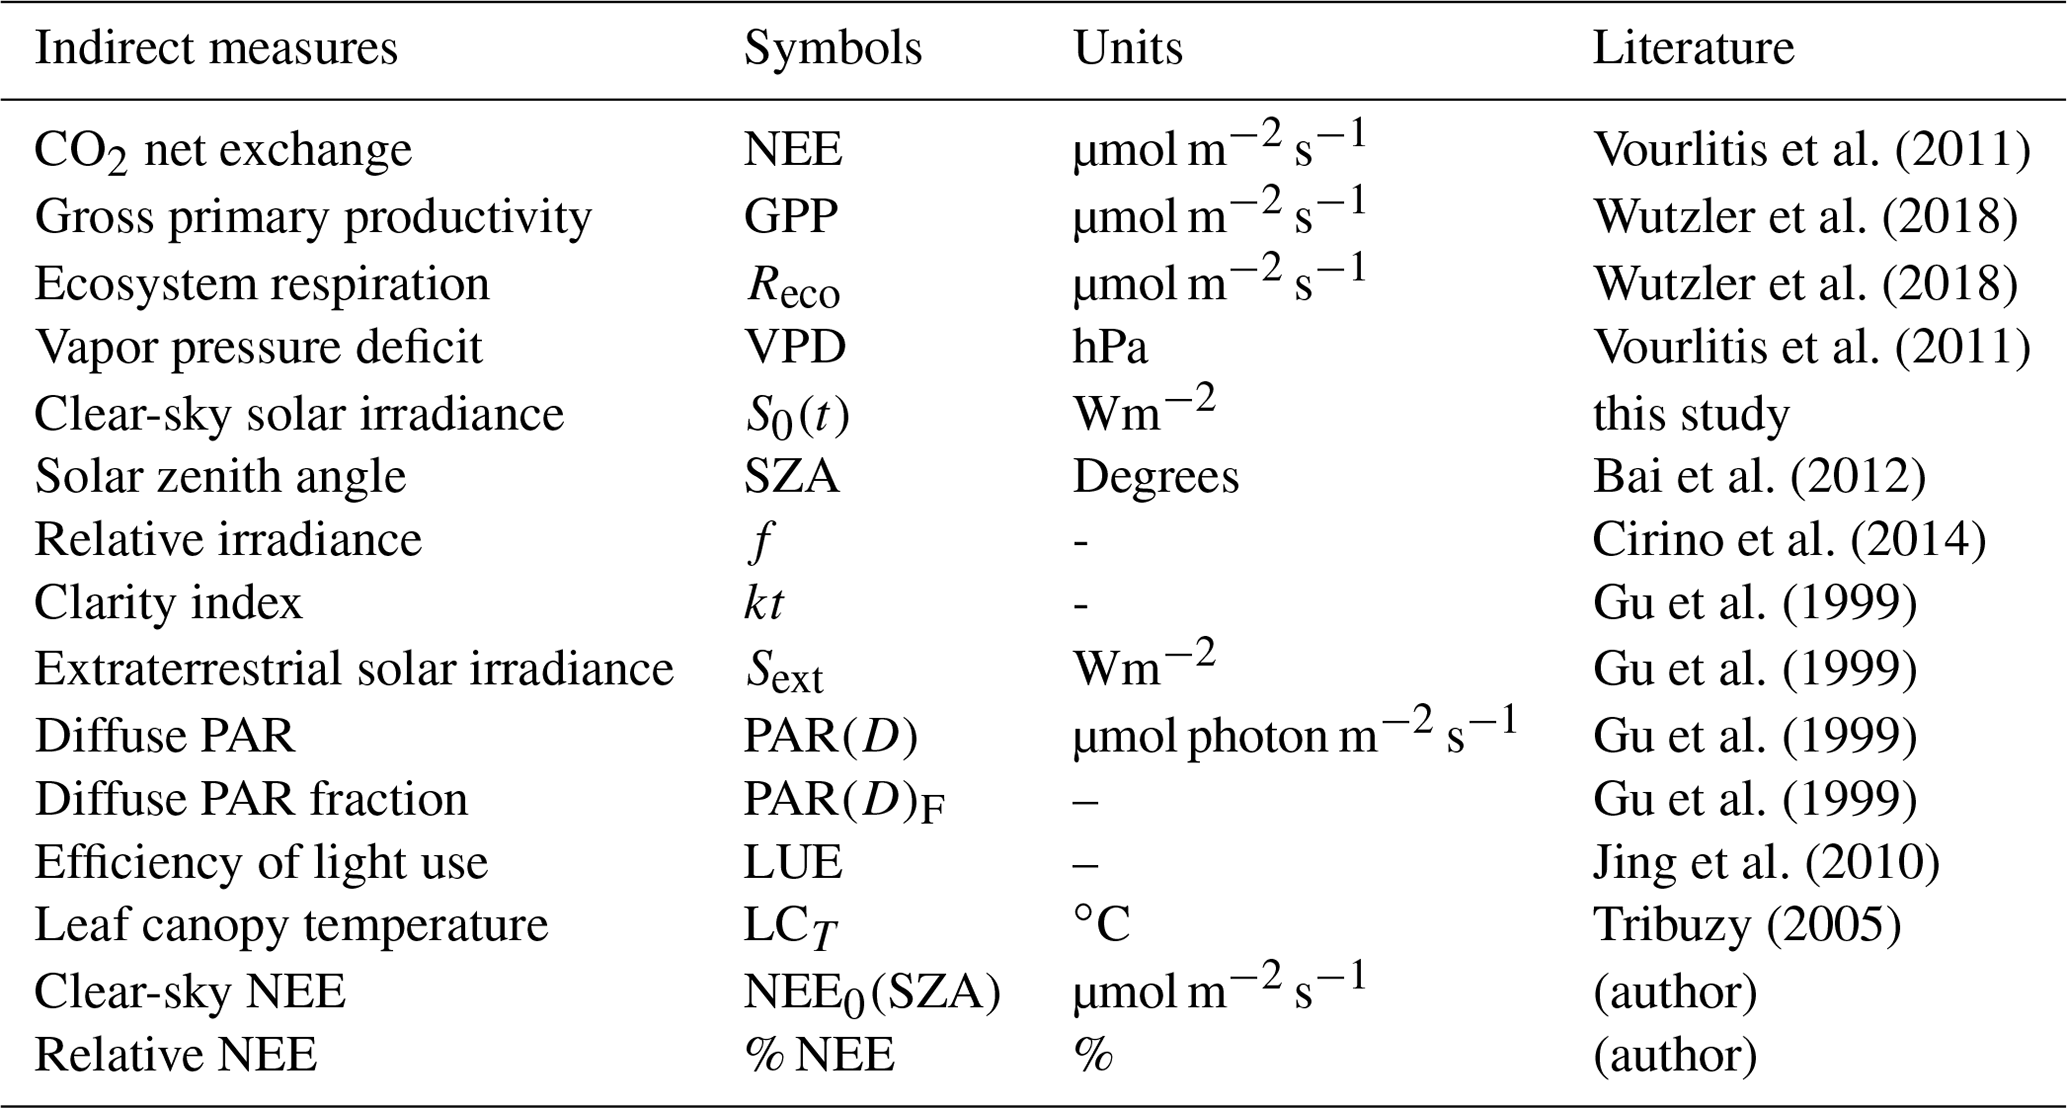
Vourlitis et al. (2011)Wutzler et al. (2018)Wutzler et al. (2018)Vourlitis et al. (2011)Bai et al. (2012)Cirino et al. (2014)Gu et al. (1999)Gu et al. (1999)Gu et al. (1999)Gu et al. (1999)Jing et al. (2010)Tribuzy (2005)Table 2List of indirect (calculated) variables, symbols, and measurement units of derived quantities according to the cited body of literature.
3.1 Average daily cycle of net exchange of CO2
The average daily pattern of NEE observed in 2005–2008 (Fig. 4) follows the typical pattern of tropical forests (Gu et al., 1999; Niyogi et al., 2004; von Randow et al., 2004; Araújo et al., 2010; Vourlitis et al., 2011). Figure 4 shows maximum negative fluxes averaging −13.7 ± 6.2 µmol m−2 s−1 around 10:00–11:00 (LT), and the maximum positive fluxes average +6.8 ± 5.8 µmol m−2 s−1 during the night period between 19:00 and 05:00 (LT). We observed a slight difference in the pattern of the daily cycle of the NEE between the wet and dry seasons (Fig. 4), with a shift (an advance) in the peak absorption of CO2 from the wet to dry season, from about 12:00 (LT) to 10:00 (LT), respectively (Fig. 4). Our estimates of CO2 absorption were about 10 %–15 % lower (i.e., less negative) during both seasons (< 0.6 µmol m−2 s−1) when compared to Vourlitis et al. (2011). We hypothesize that seasonal variations in water availability, nutrients, radiation, temperature, VPD, and pollution are counterbalanced throughout the year, producing an average seasonal behavior without significant differences in NEE.
Furthermore, different approaches in both studies can also explain the differences, i.e., analyses performed on different timescales. For example, Vourlitis et al. (2011) reported average NEE of CO2 values from daily and monthly time series. Similar monthly variations, with more negative magnitudes during the day in the rainy months (−9.0 µmol m−2 s−1 between November and February) and less negative during the light hours in the dry months (−7.7 µmol m−2 s−1 between May and August), were observed. The general balance of NEE revealed net carbon uptake of −0.12 and −0.18 µmol m−2 s−1 during the wet and dry seasons, respectively. The maximum rates of photosynthesis and leaf canopy respiration were observed in October–November, which are the first months of the rainy season.
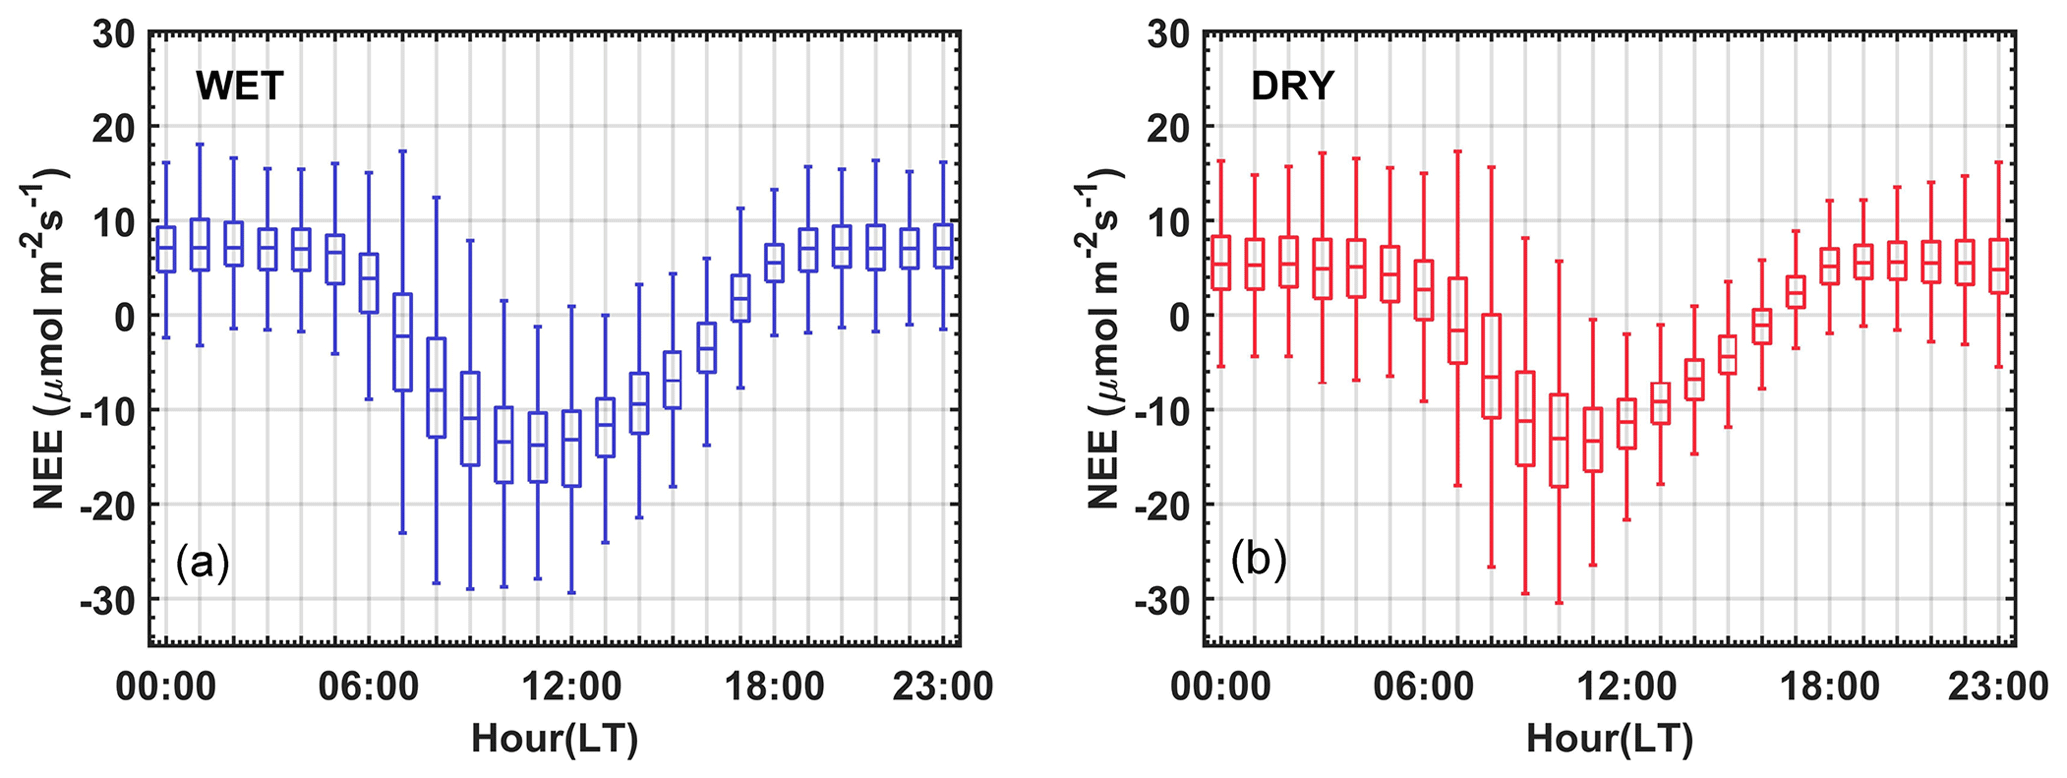
Figure 4NEE average hourly cycle between June 2005 and July 2008 during the rainy (a) and dry (b) seasons for the semideciduous forest in the Cláudia municipality. No filters are applied. The NEE is presented for any sky conditions during the year. We used the box plot to represent the distribution of CO2 flux data. The vertical bars are the maximum and minimum values. The lower and upper limits of the boxes respectively represent the 25th and 75th percentiles, whereas the horizontal blue and red lines represent the median of the CO2 flux data.
3.2 The influence of aerosols on shortwave solar radiation
The impact of aerosol particles from fires on the SWi flux is evaluated as a function of f, AODa, SZA, PAR(D)F, and PARi. Figure 5a shows the behavior of the relative irradiance f for different levels of AODa pollution in the SZA ranges between 20 and 50∘. A close and statistically significant relationship between f and AODa is observed with p value < 0.01 and a coefficient of determination R2 ≈ 0.92 (Table 3). An approximately linear relationship is observed in which f decreases by about 40 %–60 % when the AODa varies from 0.10 to 5.0, and no statistically significant difference was observed between mornings and afternoons. There is only a slight increase of ≈ 5 %–20 % (on average) in the value of f between late mornings and afternoons, attributed here to the multiple scattering of solar radiation due to the formation of clouds near the tower (Gu et al., 2001). For SZA angles between 20 and 50∘, there is a strong reduction in SWi (225 ± 50 W m−2) associated mainly with the increase in the concentration of aerosols emitted by local fires or transported regionally during the burning season. Oliveira et al. (2007) and Cirino et al. (2014) reported results about 2–3 times lower for 20 %–30 % reductions in f and AOD increase from 0.1 to 0.8 in FLONA-Tapajós (Santarém-PA) and the central Amazon (K34) in Manaus-AM.
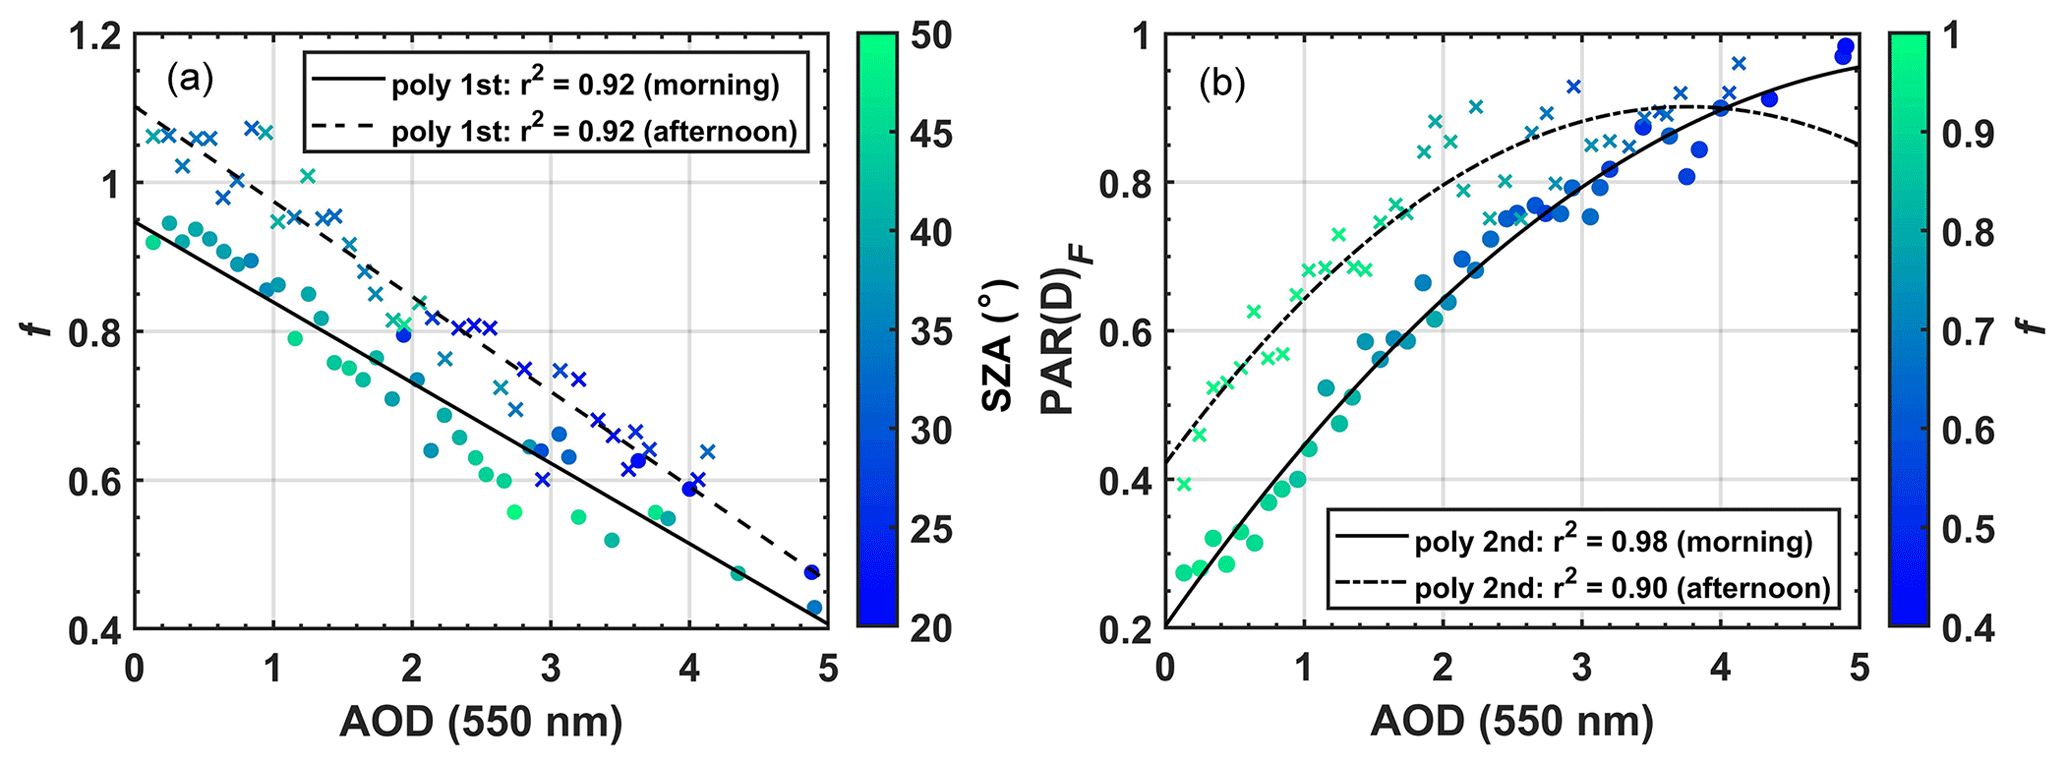
Figure 53D correlation between f and PAR(D)F with increasing AODa for different values of SZA (a) and irradiance f (b) in a semideciduous forest in the Cláudia municipality 50 km northeast of Sinop-MT (2005–2008). Means are presented as clustered (bin) points, quantified and determined in terms of standard deviation (SD) for each bin (SD shown in Table 3).
Figure 5b shows the fraction of diffuse radiation calculated as a function of AODa, with a close statistical relationship observed (R2=0.98 and 0.96) for the morning and afternoon hours (Table 3). Due to the reduction in the instantaneous fluxes of SWi an increase of up to about 85 % in diffuse radiation is observed when the AODa increases from 0.10 to 5.0. These results are consistent with previous studies carried out in the Brazilian Amazon (Doughty et al., 2010; Cirino et al., 2014; Rap, 2015; Moreira et al., 2017; Malavelle et al., 2019; Bian et al., 2021) and around the world (Niyogi et al., 2004; Jing et al., 2010; Rap, 2015; Rap et al., 2018) and prove to be particularly important due to the ability of PAR(D) to penetrate more efficiently into the leaf canopy and, under certain conditions, increase ecosystem in carbon uptake.
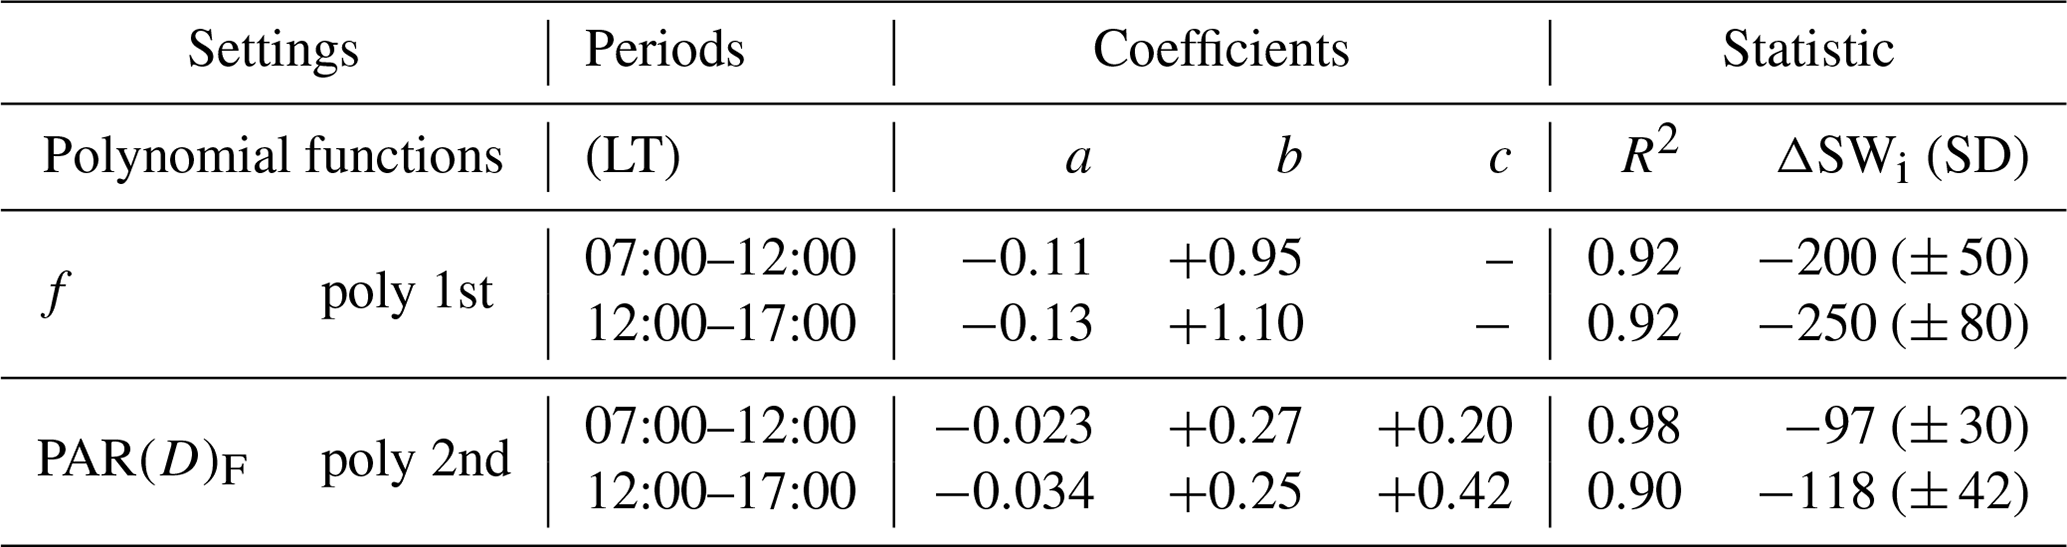
Table 3Polynomial adjustments (Fig. 5), coefficients, and statistics for the morning and afternoon periods at the micrometeorological tower in Cláudia-MT (2005–2008). R2 is the correlation coefficient, ΔSWi is the incident shortwave radiation amount, and SD is the standard deviation.
3.3 The influence of aerosols on diffuse radiation
Figure 6 shows the behavior of PARi and PAR(D) as a function of f and SZA. For reductions in f of ≈ 40 % (f ranging from 1.0 to 0.6) there were strong reductions in PARi (∼ 750 µmol m−2 s−1) and a corresponding 55 % increase in diffuse radiation PAR(D) (∼ 600 µmol m−2 s−1) between July and December. These numbers indicate a strong reduction in PARi as pollution levels increase and change from clear-sky conditions (AOD ≤ 0.10, f ∼ 1.0) to aerosol smoky-sky conditions of fires (AOD ≫ 0.1, f ≪ 1.0). Figure 6a shows an almost linear decrease between PARi and f; meanwhile, the behavior of PAR(D) versus f is nonlinear (Fig. 6b). The polynomial fits, coefficients, and inflection points are displayed in Table 4. PAR(D) reaches maximum values (779–1080 µmol m−2 s−1) for f between 0.63 and 0.66 (reductions of 37 %–34 %) and SZA ranges of 20–40∘. The negative variations in f also suggest a high pollution load for fires at the site (AOD ≫ 0.10), producing statistically significant reductions of up to 35 % in the PAR flux (Figs. 6a and 5a) and a 50 % increase in PAR(D)F (Figs. 6b and 5b).
Table 4Polynomial adjustments (Fig. 6), coefficients, and statistics for the morning and afternoon periods at the micrometeorological tower in Cláudia-MT (2005–2008). Cp (xv,yv) is the critical point of the fit curve, where the derivative is equal to zero.
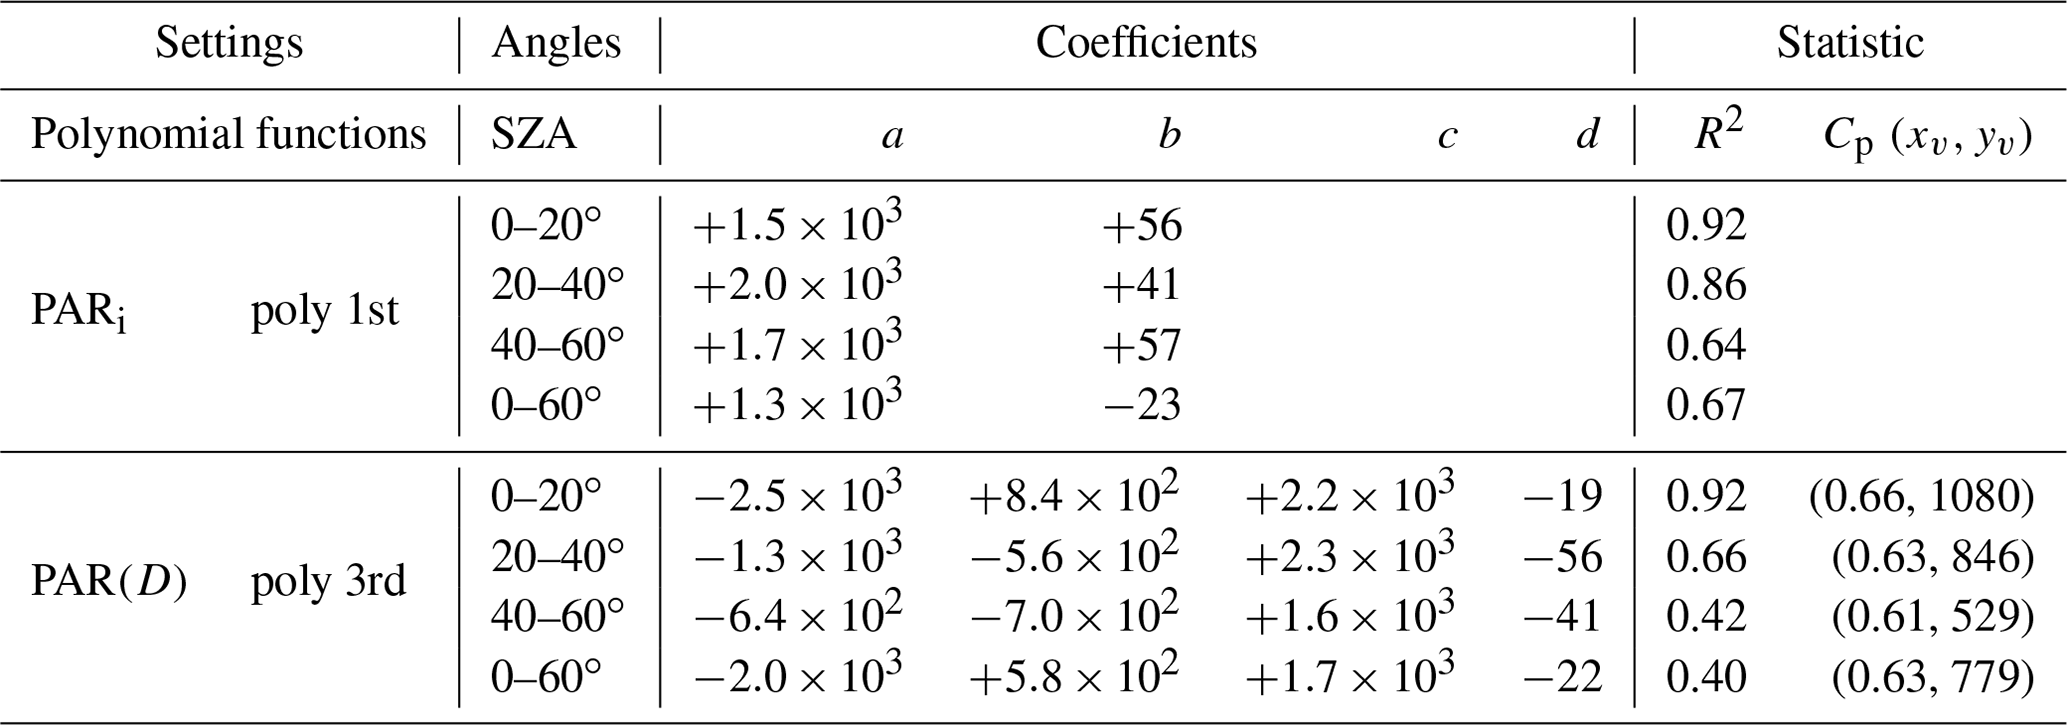
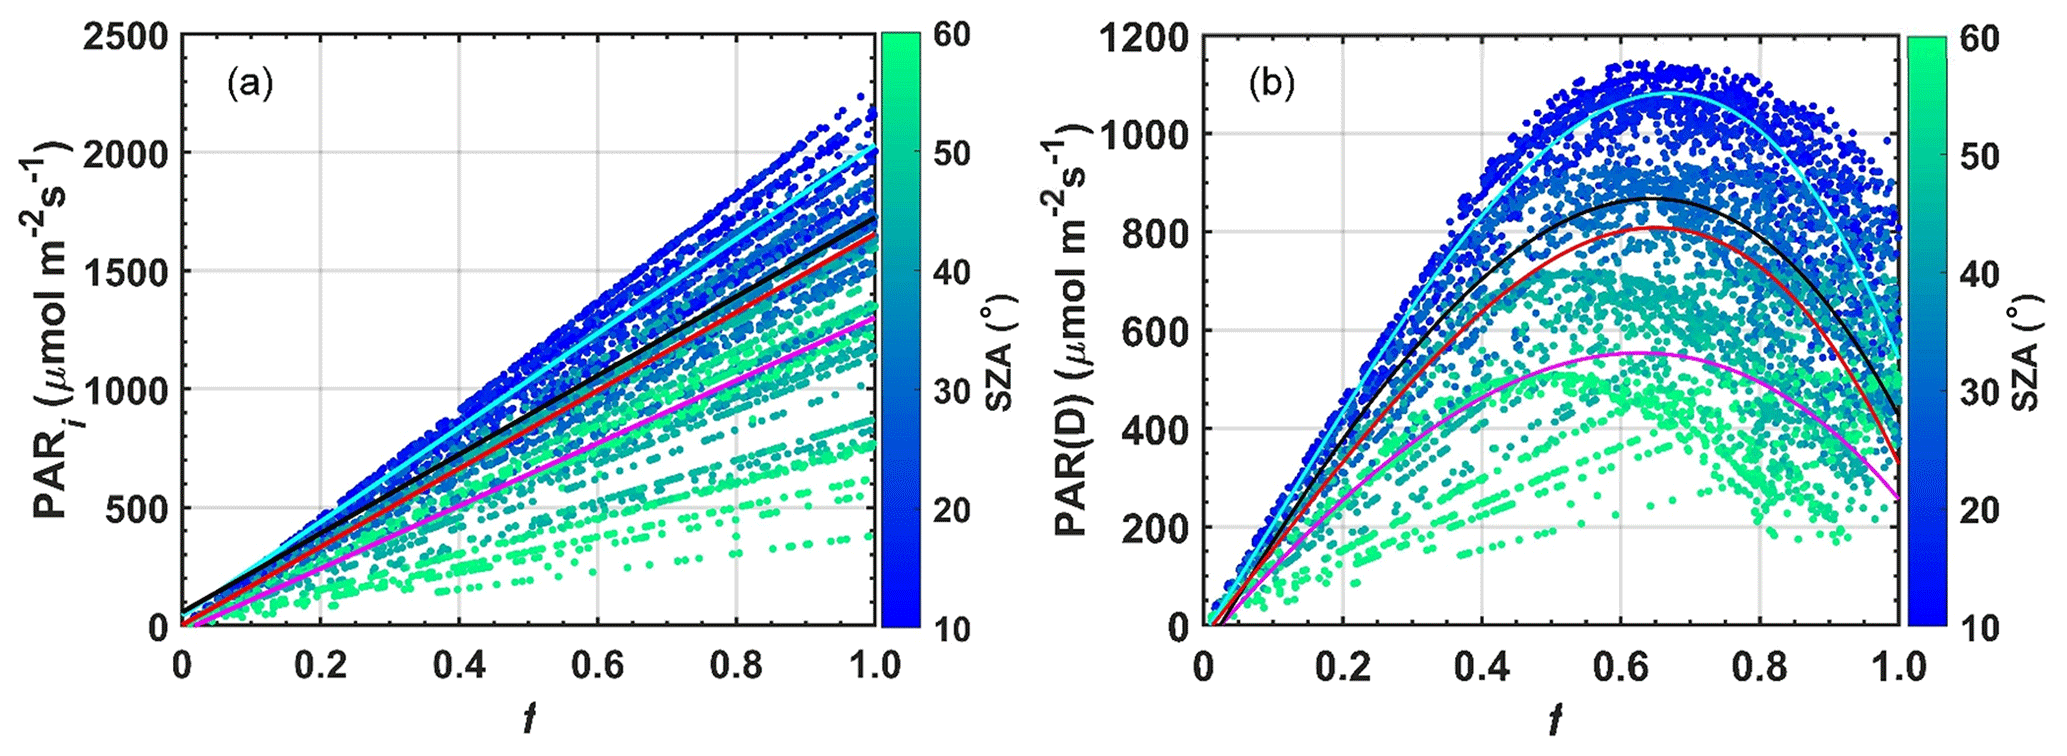
Figure 63D correlation between f, PARi (a), and PAR(D) (b) for different SZA values. The blue, black, magenta, and red lines are the polynomial curves adjusted to the analyzed SZA variation ranges, respectively equal to 0–20, 20–40, 40–60, and 0–60∘ in semideciduous forest in the Cláudia municipality 50 km northeast of Sinop-MT (2005–2008).
For SZA < 40∘, higher variation rates are observed for PAR(D) f−1, indicating the entrance or presence of plumes of pollution and clouds over the measurement tower's pyranometer. Table 4 shows a slight shift of the tipping points (Cp) towards smaller values of f (∼ 1.0–0.60), as well as an accentuated increase in PAR(D) (50 %, ∼ 400–500 µmol photon m−2 s−1). These results are likely due to greater optical thickness of the atmosphere at the beginning and end of the day and a higher aerosol concentration (BBOA). Here, we raise two reasonable hypotheses: (1) a lower PBL (planetary boundary layer) favors a higher BBOA concentration over the tree canopy, usually between 06:00 and 09:00 (LT) (SZA < 75∘), and (2) a thicker PBL provides deeper clouds and higher shading on the canopy (Oliveira et al., 2020), favoring the dispersion of fires (Nepstad et al., 2014) and intensifying the BBOA concentration locally by advection or particle regional transport (Figs. 1, S4–6). For a given period of the year, under stable meteorological conditions, BBOA can explain changes in PAR(D), at least on an hourly basis, especially between May and October when evapotranspiration is higher than rainfall (ET > PRP) (Vourlitis et al., 2002, 2011) and the deeper cloud cover fraction is often lower. In the other months of the year, clouds and aerosols mix, producing radiative effects that are inseparable considering our instrumentation and the dataset available in the area studied.
The 50 % increase in PAR(D) can be mainly attributed to radiation-scattering particles (BBOA), especially during the dry season (Shilling et al., 2018; de Sá et al., 2019), and indeed cloud cover. In fire seasons, about 80 % of BBOA is composed of fine particles (PM2.5) (Bian et al., 2021), 10 % of which is BC (black carbon) and BCr (brown carbon), by which both single-scattering albedo (SSA) and AOD can be affected. In general, these particles have the potential to heat the atmosphere (absorption greater than reflection), producing values that may be above the optimal physiological thresholds of the ecosystem and influencing CO2 absorption rates (maximum negative NEE). It is also possible that there is a mix of other kinds of particles from long-range transport with complex chemical properties, e.g., urban aerosols and African BBOA (de Sá et al., 2019; Holanda et al., 2023).
3.4 The indirect effect of aerosols on the use of light efficiency by the forest
There was a well-defined monthly variation of AODa, as shown in the previous sections. Since fires are the main cause of changes in the physical and chemical composition of the atmosphere throughout the year (Martin et al., 2010b, a; Artaxo et al., 2013, 2022), statistically significant reductions were found for the SWi and PARi. This section mainly evaluates the optimal levels of PARi as well as the effects of changes in the efficiency of solar radiation use by the forest (LUE ≈ NEE PARi). The analyses are performed as a function of PAR(D), from which the maximum efficiency of light use for the studied semideciduous forest is determined. Under smoky-sky conditions (AOD ≫ 0.10), carbon assimilation gradually increases with increasing PARi, reaching maximum saturation around 1550 and 1870 µmol m−2 s−1 in the range between 20 and 50∘ SZA, values for which the maximum NEE (negative) is approximately −23 µmol m−2 s−1. Under clear-sky conditions, considering the same SZA range, the maximum negative NEE is about around −18 µmol m−2 s−1, which occurs with a PARi of 2100–2300 µmol m−2 s−1 (Fig. 7a). To complement this analysis, the LUE flux was normalized by PAR(D)F during days with high aerosol loading in the burning season (Fig. 7b). Under these conditions, the forest reaches maximum NEE fluxes on smoky days and not under clear-sky conditions. The results reveal that smaller amounts of energy are needed for the forest to reach maximum saturation on non-polluted days. The analyses presented in Fig. 7 confirm greater photosynthetic efficiency under smoky-sky conditions for the studied semideciduous forest ecosystem; results are compatible with field observations (Oliveira et al., 2007; Doughty et al., 2010; Cirino et al., 2014) and numerical modeling in the Amazon (Rap, 2015; Moreira et al., 2017; Malavelle et al., 2019; Bian et al., 2021) and the world (Rap et al., 2018).
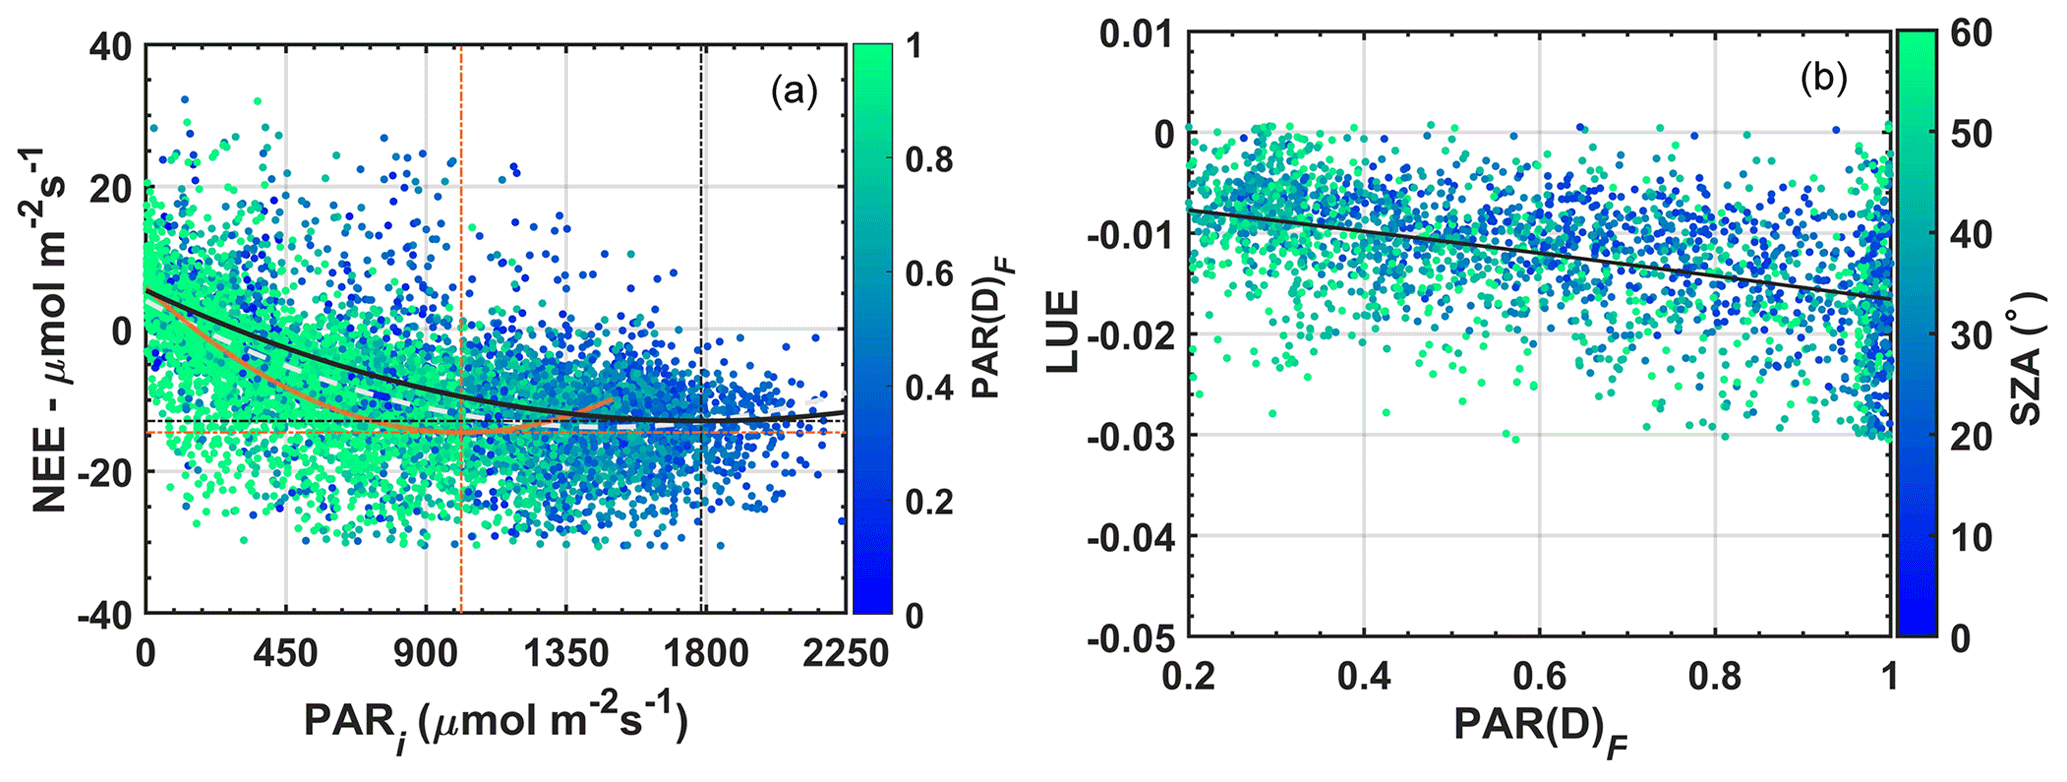
Figure 7NEE as a function of PARi for measurements between 08:00 and 17:00 (LT) (a). In panel (b) LUE is a function of the fraction of PAR(D)F (R2=0.21, the value of p < 0.001) for an area of semideciduous forest located in the municipality of Cláudia-MT 50 km north of Sinop between June 2005 and July 2008. The orange and black lines respectively denote observations PAR(D)F≥0.60 and observations f∼1.0 (clear-sky conditions). The orange and black vertical lines indicate the global minima of the polynomial curves.
Due to the physicochemical nature of the BBOA and its intrinsic properties (Cirino et al., 2018; Adachi et al., 2020), the PAR(D) affects the NEE and the functioning of several Amazon forest ecosystems (Rap, 2015; Rap et al., 2018; Bian et al., 2021), especially where tree species adapted to low light conditions occur, for example in the leaf sub-canopy of Amazonian forests (Mercado et al., 2009).
Photosynthetic efficiency (LUE), closely linked to the canopy's ability to convert solar energy into biomass, is ∼ 1 %–2 % for the studied forest, indicating loss or rejection of a large part of the solar energy available for photosynthesis. However, for high values of PAR(D)F, close to 1.0, peaks of up to 3 % in LUE are observed. In situations in which the diffuse fraction has maximum values, the values of AODa are on average < 1.0 and f ≪ 1.0. These findings corroborate previous analyses and reinforce the presence of radiation-scattering aerosols emitted by the fires over the studied area. It is noteworthy that changes in PAR(D)F (Fig. 7b) express proportional changes in PAR(D).
Although there is great uncertainty (high standard deviation) in the behavior of LUE with increasing PAR(D), there is a gradual, approximately linear increase in the values of LUE in the range of PAR(D)F between 0.20 and 1.0. This behavior is peculiar to tall vegetation with a generally leafy canopy of tropical forests, which are more sensitive to the transfer of PAR(D) from the top canopy to the bole. In short-stature vegetation, as in the semiarid region of northeast China (e.g., grasses), the LUE remains approximately constant even for high values of PAR(D) generated by aerosols and clouds (Jing et al., 2010). Overall, however, the LUE is low for many vegetation types, typically between 1 % and 3 %.
3.5 The net absorption of CO2 due to aerosols from fires
Figure 8 shows the relative changes in the NEE during all months of the year, discounting confounding factors due to the seasonality, i.e., monthly changes in variables that strongly affect photosynthetic rates. Three essential reasons reinforce the use of the whole year in these analyses: (1) the wet season contains about 15 %–20 % of the wildfires detected during the dry season (Table S4). We observed numerous hotspots of fires around the area of the study, i.e., BBOA sources emitted locally and transported regionally (Fig. S5). (2) The relative contribution of BBOA during the wet season is relatively small but contributes to improving the sample space, considered a critical aspect to the study. (3) Removing or maintaining transition and rainy periods in the analyses does not change the scientific direction of the results initially found in Fig. 8b (see Figs. S11–12).
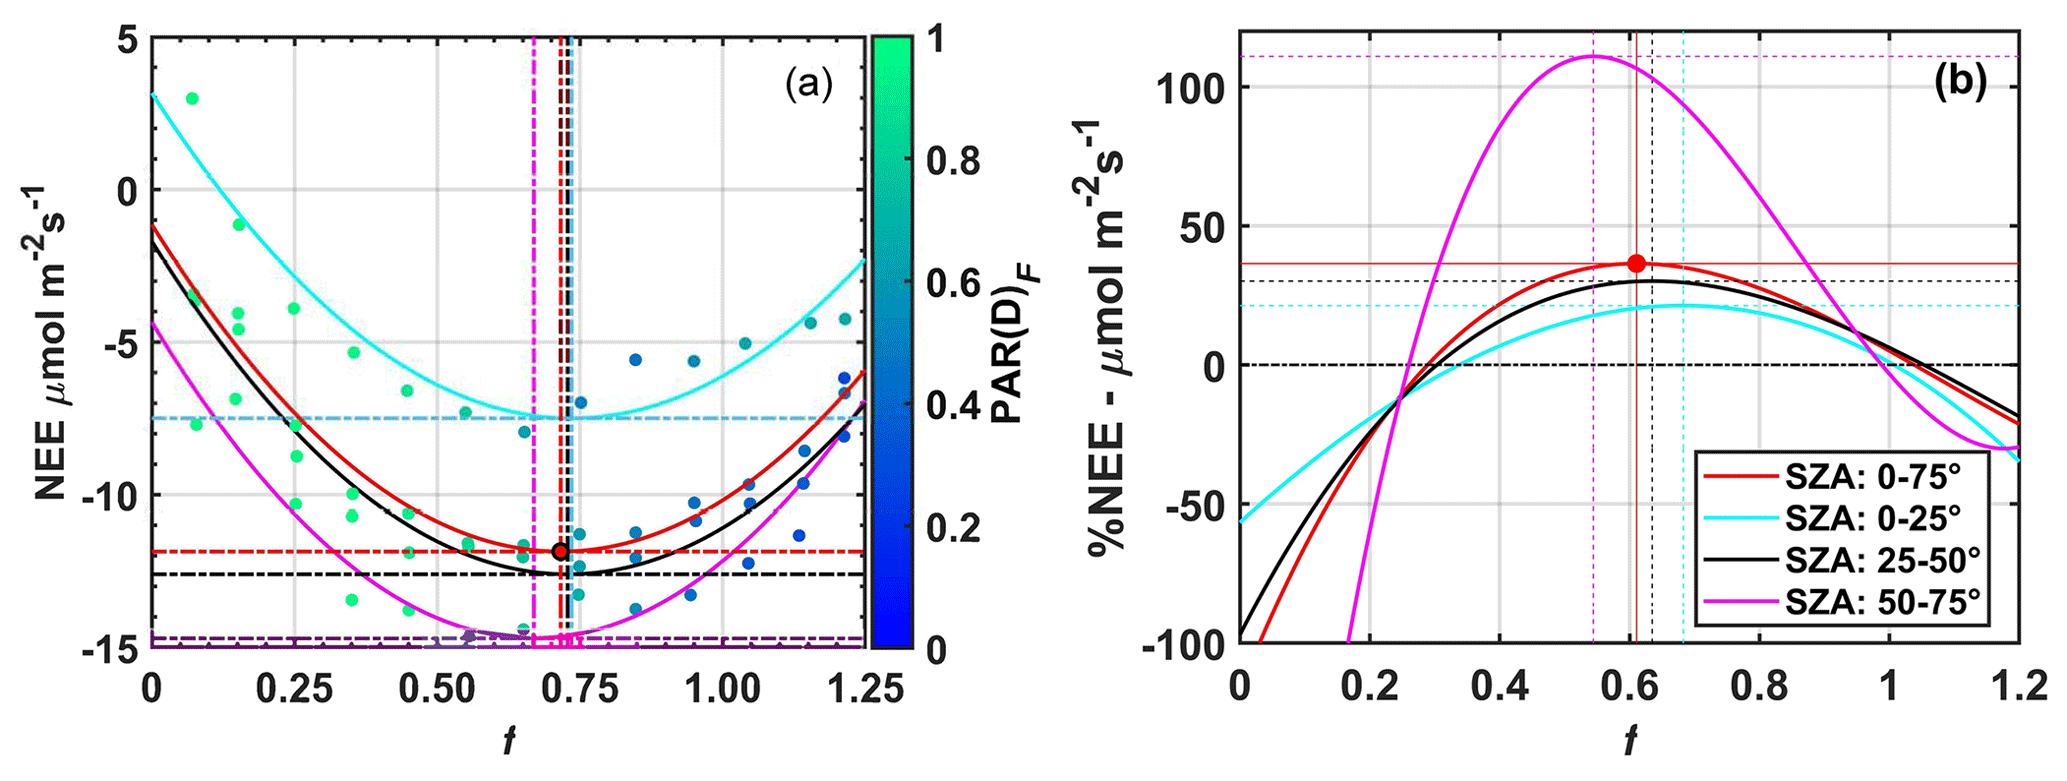
Figure 8Variability of NEE with f for various SZA ranges in (a). The % NEE as a function of the irradiance f for the same SZA intervals is shown in (b). The % NEE is calculated from Eq. (11), corrected with the NEE0(SZA) computed from the fit curves presented in Table S2. These graphs include the effects of aerosols in the experimental area of Cláudia-MT between 2005 and 2008.
3.5.1 Seasonality of biophysical factors on NEE
To reduce the effect due to the seasonality of biophysical factors strongly driven by the change in weather conditions during the year (e.g., water stress, deciduousness, ecosystem respiration), we normalized Eq. (11) by the clear-sky NEE adjusted to each month of the year (Fig. S8 shows average monthly changes found in the period 2005–2008). These adjustments better support our assumptions regarding the derived quantities described in the “Materials and methods” section. In fact, we observed a relative average increase of 30 % in the % NEE to SZA ranging from 0–75∘ after applying these corrections compared with a single curve for all years. SZA ranging 0–20∘ and enhancement up to 70 % in the % NEE were observed. Since many studies do not take these corrections into account, these results suggest that the impacts of BBOA on the NEE could be even more significant than previously known, especially in the central (Manaus, K34) and western Amazon (Ji-Paraná, RBJ) (Oliveira et al., 2007; Cirino et al., 2014; Rap, 2015; Moreira et al., 2017).
Equations (11) and (4) allowed us to evaluate the behavior of the ratio between the % NEE and the irradiance f for intervals of SZA from 0–75∘. This procedure was adopted to minimize the effects of solar elevation and air temperature on the NEE flux throughout the day (Gu et al., 1999; Cirino et al., 2014). The intervals every 25∘ ensured the smallest possible SZA variations and the largest possible number of points within the sample space necessary for statistical analyses. For each SZA interval analyzed, the average % NEE was evaluated in bins of f equal to 0.1, calculated separately (Fig. 8). The critical points and the coefficients of curves for all data (between 0 and 75∘ SZA) are shown in the Supplement (Fig. S11, Table S3). An average (absolute) increase of approximately 7.0 µmol m−2 s−1 in carbon uptake was observed relative to clear-sky conditions when f varied from 1.1–1.0 to 0.66; results for the SZA range between 0 and 75∘ (Fig. 8a). The 7.0 µmol m−2 s−1 increase represents a 20 %–70 % increase in NEE flux. This increase, strongly linked to the increase in aerosol concentration by fires, is mainly explained by the 50 % increase in PAR(D)F (≈ 450 µmol m−2 s−1) with respect to PAR(D) and the 35 %–40 % reduction in the irradiance f when the AODa varies from 0.10 to 5.0, as shown in Fig. 5b.
Oliveira et al. (2007) and Cirino et al. (2014) showed a relative increase of about 30 % in NEE for f values ranging from 1.1 to 0.80. These studies showed that the increase in carbon uptake in the presence of aerosols and clouds becomes smaller and is similar in both locations for SZA bands < 20. Solar radiation suffers from less scattering near the zenith (SZA ∼ 10∘) due to particles suspended in the atmosphere and the narrowing of the optical path, reducing the effects of diffuse radiation on the photosynthetic process. These results, in particular, are repeated for the studied semideciduous forest of Mato Grosso, but a strong increase of 70 % in % NEE is observed for lower SZA ranges (between 50 % and 75 %) in the early hours of the day between 08:00 and 10:00 (LT), while in the Jaru Biological Reserve (JBR) the biggest increases are concentrated in the SZA ranges between 10 and 35∘ close to midday or in the morning–afternoon (Oliveira et al., 2007). At K34, in Manaus, the maximum absorptions and the maximum % NEE that occur do not exceed 20 % and the effects of aerosols and clouds operate together. The individual radiative influences of clouds and aerosols are difficult to quantify because satellite AOD observations have a low temporal resolution. Similar results were observed by Doughty et al. (2010) in FLONA-Tapajós, central Amazon. In general, higher standard deviations are found in regions most heavily impacted by aerosols (Oliveira et al., 2007; Cirino et al., 2014; Rap, 2015), such as Ji-Paraná (RO) and Alta Floresta (MT). Because aerosol concentrations are relatively lower in FLONA-Tapajós (PA) and Manaus (AM), the standard deviations are lower (Oliveira et al., 2007; Doughty et al., 2010; Rap, 2015). Theses deviations can be found in previous studies published by Oliveira et al. (2007) in FLONA-Tapajós (PA), Cirino et al. (2014) in Manaus (AM), and Ji-Paraná (RO).
Table 5 lists the coefficients of the adjustment found for NEE and % NEE as a function of f for each of the SZA ranges considered. We identified the optimal and critical radiation conditions for carbon uptake between 07:00 and 17:00 (LT) and listed them below. As mentioned before, tipping points (Cp) represent the so-called physiological optimums. Our results show a substantial decrease (increase) that is significant statistically in NEE (% NEE) as a function of f from −7.5 to −14.7 µmol m−2 s−1 and 1–0.63 (≈ 40 %) when SZA ranges from 0–25 to 50–75∘, respectively (R2 ≥ 0.85).
Table 5Polynomial adjustments (Fig. 8), coefficients, and statistics for the periods between 07:00 and 17:00 (LT) at the micrometeorological tower 50 km from Sinop-MT in the municipality of Cláudia between 2005 and 2008.
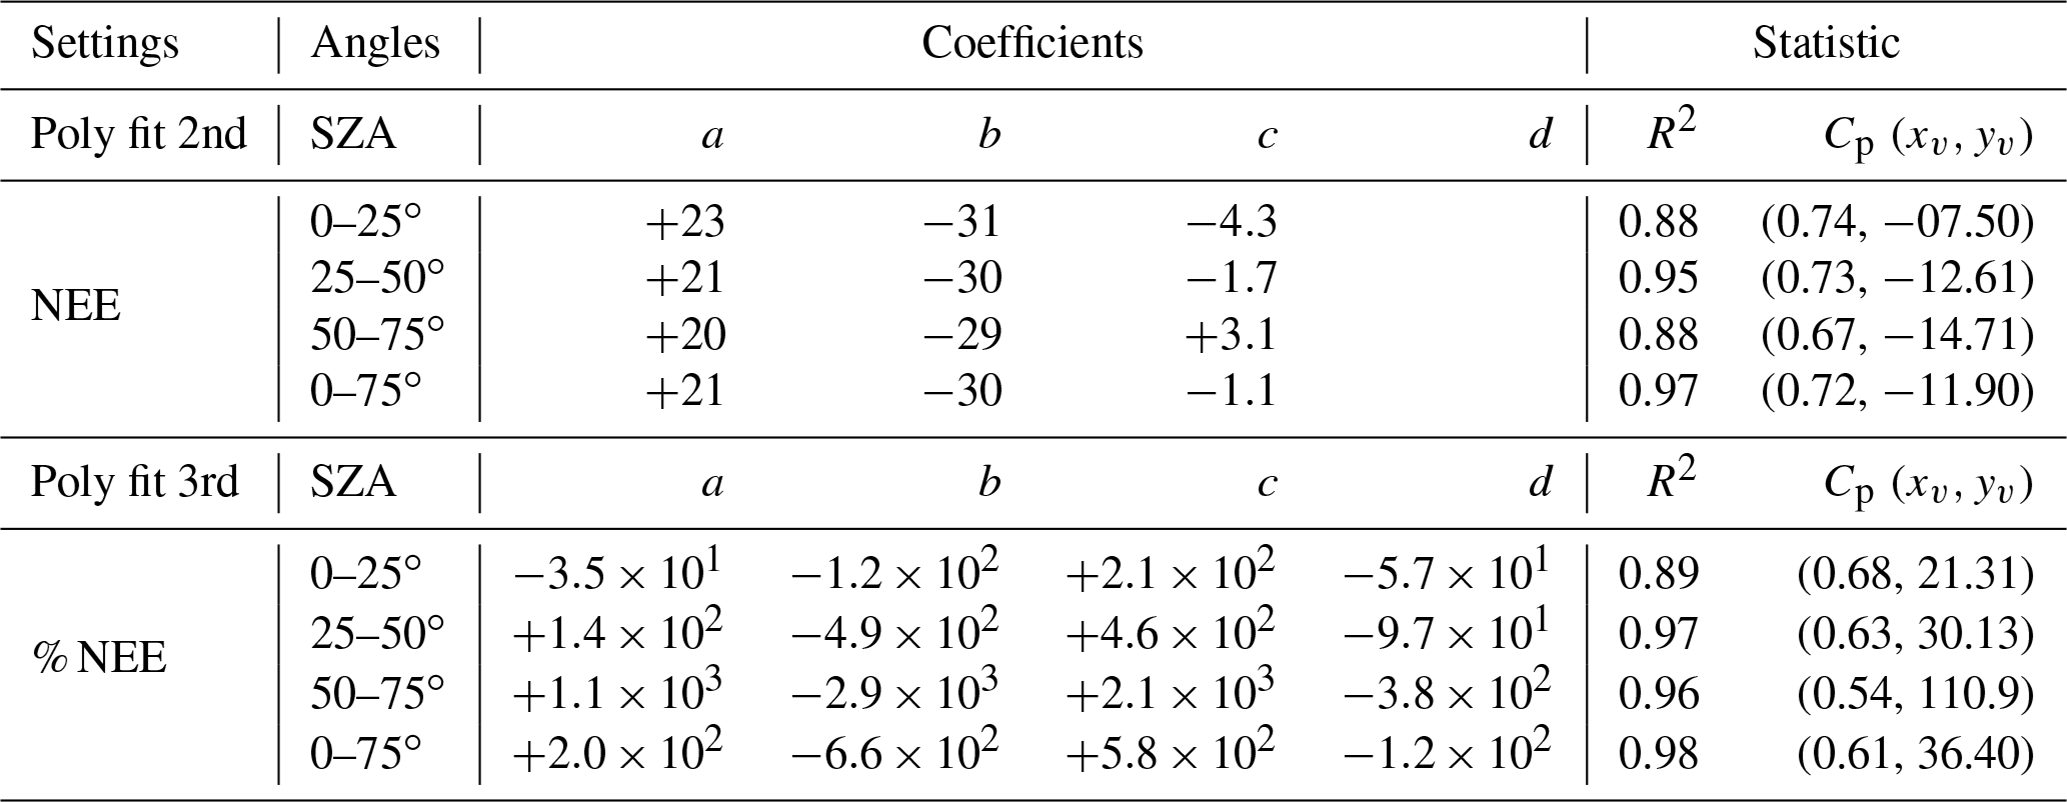
These results correspond to the relative increase (% NEE) of about 25 %–110 % in the first and last hours of the day, when the lower solar angles (greater physiological optimum) corroborated the results presented in Figs. 5–6 and Table S4. For lower than 0.63, we also observed a strong decline in photosynthetic rates until f ∼ 0.25 when the photosynthesis process breaks down altogether. Thus, f ∼ 0.66 (SZA 0–75∘) can be interpreted as a threshold for which photosynthetic rates (NEE f−1) indicate a strong reduction in the carbon uptake capacity of forest in response to an overload of BBOA. As for enhancements in the NEE, attributed to light shading, it must be seen as a narrow resilience of forest in response to a polluted atmosphere. These results offer more direct insight into alterations in solar radiation caused by BBOA and its impacts on carbon uptake during the day, although there are uncertainties not measured associated with clouds.
3.6 Insights into ecosystem respiration uncertainties
Since no direct local measurements of ecosystem respiration (Reco) exist, estimates are necessary. However, typically, the models available in the literature grossly overestimate or underestimate the local Reco, especially when in situ data are unavailable to fit them (e.g., autotrophic and heterotrophic respiration; litter, soil, trunks, branches, leaves, and roots) (Malhi, 2012). It is important to highlight that the indirect effects of BBOA on Reco have not been exploited yet in the “Cerrado–Amazon forest” ecotone. Little is known about how aerosols modify the Reco in the region. We highlighted that previous studies by Vourlitis et al. (2002) and Vourlitis et al. (2011) made daily estimates for the Reco without isolating the radiation-attenuating effects due to aerosols. These conditions are pretty different for the current study. Once photosynthetic rates are also modulated by solar radiation (attenuated by BBOA), changes in the VPD may also be impacting ecosystem respiration from nonlinear interactions, influencing the opening and closing of stomata, canopy temperature, humidity, and soil temperature. All these factors influence the microbiological dynamics of the soil and litter, with implications still unknown for Reco (in situ). Thus, we assume that the uncertainties underlying the calculation of the Reco (for the reasons mentioned) could affect our results equally significantly by disregarding it. Therefore, we assumed that the temporal variability of GPP is similar to the temporal variability of NEE.
To better support our assumption (GPP≈NEE), we have done a similar test (Figs. 8b and S11) using only daytime data during the dry season (Figs. S11 and S12). We found that the percent change (on average) is similar at around 15 % for SZA (0–75∘) and around 35 % for SZA (50–75∘). Both differences may be attributed to uncertainties due to the daytime Reco (Fig. 9) and factors that need to be better explored in future work. We hypothesized some mechanisms that could lead to an increase in NEE throughout the dry and smoky seasons (strongly supported by previous studies in the Amazon and worldwide), as follows. (1) During the dry season (July–September), the photosynthetic deficit due to deciduousness is partially compensated for by positive feedback of extrinsic factors: BBOA concentration, PAR(D), cooling of the air and leaf canopy, and VPD reduction (Vourlitis et al., 2001; Gu et al., 2003; Rap et al., 2018; Corwin et al., 2022). (2) During the flush season of new leaves (October–May), photosynthetic enhancement is primarily explained by positive feedback of both extrinsic (mentioned) and intrinsic factors (leaf area index and LUE): variation in the characteristics of the forest canopy due to the newly sprouted leaves, i.e., higher photosynthetic capacity of the canopy that compensates for the unfavorable stomatal response due to precedent drought (Wu et al., 2016; Green et al., 2020). (3) The magnitude of the effects observed in assumptions (1) and (2) will strongly depend on the intensity and frequency of occurrence of meteorological phenomena (e.g., limited PBL dynamics) (Fuentes et al., 2016; Gao et al., 2021).
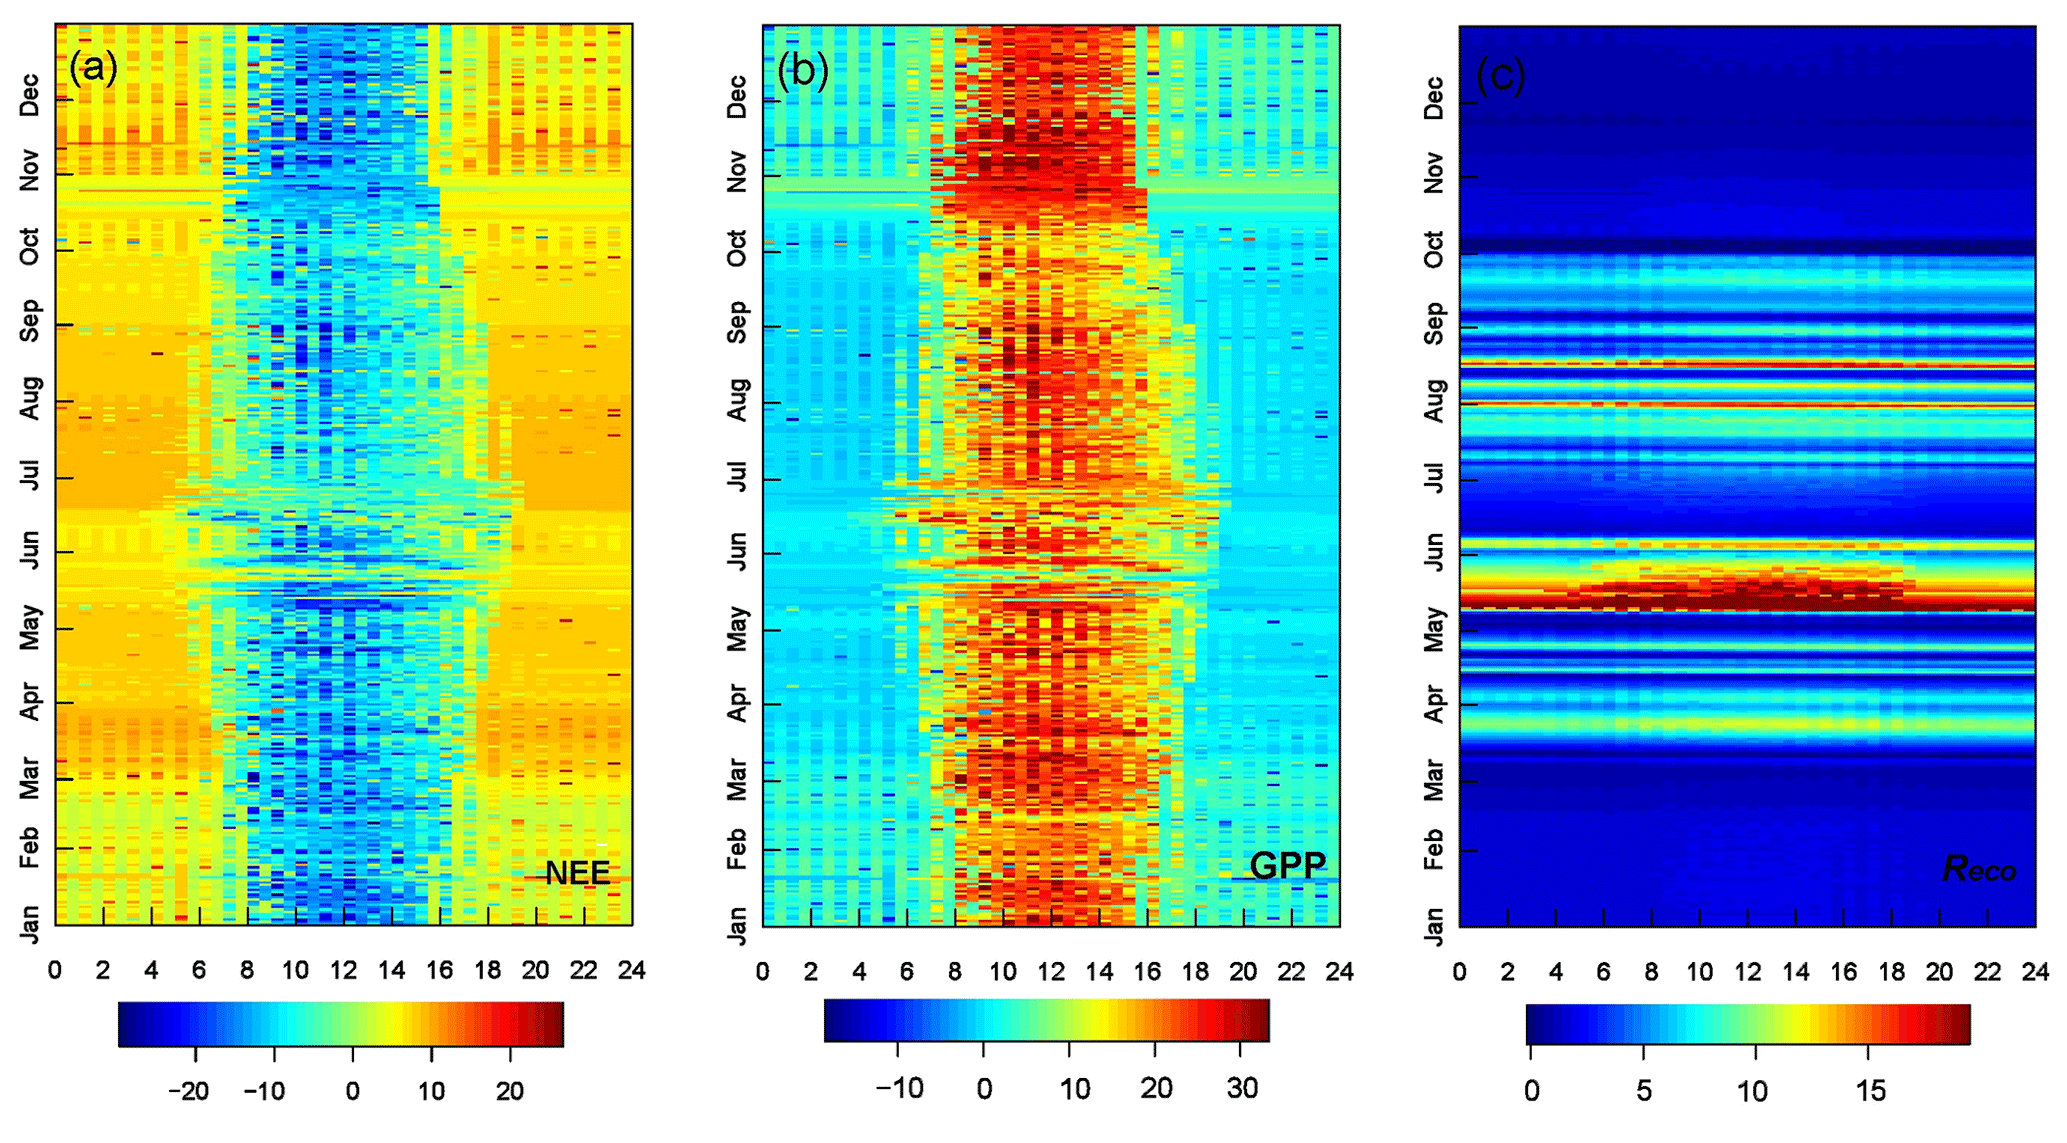
Figure 9Seasonal changes in the fingerprints calculated by the REddyProc system in µmol m2 s−1 during the years 2005–2008: (a) NEE, (b) GPP, and (c) Reco daytime. The x axis shows time (24 h, UTC−4).
3.7 BBOA effects on the biophysical variables and NEE
These results are important as a large part of the Amazon area is frequently impacted by the presence of aerosols in small amounts (low AOD), similar to those observed in the north of the Amazon Basin in Manaus-AM. In regions with high rates of deforestation and biomass burning, however, increases in CO2 absorption are significant and can have major impacts on the carbon budget of the Amazon forest. Over dense forest ecosystems of the central Amazon, CO2 absorption peaks are often observed at higher and narrower intervals of f (1.1 to 0.80), especially for dense forest ecosystems (Gu et al., 1999; Yamasoe et al., 2006; Oliveira et al., 2007; Doughty et al., 2010). This is different from grasslands and temperate forests, where the maximum net CO2 uptake is generally found in the range f between 1.0 and 0.5 (Gu et al., 1999; Niyogi et al., 2004; Jing et al., 2010; Zhang et al., 2010).
The mechanisms to explain the variation in % NEE with the irradiance f are complex and influenced by the dynamics of the PBL throughout the day, including transport of regionally and locally emitted burning emissions. For the semideciduous forests studied here, an accumulation of aerosols from fires during the night hours of 19:00–06:00 (LT) may be associated with greater stability in the PBL during the fire season (lower values in wind speed, reduction in convection, and boundary layer narrowing). These factors can increase the concentration of aerosols (AODa) during the night, with important effects on the CO2 absorption capacity (% NEE) observed in the early daytime hours (SZA values between 50 and 75∘).
Future studies may elucidate the dynamic effects of the PBL on the photosynthetic capacity of forests in the Amazon Basin, like studies carried out in other forests around the world, e.g., in Utah, USA (Helliker and Ehleringer, 2000); the UK (Yakir, 2003); and Beijing, China (Wang et al., 2021, 2022). Field experiments focused on the vertical distribution of PAR(D)F throughout the canopy will improve the current understanding of the individual effects of aerosols and clouds on the forest microclimate (LCT and VPD) in terms of % NEE.
Figure 10 shows significant interference of aerosols in environmental variables that consequently affect the photosynthetic dynamics of plants. The attenuating effect of incident solar irradiance due to the presence of aerosols triggers statistically significant reductions in LCT, Tair, and VPD near the forest canopy (Fig. 10). However, we noticed that the Tair variability is broader than the LCT variability (Fig. 10a and b), which suggests that the LCT fails to capture the realistic variability. To verify and evaluate the consistency of the LCT model (Eq. 9) calibrated to central Amazon conditions (mentioned in Sect. S2.1), a second method (LCTs) based on the Stefan–Boltzmann equation (Doughty et al., 2010; Cirino et al., 2014) was tested (see Eq. S1, Figs. S9 and S10, Supplement). We observed that Tair is systematically smaller throughout the day (Fig. S9a and b); results are obtained from the same data points shown in Fig. 10a and b. On average, the amplitude between LCT and Tair is equal to 2.2 (± 2.1) ∘C (Fig. S9c), and the leaf canopy is warmer than the air between 07:00 and 17:00 (LT), as expected. The leaf canopy was warmer than Tair during the day. However, the standard deviation (SD) of LCTs is significantly higher. The amplitude between LCTs and Tair is about 1.7±11.1 ∘C (Fig. S9a and b). LCTs appears to capture average hourly behavior but exhibits much greater hourly variability compared to Tair throughout the year. The LCT results reveal an acceptable average hourly pattern for leaf canopy temperature, although the pattern is unrealistic compared to Tair. Due to the limitations of LCT, it is worth mentioning that we are likely underestimating the uncertainties of aerosol effects on canopy temperature. However, the impact of aerosols on Tair also indicates an important cooling at the surface (∼ 3–4 ∘C), with relevant effects on the canopy and functioning of the studied ecosystem.
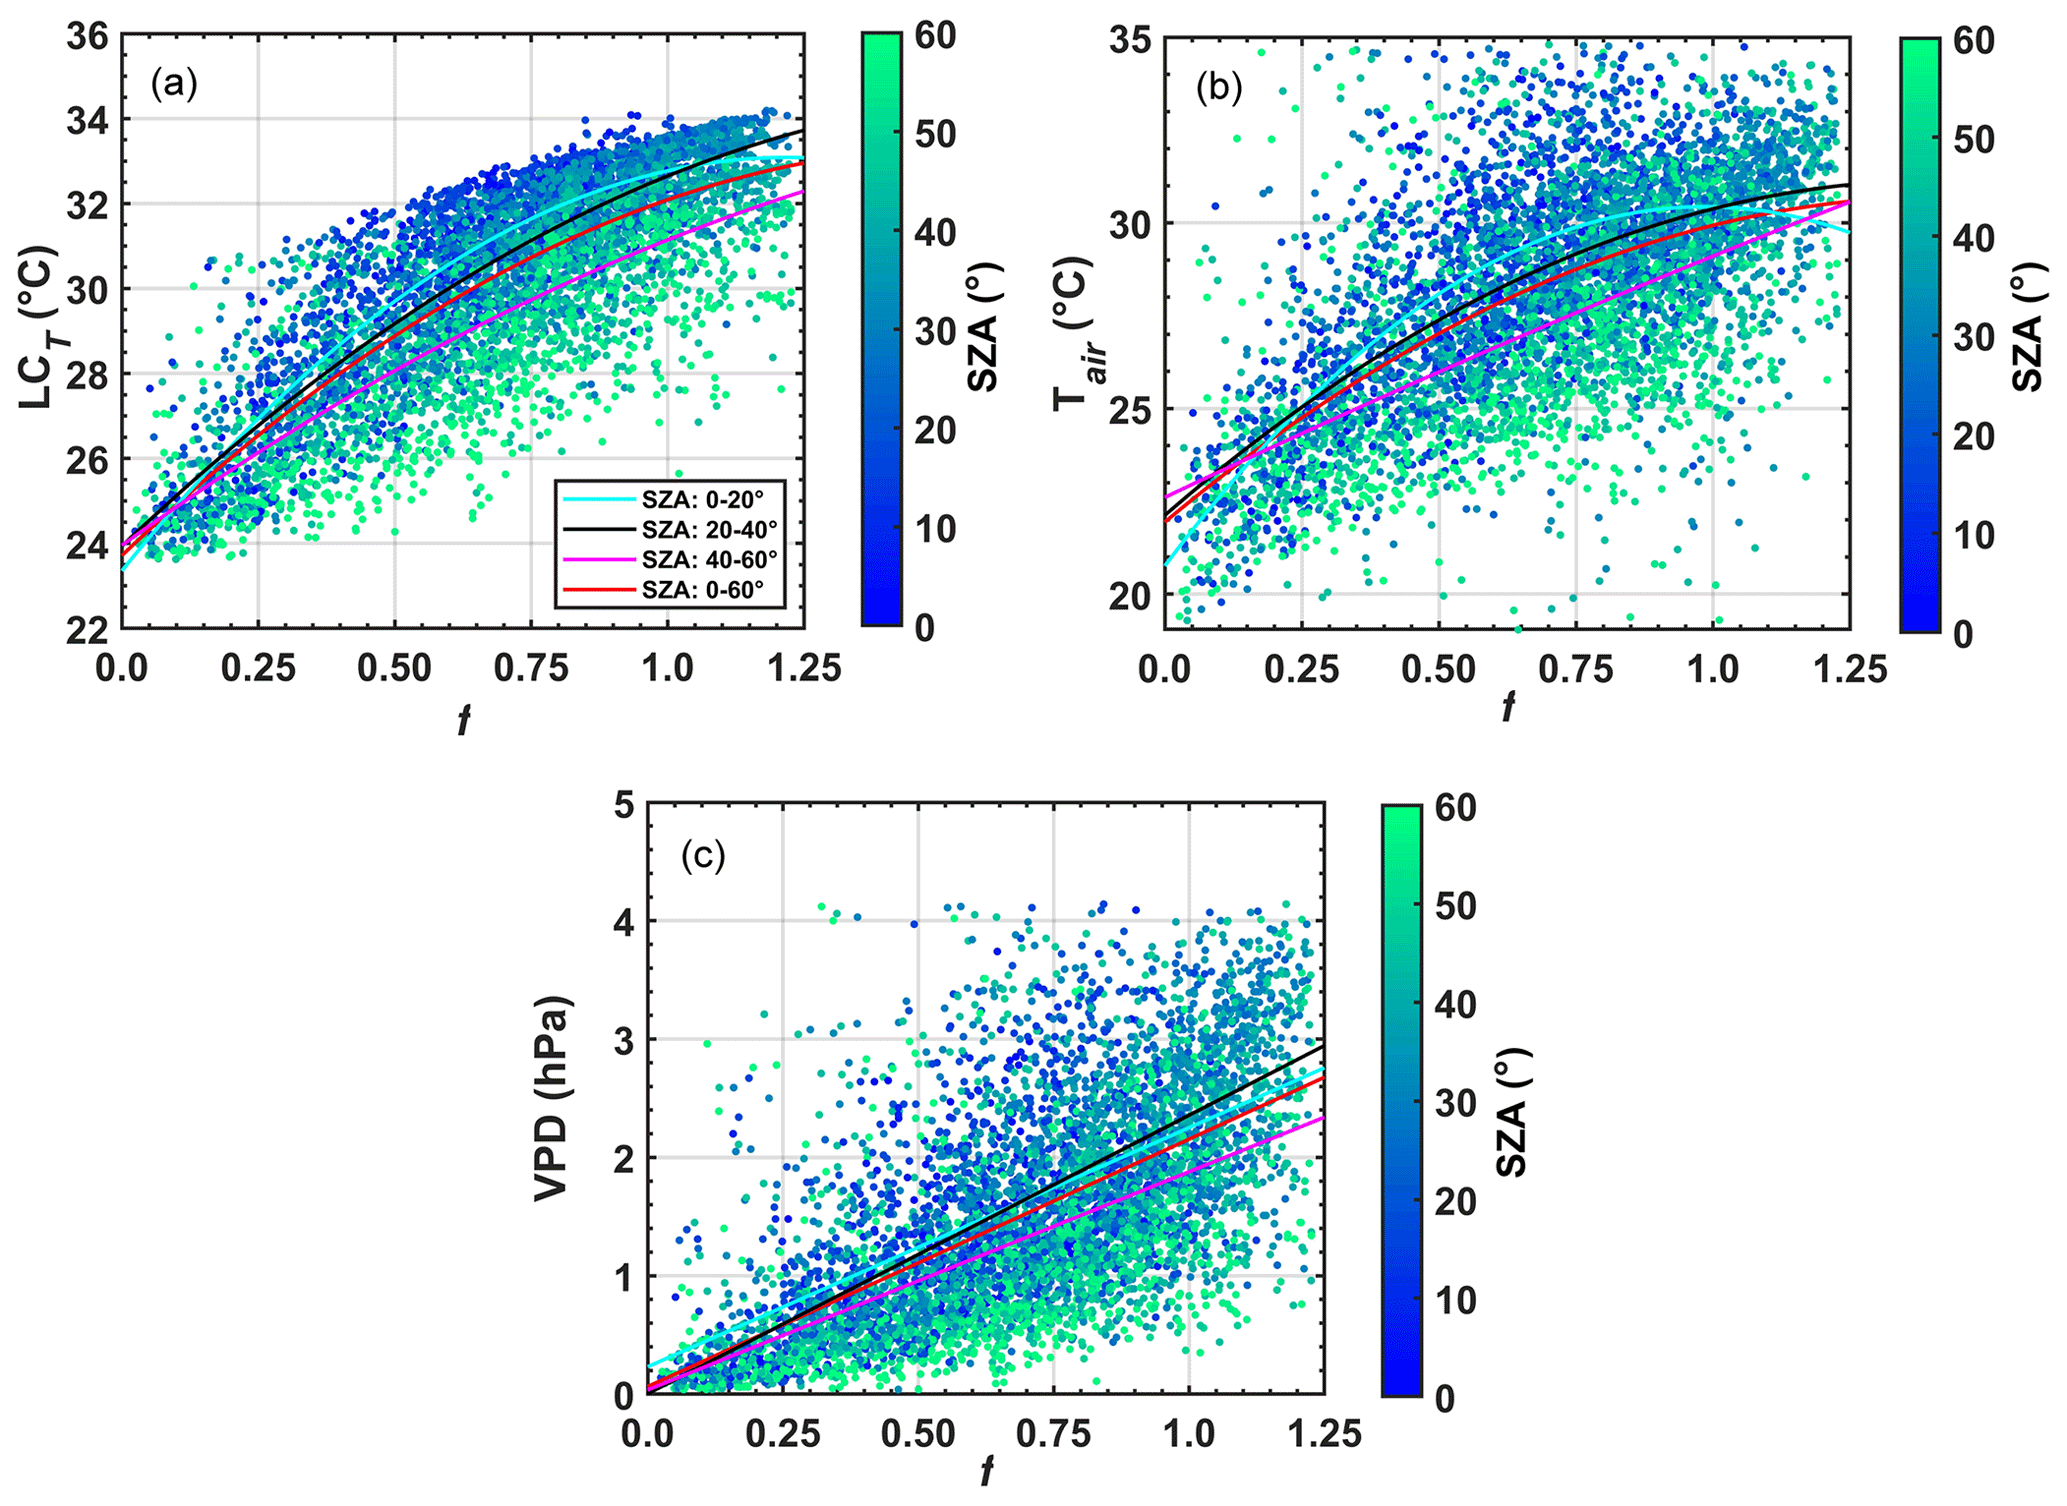
Figure 10Correlation between the relative irradiance f versus LCT (a), Tair (b), and VPD (c). Values are calculated for SZA between 0 and 60. The air temperature was measured at 42 m above the ground by the micrometeorological tower located in the municipality of Cláudia 50 km from Sinop-MT using the parameterization given in Tribuzy (2005) between 2003 and 2004.
Several mechanisms have been used to explain the increase in photosynthetic capacity by the canopy due to changes in the biophysical properties of the forest, among them the general trend of decreasing temperatures (Koren et al., 2014; Bai et al., 2012) and VPD (Min, 2005; Yuan et al., 2019) under cloudy or smoky skies. The effect of this cooling, especially on the leaf canopy, can also exert considerable influence on the photosynthesis of the forest (Doughty et al., 2010; Vourlitis et al., 2011). Herein, the impact of aerosols produced a cooling of 3 and 2.5 ∘C in LCT and Tair, respectively, when f declined from 1.10 to 0.66 (Fig. 10a and b); these are ranges for the which NEE increased by about 3–7 µmol m−2 s−1 as discussed in the section before. These results are similar to the results found by Davidi et al. (2009) and Doughty et al. (2010) in FLONA-Tapajós (Santarém-PA). However, the individual impacts of these effects depend on long-term and simultaneous measures of extrinsic factors (water stress, nutrient availability, solar radiation, aerosols, and cloud cover) and intrinsic aspects of the plant (forest type, leaf canopy structure, stomatal and root structure), which are unavailable for the site and period studied. Moreover, the nonlinear relationship between these factors makes it challenging to determine the physiological optimums for given biophysical variables, such as temperature and VPD (Fig. 10c).
The increase in relative humidity due to air cooling induced by clouds or aerosols can also influence photosynthesis (Freedman et al., 2001; Altaratz et al., 2008; Jing et al., 2010). In many forest locations, the reduction in f decreases VPD during the dry season. These reductions, strongly influenced by the cooling of the air, are also closely linked with the cooling of the forest canopy and the increase in the absorption capacity of CO2 (% NEE) (Doughty et al., 2010), considering its physiological optimums (tipping points). For cloudy or polluted-sky conditions, generally decreasing VPD behavior can influence stomata opening and intensify photosynthesis (Jing et al., 2010). Here, we observed a reduction of 2–3 hPa attributed to the decrease of around 3–4 ∘C in the air temperature, which agrees with the up to ∼ 40 % reduction in f from which NEE is critically reduced. Furthermore, it is still possible that an enhancement in the NEE is related to an increase in transpiration rates, providing cooling in the air, i.e., positive feedback between AOD, NEE, and RUair (Caioni et al., 2020).
Unlike what was found here, the forests of central Amazonia in Manaus-AM (K34), FLONA-Tapajós (K83), Santarém-PA, and Ji-Paraná (RO) seem to be less tolerant to the attenuation of sunlight induced by clouds and aerosols. In our forest, the distribution of f is close to 0.66 for AODa ≫ 0.10 (Table 5). This value is 15 %–20 % lower than values found in central Amazonia when the NEE reaches maximum negative values during the burning season (f ∼ 0.80). This is the threshold value at which maximum carbon absorption is observed due to aerosol load in the JBR in the Ji-Paraná JBR (south of the Amazon Basin) as well as in the Cuieiras reserve at K34 in Manaus-AM. These comparisons are relevant because higher (lower) quantities of aerosols and clouds in the Amazon region can cause certain types of forests to absorb even higher (lower) amounts of carbon throughout the day (Gu et al., 1999; Cirino et al., 2014). The % NEE frequency distribution patterns and their impacts on photosynthesis remain unknown for many other forest types in the Amazon and around the world. The results reported here are also consistent with calculations by Gu et al. (1999) for temperate forests in Canada, where negative maximums in NEE flux occur for ranges of f between 0.55 and 0.60.
The interannual variability of the relationship between the observed AODa, fire counts, and NEE could not be analyzed, mainly due to the lack of a long time series of NEE flux data in the region. In the central Amazon, significant variability was observed from year to year. Higher % NEE was often found on days with high fire counts. However, water stress and nutrient availability also play an essential role in the carbon uptake capacity (Gatti et al., 2014; Hofhansl et al., 2016; Gatti et al., 2021; Malhi et al., 2021). Joint modifications in these variables make it extremely difficult to quantify the individual effects of aerosols and clouds on the NEE. Field experiments taking measurements of all these aspects will yield studies with more robust and comprehensive conclusions on the ecosystem responses of Amazonian forests to external environmental disturbances such as fires.
The aerosol optical depth derived from the AERONET system proved to be a key variable in the elaboration of the clear-sky solar irradiance model used to determine the relative irradiance f. The conceived model can be directed to other regions of the Amazon as long as they are within the same latitude range, where there are no SWi measurements. The parameter f allowed us to satisfactorily evaluate the radiative effects of aerosols from fires on the net absorption of carbon (NEE) by the studied semideciduous forest ecosystem. The radiative impacts on PARi and PAR(D) allowed us to evaluate the impacts on the canopy light use efficiency (LUE), which increased by ∼ 1 %–3 % under polluted conditions (AODa). The changes in incident solar radiation and CO2 flux (NEE) could be attributed to the combined effects of aerosols emitted locally, regionally, or transported from more distant regions, considering the applied methods.
In the studied semideciduous forest ecosystem, the NEE increased from 20 %–70 % when the optical depth varied from 0.1 to 5.0 (on average). This effect was attributed to an average reduction of up to 40 % in the amount of total PAR and also to an increase of up to 50 % in the diffuse fraction of radiation (PAR(D)F). This increase in CO2 absorption capacity by the ecosystem is closely linked to the floristic composition of the understory and certain types of forest species adapted to low light conditions, which consists of vegetation more efficient in capturing diffused light during the photosynthesis process. The results show higher photosynthetic efficiency under smoky-sky conditions loaded with particles scattering solar radiation due to fires, but they also reveal the maximum limit in the PAR cuts required for the photosynthesis process. Relative irradiances f less than 0.66, on average, indicate the critical point at which forest photosynthetic rates undergo drastic reductions. Relative irradiance values f ∼ 0.22 indicate 100 % interruption in the photosynthetic process.
Due to the increase in the concentration of aerosol particles from fires in the region, statistically significant changes were also observed in meteorological (biophysical) variables such as leaf canopy temperature and VPD. Scientific findings reveal a strong influence of fire aerosols on these variables, with potentially important effects on photosynthesis and carbon absorption. The 3 and 5 ∘C reductions in leaf canopy and air temperature are strongly associated with a 40 % reduction in f and a ∼ 2.0 hPa reduction in VPD values, which induce stomata opening and contribute to the observed increase of 20 %–70 % in the CO2 absorption capacity of the forest (% NEE). The individual influences or contributions of VPD, Tair, and LCT to the ecosystem's net balance of CO2, however, could not be directly quantified in this research. Indirect correlations, however, reveal statistically significant effects between the mentioned biophysical variables and the observed changes in the NEE flux during the exposure of forests to fire and high values of AODa (greater than 1.25, on average). Studies focused on the impacts of fires on the flux of water to the atmosphere deserve attention and can help us to understand the role of forests in maintaining rainfall and its effects on the hydrological cycle (studies not yet carried out for most biomes in the Amazon).
4.1 Suggestions for future work
A more comprehensive regional study of the effects mentioned here, based on other vegetation types and biomes using vegetation maps, remote sensing estimates, meteorological data, and numerical modeling, will help us to better understand how the climate and ecosystem functioning in the Amazon are affected by natural and anthropogenic factors. The reductions in the NEE flux, and therefore the reduction of the photosynthetic capacity of plants due to the excessive increase in the concentration of BBOA aerosols as well as drastic reductions in the fluxes of solar radiation (f ≤ 0.22) due to fires in the region, constitute an effect of notable relevance for carbon cycling in semideciduous forest environments in the Amazon and therefore an important contribution to a better understanding of this cycle in the region. Future work could also involve estimating the global-scale significance of aerosol load on photosynthetically active radiation (PAR) and, consequently, on net ecosystem exchange (NEE) fluxes. In addition to the potential use of numerical modeling, promising approaches in this direction include research on remotely sensed solar-induced chlorophyll fluorescence (SIF) (Meroni et al., 2009). SIF has been increasingly utilized as a novel proxy for vegetation productivity. Comparing SIF with remotely sensed PARi and PAR(D) (e.g., Cheng et al., 2022; Zhang et al., 2023) enables an observational-based global-scale comparison of the effects observed in this study and, potentially, the estimation of the impact of aerosol load in general and biomass burning in particular on the photosynthetic capacity of plants.
This section provides free access to data repositories that support the conclusions. We provide the data from this paper through the Mendeley Data platform (https://data.mendeley.com, Cirino et al., 2023), where we will make upgrades and possible corrections. Secondary data are already in the public domain. We have listed the links to these data in the Supplement (Table S5).
The supplement related to this article is available online at: https://doi.org/10.5194/bg-21-843-2024-supplement.
Conceptualization and methodology: SR, GC, and GV; software: SR, GC, GV, and RP; validation: GV, GC, RP, and SR. Formal analysis: the authors contributed equally to this work. Investigation: SR, GC, DM, AP, SCL, BI, and GV; resources: GV and GC; data curation: GV, JN, GC, RP, and SR; writing (original draft preparation): SR and GC; writing (review and editing): GC, SR, GV, DM, AP, MIV, and SCL. All authors have read and agreed to the published version of the paper.
The contact author has declared that none of the authors has any competing interests.
Publisher's note: Copernicus Publications remains neutral with regard to jurisdictional claims made in the text, published maps, institutional affiliations, or any other geographical representation in this paper. While Copernicus Publications makes every effort to include appropriate place names, the final responsibility lies with the authors.
We want to thank the National Science Foundation and the Mato Grosso State Research Support Foundation (FAPEMAT), California State University – San Marcos (CSUSM), the Universidade Federal de Mato Grosso (UFMT), and the Northern Mato Grosso Woodcutters Trade Union (SINDUSMAD). Our thanks go to the Conselho Nacional de Desenvolvimento Científico e Tecnológico – CNPq, the Fundação Amazônia de Amparo a Estudos e Pesquisas – FAPESPA, and Coordenação de Aperfeiçoamento de Pessoal de Nível Superior – Brasil (CAPES). We also thank PROPESP/UFPA for financial support to students. Special thanks to the Dimensions Sciences Bridging Gaps with Scholarships (DS BRIDGES)–Amazonia Task Force for providing social and financial support for the research of countless students in vulnerable situations. We thank PROPESP (PIAPA/UFPA, call 04/2023) for the additional funding support.
This research has been supported by the FAPEMAT, CSUSM, UFMT, and SINDUSMAD. This study was also financed in part by the CNPq (grants no. 422894/2021-4, 200073/2024-9, and 443942/2023-4), the FAPESPA (grant no.2022/45107), and CAPES – Finance Code 001.
This paper was edited by Ivonne Trebs and reviewed by two anonymous referees.
Ackerly, D. D., Wayt Thomas, W., Cid Ferreira, C. A., and PIRANI Ackerly, R.: The forest-cerrado transition zone in southern amazonia: results of the 1985 projeto flora amazonica expedition to mato grosso, Brittonia, 41, 113–128, 1989. a, b
Adachi, K., Oshima, N., Gong, Z., de Sá, S., Bateman, A. P., Martin, S. T., de Brito, J. F., Artaxo, P., Cirino, G. G., Sedlacek III, A. J., and Buseck, P. R.: Mixing states of Amazon basin aerosol particles transported over long distances using transmission electron microscopy, Atmos. Chem. Phys., 20, 11923–11939, https://doi.org/10.5194/acp-20-11923-2020, 2020. a
Alencar, A. A. C., Arruda, V. L. S., Silva, W. V. d., Conciani, D. E., Costa, D. P., Crusco, N., Duverger, S. G., Ferreira, N. C., Franca-Rocha, W., Hasenack, H., Martenexen, L. F. M., Piontekowski, V. J., Ribeiro, N. V., Rosa, E. R., Rosa, M. R., dos Santos, S. M. B., Shimbo, J. Z., and Vélez-Martin, E.: Long-Term Landsat-Based Monthly Burned Area Dataset for the Brazilian Biomes Using Deep Learning, Remote Sens., 14, 2510, https://doi.org/10.3390/rs14112510, 2022. a, b
Alencar, A., Nepstad, D., MacGrath, D., and Moutinho, P.: Desmatamento na Amazônia: Indo além da emergência crônica, Tech. Rep., Belém, IPAM, https://livroaberto.ufpa.br/jspui/handle/prefix/859 (last access: 8 July 2023), 2004. a
Altaratz, O., Koren, I., and Reisin, T.: Humidity impact on the aerosol effect in warm cumulus clouds, Geophys. Res. Lett., 35, 1–5, https://doi.org/10.1029/2008GL034178, 2008. a
Anderegg, W. R., Trugman, A. T., Badgley, G., Konings, A. G., and Shaw, J.: Divergent forest sensitivity to repeated extreme droughts, Nat. Clim. Change, 10, 1091–1095, https://doi.org/10.1038/s41558-020-00919-1, 2020. a
Aragão, L. E., Anderson, L. O., Fonseca, M. G., Rosan, T. M., Vedovato, L. B., Wagner, F. H., Silva, C. V., Silva Junior, C. H., Arai, E., Aguiar, A. P., Barlow, J., Berenguer, E., Deeter, M. N., Domingues, L. G., Gatti, L., Gloor, M., Malhi, Y., Marengo, J. A., Miller, J. B., Phillips, O. L., and Saatchi, S.: 21st Century drought-related fires counteract the decline of Amazon deforestation carbon emissions, Nat. Commun., 9, 1–12, https://doi.org/10.1038/s41467-017-02771-y, 2018. a
Araújo, A. C., Dolman, A. J., Waterloo, M. J., Gash, J. H., Kruijt, B., Zanchi, F. B., de Lange, J. M., Stoevelaar, R., Manzi, A. O., Nobre, A. D., Lootens, R. N., and Backer, J.: The spatial variability of CO2 storage and the interpretation of eddy covariance fluxes in central Amazonia, Agr. Forest Meteorol., 150, 226–237, https://doi.org/10.1016/j.agrformet.2009.11.005, 2010. a, b, c, d
Artaxo, P., Rizzo, L. V., Brito, J. F., Barbosa, H. M., Arana, A., Sena, E. T., Cirino, G. G., Bastos, W., Martin, S. T., and Andreae, M. O.: Atmospheric aerosols in Amazonia and land use change: From natural biogenic to biomass burning conditions, Faraday Discuss., 165, 203–235, https://doi.org/10.1039/c3fd00052d, 2013. a
Artaxo, P., Hansson, H.-C., Andreae, M. O., Bäck, J., Alves, E. G., Barbosa, H. M. J., Bender, F., Bourtsoukidis, E., Carbone, S., Chi, J., Decesari, S., Després, V. R., Ditas, F., Ezhova, E., Fuzzi, S., Hasselquist, N. J., Heintzenberg, J., Holanda, B. A., Guenther, A., Hakola, H., Heikkinen, L., Kerminen, V.-M., Kontkanen, J., Krejci, R., Kulmala, M., Lavric, J. V., de Leeuw, G., Lehtipalo, K., Machado, L. A. T., McFiggans, G., Franco, M. A. M., Meller, B. B., Morais, F. G., Mohr, C., Morgan, W., Nilsson, M. B., Peichl, M., Petäjä, T., Praß, M., Pöhlker, C., Pöhlker, M. L., Pöschl, U., Von Randow, C., Riipinen, I., Rinne, J., Rizzo, L. V., Rosenfeld, D., Silva Dias, M. A. F., Sogacheva, L., Stier, P., Swietlicki, E., Sörgel, M., Tunved, P., Virkkula, A., Wang, J., Weber, B., Yáñez-Serrano, A. M., Zieger, P., Mikhailov, E., Smith, J. N., and Kesselmeier, J.: Tropical and Boreal Forest – Atmosphere Interactions: A Review, Tellus B, 74, 24–163, https://doi.org/10.16993/tellusb.34, 2022. a, b, c, d
Aubinet, M., Chermanne, B., Vandenhaute, M., Longdoz, B., Yernaux, M., and Laitat, E.: Long term carbon dioxide exchange above a mixed forest in the Belgian Ardennes, Agr. Forest Meteorol., 108, 293–315, https://doi.org/10.1016/S0168-1923(01)00244-1, 2001. a
Aubinet, M., Vesala, T., and Papale, D.: Eddy covariance: a practical guide to measurement and data analysis, Springer, Springer Atmospheric Sciences Serie, https://doi.org/10.1007/978-94-007-2351-1, 2012. a
Avitabile, V., Herold, M., Heuvelink, G. B., Lewis, S. L., Phillips, O. L., Asner, G. P., Armston, J., Ashton, P. S., Banin, L., Bayol, N., Berry, N. J., Boeckx, P., de Jong, B. H., Devries, B., Girardin, C. A., Kearsley, E., Lindsell, J. A., Lopez-Gonzalez, G., Lucas, R., Malhi, Y., Morel, A., Mitchard, E. T., Nagy, L., Qie, L., Quinones, M. J., Ryan, C. M., Ferry, S. J., Sunderland, T., Laurin, G. V., Gatti, R. C., Valentini, R., Verbeeck, H., Wijaya, A., and Willcock, S.: An integrated pan-tropical biomass map using multiple reference datasets, Glob. Change Biol., 22, 1406–1420, https://doi.org/10.1111/gcb.13139, 2016. a
Bai, Y., Wang, J., Zhang, B., Zhang, Z., and Liang, J.: Comparing the impact of cloudiness on carbon dioxide exchange in a grassland and a maize cropland in northwestern China, Ecol. Res., 27, 615–623, https://doi.org/10.1007/s11284-012-0930-z, 2012. a, b, c, d, e
Balch, J. K., Brando, P. M., Nepstad, D. C., Coe, M. T., Silvério, D., Massad, T. J., Davidson, E. A., Lefebvre, P., Oliveira-Santos, C., Rocha, W., Cury, R. T., Parsons, A., and Carvalho, K. S.: The Susceptibility of Southeastern Amazon Forests to Fire: Insights from a Large-Scale Burn Experiment, BioScience, 65, 893–905, https://doi.org/10.1093/biosci/biv106, 2015. a
Barbosa, F. R. G. M., Duarte, V. N., Staduto, J. A. R., and Kreter, A. C.: Land‐Use Dynamics for Agricultural and Livestock in Central‐West Brazil and its Reflects on the Agricultural Frontier Expansion, Clean. Circul. Bioeconom., 4, 100033, https://doi.org/10.1016/j.clcb.2022.100033, 2023. a
Beer, C., Reichstein, M., Tomelleri, E., Ciais, P., Jung, M., Carvalhais, N., Rödenbeck, C., Arain, M. A., Baldocchi, D., Bonan, G. B., Bondeau, A., Cescatti, A., Lasslop, G., Lindroth, A., Lomas, M., Luyssaert, S., Margolis, H., Oleson, K. W., Roupsard, O., Veenendaal, E., Viovy, N., Williams, C., Woodward, F. I., and Papale, D.: Terrestrial gross carbon dioxide uptake: Global distribution and covariation with climate, Science, 329, 834–838, https://doi.org/10.1126/science.1184984, 2010. a
Bian, H., Lee, E., Koster, R. D., Barahona, D., Chin, M., Colarco, P. R., Darmenov, A., Mahanama, S., Manyin, M., Norris, P., Shilling, J., Yu, H., and Zeng, F.: The response of the Amazon ecosystem to the photosynthetically active radiation fields: integrating impacts of biomass burning aerosol and clouds in the NASA GEOS Earth system model, Atmos. Chem. Phys., 21, 14177–14197, https://doi.org/10.5194/acp-21-14177-2021, 2021. a, b, c, d, e
Bird, R. E. and Hulstrom, R. L.: Simplified clear sky model for direct and diffuse insolation on horizontal surfaces, Solar Energy Research Inst. (SERI), Golden, CO, USA, https://doi.org/10.2172/6510849, 1981. a
Booth, B. B., Jones, C. D., Collins, M., Totterdell, I. J., Cox, P. M., Sitch, S., Huntingford, C., Betts, R. A., Harris, G. R., and Lloyd, J.: High sensitivity of future global warming to land carbon cycle processes, Environ. Res. Lett., 7, 024002, https://doi.org/10.1088/1748-9326/7/2/024002, 2012. a, b
Brando, P. M., Balch, J. K., Nepstad, D. C., Morton, D. C., Putz, F. E., Coe, M. T., Silvério, D., Macedo, M. N., Davidson, E. A., Nóbrega, C. C., Alencar, A., and Soares-Filho, B. S.: Abrupt increases in Amazonian tree mortality due to drought-fire interactions, P. Natl. Acad. Sci. USA, 111, 6347–6352, https://doi.org/10.1073/pnas.1305499111, 2014. a
Brando, P. M., Silvério, D., Maracahipes-Santos, L., Oliveira-Santos, C., Levick, S. R., Coe, M. T., Migliavacca, M., Balch, J. K., Macedo, M. N., Nepstad, D. C., Maracahipes, L., Davidson, E., Asner, G., Kolle, O., and Trumbore, S.: Prolonged tropical forest degradation due to compounding disturbances: Implications for CO2 and H2O fluxes, Glob. Change Biol., 25, 2855–2868, https://doi.org/10.1111/gcb.14659, 2019. a
Brienen, R. J., Phillips, O. L., Feldpausch, T. R., Gloor, E., Baker, T. R., Lloyd, J., Lopez-Gonzalez, G., Monteagudo-Mendoza, A., Malhi, Y., Lewis, S. L., Vásquez Martinez, R., Alexiades, M., Álvarez Dávila, E., Alvarez-Loayza, P., Andrade, A., Aragaõ, L. E., Araujo-Murakami, A., Arets, E. J., Arroyo, L., Aymard C., G. A., Bánki, O. S., Baraloto, C., Barroso, J., Bonal, D., Boot, R. G., Camargo, J. L., Castilho, C. V., Chama, V., Chao, K. J., Chave, J., Comiskey, J. A., Cornejo Valverde, F., Da Costa, L., De Oliveira, E. A., Di Fiore, A., Erwin, T. L., Fauset, S., Forsthofer, M., Galbraith, D. R., Grahame, E. S., Groot, N., Hérault, B., Higuchi, N., Honorio Coronado, E. N., Keeling, H., Killeen, T. J., Laurance, W. F., Laurance, S., Licona, J., Magnussen, W. E., Marimon, B. S., Marimon-Junior, B. H., Mendoza, C., Neill, D. A., Nogueira, E. M., Núñez, P., Pallqui Camacho, N. C., Parada, A., Pardo-Molina, G., Peacock, J., Penã-Claros, M., Pickavance, G. C., Pitman, N. C., Poorter, L., Prieto, A., Quesada, C. A., Ramírez, F., Ramírez-Angulo, H., Restrepo, Z., Roopsind, A., Rudas, A., Salomaõ, R. P., Schwarz, M., Silva, N., Silva-Espejo, J. E., Silveira, M., Stropp, J., Talbot, J., Ter Steege, H., Teran-Aguilar, J., Terborgh, J., Thomas-Caesar, R., Toledo, M., Torello-Raventos, M., Umetsu, R. K., Van Der Heijden, G. M., Van Der Hout, P., Guimarães Vieira, I. C., Vieira, S. A., Vilanova, E., Vos, V. A., and Zagt, R. J.: Long-term decline of the Amazon carbon sink, Nature, 519, 344–348, https://doi.org/10.1038/nature14283, 2015. a, b
Burba, G.: Eddy Covariance Method for Scientific, Industrial, Agricultural and Regulatory Applications: A Field Book on Measuring Ecosystem Gas Exchange and Areal Emission Rates, LI-COR Biosciences, ISBN 978-0-61576827-4, https://doi.org/10.13140/RG.2.1.4247.8561, 2013. a
Caioni, C., Silvério, D. V., Macedo, M. N., Coe, M. T., and Brando, P. M.: Droughts amplify differences between the energy balance components of Amazon forests and croplands, Remote Sens., 12, 525, https://doi.org/10.3390/rs12030525, 2020. a
Carswell, F. E., Costa, A. L., Palheta, M., Malhi, Y., Meir, P., Costa, J. d. P. R., Ruivo, M. d. L., Leal, L. d. S. M., Costa, J. M. N., Clement, R. J., and Grace, J.: Seasonality in CO2 and H2O flux at an eastern Amazonian rain forest, J. Geophys. Res.-Atmos., 107, LBA 43-1–LBA 43-16, https://doi.org/10.1029/2000JD000284, 2002. a
Cirino, G., Brito, J., Barbosa, H. M., Rizzo, L. V., Tunved, P., de Sá, S. S., Jimenez, J. L., Palm, B. B., Carbone, S., Lavric, J. V., Souza, R. A., Wolff, S., Walter, D., Tota, J., Oliveira, M. B., Martin, S. T., and Artaxo, P.: Observations of Manaus urban plume evolution and interaction with biogenic emissions in GoAmazon 2014/5, Atmos. Environ., 191, 513–524, https://doi.org/10.1016/j.atmosenv.2018.08.031, 2018. a
Cirino, G. G., Souza, R. A., Adams, D. K., and Artaxo, P.: The effect of atmospheric aerosol particles and clouds on net ecosystem exchange in the Amazon, Atmos. Chem. Phys., 14, 6523–6543, https://doi.org/10.5194/acp-14-6523-2014, 2014. a, b, c, d, e, f, g, h, i, j, k, l, m, n, o, p, q, r, s, t, u, v
Cirino, G., Vourlitis, G., Silva, S., and Palácios, R.: Brazil-FluxMet-Stf, Mendeley Data [data set], https://doi.org/10.17632/m5h5fw872g.1, 2023. a, b
Corripio, J. G.: Vectorial algebra algorithms for calculating terrain parameters from DEMs and solar radiation modelling in mountainous terrain, Int. J. Geogr. Inform. Sci., 17, 1–23, https://doi.org/10.1080/713811744, 2003. a
Corwin, K. A., Corr, C. A., Burkhardt, J., and Fischer, E. V.: Smoke-Driven Changes in Photosynthetically Active Radiation During the U.S. Agricultural Growing Season, J. Geophys. Res.-Atmos., 127, e2022JD037446, https://doi.org/10.1029/2022JD037446, 2022. a
Davidi, A., Koren, I., and Remer, L.: Direct measurements of the effect of biomass burning over the Amazon on the atmospheric temperature profile, Atmos. Chem. Phys., 9, 8211–8221, https://doi.org/10.5194/acp-9-8211-2009, 2009. a
Davison, C. W., Rahbek, C., and Morueta-Holme, N.: Land-use change and biodiversity: Challenges for assembling evidence on the greatest threat to nature, Glob. Change Biol., 27, 5414–5429, https://doi.org/10.1111/gcb.15846, 2021. a
de Magalhães, N., Evangelista, H., Condom, T., Rabatel, A., and Ginot, P.: Amazonian Biomass Burning Enhances Tropical Andean Glaciers Melting, Sci. Rep., 9, 1–12, https://doi.org/10.1038/s41598-019-53284-1, 2019. a
de Sá, S. S., Rizzo, L. V., Palm, B. B., Campuzano-Jost, P., Day, D. A., Yee, L. D., Wernis, R., Isaacman-VanWertz, G., Brito, J., Carbone, S., Liu, Y. J., Sedlacek, A., Springston, S., Goldstein, A. H., Barbosa, H. M. J., Alexander, M. L., Artaxo, P., Jimenez, J. L., and Martin, S. T.: Contributions of biomass-burning, urban, and biogenic emissions to the concentrations and light-absorbing properties of particulate matter in central Amazonia during the dry season, Atmos. Chem. Phys., 19, 7973–8001, https://doi.org/10.5194/acp-19-7973-2019, 2019. a, b
Doughty, C. E., Flanner, M. G., and Goulden, M. L.: Effect of smoke on subcanopy shaded light, canopy temperature, and carbon dioxide uptake in an Amazon rainforest, Global Biogeochem. Cy., 24, 1–10, https://doi.org/10.1029/2009GB003670, 2010. a, b, c, d, e, f, g, h, i, j, k, l, m
Doughty, C. E., Metcalfe, D. B., Girardin, C. A., Amézquita, F. F., Cabrera, D. G., Huasco, W. H., Silva-Espejo, J. E., Araujo-Murakami, A., Da Costa, M. C., Rocha, W., Feldpausch, T. R., Mendoza, A. L., Da Costa, A. C., Meir, P., Phillips, O. L., and Malhi, Y.: Drought impact on forest carbon dynamics and fluxes in Amazonia, Nature, 519, 78–82, https://doi.org/10.1038/nature14213, 2015. a
Drugé, T., Nabat, P., Mallet, M., Michou, M., Rémy, S., and Dubovik, O.: Modeling radiative and climatic effects of brown carbon aerosols with the ARPEGE-Climat global climate model, Atmos. Chem. Phys., 22, 12167–12205, https://doi.org/10.5194/acp-22-12167-2022, 2022. a
Duchon, C. E. and O'Malley, M. S.: Estimating Cloud Type from Pyranometer Observations, J. Appl. Meteorol., 38, 132–141, https://doi.org/10.1175/1520-0450(1999)038<0132:ECTFPO>2.0.CO;2, 1999. a
Durand, M., Murchie, E. H., Lindfors, A. V., Urban, O., Aphalo, P. J., and Robson, T. M.: Diffuse solar radiation and canopy photosynthesis in a changing environment, Agr. Forest Meteorol., 311, 108684, https://doi.org/10.1016/j.agrformet.2021.108684, 2021. a
Finnigan, J.: The storage term in eddy flux calculations, Agr. Forest Meteorol., 136, 108–113, https://doi.org/10.1016/j.agrformet.2004.12.010, 2006. a
Freedman, J. M., Fitzjarrald, D. R., Moore, K. E., and Sakai, R. K.: Boundary Layer Clouds and Vegetation–Atmosphere Feedbacks, J. Clim., 14, 180–197, https://doi.org/10.1175/1520-0442(2001)013<0180:BLCAVA>2.0.CO;2, 2001. a
Fu, Z., Gerken, T., Bromley, G., Araújo, A., Bonal, D., Burban, B., Ficklin, D., Fuentes, J. D., Goulden, M., Hirano, T., Kosugi, Y., Liddell, M., Nicolini, G., Niu, S., Roupsard, O., Stefani, P., Mi, C., Tofte, Z., Xiao, J., Valentini, R., Wolf, S., and Stoy, P. C.: The surface-atmosphere exchange of carbon dioxide in tropical rainforests: Sensitivity to environmental drivers and flux measurement methodology, Agr. Forest Meteorol., 263, 292–307, https://doi.org/10.1016/j.agrformet.2018.09.001, 2018. a
Fuentes, J. D., Chamecki, M., Dos Santos, R. M. N., Von Randow, C., Stoy, P. C., Katul, G., Fitzjarrald, D., Manzi, A., Gerken, T., Trowbridge, A., Freire, L. S., Ruiz-Plancarte, J., Maia, J. M. F., Tóta, J., Dias, N., Fisch, G., Schumacher, C., Acevedo, O., Mercer, J. R., and Yañez-Serrano, A. M.: Linking meteorology, turbulence, and air chemistry in the amazon rain forest, Bull. Am. Meteorol. Soc., 97, 2329–2342, https://doi.org/10.1175/BAMS-D-15-00152.1, 2016. a
Gao, Y., Zhang, Z., Chen, J., McNulty, S., Xu, H., Chen, L., Chen, Z., and Jin, Z.: Atmospheric aerosols elevated ecosystem productivity of a poplar plantation in Beijing, China, Can. J. Forest Res., 51, 1440–1449, https://doi.org/10.1139/cjfr-2020-0396, 2021. a, b
Gates, D. M.: Biophysical Ecology, Springer New York, NY, ISBN 9781461260264, https://doi.org/10.1007/978-1-4612-6024-0, 1980. a
Gatti, L. V., Gloor, M., Miller, J. B., Doughty, C. E., Malhi, Y., Domingues, L. G., Basso, L. S., Martinewski, A., Correia, C. S., Borges, V. F., Freitas, S., Braz, R., Anderson, L. O., Rocha, H., Grace, J., Phillips, O. L., and Lloyd, J.: Drought sensitivity of Amazonian carbon balance revealed by atmospheric measurements, Nature, 506, 76–80, https://doi.org/10.1038/nature12957, 2014. a, b
Gatti, L. V., Basso, L. S., Miller, J. B., Gloor, M., Gatti Domingues, L., Cassol, H. L., Tejada, G., Aragão, L. E., Nobre, C., Peters, W., Marani, L., Arai, E., Sanches, A. H., Corrêa, S. M., Anderson, L., Von Randow, C., Correia, C. S., Crispim, S. P., and Neves, R. A.: Amazonia as a carbon source linked to deforestation and climate change, Nature, 595, 388–393, https://doi.org/10.1038/s41586-021-03629-6, 2021. a, b, c, d
Grace, J., Malhi, Y., Lloyd, J., McIntyre, J., Miranda, A. C., Meir, P., and Miranda, H. S.: The use of eddy covariance to infer the net carbon dioxide uptake of Brazilian rain forest, Glob. Change Biol., 2, 209–217, https://doi.org/10.1111/j.1365-2486.1996.tb00073.x, 1996. a
Green, J. K., Berry, J., Ciais, P., Zhang, Y., and Gentine, P.: Amazon rainforest photosynthesis increases in response to atmospheric dryness, Sci. Adv., 6, eabb7232, https://doi.org/10.1126/sciadv.abb7232, 2020. a
Gu, L., Fuentes, J. D., Shugart, H. H., Staebler, R. M., and Black, T. A.: Responses of net ecosystem exchanges of carbon dioxide to changes in cloudiness: Results from two North American deciduous forests, J. Geophys. Res.-Atmos., 104, 31421–31434, https://doi.org/10.1029/1999JD901068, 1999. a, b, c, d, e, f, g, h, i, j, k, l, m, n, o, p, q, r, s, t, u
Gu, L., Fuentes, J. D., Garstang, M., Silva, J. T. D., Heitz, R., Sigler, J., and Shugart, H. H.: Cloud modulation of surface solar irradiance at a pasture site in Southern Brazil, Agr. Forest Meteorol., 106, 117–129, https://doi.org/10.1016/S0168-1923(00)00209-4, 2001. a, b, c
Gu, L., Baldocchi, D. D., Wofsy, S. C., Munger, J. W., Michalsky, J. J., Urbanski, S. P., and Boden, T. A.: Response of a Deciduous Forest to the Mount Pinatubo Eruption: Enhanced Photosynthesis, Science, 299, 2035–2038, https://doi.org/10.1126/science.1078366, 2003. a, b
Helliker, B. R. and Ehleringer, J. R.: Establishing a grassland signature in veins: 18O in the leaf water of C3 and C4 grasses, P. Natl. Acad. Sci. USA, 97, 7894–7898, https://doi.org/10.1073/pnas.97.14.7894, 2000. a
Hofhansl, F., Andersen, K. M., Fleischer, K., Fuchslueger, L., Rammig, A., Schaap, K. J., Valverde-Barrantes, O. J., and Lapola, D. M.: Amazon forest ecosystem responses to elevated atmospheric CO2 and alterations in nutrient availability: Filling the gaps with model-experiment integration, Front. Earth Sci., 4, 1–9, https://doi.org/10.3389/feart.2016.00019, 2016. a
Holanda, B. A., Franco, M. A., Walter, D., Artaxo, P., Carbone, S., Cheng, Y., Chowdhury, S., Ditas, F., Gysel-Beer, M., Klimach, T., Kremper, L. A., Krüger, O. O., Lavric, J. V., Lelieveld, J., Ma, C., Machado, L. A. T., Modini, R. L., Morais, F. G., Pozzer, A., Saturno, J., Su, H., Wendisch, M., Wolff, S., Pöhlker, M. L., Andreae, M. O., Pöschl, U., and Pöhlker, C.: African biomass burning affects aerosol cycling over the Amazon, Commun. Earth Environ., 4, 154, https://doi.org/10.1038/s43247-023-00795-5, 2023. a
Holben, B. N., Eck, T. F., Slutsker, I., Tanré, D., Buis, J. P., Setzer, A., Vermote, E., Reagan, J. A., Kaufman, Y. J., Nakajima, T., Lavenu, F., Jankowiak, I., and Smirnov, A.: AERONET – A federated instrument network and data archive for aerosol characterization, Remote Sens. Environ., 66, 1–16, https://doi.org/10.1016/S0034-4257(98)00031-5, 1998. a
Hubau, W., Lewis, S. L., Phillips, O. L., Affum-Baffoe, K., Beeckman, H., Cuní-Sanchez, A., Daniels, A. K., Ewango, C. E., Fauset, S., Mukinzi, J. M., Sheil, D., Sonké, B., Sullivan, M. J., Sunderland, T. C., Taedoumg, H., Thomas, S. C., White, L. J., Abernethy, K. A., Adu-Bredu, S., Amani, C. A., Baker, T. R., Banin, L. F., Baya, F., Begne, S. K., Bennett, A. C., Benedet, F., Bitariho, R., Bocko, Y. E., Boeckx, P., Boundja, P., Brienen, R. J., Brncic, T., Chezeaux, E., Chuyong, G. B., Clark, C. J., Collins, M., Comiskey, J. A., Coomes, D. A., Dargie, G. C., de Haulleville, T., Kamdem, M. N. D., Doucet, J. L., Esquivel-Muelbert, A., Feldpausch, T. R., Fofanah, A., Foli, E. G., Gilpin, M., Gloor, E., Gonmadje, C., Gourlet-Fleury, S., Hall, J. S., Hamilton, A. C., Harris, D. J., Hart, T. B., Hockemba, M. B., Hladik, A., Ifo, S. A., Jeffery, K. J., Jucker, T., Yakusu, E. K., Kearsley, E., Kenfack, D., Koch, A., Leal, M. E., Levesley, A., Lindsell, J. A., Lisingo, J., Lopez-Gonzalez, G., Lovett, J. C., Makana, J. R., Malhi, Y., Marshall, A. R., Martin, J., Martin, E. H., Mbayu, F. M., Medjibe, V. P., Mihindou, V., Mitchard, E. T., Moore, S., Munishi, P. K., Bengone, N. N., Ojo, L., Ondo, F. E., Peh, K. S., Pickavance, G. C., Poulsen, A. D., Poulsen, J. R., Qie, L., Reitsma, J., Rovero, F., Swaine, M. D., Talbot, J., Taplin, J., Taylor, D. M., Thomas, D. W., Toirambe, B., Mukendi, J. T., Tuagben, D., Umunay, P. M., van der Heijden, G. M., Verbeeck, H., Vleminckx, J., Willcock, S., Wöll, H., Woods, J. T., and Zemagho, L.: Asynchronous carbon sink saturation in African and Amazonian tropical forests, Nature, 579, 80–87, https://doi.org/10.1038/s41586-020-2035-0, 2020. a
Huntingford, C., Zelazowski, P., Galbraith, D., Mercado, L. M., Sitch, S., Fisher, R., Lomas, M., Walker, A. P., Jones, C. D., Booth, B. B., Malhi, Y., Hemming, D., Kay, G., Good, P., Lewis, S. L., Phillips, O. L., Atkin, O. K., Lloyd, J., Gloor, E., Zaragoza-Castells, J., Meir, P., Betts, R., Harris, P. P., Nobre, C., Marengo, J., and Cox, P. M.: Simulated resilience of tropical rainforests to CO2 – induced climate change, Nat. Geosci., 6, 268–273, https://doi.org/10.1038/ngeo1741, 2013. a, b
Jing, X., Huang, J., Wang, G., Higuchi, K., Bi, J., Sun, Y., Yu, H., and Wang, T.: The effects of clouds and aerosols on net ecosystem CO2 exchange over semi-arid Loess Plateau of Northwest China, Atmos. Chem. Phys., 10, 8205–8218, https://doi.org/10.5194/acp-10-8205-2010, 2010. a, b, c, d, e, f, g, h, i, j, k
Junior, C. H. L. S., Aragão, L. E. O. C., Anderson, L. O., Fonseca, M. G., Shimabukuro, Y. E., Vancutsem, C., Achard, F., Beuchle, R., Numata, I., Silva, C. A., Maeda, E. E., Longo, M., and Saatchi, S. S.: Persistent collapse of biomass in Amazonian forest edges following deforestation leads to unaccounted carbon losses, Sci. Adv., 6, eaaz8360, https://doi.org/10.1126/sciadv.aaz8360, 2020. a
Kanniah, K. D., Beringer, J., North, P., and Hutley, L.: Control of atmospheric particles on diffuse radiation and terrestrial plant productivity: A review, Prog. Phys. Geogr., 36, 209–237, https://doi.org/10.1177/0309133311434244, 2012. a
Koren, I., Dagan, G., and Altaratz, O.: From aerosol-limited to invigoration of warm convective clouds, Science, 344, 1143–1146, https://doi.org/10.1126/science.1252595, 2014. a
Levy, R. C., Mattoo, S., Munchak, L. A., Remer, L. A., Sayer, A. M., Patadia, F., and Hsu, N. C.: The Collection 6 MODIS aerosol products over land and ocean, Atmos. Meas. Tech., 6, 2989–3034, https://doi.org/10.5194/amt-6-2989-2013, 2013. a
Lorenzi, H.: Árvores brasileiras: manual de identificação e cultivo de plantas arbóreas nativas do Brasil, no. v.2 in Árvores brasileiras: manual de identificação e cultivo de plantas arbóreas nativas do Brasil, Instituto Plantarum de Estudos da Flora, ISBN 9788586714146, https://books.google.com.br/books?id=UN4sAQAAMAAJ (last access: 25 July 2022), 2002. a
Venturini, A. M., Gontijo, J. B., Mandro, J. A., Berenguer, E., Peay, K. G., Tsai, S. M., and Bohannan, B. J. B.: Soil microbes under threat in the Amazon Rainforest, Trend. Ecol. Evol., 38, 693–696, https://doi.org/10.1016/j.tree.2023.04.014, 2023. a
Malavelle, F. F., Haywood, J. M., Mercado, L. M., Folberth, G. A., Bellouin, N., Sitch, S., and Artaxo, P.: Studying the impact of biomass burning aerosol radiative and climate effects on the Amazon rainforest productivity with an Earth system model, Atmos. Chem. Phys., 19, 1301–1326, https://doi.org/10.5194/acp-19-1301-2019, 2019. a, b, c
Malhi, Y.: The productivity, metabolism and carbon cycle of tropical forest vegetation, J. Ecol., 100, 65–75, https://doi.org/10.1111/j.1365-2745.2011.01916.x, 2012. a
Malhi, Y., Melack, J., Gatti, L. V., Ometto, J. P., Kesselmeier, J., Wolff, S., Aragão, L. E. O., Costa, M. H., Saleska, S. R., Pangala, S., Basso, L. S., Rizzo, L., de Araújo, A. C., Restrepo-Coupe, N., and Silva Junior, C. H. L.: Biogeochemical Cycles in the Amazon, Chap. 6, United Nations Sustainable Development Solutions Network, New York, USA, ISBN 9781734808001, https://doi.org/10.55161/takr3454, 2021. a
Martin, S. T., Andreae, M. O., Althausen, D., Artaxo, P., Baars, H., Borrmann, S., Chen, Q., Farmer, D. K., Guenther, A., Gunthe, S. S., Jimenez, J. L., Karl, T., Longo, K., Manzi, A., Müller, T., Pauliquevis, T., Petters, M. D., Prenni, A. J., Pöschl, U., Rizzo, L. V., Schneider, J., Smith, J. N., Swietlicki, E., Tota, J., Wang, J., Wiedensohler, A., and Zorn, S. R.: An overview of the Amazonian Aerosol Characterization Experiment 2008 (AMAZE-08), Atmos. Chem. Phys., 10, 11415–11438, https://doi.org/10.5194/acp-10-11415-2010, 2010a. a
Martin, S. T., Andreae, M. O., Artaxo, P., Baumgardner, D., Chen, Q., Goldstein, A. H., Guenther, A., Heald, C. L., Mayol-Bracero, O. L., McMurry, P. H., Pauliquevis, T., Pschl, U., Prather, K. A., Roberts, G. C., Saleska, S. R., Silva Dias, M. A., Spracklen, D. V., Swietlicki, E., and Trebs, I.: Sources and properties of Amazonian aerosol particles, Rev. Geophys., 48, 42 pp., https://doi.org/10.1029/2008RG000280, 2010b. a
MATLAB: version 9.8.8.748 (R2013a), The MathWorks Inc., Natick, Massachusetts, https://www.mathworks.com (last access: 12 February 2024), 2013. a
Mercado, L. M., Bellouin, N., Sitch, S., Boucher, O., Huntingford, C., Wild, M., and Cox, P. M.: Impact of changes in diffuse radiation on the global land carbon sink, Nature, 458, 1014–1017, https://doi.org/10.1038/nature07949, 2009. a, b, c, d
Meroni, M., Rossini, M., Guanter, L., Alonso, L., Rascher, U., Colombo, R., and Moreno, J.: Remote sensing of solar-induced chlorophyll fluorescence: Review of methods and applications, Remote Sens. Environ., 113, 2037–2051, https://doi.org/10.1016/j.rse.2009.05.003, 2009. a
Meyers, T. P. and Dale, R. F.: Predicting daily insolation with hourly cloud height and coverage, J. Appl. Meteorol. Climatol., 22, 537–545, https://doi.org/10.1175/1520-0450(1983)022<0537:PDIWHC>2.0.CO;2, 1983. a
Min, Q.: Impacts of aerosols and clouds on forest-atmosphere carbon exchange, J. Geophys. Res.-Atmos., 110, D06203, https://doi.org/10.1029/2004JD004858, 2005. a
Montagnani, L., Grünwald, T., Kowalski, A., Mammarella, I., Merbold, L., Metzger, S., Sedlák, P., and Siebicke, L.: Estimating the storage term in eddy covariance measurements: The ICOS methodology, Int. Agrophys., 32, 551–567, https://doi.org/10.1515/intag-2017-0037, 2018. a
Moreira, D. S., Freitas, S. R., Bonatti, J. P., Mercado, L. M., Rosário, N. M. É., Longo, K. M., Miller, J. B., Gloor, M., and Gatti, L. V.: Coupling between the JULES land-surface scheme and the CCATT-BRAMS atmospheric chemistry model (JULES-CCATT-BRAMS1.0): applications to numerical weather forecasting and the CO2 budget in South America, Geosci. Model Dev., 6, 1243–1259, https://doi.org/10.5194/gmd-6-1243-2013, 2013. a
Moreira, D. S., Longo, K. M., Freitas, S. R., Yamasoe, M. A., Mercado, L. M., Rosário, N. E., Gloor, E., Viana, R. S., Miller, J. B., Gatti, L. V., Wiedemann, K. T., Domingues, L. K., and Correia, C. C.: Modeling the radiative effects of biomass burning aerosols on carbon fluxes in the Amazon region, Atmos. Chem. Phys., 17, 14785–14810, https://doi.org/10.5194/acp-17-14785-2017, 2017. a, b, c, d, e, f, g, h
Morgan, W. T., Darbyshire, E., Spracklen, D. V., Artaxo, P., and Coe, H.: Non-deforestation drivers of fires are increasingly important sources of aerosol and carbon dioxide emissions across Amazonia, Sci. Rep., 9, 1–15, https://doi.org/10.1038/s41598-019-53112-6, 2019. a
Murphy, P. G. and Lugo, A. E.: Ecology of tropical dry forest, Annu. Rev. Ecol. Syst., 17, 67–88, https://doi.org/10.1146/annurev.es.17.110186.000435, 1986. a
Nagy, L., Artaxo, P., and Forsberg, B. R.: Interactions Between Biosphere, Atmosphere, and Human Land Use in the Amazon Basin: An Introduction, Springer Berlin, Heidelberg, ISBN 9783662499009, https://doi.org/10.1007/978-3-662-49902-3_1, 2016. a
Nagy, R. C., Porder, S., Brando, P., Davidson, E. A., Figueira, A. M. E. S., Neill, C., Riskin, S., and Trumbore, S.: Soil Carbon Dynamics in Soybean Cropland and Forests in Mato Grosso, Brazil, J. Geophys. Res.-Biogeo., 123, 18–31, https://doi.org/10.1002/2017JG004269, 2018. a
Nepstad, D., McGrath, D., Stickler, C., Alencar, A., Azevedo, A., Swette, B., Bezerra, T., DiGiano, M., Shimada, J., Da Motta, R. S., Armijo, E., Castello, L., Brando, P., Hansen, M. C., McGrath-Horn, M., Carvalho, O., and Hess, L.: Slowing Amazon deforestation through public policy and interventions in beef and soy supply chains, Science, 344, 1118–1123, https://doi.org/10.1126/science.1248525, 2014. a, b
Niyogi, D., Chang, H. I., Saxena, V. K., Holt, T., Alapaty, K., Booker, F., Chen, F., Davis, K. J., Holben, B., Matsui, T., Meyers, T., Oechel, W. C., Pielke, R. A., Wells, R., Wilson, K., and Xue, Y.: Direct observations of the effects of aerosol loading on net ecosystem CO2 exchanges over different landscapes, Geophys. Res. Lett., 31, 1–5, https://doi.org/10.1029/2004GL020915, 2004. a, b, c
Nogueira, E. M., Nelson, B. W., Fearnside, P. M., França, M. B., and de Oliveira, Á. C. A.: Tree height in Brazil's “arc of deforestation”: Shorter trees in south and southwest Amazonia imply lower biomass, Forest Ecol. Manag., 255, 2963–2972, https://doi.org/10.1016/j.foreco.2008.02.002, 2008. a
Oliveira, M. I., Acevedo, O. C., Sörgel, M., Nascimento, E. L., Manzi, A. O., Oliveira, P. E. S., Brondani, D. V., Tsokankunku, A., and Andreae, M. O.: Planetary boundary layer evolution over the Amazon rainforest in episodes of deep moist convection at the Amazon Tall Tower Observatory, Atmos. Chem. Phys., 20, 15–27, https://doi.org/10.5194/acp-20-15-2020, 2020. a
Oliveira, P. H., Artaxo, P., Pires, C., De Lucca, S., Procópio, A., Holben, B., Schafer, J., Cardoso, L. F., Wofsy, S. C., and Rocha, H. R.: The effects of biomass burning aerosols and clouds on the CO2 flux in Amazonia, Tellus B, 59, 338–349, https://doi.org/10.1111/j.1600-0889.2007.00270.x, 2007. a, b, c, d, e, f, g, h, i, j, k, l, m, n
Oliveira, P. S. and Marquis, R. J.: The Cerrados of Brazil: Ecology and Natural History of a Neotropical Savanna, Columbia University Press New York, http://www.jstor.org/stable/10.7312/oliv12042 (last access: 25 July 2022), 2002. a
Ometto, J., Kalaba, K., Anshari, G., Chacón, N., Farrell, A., Halim, S., Neufeldt, H., and Sukumar, R.: Cross, Chap. 7, Tropical Forests, 2369–2410, Cambridge University Press, Cambridge, UK and New York, USA, ISBN 9781009325844, https://doi.org/10.1017/9781009325844.024.2369, 2022. a
Palácios, R. d. S., Romera, K. S., Curado, L. F. A., Banga, N. M., Rothmund, L. D., Sallo, F. d. S., Morais, D., Santos, A. C. A., Moraes, T. J., Morais, F. G., Landulfo, E., Franco, M. A. d. M., Kuhnen, I. A., Marques, J. B., Nogueira, J. d. S., Júnior, L. C. G. d. V., and Rodrigues, T. R.: Long Term Analysis of Optical and Radiative Properties of Aerosols in the Amazon Basin, Aerosol Air Qual. Res., 20, 139–154, https://doi.org/10.4209/aaqr.2019.04.0189, 2020. a
Pan, Y.: A large and persistent carbon sink in the world's forests, Science, 333, 988–993, 2011. a
Prado, D. E. and Gibbs, P. E.: Patterns of Species Distributions in the Dry Seasonal Forests of South America, Ann. Mo. Bot. Gard., 80, 902–927, https://doi.org/10.2307/2399937, 1993. a
Procopio, A. S., Artaxo, P., Kaufman, Y. J., Remer, L. A., Schafer, J. S., and Holben, B. N.: Multiyear analysis of amazonian biomass burning smoke radiative forcing of climate, Geophys. Res. Lett., 31, 1–4, https://doi.org/10.1029/2003GL018646, 2004. a
Rap, A.: Fires increase Amazon forest productivity, Geophys. Res. Lett., 42, 4654–4662, https://doi.org/10.1002/2015GL063719, 2015. a, b, c, d, e, f, g, h
Rap, A., Scott, C. E., Reddington, C. L., Mercado, L., Ellis, R. J., Garraway, S., Evans, M. J., Beerling, D. J., MacKenzie, A. R., Hewitt, C. N., and Spracklen, D. V.: Enhanced global primary production by biogenic aerosol via diffuse radiation fertilization, Nat. Geosci., 11, 640–644, https://doi.org/10.1038/s41561-018-0208-3, 2018. a, b, c, d, e
Ratter, J. A., Askew, G. P., Montgomery, R. F., and Gifford, D. R.: Observations on the vegetation of northeastern Mato Grosso II. Forests and soils of the Rio Suiá–Missu area., P. Roy. Soc. Lond. B, 203, 191–208, https://doi.org/10.1098/rspb.1978.0100, 1978. a
Reboita, M. S., Krusche, N., Ambrizzi, T., Porfírio, R., and Rocha, D.: Entendendo o Tempo e o Clima na América do Sul, Terra e Didatica, 8, 34–50, 2012. a
Reichstein, M., Falge, E., Baldocchi, D., Papale, D., Aubinet, M., Berbigier, P., Bernhofer, C., Buchmann, N., Gilmanov, T., Granier, A., Grünwald, T., Havránková, K., Ilvesniemi, H., Janous, D., Knohl, A., Laurila, T., Lohila, A., Loustau, D., Matteucci, G., Meyers, T., Miglietta, F., Ourcival, J.-M., Pumpanen, J., Rambal, S., Rotenberg, E., Sanz, M., Tenhunen, J., Seufert, G., Vaccari, F., Vesala, T., Yakir, D., and Valentini, R.: On the separation of net ecosystem exchange into assimilation and ecosystem respiration: review and improved algorithm, Glob. Change Biol., 11, 1424–1439, https://doi.org/10.1111/j.1365-2486.2005.001002.x, 2005. a
Reindl, D., Beckman, W., and Duffie, J.: Diffuse fraction correlations, Sol. Energy, 45, 1–7, https://doi.org/10.1016/0038-092X(90)90060-P, 1990. a
Remer, L. A., Kaufman, Y. J., Tanré, D., Mattoo, S., Chu, D. A., Martins, J. V., Li, R. R., Ichoku, C., Levy, R. C., Kleidman, R. G., Eck, T. F., Vermote, E., and Holben, B. N.: The MODIS aerosol algorithm, products, and validation, J. Atmos. Sci., 62, 947–973, https://doi.org/10.1175/JAS3385.1, 2005. a
Remer, L. A., Mattoo, S., Levy, R. C., and Munchak, L. A.: MODIS 3 km aerosol product: algorithm and global perspective, Atmos. Meas. Tech., 6, 1829–1844, https://doi.org/10.5194/amt-6-1829-2013, 2013. a, b, c
Cheng, R., KÖhler, P., and Frankenberg, C.: Impact of radiation variations on temporal upscaling of instantaneous Solar-Induced Chlorophyll Fluorescence, Agr. Forest Meteorol., 327, 109197, https://doi.org/10.1016/j.agrformet.2022.109197, 2022. a
Saatchi, S., Longo, M., Xu, L., Yang, Y., Abe, H., André, M., Aukema, J. E., Carvalhais, N., Cadillo-Quiroz, H., Cerbu, G. A., Chernela, J. M., Covey, K., Sánchez-Clavijo, L. M., Cubillos, I. V., Davies, S. J., De Sy, V., De Vleeschouwer, F., Duque, A., Sybille Durieux, A. M., De Avila Fernandes, K., Fernandez, L. E., Gammino, V., Garrity, D. P., Gibbs, D. A., Gibbon, L., Gowae, G. Y., Hansen, M., Lee Harris, N., Healey, S. P., Hilton, R. G., Johnson, C. M., Kankeu, R. S., Laporte-Goetz, N. T., Lee, H., Lovejoy, T., Lowman, M., Lumbuenamo, R., Malhi, Y., Albert Martinez, J. M. M., Nobre, C., Pellegrini, A., Radachowsky, J., Román, F., Russell, D., Sheil, D., Smith, T. B., Spencer, R. G., Stolle, F., Tata, H. L., Torres, D. d. C., Tshimanga, R. M., Vargas, R., Venter, M., West, J., Widayati, A., Wilson, S. N., Brumby, S., and Elmore, A. C.: Detecting vulnerability of humid tropical forests to multiple stressors, One Earth, 4, 988–1003, https://doi.org/10.1016/j.oneear.2021.06.002, 2021. a
Saatchi, S. S., Harris, N. L., Brown, S., Lefsky, M., Mitchard, E. T., Salas, W., Zutta, B. R., Buermann, W., Lewis, S. L., Hagen, S., Petrova, S., White, L., Silman, M., and Morel, A.: Benchmark map of forest carbon stocks in tropical regions across three continents, P. Natl Acad. Sci. USA, 108, 9899–9904, https://doi.org/10.1073/pnas.1019576108, 2011. a
Schafer, J. S., Eck, T. F., Holben, B. N., Artaxo, P., and Duarte, A. F.: Characterization of the optical properties of atmospheric aerosols in Amazônia from long-term AERONET monitoring (1993–1995 and 1999–2006), J. Geophys. Res.-Atmos., 113, 1–16, https://doi.org/10.1029/2007JD009319, 2008. a
Schuepp, P. H., Leclerc, M. Y., MacPherson, J. I., and Desjardins, R. L.: Footprint prediction of scalar fluxes from analytical solutions of the diffusion equation, Bound.-Lay. Meteorol., 50, 355–373, https://doi.org/10.1007/BF00120530, 1990. a
Shilling, J. E., Pekour, M. S., Fortner, E. C., Artaxo, P., de Sá, S., Hubbe, J. M., Longo, K. M., Machado, L. A. T., Martin, S. T., Springston, S. R., Tomlinson, J., and Wang, J.: Aircraft observations of the chemical composition and aging of aerosol in the Manaus urban plume during GoAmazon 2014/5, Atmos. Chem. Phys., 18, 10773–10797, https://doi.org/10.5194/acp-18-10773-2018, 2018. a
Sinyuk, A., Holben, B. N., Eck, T. F., Giles, D. M., Slutsker, I., Korkin, S., Schafer, J. S., Smirnov, A., Sorokin, M., and Lyapustin, A.: The AERONET Version 3 aerosol retrieval algorithm, associated uncertainties and comparisons to Version 2, Atmos. Meas. Tech., 13, 3375–3411, https://doi.org/10.5194/amt-13-3375-2020, 2020. a, b
Spitters, C. J., Toussaint, H. A., and Goudriaan, J.: Separating the diffuse and direct component of global radiation and its implications for modeling canopy photosynthesis, Part I: Components of incoming radiation, Agr. Forest Meteorol., 38, 217–229, https://doi.org/10.1016/0168-1923(86)90060-2, 1986. a, b
Sullivan, M. J. P., Lewis, S. L., Affum-Baffoe, K., Castilho, C., Costa, F., Sanchez, A. C., Ewango, C. E. N., Hubau, W., Marimon, B., Monteagudo-Mendoza, A., Qie, L., Sonké, B., Martinez, R. V., Baker, T. R., Brienen, R. J. W., Feldpausch, T. R., Galbraith, D., Gloor, M., Malhi, Y., Aiba, S.-I., Alexiades, M. N., Almeida, E. C., de Oliveira, E. A., Dávila, E. Á., Loayza, P. A., Andrade, A., Vieira, S. A., Aragão, L., Araujo-Murakami, A., Arets, E. J. M. M., Arroyo, L., Ashton, P., C., G. A., Baccaro, F. B., Banin, L. F., Baraloto, C., Camargo, P. B., Barlow, J., Barroso, J., Bastin, J.-F., Batterman, S. A., Beeckman, H., Begne, S. K., Bennett, A. C., Berenguer, E., Berry, N., Blanc, L., Boeckx, P., Bogaert, J., Bonal, D., Bongers, F., Bradford, M., Brearley, F. Q., Brncic, T., Brown, F., Burban, B., Camargo, J. L., Castro, W., Céron, C., Ribeiro, S. C., Moscoso, V. C., Chave, J., Chezeaux, E., Clark, C. J., de Souza, F. C., Collins, M., Comiskey, J. A., Valverde, F. C., Medina, M. C., da Costa, L., Danˇcák, M., Dargie, G. C., Davies, S., Cardozo, N. D., Thales de Haulleville, de Medeiros, M. B., Pasquel, J. d. A., Derroire, G., Fiore, A. D., Doucet, J.-L., Dourdain, A., Droissart, V., Duque, L. F., Ekoungoulou, R., Elias, F., Erwin, T., Esquivel-Muelbert, A., Fauset, S., Ferreira, J., Llampazo, G. F., Foli, E., Ford, A., Gilpin, M., Hall, J. S., Hamer, K. C., Hamilton, A. C., Harris, D. J., Hart, T. B., Hédl, R., Herault, B., Herrera, R., Higuchi, N., Hladik, A., Eurídice Honorio Coronado, Huamantupa-Chuquimaco, I., Huasco, W. H., Jeffery, K. J., Jimenez-Rojas, E., Kalamandeen, M., Kamdem, M.-N., Kearsley, E., Umetsu, R. K., Khoon, L. K. K., Killeen, T., Kitayama, K., Klitgaard, B., Koch, A., Labrière, N., Laurance, W., Laurance, S., Leal, M. E., Levesley, A., Lima, A. J. N., Lisingo, J., Pontes-Lopes, A., Lopez-Gonzalez, G., Lovejoy, T., Lovett, J., Lowe, R., Magnusson, W. E., Malumbres-Olarte, J., Manzatto, Â. G., Jr., B. H. M., Marshall, A. R., Marthews, T., Reis, S. M. d. A., Maycock, C., Melgaço, K., Mendoza, C., Metali, F., Mihindou, V., Milliken, W., Mitchard, E., Morandi, P. S., Mossman, H. L., Nagy, L., Nascimento, H., Neill, D., Nilus, R., Vargas, P. N., Palacios, W., Camacho, N. P., Peacock, J., Pendry, C., Mora, M. C. P., Pickavance, G. C., Pipoly, J., Pitman, N., Playfair, M., Poorter, L., Poulsen, J. R., Poulsen, A. D., Preziosi, R., Prieto, A., Richard Primack, Ramírez-Angulo, H., Reitsma, J., Réjou-Méchain, M., Correa, Z. R., de Sousa, T. R., Bayona, L. R., Roopsind, A., Rudas, A., Rutishauser, E., Salim, K. A., Salomão, R. P., Schietti, J., Sheil, D., Silva, R. C., Espejo, J. S., Valeria, C. S., Silveira, M., Simo-Droissart, M., Simon, M. F., Singh, J., Shareva, Y. C. S., Stahl, C., Stropp, J., Sukri, R., Sunderland, T., Svátek, M., Swaine, M. D., Swamy, V., Taedoumg, H., Talbot, J., James Taplin, Taylor, D., ter Steege, H., Terborgh, J., Thomas, R., Thomas, S. C., Torres-Lezama, A., Umunay, P., Gamarra, L. V., van der Heijden, G., van der Hout, P., van der Meer, P. J., van Nieuwstadt, M., Verbeeck, H., Vernimmen, R., Vicentini, A., Vieira, I. C. G., Torre, E. V., Vleminckx, J., Vos, V. A., Wang, O., White, L. J. T., Willcock, S., Woods, J. T., Wortel, V., Young, K., Zagt, R., Zemagho, L., Zuidema, P. A., Zwerts, J. A., and Phillips, O. L.: Long-term thermal sensitivity of Earth's tropical forests, Science, 368, 869–874, https://doi.org/10.1126/science.aaw7578, 2020. a
Tribuzy, E. S.: Canopy leaf temperature variations and their effect on the CO2 assimilation rate in Central Amazonia, Doctoral Thesis, p. 102, 2005 (in Portuguese). a, b, c
von Randow, C., Manzi, A. O., Kruijt, B., de Oliveira, P. J., Zanchi, F. B., Silva, R. L., Hodnett, M. G., Gash, J. H., Elbers, J. A., Waterloo, M. J., Cardoso, F. L., and Kabat, P.: Comparative measurements and seasonal variations in energy and carbon exchange over forest and pasture in South West Amazonia, Theor. Appl. Climatol., 78, 5–26, https://doi.org/10.1007/s00704-004-0041-z, 2004. a, b
Vourlitis, G. L., Priante Filho, N., Hayashi, M. M., Nogueira, J. D. S., Caseiro, F. T., and Holanda Campelo, J.: Seasonal variations in the net ecosystem CO2 exchange of a mature Amazonian transitional tropical forest (cerradão), Funct. Ecol., 15, 388–395, https://doi.org/10.1046/j.1365-2435.2001.00535.x, 2001. a, b
Vourlitis, G. L., Priante Filho, N., Hayashi, M. M., Nogueira, J. D. S., Caseiro, F. T., and Campelo, J. H.: Seasonal variations in the evapotranspiration of a transitional tropical forest of Mato Grosso, Brazil, Water Resour. Res., 38, 30-1–30-11, https://doi.org/10.1029/2000wr000122, 2002. a, b, c, d
Vourlitis, G. L., De Almeida Lobo, F., Zeilhofer, P., and De Souza Nogueira, J.: Temporal patterns of net CO2 exchange for a tropical semideciduous forest of the southern Amazon Basin, J. Geophys. Res.-Biogeo., 116, 1–15, https://doi.org/10.1029/2010JG001524, 2011. a, b, c, d, e, f, g, h, i, j, k, l, m, n, o, p, q, r, s, t
Wang, X., Wang, C., Wu, J., Miao, G., Chen, M., Chen, S., Wang, S., Guo, Z., Wang, Z., Wang, B., Li, J., Zhao, Y., Wu, X., Zhao, C., Lin, W., Zhang, Y., and Liu, L.: Intermediate Aerosol Loading Enhances Photosynthetic Activity of Croplands, Geophys. Res. Lett., 48, e2020GL091893, https://doi.org/10.1029/2020GL091893, 2021. a
Wang, Z., Wang, C., Wang, X., Wang, B., Wu, J., and Liu, L.: Aerosol pollution alters the diurnal dynamics of sun and shade leaf photosynthesis through different mechanisms, Plant Cell Environ., 45, 2943–2953, https://doi.org/10.1111/pce.14411, 2022. a
Wu, J., Albert, L. P., Lopes, A. P., Restrepo-Coupe, N., Hayek, M., Wiedemann, K. T., Guan, K., Stark, S. C., Christoffersen, B., Prohaska, N., Tavares, J. V., Marostica, S., Kobayashi, H., Ferreira, M. L., Campos, K. S., da Silva, R., Brando, P. M., Dye, D. G., Huxman, T. E., Huete, A. R., Nelson, B. W., and Saleska, S. R.: Leaf development and demography explain photosynthetic seasonality in Amazon evergreen forests, Science, 351, 972–976, https://doi.org/10.1126/science.aad5068, 2016. a
Wutzler, T., Lucas-Moffat, A., Migliavacca, M., Knauer, J., Sickel, K., Šigut, L., Menzer, O., and Reichstein, M.: Basic and extensible post-processing of eddy covariance flux data with REddyProc, Biogeosciences, 15, 5015–5030, https://doi.org/10.5194/bg-15-5015-2018, 2018. a, b
Yakir, D.: 4.07 – The Stable Isotopic Composition of Atmospheric CO2, in: Treatise on Geochemistry, edited by: Holland, H. D. and Turekian, K. K., 175–212, Pergamon, Oxford, ISBN 978-0-08-043751-4, https://doi.org/10.1016/B0-08-043751-6/04038-X, 2003. a
Yamasoe, M. A., von Randow, C., Manzi, A. O., Schafer, J. S., Eck, T. F., and Holben, B. N.: Effect of smoke and clouds on the transmissivity of photosynthetically active radiation inside the canopy, Atmos. Chem. Phys., 6, 1645–1656, https://doi.org/10.5194/acp-6-1645-2006, 2006. a, b
Yuan, W., Zheng, Y., Piao, S., Ciais, P., Lombardozzi, D., Wang, Y., Ryu, Y., Chen, G., Dong, W., Hu, Z., Jain, A. K., Jiang, C., Kato, E., Li, S., Lienert, S., Liu, S., Nabel, J. E., Qin, Z., Quine, T., Sitch, S., Smith, W. K., Wang, F., Wu, C., Xiao, Z., and Yang, S.: Increased atmospheric vapor pressure deficit reduces global vegetation growth, Sci. Adv., 5, 1–13, https://doi.org/10.1126/sciadv.aax1396, 2019. a
Zhang, M., Yu, G. R., Zhang, L. M., Sun, X. M., Wen, X. F., Han, S. J., and Yan, J. H.: Impact of cloudiness on net ecosystem exchange of carbon dioxide in different types of forest ecosystems in China, Biogeosciences, 7, 711–722, https://doi.org/10.5194/bg-7-711-2010, 2010. a, b
Zhang, Z., Chen, J. M., Zhang, Y., and Li, M.: Improving the ability of solar-induced chlorophyll fluorescence to track gross primary production through differentiating sunlit and shaded leaves, Agr. Forest Meteorol., 341, 109658, https://doi.org/10.1016/j.agrformet.2023.109658, 2023 a