the Creative Commons Attribution 4.0 License.
the Creative Commons Attribution 4.0 License.
 | 25 Feb 2025
Modelling ozone-induced changes in wheat amino acids and protein quality using a process-based crop model
Durgesh Singh Yadav
Felicity Hayes
Nathan Booth
Sam Bland
Pritha Pande
Samarthia Thankappan
Lisa Emberson
Ozone (O3) pollution reduces wheat yields as well as the protein and micronutrient yield of the crop. O3 concentrations are particularly high in India and are set to increase, threatening wheat yields and quality in a country already facing challenges to food security. This study aims to improve the existing DO3SE-CropN model to simulate the effects of O3 on Indian wheat quality by incorporating antioxidant processes to simulate protein and the concentrations of nutritionally relevant amino acids. As a result, the improved model can now capture the decrease in protein concentration that occurs in Indian wheat exposed to elevated O3. The structure of the modelling framework is transferrable to other abiotic stressors and easily integrable into other crop models, provided they simulate leaf and stem nitrogen (N), demonstrating the flexibility and usefulness of the framework developed in this study. Further, the modelling results can be used to simulate the dietary indispensable amino acid score (DIAAS), the metric for measuring protein quality recommended by the Food and Agriculture Organization (FAO) of the United Nations, setting up a foundation for nutrition-based risk assessments of O3 effects on crops. The resulting model was able to capture grain protein, lysine and methionine concentrations reasonably well. As a proportion of dry matter, the simulated percentages ranged from 0.26 % to 0.38 % for lysine and from 0.13 % to 0.22 % for methionine, while the observed values were 0.16 % to 0.38 % and 0.14 % to 0.22 %, respectively. For grain and leaf protein simulations, the interdependence between parameters reduced the accuracy of their respective relative protein loss under O3 exposure. Additionally, the decrease in lysine and methionine concentrations under O3 exposure was underestimated by ∼ 10 percentage points for methionine for both cultivars and by 37 and 19 percentage points for lysine for HUW234 and HD3118, respectively. This underestimation occurs despite simulations of relative yield loss being fairly accurate (average deviation of 2.5 percentage points excluding outliers). To provide a further mechanistic understanding of O3 effects on wheat grain quality, future experiments should measure N and protein concentrations in leaves and stems, along with the proportion of N associated with antioxidants, which will aid in informing future model development. Additionally, exploring how grain protein relates to amino acid concentrations under O3 will enhance the model's accuracy in predicting protein quality and provide more reliable estimates of the influence of O3 on wheat quality. This study builds on the work of Cook et al. (2024) and supports the second phase of the Tropospheric Ozone Assessment Report (TOAR) by investigating the impacts of tropospheric O3 on Indian wheat and the potential of this to exacerbate existing malnutrition in India.
- Article
(3508 KB) - Full-text XML
-
Supplement
(887 KB) - BibTeX
- EndNote


A growing body of literature from Europe, China and India has shown that exposure to O3 reduces wheat protein and micronutrient yields (Broberg et al., 2015; Feng et al., 2008; Mishra et al., 2013; Yadav et al., 2020). This is important as cereals often make up the most available protein source per capita and wheat is the dominant dietary cereal globally (Shiferaw et al., 2013). Therefore, any reduction in yield, protein and micronutrient content caused by O3 could threaten both food and nutrition security, especially in countries such as India where O3 concentrations are high and food security is low (FAO et al., 2020; Herforth et al., 2020; Mills et al., 2018b). The first phase of the Tropospheric Ozone (O3) Assessment Report (TOAR) (https://igacproject.org/activities/TOAR/TOAR-I, last access: 30 September 2024) compiled information on surface O3 metrics to produce the world's largest database for the identification of O3 global distribution and trends (Schultz et al., 2017). From the first phase of TOAR, it was observed that tropospheric O3 increased globally in the 20th century, with atmospheric chemistry and climate modelling studies finding that O3 production is greatest in middle to high latitudes due to greater emissions of O3 precursors (Archibald et al., 2020; Cooper et al., 2014). Additionally, using the database, Mills et al. (2018b) found that in East Asia O3 concentration metrics for wheat-growing locations were much greater than in Europe. Several authors from the first phase of TOAR commented on the underrepresentation of some key wheat-producing areas (particularly India but also China and Russia) in the database, which limited some of the analysis (Cooper et al., 2014; Mills et al., 2018b; Schultz et al., 2017). This paper is part of the second phase of TOAR (https://igacproject.org/activities/TOAR/TOAR-II, last access: 30 September 2024), which expands on the first phase to investigate O3 impacts on human health and vegetation. This study contributes to the second phase of TOAR by examining the impacts of tropospheric O3 on wheat yield and quality in India, enhancing our understanding of the broader implications for food and nutrition security. Understanding the interplay of different factors affecting O3-induced reductions in wheat yield and quality will be important for current, as well as future, food and nutritional security risk assessments.
1.1 Malnutrition and the importance of wheat in India
Malnutrition is prevalent in India with ∼ 40 % of the population unable to afford a nutritionally adequate diet and ∼ 80 % unable to afford a healthy diet (FAO et al., 2023). In India, ∼ 35 % of children under the age of 5 are affected by stunting and ∼ 20 % are affected by wasting, with the prevalence of wasting in India being one of the highest in the world (Global Nutrition Report, 2025). Stunting and wasting occur when an individual does not have sufficient calories or micronutrients in their diet to grow and develop (Gonmei and Toteja, 2018). Wasting and muscle function loss can result from dietary protein that is of poor quantity or quality (Medek et al., 2017). For most Indian states, at least 30 % of the population is at risk of protein deficiency, which is of concern for people who are pregnant or in poorer socioeconomic circumstances, who require higher-quality protein for growth or fighting infections (Minocha et al., 2017; Swaminathan et al., 2012).
In India, cereals are the most available protein source per capita and are a key dietary protein source (Minocha et al., 2017). Wheat makes up the dominant dietary cereal in the north of India, where the majority of the crop is grown (Khatkar et al., 2015). Globally, India has the greatest area under wheat cultivation, 31.6 million hectares, and produced 109.5 million tonnes of wheat in 2021, second only to the amount of wheat produced by China (Ministry of Agriculture & Farmers Welfare, 2022). As a result, the country is self-sufficient/self-reliant when it comes to wheat (Tripathi and Mishra, 2017). The consumption of wheat varies by state, with the dominant wheat-producing states (Punjab, Rajasthan, Haryana and Madhya Pradesh) consuming the most. Resulting from population growth and income increases, the total demand for wheat is increasing (Tripathi and Mishra, 2017). However, numerous experimental and modelling studies have shown that O3 is substantially reducing wheat yields across India (Mills et al., 2018a; Mishra et al., 2013; Sharma et al., 2019; Sinha et al., 2015; Yadav et al., 2021).
1.2 O3 pollution in India
Ground level O3 is a secondary pollutant, formed when precursor gases (predominantly volatile organic compounds and nitrogen oxides) react in the presence of ultraviolet light (Fowler et al., 2008). The first phase of TOAR identified that South Asia and, in particular, India experience some of the highest O3 burdens of any region or country worldwide, though this analysis was limited by the availability of O3 concentration data for India (Emberson, 2020; Mills et al., 2018b). These high O3 burdens occur due to increasing precursor emissions and insufficient pollution control measures (Archibald et al., 2020; Elshorbany et al., 2024; Singh et al., 2023; Wang et al., 2023). Atmospheric chemistry and climate models have found that, geographically, the highest O3 concentrations in India occur in the northern part of the country and the Indo-Gangetic Plain (IGP), where the majority of wheat is grown (Lu et al., 2018; Ministry of Agriculture & Farmers Welfare, 2022; Rathore et al., 2023). In the future, the changing climate will affect O3 concentrations, with model projections agreeing that climatic conditions across the north of India will favour greater O3 production (Kumar et al., 2018; Li et al., 2023; Stevenson et al., 2013). Using a Nested Regional Climate Model with Chemistry, Kumar et al. (2018) projected that O3 concentrations across India will rise under RCP8.5 (Representative Concentration Pathway), while they will remain comparable to current levels under RCP6.0. For the dry, wheat growing season, the authors projected that O3 concentrations across the IGP will increase under both RCP6.0 and RCP8.5, with a much larger increase under RCP8.5 (Kumar et al., 2018). This is a critical finding given the majority of wheat is grown in the north of India, across the IGP (Ministry of Agriculture & Farmers Welfare, 2022).
1.3 Effects of O3 pollution on wheat yields
O3 diffuses into wheat leaves via the stomates and impacts photosynthesis and senescence when antioxidant defences are compromised (Emberson et al., 2018; Rai and Agrawal, 2012; Tiwari and Agrawal, 2018). Accelerated senescence shortens the grain-filling period, and the decline in photosynthesis decreases biomass production, ultimately leading to lower crop yields (Emberson et al., 2018; Tiwari and Agrawal, 2018).
Several experimental studies using wheat cultivars commonly grown in India have shown decreases in yield due to elevated O3 exposure (Naaz et al., 2022; Pandey et al., 2018; Tomer et al., 2015; Yadav et al., 2021). National estimates of relative yield (RY) loss due to O3 across India vary between 3.8 %–41 % between studies (Avnery et al., 2011; Van Dingenen et al., 2009; Droutsas, 2020; Ghude et al., 2014; Lal et al., 2017; Sharma et al., 2019; Sinha et al., 2015). The effects of O3 on wheat yield also vary spatially (Droutsas, 2020; Ghude et al., 2014; Lal et al., 2017; Mills et al., 2018a; Sharma et al., 2019). Mills et al. (2018a) found the greatest yield losses across the north of the country as the meteorological conditions are more favourable to O3 uptake. Lal et al. (2017) also found the greatest wheat yield losses due to O3 in the north and west of India, where the majority of wheat is grown. Further, Naaz et al. (2022) exposed Indian wheat cultivars to different conditions representing future O3 and climate scenarios, finding that areas suitable for wheat cultivation will be reduced in the future.
1.4 Effects of O3 pollution on wheat quality
Studies have shown that the starch, protein and micronutrient yield of wheat decreases under elevated O3 exposure (Broberg et al., 2015; Piikki et al., 2008; Tomer et al., 2015). Pre-anthesis, the accumulation of nitrogen (N) in upper plant parts, is unaffected by elevated O3 concentrations (Brewster et al., 2024). However, after anthesis, the O3-induced acceleration of plant senescence limits the remobilisation of N from the leaves and stem to the grain (Brewster et al., 2024; Broberg et al., 2017; Chang-Espino et al., 2021). Brewster et al. (2024) also suggest that an additional process affects N remobilisation to the grain, as they found an increase in residual N in the flag leaf, despite not detecting a difference in senescence onset. It is possible that the residual N is in the form of antioxidants (for example glutathione) which the plant creates for defence against O3-induced reactive oxygen species (ROSs) (Brewster et al., 2024; Sarkar and Agrawal, 2010; Yadav et al., 2019). Overall, the reduction in N remobilisation leads to reduced N deposition to the grain and a reduced grain N, as well as protein, yield (Broberg et al., 2015; Cook et al., 2024; Yadav et al., 2020).
In wheat, since the grain yield is decreased to a greater extent than proteins and micronutrients under increased O3, the concentration of protein and micronutrients in the grains generally increases (Feng and Kobayashi, 2009; Piikki et al., 2008). However, some wheat varieties, particularly Indian wheat, have shown a different pattern, where the protein yield and concentration of the grains decreases under O3 exposure (Baqasi et al., 2018; Mishra et al., 2013; Yadav et al., 2020).
Indispensable amino acids (AAs) are most important for nutrition as they cannot be synthesised by the body and must be obtained through diet (Brestenský et al., 2019). Additionally, the quantity of N-containing compounds consumed is important for the synthesis of dispensable AAs (Brestenský et al., 2019). Nevertheless, while dispensable AAs can be produced by the body, their consumption is still important for supporting metabolic functions (Brestenský et al., 2019). The production of different proteins in the body requires AAs in differing proportions (Shewry and Hey, 2015). The AA that is available in the lowest proportion, the most limiting AA, determines protein production (Elango et al., 2008; Shewry and Hey, 2015). Un-utilised AAs cannot be stored, so if they are not used for protein production, they are oxidised (Brestenský et al., 2019; Elango et al., 2008). Yadav et al. (2020) looked at the AA profiles of a modern (HD3118), as well as old (HUW234), wheat cultivar exposed to O3, finding indispensable and dispensable AAs decreased under O3 exposure. The effect of O3 on the protein quality of wheat is of particular concern given the existing state of malnutrition in India.
1.5 Crop modelling for O3 and nutrition
Several crop models have been used to investigate the impacts of O3 pollution on crop yields in a wide range of countries and globally (Droutsas, 2020; Guarin et al., 2019, 2024; Nguyen et al., 2024; Schauberger et al., 2019; Tai et al., 2021; Tao et al., 2017; Tian et al., 2015; Xu et al., 2023; Zhou et al., 2018). Ebi et al. (2021) highlight the usefulness of models for such risk assessments, while they stress that most do not consider aspects relevant for human nutrition in their simulations. Currently, only one model has been developed which captures the effect of O3 on crop nutrition: DO3SE-CropN (Cook et al., 2024). DO3SE-CropN is built on the existing DO3SE-Crop model, which takes inputs of hourly meteorology and O3 concentrations to simulate crop phenology, O3-impacted net photosynthesis, dry matter partitioning, grain filling and O3-impacted crop senescence (Pande et al., 2025). The DO3SE-CropN model then simulates crop N and explicitly models the effect of O3 on reducing the amount of N from the leaves and stems that is available for the grain. From the grain N content (g N m−2), grain protein content (g protein m−2) is easily obtained using conversion factors (Mariotti et al., 2008).
The DO3SE-CropN model was originally developed to capture the increase in N concentration (100g N g DM−1, where DM refers to dry matter) and decrease in N yield (g N m−2) that occur under O3 exposure in European wheat (Cook et al., 2024). However, Indian wheat experiences a decrease in grain protein concentration as well as a decrease in grain protein yield under elevated O3 concentrations (Mishra et al., 2013; Yadav et al., 2020). In India, the ambient O3 concentrations are high, leading to ROS production and subsequent yield losses (Sharma et al., 2019; Sinha et al., 2015; Tiwari and Agrawal, 2018). The production of antioxidants by the plant to defend against ROSs reduces the proportion of proteins that would otherwise be remobilised to the grain, reducing grain protein (Yadav et al., 2019, 2020). Therefore, to capture the decrease in the protein concentration of Indian wheat under O3 exposure, the inclusion of antioxidant processes is essential. Further, the inclusion of such processes will improve the wider applicability of the model for simulating O3 effects on wheat quality for regions with high O3 concentrations.
Further, to expand the nutritional relevance of the model, it would be useful to simulate the effect of O3 on protein quality. This can be done through simulating AA concentrations, which can subsequently be used to calculate the metric for measuring protein quality recommended by the Food and Agriculture Organization (FAO) of the United Nations, the dietary indispensable AA score (DIAAS). The inclusion of protein quality would allow for risk assessments of O3 effects on wheat nutrition in addition to yield.
1.6 Aims
In the present study, the DO3SE-CropN model was further developed and applied with 2 years of meteorological data. The model was calibrated using phenology, photosynthesis and yield data collected for two cultivars (HUW234 and HD3118) grown under both ambient and elevated O3 treatments. All data were available from Yadav et al. (2021). Grain quality data were obtained from an experiment on the same cultivars a year prior; however hourly meteorological and O3 data were not available for this year (Yadav et al., 2020). In the absence of further data, this study assumes that the grain protein concentration and grain protein quality will respond similarly to O3 between years. The aims of the present study were to use the available data for the following:
-
develop a framework to simulate the antioxidant response of wheat under O3 exposure for incorporation into the existing DO3SE-CropN model
-
develop a method for simulating the impact of O3 exposure on the protein quality of wheat, focussing on AAs essential for human nutrition, for incorporation into the existing DO3SE-CropN model.
2.1 Integrating antioxidant processes into DO3SE-CropN
The DO3SE-Crop model is a coupled stomatal conductance–photosynthesis model, which simulates stomatal O3 uptake and its impact on photosynthesis which the plant can recover from overnight, as well as O3-induced accelerated crop senescence (Pande et al., 2025). Daily photosynthate is partitioned between the leaves, stem, roots and grains according to the plant's growth stage (Osborne et al., 2015; Pande et al., 2025). Development of DO3SE-Crop has allowed for the O3 impact on wheat production in China and Europe to be estimated (Nguyen et al., 2024; Pande et al., 2025). The N module for DO3SE-Crop, developed by Cook et al. (2024), takes inputs of daily stem and leaf dry matter (DM), as well as the onset of crop senescence, to simulate the N accumulated by the leaf and stem. The remobilisation of N from the leaf and stem to the grain after anthesis is simulated using a sigmoid function. To account for the reduction in N remobilisation under O3 exposure, a relationship linking accumulated O3 flux to the minimum N levels in the leaf and stem is incorporated (Brewster et al., 2024; Cook et al., 2024). The model allowed for the decrease in grain N yield (g N m−2) and increase in grain N concentration (100 g N g DM−1) of European wheat under O3 exposure to be simulated (Cook et al., 2024). When the N module is integrated within the existing DO3SE-Crop model, the resulting model is termed DO3SE-CropN. A full write-up of the equations and processes of the DO3SE-Crop model is given in Pande et al. (2025). Additionally, a full description of the equations and processes of version 1.0 of the N module developed for DO3SE-Crop is given in Cook et al. (2024). In this study version 4.39.16 of the DO3SE-Crop model was used (Bland, 2024), along with version 2.0 of the N module (Cook, 2024).
The first iteration of DO3SE-CropN (Cook et al., 2024) did not consider the utilisation of leaf and stem N in creating defence proteins, yet for Indian wheat this may be an important process to explain the decrease in grain protein concentration as well as yield (Yadav et al., 2019, 2020). Here we propose a method by which the leaf and stem N involved in antioxidant production may be quantified (Fig. 1). For the purposes of this study, we do not consider individual antioxidants (e.g. superoxide dismutase, Tiwari and Agrawal, 2018). Instead, we model a general pool of N that we hypothesise to be associated with antioxidants. This antioxidant pool of N is subsequently unavailable to the grain and is suggested to partially explain the decrease in grain protein of Indian wheat under O3 exposure.
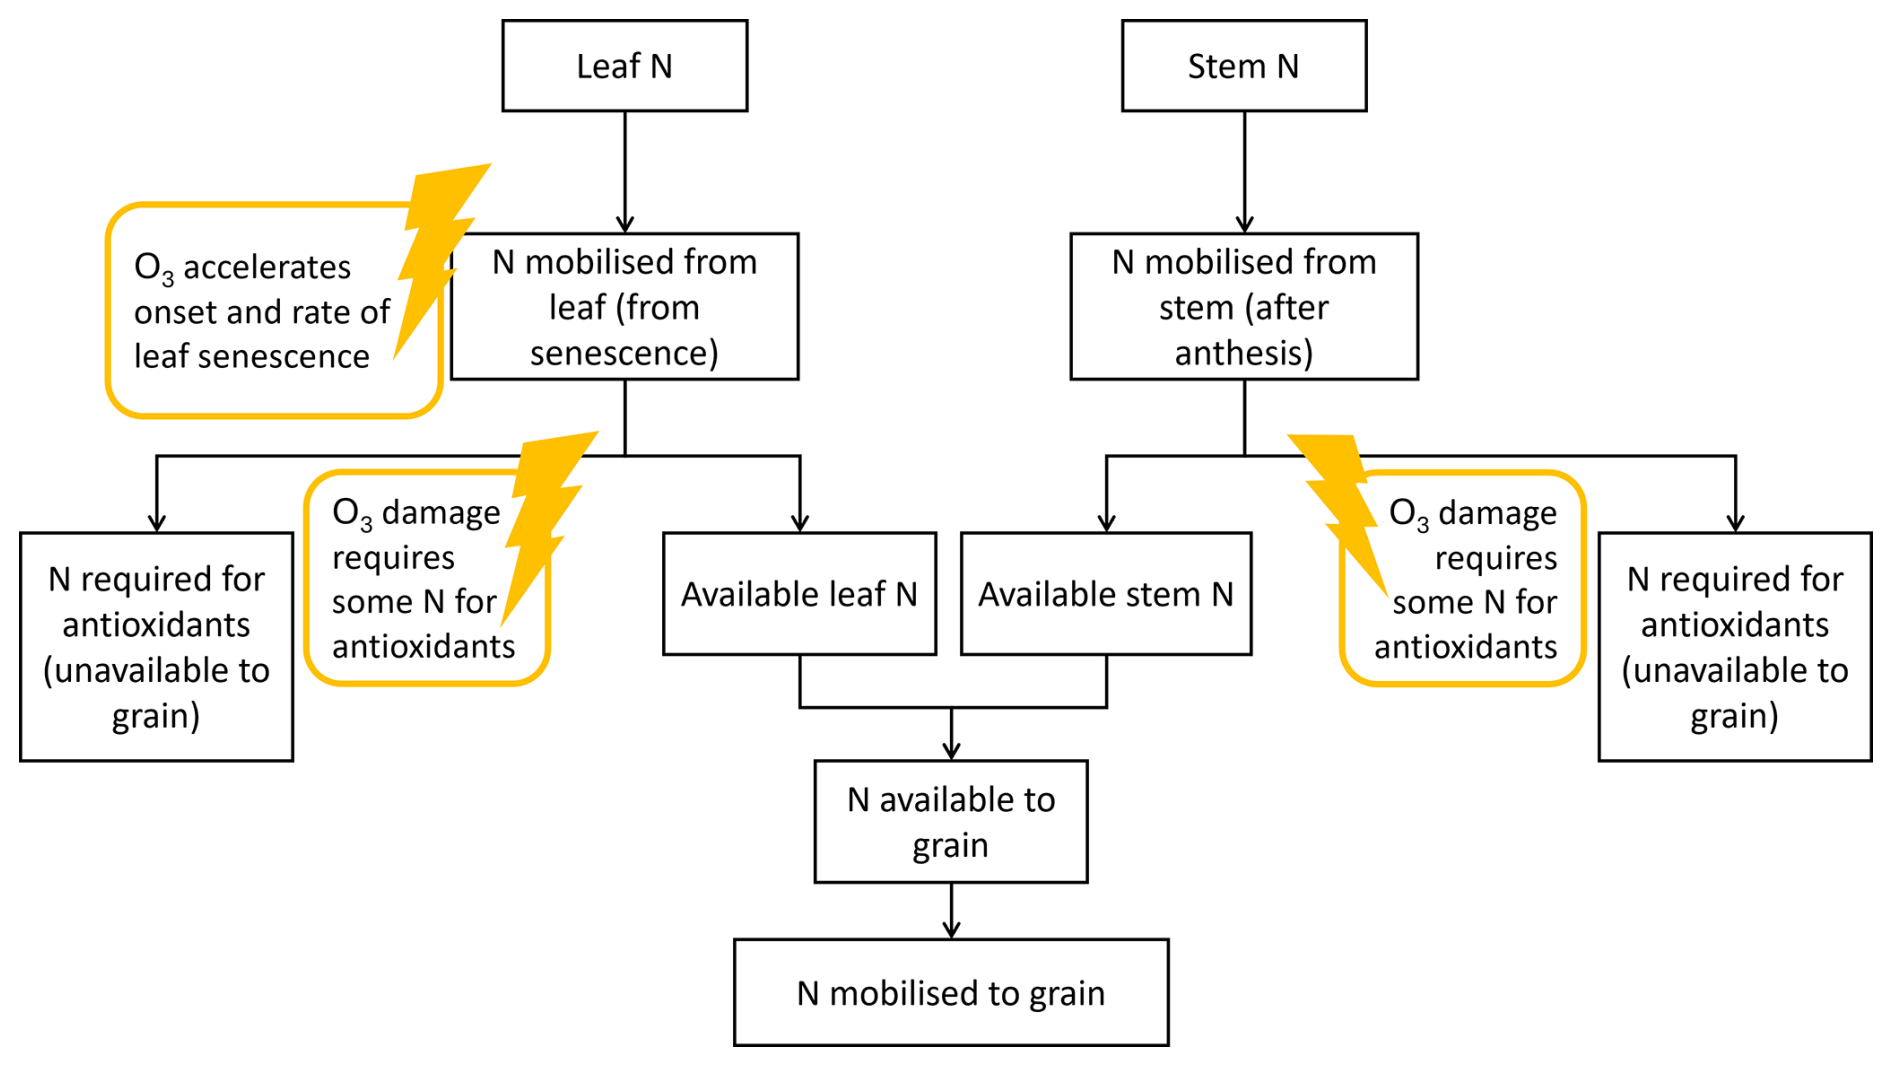
Figure 1Diagram of the proposed method for integrating antioxidant response under O3 exposure into the existing N module for DO3SE-Crop. The lightning strikes represent the points where O3 interacts with the antioxidant processes in the model.
Figure 1 shows how antioxidant processes can be integrated within the existing DO3SE-CropN framework. When the leaf senesces, N is released from the leaf. The N module is linked to the existing DO3SE-Crop model so that increasing stomatal O3 flux accelerates senescence, which accelerates N release from the leaf. N is released until the minimum leaf N concentration is reached. Previously, the minimum leaf N concentration increased with O3 concentration to represent the increase in residual N (Cook et al., 2024). Now it is hypothesised that this increase in residual N is due to the leaf and stem using N for antioxidants which remain in the leaf. After a threshold of accumulated O3 flux has been exceeded, we allocate a proportion of the released N to an antioxidant pool, which means it is unavailable to the grain. Since the stem is also involved in antioxidant response and defence against ROSs (Bazargani et al., 2011; Gao et al., 2018; Li et al., 2022), the same mechanism is used for the stem. We determine the proportion of N that will be allocated to the antioxidant pool using an equation that follows a structure similar to the drought stress factor of Liu et al. (2018), as both O3 and drought stress are ROS mediated (Khanna-Chopra, 2012). Liu et al. (2018) use their drought stress factor to empirically modify the N : protein conversion factor under drought stress. Here, we introduce this method to the DO3SE-CropN model via Eq. (1) as a more mechanistic approach. Instead of modifying the N : protein conversion factor under an abiotic stress, we use the structure of the equation of Liu et al. (2018) to determine N allocation to the antioxidant pool, thereby reducing the N available to the grain and subsequently affecting grain protein.
The proportion of N allocated to the antioxidant pool, , takes the following form:
where fstacc is the current stomatal accumulation of O3 flux in the DO3SE model; fstend is the stomatal accumulation of O3 flux when N is only allocated to the antioxidant pool and is not available to the grain; is the critical level above which O3 flux starts, affecting the onset of senescence in the base DO3SE-Crop model; and apart is a constant modifier that can be calibrated to customise the O3 effect on antioxidants for each plant part (leaf and stem). apart must be equal to or greater than for the antioxidant factor equation to show a decrease in released N with accumulated O3 flux. Further, fstend must be greater than . Of the N released that day, the proportion available to the grain is . The term was chosen as the O3 stress factor as if O3 has exceeded a critical threshold and is affecting senescence onset; we can hypothesise that the allocation of N to antioxidants to protect against O3 stress will be increased. fstend was incorporated into the equation to allow for the end point of the slope to be customised. For varying values of apart, the O3 stress factor is used to calculate the proportion of N available to the grain as a function of accumulated stomatal O3 flux according to Fig. 2.

Figure 2Proportion of N released from stem or leaf senescence that is available to the grain for varying values of apart. The plot uses fstend=30 000 and .
2.2 Identification of nutritionally relevant AAs for O3-exposed wheat
The quality of a protein depends on the proportions of indispensable and dispensable AAs in the food. While Yadav et al. (2020) found that dispensable AAs were reduced to a greater extent than indispensable AAs under O3 exposure, the most limiting for protein production were the indispensable AAs lysine and methionine. Additionally, the concentrations of lysine and methionine were reduced under O3 exposure for both the HD3118 and HUW234 cultivars (Yadav et al., 2020). Therefore, to simulate the protein quality under O3 exposure, lysine and methionine were focussed on.
2.3 Protein and AA calculations
The DO3SE-CropN model outputs a grain N yield (g N m−2) and concentration (100g N g DM−1). From the grain N content, the protein content can be calculated by considering a standard N : protein conversion factor. The Jones' factors are commonly used to convert from N to protein; however, these factors vary between foods and within the same food group (Jones, 1941; Mariotti et al., 2008). On average for whole wheat, the conversion factor is 5.49, which is used in this study to convert grain N to protein (Mariotti et al., 2008). The regressions used to calculate lysine and methionine concentrations of the wheat grain from grain protein percentage are taken from Table 5 of Liu et al. (2019).
2.4 DIAAS
The metric recommended by the FAO for evaluating food protein quality is the dietary indispensable AA score (DIAAS), which corrects for the AA digestibility at the end of the small intestine (FAO, 2013). It therefore reflects the fact that the nutritional quality of protein should account for the AAs required for metabolism (FAO, 2013). The metric also varies for different age groups which have different protein quality requirements (FAO, 2013). Currently, no crop model has incorporated a nutrition measure such as the DIAAS into their models. Additionally, no model has considered the impact of O3 pollution on protein quality, which is critical for risk assessments of O3 stress on food and nutrition security.
There are two steps in calculating the DIAAS. First, the DIAAS reference ratio is calculated for each AA as follows:
where IAA stands for indispensable AAs.
Once the AA concentrations have been obtained from grain protein simulations, as detailed in Sect. 2.3, Eq. (2) is re-written using the parameters used in the crop modelling as
In the second step, the lowest DIAAS reference ratio is selected and used to calculate the DIAAS as in Eq. (4). The lowest reference ratio is selected as this corresponds to the AA which is most limiting in the food and is available in the smallest proportion relative to a person's requirements (Elango et al., 2008). The AA with the lowest availability determines protein production, as well as quality, and the other AAs which are in excess of the most limiting one will be oxidised (Elango et al., 2008).
The true ileal IAA digestibility coefficients for wheat flour required for Eq. (3) can be obtained from Shaheen et al. (2016) for the different AAs. Additionally, the digestible indispensable AA (mg) in 1 g of the dietary protein is tabulated for the different AAs and age groups in FAO (2013). There are different requirements for different age groups as adults only require AAs for maintenance, whereas children require them for growth and maintenance (Shewry and Hey, 2015).
2.5 Calculations of RY loss and the decrease in protein and AA concentrations under O3
For performing risk assessments of O3 damage to crops, RY and RY loss (1−RY) are the commonly used response parameters which quantify the magnitude of the crop yield loss under O3 by comparing it to the corresponding preindustrial value (∼ 10 ppb) (see Eq. 5) (CLRTAP, 2017). Such risk assessments allow for the magnitude of the effects of O3 on crop yields to be estimated (Emberson, 2020).
For the model simulations, the yield under preindustrial O3 was extracted by performing a model run with a constant O3 concentration of 10 ppb, while the yields under the O3 treatment were obtained by running the model with the hourly experimental O3 concentration data for the ambient and elevated (ambient + 20 ppb) treatments. To extract the yield under preindustrial O3 concentrations for the experimental data, the yields for the ambient and elevated treatments were regressed against their M7 (mean hourly O3 concentration during daylight hours from 09:00 to 17:00) value. The regression was then used to calculate the expected yield at a preindustrial M7 value of 10 ppb.
The calculations for obtaining the observed RY for the experimental data assume that the response of yield to increasing O3 concentrations is approximately linear, which is verified in the literature (Pleijel et al., 2022). However, the effect of O3 on leaf and grain protein and grain AAs has received far less attention in the literature, and it is unknown if their response to increasing O3 is also linear. Due to these factors it was not possible to estimate preindustrial leaf and grain protein and grain AA concentrations. Instead, we focus on the reduction in leaf and grain protein and grain AAs under the elevated, as compared to the ambient, O3 treatment.
3.1 Experimental datasets
Datasets for training and evaluation of the DO3SE-CropN model were taken from 3 years of field experiments for wheat harvested between March 2016–2018 at the Botanical Garden, Banaras Hindu University, Varanasi, India, using the HUW234 and HD3118 cultivars. The cultivars are both late-sown and heat-tolerant wheat varieties. For all years, O3 fumigation began 3 d after seed germination, on 13, 14 and 15 December, respectively, for the 2015, 2016 and 2017 wheat growing periods. The wheat was exposed to ambient O3 concentrations and an elevated O3 treatment (ambient + 20 ppb), with the seasonal maximum O3 concentrations ranging from 80–100 ppb and an average ambient M7 of 48 ppb across 2017 and 2018. For all experiments the wheat was sown on 5 December and harvested on 30 March. The wheat was grown in non-filtered open-top chambers across all 3 years. The wheat did not experience any soil water or N stress. For greater detail about the experimental set-up and measurements taken, the reader is referred to Yadav et al. (2020) and Yadav et al. (2021). A scaling factor was applied to each AA concentration in Yadav et al. (2020) based on the mean concentration of AAs in Siddiqi et al. (2020) to ensure values were consistent with the wider literature on AA concentrations for Indian wheat.
The meteorological data for the model input were taken from an on-site weather and O3 monitoring system. The input temperature data were corrected for the heating effect of the open-top chambers, with the chambers found to be approximately 2 °C warmer than the ambient air (see Supplement). Due to gaps in the hourly meteorological data, gap filling was performed according to Emberson et al. (2021).
3.2 Model calibration and evaluation
3.2.1 Model calibration
The calibration for DO3SE-CropN is performed sequentially to allow for the interactions between parameters at each stage to be limited (Cook et al., 2024). The key parameters calibrated in the DO3SE-CropN model are given in Cook et al. (2024), and the same method of calibration is used in this study. In the present study, there are three additional parameters to calibrate based on the newly introduced antioxidant module: fstend, aleaf and astem.
The maximum catalytic rate at 25 °C (Vcmax,25) and the maximum rate of electron transport at 25 °C (Jmax,25) were fixed at the values provided by Yadav et al. (2020) in their supplementary data. The authors' supplementary data on the maximum photosynthetic rate were combined with data provided by the authors on maximum stomatal conductance to vary the species-specific sensitivity of stomatal conductance to the assimilation rate (m), as well as the parameter describing variation in stomatal conductance in response to the vapour pressure deficit (VPD0), until a close match between the photosynthetic rate and stomatal conductance was achieved (Yadav et al., 2020). Additional data provided by the authors of Yadav et al. (2020) were utilised to calculate the dark respiration rate, allowing for calibration of the dark respiration coefficient for all simulations. Subsequently, the parameters controlling biomass accumulation and O3 damage were calibrated using the biomass data provided and assuming a seasonal maximum leaf area index (LAI) of 5. The O3 damage parameters were incorporated at this stage due to high ambient O3 concentrations which caused an O3-induced reduction in yield even under the ambient treatment. The parameters controlling leaf and stem N were varied to achieve a close match for the leaf and grain protein simulations, as no stem N data were available for calibration. During this stage of the calibration, the gradient of the equations describing the effect of O3 on N remobilisation of the leaf and stem were set to 0 to allow for the newly developed antioxidant processes to be tested, as it was hypothesised in Cook et al. (2024) that the O3 impact on N remobilisation occurs due to antioxidant processes. However, as the calibration was performed, the best results were achieved when the new antioxidant processes were used in combination with the previously developed O3 effect on remobilisation. Therefore, the parameters controlling N remobilisation from the leaf and stem (calibrated in Cook et al., 2024) were varied as little as possible from their defaults to allow for the newly developed antioxidant processes to be parameterised. For a tabulation of parameters calibrated for, as well as the values they were calibrated to, please refer to the Supplement.
Model parameters were calibrated using a combination of a genetic algorithm and a trial-and-error approach to minimise the difference between simulated and observed values while also retaining parameterisations that are physiologically realistic for the plant. For further details of the calibration method, see Cook et al. (2024).
3.2.2 Model evaluation
The input data available for the present study were limited. Initially, the data were split in half, with the 2017 data being used for model calibration and the 2018 data being used for the model evaluation. However, when looking at the results of the evaluation it was clear that the limited input data led to overfitting of the 2017 dataset (see Supplement Figs. S8 and S9). Therefore, to focus on the development of the modelling framework, all available data were used for model calibration. The root mean square error (RMSE) and R2 were used to evaluate the model's suitability at simulating the yields and protein contents of the two cultivars using scikit-learn (Pedregosa et al., 2011). Using the R2 calculation from Pedregosa et al. (2011) can give negative R2 values, where a negative value means that using the mean of the observed values is a better fit to the data than using the model. In this paper the units of the RMSE are the same as the units of the model variable; e.g. for yield the RMSE is reported in g m−2, and for protein percentage (% or 100 g protein g DM−1) the RMSE is reported as percentage points.
4.1 Biomass and protein simulations
Overall, the calibrations for grain yield and leaf and grain protein were reasonable for both cultivars. The grain yield and RY loss simulations performed better for 2018 than 2017. However, there was little difference in the model's capacity to capture the leaf and grain protein concentrations, as well as the relative loss in these, under O3 exposure between the years. As seen in Fig. 3a, the grain yield calibration was satisfactory with an RMSE of 141 g m−2; however it is clear that the calibration was able to simulate the grain DM better for 2018 than 2017. The underestimation of the grain DM in the 2017 dataset ranged between 35 %–46 %. Further, the negative R2 implies that using the mean of the observed data would be a better estimate of grain DM than the model (Pedregosa et al., 2011). The RY loss was captured much better than the grain DM. In Fig. 3b, the model captures the RY loss of the HD3118 cultivar well. However, the HUW234 cultivar has a large difference in RY loss between the 2 years which the model was unable to capture. The average deviation of RY loss from the observed value is 2.5 percentage points excluding the HUW234 cultivar for 2018. When this cultivar is included, the deviation increases to 7 percentage points.
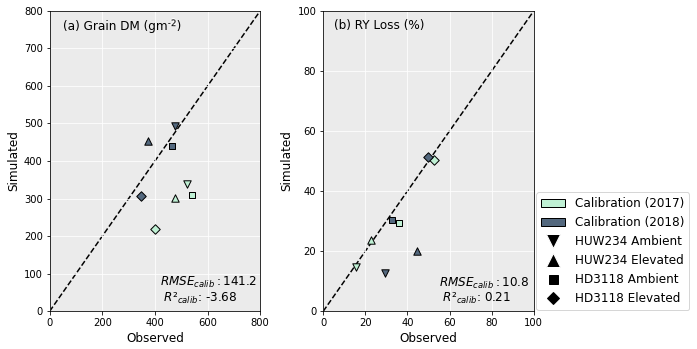
Figure 3Calibration of grain DM (a) and RY loss (b) using the DO3SE-CropN model for the Varanasi dataset. RY loss was calculated in comparison to preindustrial O3 concentrations (see Sect. 2.5).
Figure 4 shows the grain and leaf protein simulations and the relative protein (RP) loss between the ambient and elevated treatments. The grain protein (Fig. 4a) is captured better for 2017 than 2018, but overall, the results are good, with an R2 of 0.5 and an RMSE of only 1.3 %. The grain RP loss between the ambient and elevated O3 treatment is slightly overestimated for the HUW234 cultivar, and for the HD3118 cultivar in 2017 it is slightly underestimated, both by ∼ 2.5 percentage points. However, in 2018 the grain RP loss of the HD3118 cultivar was heavily overestimated by ∼ 6.5 percentage points.
The simulations of leaf protein (Fig. 4c) showed a good fit to the experimental data and were closer to the observed values than grain protein simulations, with an R2 of 0.6 and an RMSE of 0.8 %. Nevertheless, the model captured the pattern of the grain protein concentrations under ambient and elevated O3 concentrations better than the pattern of the leaf protein concentrations (Fig. 4a and c). The leaf RP loss (Fig. 4d) was not well captured. For the HD3118 cultivar, the leaf RP loss was underestimated, and for the HUW234 cultivar it was overestimated. For the HUW234 cultivar the leaf RP loss was overestimated by ∼ 42 percentage points, and for the HD3118 cultivar the RP losses were more variable, with the leaf RP loss underestimated by ∼ 13.5 and ∼ 25 percentage points for 2017 and 2018, respectively.
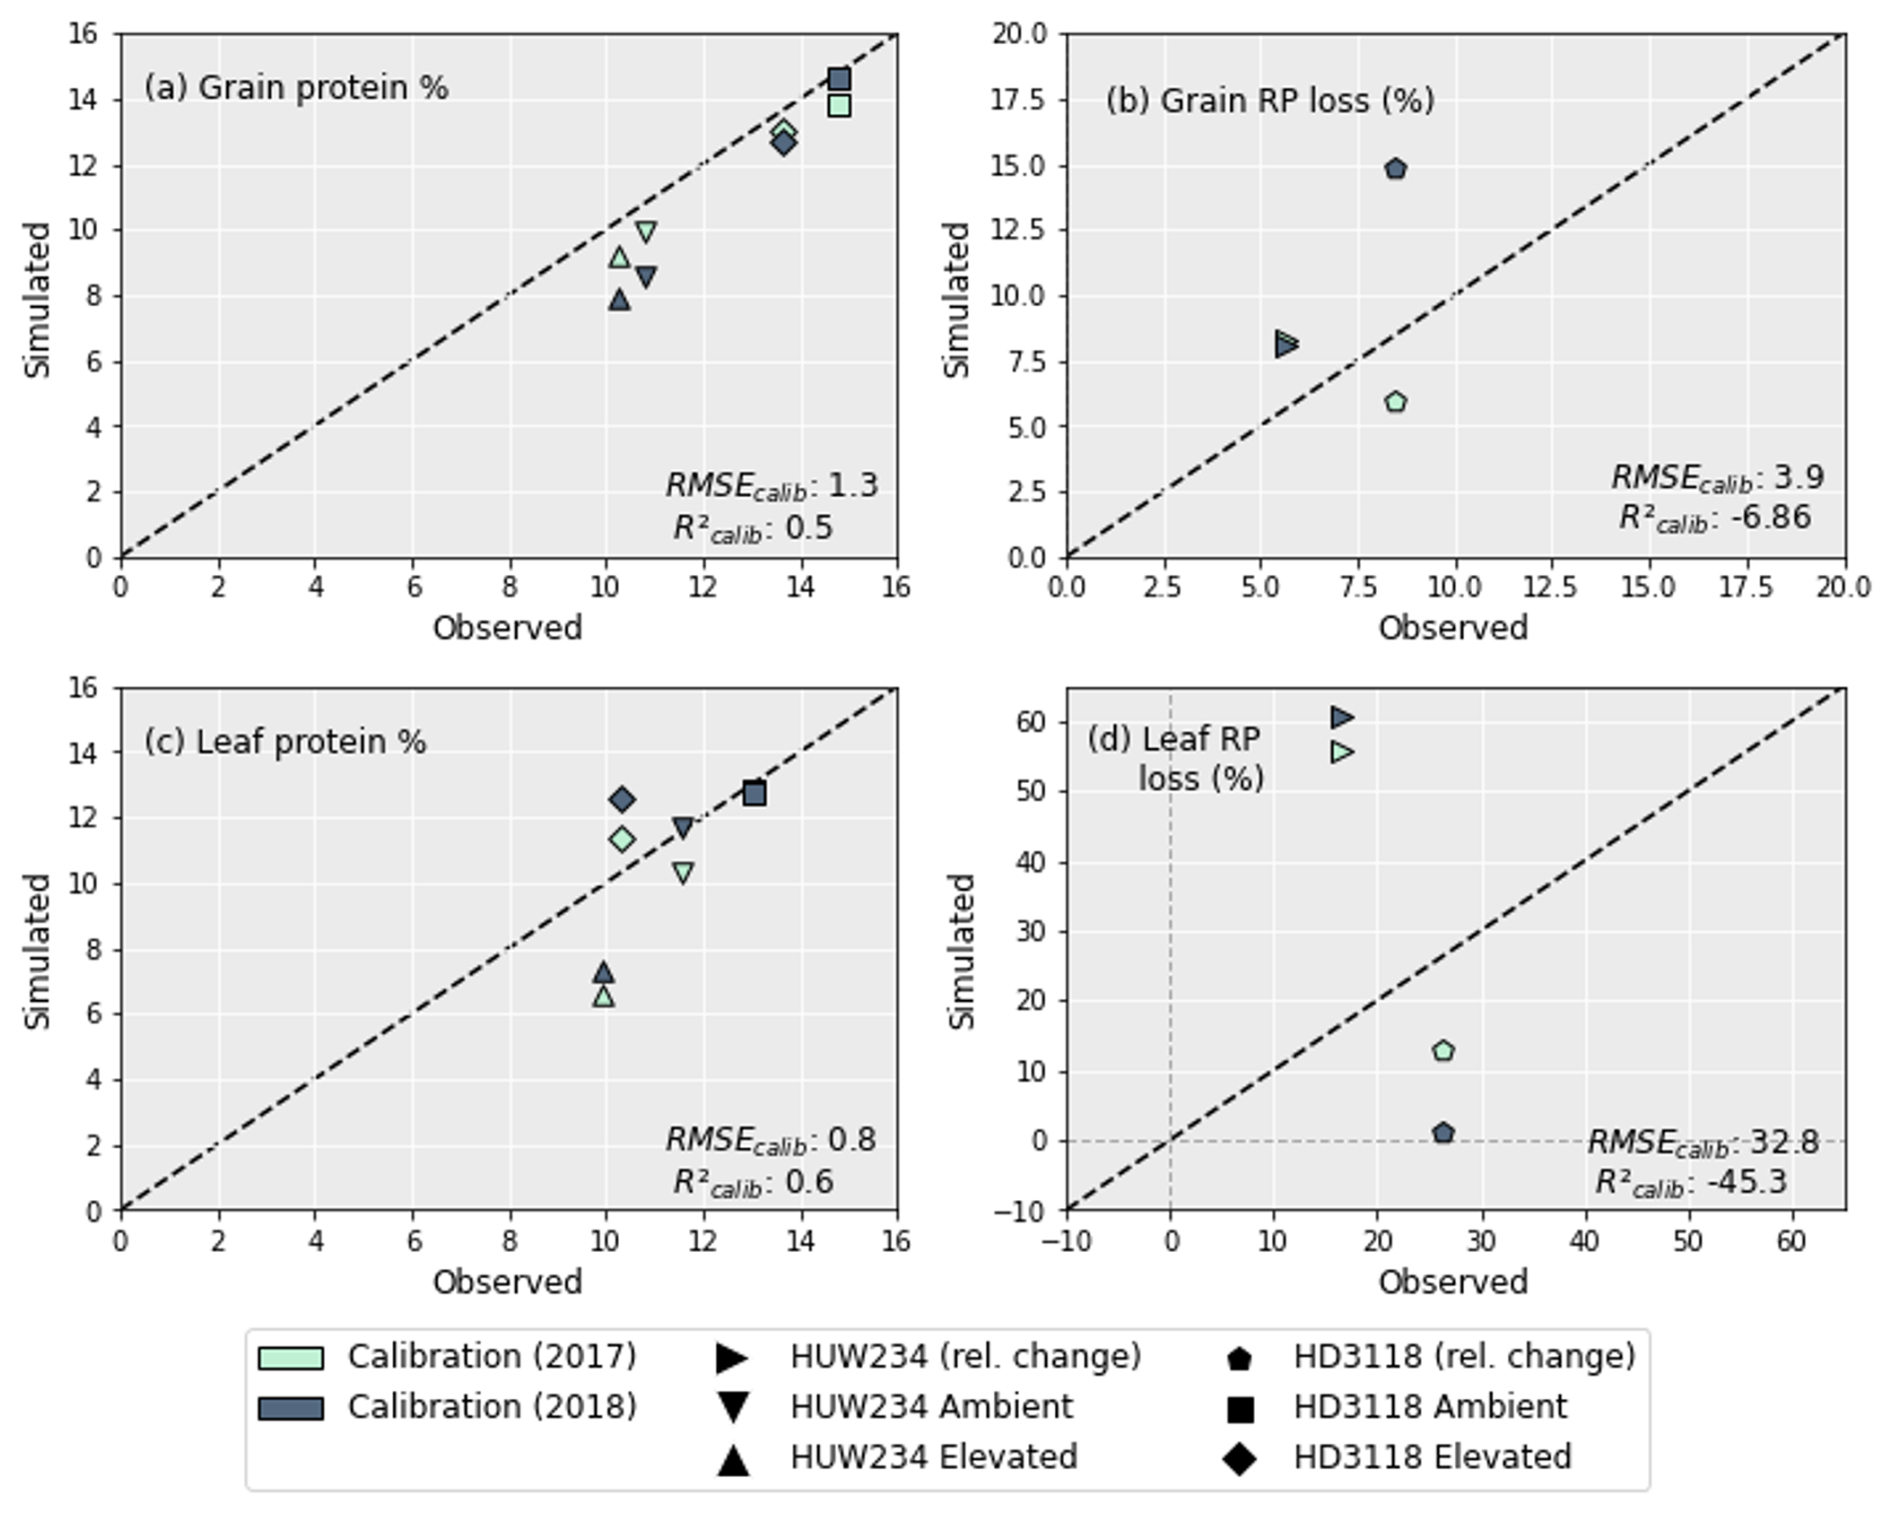
Figure 4The concentration of grain (a) and leaf (c) protein of the HUW234 and HD3118 cultivars under ambient and elevated O3. Calibration of grain (b) and leaf (d) RP loss. As shown in (b), the relative change in grain protein for the HUW234 cultivar for the years 2017 and 2018 was almost identical, hence the overlain points. As shown in (c), the leaf protein concentration for the HD3118 cultivar in the ambient treatment was almost identical for 2017 and 2018, giving the overlain points. The RMSE and R2 of the calibration are indicated in the plot.
4.2 AA simulations
Lysine and methionine were the key AAs focussed on as they were found to be the most limiting to protein production under O3 exposure (Yadav et al., 2020). To calculate their concentrations the grain protein concentrations (Fig. 4) were used along with the regressions from Liu et al. (2019). Figure 5a and c show the concentration of methionine in the wheat grains is predicted better than the lysine concentrations, with a higher R2 of 0.73 (compared with 0.31) and a lower RMSE (0.02 compared with 0.06). However, the decrease in both AA concentrations under O3 exposure was not captured as well (Fig. 5b and d). For both lysine and methionine, the decrease in AAs under O3 exposure was heavily underestimated. The decrease in methionine for HUW234 and HD3118 was underestimated by 9 and 10.5 percentage points, respectively. The decrease in lysine concentrations were underestimated by 37 and 19 percentage points for HUW234 and HD3118, respectively. The decrease in AA concentration for HUW234 was similar between years for both methionine and lysine, whereas for the HD3118 cultivar, the simulations showed a drastically different decrease in AA concentration between years.
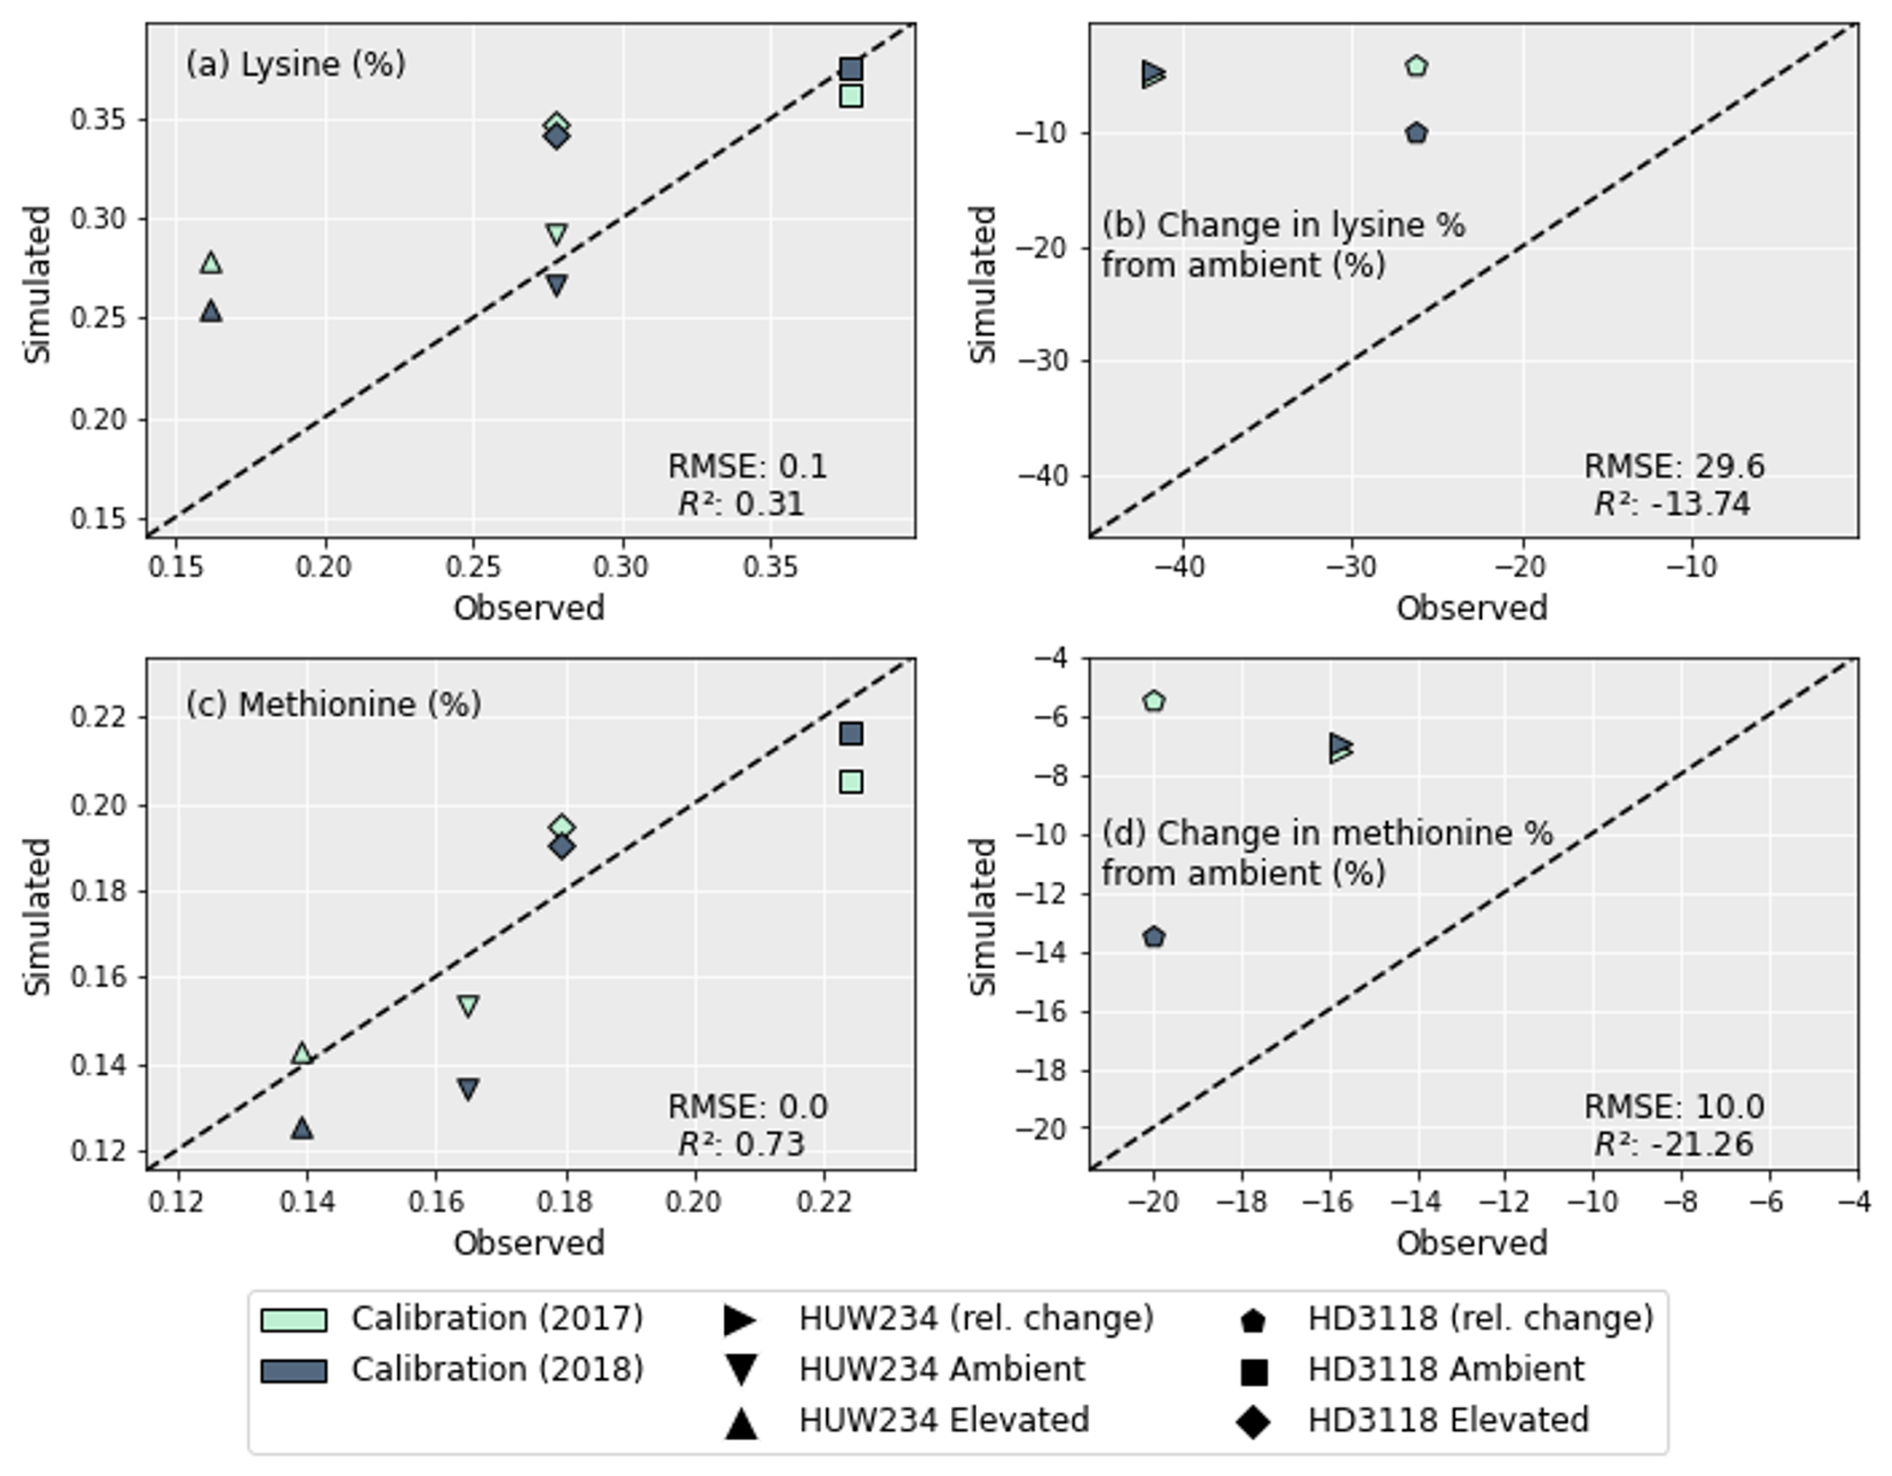
Figure 5A comparison of the simulated concentrations of lysine (a) and methionine (c) for the different cultivars and years of treatment. The change in AAs from ambient for lysine (b) and methionine (d) is also shown for both cultivars.
4.3 DIAAS of the nutritionally relevant AAs
Methionine and lysine are the most limiting AAs for protein production for the HUW234 and HD3118 cultivars and experience a decrease in concentration under O3 exposure (Yadav et al., 2020). Since the relative impact of O3 on the AA concentrations was not captured well, the observed concentrations of the AAs were used to calculate the DIAAS, with the value that would be obtained if using the simulated outputs in brackets. After calculating the reference ratios for lysine and methionine using Eq. (3), lysine was found to give the lowest reference ratio for all O3 treatments and cultivars and was used to calculate the DIAAS using Eq. (4). Table 1 shows the results of the DIAAS calculation. Using the observed data, both cultivars experience a decrease in protein quality under elevated O3 with the HUW234 cultivar experiencing a greater reduction than the HD3118 cultivar. Overall, the quality of wheat protein was lower for children aged between 6 months–3 years than for older children and adults (>3 years). When using the simulated outputs to calculate the DIAAS, there is an increase in protein quality under O3 exposure. This discrepancy occurs due to the structure of the DIAAS equation. The decrease in AA concentrations under O3 was underestimated by DO3SE-CropN in comparison to the grain protein (see Figs. 4 and 5), leading to a greater ratio of grain AAs to grain protein (Eq. 3). The greater ratio under elevated O3 then led to a higher-value DIAAS under the treatment compared to the ambient, though this would not be the case in reality.
Table 1The DIAAS for the HUW234 and HD3118 cultivars under the two O3 treatments and for the age categories of 6 months–3 years and >3 years (for older children and adults). The reduction in the DIAAS under O3 for the HUW234 and HD3118 cultivars was also calculated. The numbers in brackets represent the DIAAS calculated using model outputs; the average AA and protein concentrations across the 2017 and 2018 simulations were used in the calculation.
4.4 Difference between the 2017 and 2018 simulations
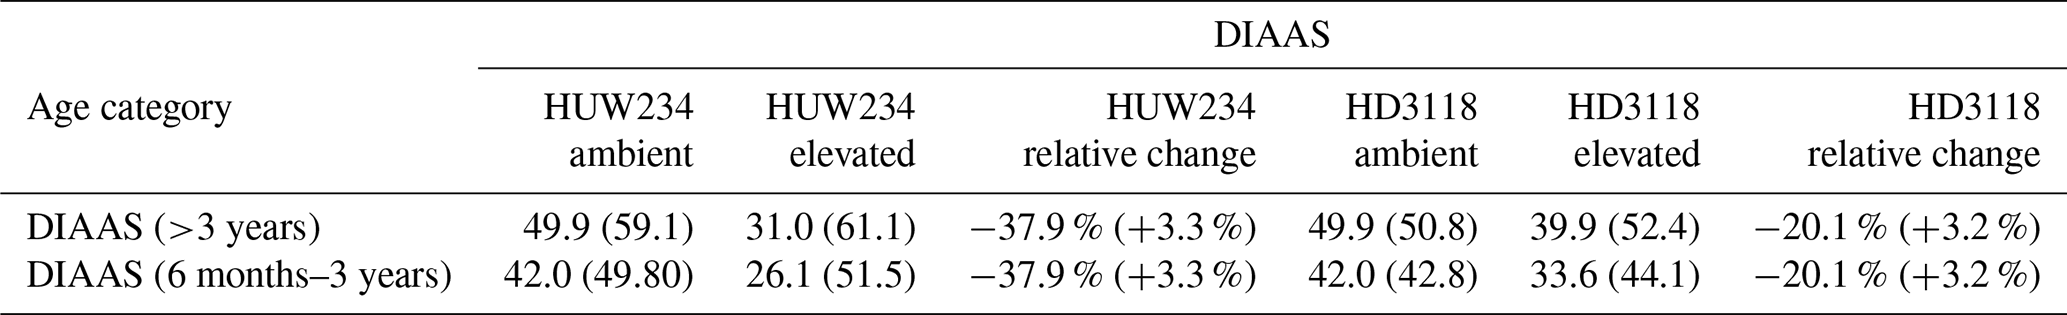
After performing the simulations for 2017 and 2018 in Sect. 4.1, it was clear there was a large difference in grain DM for the 2 years. The reasons for this discrepancy are important to understand since uncertainties in the grain DM simulation will compound errors in protein concentration and yield (Cook et al., 2024). To investigate the grain DM discrepancy further, the meteorological variables, stomatal conductance and photosynthetic rate were plotted for both years. The accumulation of biomass each day and the LAI were overlaid to see if there were any differences that could explain the large difference in biomass. The temperature in 2018 was greater at the beginning and end of the growing season compared to 2017 (Fig. 6). The reverse was true for relative humidity (Fig. S2). In relation to the other inputs, air pressure, precipitation and wind speed had negligible differences between the years (Figs. S1, S3 and S4). O3 concentrations were generally greater in 2017 than 2018 (Figs. 7 and S11), and photosynthetic photon flux density (PPFD) was greater at the start of the growing season in 2018 (Fig. 8). The daily photosynthetic rate was mostly greater in 2018 than 2017 and showed the same pattern for both cultivars (Figs. 9 and S5). The difference in stomatal conductance between the years for both cultivars mimicked the shape of the photosynthetic rate plots (Figs. S6 and S7). Given that the O3 effect is more strongly determined by senescence than the instantaneous impact on photosynthesis (Pande et al., 2025) and senescence onset did not differ strongly between years (Fig. S11), it is unlikely that the differences in yield were caused by O3 effects. Instead, it is likely that the higher early-season PPFD and temperatures of 2018, along with lower RH, promoted earlier LAI development and increased biomass production in simulations.
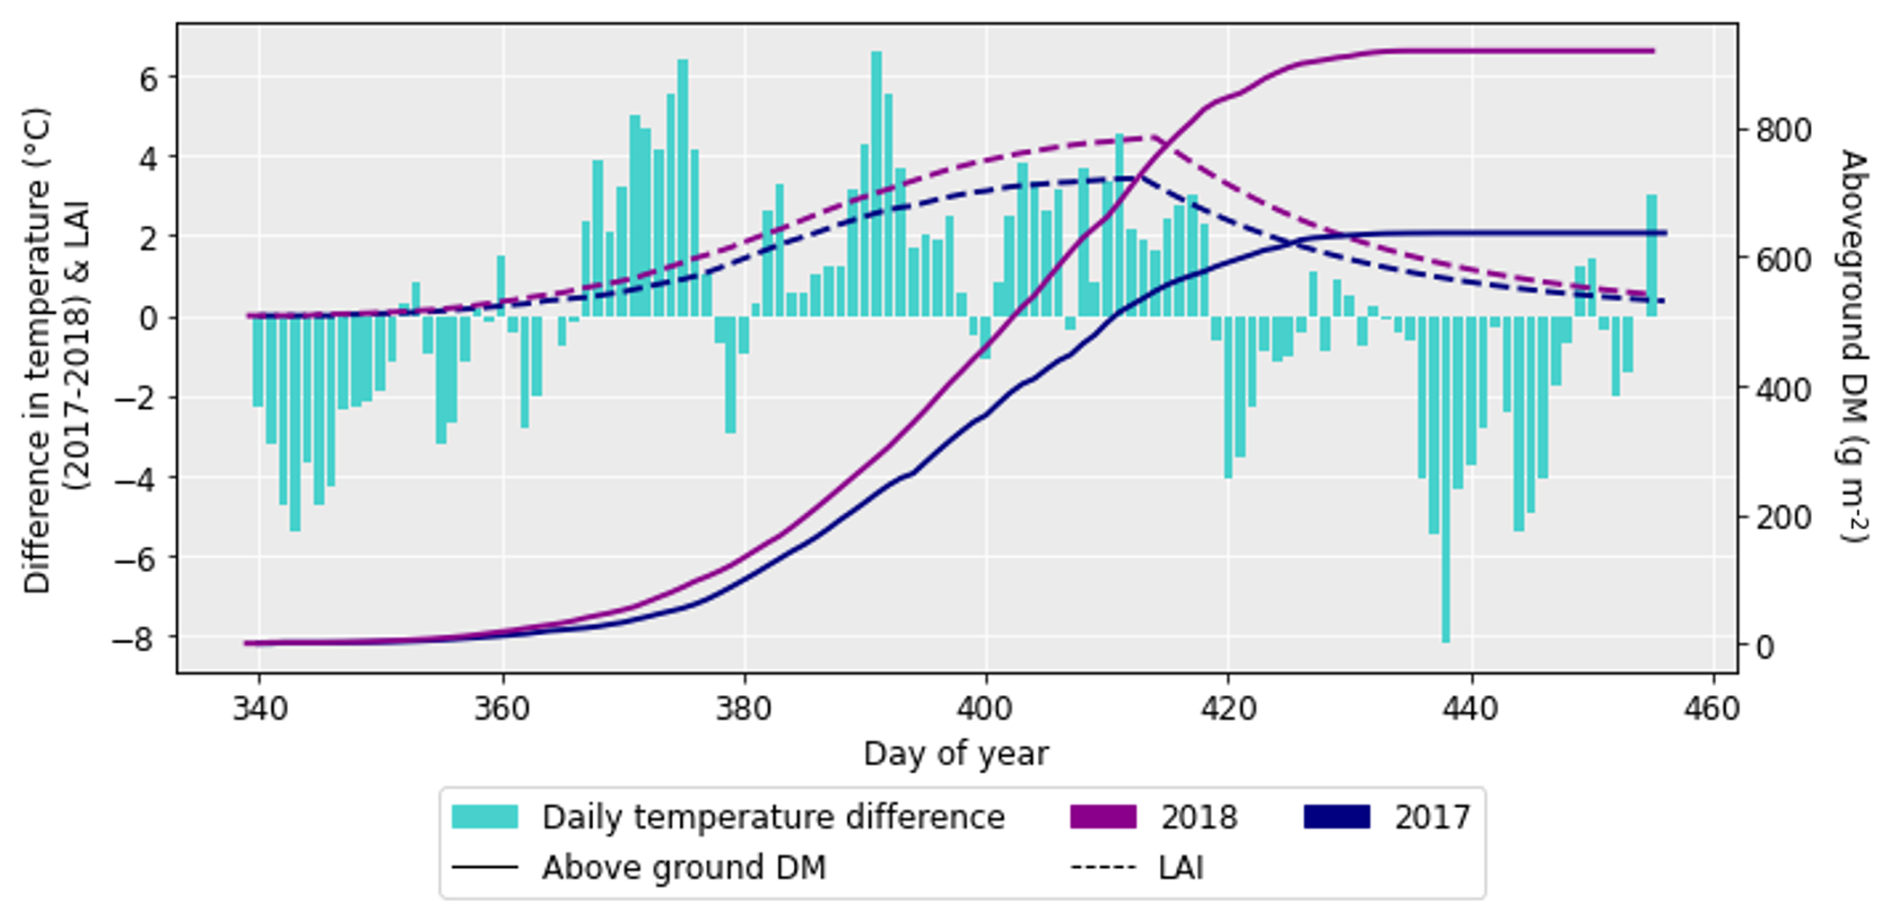
Figure 6The difference in daily temperature between 2017 and 2018 (where the temperatures for 2018 were subtracted from those for 2017), along with the difference in aboveground DM accumulation for the ambient treatment for both years and the LAI profiles. The LAI and aboveground DM profiles are for the HUW234 cultivar.
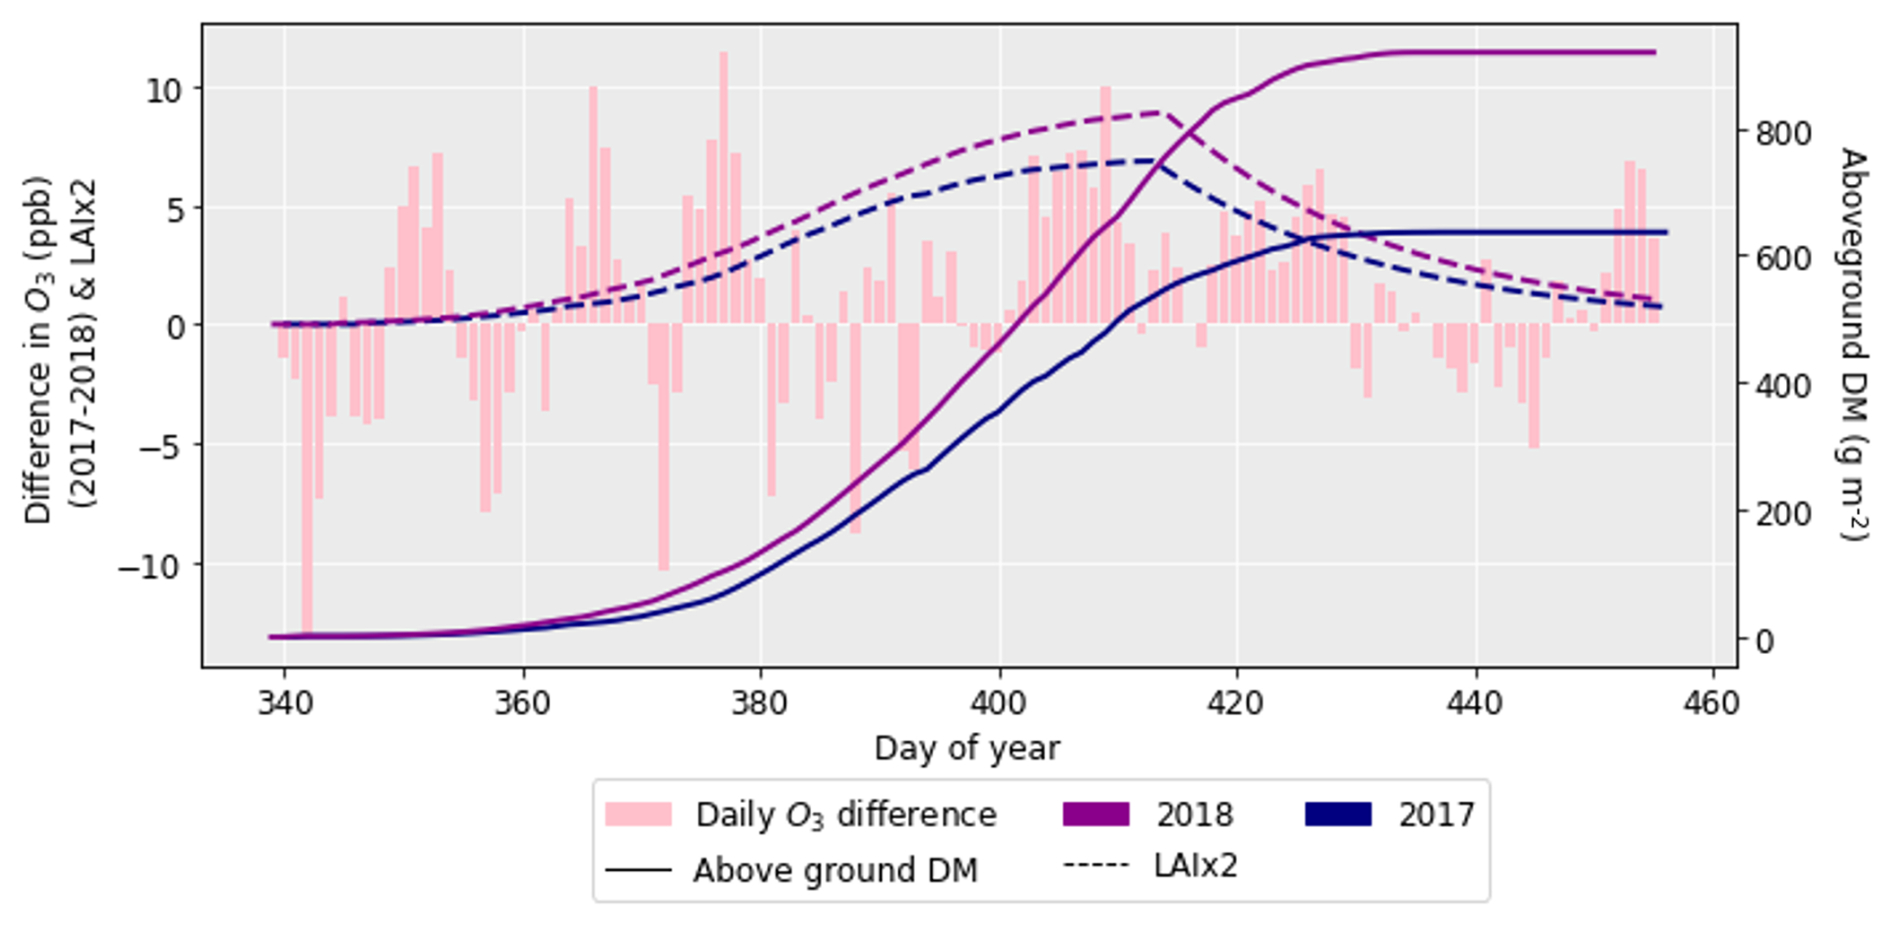
Figure 7The difference in daily O3 between 2017 and 2018 (where the O3 concentrations for 2018 were subtracted from those for 2017), along with the difference in aboveground DM accumulation for the ambient treatment for both years and the LAI profiles. The LAI has been multiplied by 2 to more easily show the profile. The LAI and aboveground DM profiles are for the HUW234 cultivar.
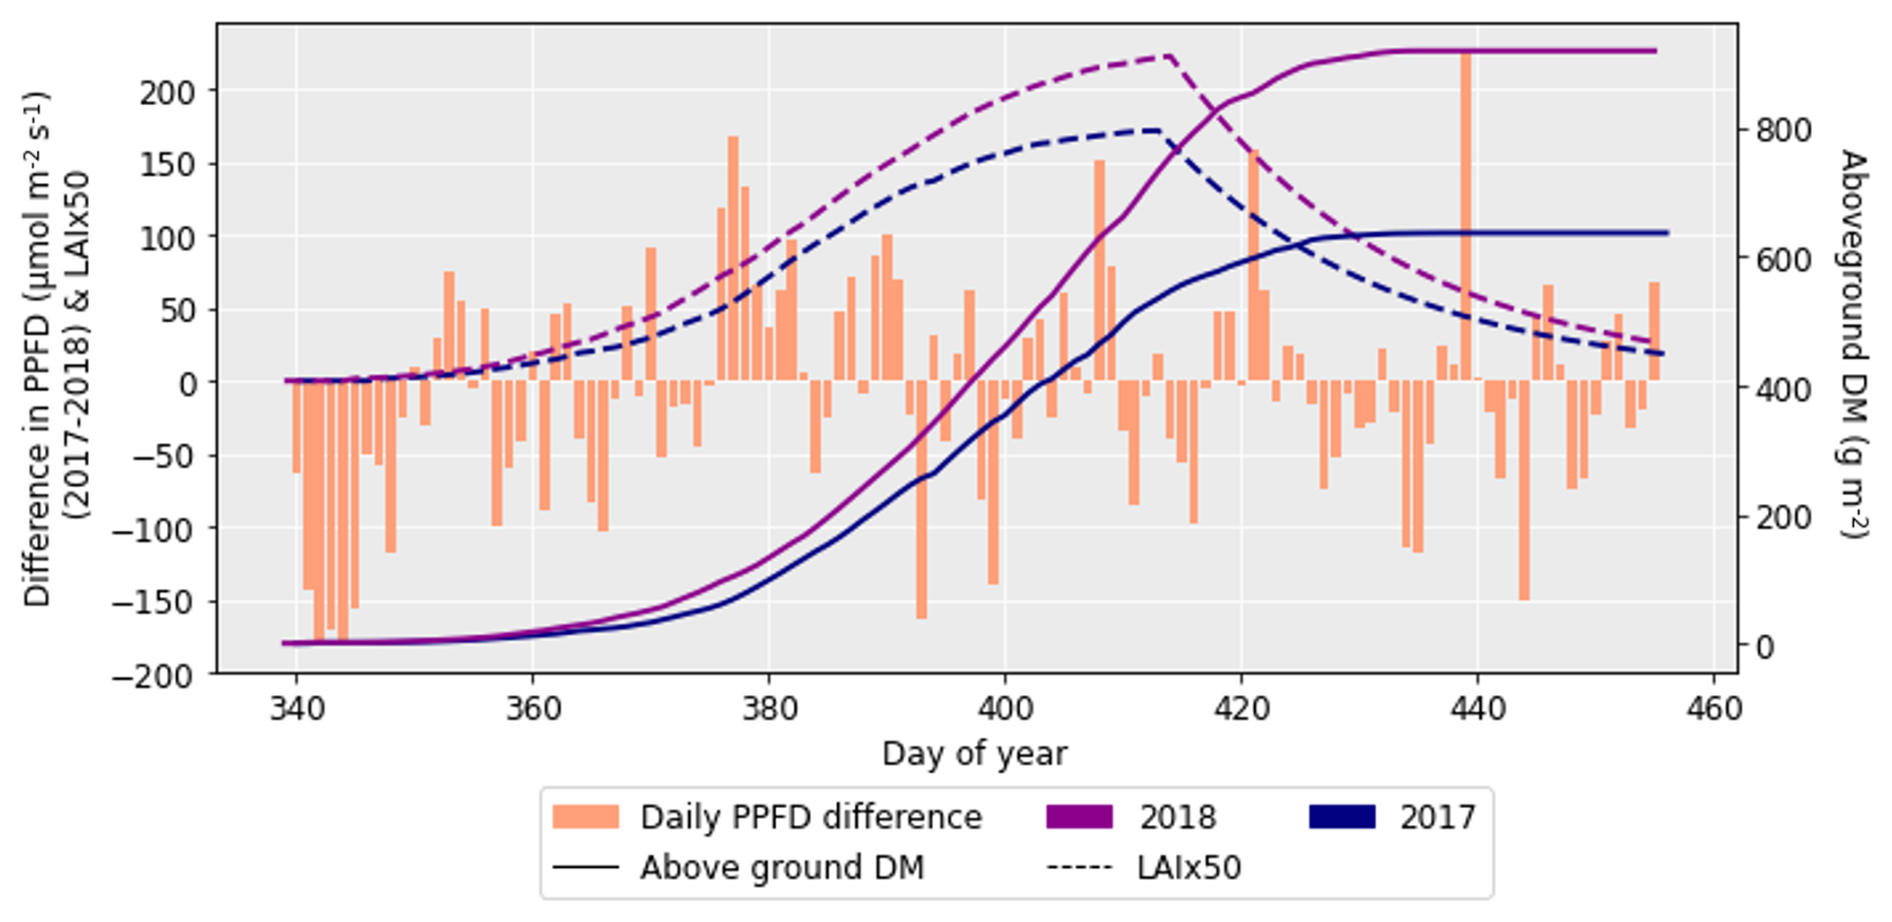
Figure 8The difference in daily PPFD between 2017 and 2018 (where the PPFD for 2018 was subtracted from that for 2017), along with the difference in aboveground DM accumulation for the ambient treatment for both years and the LAI profiles. The LAI has been multiplied by 50 to more clearly show the profile. The LAI and aboveground DM profiles are for the HUW234 cultivar.
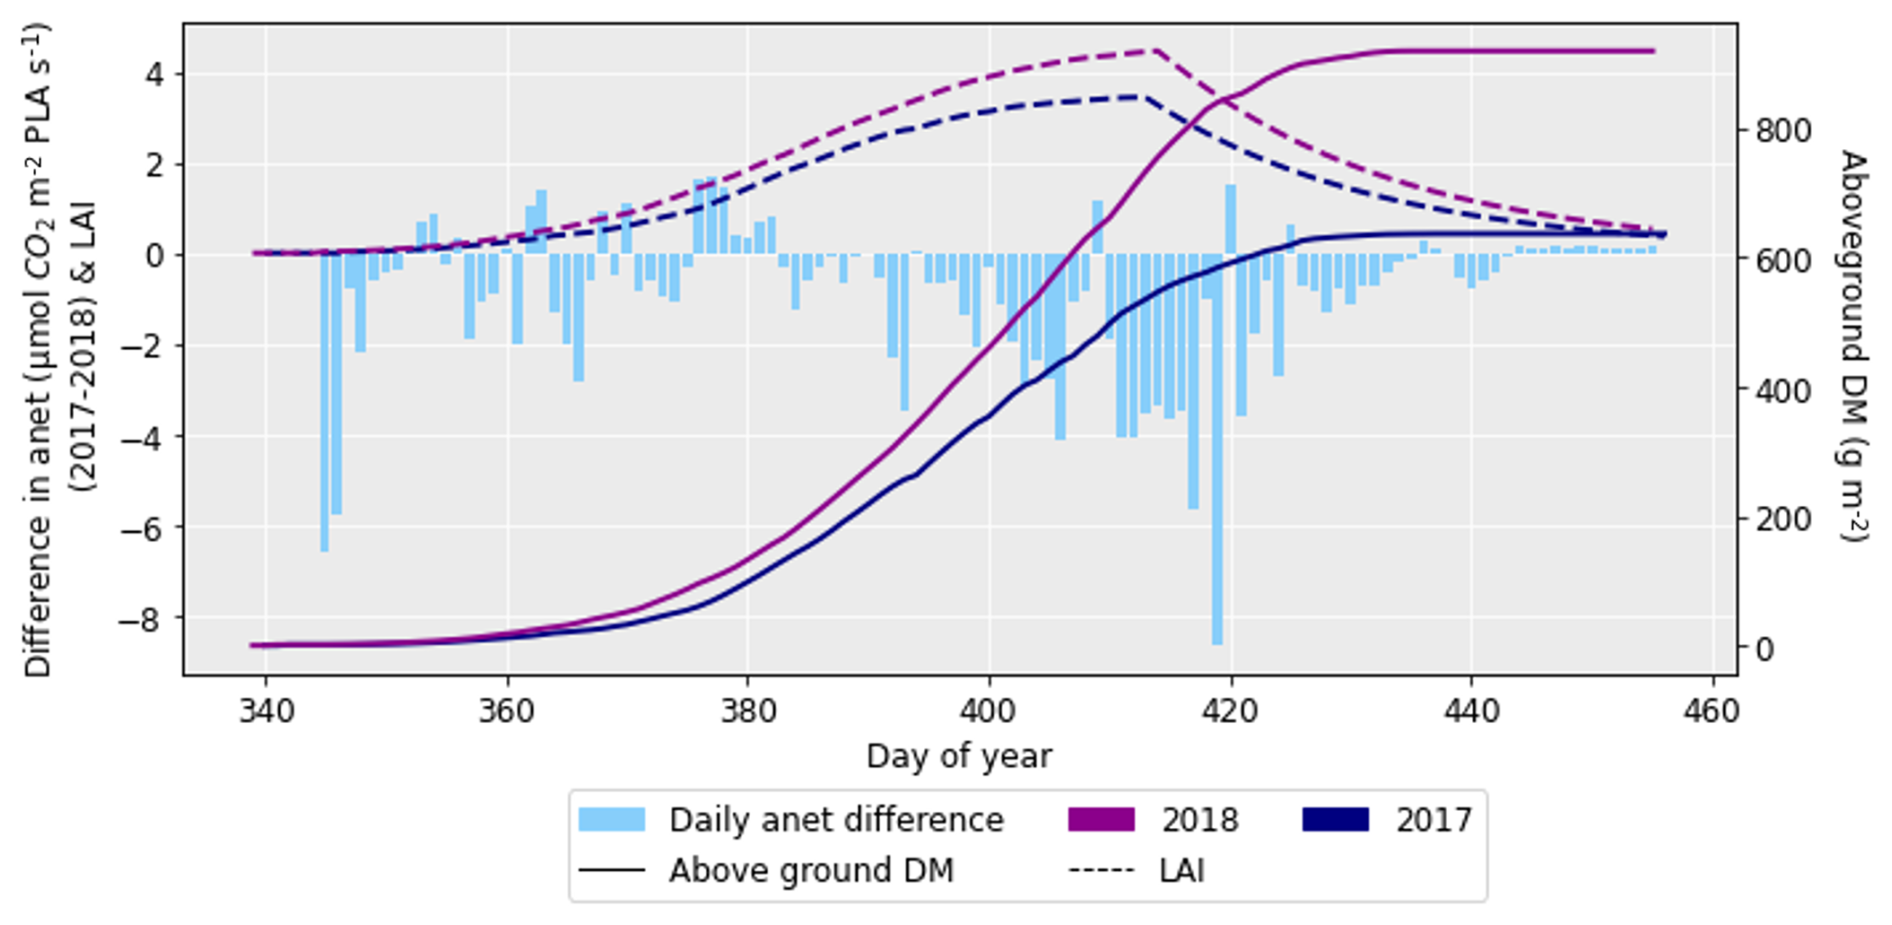
Figure 9The difference in net photosynthetic rate (anet) for 2017 and 2018 (where the anet for 2018 was subtracted from that for 2017), along with the difference in aboveground DM accumulation and LAI for the ambient treatment for the 2 years. The LAI and aboveground DM profiles are for the HUW234 cultivar.
We developed the DO3SE-CropN model to address a current limitation in the ability of crop models to assess the effects of O3 stress on not only crop yields but also quality. We describe the further development and applications of the model to simulate O3 effects on nutritionally important AAs based on current understanding of antioxidant processes and implications for N remobilisation. This work is important since currently there are few models that consider protein quality in their simulations. CN-Wheat considers AAs from the perspective of being used for leaf, stem and grain protein production (Barillot et al., 2016). It does not explicitly consider the AAs of the wheat grains, relevant for nutrition (Barillot et al., 2016). In SiriusQuality1, Martre et al. (2006) consider the fractions of N that are split between gliadin, glutenin, albumin–globulin and other proteins in the wheat grains as a measure of wheat quality for bread production, not human nutrition. To our current knowledge, Liu et al. (2019) are the only authors who have extended a crop model to simulate protein quality, in the form of AAs, from the perspective of human nutrition. In their work they extended the CERES-Wheat model to simulate lysine and other indispensable AA concentrations. Further, none of these crop models that consider crop quality have incorporated the effects of antioxidants. In our study we extend the equations used by Liu et al. (2019) to produce the first framework by which the effect of O3 on protein quality (through antioxidants, AAs and the DIAAS) can be captured.
5.1 Ability of the model to simulate DM and protein
The present model was able to reproduce the observed grain DM for 2018 but underestimated it for 2017 due to differences in meteorology that triggered earlier LAI development, leading to greater photosynthesis and biomass production in the model for 2018. The model was able to capture the RY loss of the HD3118 cultivar well for both years. However, the HUW234 cultivar experienced a large difference in RY loss between the 2 years, with the model only able to capture the RY loss well for 1 year. With only 2 years of data, it was not possible to determine which of the observed RY loss values is the most common response for HUW234. Data for additional O3 treatments and years are required to develop a more robust model parameterisation for different meteorological conditions and cultivars.
While the model underestimated the grain DM for 2017 by ∼ 40 %, there appears to have been no effect of this underestimation on the capacity of the model to capture grain protein concentration (100 g protein g DM−1). A possible reason for this is that the lower photosynthesis in 2017 led to lower simulations of leaf and stem biomass. As a result, the N required by the leaf and stem for growth in the model was reduced, leading to lower N accumulation in these parts. Upon remobilisation to the grains, the reduction in N accumulated by the grains in 2017 compared to 2018, along with the reduced grain DM in 2017, led to similar protein concentrations. The model's ability to reproduce the observed grain protein concentration, despite yield discrepancies, suggests that the underlying N allocation and remobilisation equations reasonably approximate plant processes. This outcome supports the reliability of the equations, though further validation is needed to confirm their accuracy. Future work should focus on improving the model's estimates of protein yield and concentration so that O3 threats to food security can be assessed with greater confidence.
In the model, there was a strong interdependence between the parameters controlling protein accumulation in the leaf and stem with grain protein, which is to be expected as protein remobilisation from the leaf and stem are key contributors to grain protein (Feller and Fischer, 1994; Gaju et al., 2014; Nehe et al., 2020). On calibrating the model, this interdependence meant that any attempt to improve the model's accuracy in capturing the decrease in leaf protein under elevated O3 resulted in reduced model accuracy in capturing the decrease in grain protein under elevated O3 and vice versa (see Fig. 4b and d). This meant that there was a trade-off between calibrating leaf and grain RP loss under O3 exposure. No data were available on stem RP loss, so the accuracy of the stem parameterisation is unclear. Given this study focussed on grain quality, capturing the grain RP loss under O3 was prioritised over the leaf. If the model is not able to match the decrease in leaf protein with the corresponding decrease in grain protein under O3 exposure for a given cultivar, then it implies a problem with the parameterisation or model construct. Regarding the parameterisation, leaf DM data were not available which would affect leaf N, and hence protein, accumulation. Therefore, in the future leaf (and stem) DM data at anthesis and harvest would aid in parameterising the equations describing the partitioning of photosynthate each day and could improve simulations of RP loss.
5.2 Ability of the model to simulate AA concentrations
To date, there is only one study (Yadav et al., 2020) that has investigated the effect of elevated O3 on the AA concentrations of wheat. Data from this study were used to calibrate and evaluate the DO3SE-CropN model and test the framework for the AA simulations. While the grain methionine concentrations were reproduced well, the grain lysine concentrations were overestimated for the elevated O3 treatment. It is also clear to see that the reduction in concentrations of both lysine and methionine was underestimated by the DO3SE-CropN model. The AA concentrations were calculated using regressions linking protein concentrations to AAs from Liu et al. (2019), which were constructed using data from 48 field experiments from major wheat-producing areas in China. Approximately 95 % of wheat grown in China is winter wheat (United States Department of Agriculture, 2022), and most of the cultivars used to produce the regressions were winter wheat (Liu et al., 2019). However, the model was parameterised for Indian spring wheat. Given the differences between the growing conditions in India and China, as well as spring and winter wheat, deviations in simulations of lysine and methionine concentrations from the observed are to be expected. Additionally, Liu et al. (2019) did not include experiments with differing levels of O3 in their treatments. For lysine, this has culminated in a much better simulation of the AA concentrations under ambient O3 compared to the elevated treatment. For both lysine and methionine, using the regressions alone to convert grain protein to grain AA concentrations was not sufficient to account for the O3 effect on grain quality. Additionally, there is currently a knowledge gap (discussed further in Sect. 5.3) relating to our understanding of the effects of O3 on both antioxidants and grain quality, which affects not only the construction of the model but also its parameterisation. Suggestions for more specific experiments which could reduce the knowledge gap for both modelling and understanding the effect of O3 exposure on grain protein and AAs are discussed in Sect. 5.3, 5.4 and 5.7. Nevertheless, it is clear that additional experimental data about the effect of O3 on grain AAs would be beneficial for not only model development but also improving confidence in modelling results.
5.3 Modelling antioxidant processes under O3 exposure
The first iteration of the DO3SE-CropN model simulated the decrease in grain protein yield (g protein m−2) and increase in grain protein concentration (100 g protein g DM−1) experienced by European and Chinese wheat cultivars (Broberg et al., 2015; Cook et al., 2024). However, Indian wheat has been shown to experience a decrease in both protein yield and concentration under O3 exposure (Mishra et al., 2013; Yadav et al., 2020). Through the incorporation of antioxidant processes, the present model is now able to capture the decrease in protein concentration, as well as yield, of protein in Indian wheat under O3 exposure, improving the regional applicability and nutritional relevance of the model.
The design of the antioxidant equations has several benefits which make it useful for further applications. Firstly, the structure of Eq. (1) means that it could be translated to other stressors provided they have a similar mechanism of damage to O3, meaning the framework is flexible. Drought and high temperature stress are good candidates for this framework as they are ROS mediated, like O3, and cause a reduction in both grain yield and protein content (Broberg et al., 2015, 2023; Mariem et al., 2021). The effect of heat stress on antioxidant production, and hence grain quality, could be incorporated by modifying Eq. (1) and Fig. 2 to incorporate the duration (and potentially timing) of the stress as these are the key factors affecting grain yield under heat stress (Balla et al., 2019). For drought stress, the duration of the stress would be useful, but there would need to be an additional effect of drought on reducing nutrient uptake (as this affects grain quality) (Faisal et al., 2017; Rijal et al., 2020). The second benefit of the framework is that it is simple. It does not require a large number of additional parameters, which reduces the complexity of the modelling process and makes it easier for other modellers to introduce into their models. Thirdly, the framework is compatible with the structure of other models that simulate plant N. The equations can be used to simply divide leaf and stem N into pools that are accessible or inaccessible (antioxidants) to the grain. Following this, the modeller only needs to ensure that any N remobilised from the leaf and stem to the grain comes from the accessible pool.
It was hypothesised that the introduction of the antioxidant processes would replace the previous O3 effect on leaf and stem residual N that was parameterised in Cook et al. (2024), as it was previously hypothesised that the increase in residual N occurred as a result of antioxidant production (Brewster et al., 2024; Cook et al., 2024; Sarkar et al., 2010). However, during model calibration it was noted that the simulations of leaf and grain protein were improved when both processes were used in combination (see model parameterisation in the Supplement). There are two potential explanations for this: (1) the shape of the antioxidant response to O3 is such that the two effects working in combination are a more effective approximation, meaning further data to investigate the effect could provide insight into the truer shape of the response, and (2) O3 has an effect on N remobilisation from the leaf and stem to the grains that is separate from antioxidant production. For example, ROSs have been shown to oxidise proteins which would decrease protein concentrations but lead to greater residual N in the leaf and stem (Gill and Tuteja, 2010). Given this and the previously described trade-off when calibrating leaf and grain RP loss, there is clearly a knowledge gap in our current understanding of antioxidant production and the remobilisation of nutrients under O3 exposure. Therefore, a study with multiple O3 treatments that identifies the proportion of N in the leaf and stem at anthesis and the leaf, stem and grains at harvest, as well as the corresponding proportion of proteins, would allow for identification of how much N is associated with proteins and whether this fraction changes under O3 exposure and affects N remobilisation. Such data would also allow for further development of the antioxidant equations in this study, as for simplicity and a lack of data to test a more complex relationship, we have assumed linearity, but this may not be the case. Additionally, identification of the N associated with antioxidants at anthesis and harvest, as well as how these change under O3 exposure, would also allow for further development of the antioxidant equations. If combined with protein measurements at anthesis and harvest, mechanistic understanding of O3 impacts on protein, antioxidant processes and grain filling with N could be developed further and used to refine existing model processes.
5.4 Antioxidant processes and grain quality
For consideration of O3 effects on nutrition, it is important to consider the protein quality, in addition to its concentration. From a dietary perspective, indispensable AAs, such as lysine and methionine, are the most important to consider when thinking about protein quality as they cannot be produced by the body and must be obtained through diet (Elango et al., 2008; Shewry and Hey, 2015). Lysine and methionine are key as they are the AAs available in the lowest quantity in wheat exposed to O3, and therefore the body's capacity to produce proteins from them is limited (Yadav et al., 2020). If a person does not consume enough protein or protein of a high enough quality, then they are at risk of wasting and a loss of muscle function (Medek et al., 2017). Understanding how O3-induced changes to wheat protein will affect protein quality, and hence diet quality, is key to understanding O3 effects on human nutrition and its potential role in exacerbating malnutrition.
The regressions from Liu et al. (2019) were used to simulate grain lysine and methionine concentrations as these were the most limiting for protein production under O3 exposure (Yadav et al., 2020). However, there is variability in the response of AAs in wheat grains under O3 due to the differential activation of metabolic pathways under stress (Ali et al., 2019; G A et al., 2024; Li et al., 2024; Wang et al., 2018). Yadav et al. (2020) found that while overall protein concentrations decreased under elevated O3, lysine and methionine concentrations decreased, while grain serine concentrations increased. The responses also differed between cultivars, with HUW234 having an increase in threonine, while HD3118 had a decrease (Yadav et al., 2020). During stress conditions, the concentrations of AAs vary to enhance plant defence mechanisms against abiotic stressors (Ali et al., 2019; G A et al., 2024; Li et al., 2024; Wang et al., 2018). In HUW234 and HD3118, lysine concentrations decreased under elevated O3, due to its breakdown for energy production and plant defence (Ali et al., 2019; Yadav et al., 2020). Lysine breakdown produces proline, the concentration of which increased in both cultivars, which has been shown to protect against ROS-induced oxidative damage (Nayyar and Walia, 2003; Yadav et al., 2020; Yang et al., 2020). Additionally, the concentration of methionine decreased in both cultivars under elevated O3 (Yadav et al., 2020). The decrease is likely due to methionine's role as an antioxidant and because it is very sensitive to oxidation by ROSs (Ali et al., 2019). The changes in AAs aid in the maintenance of the photosynthetic rate and protection of photosynthetic pigments from ROSs (Zulfiqar and Ashraf, 2023; Naidu et al., 1991; Simon-Sarkadi and Galiba, 1996). The specific response of an AA to abiotic stress is cultivar specific and depends on the intensity of the stress (Ali et al., 2019). As a result, grain AA concentrations are linked to the stress response of the plant under O3. Measurements of AA concentrations under multiple O3 treatments would help to elucidate the shape of the response of AAs to O3 stress. This is a field which has largely been neglected, with only Yadav et al. (2020) having investigated it so far. Such data would allow for the effect of O3 on nutrition to be better understood.
5.5 Protein quality estimates using the DIAAS
Through extending DO3SE-CropN to simulate the DIAAS, estimates of protein quality are translated into a metric that is commonly used to assess dietary quality in the nutrition field (e.g. Kurpad and Thomas, 2020). Using the observed data, the HUW234 cultivar experienced the greatest loss in protein quality under increased O3 concentrations despite showing the smallest RP and RY loss. The reason for this is that HUW234 experienced the greatest decrease in lysine concentrations, and lysine is the most limiting AA in wheat (Meybodi et al., 2019; Siddiqi et al., 2020). The DO3SE-CropN model was not able to reproduce the reduction in protein quality calculated through the DIAAS as it was not able to reproduce the magnitude of the decrease in protein and lysine concentrations under elevated O3 for either cultivar (Table 1, Fig. 5b and d). Using the observed data, the calculations of the DIAAS were the same for both cultivars due to the scaling factor used for the AAs (see Sect. 3.1), but, in reality, the DIAAS would differ between the cultivars. While using the simulations of grain protein and AAs was able to produce a difference in the DIAAS between cultivars, it was only able to reproduce the DIAAS calculated from the observed data for the HD3118 cultivar in the ambient O3 treatment, as the protein and lysine concentrations were captured well for this cultivar and treatment. To develop crop models that use the DIAAS to understand the reduction in protein quality under abiotic stress, the reduction in grain protein and the most limiting AAs for protein production under that stress need to be understood.
5.6 Data requirements for effective model calibration
Initially in this study, the data were split in half, with the 2017 data being used for model calibration and the 2018 data being used for evaluation. However, due to the model overfitting to the 2017 dataset (see the Supplement), the decision was made to utilise all available data for calibration. This allowed for the paper to focus on the development of the antioxidant processes and protein quality simulations. Should future work utilise the antioxidant or protein quality framework presented in this work, a thorough model calibration and evaluation is recommended. Calibrations that use data from contrasting growing conditions, such as different growing seasons/years, sowing dates or experimental conditions, have been shown to reduce the chance of multiple combinations of parameters giving the same answer (equifinality), reduce model uncertainty and improve simulation accuracy (He et al., 2017; Zhang et al., 2023). This is likely a result of achieving a truer parameterisation for the cultivar, leading to improved generalisation of the model upon application (Wallach, 2011). Hence, if there are few growing seasons of data available, it would be helpful to have data spanning a range of crop treatments.
5.7 Further work for understanding O3 effects on wheat nutrition
Current risk assessments of the effect of O3 on Indian wheat yields have predicted the greatest yield reductions across the IGP and eastern India due to the high O3 concentrations in this region as well as meteorological conditions that favour plant O3 uptake (Droutsas, 2020; Mills et al., 2018a; Tai et al., 2021). (These estimates exclude concentration-response methods, which are not as biologically relevant, since these do not include the modifying effect of meteorology on O3 uptake the spatial distribution of yield losses differs (Emberson et al., 2000; Pleijel et al., 2022).) From this, we can hypothesise that nutrition impacts will also be greater in these regions, though the specific response will vary by cultivar. However, the work of the present study does not just have applications for India. Understanding cultivar-specific responses to increasing O3 concentrations will be important for food security globally in order to breed cultivars that can maintain yields and protein quantity, as well as quality, in the future. Additionally, it can be seen in the calculations of the DIAAS and is reflected in the wider literature that the quality of protein in wheat is low, even without the impact of O3, which will exacerbate protein deficiencies in consumers who rely on wheat-based diets (Swaminathan et al., 2012). Therefore, to reduce malnutrition, cultivars with a high protein quality that can maintain yields and protein concentration under O3 exposure should be investigated for their potential to maintain wheat supply and quality under conditions of elevated O3 concentration. Additionally, existing barriers to diet diversification need to be overcome so that individuals may have access to higher-quality protein sources (Agrawal et al., 2019).
To develop an understanding of cultivar-specific responses to abiotic stress, a modelling approach similar to that used in this study would be useful, as such a model can capture the effect of antioxidant processes under stress on grain quality. To ensure the applicability of the model in addressing this goal, there are a few existing barriers identified in this study:
-
Before model application, models need to be thoroughly calibrated and evaluated. To perform a thorough calibration and evaluation, a range of treatments and/or years of data need to be available to provide a set of calibration parameters that are more general for that cultivar and prevent overfitting. Additionally, obtaining leaf and stem DM anthesis and harvest will aid in parameterising, partitioning and the remobilisation of photosynthate.
-
Differences in meteorological conditions between the 2 years of experiments in the present study had a large effect on simulations of grain DM. The effect of meteorology on simulations of photosynthetic processes and biomass production in crop models should be further investigated in the future to ascertain crop model sensitivity to input data choices.
-
To advance the antioxidant equations and understand O3 effects on grain quality, an O3 exposure (e.g. FACE, free-air controlled exposure; OTC, open-top chamber; or solardome) experiment measuring total N and protein content, as well as N and protein concentrations in the leaf and stem at anthesis, and harvest stages under varying O3 treatments should be conducted. The proportion of N associated with specific antioxidants (such as glutathione and enzymatic antioxidants) under these O3 treatments should also be obtained to improve mechanistic understanding of plant antioxidant response to O3. This can be used to further develop the model, as it is anticipated that increased allocation of N to antioxidant production in leaves and stems under O3 stress reduces the N available for remobilisation to grains during grain filling, leading to a decrease in grain protein concentration and altered amino acid profiles.
-
From the same O3 exposure experiments, measurements of grain protein and AA concentrations for each O3 treatment should be collected to produce relationships linking the two and showing how the relationship changes under the influence of O3 to verify whether there is a trade-off between stress mitigation and nutritional quality. Such relationships could be integrated into the model to improve its ability to simulate AA concentrations under stress and hence provide more trustworthy estimates of protein quality.
Reliable estimates of the DIAAS would allow for dietary protein quality to be incorporated into O3 risk assessments. Performing yield and nutrition-based risk assessments utilising AA and DIAAS simulations under future O3 scenarios would allow for assessment of which wheat-growing areas will experience a decrease in wheat protein quality as well as yield. Such results could then be combined with dietary surveys to evaluate adults' and children's risk of not getting enough food or food of a high enough quality under increasing O3.
In summary, the present study has developed a framework by which the antioxidant response of wheat under O3 exposure can be incorporated into wheat quality simulations in the existing crop model DO3SE-CropN. The key benefits of the framework are that it is flexible, simple and compatible with other crop models provided they simulate leaf and stem N. The AAs most limiting for human nutrition under O3 exposure were found to be lysine and methionine. The new modelling framework allowed for the effect of high O3 concentrations leading to a decrease in grain protein, lysine and methionine concentrations of Indian wheat to be simulated. Through calculations of the AAs, the FAO-recommended metric for simulating wheat quality, the DIAAS, can be calculated. To improve the present model, we identified key experimental data needed to test and refine model formulations and parameterisations for a wider range of meteorological conditions and wheat cultivars. These include greater calibration data across multiple years and treatments with leaf and stem DM and N measurements, a mechanistic understanding of plant antioxidant response, and a further development of relationships linking grain protein concentrations to AA concentrations under elevated O3.
An open version of the DO3SE-Crop model, version 4.39.16, as used in the present study can be found at https://doi.org/10.5281/zenodo.11620501 (Bland, 2024), and version 2.0 of the N module for DO3SE-Crop can be found at https://doi.org/10.5281/zenodo.13771475 (Cook, 2024).
Data from Yadav et al. (2020) and (2021) were used in the present study with additional data provided by Durgesh Singh Yadav (durgeshsinghy@gmail.com). Due to data ownership, please contact Durgesh Singh Yadav directly for access to required data.
The supplement related to this article is available online at https://doi.org/10.5194/bg-22-1035-2025-supplement.
Conceptualisation: JC, LE, FH, ST, DSY. Data curation: JC, DSY, NB. Formal analysis: JC. Methodology: JC, LE, FH, ST, DSY. Software: JC (N module, antioxidant processes and DO3SE-Crop), SB (DO3SE-Crop), PP (DO3SE-Crop), NB (DO3SE-Crop), LE (DO3SE-Crop). Supervision: LE, FH, ST. Visualisation: JC. Writing – original draft preparation: JC. Writing – review and editing: JC, LE, FH, ST, DSY, NB, PP, SB.
The contact author has declared that none of the authors has any competing interests.
Publisher's note: Copernicus Publications remains neutral with regard to jurisdictional claims made in the text, published maps, institutional affiliations, or any other geographical representation in this paper. While Copernicus Publications makes every effort to include appropriate place names, the final responsibility lies with the authors.
This article is part of the special issue “Tropospheric Ozone Assessment Report Phase II (TOAR-II) Community Special Issue (ACP/AMT/BG/GMD inter-journal SI)”. It is a result of the Tropospheric Ozone Assessment Report, Phase II (TOAR-II, 2020–2024).
We would like to thank the three anonymous reviewers and editor for their valuable feedback which greatly improved the clarity and quality of the manuscript.
This research has been supported by the Natural Environment Research Council (grant no. NE/S00713X/1).
This paper was edited by Paul Stoy and reviewed by three anonymous referees.
Agrawal, S., Kim, R., Gausman, J., Sharma, S., Sankar, R., Joe, W., and Subramanian, S. V.: Socio-economic patterning of food consumption and dietary diversity among Indian children: evidence from NFHS-4, Eur. J. Clin. Nutr., 73, 1361–1372, https://doi.org/10.1038/s41430-019-0406-0, 2019.
Ali, Q., Athar, H.-R., Haider, M. Z., Shahid, S., Aslam, N., Shehzad, F., Naseem, J., Ashraf, R., Ali, A., and Hussain, S. M.: Role of Amino Acids in Improving Abiotic Stress Tolerance to Plants, in: Plant Tolerance to Environmental Stress, 175–204, https://doi.org/10.1201/9780203705315-12, 2019.
Archibald, A. T., Neu, J. L., Elshorbany, Y. F., Cooper, O. R., Young, P. J., Akiyoshi, H., Cox, R. A., Coyle, M., Derwent, R. G., Deushi, M., Finco, A., Frost, G. J., Galbally, I. E., Gerosa, G., Granier, C., Griffiths, P. T., Hossaini, R., Hu, L., Jöckel, P., Josse, B., Lin, M. Y., Mertens, M., Morgenstern, O., Naja, M., Naik, V., Oltmans, S., Plummer, D. A., Revell, L. E., Saiz-Lopez, A., Saxena, P., Shin, Y. M., Shahid, I., Shallcross, D., Tilmes, S., Trickl, T., Wallington, T. J., Wang, T., Worden, H. M., and Zeng, G.: Tropospheric ozone assessment report: A critical review of changes in the tropospheric ozone burden and budget from 1850 to 2100, Elementa, 8, 034, https://doi.org/10.1525/elementa.2020.034, 2020.
Avnery, S., Mauzerall, D. L., Liu, J., and Horowitz, L. W.: Global crop yield reductions due to surface ozone exposure: 1. Year 2000 crop production losses and economic damage, Atmos. Environ., 45, 2284–2296, https://doi.org/10.1016/j.atmosenv.2010.11.045, 2011.
Balla, K., Karsai, I., Bónis, P., Kiss, T., Berki, Z., Horváth, Á., Mayer, M., Bencze, S., and Veisz, O.: Heat stress responses in a large set of winter wheat cultivars (Triticum aestivum L.) depend on the timing and duration of stress, PLoS One, 14, e0222639, https://doi.org/10.1371/journal.pone.0222639, 2019.
Baqasi, L. A., Qari, H. A., Nahhas, N. Al, Badr, R. H., Taia, W. K., El Dakkak, R., and Hassan, I. A.: Effects of low concentrations of ozone (O3) on metabolic and physiological attributes in wheat (Triticum aestivum L.) pants, Biomed. Pharmacol. J., 11, 929–934, https://doi.org/10.13005/bpj/1450, 2018.
Barillot, R., Chambon, C., and Andrieu, B.: CN-Wheat, a functional-structural model of carbon and nitrogen metabolism in wheat culms after anthesis. I. Model description, Ann. Bot., 118, 997–1013, https://doi.org/10.1093/aob/mcw143, 2016.
Bazargani, M. M., Sarhadi, E., Bushehri, A. A. S., Matros, A., Mock, H. P., Naghavi, M. R., Hajihoseini, V., Mardi, M., Hajirezaei, M. R., Moradi, F., Ehdaie, B., and Salekdeh, G. H.: A proteomics view on the role of drought-induced senescence and oxidative stress defense in enhanced stem reserves remobilization in wheat, J. Proteomics, 74, 1959–1973, https://doi.org/10.1016/j.jprot.2011.05.015, 2011.
Bland, S.: SEI-DO3SE/pyDO3SE-open: V4.39.16, Zenodo [code], https://doi.org/10.5281/zenodo.11620501, 2024.
Brestenský, M., Nitrayová, S., Patráš, P., and Nitray, J.: Dietary Requirements for Proteins and Amino Acids in Human Nutrition, Curr. Nutr. Food Sci., 15, 638–645, https://doi.org/10.2174/1573401314666180507123506, 2019.
Brewster, C., Fenner, N., and Hayes, F.: Chronic ozone exposure affects nitrogen remobilization in wheat at key growth stages, Sci. Total Environ., 908, 168288, https://doi.org/10.1016/j.scitotenv.2023.168288, 2024.
Broberg, M. C., Feng, Z., Xin, Y., and Pleijel, H.: Ozone effects on wheat grain quality – A summary, Environ. Pollut., 197, 203–213, https://doi.org/10.1016/j.envpol.2014.12.009, 2015.
Broberg, M. C., Uddling, J., Mills, G., and Pleijel, H.: Fertilizer efficiency in wheat is reduced by ozone pollution, Sci. Total Environ., 607–608, 876–880, https://doi.org/10.1016/j.scitotenv.2017.07.069, 2017.
Broberg, M. C., Hayes, F., Harmens, H., Uddling, J., Mills, G., and Pleijel, H.: Effects of ozone, drought and heat stress on wheat yield and grain quality, Agric. Ecosyst. Environ., 352, 108505, https://doi.org/10.1016/j.agee.2023.108505, 2023.
Chang-Espino, M., González-Fernández, I., Alonso, R., Araus, J. L., and Bermejo-Bermejo, V.: The effect of increased ozone levels on the stable carbon and nitrogen isotopic signature of wheat cultivars and landraces, Atmosphere (Basel)., 12, 883, https://doi.org/10.3390/atmos12070883, 2021.
CLRTAP: Chapter 3: Mapping critical levels for vegetation, in: Manual on methodologies and criteria for modelling and mapping critical loads and levels and air pollution effects, risks and trends, https://unece.org/fileadmin/DAM/env/documents/2017/AIR/EMEP/Final__new_Chapter_3_v2__August_2017_.pdf (last access: 30 September 2024), 2017.
Cook, J.: JoCook1997/DO3SE-CropN: Initial release (v2.0), Zenodo [code], https://doi.org/10.5281/zenodo.13771475, 2024.
Cook, J., Brewster, C., Hayes, F., Booth, N., Bland, S., Pande, P., Thankappan, S., Pleijel, H., and Emberson, L.: New ozone–nitrogen model shows early senescence onset is the primary cause of ozone-induced reduction in grain quality of wheat, Biogeosciences, 21, 4809–4835, https://doi.org/10.5194/bg-21-4809-2024, 2024.
Cooper, O. R., Parrish, D. D., Ziemke, J., Balashov, N. V., Cupeiro, M., Galbally, I. E., Gilge, S., Horowitz, L., Jensen, N. R., Lamarque, J. F., Naik, V., Oltmans, S. J., Schwab, J., Shindell, D. T., Thompson, A. M., Thouret, V., Wang, Y., and Zbinden, R. M.: Tropospheric Ozone Assessment Report: Global distribution and trends of tropospheric ozone: An observation-based review, Elem. Sci. Anthr., 2, 000029, https://doi.org/10.12952/journal.elementa.000029, 2014.
Droutsas, I.: How do climate, ozone and crops interact to impact on health and nutrition?, University of Leeds, https://etheses.whiterose.ac.uk/id/eprint/27657/1/Droutsas_I_Earth_and_Environment_PhD_2020.pdf (last access: 30 September 2024), 2020.
Ebi, K. L., Anderson, C. L., Hess, J. J., Kim, S.-H., Loladze, I., Neumann, R. B., Singh, D., Ziska, L., and Wood, R.: Nutritional quality of crops in a high CO2 world: an agenda for research and technology development, Environ. Res. Lett., 16, 064045, https://doi.org/10.1088/1748-9326/abfcfa, 2021.
Elango, R., Ball, R. O., and Pencharz, P. B.: Indicator amino acid oxidation: Concept and application, J. Nutr., 138, 243–246, https://doi.org/10.1093/jn/138.2.243, 2008.
Elshorbany, Y., Ziemke, J. R., Strode, S., Petetin, H., Miyazaki, K., De Smedt, I., Pickering, K., Seguel, R. J., Worden, H., Emmerichs, T., Taraborrelli, D., Cazorla, M., Fadnavis, S., Buchholz, R. R., Gaubert, B., Rojas, N. Y., Nogueira, T., Salameh, T., and Huang, M.: Tropospheric ozone precursors: global and regional distributions, trends, and variability, Atmos. Chem. Phys., 24, 12225–12257, https://doi.org/10.5194/acp-24-12225-2024, 2024.
Emberson, L.: Effects of ozone on agriculture, forests and grasslands: Improving risk assessment methods for O3, Philos. T. Roy. Soc. A, 378, 20190327, https://doi.org/10.1098/rsta.2019.0327, 2020.
Emberson, L., Bland, S., and Booth, N.: AgMIP Datahub [data set], https://agmipdatahub.wordpress.com/about/ (last access: 8 December 2022), 2021.
Emberson, L. D., Ashmore, M. R., Cambridge, H. M., Simpson, D., and Tuovinend, J.: Modelling stomatal ozone flux across Europe, Environ. Pollut., 109, 403–413, 2000.
Emberson, L. D., Pleijel, H., Ainsworth, E. A., van den Berg, M., Ren, W., Osborne, S., Mills, G., Pandey, D., Dentener, F., Büker, P., Ewert, F., Koeble, R., and Van Dingenen, R.: Ozone effects on crops and consideration in crop models, Eur. J. Agron., 100, 19–34, https://doi.org/10.1016/j.eja.2018.06.002, 2018.
Faisal, S., Mujtaba, S. M., Khan, M. A., and Mahboob, W.: Morpho-physiological assessment of wheat (Triticum aestivum L.) genotypes for drought stress tolerance at seedling stage, Pakistan J. Bot., 49, 445–452, 2017.
FAO: Dietary protein quality evaluation in human nutrition: Report of an FAO Expert Consultation, Rome, 1–66, ISBN 978-92-5-107417-6, 2013.
FAO, IFAD, UNICEF, WFP, and WHO: The State of Food Security and Nutrition in the World 2020, Transforming food systems for affordable healthy diets, FAO, Rome, 320 pp., ISBN 978-92-5-132901-6, 2020.
FAO, IFAD, UNICEF, WFP, and WHO: The state of food security and nutrition in the world, https://doi.org/10.1016/S2213-8587(22)00220-0, 2023.
Feller, U. and Fischer, A.: Nitrogen metabolism in senescing leaves, CRC. Crit. Rev. Plant Sci., 13, 241–273, https://doi.org/10.1080/07352689409701916, 1994.
Feng, Z. and Kobayashi, K.: Assessing the impacts of current and future concentrations of surface ozone on crop yield with meta-analysis, Atmos. Environ., 43, 1510–1519, https://doi.org/10.1016/j.atmosenv.2008.11.033, 2009.
Feng, Z., Kobayashi, K., and Ainsworth, E. A.: Impact of elevated ozone concentration on growth, physiology, and yield of wheat (Triticum aestivum L.): A meta-analysis, Glob. Chang. Biol., 14, 2696–2708, https://doi.org/10.1111/j.1365-2486.2008.01673.x, 2008.
Fowler, D., Amann, M., Anderson, R., Ashmore, M., Cox, P., Depledge, M., Derwent, D., Grennfelt, P., Hewitt, N., Hov, O., Jenkin, M., Kelly, F., Liss, P., Pilling, M., Pyle, J., Slingo, J., and Stevenson, D.: Ground-level ozone in the 21st century: future trends, impacts and policy implications, 134 pp., ISBN 978-0-85403-713-1, 2008.
G A, N., Chitransh, A., Gampa, M., Goswami, S., Dalal, M., Kumar, S., Tyagi, A., and Kumar, R. R.: Unraveling the effect of drought and heat stresses on grain quality of wheat (Triticum aestivum), Indian J. Agric. Sci., 94, 489–494, https://doi.org/10.56093/ijas.v94i5.142783, 2024.
Gaju, O., Allard, V., Martre, P., Le Gouis, J., Moreau, D., Bogard, M., Hubbart, S., and Foulkes, M. J.: Nitrogen partitioning and remobilization in relation to leaf senescence, grain yield and grain nitrogen concentration in wheat cultivars, F. Crop. Res., 155, 213–223, https://doi.org/10.1016/j.fcr.2013.09.003, 2014.
Gao, M., Liu, Y., Dong, Y., and Song, Z.: Photosynthetic and antioxidant response of wheat to di(2-ethylhexyl) phthalate (DEHP) contamination in the soil, Chemosphere, 209, 258–267, https://doi.org/10.1016/j.chemosphere.2018.06.090, 2018.
Ghude, S. D., Jena, C., Chate, D. M., Beig, G., Pfister, G. G., Kumar, R., and Ramanathan, V.: Reductions in India's crop yield due to ozone, Geophys. Res. Lett., 41, 5685–5691, https://doi.org/10.1002/2014GL060930, 2014.
Gill, S. S. and Tuteja, N.: Reactive oxygen species and antioxidant machinery in abiotic stress tolerance in crop plants, Plant Physiol. Biochem., 48, 909–930, https://doi.org/10.1016/j.plaphy.2010.08.016, 2010.
Global Nutrition Report: Country Nutrition Profiles, https://globalnutritionreport.org/resources/nutrition-profiles/asia/southern-asia/india/ (last access: 30 September 2024), 2020..
Gonmei, Z. and Toteja, G. S.: Micronutrient status of Indian population, Indian J. Med. Res., 148, 511–521, https://doi.org/10.4103/ijmr.IJMR_1768_18, 2018.
Guarin, J. R., Emberson, L., Simpson, D., Hernandez-Ochoa, I. M., Rowland, D., and Asseng, S.: Impacts of tropospheric ozone and climate change on Mexico wheat production, Climatic Change, 155, 157–174, https://doi.org/10.1007/s10584-019-02451-4, 2019.
Guarin, J. R., Jägermeyr, J., Ainsworth, E. A., Oliveira, F. A. A., Asseng, S., Boote, K., Elliott, J., Emberson, L., Foster, I., Hoogenboom, G., Kelly, D., Ruane, A. C., and Sharps, K.: Modeling the effects of tropospheric ozone on the growth and yield of global staple crops with DSSAT v4.8.0, Geosci. Model Dev., 17, 2547–2567, https://doi.org/10.5194/gmd-17-2547-2024, 2024.
He, D., Wang, E., Wang, J., and Robertson, M. J.: Data requirement for effective calibration of process-based crop models, Agric. For. Meteorol., 234–235, 136–148, https://doi.org/10.1016/j.agrformet.2016.12.015, 2017.
Herforth, A., Bai, Y., Venkat, A., Mahrt, K., Ebel, A., and Masters, W. A.: Cost and affordability of nutritious diets across and within countries., Background paper for The State of Food Security and Nutrition in the World, Rome, 105 pp., https://openknowledge.fao.org/items/5c33ca33-53e8-4ec6-89c5-f398bcfbf3c3 (last access: 30 September 2024), 2020.
Jones, D. B.: Factors for converting percentages of nitrogen in foods and feeds into percentages of proteins, United States Department of Agriculture, Washington, D.C., 1941.
Khanna-Chopra, R.: Leaf senescence and abiotic stresses share reactive oxygen species-mediated chloroplast degradation, Protoplasma, 249, 469–481, https://doi.org/10.1007/s00709-011-0308-z, 2012.
Khatkar, B. S., Chaudhary, N., and Dangi, P.: Production and Consumption of Grains: India, 2nd edn., Elsevier Ltd., 367–373, https://doi.org/10.1016/B978-0-12-394437-5.00044-9, 2015.
Kumar, R., Barth, M. C., Pfister, G. G., Delle Monache, L., Lamarque, J. F., Archer-Nicholls, S., Tilmes, S., Ghude, S. D., Wiedinmyer, C., Naja, M., and Walters, S.: How Will Air Quality Change in South Asia by 2050?, J. Geophys. Res.-Atmos., 123, 1840–1864, https://doi.org/10.1002/2017JD027357, 2018.
Kurpad, A. V. and Thomas, T.: Protein Quality and its Food Source in the Diets of Young Indian Children, J. Nutr., 150, 1350–1351, https://doi.org/10.1093/jn/nxaa100, 2020.
Lal, S., Venkataramani, S., Naja, M., Kuniyal, J. C., Mandal, T. K., Bhuyan, P. K., Kumari, K. M., Tripathi, S. N., Sarkar, U., Das, T., Swamy, Y. V., Gopal, K. R., Gadhavi, H., and Kumar, M. K. S.: Loss of crop yields in India due to surface ozone: an estimation based on a network of observations, Environ. Sci. Pollut. Res., 24, 20972–20981, https://doi.org/10.1007/s11356-017-9729-3, 2017.
Li, G., Wei, J., Li, C., Fu, K., Li, C., and Li, C.: Amino acid metabolism response to post-anthesis drought stress during critical periods of elite wheat (Triticum aestivum L.) endosperm development, Environ. Exp. Bot., 218, 105577, https://doi.org/10.1016/j.envexpbot.2023.105577, 2024.
Li, H., Yang, Y., Jin, J., Wang, H., Li, K., Wang, P., and Liao, H.: Climate-driven deterioration of future ozone pollution in Asia predicted by machine learning with multi-source data, Atmos. Chem. Phys., 23, 1131–1145, https://doi.org/10.5194/acp-23-1131-2023, 2023.
Li, J., Guo, X., Zhang, S., Zhang, Y., Chen, L., Zheng, W., and Xue, X.: Effects of light quality on growth, nutritional characteristics, and antioxidant properties of winter wheat seedlings (Triticum aestivum L.), Front. Plant Sci., 13, 1–15, https://doi.org/10.3389/fpls.2022.978468, 2022.
Liu, J., Feng, H., He, J., Chen, H., and Ding, D.: The effects of nitrogen and water stresses on the nitrogen-to-protein conversion factor of winter wheat, Agric. Water Manag., 210, 217–223, https://doi.org/10.1016/j.agwat.2018.07.042, 2018.
Liu, J., Feng, H., He, J., Chen, H., Ding, D., Luo, X., and Dong, Q.: Modeling wheat nutritional quality with a modified CERES-wheat model, Eur. J. Agron., 109, 125901, https://doi.org/10.1016/j.eja.2019.03.005, 2019.
Lu, X., Zhang, L., Liu, X., Gao, M., Zhao, Y., and Shao, J.: Lower tropospheric ozone over India and its linkage to the South Asian monsoon, Atmos. Chem. Phys., 18, 3101–3118, https://doi.org/10.5194/acp-18-3101-2018, 2018.
Mariem, S. Ben, Soba, D., Zhou, B., Loladze, I., Morales, F., and Aranjuelo, I.: Climate Change, Crop Yields, and Grain Quality of C3 Cereals: A Meta-Analysis of [CO2], Temperature , and Drought Effects, Plants, 10, 1052, https://doi.org/10.3390/plants10061052, 2021.
Mariotti, F., Tomé, D., and Mirand, P. P.: Converting nitrogen into protein – Beyond 6.25 and Jones' factors, Crit. Rev. Food Sci. Nutr., 48, 177–184, https://doi.org/10.1080/10408390701279749, 2008.
Martre, P., Jamieson, P. D., Semenov, M. A., Zyskowski, R. F., Porter, J. R., and Triboi, E.: Modelling protein content and composition in relation to crop nitrogen dynamics for wheat, Eur. J. Agron., 25, 138–154, https://doi.org/10.1016/j.eja.2006.04.007, 2006.
Medek, D. E., Schwartz, J., and Myers, S. S.: Estimated effects of future atmospheric CO2 concentrations on protein intake and the risk of protein deficiency by country and region, Environ. Health Perspect., 125, 1–8, https://doi.org/10.1289/EHP41, 2017.
Meybodi, N. M., Mirmoghtadaie, L., Sheidaei, Z., and Mohammad, A.: Wheat Bread: Potential Approach to Fortify its Lysine Content, Curr. Nutr. Food Sci., 15, 630–637, https://doi.org/10.2174/1573401315666190228125241, 2019.
Mills, G., Sharps, K., Simpson, D., Pleijel, H., Broberg, M., Uddling, J., Jaramillo, F., Davies, W. J., Dentener, F., Van den Berg, M., Agrawal, M., Agrawal, S. B., Ainsworth, E. A., Büker, P., Emberson, L., Feng, Z., Harmens, H., Hayes, F., Kobayashi, K., Paoletti, E., and Van Dingenen, R.: Ozone pollution will compromise efforts to increase global wheat production, Glob. Change Biol., 24, 3560–3574, https://doi.org/10.1111/gcb.14157, 2018a.
Mills, G., Pleijel, H., Malley, C. S., Sinha, B., Cooper, O. R., Schultz, M. G., Neufeld, H. S., Simpson, D., Sharps, K., Feng, Z., Gerosa, G., Harmens, H., Kobayashi, K., Saxena, P., Paoletti, E., Sinha, V., and Xu, X.: Tropospheric Ozone Assessment Report: Present-day ozone distribution and trends relevant to human health, Elem. Sci. Anthr., 6, 47, https://doi.org/10.1525/elementa.302, 2018b.
Ministry of Agriculture & Farmers Welfare: Agricultural Statistics at a Glance 2021, New Delhi, 431 pp., https://desagri.gov.in/wp-content/uploads/2021/07/Agricultural-Statistics-at-a-Glance-2021-English-version.pdf (last access: 30 September 2024), 2022.
Minocha, S., Thomas, T., and Kurpad, A. V.: Dietary protein and the health-nutrition-agriculture connection in India, J. Nutr., 147, 1243–1250, https://doi.org/10.3945/jn.116.243980, 2017.
Mishra, A. K., Rai, R., and Agrawal, S. B.: Individual and interactive effects of elevated carbon dioxide and ozone on tropical wheat (Triticum aestivum L.) cultivars with special emphasis on ROS generation and activation of antioxidant defence system, Indian J. Biochem. Biophys., 50, 139–149, 2013.
Naaz, S., Rai, R., Adhikari, D., Kannaujia, R., Jamal, R., Ansari, M. A., Ansari, I., Pandey, V., and Barik, S. K.: Bioclimatic modeling and FACE study forecast a bleak future for wheat production in India, Environ. Monit. Assess., 195, 48, https://doi.org/10.1007/s10661-022-10551-5, 2022.
Naidu, B. P., Paleg, L. G., Aspinall, D., Jennings, A. C., and Jones, G. P.: Amino acid and glycine betaine accumulation in cold-stressed wheat seedlings, Phytochemistry, 30, 407–409, https://doi.org/10.1016/0031-9422(91)83693-F, 1991.
Nayyar, H. and Walia, D. P.: Water stress induced proline accumulation in contrasting wheat genotypes as affected by calcium and abscisic acid, Biol. Plantarum, 46, 275–279, https://doi.org/10.1023/A:1022867030790, 2003.
Nehe, A. S., Misra, S., Murchie, E. H., Chinnathambi, K., Singh Tyagi, B., and Foulkes, M. J.: Nitrogen partitioning and remobilization in relation to leaf senescence, grain yield and protein concentration in Indian wheat cultivars, F. Crop. Res., 251, 107778, https://doi.org/10.1016/j.fcr.2020.107778, 2020.
Nguyen, T. H., Cappelli, G. A., Emberson, L., Ignacio, G. F., Irimescu, A., Francesco, S., Fabrizio, G., Booth, N., Boldeanu, G., Bermejo, V., Bland, S., Frei, M., Ewert, F., and Gaiser, T.: Assessing the spatio-temporal tropospheric ozone and drought impacts on leaf growth and grain yield of wheat across Europe through crop modeling and remote sensing data, Eur. J. Agron., 153, 127052, https://doi.org/10.1016/j.eja.2023.127052, 2024.
Osborne, T., Gornall, J., Hooker, J., Williams, K., Wiltshire, A., Betts, R., and Wheeler, T.: JULES-crop: a parametrisation of crops in the Joint UK Land Environment Simulator, Geosci. Model Dev., 8, 1139–1155, https://doi.org/10.5194/gmd-8-1139-2015, 2015.
Pande, P., Bland, S., Booth, N., Cook, J., Feng, Z., and Emberson, L.: Development of the DO3SE-Crop model to assess ozone effects on crop phenology, biomass, and yield, Biogeosciences, 22, 181–212, https://doi.org/10.5194/bg-22-181-2025, 2025.
Pandey, A. K., Ghosh, A., Agrawal, M., and Agrawal, S. B.: Effect of elevated ozone and varying levels of soil nitrogen in two wheat (Triticum aestivum L.) cultivars: Growth, gas-exchange, antioxidant status, grain yield and quality, Ecotoxicol. Environ. Saf., 158, 59–68, https://doi.org/10.1016/j.ecoenv.2018.04.014, 2018.
Pedregosa, F., Varoquaux, G., Gramfort, A., Michel, V., Thirion, B., Grisel, O., Blondel, M., Prettenhofer, P., Weiss, R., Dubourg, V., Vanderplas, J., Passos, A., Cournapeau, D., Brucher, M., Perrot, M., and Duchesnay, E.: Scikit-learn: Machine Learning in Python Fabian, J. Mach. Learn. Res., 12, 2825–2830, https://doi.org/10.48550/arXiv.1201.0490, 2011.
Piikki, K., De Temmerman, L., Ojanperä, K., Danielsson, H., and Pleijel, H.: The grain quality of spring wheat (Triticum aestivum L.) in relation to elevated ozone uptake and carbon dioxide exposure, Eur. J. Agron., 28, 245–254, https://doi.org/10.1016/j.eja.2007.07.004, 2008.
Pleijel, H., Danielsson, H., and Broberg, M. C.: Benefits of the Phytotoxic Ozone Dose (POD) index in dose-response functions for wheat yield loss, Atmos. Environ., 268, 118797, https://doi.org/10.1016/j.atmosenv.2021.118797, 2022.
Rai, R. and Agrawal, M.: Impact of tropospheric ozone on crop plants, P. Natl. A. Sci. India B, 82, 241–257, https://doi.org/10.1007/s40011-012-0032-2, 2012.
Rathore, A., Gopikrishnan, G. S., and Kuttippurath, J.: Changes in tropospheric ozone over India: Variability, long-term trends and climate forcing, Atmos. Environ., 309, 119959, https://doi.org/10.1016/j.atmosenv.2023.119959, 2023.
Rijal, B., Baduwal, P., Chaudhary, M., Chapagain, S., Khanal, S., Khanal, S., and Poudel, P. B.: Drought Stress Impacts on Wheat and Its Resistance Mechanisms, Malaysian J. Sustain. Agric., 5, 67–76, https://doi.org/10.26480/mjsa.02.2021.67.76, 2020.
Sarkar, A. and Agrawal, S. B.: Elevated ozone and two modern wheat cultivars: An assessment of dose dependent sensitivity with respect to growth, reproductive and yield parameters, Environ. Exp. Bot., 69, 328–337, https://doi.org/10.1016/j.envexpbot.2010.04.016, 2010.
Sarkar, A., Rakwal, R., Agrawal, S. B., Shibato, J., Ogawa, Y., Yoshida, Y., Kumar Agrawal, G., and Agrawal, M.: Investigating the impact of elevated levels of ozone on tropical wheat using integrated phenotypical, physiological, biochemical, and proteomics approaches, J. Proteome Res., 9, 4565–4584, https://doi.org/10.1021/pr1002824, 2010.
Schauberger, B., Rolinski, S., Schaphoff, S., and Müller, C.: Global historical soybean and wheat yield loss estimates from ozone pollution considering water and temperature as modifying effects, Agric. For. Meteorol., 265, 1–15, https://doi.org/10.1016/j.agrformet.2018.11.004, 2019.
Schultz, M. G., Schröder, S., Lyapina, O., Cooper, O. R., Galbally, I., Petropavlovskikh, I., Von Schneidemesser, E., Tanimoto, H., Elshorbany, Y., Naja, M., Seguel, R. J., Dauert, U., Eckhardt, P., Feigenspan, S., Fiebig, M., Hjellbrekke, A. G., Hong, Y. D., Kjeld, P. C., Koide, H., Lear, G., Tarasick, D., Ueno, M., Wallasch, M., Baumgardner, D., Chuang, M. T., Gillett, R., Lee, M., Molloy, S., Moolla, R., Wang, T., Sharps, K., Adame, J. A., Ancellet, G., Apadula, F., Artaxo, P., Barlasina, M. E., Bogucka, M., Bonasoni, P., Chang, L., Colomb, A., Cuevas-Agulló, E., Cupeiro, M., Degorska, A., Ding, A., Fröhlich, M., Frolova, M., Gadhavi, H., Gheusi, F., Gilge, S., Gonzalez, M. Y., Gros, V., Hamad, S. H., Helmig, D., Henriques, D., Hermansen, O., Holla, R., Hueber, J., Im, U., Jaffe, D. A., Komala, N., Kubistin, D., Lam, K. S., Laurila, T., Lee, H., Levy, I., Mazzoleni, C., Mazzoleni, L. R., McClure-Begley, A., Mohamad, M., Murovec, M., Navarro-Comas, M., Nicodim, F., Parrish, D., Read, K. A., Reid, N., Ries, L., Saxena, P., Schwab, J. J., Scorgie, Y., Senik, I., Simmonds, P., Sinha, V., Skorokhod, A. I., Spain, G., Spangl, W., Spoor, R., Springston, S. R., Steer, K., Steinbacher, M., Suharguniyawan, E., Torre, P., Trickl, T., Weili, L., Weller, R., Xiaobin, X., Xue, L., and Zhiqiang, M.: Tropospheric Ozone Assessment Report: Database and metrics data of global surface ozone observations, Elem. Sci. Anthr., 5, 58, https://doi.org/10.1525/elementa.244, 2017.
Shaheen, N., Islam, S., Munmun, S., Mohiduzzaman, M., and Longvah, T.: Amino acid profiles and digestible indispensable amino acid scores of proteins from the prioritized key foods in Bangladesh, Food Chem., 213, 83–89, https://doi.org/10.1016/j.foodchem.2016.06.057, 2016.
Sharma, A., Ojha, N., Pozzer, A., Beig, G., and Gunthe, S. S.: Revisiting the crop yield loss in India attributable to ozone, Atmos. Environ. X, 1, 100008, https://doi.org/10.1016/j.aeaoa.2019.100008, 2019.
Shewry, P. R. and Hey, S. J.: The contribution of wheat to human diet and health, Food Energy Secur., 4, 178–202, https://doi.org/10.1002/FES3.64, 2015.
Shiferaw, B., Smale, M., Braun, H. J., Duveiller, E., Reynolds, M., and Muricho, G.: Crops that feed the world 10. Past successes and future challenges to the role played by wheat in global food security, Food Secur., 5, 291–317, https://doi.org/10.1007/s12571-013-0263-y, 2013.
Siddiqi, R. A., Singh, T. P., Rani, M., Sogi, D. S., and Bhat, M. A.: Diversity in Grain, Flour, Amino Acid Composition, Protein Profiling, and Proportion of Total Flour Proteins of Different Wheat Cultivars of North India, Front. Nutr., 7, 141, https://doi.org/10.3389/fnut.2020.00141, 2020.
Simon-Sarkadi, L. and Galiba, G.: Reflection of Environmental Stresses, Period. Polytech. Chem. Eng., 40, 79–86, 1996.
Singh, N., Dey, S., and Knibbs, L. D.: Spatio-temporal patterns of tropospheric NO2 over India during 2005–2019, Atmos. Pollut. Res., 14, 101692, https://doi.org/10.1016/j.apr.2023.101692, 2023.
Sinha, B., Singh Sangwan, K., Maurya, Y., Kumar, V., Sarkar, C., Chandra, B. P., and Sinha, V.: Assessment of crop yield losses in Punjab and Haryana using 2 years of continuous in situ ozone measurements, Atmos. Chem. Phys., 15, 9555–9576, https://doi.org/10.5194/acp-15-9555-2015, 2015.
Stevenson, D. S., Young, P. J., Naik, V., Lamarque, J.-F., Shindell, D. T., Voulgarakis, A., Skeie, R. B., Dalsoren, S. B., Myhre, G., Berntsen, T. K., Folberth, G. A., Rumbold, S. T., Collins, W. J., MacKenzie, I. A., Doherty, R. M., Zeng, G., van Noije, T. P. C., Strunk, A., Bergmann, D., Cameron-Smith, P., Plummer, D. A., Strode, S. A., Horowitz, L., Lee, Y. H., Szopa, S., Sudo, K., Nagashima, T., Josse, B., Cionni, I., Righi, M., Eyring, V., Conley, A., Bowman, K. W., Wild, O., and Archibald, A.: Tropospheric ozone changes, radiative forcing and attribution to emissions in the Atmospheric Chemistry and Climate Model Intercomparison Project (ACCMIP), Atmos. Chem. Phys., 13, 3063–3085, https://doi.org/10.5194/acp-13-3063-2013, 2013.
Swaminathan, S., Vaz, M., and Kurpad, A. V.: Protein intakes in India, Br. J. Nutr., 108, 50–58, https://doi.org/10.1017/S0007114512002413, 2012.
Tai, A. P. K., Sadiq, M., Pang, J. Y. S., Yung, D. H. Y., and Feng, Z.: Impacts of Surface Ozone Pollution on Global Crop Yields: Comparing Different Ozone Exposure Metrics and Incorporating Co-effects of CO2, Front. Sustain. Food Syst., 5, 534616, https://doi.org/10.3389/fsufs.2021.534616, 2021.
Tao, F., Feng, Z., Tang, H., Chen, Y., and Kobayashi, K.: Effects of climate change, CO2 and O3 on wheat productivity in Eastern China, singly and in combination, Atmos. Environ., 153, 182–193, https://doi.org/10.1016/j.atmosenv.2017.01.032, 2017.
Tian, H., Ren, W., Tao, B., Sun, G., Chappelka, A., Wang, X., Pan, S., Yang, J., Liu, J., Felzer, B. S., Melillo, J. M., and Reilly, J.: Climate extremes and ozone pollution: a growing threat to China' s food security, Ecosyst. Heal. Sustain., 2, e01203, https://doi.org/10.1002/ehs2.1203, 2015.
Tiwari, S. and Agrawal, M.: Tropospheric Ozone and its Impacts on Crop Plants, Springer International Publishing, Cham, Switzerland, https://doi.org/10.1007/978-3-319-71873-6, 2018.
Tomer, R., Bhatia, A., Kumar, V., Kumar, A., Singh, R., Singh, B., and Singh, S. D.: Impact of elevated ozone on growth, yield and nutritional quality of two wheat species in northern india, Aerosol Air Qual. Res., 15, 329–340, https://doi.org/10.4209/aaqr.2013.12.0354, 2015.
Tripathi, A. and Mishra, A. K.: The Wheat Sector in India: Production, Policies and Food Security, in: The Eurasian Wheat Belt and Food Security: Global and Regional Aspects, 275–296, https://doi.org/10.1007/978-3-319-33239-0_17, 2017.
United States Department of Agriculture: China Wheat: MY 2022/23 production projected down from last year, Commodity Intelligence Report: Foreign Agricultural Service Report, 1–9, https://ipad.fas.usda.gov/highlights/2022/05/China/index.pdf (last access: 30 September 2024), 2022.
Van Dingenen, R., Dentener, F. J., Raes, F., Krol, M. C., Emberson, L., and Cofala, J.: The global impact of ozone on agricultural crop yields under current and future air quality legislation, Atmos. Environ., 43, 604–618, https://doi.org/10.1016/j.atmosenv.2008.10.033, 2009.
Wallach, D.: Crop model calibration: A statistical perspective, Agron. J., 103, 1144–1151, https://doi.org/10.2134/agronj2010.0432, 2011.
Wang, P., Liu, D., Mukherjee, A., Agrawal, M., Zhang, H., Agathokleous, E., Qiao, X., Xu, X., Chen, Y., Wu, T., Zhu, M., Saikawa, E., Agrawal, S. B., and Feng, Z.: Air pollution governance in China and India: Comparison and implications, Environ. Sci. Policy, 142, 112–120, https://doi.org/10.1016/j.envsci.2023.02.006, 2023.
Wang, X., Hou, L., Lu, Y., Wu, B., Gong, X., Liu, M., Wang, J., Sun, Q., Vierling, E., and Xu, S.: Metabolic adaptation of wheat grain contributes to a stable filling rate under heat stress, J. Exp. Bot., 69, 5531–5545, https://doi.org/10.1093/jxb/ery303, 2018.
Xu, B., Wang, T., Gao, L., Ma, D., Song, R., Zhao, J., Yang, X., Li, S., Zhuang, B., Li, M., and Xie, M.: Impacts of meteorological factors and ozone variation on crop yields in China concerning carbon neutrality objectives in 2060, Environ. Pollut., 317, 120715, https://doi.org/10.1016/j.envpol.2022.120715, 2023.
Yadav, D. S., Rai, R., Mishra, A. K., Chaudhary, N., Mukherjee, A., Agrawal, S. B., and Agrawal, M.: ROS production and its detoxification in early and late sown cultivars of wheat under future O3 concentration, Sci. Total Environ., 659, 200–210, https://doi.org/10.1016/j.scitotenv.2018.12.352, 2019.
Yadav, D. S., Mishra, A. K., Rai, R., Chaudhary, N., Mukherjee, A., Agrawal, S. B., and Agrawal, M.: Responses of an old and a modern Indian wheat cultivar to future O3 level: Physiological, yield and grain quality parameters, Environ. Pollut., 259, 113939, https://doi.org/10.1016/j.envpol.2020.113939, 2020.
Yadav, D. S., Agrawal, S. B., and Agrawal, M.: Ozone flux-effect relationship for early and late sown Indian wheat cultivars: Growth, biomass, and yield, F. Crop. Res., 263, 108076, https://doi.org/10.1016/j.fcr.2021.108076, 2021.
Yang, Q., Zhao, D., and Liu, Q.: Connections Between Amino Acid Metabolisms in Plants: Lysine as an Example, Front. Plant Sci., 11, 928, https://doi.org/10.3389/fpls.2020.00928, 2020.
Zhang, D., Liu, J., Li, D., Batchelor, W. D., Wu, D., Zhen, X., and Ju, H.: Future climate change impacts on wheat grain yield and protein in the North China Region, Sci. Total Environ., 902, 166147, https://doi.org/10.1016/j.scitotenv.2023.166147, 2023.
Zhou, S. S., Tai, A. P. K., Sun, S., Sadiq, M., Heald, C. L., and Geddes, J. A.: Coupling between surface ozone and leaf area index in a chemical transport model: strength of feedback and implications for ozone air quality and vegetation health, Atmos. Chem. Phys., 18, 14133–14148, https://doi.org/10.5194/acp-18-14133-2018, 2018.
Zulfiqar, F. and Ashraf, M.: Proline Alleviates Abiotic Stress Induced Oxidative Stress in Plants, J. Plant Growth Regul., 42, 4629–4651, https://doi.org/10.1007/s00344-022-10839-3, 2023.
- Abstract
- Introduction
- Model development
- Parameterisation and calibration of the DO3SE-CropN model
- Results
- Discussion
- Conclusions
- Code availability
- Data availability
- Author contributions
- Competing interests
- Disclaimer
- Special issue statement
- Acknowledgements
- Financial support
- Review statement
- References
- Supplement