the Creative Commons Attribution 4.0 License.
the Creative Commons Attribution 4.0 License.
 | 20 Mar 2025
Constraining 2010–2020 Amazonian carbon flux estimates with satellite solar-induced fluorescence (SIF)
Marikate Mountain
Bharat Rastogi
John B. Miller
Luciana Gatti
Amazonia's net biome exchange (NBE), the sum of biogenic and wildfire carbon fluxes, is a fundamental indicator of the state of its ecosystems. It also quantifies the magnitude and patterns of short- and long-term carbon dioxide sources and sinks but is poorly quantified and out of equilibrium (non-zero) due to both direct (deforestation) and indirect (climate-related) anthropogenic disturbance. Determining trends in Amazonia's carbon balance, shifts in carbon exchange pathways of NBE, and timescales of ecosystem sensitivity to disturbance requires reliable biogenic flux models that adequately capture fluxes from diurnal to seasonal and annual timescales. Our study assimilates readily available observations and a derived solar-induced fluorescence (SIF) product to estimate hourly biogenic carbon dioxide (CO2) fluxes (here in units of ) as net ecosystem exchange (NEE), as well as its photosynthesis and respiration constituents, at 12 km resolution using four versions of the data-driven diagnostic Vegetation Photosynthesis and Respiration Model (VPRM). The VPRM versions are all calibrated with ground-based eddy flux data and vary based on whether (1) the photosynthesis term incorporates SIF (VPRM_SIF) or traditional surface reflectance (VPRM_TRA) and (2) the respiration term is modified beyond a simple linear air temperature dependence (VPRM_SIFg; VPRM_TRG). We compare the VPRM versions with each other and with hourly fluxes from the bottom-up mechanistic Simple Biosphere 4 (SiB4 v4.2) model. We also use NASA's Orbiting Carbon Observatory (OCO-2) CO2 column observations to optimize the VPRM and SiB4 models during the 2016 wet season which occurred at the tail of the 2015/2016 severe El Niño. The wet season 2016 case study suggests that relative to SiB4 and the SIF-based VPRMs, the traditional VPRM versions can underestimate uptake by a factor of 3. In addition, the VPRM_SIFg version better captures biogenic CO2 fluxes at hourly to seasonal scales than all other VPRM versions in both anomalously wet and anomalously dry conditions. We also find that the VPRM_SIFg model and the independent bottom-up mechanistic hourly SiB4 model converge in NEE, although there are differences in the partitioning of the photosynthesis and respiration components. We further note that VPRM_SIFg describes greater spatial heterogeneity in carbon exchange throughout the Amazon. Despite the paucity of OCO-2 CO2 column observations (XCO2) over the Amazon in the wet season, incorporating XCO2 into the models significantly reduces near-field model–measurement mismatch at aircraft vertical profiling locations. Finally, a qualitative analysis of the unoptimized biogenic models from 2010–2020 agrees with the wet season 2016 case study, where the traditional VPRM formulations significantly underestimate photosynthesis and respiration relative to VPRM_SIFg. Overall, the VPRM_SIFg biogenic flux model shows promise in its ability to capture Amazonian carbon fluxes across multiple timescale and moisture regimes, suggesting its suitability for larger studies evaluating interannual and seasonal carbon trends in fire as well as the biogenic components of the region's NBE.
- Article
(8037 KB) - Full-text XML
-
Supplement
(17469 KB) - BibTeX
- EndNote


The terrestrial tropics dominate the interannual variability in the global carbon cycle (Piao et al., 2020). As the dominant component of the South American terrestrial tropics, the Amazon is a major contributor to both the long-term global terrestrial carbon balance and the interannual variations in the terrestrial biosphere's sequestration of anthropogenic CO2 emissions (Phillips and Brienen, 2017; Gatti et al., 2014; Saleska et al., 2003). Covering about one-third of South America with about 80 % as tropical rain forest, the tropical Amazon is being altered profoundly by human activity especially in recent decades (Andreae, 2019; Fu et al., 2013). Gatti et al. (2021) found that, from 2010–2018, most of the Amazon's carbon emissions came from the disturbed eastern Amazon, and most of those emissions are from fires. In the past 2 decades, 44 % of carbon loss from the Brazilian Amazon has been attributed to degradation and disturbance and 56 % to deforestation (Kruid et al., 2021). Recent work (Aragão et al., 2018) suggests that drought-related fires are increasing in importance relative to deforestation-related fires, but this statement was made under the assumption that protections of the Amazon against deforestation would remain in place. Following over a decade of decline, swaths of the Amazon have been illegally burned beginning with the 2019 dry season; there was a 3-fold increase in fire activity in 2019 compared to the previous year (Brando et al., 2020). Furthermore, the fire severity is potentially exacerbated by increased ecosystem fragmentation: aggregate impacts of human activity reduce the buffer that would have been present in a healthier and more intact ecosystem, making the Amazon more vulnerable to fire impacts (Fu et al., 2013; Aragão et al., 2018; Alden et al., 2016; Brando et al., 2020).
The associated carbon response to large-scale fire activity is complicated given that the Amazon is not evolutionarily adapted to fires: while fires have played a historical role in the region, they have almost all been started by humans, generally for agricultural purposes (Uhl et al., 1988; Brando et al., 2020). As such, it is uncertain how prior burn trauma impacts future ecosystem productivity (Trumbore et al., 2015). Yet the direct and indirect carbon effects of the fires ravaging the Amazon during the dry seasons, particularly along the southeastern frontier termed the “arc of deforestation” (Fig. 1), are playing an increasing role in the region's net biome exchange (NBE) (Gatti et al., 2021a). With the dry season length of southern Amazonia already increasing significantly by approximately 6.5 d per decade, conditions conducive to enhanced fire seasons are further prolonged (Fu et al., 2013). Therefore, we are at a critical time for both the Amazonian and global carbon balance when a warmer, drier Amazon is poised to face additional pressures from the combined effects of both drought- and deforestation-related fires (Brando et al., 2020; Naus et al., 2022). Furthermore, under Brazil's volatile political regime, any re-established protections face an uncertain future (Brando et al., 2020; Naus et al., 2022; Gatti et al., 2023).
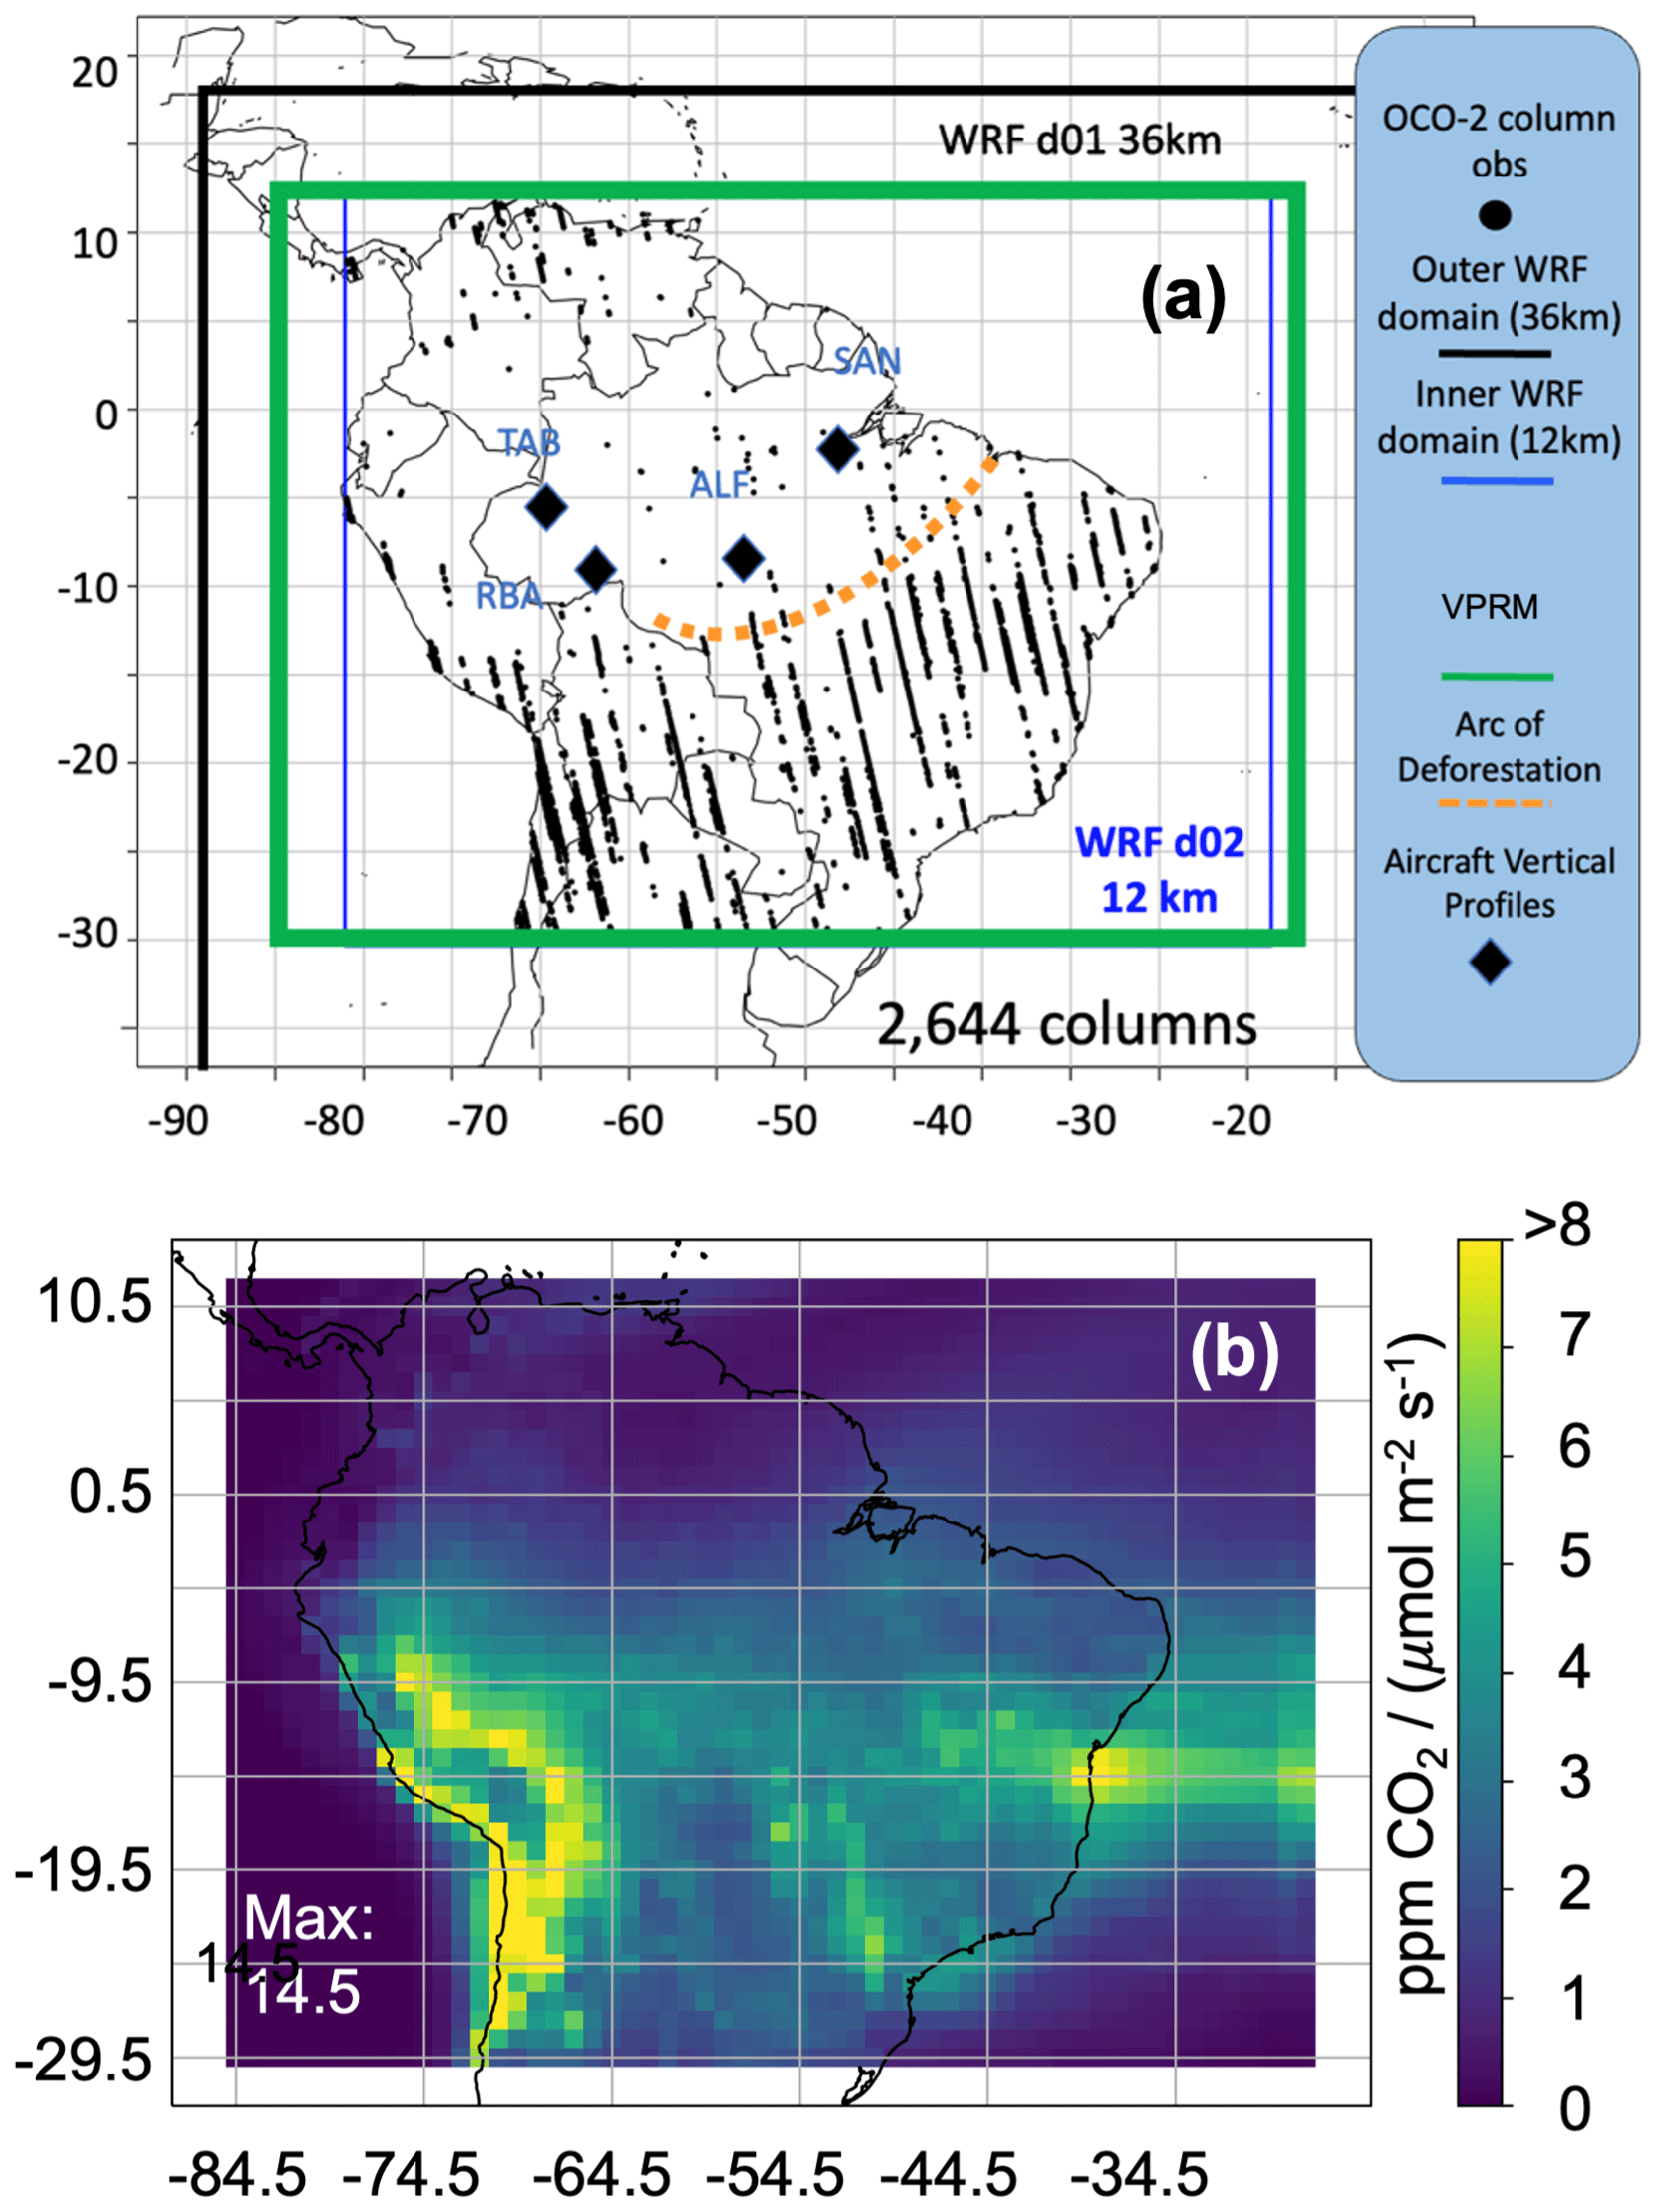
Figure 1Study spatial domain with OCO-2 and aircraft observation locations. (a) WRF domain. The black diamonds indicate the semimonthly aircraft vertical profiling areas available for evaluation over the study period. Bounding boxes represent the VPRM (green: 12 km native resolution) and WRF meteorology domain nests (black: d01, 36 km resolution; blue: d02, 12 km resolution). The dashed orange line approximates the arc of deforestation. OCO-2 column measurements (land nadir and land glint soundings, March 2016), thinned to 2 s along-track, are provided as black points. (b) Vertically integrated footprints for March 2016 optimization case study using 14 levels of WRF-STILT footprints within the WRF d02 domain.
Despite the carbon response of the Amazon being a key variable in climate modeling (e.g., Cox et al., 2000, 2013), regional surface flux estimates of CO2 as well as the atmospheric measurements to constrain them have been historically sparse due to physical, economic, and political limitations. As a result, capturing Amazon carbon surface fluxes and their sensitivities has been a challenge (Liu et al., 2017). However, the past 2 decades have seen an increase in multi-platform measurement efforts with the potential to greatly improve our ability to quantify carbon cycling in the Amazonian biosphere. Ground-based carbon flux measurements through AmeriFlux and the Amazon Tall Tower Observatory (ATTO) provide important surface-based ecosystem information at a high temporal resolution (e.g., Basso et al., 2023; Paca et al., 2022; Hayek et al., 2018). Aircraft observations have provided important constraints enabling in-depth assessments of land–atmosphere carbon exchange (e.g., Gatti et al., 2010, 2014, 2021; Gloor et al., 2012; van der Laan-Luijkx et al., 2015; Alden et al., 2016). Beginning in 2010, sustained semimonthly aircraft measurements have been conducted in the four corners of the Brazilian Amazon as an international effort among researchers, informing estimates of fire effects in the region (Gatti et al., 2021a). Finally, total column CO2 retrievals and solar-induced fluorescence (SIF) from NASA's Orbiting Carbon Observatory (OCO-2; operational September 2014) enable previously inferred features of the tropical biosphere's carbon response to climatological variability to be more accurately estimated at multiple spatiotemporal scales (Bloom et al., 2016).
With the Amazon becoming warmer and drier, the impacts of fires and other disturbances – both climate-related and directly through deforestation and other degradation – on carbon stock loss are compounded (Barkhordarian et al., 2019; Kruid et al., 2021). However, absent a consistent observationally constrained multi-decadal record extending into the present, when CO2 surface fluxes from both photosynthesis and respiration are captured, our capacity to evaluate long-term shifts in carbon dynamics of the South American tropics is limited. Existing global flux products with multi-decadal temporal records such as gross primary productivity (GPP) estimates from NASA's MODIS have been found to inadequately represent complex Amazonian ecosystems (Almeida et al., 2018). In recent years, the availability of global satellite-based SIF observations – a more direct correlate to photosynthetic activity, including in the Amazon – has greatly improved our ability to capture the timing and magnitude of ecosystem carbon exchange (e.g., Doughty et al., 2019; Koren et al., 2018; Zhang et al., 2018a; Luus et al., 2017). To this end, our study uses SIF along with a suite of readily available ground-to-satellite observations to estimate hourly biogenic CO2 fluxes () via an improved version of the Vegetation Photosynthesis and Respiration Model (VPRM) (Mahadevan et al., 2008). The VPRM is a minimally parameterized data-driven diagnostic ecosystem light-use efficiency model that has many advantages for exploring shifts in regional carbon dynamics and modes of carbon exchange, particularly in its translation of local ecosystem and satellite observations into spatially resolved fluxes of CO2 as net ecosystem exchange (NEE), GPP, and Reco at fine spatial (here, 12 km) and temporal (hourly) scales. The VPRM has demonstrated effectiveness as a prior model in diverse CO2 source attribution studies at midlatitudes and the Arctic (e.g., Dayalu et al., 2018; Luus et al., 2017; Hilton et al., 2013; Matross et al., 2006). Furthermore, the region-specific approach of the VPRM contrasts with subsets of existing global vegetation carbon flux models which, in data-sparse regions such as the Amazon, can be insufficiently resolved (Dayalu et al., 2018; Luus et al., 2017; Hilton et al., 2013; Matross et al., 2006). The VPRM is calibrated with direct ecosystem observations when available for each land use category in the domain of interest. Traditionally, satellite surface-reflectance-based proxies such as the enhanced vegetation index (EVI) and the land surface water index (LSWI) are incorporated into the VPRM; however, there are known issues with that approach, particularly pertaining to the LSWI inadequately capturing the effects of water stress (Dayalu et al., 2018; Luus et al., 2017).
The SIF-based formulation of the VPRM has improved performance relative to the traditional VPRM (VPRM_TRA) when compared against aircraft and tower observations in extratropical settings (Luus et al., 2017). However, the SIF-based VPRM holds promise for the tropics as well: SIF is implicitly and significantly correlated to previously hard-to-quantify parameters like water stress (e.g., Mohammadi et al., 2022). Particularly in the Amazon, where moisture can be a strong control on carbon cycling (Gatti et al., 2014), using SIF includes early-stage ecosystem response to moisture availability in the VPRM in a way that traditional vegetation indices do not (Zhang et al., 2018a). Similar to Luus et al. (2017), our work adapts the VPRM formulation where the traditional MODIS-based satellite surface reflectance data are entirely replaced with SIF data derived from OCO-2 measurements (VPRM_SIF). In addition, our work further adapts the respiration term of the VPRM similarly to Winbourne et al. (2022) and Gourdji et al. (2022), where the amount of living biomass per pixel informs the autotrophic respiration term. The adaptation of the VPRM respiration term addresses a tendency for the VPRM to systematically underestimate autotrophic respiration, at least in the extratropics (e.g., Dayalu et al., 2018; Gourdji et al., 2022). In the tropics, where respiration is a strong control on NBE, models that provide more accurate respiration parameterizations are needed. The biogenic carbon fluxes generated by SIF-based VPRM formulations provide the basis for this study's quantification and categorization of the spatial and temporal variations in the Amazon's carbon sink strength from 2010–2020.
In our study, we expand upon the latest research for the Amazon, leveraging observations where available, to construct, improve, and evaluate biosphere carbon fluxes. This is a critical first step to evaluating long-term anthropogenic impacts on and trends in the Amazon's carbon balance. We broadly define Amazonia's wet and dry seasons as 6-month periods, with the wet season typically extending from December through May and the dry season extending from June through November. We construct and evaluate multiple versions of the VPRM: the traditional version before and after modifying respiration (VPRM_TRA, VPRM_TRG) and the SIF-based version before and after modifying respiration (VPRM_SIF, VPRM_SIFg). The VPRM CO2 fluxes are generated for all hours from 2010 through September 2020. As an additional test, we compare all versions of the diagnostic VPRM to output from the process-based bottom-up Simple Biosphere 4 model (SiB4; Haynes et al., 2021), which to our knowledge is the only publicly available hourly partitioned biogenic carbon flux estimate for the Amazon that extends through at least 2018. The hourly VPRM fluxes also include two main events which, as suggested by Liu et al. (2017) and Brando et al. (2020), are increasingly representative of the Amazon's future conditions and impacts on the global carbon balance: the strong El Niño in 2015–2016 and the severe dry season fires in 2019/2020. In this paper, we additionally evaluate model performance during March 2016 by constraining with OCO-2 land nadir and land glint (LNLG) total columns and evaluating against CO2 observations from aircraft vertical profiles. The March 2016 case study was selected for three main reasons: (1) it falls well within the Amazon wet season such that the biosphere dominates land–atmosphere CO2 exchange such that model–measurement mismatch can largely be attributed to the biosphere flux model alone rather than entangling the influence of fires, (2) it falls at the tail end of the 2015/2016 severe El Niño and more strongly illustrates potential strengths and weaknesses in how the various models capture the impacts of temperature and water stress on Amazonian land–atmosphere carbon exchange; and (3) there was distinct and separable fire activity which provides an opportunity to evaluate the capacity of the biogenic flux models to separate NEE from fire fluxes. Figure 1 displays our study domain along with key modeled and observational datasets used in top-down constraints and evaluations.
2.1 Data processing tools
We used R v4.2.1 (https://cran.r-project.org/, last access: 14 March 2025) for all data processing and analysis. We used the Weather Research and Forecasting Model (WRF) version 3.8.1 to model the meteorology driving the Stochastic Time-Inverted Lagrangian Transport (STILT; WRF-STILT) model. The WRF v3.8.1 configuration is detailed in Table S1 in the Supplement.
2.2 VPRM: estimating vegetation CO2 fluxes
VPRM CO2 fluxes from vegetation are modeled as NEE, GPP, and Reco and reported as micromoles CO2 per square meter per second (; hourly, 12 km resolution) with the convention of negative fluxes indicating uptake from the atmosphere and positive fluxes indicating release to the atmosphere.
2.2.1 Model overview
The traditional and SIF-based VPRM formulations – without (VPRM_TRA, VPRM_SIF) and with (VPRM_TRG, VPRM_SIFg) respiration term modifications – provide hourly fluxes of biogenic CO2 NEE partitioned into GPP and Reco. Equations (1a, b) and (2a, b) describe all VPRM formulations.
The parameters λ (ecosystem light use efficiency, units: per micromole photosynthetically active radiation (PAR)), PAR0 (ecosystem half-saturation value of PAR, units: ), α (ecosystem respiration temperature dependence, units: ), β (flux-weighted mean size of the respiring carbon pools, ), and γ (sensitivity to water stress and aboveground biomass, ) are all optimized from nonlinear least squares (NLS) fits to ground-based measurements (e.g., Mahadevan et al., 2008; Gourdji et al., 2022). Domain-wide hourly fluxes are then derived for each land use category present. Our domain land categories are based on the International Geosphere–Biosphere Programme (IGBP) and obtained from the MODIS MCD12Q1 0.05° gridded product. Calibration and land classification details are provided in Sect. 2.2.2.
In all formulations, hourly photosynthetically active radiation (PAR, units: ; Eq. 3) drives the diurnal flux signal, and Tscale (unitless; see Eq. 4) provides ecosystem temperature sensitivity. When scaling fluxes to the entire domain, ERA5 meteorology (https://registry.opendata.aws/ecmwf-era5/; last access: 9 August 2023) at 31 km horizontal resolution provides the hourly downwelling shortwave radiation (SW) used to derive diurnal PAR; 2 m surface air temperature estimates (Tair) are used to calculate Tscale.
As shown in Eq. (4), Tscale modifies the GPP term by weighting the differences between observed Tair and the ecosystem-specific requirements for minimum (Tmin), maximum (Tmax), and optimal (Topt) temperatures for photosynthesis. Tmin, Tmax, and Topt values are informed by literature values relevant to the tropics (Ma et al., 2017; Slot and Winter, 2017; Tan et al., 2017). For all tropical ecosystems, Tmin is set to 4 °C. Following work by Slot and Winter (2017) we broadly divide our ecosystem classes into tropical dry and tropical wet ecosystems. Tropical dry ecosystems (pixels in domain with IGBP categories of woody savannas, savannas, and grasslands) are assigned a Tmax of 41.8 °C (SD=2.1 °C) and Topt of 30.7 °C (SD=1.1 °C). Tropical wet ecosystems (pixels in domain with IGBP category of evergreen broadleaf) are assigned a Tmax of 40.1 °C (SD=1.8 °C) and Topt of 29.8 °C (SD=0.9 °C).
In the traditional formulations (Eq. 1a and b) the unitless scalars Pscale (phenology; Eq. 5), Wscale (water stress; Eq. 6), and EVI (surface “greenness”; Eq. 7) modify GPP based on remotely sensed measurements of surface reflectance in the near-infrared (ρnir), shortwave infrared (ρswir), blue (ρblue), and red (ρred) bands.
The tropical SIF-based VPRM formulations (Eq. 2a and b) entirely replace the Pscale×EVI quantity with instantaneous spatially contiguous SIF derived from OCO-2 measurements (4 d, 0.05° resolution as in Zhang et al., 2018a). However, as shown in Eq. (7a), raw SIF has a PAR dependence (Zhang et al., 2018b, 2020) which Luus et al. (2017) previously corrected for by normalizing with the cosine of the solar zenith angle (SZA) at the local OCO-2 overpass time of 13:30 h (Eq. 7b).
In Eq. (8a), fAPAR is the fraction of PAR absorbed by chlorophyll and EF is the fluorescence efficiency. Daily SZA data for each calibration site were obtained from the NASA Horizons portal (https://ssd.jpl.nasa.gov/horizons/app.html; last accessed: 15 February 2021). When scaling to our domain, we use the solarPos package in R to calculate the average SZA at each pixel at 13:30 local overpass time averaged over each 4 d interval of the contiguous SIF product. We note an additional caveat here: specifically, SIF normalized by cos (SZA) still potentially risks overcounting PAR in the GPP equation. Previous work (e.g., Luus et al., 2017) and this study use as a standalone index in a similar role to the fAPAR-approximating EVI; future development of the model should focus on testing the assumption that sufficiently removes the explicit PAR dependence of SIF.
Finally, two of our VPRM formulations (Eqs. 1b and 2b) also incorporate a γ () term adapting recent modifications that better represent Reco responses associated with biomass seasonality and/or water stress (Winbourne et al., 2022; Gourdji et al., 2022). In the tropics, Clark et al. (2013) note that temperature sensitivity of nighttime plant respiration can have a significant control on aboveground biomass production. As shown in Eq. (7), Gourdji et al. (2022) apply a quadratic temperature formulation to the traditional VPRM for Reco which allows for a nonlinear temperature response; furthermore, EVI and Wscale are explicitly incorporated to account for aboveground biomass seasonality and water stress.
However, given both the spatial and temporal limitations of our Amazon region calibration sites (see Sect. 2.1.2), applying the Gourdji et al. (2022) respiration parameterization risks overfitting Amazonian respiration to a small number of specific sites. Furthermore, Winbourne et al. (2022) found that the VPRM respiration term approached the traditional linear result during the growing season in a US urban environment. In tropical environments, where growing season conditions last year-round, we therefore represent Reco with the bolded terms in Eq. (8) – i.e., as a linear function of air temperature with an additional γ term that uses EVI or to incorporate the influence of aboveground biomass seasonality and water stress.
2.2.2 Domain land use classification, model calibration, and model evaluation
Prior to generating vegetation carbon fluxes for the entire study domain, the VPRM is calibrated using NLS to ground-based flux data collected for each major vegetation class. In our Amazonian study domain, ground-based data availability is an ongoing challenge; our calibration data were therefore restricted to publicly available data from the AmeriFlux and FLUXNET eddy flux networks. Data from the eight available Amazon-relevant eddy flux sites span limited IGBP vegetation classes and subsets of time from 2001–2015 (Table 1 and Fig. 2). With the exception of the tropical rainforest site Br-K67 (discussed later in this section), the eddy flux data are insufficient for separately fitting wet and dry seasons. Therefore, we perform single NLS fits to calibration data, which results in constant VPRM parameters for each ecosystem type over the study period. While the calibration dataset is not dense enough to span both the spatial and temporal extents of our study, we note that it does provide valuable and sufficient information to establish reasonable a priori vegetation CO2 flux estimates that can be meaningfully constrained with OCO-2 CO2 observations for two main reasons. First, approximately 95 % of the land use in the study domain from 2010–2020 is encompassed by the four IGBP categories for which eddy flux data were available, namely evergreen broadleaf (50 %), savannas (20 %), grasslands (20 %), and woody savannas (5 %) (Fig. 2b). Three of the eight sites represent the evergreen broadleaf category, which is the most prevalent broad class in the domain. While we recognize the IGBP “evergreen broadleaf” categorization is an oversimplification of heterogeneous Amazonian evergreen ecosystems, we note the value in tuning the VPRM to three separate evergreen broadleaf sites. Second, while the available eddy flux data can be offset by up to 13 years prior to the study period of 2010–2020, the hourly ecosystem flux variations are largely captured by Tair, PAR, surface reflectance indices, and SIF; i.e., while the static ecosystem parameters of λ, PAR0, α, β, and γ would benefit from tuning to eddy flux data seasonally and/or over the entire study period to reflect concurrent ecosystem states most accurately, the real time variation is dominated by Tair, PAR, surface reflectance indices, and SIF (Dayalu et al., 2018).
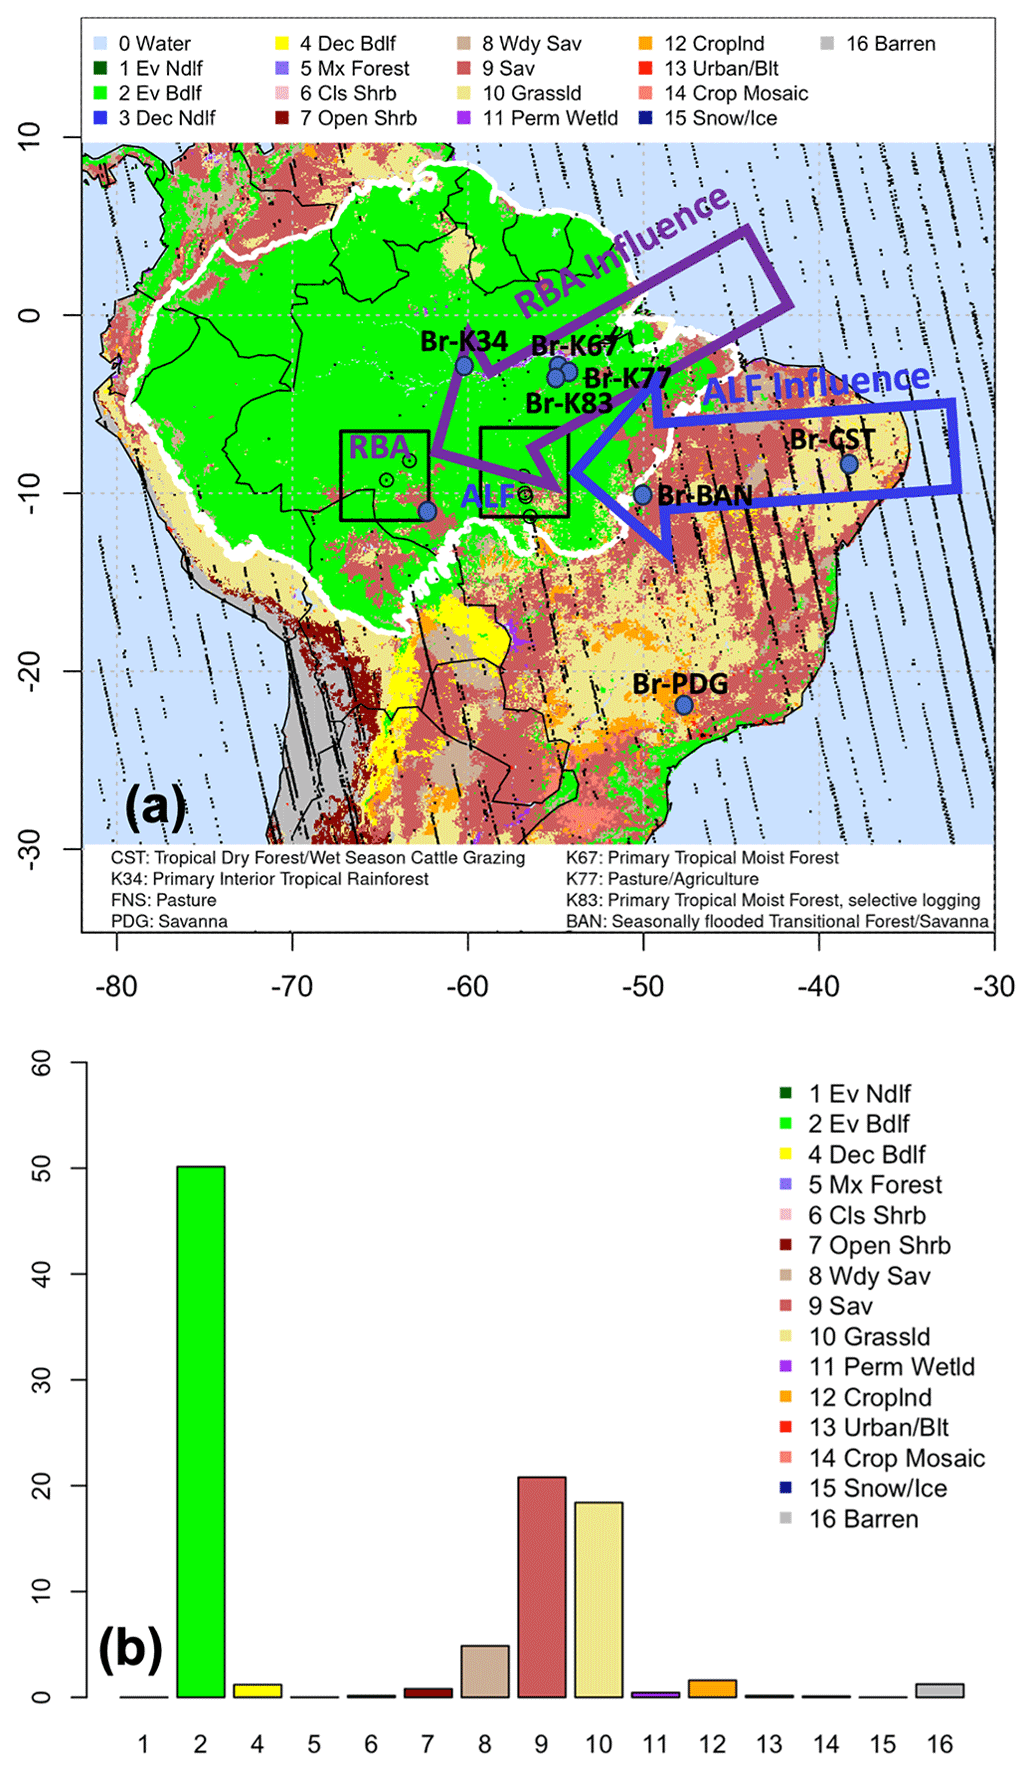
Figure 2IGBP land use categories by domain and influences on measurements. (a) IGBP categories mapped to study domain, with eddy flux calibration and validation sites and OCO-2 receptors overlaid. Vertical profiling sites RBA and ALF, their representative OCO-2 receptors, and their upwind influences are highlighted. (b) Land use percentages by domain.
As shown in Table 1, each broad ecosystem type is assigned a representative calibration and evaluation site. The exception is site Br-K34, which is the only representative of primary interior tropical rainforest, and there were insufficient data to divide the data into calibration and evaluation years. As the remaining tropical rainforest sites (Br-K67, Br-K83) are impacted by higher degrees of disturbance and edge effects, a comparison with Br-K34 was not appropriate. We therefore manually differentiate two categories of evergreen broadleaf/IGBP category 2: (1) western Amazon IGBP category 2 is designated as primary interior tropical rainforest and its pixels are represented by NLS parameters obtained from site Br-K34; (2) remaining IGBP category 2 primary tropical moist forest occurring in the domain is represented by NLS parameters obtained from site Br-K67 (Fig. S1 in the Supplement).
Table 1Eddy flux sites used for VPRM calibration and/or evaluation. Sites used in the evaluation have their associated calibration site listed in parentheses in the “VPRM role” column.
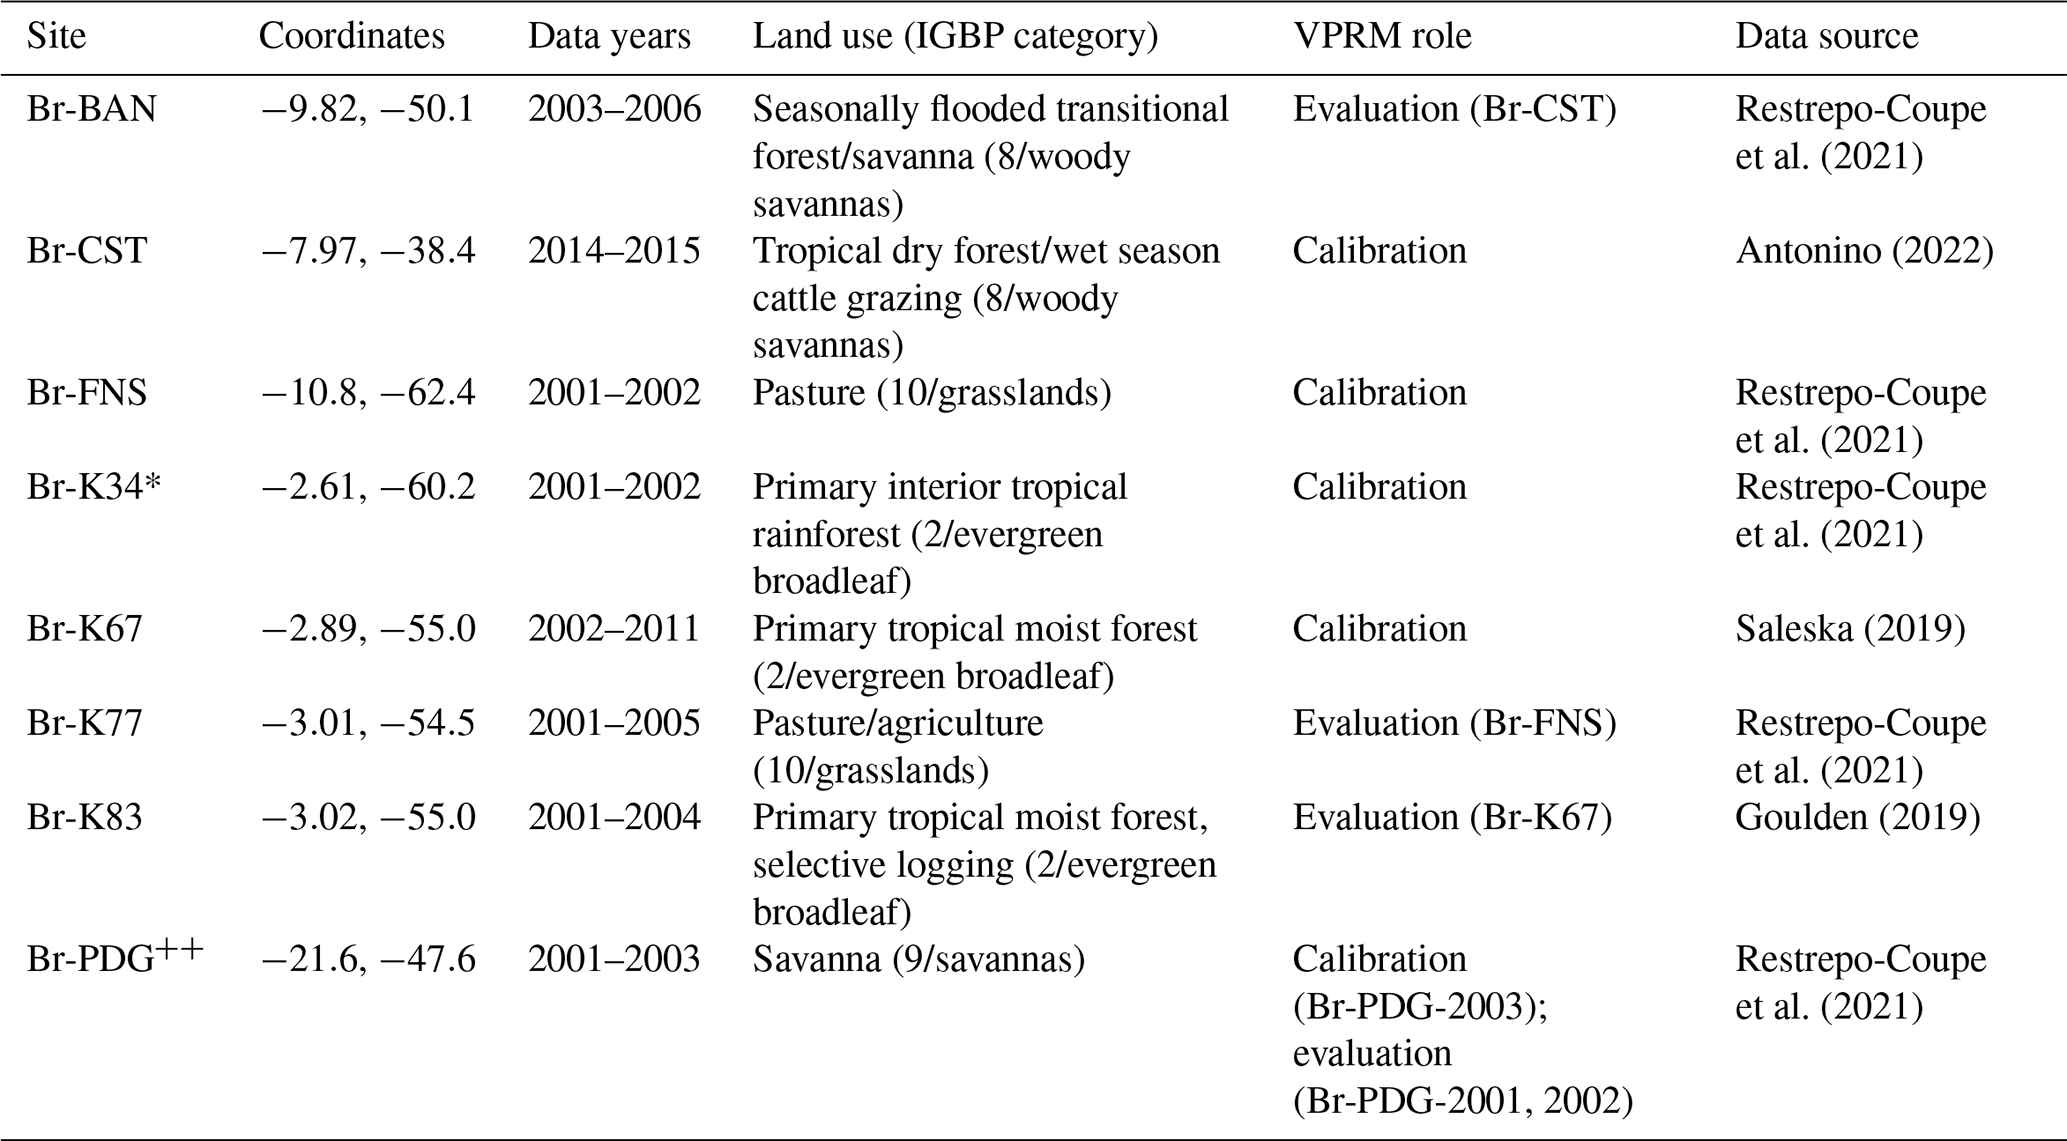
* Br-K34 site represents the interior, relatively undisturbed evergreen broadleaf classes; K34 data are unvalidated due to insufficient representative data. Br-PDG was the only member of IGBP class 9, and separate years were used for calibration (2003) and evaluation (2001–2002).
As noted earlier, the long record of Br-K67 – spanning 2002–2011 – enables assessing uncertainty associated with using annually fit VPRM parameters rather than seasonally fit ones. We therefore used the Br-K67 record to evaluate the impact of parameter seasonality on model performance. Accounting for data gaps, a total of 7 years of hourly Br-K67 observations were randomly separated into wet and dry season subsets for VPRM calibration (70 % from each of wet and dry season data) and evaluation (30 % from each of wet and dry season data). We then performed seasonal NLS fits for each VPRM version. We used the seasonal and annual fits in an assessment of model bias for the tropical rainforest/evergreen broadleaf class relative to observations.
2.3 SiB4
The SiB4 model version 4.2 (SiB4) integrates land cover, phenology, dynamic carbon allocation, cascading carbon pools from live biomass to surface litter to soil organic matter, and NASA MERRA2 meteorology (Haynes et al., 2021). Unlike the VPRM it is a mechanistic model that is independent of satellite indices and site-specific tuning parameters (Haynes et al., 2019). We obtained SiB4 global hourly carbon fluxes partitioned into GPP and Reco at 0.5°×0.5° resolution from 2000–2018 from the Oak Ridge National Laboratory Distributed Active Archive Center (ORNL DAAC; Haynes et al., 2021). SiB4 fluxes for each grid cell are disaggregated into 1 of 15 plant functional types (PFTs). We convert SiB4 fluxes per PFT to total fluxes per grid cell using the provided area per grid cell. We then subset these grid cell total SiB4 fluxes over the VPRM domain (Fig. 1) and regrid them to the VPRM resolution using bilinear interpolation. Additional details and technical description of SiB4 model v4.2 are provided in Haynes et al. (2020).
2.4 Regional inversion methodology
In this study we apply the CarbonTracker–Lagrange regional inverse modeling framework (Hu et al., 2019; Rastogi et al., 2021a, b). It uses a Bayesian inversion methodology with a geophysically based simulation of satellite retrievals of column CO2 profiles (Sect. 2.4.1) and sensitivities of the satellite observations to upstream surface fluxes (i.e., “footprints”) derived from WRF-STILT (Sect. 2.4.2). The March 2016 period was extracted from a 3-month inversion, spanning February 2016 through April 2016, to account for edge effects. On average, wet season OCO-2 data coverage was ∼15 % less than dry season coverage.
We use OCO-2 total column CO2 (XCO2) retrievals to constrain VPRM CO2 flux estimates in a geostatistical Bayesian framework. In this study, 2644 retrievals (n) are used over the February to April 2016 time frame and 1266 land grid cells are optimized over the domain, hourly, for 2160 h (m=2 734 560). We write the posterior flux solution as
where is the n×1 vector of retrieved XCO2. (Eq. 10) is the n×1 vector of simulated XCO2. H (Eq. 11) is the column-weighted sensitivity of to surface fluxes upwind of the measurement, otherwise known as the column-weighted footprint n×m or Jacobian, and s is the posterior flux estimate 1×m. R is the model–data mismatch covariance matrix n×n, which ideally includes uncertainty due to geostatistical measurements, the forward model, model representation, and boundary conditions. Given the difficulty in estimating these uncertainties, in our application, R is estimated from the uncertainty in XCO2 using the methodology of Peiro et al. (2022) with some modifications, discussed next. Q is the prior flux error covariance matrix m×m, and in our application it is calculated using the standard deviation of the temporally averaged prior fluxes, a temporal correlation length of 7 d, and a spatial correlation length of 1000 km. sa is the prior flux estimate 1×m from the VPRM or SiB4 flux models.
Our methodology follows this methodology for comparing satellite retrievals to simulated CO2 columns from the Atmospheric CO2 Observations from Space (ACOS) retrieval algorithm v10 (O'Dell et al., 2012). We follow the convolution method as detailed in Rastogi et al. (2021a) to calculate the simulated XCO2:
where N is the number of vertical levels. wi is the pressure weighting function calculated as in Rastogi et al. (2021a). αi is the retrieval averaging kernel profile. is the CO2 background profile from NOAA's CarbonTracker version CT2019B (Jacobson et al., 2020). sbio is the biospheric flux estimate from VPRM or SiB4 models. is the OCO-2 prior CO2 profile. Hi is the sensitivity function or footprint on discrete levels from WRF-STILT (Sect. 2.5.2):
In this application, N is 17 levels. This accounts for 14 levels of WRF-STILT footprints, discussed in Sect. 2.5.2, and 3 levels in the upper-atmospheric column where the impact of surface fluxes are assumed to be negligible and the footprints are set to zero. Thus in the upper atmosphere, the calculation is dominated by the CarbonTracker background profile and OCO-2 prior CO2 profile.
For this study, we assimilate OCO-2 land nadir and land glint XCO2 retrievals that are averaged to 2 s along-track (∼13.5 km) – rather than 10 s averages – to better match the higher spatial resolution of our inversion domain (12 km) compared to global model resolutions. We average the OCO-2 XCO2 2 s data following the methodology from Peiro et al. (2022), where a 10 s average dataset was used. However, for the application of 2 s data over land we estimate the uncertainty in 2 s XCO2 (R) using a higher land correlation coefficient of 0.7, compared to 0.3 in Piero et al. (2022). In our application we also neglect transport model errors, which are difficult to quantify but can be further explored in the future using transport ensembles. Errors in WRF-STILT transport are discussed in Rastogi et al. (2021a) in terms of calculating for OCO-2 XCO2 retrievals in North America. They found that low partial column bias relative to independent vertical profile CO2 data shows that errors in WRF-STILT transport contribute very minimally to bias in .
2.4.1 Transport model framework
We use WRF v3.8.1 model transport fields to drive the STILT model dispersion and compute footprints. A footprint (Hi), in units of mixing ratio per unit flux (e.g., ), quantitatively describes how the surface fluxes upwind of a mixing ratio measurement location are influencing the measurement. For each OCO-2 XCO2 retrieval location, footprints are computed at 14 individual levels throughout the column. These 14 footprints are then convolved with OCO-2's pressure weighting function and averaging kernel and interpolated to STILT levels. This produces one column-weighted footprint (H) per retrieval, which quantifies how the OCO-2 XCO2 retrieval is influenced by surface fluxes upwind of the column. The column-weighted footprint is not to be confused with a satellite footprint, which describes the area of earth reflecting the satellite signal. The computational domains of the two nested WRF grids are shown in Fig. 1a. Model configuration details are provided in Table S1.
STILT computes footprints by modeling the dispersion of 500 particles, 10 d back in time from each measurement location (in this case the coordinate of an XCO2 retrieval), and in 14 levels from 50 m to 14 km a.g.l. where each receptor is located at a column measurement latitude and longitude and on one of 14 levels (50 m to 14 km a.g.l.). Back trajectories computed by STILT are affected by both resolved wind velocities and parameterized subgrid-scale turbulent motions and convective fluxes. The footprint domain is outlined in Fig. 1b, where footprints are aggregated to 1° resolution at 1 h intervals, compatible with the VPRM prior flux resolution used in the inversion.
2.5 Model aircraft vertical profile simulation
We calculate prior and posterior modeled vertical profiles for SiB4 and each VPRM formulation for our March 2016 optimization period at locations roughly corresponding to the vertical profiling sites RBA and ALF displayed in Fig. 1a. As the available OCO-2 receptors are not identical in space and time to locations of RBA and ALF profiling sites, a direct comparison of prior and posterior simulated CO2 vertical profiles derived from convolving multi-level OCO-2 receptor footprints and vegetation flux models is not possible. In addition, RBA and ALF vertical profiles are typically obtained once or twice a month such that robust measured monthly averages for a single month are not available. To allow for direct comparison between modeled (prior and posterior) and measured vertical profiles for all 744 h of March 2016, we construct pooled datasets that occasionally combine February and March 2016 measurements and/or modeled fields to develop a dataset that adequately represents a typical 2016 wet season month. Given the seasonal similarities across the Amazon in February and March, combining data across these months to create a representative “typical wet season month” is reasonable. Our method is detailed below.
We first construct a pooled dataset of “typical wet season 2016” measured vertical profiles at each of the RBA and ALF sites. For RBA, we combine all measurements obtained between February and March 2016 (2016-02-08 – date format: year-month-day – at 16:30 UTC, 2016-02-27 at 16:45 UTC, and 2016-03-17 at 17:00 UTC), resulting in three measurements at each of 17 vertical levels between 300 and 4500 m a.s.l. For ALF, we combine all measurements obtained between February and March 2016 (2016-02-23 at 16:30 UTC, 2016-02-29 at 15:40 UTC, 2016-03-13 at 16:00 UTC, and 2016-03-30 at 15:40 UTC), resulting in four measurements at each of 12 vertical levels between 450 and 4500 m a.s.l. For each site, we conduct a Monte Carlo simulation of measurements at each vertical level to obtain measured concentration matrices of 744 h×17 levels (RBA) or 744 h×12 levels (ALF). Second, we assess the availability of OCO-2 footprints in the vicinity of RBA and ALF sites from February to March 2016. Our goal was to obtain footprints sufficiently close to each profiling site to be representative of the near-field influences on the site but also have a large enough bounding box so that at least two OCO-2 receptors and their footprints were present for transport uncertainty calculations. Figure 2a displays the final selected 5×5 km bounding boxes around each of the RBA and ALF sites and the representative OCO-2 receptors. RBA and ALF simulated vertical profiles are then derived from the OCO-2 receptor footprints bounded in each box (Fig. 2a). Third, we use NOAA's web-based HYSPLIT model to assess land surface influences on each of the measured vertical profile dates and compare them with the land surface influences on each of the selected OCO-2 receptors. Figures S2 and S3 in the Supplement show that the land surfaces influencing both the simulated and actual profiles at RBA and ALF are comparable with the air mass trajectories representing typical seasonal prevailing winds in the February–March 2016 time frame and annually from 2010–2018; the average air mass trajectories are displayed in Fig. 2a. Fourth, we obtain CT2019 background concentrations associated with the vertical level of each air mass back trajectory before it enters the study domain. We capture background uncertainty by pooling all CT2019 concentrations at each vertical level and by conducting a Monte Carlo simulation resulting in a CT2019 matrix of 744 h×14 WRF-STILT vertical levels. Next, we use the March 2016 prior and posterior hourly fluxes to estimate a “typical wet season 2016 month of fluxes” and convolve them with WRF-STILT footprints from each of the six OCO-2 receptors in the RBA and ALF bounding boxes to obtain a spread of enhancements or depletions relative to the incoming CT2019 background CO2 from 10 d prior. This results in a simulated CO2 concentration at each of 14 WRF-STILT vertical levels over the 744 h in March 2016 (Eq. 12). Finally, we linearly interpolate all components from WRF-STILT vertical grids to each of the RBA and ALF measured vertical profiles, which enables us to calculate hourly model–observation residuals at each vertical level and extract means and 25th and 75th percentiles. Ultimately, vertical profiles of modeled and measured residuals for the simulated month typical of the 2016 wet season incorporate uncertainties in transport, background, vertical profile measurements, and flux fields. Figure S6 in the Supplement displays the overall methodology in a flow chart.
3.1 VPRM calibration and evaluation
Site-specific values of tuning parameters are provided in Table S2 in the Supplement. NLS calibration results are summarized in Table 2. Table 2 provides the root mean square error (RMSE) of predicted vs. measured NEE from the NLS fits at each calibration site, along with the interquartile range (IQR) of measured NEE, which allows for normalizing RMSE across the varied ecosystems present in the domain. Generally, relative to the traditional VPRM formulations, the VPRM_SIF formulations provide improved fits (calibration) and predictions (evaluation) to hourly NEE observations. Of the VPRM formulations with SIF, the SIFg formulation is a slight net improvement over the standard SIF formulation. An interesting feature of the respiration parameterization – relative to the typical non-tropical VPRM formulations – is the estimate of negative values for α in the respiration temperature dependency for the tropical dry forest Br-CST and interior primary rainforest Br-K34 sites. This is likely a response to the strength of temperature as a driver of NEE and respiration: strong decreases in respiration in certain tropical ecosystems have previously been observed (Clark et al., 2013; Gallup et al., 2021).
We note that Br-K83 – the Br-K67 evaluation site – is a selectively logged disturbed forest site (Figueira et al., 2008). We also note that site Br-K77 is a highly disturbed pasture and cropland site with a history of forest conversion to cropland in the 1990s followed by burning for rice cultivation in 2001. Br-K77 is therefore limited in its representation of steady-state cropland and grassland mosaic ecosystems: its poor performance as an evaluation site for the FNS cropland/grassland mosaic reflects its disturbed ecological history in the limited years for which we have eddy flux data. Specifically, as we have K77 eddy flux data only for 2001–2005, we are comparing an unstable ecology with FNS which began its trajectory to cropland as far back as 1977 (Almeida et al., 2018).
Given the greater importance of respiration on the NEE (and NBE) signal in the tropics relative to the extratropics, we also examine differences in respiration parameterization across all VPRM formulations. We use nighttime NEE as a proxy for respiration (i.e., absent confounding effects of daytime uptake) focusing on the hours from 20:00 LST to 03:00 LST. Overall, we find that annually and by season, the SIF-based VPRM formulations – and VPRM_SIFg in particular – have less skewed distributions and lower overall bias than the traditional formulations (Fig. 3 and Table S3 in the Supplement). On average, the dry season respiration bias is lower across all model versions than in the wet season. In the wet season, while all models tend to underestimate respiration, VPRM_TRA and VPRM_TRG display the greatest bias, with VPRM_TRG displaying the greatest skew. In both seasons, the VPRM_SIFg formulation exhibits the lowest respiration bias with a residual distribution closest to normal. The underestimate in wet season nighttime respiration also implies that the general underestimate of peak daytime wet season drawdown in NEE occurs through underestimating GPP rather than through overestimating Reco. Of the VPRM formulations, the SIF-based formulations have more instances of overestimating respiration, especially in savanna ecosystems (Table S3).
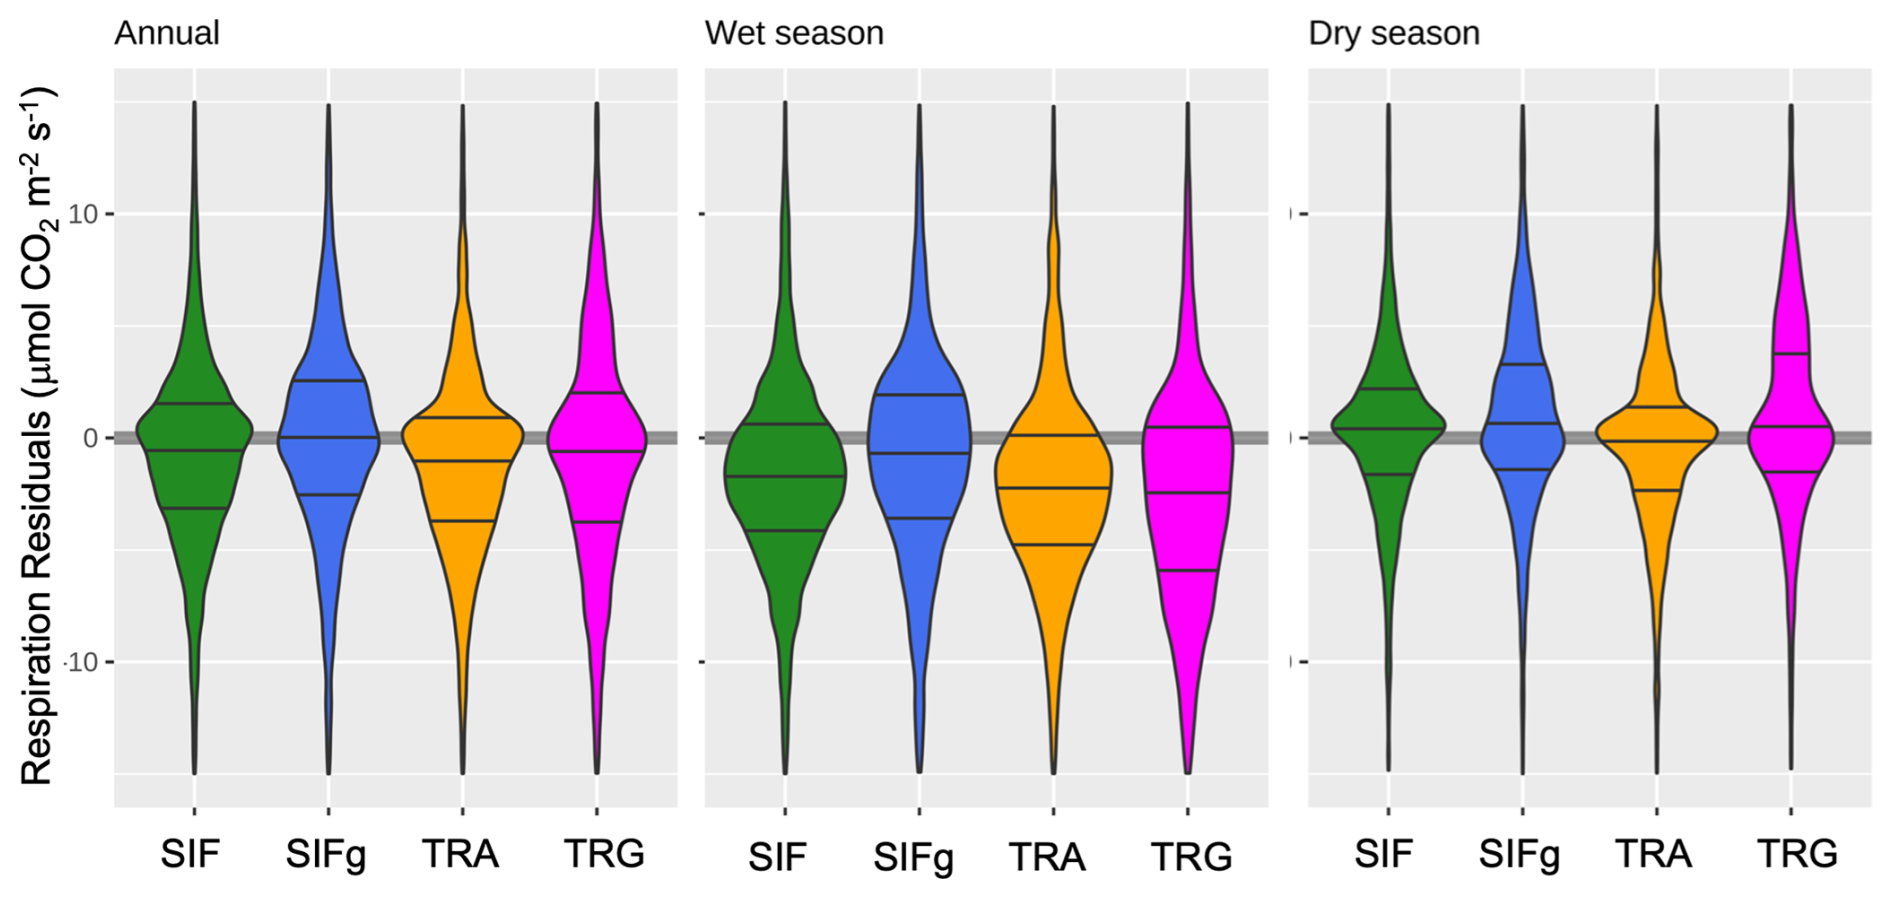
Figure 3Violin plots of VPRM model–observation (nighttime) respiration residuals annually and by season at eddy flux sites (). Nighttime NEE (where GPP=0) is used to approximate respiration. Lines are 25th, 50th, and 75th quantiles. All models tend to underestimate wet season respiration and overestimate dry season respiration. Data skew suggests that VPRM_SIFg respiration residuals are the closest to a normal distribution.
Table 2Root mean square errors and correlation coefficients (R2) from NLS fits to calibration sites and associated evaluation site predictions. For evaluation sites, the site used for calibration is provided in the “Cal site” column. Calibration (model fitting) results with R2>0.5 are in regular italics. Evaluation (model predictions) results with R2 values≥0.5 are in bold italics. The VPRM model version is shown as one of TRA, TRG, SIF, or SIFg.
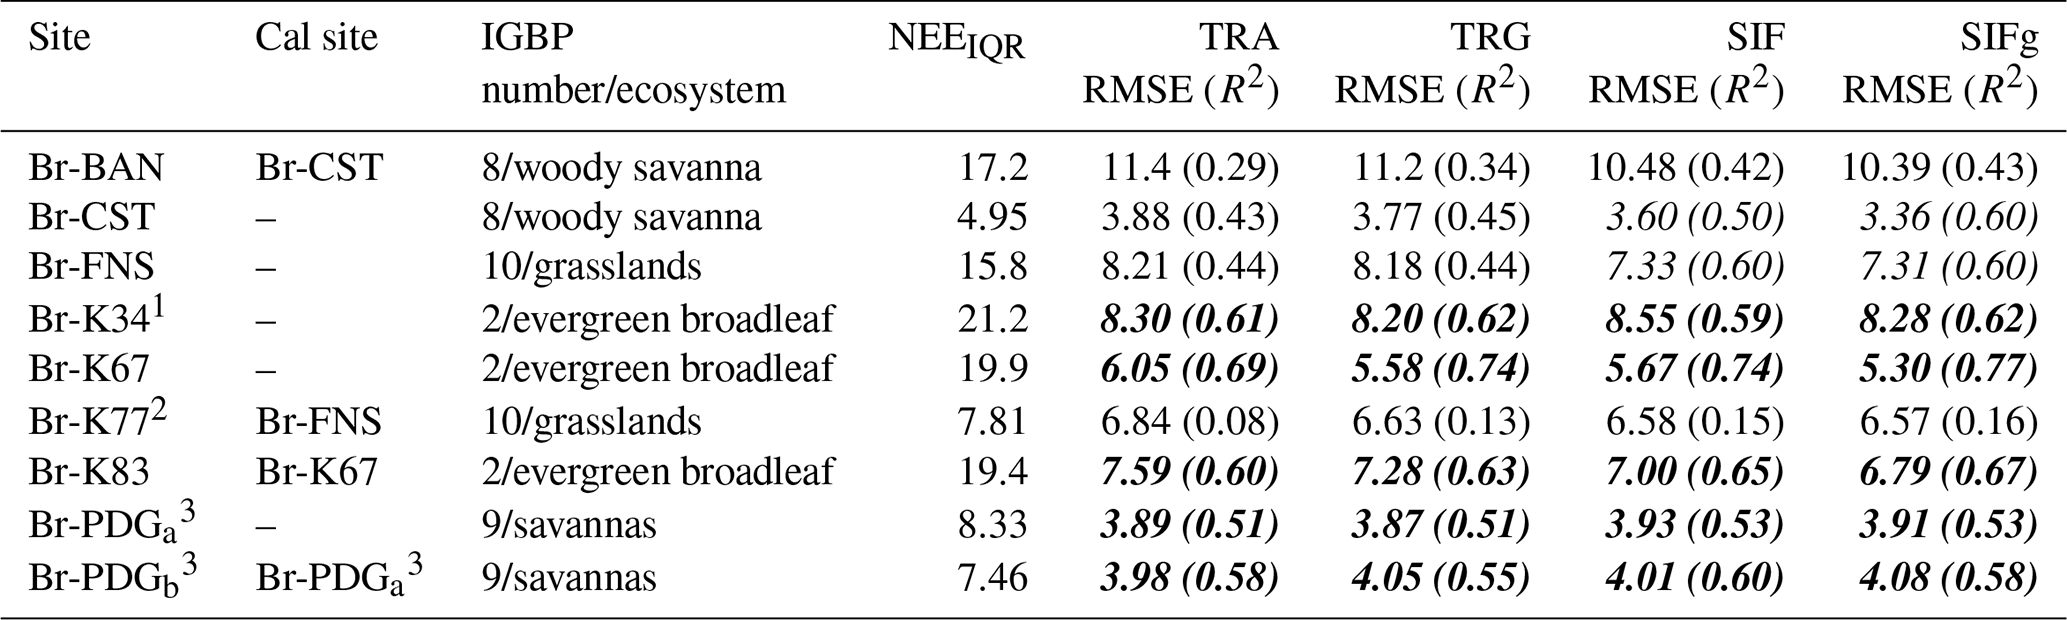
1 K34 data are unvalidated due to insufficient representative data.
2 K77 ecological history suggests limitations in its representation of steady-state grasslands.
3 PDG was the only member of IGBP class 9, and separate years were used for calibration (2003, PDGa) and evaluation (2001–2002, PDGb). The IQR of measured NEE at each site is also provided to normalize RMSE and facilitate comparison across the varied ecosystem types.
Diurnally, the SIF-based formulations consistently perform better than the traditional formulations when compared to observations annually and seasonally (Figs. S4 and S5 in the Supplement). Notably, for evergreen broadleaf classes – the dominant domain vegetation type – peak uptake tends to be underestimated in both seasons but especially in the wet season. Full details of seasonality are provided in Sect. S1 in the Supplement, focusing on the Br-K67 site which had the longest record (Wu et al., 2017, Table S4, Figs. S7 and S8 in the Supplement). The results from the seasonality case study suggest that the SIF-based formulations in general – and the VPRM_SIFg formulation in particular – are better equipped at estimating biogenic carbon fluxes at both short and longer timescales. We explore these results further via the wet season 2016 optimization case study in Sect. 3.2.
Of note, while there can be conflicting evidence on light limitations and seasonal carbon uptake in the Amazon, several studies provide evidence for enhanced dry season carbon uptake when cloud cover is reduced and sunlight is more readily available (Huete et al., 2006; Saleska et al., 2016; Doughty et al., 2019). But while the GPP constituent of NEE can be higher in the dry season, wet season aircraft observations tend to show higher net uptake (Gatti et al., 2010, 2014, 2021).
3.2 Wet season 2016 case study: biogenic model evaluation and estimates of fire influence
We evaluate the VPRM performance during March 2016, corresponding to the middle of the wet season immediately following the peak of the 2015/2016 severe El Niño, and compare it with SiB4's performance. We select the March 2016 wet season as it is a valuable natural experiment that demonstrates the relative importance of biogenic fluxes and fire fluxes. The severe El Niño corresponded to one of the hottest periods recorded over Amazonia in the past century; as shown in Fig. 4a, the 2016 wet season was characterized by a dipole of extreme drought in the eastern Amazon and unusual wetting in the western Amazon (Silva Junior et al., 2019). The anomalously hot and dry conditions in portions of the Amazon were more conducive to drought-related fire activity; however, Silva Junior et al. (2019) found the peak in Amazon area affected by fires during the first quarter of 2016 was approximately 2 %, with fire anomalies concentrated in the northern state of Roraima. Integrated over February and March 2016, Aqua satellite fire detections were concentrated at the northern and southeastern boundaries of the Amazon basin (TerraBrasilis, 2024). The emissions strength of these fires (as fire radiative power) was not readily available and could not be used to weight their relative importance. Dominance of fire emissions relative to biosphere fluxes varied by location; we use this feature in combination with drought index information and measured aircraft vertical profiles to evaluate biogenic flux models and estimate the relative contribution of the biogenic activity and fires to sub-regional CO2 signal.
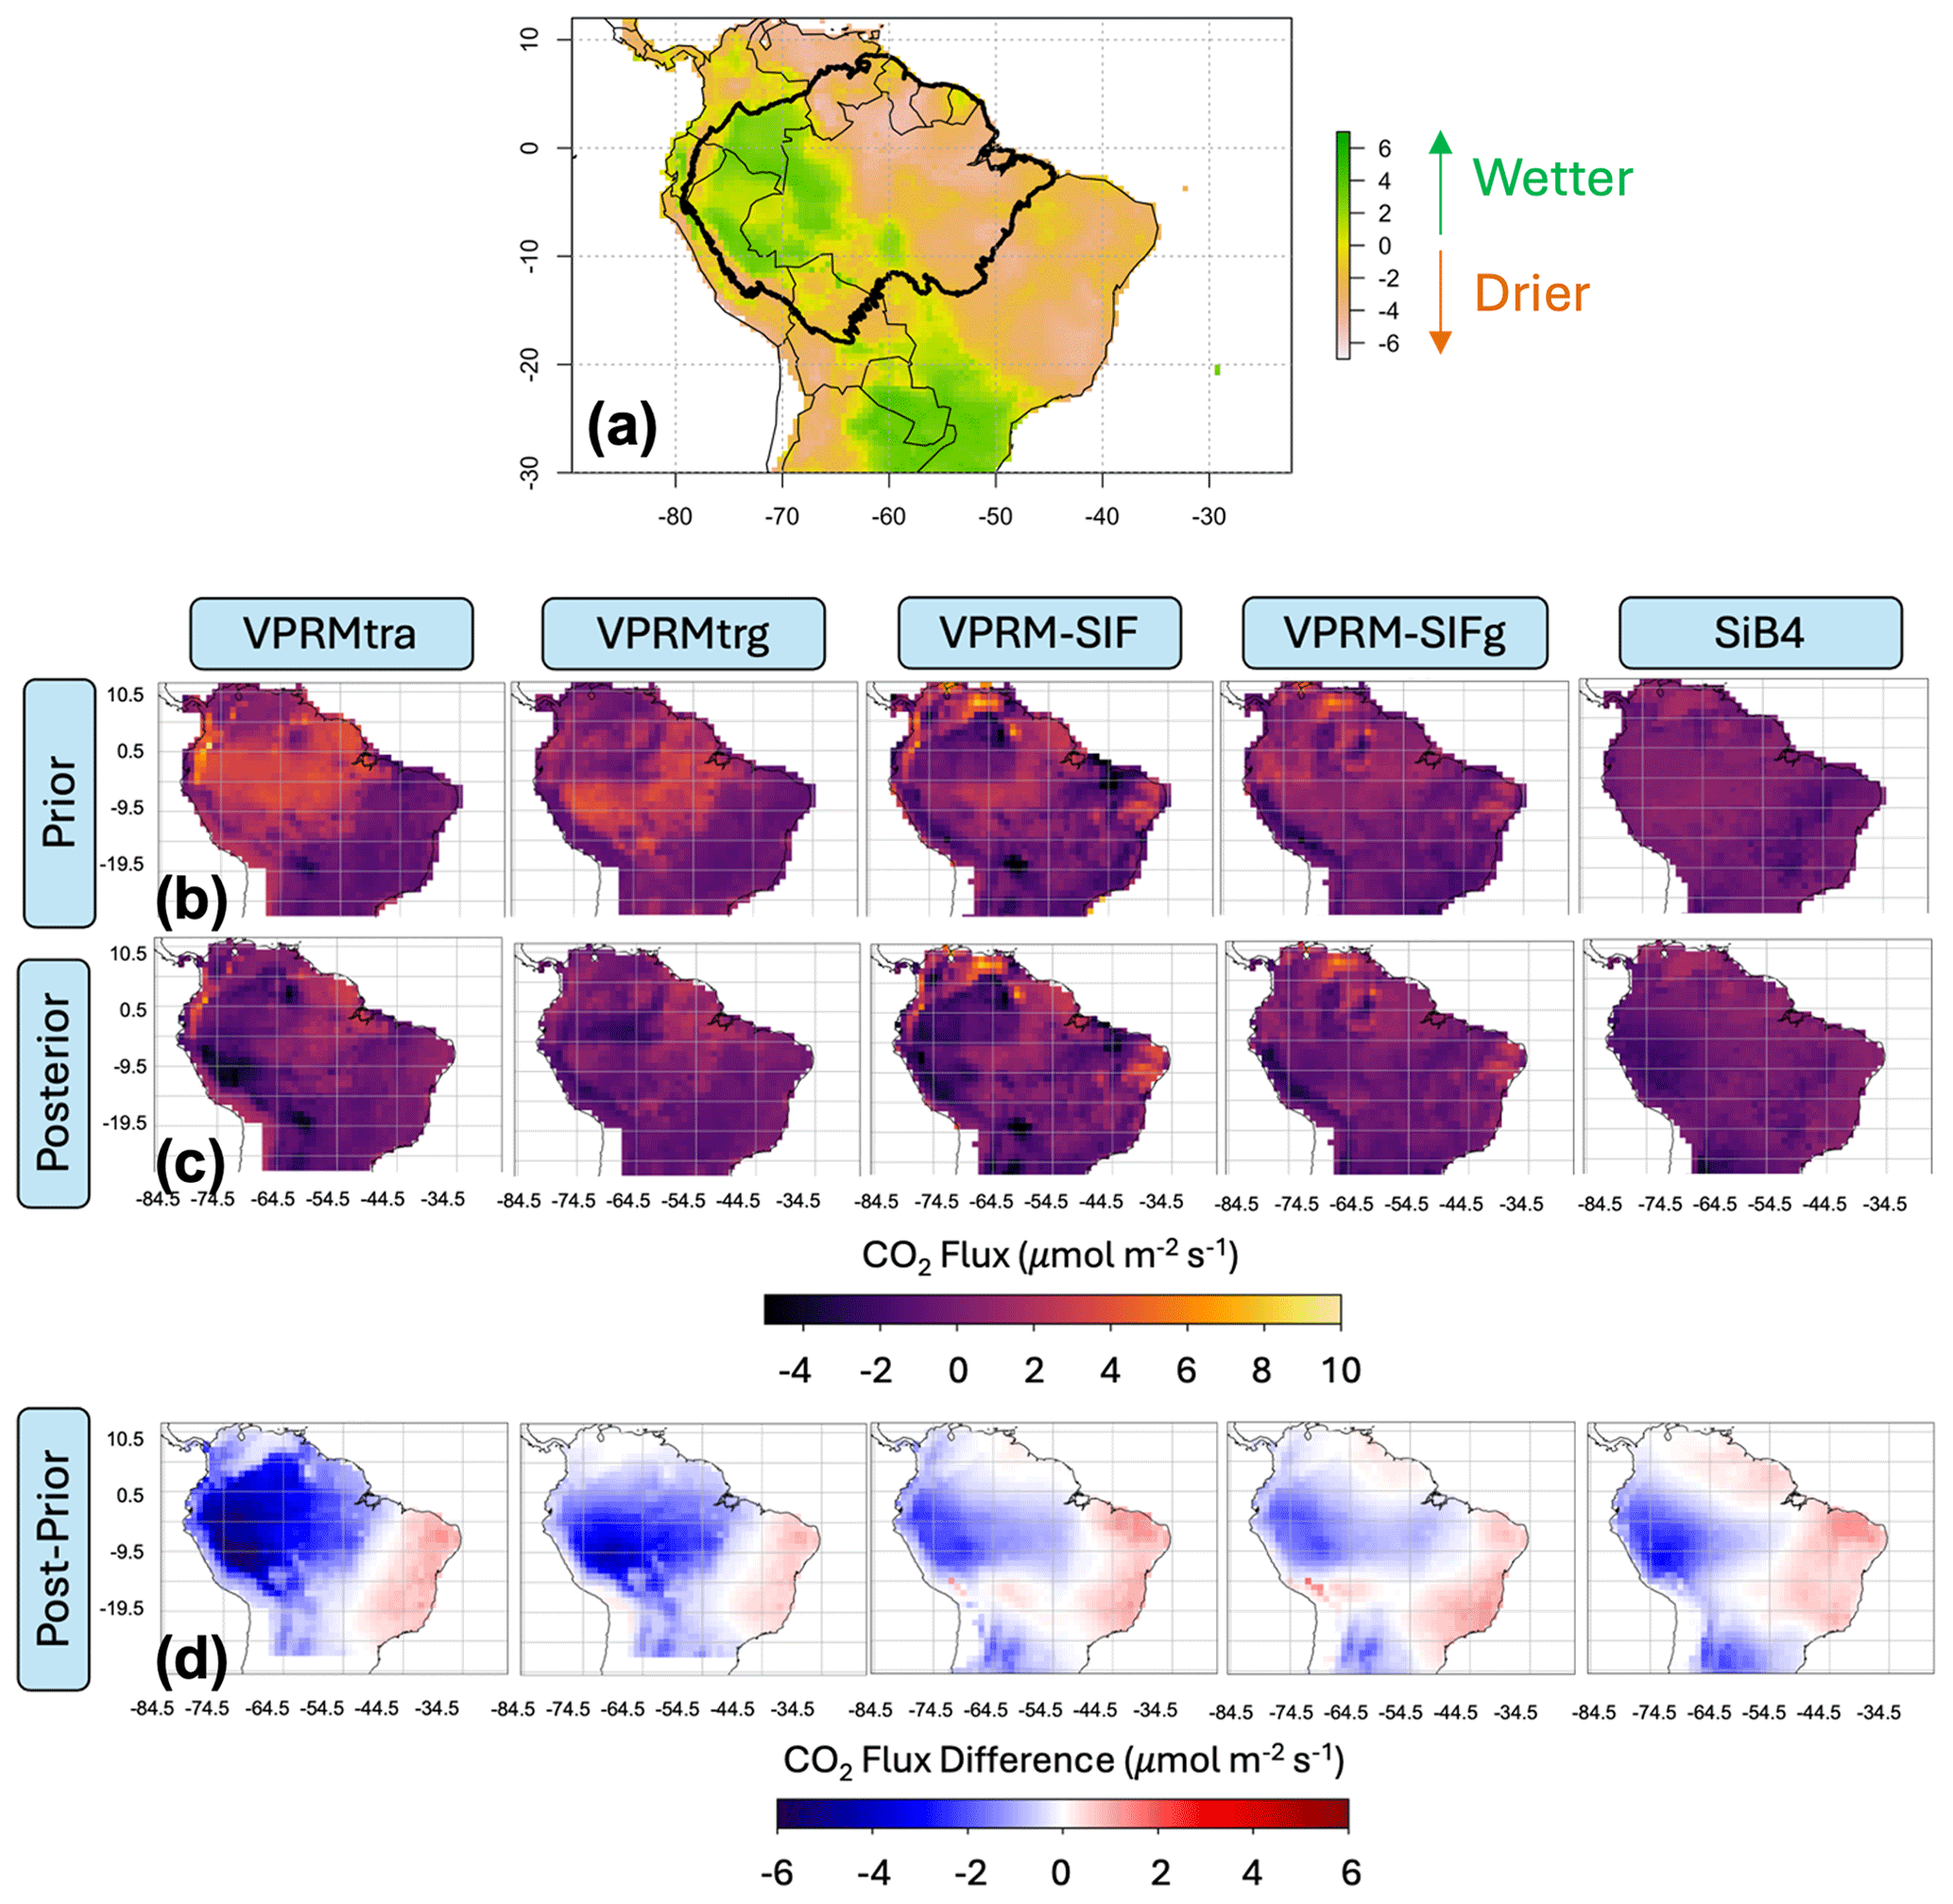
Figure 4Correlation of March 2016 regional drought patterns with differences between average monthly prior and posterior fluxes. (a) Self-calibrated Palmer drought severity index (scPDSI) from January through March 2016 exhibiting anomalously wet conditions in the western Amazon and anomalously dry conditions in the eastern Amazon; (b–d) spatial patterns of average March 2016 fluxes for the (b) prior models, (c) posterior models, and (d) their differences. The scPDSI data are from Jiminez-Muñoz et al. (2016).
3.2.1 Optimization results for biogenic flux models
Figure 4 displays 1°×1° prior (Fig. 4b) and posterior (Fig. 4c) fluxes and their differences (Fig. 4d) (as ) averaged over the month of March 2016. The optimization suggests that all prior models in wet season 2016 tended to underestimate carbon uptake in the western Amazon and particularly in the Amazon lowlands. The regions of underestimated uptake correspond to the anomalously wet region identified through the self-calibrated Palmer drought severity index (scPDSI) by Jimenez-Muñoz et al. (2016) but also in the case of the VPRM to regions under-constrained by eddy flux calibration sites (Figs. 2a and 4a). Relative to OCO-2 total column observations, both traditional VPRM formulations tend to underestimate uptake throughout the Amazon and strongly underestimate uptake in the region corresponding to the wetter-than-normal conditions. However, incorporating SIF observations into the VPRM formulations enhances the model's ability to capture uptake in anomalously dry conditions. We note the demonstrated drought sensitivity of SIF, providing confidence in its ability to quantify impacts of water availability on carbon uptake (e.g., Mohammadi et al., 2022).
Overall, our optimization results during the differentially drought-impacted 2016 wet season suggest that SIF-based VPRM formulations are better able to capture carbon uptake during varying tropical light and moisture regimes than the traditional surface-reflectance-based VPRM formulations. We also find that the posterior solutions of the diagnostic SIF-based VPRM formulations – and the SIFg formulation in particular – converge with that of the bottom-up process-based SiB4 model (Fig. 4d). We further note that the SIF-based VPRM formulations provide significantly higher spatial heterogeneity relative to the SiB4 model, suggesting improved parameterization of the complexity of Amazonian ecosystems.
3.2.2 Comparison of prior and posterior models at aircraft vertical profiling locations
We evaluate the prior and posterior performance of the VPRM and SiB4 models at the RBA and ALF vertical profiling sites, focusing on altitudes where upwind biogenic fluxes dominated the CO2 signal. After qualitatively accounting for the likely presence of fire emissions, we examine the impact of biogenic model optimization through simulating vertical profiles, diurnal cycles, and total monthly fluxes. Methods to calculate vertical profiles and total monthly flux are described in Sects. 2.6 and 2.7.
Overall, we find the SIF-based VPRM formulations and the SiB4 simulate vertical profiles have significantly better model–observation agreement than the traditional VPRM formulations. We discuss the details of the analysis below, noting that the RBA profiling location alone provided observations at altitudes where the biosphere is dominant. Fire activity in the region upwind of ALF was determined to be substantial enough at all altitudes such that biogenic model evaluation – i.e., evaluation absent other significant and confounding sources of CO2 – would not be valid. Figures 5 and 6 display modeled and measured vertical profiles and their 25th and 75th percentiles for a typical 2016 wet season month at RBA and ALF, where “typical” is defined using data across February and March 2016 (Sect. 2.6). At RBA, this period corresponds to surface influence from across the northeast and central Amazon basin, which is a strong modifier of the background CO2 signal through evergreen broadleaf uptake (Figs. 2a, S2, and S9). At ALF, however, the Amazon basin has significantly less influence on the air masses; savanna and woody savanna ecosystems outside the basin dominate the surface influences on the advected background air (Figs. 2a, S3, and S10). As indicated by the IQR of NEE in Table 2, savannas and woody savannas are weaker modifiers of the CO2 signal relative to Amazon basin evergreen broadleaf classes. In addition, during the first quarter (Q1; January–March) of the calendar year, the typical RBA influence region (Fig. S2) is ∼14 % deforested, unlike the ALF Q1 influence region (Fig. S3) which is ∼23 % deforested during the same period (Gatti et al., 2021a). The footprints from the four OCO-2 receptors used to simulate ALF vertical profiles and the back trajectories from measured profiling locations indicate the highest ALF influence is from the most heavily deforested regions (Figs. 2a, S3, and S10). As previously noted, numerous upwind fire locations potentially impact ALF at all altitudes such that the biosphere models alone cannot sufficiently approximate the observed concentrations at any altitude. Table 3 summarizes these results as differences between measured CO2 vertical profiles and the modeled background. At altitudes , ALF Q1 upwind surfaces result in lower background CO2 signal modification relative to RBA Q1 upwind surfaces due to a combination of fewer ecosystem carbon flux modifications and higher fire emissions. At , the differences between ALF and RBA measurements are not significant, suggesting similar background influences above that altitude. At altitudes from ∼900–1000 , COCO2 ratios from Gatti et al. (2021) indicate fire plume influence dominating the signal at RBA and ALF.
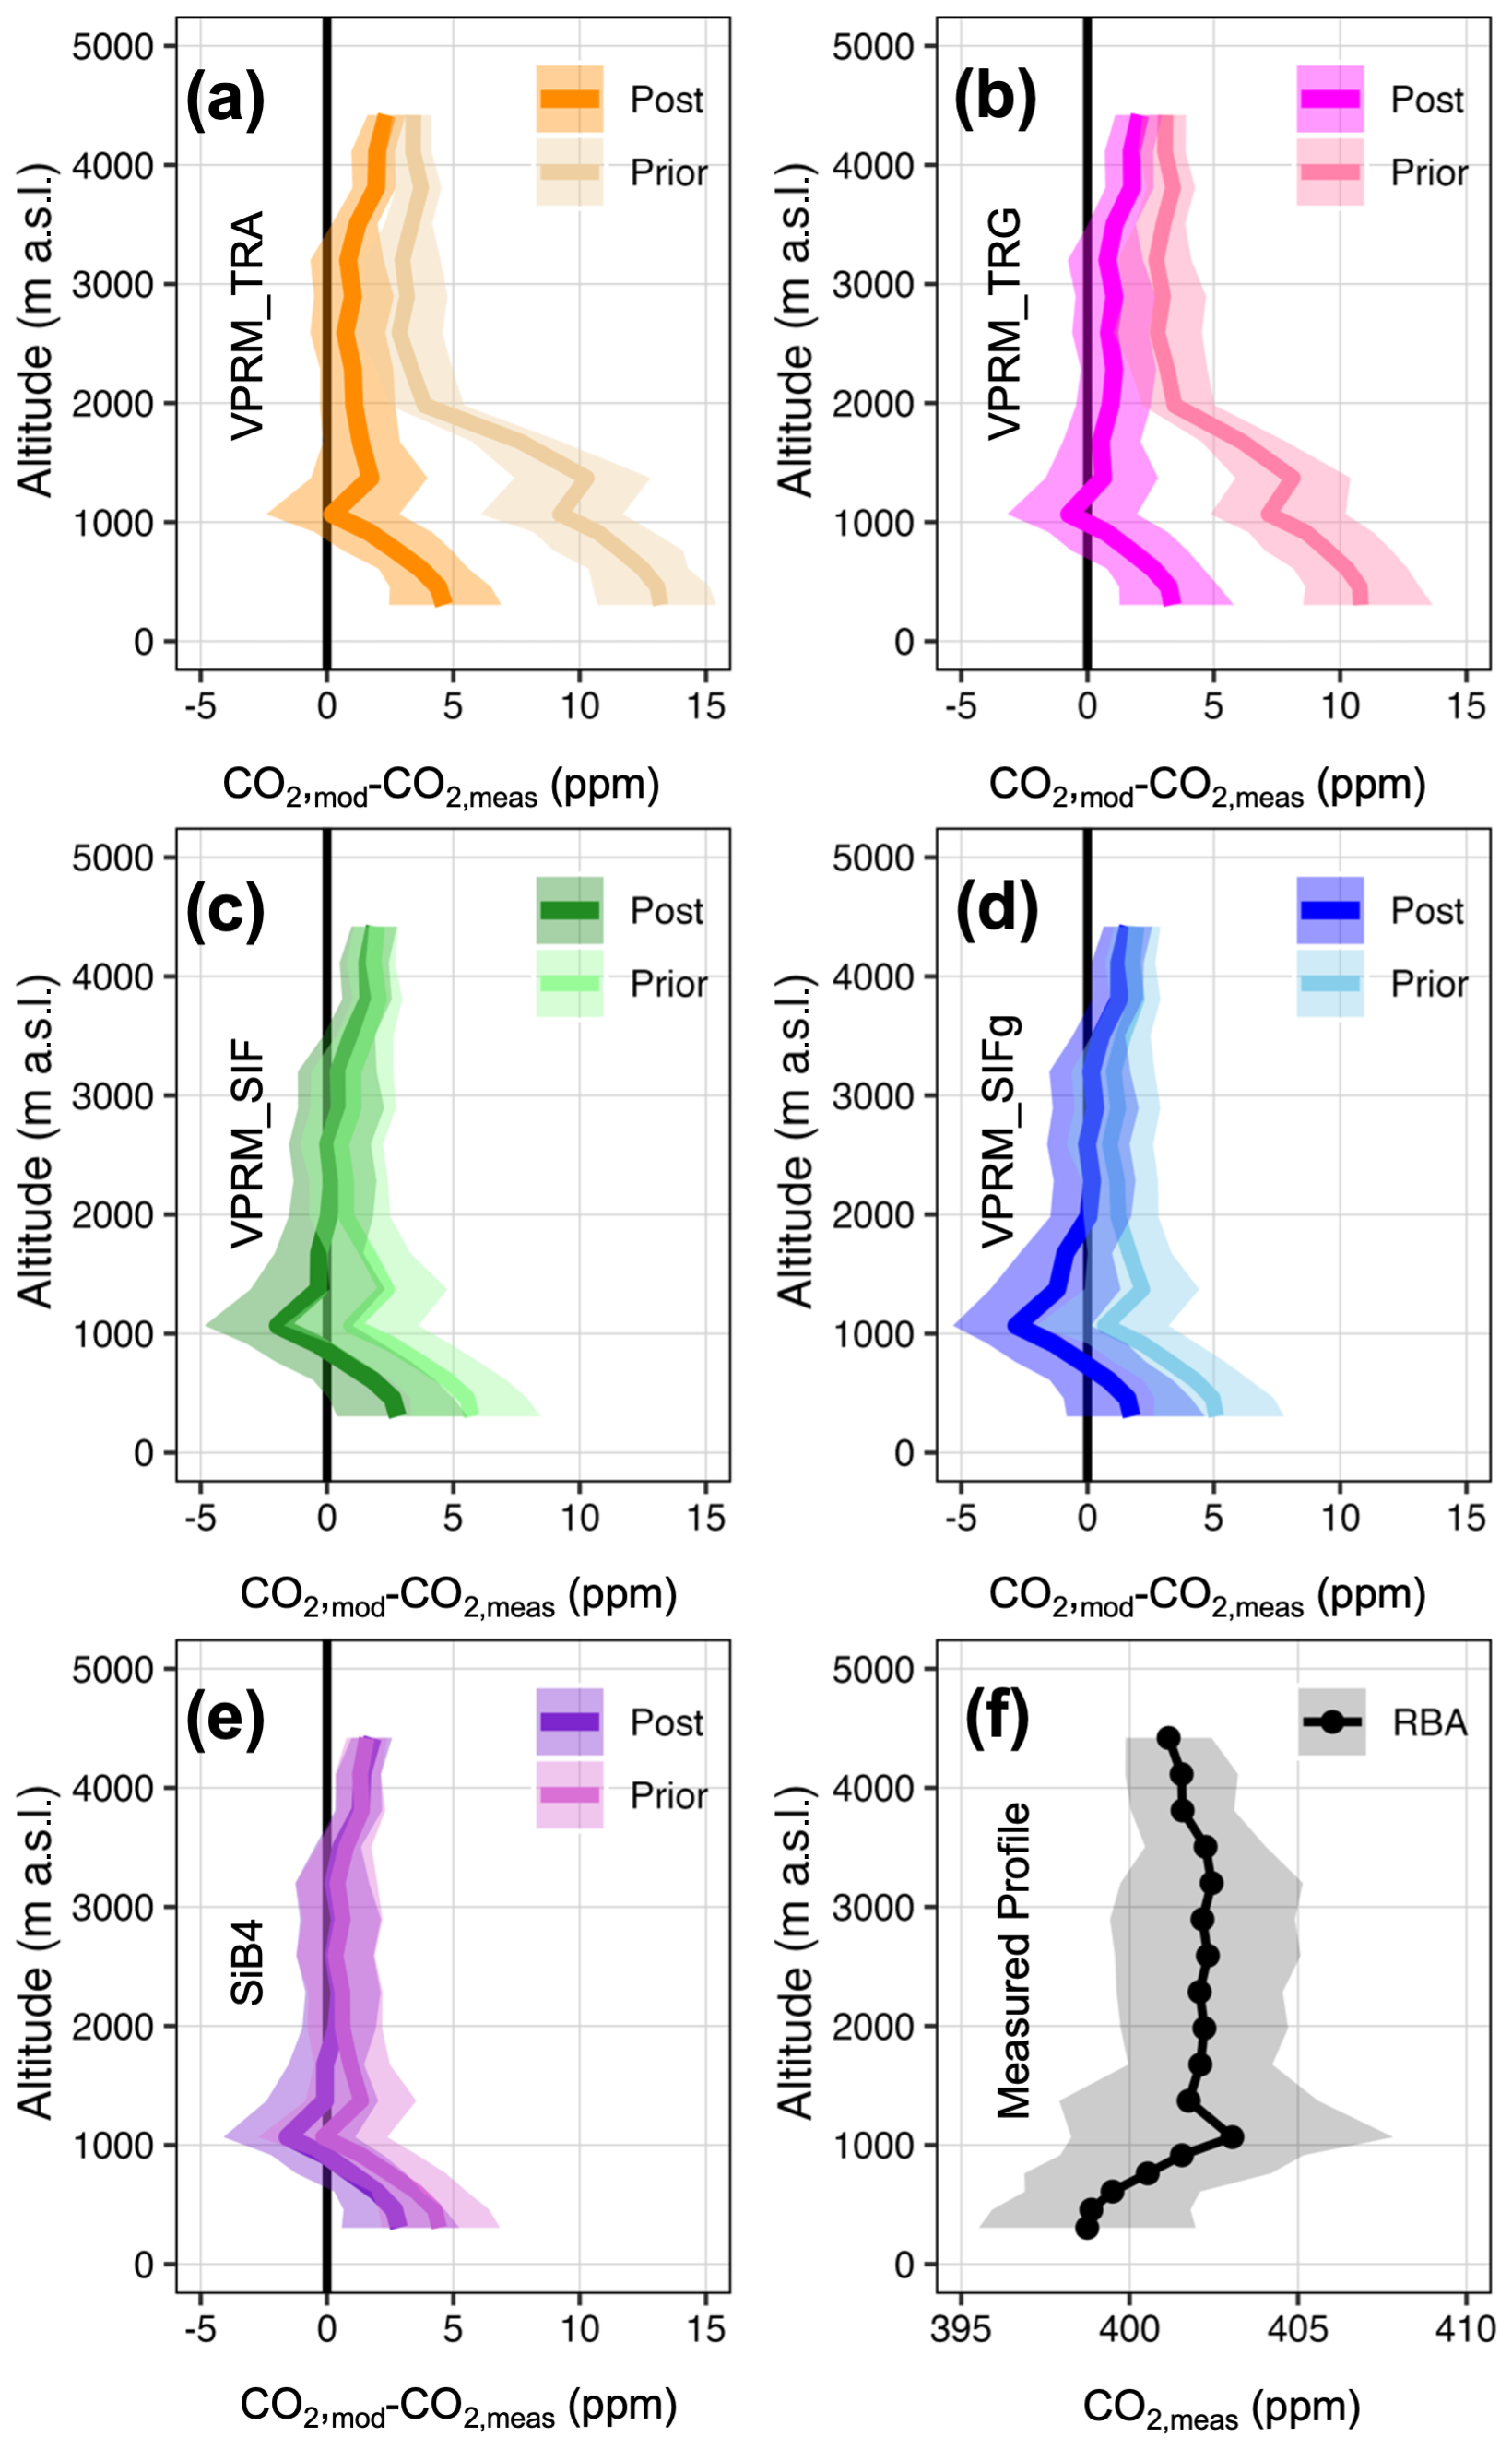
Figure 5Modeled and measured vertical profiles for a typical month during the 2016 wet season at the RBA aircraft site. (a–e) Prior and posterior residuals of modeled vertical profiles relative to measured profiles. (f) Measured CO2. Shaded regions are 25th and 75th percentiles of bootstrapped distributions.
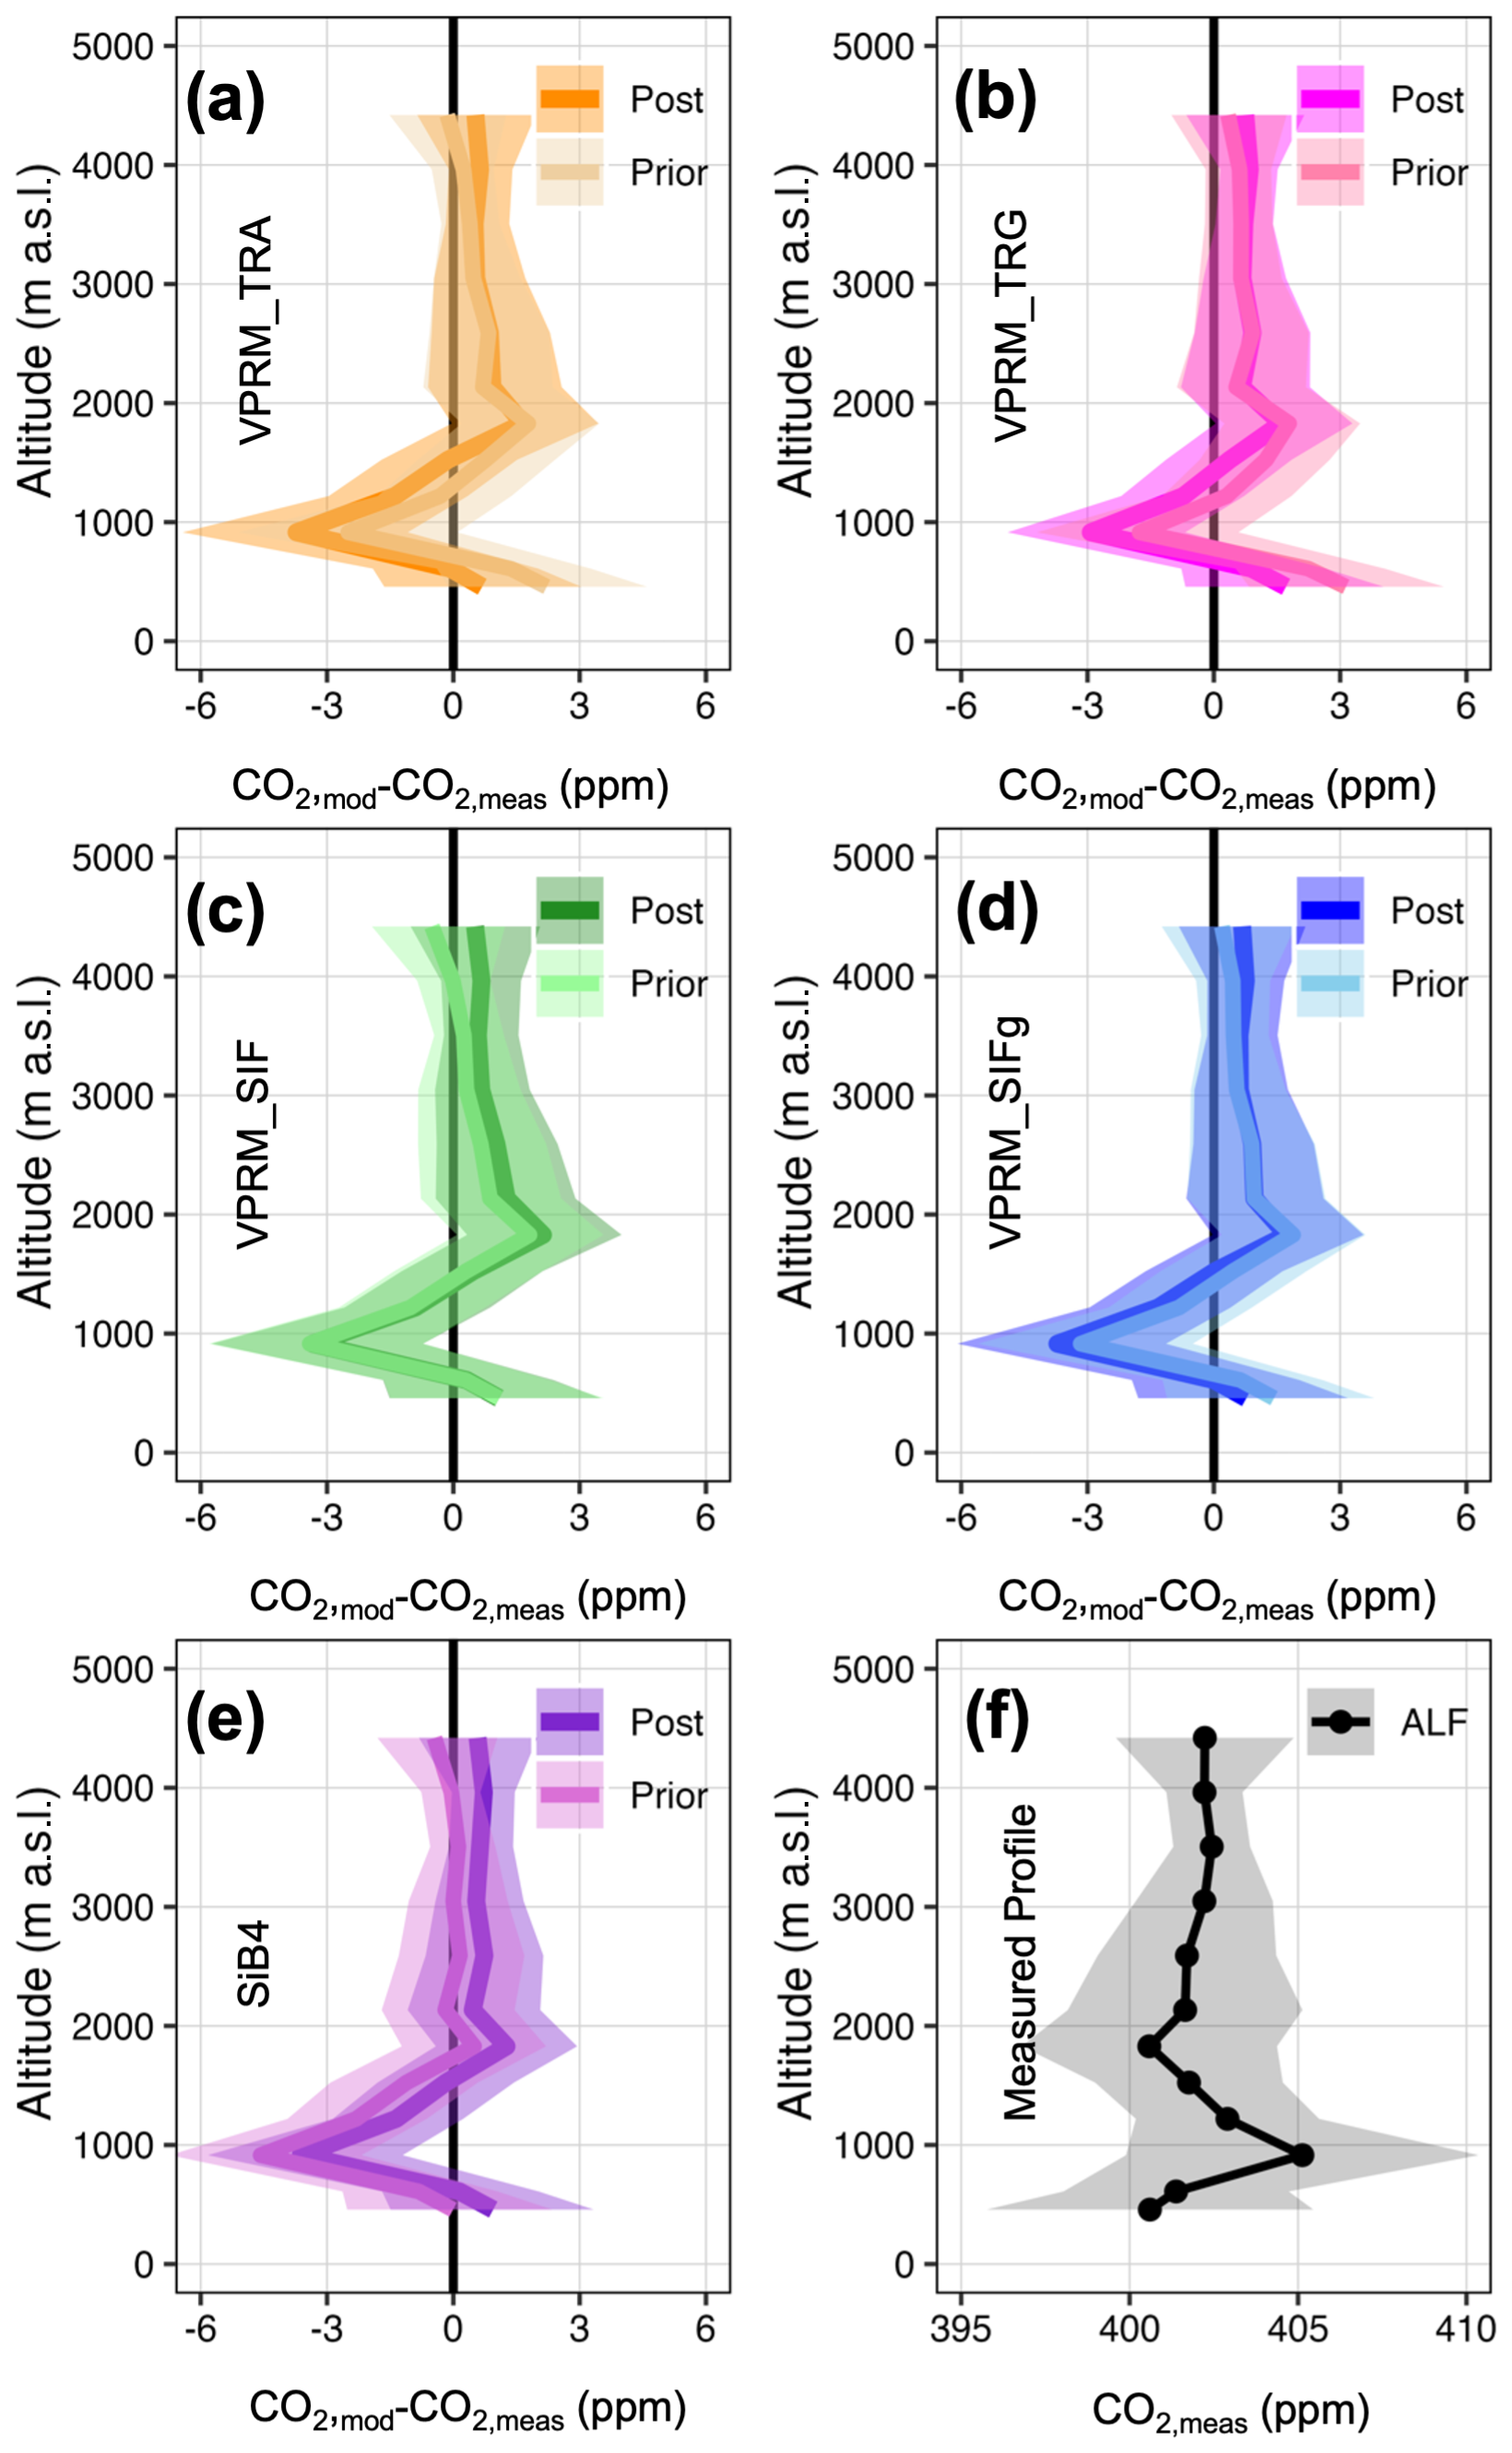
Figure 6Modeled and measured vertical profiles for a typical month during the 2016 wet season at the ALF aircraft site. (a–e) Prior and posterior residuals of modeled vertical profiles relative to measured profiles. (f) Measured CO2. Shaded regions are 25th and 75th percentiles of bootstrapped distributions.
The vertically resolved footprints in Figs. 5 and 6 and Table 3 suggest four distinct upwind CO2 regimes influencing the RBA and ALF measured profiles: (1) biosphere flux dominance below 900 m a.s.l., (2) fire emission dominance between 900–1000 m a.s.l., (3) dilution of fire emissions by background air between 1000–2000 m a.s.l., and (4) background tropical marine Atlantic air dominance above 2000 m a.s.l. We note Gatti et al. (2021), whose surface influence regions are based on integrated back trajectories ranging from 300–3500 m a.s.l.; while their upper threshold of 3500 m a.s.l. defines tropical marine Atlantic background air, their results were robust across background air designations from (typical regional planetary boundary layer height) to 3500 m a.s.l.
At RBA where the Amazon basin biosphere dominates the signal more than at ALF, the optimization reduces the model–observation mismatch for all flux models, particularly below 1000 m a.s.l. Generally, the traditional VPRM formulations are significantly more impacted by the optimization than the SIF-based VPRM and SiB4 models. The magnitude at which VPRM_TRA and VPRM_TRG underestimate CO2 uptake across the RBA area of influence results in a model–observation a priori surface residual of over 10 ppm and a posterior surface residual of approximately 5 ppm (Fig. 5a and b). In contrast, the VPRM_SIF, VPRM_SIFg, and SiB4 models are all similarly impacted by the optimization with a prior model–observation surface residual of approximately 5 ppm, and a posterior model–observation surface residual of <2.5 ppm. At ALF the February–March 2016 upwind air masses are potentially significantly influenced by fire activity at all altitudes. In addition, with the upwind air masses bypassing a majority of the Amazon basin and instead primarily influenced by the Cerrado and Caatinga biomes where the models generally agree (Fig. 4d), all prior and posterior flux models perform similarly with a typical model–observation residual of −3 to 3 ppm throughout the vertical column (Fig. 6a–e).
Table 3Difference between average measured CO2 profiles and CT2019 background CO2. Differences are based on averages pooled across February and March 2016.
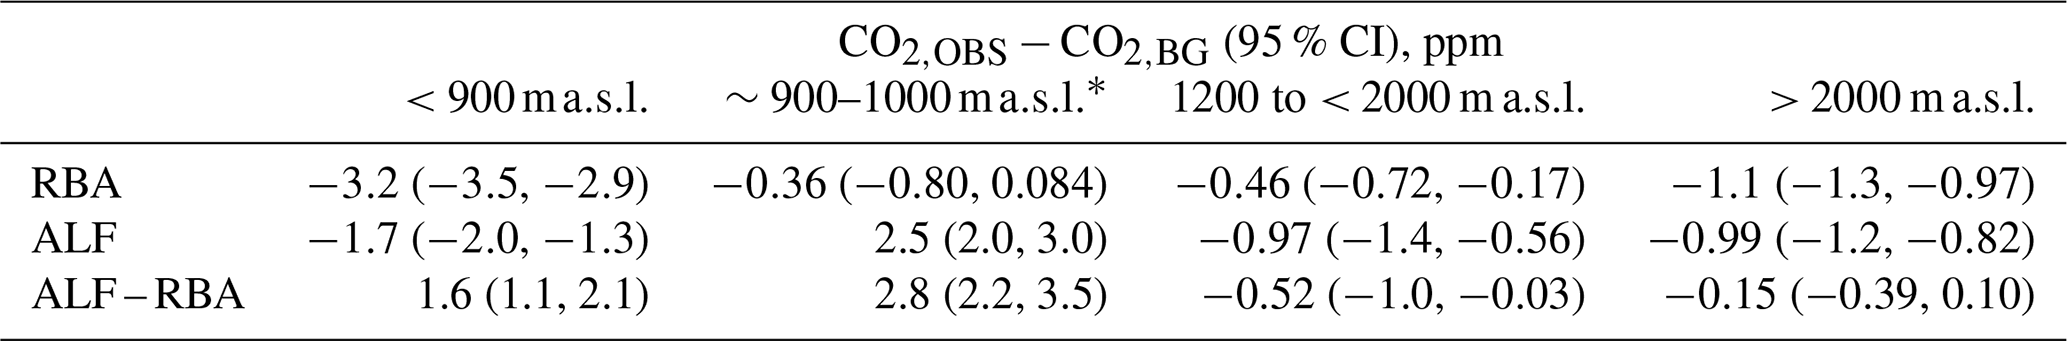
∗ 1000 m a.s.l. is the approximate location of the peak of a fire plume.
3.3 Summary of VPRM_SIFg prior model decadal performance
Based on comparison with eddy flux data and results from the March 2016 optimization case study, the VPRM_SIFg biogenic flux model shows promise in its ability to capture Amazonian carbon fluxes across multiple timescale and moisture regimes, suggesting its suitability for larger studies evaluating interannual and seasonal carbon trends in both the fire and biogenic components of the region's NBE. In this section, we summarize the decadal performance of the VPRM_SIFg prior relative to the VPRM_TRG, VPRM_TRA, and SiB4 priors. We calculate average seasonal fluxes of the VPRM_SIFg prior (as ) from 2010–2020 (2010–2018 for SiB4) over Amazonia and compare them with the corresponding average fluxes from the VPRM_TRA, VPRM_TRG, and SiB4 priors (Fig. 7). In addition, we compare the interannual performance of VPRM_SIFg and SiB4 and include comparisons with other studies both in the Amazon (Gatti et al., 2021a) and in the Cerrado and Caatinga biomes (Mendes et al., 2020; Alves et al., 2021).
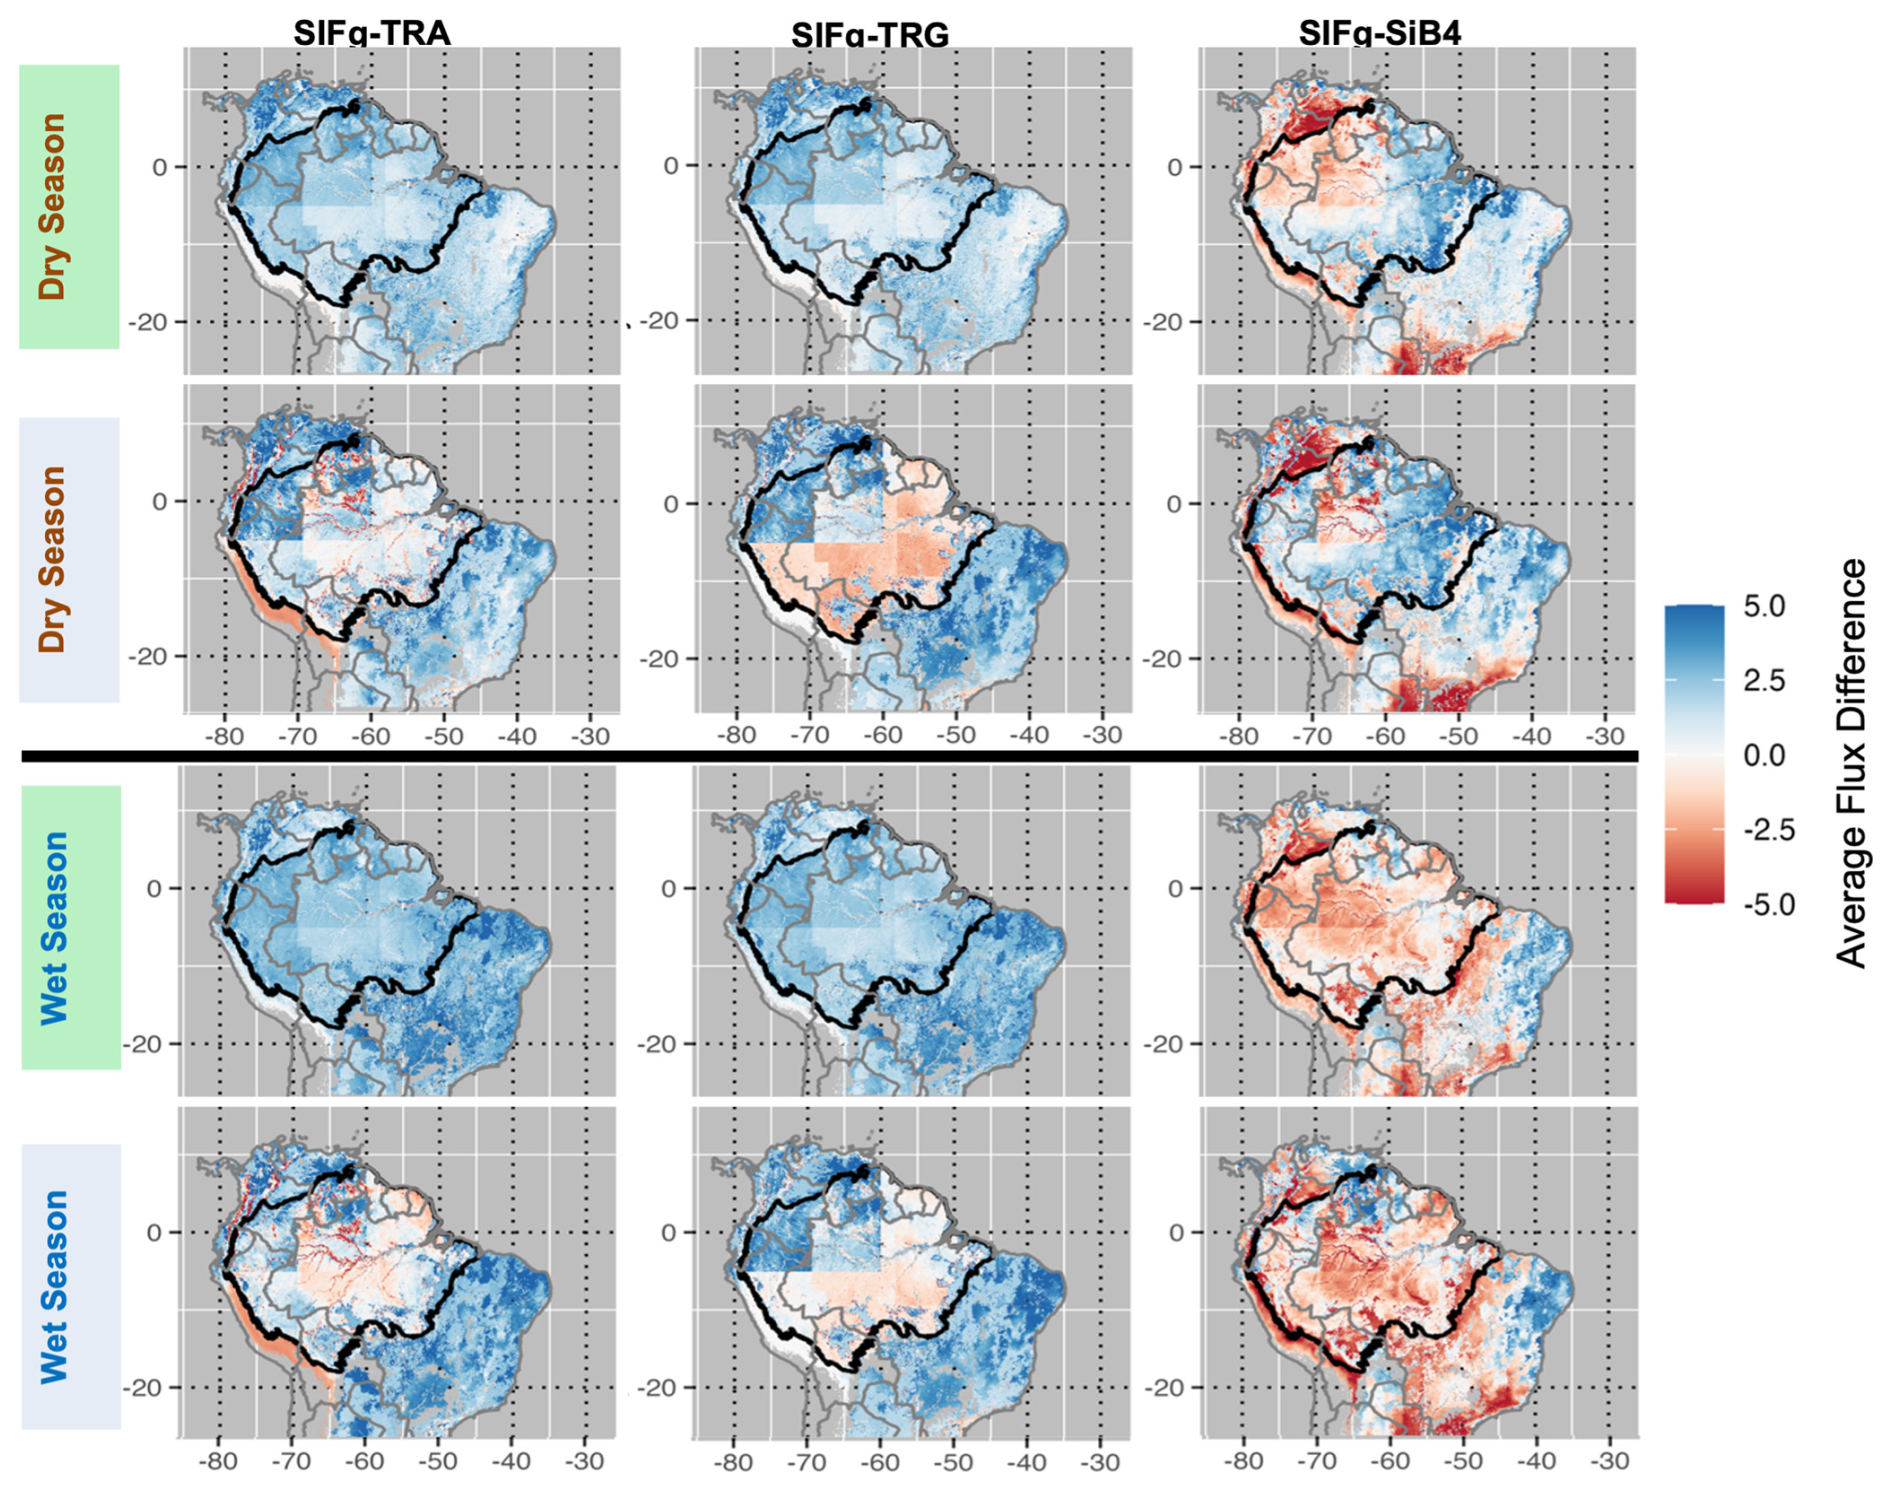
Figure 7Average GPP and Reco flux differences between VPRM_SIFg relative to traditional VPRM formulations and SiB4. Averaging period is 2010–2020 (comparison with VPRM formulations) and 2010–2018 (comparison with SiB4). Top panels: dry season differences. Bottom panels: wet season differences. Blue (red) values indicate instances where SIFg estimates more (less) uptake and release than the comparison model.
3.3.1 Comparison with traditional VPRM fluxes
Basinwide and across both seasons and all years, VPRM_SIFg estimates more photosynthetic uptake than VPRM_TRA and VPRM_TRG in an overall pattern consistent with model validation and wet season 2016 optimization results. Across both seasons, VPRM_SIFg estimates more respiration in the Br-K34 calibration region and less respiration across the rest of the basin when compared to VPRM_TRA and VPRM_TRG.
Outside of the basin, VPRM_SIFg universally estimates higher photosynthetic uptake and respiration release than the traditional VPRMs.
3.3.2 Comparison with SiB4 fluxes
When compared to SiB4, VPRM_SIFg estimates less dry season uptake and respiration in the western Amazon basin corresponding to the regions calibrated by Br-K34. In the wet season, VPRM_SIFg generally estimates less uptake and respiration than SiB4.
Outside of the basin, VPRM_SIFg generally estimates more photosynthesis and respiration in the dry season. In the wet season, higher photosynthesis and respiration relative to SiB4 are localized to woody savanna and savanna ecosystems (Br-CST, Br-BAN).
Determining the extent to which the differences between the two models reflect real carbon dynamics requires a multi-year optimization, including separately optimizing GPP and Reco.
3.3.3 Comparison with interannual observations
We assessed the performance of VPRM_SIFg and SiB4 from 2010 to 2019 for the Amazon basin (Amazon mask; Fig. 8a and b) and separately for the region containing the Cerrado and Caatinga biomes (Cerrado+Caatinga mask; Fig. 8a and c) and compared it against available observations.
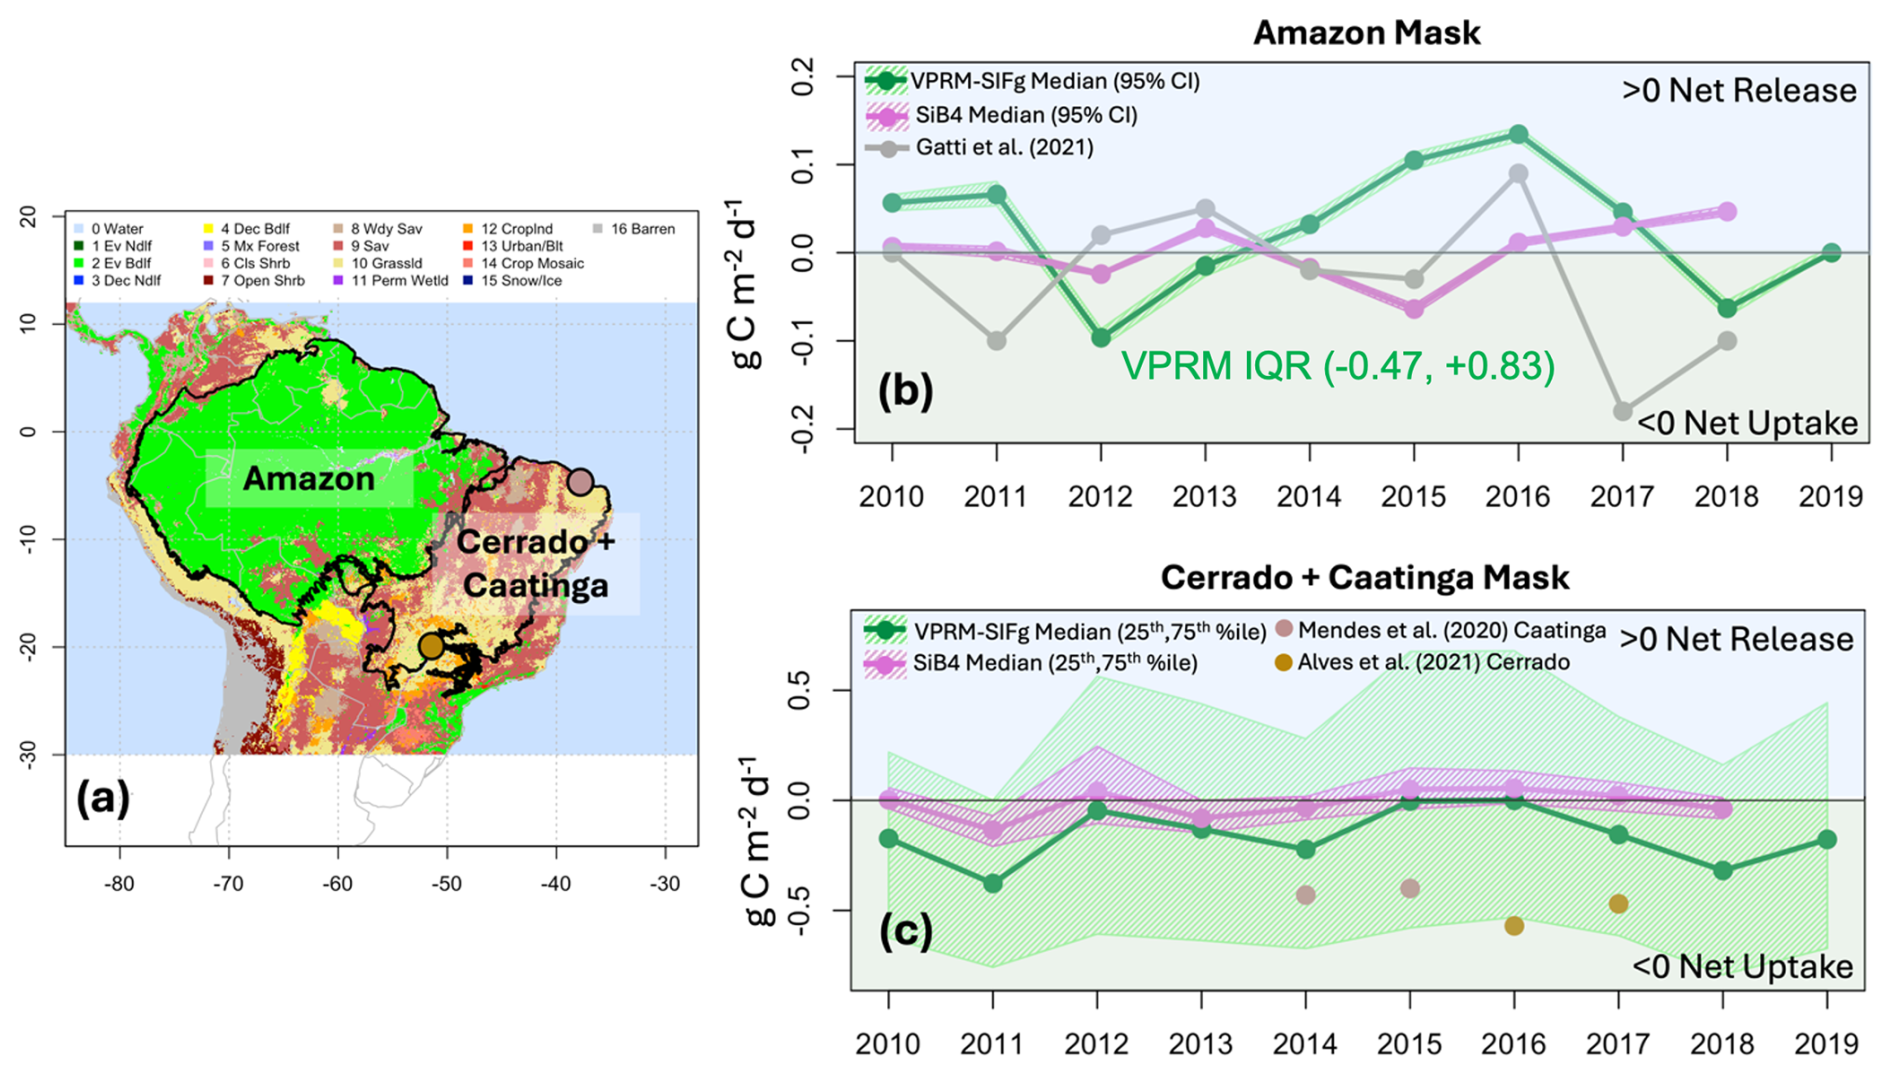
Figure 8Interannual performance of VPRM_SIFg and SiB4 NEE () relative to available observations for the decade beginning in 2010. (a) IGBP land use map overlaid with the Amazon mask, Cerrado+Caatinga mask, and two Cerrado and Caatinga eddy flux sites used for comparison; (b) VPRM_SIFg and SiB4 median annual NEE (95 % CI of the median) for the Amazon mask along with estimates from Gatti et al. (2021); (c) VPRM_SIFg and SiB4 median annual NEE (25th, 75th percentiles) for the Cerrado+Caatinga mask along with annual estimates from two eddy flux sites.
For the Amazon mask, the VPRM_SIFg prior tends to estimate interannual net release, while the SiB4 model tends to remain closer to neutral (Fig. 8b). In addition, the VPRM_SIFg describes greater ecosystem heterogeneity relative to SiB4: the interquartile range (IQR) over the Amazon for the VPRM_SIFg is −0.47 to 0.83 . In contrast the SiB4 IQR is 0.06 to 0.07 . Meanwhile, the Gatti et al. (2021) mass balance approach using aircraft vertical profiles tends to estimate net fluxes closer to neutral that generally track SiB4 interannual estimates with a few notable exceptions: in 2016, corresponding to the tail of the severe 2015–2016 El Niño, aircraft profiles suggest a regional net release of 0.1 in agreement with VPRM_SIFg, while the following year shows a net regional uptake of −0.2 . We note that the VPRM_SIFg model agrees with the trajectory of the Gatti et al. (2021) post-El Niño fluxes in that there is more net uptake implied between 2016 and 2018. Furthermore, we note that the 2010–2011 El Niño corresponds to a VPRM_SIFg estimate of net release, while Gatti et al. (2021) and SiB4 estimate carbon fluxes that are net neutral to uptake. Given the severity of the associated 2010 drought across the Amazon, particularly as it was only 5 years after the previous severe drought, it is worth exploring whether the VPRM_SIFg is better able to capture the regional carbon effects and impacts of antecedent environmental stressors.
The performance in the Cerrado and Caatinga region suggests that the ecosystem heterogeneity exhibited in the VPRM_SIFg model is realistic. The IQR for the VPRM_SIFg in the Cerrado and Caatinga region captures the site diversity exhibited by the Mendes et al. (2020) northern Caatinga eddy flux site and the Alves et al. (2021) southern Cerrado converted pasture site. In contrast, the IQR of SiB4 remains closer to neutral. Note that the Gatti et al. (2021) analysis did not include an assessment of the Cerrado and Caatinga regions.
Compounded by the impacts of global climate change, the Amazon is experiencing unprecedented ecological disturbance through fires, deforestation, drought, and forest fragmentation. Multiple recent studies describe how the increasingly degraded and disturbed Amazon has a lowered carbon sink capacity with significant impacts to regional and global carbon budgets. However, reliable biogenic flux models that can capture fluxes from hourly to annual timescales are needed to quantify trends in carbon sink strength, ecological health and recovery from disturbance, and estimates of emissions from increasingly prevalent fires.
Assimilating observational CO2 data from eddy flux sites, OCO-2 columns, and aircraft vertical profiles, we demonstrate, construct, and evaluate the ability of four versions of the VPRM diagnostic light use efficiency model to capture biogenic carbon fluxes from hourly to seasonal scales. Of the VPRM versions evaluated, the respiration-modified VPRM_SIFg exhibits the least bias when compared to eddy flux observations, including observationally derived respiration estimates. In the tropics – where respiration exerts stronger controls on NBE than the extratropics – our work demonstrates the superior performance of the respiration-modified VPRM_SIFg diagnostic light use efficiency model relative to all other VPRM versions. Future work will continue development of the VPRM_SIFg formulation, including further investigating the model structure as it relates to SIF and PAR as well as exploring the direct use of SIF satellite products rather than derived products such as contiguous solar-induced fluorescence (CSIF).
Optimization results for March 2016 – the middle of the wet season corresponding to the tail of the 2015–2016 severe El Niño – demonstrate (1) a significant underestimate of net uptake by the traditional VPRM formulations relative to observations and VPRM_SIFg; (2) that relative to the SiB4 model, the VPRM_SIFg model describes more spatial heterogeneity in carbon exchange throughout the Amazon; and (3) the convergence of flux estimates from two distinct methodologies – namely, the diagnostic VPRM_SIFg and the process-based bottom-up SiB4 biogenic flux model. While the convergence of NEE in the distinct VPRM_SIFg and SiB4 flux estimation methodologies lends confidence to both models, differences in NEE partitioning (as GPP and Reco) warrant further exploration. Future work will optimize GPP and Reco separately; in that case, the VPRM can be optimized in parameter space (e.g., Matross et al., 2006), which will also account for the uncertainty associated with using carbon dynamics from 2000–2010 to describe carbon dynamics from 2010–2020.
We also find that, despite the paucity of wet season OCO-2 observations used in top-down constraints, modeled vertical profiles optimized with OCO-2 measurements compare significantly better with aircraft measurements than their unoptimized counterparts. We hypothesize that, given the drier-than-normal conditions experienced by the region influencing RBA during this time period, the sounding density during this wet season was higher than normal. Future work focusing on a range of wet season conditions will shed light on this possible anomaly.
The promising performance of both the prior and posterior VPRM_SIFg model in the wet season 2016 case study provides confidence in its ability to capture interannual and seasonal trends in the biogenic carbon component of the Amazon's net biome exchange. We note that VPRM_SIFg would benefit from additional calibration sites, via inclusion of eddy flux data from more recent time periods and/or greater representation of interior primary moist evergreen broadleaf classes. Currently, Br-K34 is the only site representing the interior Amazon; additional eddy flux data for calibration and/or validation such as from the Amazon Tall Tower Observatory (ATTO) would be beneficial. In addition, eddy flux data from the Amazon lowlands would provide additional constraints to the higher model–observation mismatch observed in that region. Future work will use the optimized VPRM_SIFg across both wet and dry seasons to evaluate interannual and seasonal trends, including assessing the changing role of fires in the net biome exchange of Amazonian carbon fluxes, and the changes in the pace of post-fire ecosystem recovery.
The VPRM and the inversion code are available upon request from the authors.
CO2 vertical profiling data are available from https://doi.org/10.1594/PANGAEA.926834 (Gatti et al., 2021b). VPRM fluxes, STILT footprints, and CT2019 background data for the March 2016 case study are available from https://doi.org/10.7910/DVN/PJ1EVC (Dayalu, 2024). Additional data are available from the authors upon request.
The supplement related to this article is available online at https://doi.org/10.5194/bg-22-1509-2025-supplement.
AD wrote the paper with input from all co-authors. AD constructed the VPRM. MM generated the WRF-STILT fields and performed the inversion with assistance from BR and JBM. LG provided access to vertical profiling datasets and shapefiles.
The contact author has declared that none of the authors has any competing interests.
Publisher's note: Copernicus Publications remains neutral with regard to jurisdictional claims made in the text, published maps, institutional affiliations, or any other geographical representation in this paper. While Copernicus Publications makes every effort to include appropriate place names, the final responsibility lies with the authors.
We thank Yao Zhang for assistance with the CSIF dataset; Juan-Carlos Jiminez-Muñoz for providing the Amazon scPDSI data for 2016; and Sharon Gourdji, Matthew Alvarado, Rebecca Adams-Selin, and Thomas Nehrkorn for helpful discussions. AmeriFlux data were made available through the data portal (https://ameriflux.lbl.gov, last access: 14 March 2025). Regional shapefiles were obtained from TerraBrasilis (https://terrabrasilis.dpi.inpe.br/en/home-page/, last access: 14 March 2025).
This research has been supported by the Directorate for Geosciences (grant no. 2026410) and the National Aeronautics and Space Administration (grant nos. 80NSSC24K0753 and 80NSSC18K0171).
This paper was edited by Anja Rammig and reviewed by two anonymous referees.
Alden, C. B., Miller, J. B., Gatti, L. V., Gloor, M. M., Guan, K., Michalak, A. M., van der Laan-Luijkx, I. T., Touma, D., Andrews, A., Basso, L. S., Correia, C. S. C., Domingues, L. G., Joiner, J., Krol, M. C., Lyapustin, A. I., Peters, W., Shiga, Y. P., Thoning, K., van der Velde, I. R., van Leeuwen, T. T., Yadav, V., and Diffenbaugh, N. S.: Regional atmospheric CO2 inversion reveals seasonal and geographic differences in Amazon net biome exchange, Glob. Change Biol., 22, 3427–3443, https://doi.org/10.1111/gcb.13305, 2016.
Alves, J. D. N., Ribeiro, A., Rody, Y. P., Loos, R. A., and Hall, K. B.: Carbon uptake and water vapor exchange in a pasture site in the Brazilian Cerrado, J. Hydrol., 594, 125943, https://doi.org/10.1016/j.jhydrol.2020.125943, 2021.
de Almeida, C. T., Delgado, R. C., Galvão, L. S., Aragão, L. E., and Ramos, M. C.: Improvements of the MODIS Gross Primary Productivity model based on a comprehensive uncertainty assessment over the Brazilian Amazonia, ISPRS J. Photogramm., 145, 268–283, https://doi.org/10.1016/j.isprsjprs.2018.07.016, 2018.
Andreae, M. O.: Emission of trace gases and aerosols from biomass burning – an updated assessment, Atmos. Chem. Phys., 19, 8523–8546, https://doi.org/10.5194/acp-19-8523-2019, 2019.
Antonino, A.: AmeriFlux FLUXNET-1F BR-CST Caatinga Serra Talhada, Ver. 3-5, AmeriFlux AMP [data set], https://doi.org/10.17190/AMF/1902820, 2022.
Aragão, L. E. O. C., Anderson, L. O., Fonseca, M. G., Rosan, T. M., Vedovato, L. B., Wagner, F. H., Silva, C. V. J., Silva Junior, C. H. L., Arai, E., Aguiar, A. P., Barlow, J., Berenguer, E., Deeter, M. N., Domingues, L. G., Gatti, L., Gloor, M., Malhi, Y., Marengo, J. A., Miller, J. B., Phillips, O. L., and Saatchi, S.: 21st Century drought-related fires counteract the decline of Amazon deforestation carbon emissions, Nat. Commun., 9, 536, https://doi.org/10.1038/s41467-017-02771-y, 2018.
Barkhordarian, A., Saatchi, S. S., Behrangi, A., Loikith, P., and Mechoso, C.: A recent systematic increase in vapor pressure deficit over tropical South America, Sci. Rep.-UK, 9, 15331, https://doi.org/10.1038/s41598-019-51857-8, 2019.
Basso, L. S., Wilson, C., Chipperfield, M. P., Tejada, G., Cassol, H. L. G., Arai, E., Williams, M., Smallman, T. L., Peters, W., Naus, S., Miller, J. B., and Gloor, M.: Atmospheric CO2 inversion reveals the Amazon as a minor carbon source caused by fire emissions, with forest uptake offsetting about half of these emissions, Atmos. Chem. Phys., 23, 9685–9723, https://doi.org/10.5194/acp-23-9685-2023, 2023.
Bloom, A. A., Lauvaux, T., Worden, J., Yadav, V., Duren, R., Sander, S. P., and Schimel, D. S.: What are the greenhouse gas observing system requirements for reducing fundamental biogeochemical process uncertainty? Amazon wetland CH4 emissions as a case study, Atmos. Chem. Phys., 16, 15199–15218, https://doi.org/10.5194/acp-16-15199-2016, 2016.
Brando, P., Macedo, M., Silvério, D., Rattis, L., Paolucci, L., Alencar, A., Coe, M., and Amorim, C.: Amazon wildfires: Scenes from a foreseeable disaster, Flora, 268, 151609, https://doi.org/10.1016/j.flora.2020.151609, 2020.
Clark, D. A., Clark, D. B., and Oberbauer. S. F.: Field-quantified responses of tropical rainforest aboveground productivity to increasing CO2 and climatic stress, 1997–2009, J. Geophys. Res.-Biogeo., 118, 783–794, https://doi.org/10.1002/jgrg.20067, 2013.
Cox, P., Betts, R., Jones, C., Spall, S., and Totterdell, I.: Acceleration of global warming due to carbon-cycle feedbacks in a coupled climate model, Nature, 408, 184–187, https://doi.org/10.1038/35041539, 2000.
Cox, P., Pearson, D., Booth, B., Friedlingstein, P., Huntingford, C., Jones, C., and Luke, C.: Sensitivity of tropical carbon to climate change constrained by carbon dioxide variability, Nature, 494, 341–344, https://doi.org/10.1038/nature11882, 2013.
Dayalu, A.: Supplementary Data for:Constraining 2010-2020 Amazonian carbon flux estimates with satellite solar-induced fluorescence (SIF), Harvard Dataverse [data set], https://doi.org/10.7910/DVN/PJ1EVC, 2024.
Dayalu, A., Munger, J. W., Wofsy, S. C., Wang, Y., Nehrkorn, T., Zhao, Y., McElroy, M. B., Nielsen, C. P., and Luus, K.: Assessing biotic contributions to CO2 fluxes in northern China using the Vegetation, Photosynthesis and Respiration Model (VPRM-CHINA) and observations from 2005 to 2009, Biogeosciences, 15, 6713–6729, https://doi.org/10.5194/bg-15-6713-2018, 2018.
Doughty, R., Köhler, P., Frankenberg, C., Magney, T. S., Xiao, X., Qin, Y., Wu, X., and Moore, B.: TROPOMI reveals dry-season increase of solar-induced chlorophyll fluorescence in the Amazon forest, P. Natl. Acad. Sci. USA, 116, 22393-8, https://doi.org/10.1073/pnas.1908157116 2019, 2019.
Figueira, A. M. E S., Miller, S. D., de Sousa, C. A. D., Menton, M. C., Maia, A. R., da Rocha, H. R., and Goulden, M. L.: Effects of selective logging on tropical forest tree growth, J. Geophys. Res., 113, G00B05, https://doi.org/10.1029/2007JG000577, 2008.
Fu, R., Yin, L., Li, W., Arias, P. A., Dickinson, R. E., Huang, L., Chakraborty, S., Fernandes, K., Liebmann, B., Fisher, R., and Myneni, R. B.: Increased dry-season length over southern Amazonia in recent decades and its implication for future climate projection, P. Natl. Acad. Sci. USA, 110, 18110–18115, https://doi.org/10.1073/pnas.1302584110, 2013.
Gallup, S. M., Baker, I. T., Gallup, J. L., Restrepo-Coupe, N., Haynes, K. D., Geyer, N. M., and Denning, A. S.: Accurate simulation of both sensitivity and variability for Amazonian photosynthesis: Is it too much to ask?, J. Adv. Model. Earth Sy., 13, e2021MS002555, https://doi.org/10.1029/2021MS002555, 2021.
Gatti, L. V., Miller, J. B., D'Amelio, M. T. S., Martinewski, A., Basso, L. S., Gloor, M. E., Wofsy, S., and Tans, P.: Vertical profiles of CO2 above eastern Amazonia suggest a net carbon flux to the atmosphere and balanced biosphere between 2000 and 2009, Tellus B, 62, 581–594, https://doi.org/10.1111/j.1600-0889.2010.00484.x, 2010.
Gatti, L. V., Gloor, M., Miller, J. B., Doughty, C. E., Malhi, Y., Domingues, L. G., Basso, L. S., Martinewski, A., Correia, C. S. C., Borges, V. F., Freitas, S., Braz, R., Anderson, L. O., Rocha, H., Grace, J., Phillips, O. L., and Lloyd, J.: Drought sensitivity of Amazonian carbon balance revealed by atmospheric measurements, Nature, 506, 76–80, https://doi.org/10.1038/nature12957, 2014.
Gatti, L. V., Basso, L. S., Miller, J. B., Gloor, M., Gatti Domingues, L., Cassol, H. L. G., Tejada, G., Aragão, L. E. O. C., Nobre, C., Peters, W., Marani, L., Arai, E., Sanches, A. H., Corrêa, S. M., Anderson, L., Von Randow, C., Correia, C. S. C., Crispim, S. P., and Neves, R. A. L.: Amazonia as a carbon source linked to deforestation and climate change, Nature, 595, 388–393, https://doi.org/10.1038/s41586-021-03629-6, 2021a.
Gatti, L. V., Correa, C. C. S., Domingues, L. G., Miller, J. B., Gloor, M., Martinewski, A., Basso, L. S., Santana, R., Crispim, S. P., Marani, L., Neves, R. L.: CO2 Vertical Profiles on Four Sites over Amazon from 2010 to 2018, PANGAEA [data set], https://doi.org/10.1594/PANGAEA.926834, 2021b.
Gatti, L. V., Cunha, C. L., Marani, L., Cassol, H. L. G., Messias, C. G, Arai, E., Denning, A. S., Soler, L. S., Almeida, C., Setzer, A., Domingues, L. G., Basso, L. S., Miller, J. B., Gloor, M., Correia, C. S. C., Tejada, G., Neves, R. A. L., Rajao, R., Nunes, F., Filho, B. S. S., Schmitt, J., Nobre, C., Corrêa, S. M., Sanches, A. H., Aragão, L. E. O. C., Anderson, L., Von Randow, C., Crispim, S. P., Silva, F. M., and Machado, G. B. M.: Increased Amazon carbon emissions mainly from decline in law enforcement, Nature, 621, 318–323, https://doi.org/10.1038/s41586-023-06390-0, 2023.
Gloor, M., Gatti, L., Brienen, R., Feldpausch, T. R., Phillips, O. L., Miller, J., Ometto, J. P., Rocha, H., Baker, T., de Jong, B., Houghton, R. A., Malhi, Y., Aragão, L. E. O. C., Guyot, J.-L., Zhao, K., Jackson, R., Peylin, P., Sitch, S., Poulter, B., Lomas, M., Zaehle, S., Huntingford, C., Levy, P., and Lloyd, J.: The carbon balance of South America: a review of the status, decadal trends and main determinants, Biogeosciences, 9, 5407–5430, https://doi.org/10.5194/bg-9-5407-2012, 2012.
Goulden, M.: AmeriFlux BASE BR-Sa3 Santarem-Km83-Logged Forest, Ver. 3-5, AmeriFlux AMP [data set], https://doi.org/10.17190/AMF/1245995, 2019.
Gourdji, S. M., Karion, A., Lopez-Coto, I., Ghosh, S., Mueller, K. L., Zhou, Y., Williams, C. A., Baker, I. T., Haynes, K. D., and Whetstone, J. R.: A modified Vegetation Photosynthesis and Respiration Model (VPRM) for the Eastern USA and Canada, evaluated with comparison to atmospheric observations and other biospheric models, J. Geophys. Res.-Biogeo., 127, e2021JG006290, https://doi.org/10.1029/2021JG006290, 2022.
Hayek, M. N., Longo, M., Wu, J., Smith, M. N., Restrepo-Coupe, N., Tapajós, R., da Silva, R., Fitzjarrald, D. R., Camargo, P. B., Hutyra, L. R., Alves, L. F., Daube, B., Munger, J. W., Wiedemann, K. T., Saleska, S. R., and Wofsy, S. C.: Carbon exchange in an Amazon forest: from hours to years, Biogeosciences, 15, 4833–4848, https://doi.org/10.5194/bg-15-4833-2018, 2018.
Haynes, K., Baker, I., and Denning, S.: Simple Biosphere Model version 4.2 (SiB4) technical description, Mountain Scholar, Colorado State University, Fort Collins, CO, USA, https://hdl.handle.net/10217/200691 (last access: 14 March 2025), 2020.
Haynes, K. D., Baker, I. T., Denning, A. S., Stöckli, R., Schaefer, K., Lokupitiya, E. Y., and Haynes, J. M.: Representing grasslands using dynamic prognostic phenology based on biological growth stages: 1. Implementation in the Simple Biosphere Model (SiB4), J. Adv. Model. Earth Sy., 11, 4423–4439, https://doi.org/10.1029/2018MS001540, 2019.
Haynes, K. D., Baker, I. T., and Denning, A. S.: SiB4 Modeled Global 0.5-Degree Monthly Carbon Fluxes and Pools, 2000–2018, ORNL DAAC, Oak Ridge, Tennessee, USA, https://doi.org/10.3334/ORNLDAAC/1848, 2021.
Hilton, T. W., Davis, K. J., Keller, K., and Urban, N. M.: Improving North American terrestrial CO2 flux diagnosis using spatial structure in land surface model residuals, Biogeosciences, 10, 4607–4625, https://doi.org/10.5194/bg-10-4607-2013, 2013.
Hu, L., Andrews, A. E., Thoning, K. W., Sweeney, C., Miller, J. B., Michalak, A. M., Dlugokencky, E., Tans, P. P., Shiga, Y. P., Mountain, M., Nehrkorn, T., Montzka, S. A., McKain, K., Kofler, J., Trudeau, M., Michel, S. E., Biraud, S. C., Fischer, M. L., Worthy, D. E., Vaughn, B. H., White, J. W., Yadav, V., Basu, S., and Van Der Velde, I. R.: Enhanced North American carbon uptake associated with El Niño, Science Advances, 5, eaaw0076, https://doi.org/10.1126/sciadv.aaw0076, 2019.
Huete, A. R., Didan, K., Shimabukuro, Y. E., Ratana, P., Saleska, S. R., Hutyra, L. R., Yang, W., Nemani, R. R., and Myneni, R.: Amazon rainforests green-up with sunlight in dry season, Geophys. Res. Lett., 33, L06405, https://doi.org/10.1029/2005GL025583, 2006.
Jacobson, A. R., Schuldt, K. N., Miller, J. B., Oda, T., Tans, P., Andrews, A., Mund, J., Ott, L., Collatz, G. J., Aalto, T., Afshar, S., Aikin, K., Aoki, S., Apadula, F., Baier, B., Bergamaschi, P., Beyersdorf, A., Biraud, S. C., Bollenbacher, A., and Zimnoch, M.: CarbonTracker CT2019B, NOAA Global Monitoring Laboratory, https://doi.org/10.25925/20201008, 2020.
Jiménez-Muñoz, J., Mattar, C., Barichivich, J. Santamaría-Artigas, A. Takahashi, K., Malhi, Y., Sobrino, J. A., and van der Schrier, G: Record-breaking warming and extreme drought in the Amazon rainforest during the course of El Niño 2015, Sci. Rep.-UK, 6, 33130, https://doi.org/10.1038/srep33130, 2016.
Koren, G., van Schaik, E., Araújo, A. C., Boersma, K. F., Gärtner, A., Killaars, L., Kooreman, M. L., Kruijt, B., van der Laan-Luijkx, I. T., von Randow, C., Smith, N. E., and Peters, W.: Widespread reduction in sun-induced fluorescence from the Amazon during the 2015/2016 El Niño, Philos. T. R. Soc. B, 373, 20170408, https://doi.org/10.1098/rstb.2017.0408, 2018.
Kruid, S., Macedo, M. N., Gorelik, S. R., Walker, W., Moutinho, P., Brando, P. M., Castanho, A., Alencar, A., Baccini, A., and Coe, M. T.: Beyond deforestation: carbon emissions from land grabbing and forest degradation in the Brazilian Amazon, Frontiers in Forests and Global Change, 4, 645282, https://doi.org/10.3389/ffgc.2021.645282, 2021.
Liu, J., Wunch, D., Menemenlis, D., Frankenberg, C., Sun, Y., Bloom, A. A., Lee, M., Bowman, K. W., Schimel, D. S., Crisp, D., Gurney, K. R., Eldering, A., Jiang, Z., O'Dell, C. W., Gierach, M., and Parazoo, N. C.: Contrasting carbon cycle responses of the tropical continents to the 2015–2016 El Niño, Science, 358, eaam5690, https://doi.org/10.1126/science.aam5690, 2017.
Luus, K. A., Commane, R., Parazoo, N. C., Benmergui, J., Euskirchen, E. S., Frankenberg, C., Joiner, J., Lindaas, J., Miller, C. E., Oechel, W. C., Zona, D., Wofsy, S., and Lin, J. C.: Tundra photosynthesis captured by satellite-observed solar-induced chlorophyll fluorescence, Geophys. Res. Lett., 44, 1564–1573, https://doi.org/10.1002/2016GL070842, 2017.
Ma, S., Osuna, J. L., Verfaillie, J., and Baldocchi, D. D.: Photosynthetic responses to temperature across leaf–canopy–ecosystem scales: a 15 year study in a Californian oak–grass savanna, Photosynth. Res., 132, 277–291, https://doi.org/10.1007/s11120-017-0388-5, 2017.
Mahadevan, P., Wofsy, S. C., Matross, D. M., Xiao, X., Dunn, A. L., Lin, J. C., Gerbig, C., Munger, J. W., Chow, V. Y., and Gottlieb, E. W.: A satellite-based biosphere parameterization for net ecosystem CO2 exchange: Vegetation Photosynthesis and Respiration Model (VPRM), Global Biogeochem. Cy., 22, GB2005, https://doi.org/10.1029/2006GB002735, 2008.
Matross, D. M., Andrews, A., Pathmathevan, M., Gerbig, C., Lin, J. C., Wofsy, S. C., Daube, B. C., Gottlieb, E. W., Chow, V. Y., Lee, J. T., Zhao, C., Bakwin, P. S., Munger, J. W., and Hollinger, D. Y.: Estimating regional carbon exchange in New England and Quebec by combining atmospheric, ground-based and satellite data, Tellus B, 58, 344–358, https://doi.org/10.1111/j.1600-0889.2006.00206.x, 2006.
Mendes, K. R., Campos, S., da Silva, L. L., Mutti, P. R., Ferreira, R. R., Medeiros, S. S., Perez-Marin, A. M., Marques, T. v., Ramos, T. M., de Lima Vieira, M. M., Oliveira, C. P., Gonçalves, W. A., Costa, G. B., Antonino, A. C. D., Menezes, R. S. C., Bezerra, B. G., and Santos e Silva, C. M.: Seasonal variation in net ecosystem CO2 exchange of a Brazilian seasonally dry tropical forest, Sci. Rep., 10, 9454, https://doi.org/10.1038/s41598-020-66415-w, 2020.
Mohammadi, K., Jiang, Y., and Wang, G.: Flash drought early warning based on the trajectory of solar-induced chlorophyll fluorescence, P. Natl. Acad. Sci. USA, 119, e2202767119, https://doi.org/10.1073/pnas.2202767119, 2022.
Naus, S., Domingues, L. G., Krol, M., Luijkx, I. T., Gatti, L. V., Miller, J. B., Gloor, E., Basu, S., Correia, C., Koren, G., Worden, H. M., Flemming, J., Pétron, G., and Peters, W.: Sixteen years of MOPITT satellite data strongly constrain Amazon CO fire emissions, Atmos. Chem. Phys., 22, 14735–14750, https://doi.org/10.5194/acp-22-14735-2022, 2022.
O'Dell, C. W., Connor, B., Bösch, H., O'Brien, D., Frankenberg, C., Castano, R., Christi, M., Eldering, D., Fisher, B., Gunson, M., McDuffie, J., Miller, C. E., Natraj, V., Oyafuso, F., Polonsky, I., Smyth, M., Taylor, T., Toon, G. C., Wennberg, P. O., and Wunch, D.: The ACOS CO2 retrieval algorithm – Part 1: Description and validation against synthetic observations, Atmos. Meas. Tech., 5, 99–121, https://doi.org/10.5194/amt-5-99-2012, 2012.
Paca, V. H., Espinoza-Dávalos, G. E., da Silva, R., Tapajós, R., and dos Santos Gaspar, A. B.: Remote sensing products validated by flux tower data in Amazon Rain Forest, Remote Sens.-Basel, 14, 1259, https://doi.org/10.3390/rs14051259, 2022.
Peiro, H., Crowell, S., Schuh, A., Baker, D. F., O'Dell, C., Jacobson, A. R., Chevallier, F., Liu, J., Eldering, A., Crisp, D., Deng, F., Weir, B., Basu, S., Johnson, M. S., Philip, S., and Baker, I.: Four years of global carbon cycle observed from the Orbiting Carbon Observatory 2 (OCO-2) version 9 and in situ data and comparison to OCO-2 version 7, Atmos. Chem. Phys., 22, 1097–1130, https://doi.org/10.5194/acp-22-1097-2022, 2022.
Phillips, O. L. and Brienen, R. J. W.: Carbon uptake by mature Amazon forests has mitigated Amazon nations' carbon emissions, Carbon Balance and Management, 12, 1, https://doi.org/10.1186/s13021-016-0069-2, 2017.
Piao, S., Wang, X., Wang, K., Li, X., Bastos, A., Canadell, J. G., Ciais, P., Friedlingstein, P., and Sitch, S.: Interannual variation of terrestrial carbon cycle: Issues and perspectives, Glob. Change Biol., 26, 300–318, https://doi.org/10.1111/gcb.14884, 2020.
Rastogi, B., Miller, J., Trudeau, M., Andrews, A., Hu, L., Mountain, M., Nehrkorn, T., Baier, B., Mund, J., and Alden, C.: December, Constraints on OCO-2 retrievals to provide robust NEE estimates over North America, AGU Fall Meeting Abstracts (Vol. 2021, A12E-01), https://ui.adsabs.harvard.edu/abs/2021AGUFM.A12E..01R (last access: 14 March 2025), 2021b.
Restrepo-Coupe, N., da Rocha, H. R., Hutyra, L. R., de Araujo, A. C., Borma, L. S., Christoffersen, B., Cabral, O., de Camargo, P. B., Cardoso, F. L., Costa, A. C. L., Fitzjarrald, D. R., Goulden, M. L., Kruijt, B., Maia, J. M. F., Malhi, Y. S., Manzi, A. O., Miller, S. D., Nobre, A. D., von Randow, C., Abreu Safaj, L. D., Sakai, R. K., Tota, J., Wofsy, S. C., Zanchi, F. B., and Saleska, S. R.: LBA-ECO CD-32 Flux Tower Network Data Compilation, Brazilian Amazon: 1999–2006, V2, ORNL DAAC, Oak Ridge, Tennessee, USA, https://doi.org/10.3334/ORNLDAAC/1842, 2021.
Saleska, S.: AmeriFlux BASE BR-Sa1 Santarem-Km67-Primary Forest, Ver. 5-5, AmeriFlux AMP [data set], https://doi.org/10.17190/AMF/1245994, 2019.
Saleska, S. R., Miller, S. D., Matross, D. M., Goulden, M. L., Wofsy, S. C., da Rocha, H. R., de Camargo, P. B., Crill, P., Daube, B. C., de Freitas, H. C., Hutyra, L., Keller, M., Kirchhoff, V., Menton, M., Munger, J. W., Pyle, E. H., Rice, A. H., and Silva, H.: Carbon in Amazon Forests: unexpected seasonal fluxes and disturbance-induced losses, Science, 302, 1554–1557, https://doi.org/10.1126/science.1091165, 2003.
Saleska, S. R., Wu, J., Guan, K., Araujo, A. C., Huete, A., Nobre, A. D., and Restrepo-Coupe, N.: Dry-season greening of Amazon forests, Nature, 531, E4–E5, https://doi.org/10.1038/nature16457, 2016.
Silva Junior, C. H. L., Anderson, L. O., Silva, A. L., Almeida, C. T., Dalagnol, R., Pletsch, M. A. J. S., Penha, T. V., Paloschi, R. A., and Aragão, L. E. O. C.: Corrigendum: fire responses to the 2010 and 2015/2016 Amazonian droughts, Front. Earth Sci., 7, 97, https://doi.org/10.3389/feart.2019.00160, 2019.
Slot, M. and Winter, K.: In situ temperature response of photosynthesis of 42 tree and liana species in the canopy of two Panamanian lowland tropical forests with contrasting rainfall regimes, New Phytol., 214, 1103–1117, https://doi.org/10.1111/nph.14469, 2017.
Tan, Z.-H., Zeng, J., Zhang, Y.-J., Slot, M., Gamo, M., Hirano, T., Kosugi, Y., da Rocha, H. R., Saleska, S. R., Goulden, M. L., Wofsy, S. C., Miller, S. D., Manzi, A. O., Nobre, A. D., de Camargo, P. B., and Restrepo-Coupe, N.: Optimum air temperature for tropical forest photosynthesis: mechanisms involved and implications for climate warming, Environ. Res. Lett., 12, 054022, https://doi.org/10.1088/1748-9326/aa6f97, 2017.
TerraBrasilis: http://terrabrasilis.dpi.inpe.br/queimadas/bdqueimadas/#mapa, Data from Aqua Satellite February–March 2016, last accessed: 5 March 2024.
Trumbore, S., Brando, P., and Hartmann, H.: Forest health and global change, Science, 349, 814–818, https://doi.org/10.1126/science.aac6759, 2015.
Uhl, C., Kauffman, J. B., and Cummings, D. L.: Fire in the Venezuelan Amazon 2: Environmental Conditions Necessary for Forest Fires in the Evergreen Rainforest of Venezuela, Oikos, 53, 176–184, https://doi.org/10.2307/3566060, 1988.
van der Laan-Luijkx, I. T., van der Velde, I. R., Krol, M. C., Gatti, L. V., Domingues, L. G., Correia, C. S. C., Miller, J. B., Gloor, M., van Leeuwen, T. T., Kaiser, J. W., Wiedinmyer, C., Basu, S., Clerbaux, C., and Peters, W.: Response of the Amazon carbon balance to the 2010 drought derived with CarbonTracker South America, Global Biogeochem. Cy., 29, 1092–1108, https://doi.org/10.1002/2014GB005082, 2015.
Winbourne, J. B., Smith, I. A., Stoynova, H., Kohler, C., Gately, C. K., Logan, B. A., Reblin, J., Reinmann, A., Allen, D. W., and Hutyra, L. R.: Quantification of urban forest and grassland carbon fluxes using field measurements and a satellite-based model in Washington DC/Baltimore area, J. Geophys. Res.-Biogeo., 127, e2021JG006568, https://doi.org/10.1029/2021JG006568, 2022.
Wu, J., Guan, K., Hayek, M., Restrepo-Coupe, N., Wiedemann, K. T., Xu, X., Wehr, R., Christoffersen, B. O., Miao, G., da Silva, R., de Araujo, A. C., Oliviera, R. C., Camargo, P. B., Monson, R. K., Huete, A. R., and Saleska, S. R.: Partitioning controls on Amazon forest photosynthesis between environmental and biotic factors at hourly to interannual timescales, Glob. Change Biol., 23, 1240–1257, https://doi.org/10.1111/gcb.13509, 2017.
Zhang, Y., Joiner, J., Alemohammad, S. H., Zhou, S., and Gentine, P.: A global spatially contiguous solar-induced fluorescence (CSIF) dataset using neural networks, Biogeosciences, 15, 5779–5800, https://doi.org/10.5194/bg-15-5779-2018, 2018a.
Zhang, Y., Xiao, X., Wolf, S., Wu, J., Wu, X., Gioli, B., Wohlfahrt, G., Cescatti, A., van der Tol, C., Zhou, S., Gough, C. M., Gentine, P., Zhang, Y., Steinbrecher, R., and Ardö, J.: Spatio-temporal convergence of maximum daily light-use efficiency based on radiation absorption by canopy chlorophyl, Geophys. Res. Lett., 45, 3508–3519, https://doi.org/10.1029/2017GL076354, 2018b.
Zhang, Z., Zhang, Y., Zhang, Y., Gobron, N., Frankenberg, C., Wang, S., and Li, Z.: The potential of satellite FPAR product for GPP estimation: An indirect evaluation using solar-induced chlorophyll fluorescence, Remote Sens. Environ., 240, 111686, https://doi.org/10.1016/j.rse.2020.111686, 2020.