the Creative Commons Attribution 4.0 License.
the Creative Commons Attribution 4.0 License.
 | 07 Apr 2025
Technical note: Flow cytometry assays for the detection, counting and cell sorting of polyphosphate-accumulating bacteria
Clémentin Bouquet
Hermine Billard
Cécile C. Bidaud
Jonathan Colombet
Young-Tae Chang
Joan Artigas
Isabelle Batisson
Karim Benzerara
Fériel Skouri-Panet
Elodie Duprat
Anne-Catherine Lehours
In the context of the ecological sustainability of phosphorus, emerging evidence for the ubiquitous presence of polyphosphate-accumulating bacteria in natural environments invites efforts to reveal their roles in the biogeochemical cycle of phosphorus. This requires high-throughput methods to characterize their structure and dynamics in ecosystems. A promising strategy is to combine the staining of intracellular polyphosphate granules and their subsequent detection by flow cytometry, enabling rapid data acquisition. In this study, we evaluated the potential of this approach by testing various factors that could affect the efficiency and specificity of polyphosphate labeling. Most of our experiments were performed using the 4′,6-diamidino-2-phenylindole dye (DAPI). However, we also carried out a preliminary study using the synthetic fluorochrome JC-D7, a new selective fluorescent dye used for the specific labeling of endogenous polyphosphate in living cells. The assays were performed on Tetrasphaera elongata, a Gram-positive bacterium known to accumulate large amounts of intracellular polyphosphates. We also used six bacterial strains belonging to different phyla, in particular a Gram-negative bacterial strain belonging to the genus Pseudomonas, which is characterized by low levels of cellular polyphosphate. The potential of flow cytometry to quantify and sort polyphosphate-accumulating bacteria in complex environmental samples, including soil, freshwater and sediments, was also examined. Our tests provide useful information for the design of future experiments and highlight the potential pitfalls and limitations of detecting polyphosphate-accumulating bacteria using the cytometric approach. We also show that JC-D7 is a promising dye for achieving these objectives, particularly for enumerating polyphosphate-accumulating bacteria from environmental samples.
- Article
(3839 KB) - Full-text XML
-
Supplement
(779 KB) - BibTeX
- EndNote


Since the “green revolution” of the 1960s, the phosphorus (P) contained in geological deposits has been extracted in large quantities for the production of fertilizers, increasing the input of P into the biosphere 4-fold compared to the pre-industrial era (Falkowski et al., 2000). Over the same period, P storage in terrestrial and freshwater ecosystems increased dramatically (>75 %; Bennett et al., 2001). This P excess has led to deterioration in ecosystem services, notably the formation of hundreds of coastal dead zones associated with eutrophication (Diaz and Rosenberg, 2008). Paradoxically, and by analogy with “peak oil”, a “phosphorus peak” is predicted by 2035 (Cordell et al., 2009, 2011). In order to increase the sustainability of P resource management, it is crucial to significantly improve our knowledge about the detailed processes, fluxes and reservoirs involved in the biogeochemical cycle of P. Microorganisms have been shown to be major actors in modern and past cycles of P as reservoirs and/or as catalysts of processes exchanging P between different reservoirs (Diaz et al., 2008). In this vein, there is emerging evidence of the unexpected and ubiquitous presence of polyphosphate-accumulating bacteria (PAB) in natural environments such as rivers, lakes and soils, inviting efforts to reveal their unknown functions and roles in the context of P availability and cycling (Diaz et al., 2008; Rivas-Lamelo et al., 2017; Akbari et al., 2021; Bidaud et al., 2022).
Intracellular polyphosphates (polyPs) are ubiquitous biopolymers containing between a few and hundreds of orthophosphate residues linked together by phosphoanhydride bonds. Monovalent or divalent metal elements, such as Mg2+, K+, Ca2+ and Na+, can act as counter-ions in polyP polymers, forming complexes with negatively charged phosphate residues (Akbari et al., 2021). PolyPs are found in representatives of all kingdoms of living organisms and every cell type in nature (Lorenzo-Orts et al., 2020; Akbari et al., 2021). Likely a key agent in evolution from prebiotic time (Brown and Kornberg, 2004; Lorentzo-Orts et al., 2020), the functions of polyPs in cells of contemporary organisms are many and varied (Kornberg et al., 1999). PolyPs can serve as a source of energy; as a phosphorylating agent for alcohols, including sugars, nucleosides and proteins; and as a means of activating the precursors of fatty acids, phospholipids, polypeptides and nucleic acids (Rao et al., 2009). In PAB, polyP storage is exacerbated, and polyP granules, which are spherical aggregates, can account for up to 20 % of the dry weight of these bacteria. PAB cells accumulate these polymers at cellular concentrations up to millimoles, for example, as an energy reserve to adapt and survive environmental gradients or to scavenge nutrients (Martin et al., 2014). PolyP accumulation in PAB can have an impact on P biogeochemistry, and PAB are expected to play critical roles as reservoirs or catalysts for P exchange between the geosphere and the biosphere (Diaz et al., 2008; Cosmidis et al., 2014), yet they are still missing from the global P cycle models.
Numerous methodologies to quantify and characterize polyPs have been developed, including chemical, biological, molecular and microscopic approaches (Majed et al., 2012). Most conventional analytical methods (e.g., electron ionization mass spectrometry) require extensive sample preparation, pre-treatment and pre-fractionation procedures. Advanced analytical techniques, such as nuclear magnetic resonance, Raman, Raman-FISH (Fernando et al., 2019) and X-ray spectromicroscopy, require much less pre-treatment and allow polyPs to be characterized with high molecular and spatial resolution (<µm). Although the potential of these approaches in environmental and biological research is clear, their use remains limited due to the cost and accessibility of analysis instruments. Photometric approaches offer an interesting alternative to the methods discussed above and, the most relevant to date, are based on the interaction between polyPs and the 4′,6-diamidino-2-phenylindole fluorochrome (DAPI) (Martin and Van Mooy, 2013). The binding of DAPI to polyPs shifts the wavelength of maximum emission from DAPI and, as a result, the intensity of fluorescence at this shifted wavelength is proportional to the intracellular polyP concentration (Tijssen et al., 1982; Aschar-Sobbi et al., 2008). This principle has played a decisive role in the visual identification of polyP granules in cells. These approaches which combine microscopic observations with DAPI labeling are simple but time-consuming techniques. Unveiling the environmental importance of PAB and their impact on the biogeochemical P cycle requires high-throughput methods to characterize their structure, dynamics and function in complex and heterogeneous environmental samples at high spatial and temporal resolution (Günther et al., 2009). To this end, a promising strategy is to combine the specific staining of intracellular polyP granules in PAB and their subsequent detection by flow cytometry (e.g., Zilles et al., 2002; Günther et al., 2009; Terashima et al., 2020).
Flow cytometry (FCM) is an essential tool in the field of environmental microbiology, enabling rapid data acquisition and multiparametric analyses. In combination with various dyes, FCM can be used to study communities and analyze thousands of microbial cells per second. The ability of fluorescence-activated cell sorting (FACS) also makes FCM a powerful technique for identifying and isolating microbial cells with particular characteristics (Zilles et al., 2002; Terashima et al., 2020). Although FCM has already been applied to detect polyP fluorescence induced by different dyes (Zilles et al., 2002; Terashima et al., 2020), there is still a lack of knowledge about the optimal parameters and the potential pitfalls of the FCM approach for the detection and counting of PAB in the environment.
To evaluate the detection and enumeration of PAB by FCM, we present here a detailed evaluation of a wide range of factors that may affect the quality of the fluorescence signal and, therefore, the efficiency of enumeration from DAPI staining of polyPs. We also compare the staining of polyP with DAPI to that obtained with JC-D7, which is a benzimidazolinium dye. This novel polyP sensor has been shown to be suitable for staining polyPs in living eukaryotic cells and tissues (Angelova et al., 2014) and has recently been used to target polyPs in yeast extracts (Deitert et al., 2024) and planktonic environmental samples (Yang et al., 2024). The assays were performed using Tetrasphaera elongata, which can account for up to 30 % of the total bacteria in an enhanced biological phosphorus removal process (Nguyen et al., 2011). Our analyses also included six bacterial strains affiliated with different phyla, in particular a Gram-negative bacterium belonging to the genus Pseudomonas, which is characterized by low levels of cellular polyPs. Furthermore, we carried out tests on microbial cells from soil, water and lake sediment samples. Our work provides useful information for the design of future experiments by highlighting the potential applications but also the pitfalls and limitations of PAB detection by FCM. It also highlights the JC-D7 dye as a promising fluorescent probe for PAB enumeration in environmental samples.
2.1 Strains and culture conditions
Tetrasphaera elongata Lp2 (DSM 14184), a Gram-positive bacterium well known to accumulate large amounts of intracellular polyPs (up to 30 %–35 % of the total biovolume of bacteria; Nguyen et al., 2011), was used as a “high polyP accumulation” control. Prior to this study, we screened our bacterial strain library at the Laboratoire Microorganismes: Génome et Environnement (LMGE) and identified the Gram-negative strain RX (99 % identity with Pseudomonas trivialis) as having a very low amount of intracellular polyPs (i.e., only a few RX cells have polyPs, and the polyPs in these cells represents only a small fraction of the cell volume). The RX strain was used as a “low polyP accumulation” control. We also compared polyP labeling with DAPI or JC-D7 dye using four Gram-negative strains affiliated with Acinetobacter lwoffii (Pseudomonadales): Flavobacterium sp. (Bacteroidota), Pseudomonas sp. (Pseudomonadales), Stenotrophomonas rhizophila (Pseudomonadales) and the Gram-positive strain Microbacterium hydrocarbonoxydans DSM 16089 (Actinomycetota). The RX strain was isolated from a freshwater sample; the other Gram-negative strains were isolated from samples of decomposing leaf litter. All strains are preserved at the LMGE.
T. elongata cells were grown in NM-1 medium (pH 7.1) containing (per liter) glucose (0.5 g), peptone (0.5 g), monosodium glutamate (0.5 g), yeast extract (0.5 g), K2HPO4 (0.44 g), (NH4)2SO4 (0.1 g) and MgSO4×7 H2O (0.1 g). The other strain cells were grown in plate count agar (PCA) medium (pH 7) containing (per liter) tryptone (5.0 g), yeast extract (2.5 g) and glucose (1.0 g). The culture media were autoclaved (20 min, 121 °C) and then filtered through Stericup® vacuum filtration systems with a porosity of 0.2 µm. Cultures (10 % vol per vol inoculum) were incubated at 28 °C in Falcon® aerobic cell culture flasks fitted with a 0.2 µm hydrophobic membrane, in the dark, and shaken at 100 rpm. The kinetics of strain growth were monitored by measuring the optical density at 600 nm, and subsequent analyses were performed during the exponential phase of growth.
2.2 Environmental samples
The water samples were collected in the water column of Lake Pavin (Auvergne, France) at 54 m depth with an 8 L horizontal Van Dorn bottle and filtered by tangential flow filtration (0.2 µm cartridge) to yield the concentrate. Sediments from the littoral zone of Lake Pavin were sampled using a UWITEC corer (Mondsee, Austria) fitted with a polyvinyl chloride tube (1 m). The upper part (0–5 cm) of the sediment core was collected with a sterile 50 mL pipette. Samples of calcareous or colluvial soils, with neutral to alkaline pH, were taken from six agricultural parcels in Puy de Dôme (Auvergne, France) at a depth of 0–20 cm. Three of these parcels were subjected to conventional farming and the other three to biological farming. The relative bioavailability of inorganic orthophosphate (PO4-P) in soil samples was estimated using the Olsen method (Olsen and Sommers, 1982), which is widely used to determine bioavailable phosphate in soils with neutral to alkaline pH (Amini et al., 2022).
To separate the microbial cells from the sediment or soil particles, 10 mL of 0.01 M sodium pyrophosphate buffer (pH 7.2) was added to 1 g of soil or sediment sample in a 15 mL Falcon® tube and the mixture shaken (280 rpm) at 4 °C for 30 min. The samples were placed for 1 min at 60 W in a sonication bath (Elmasonic S, Elma) and then centrifuged (2 min, 1500 g, 4 °C) (Lavergne et al., 2014). The supernatant was collected and stored for 4 h at 4 °C until analysis.
2.3 Properties of fluorescent dyes and preparation of staining solutions
DAPI (4′,6-diamidino-2-phenylindole), used at a final concentration of less than 1 µg mL−1, is a fluorescent dye that strongly binds to DNA, and the DAPI–DNA complex fluoresces blue, with a maximum emission at 460 nm, after excitation by an ultraviolet (UV, 350 nm) or violet (405 nm) laser (Button and Robertson, 2001). DAPI also forms complexes with polyPs when used at high concentrations (3–50 µg mL−1; Kulakova et al., 2011). DAPI–polyP complexes emit yellow-green fluorescence (525–605 nm range) when excited by a violet laser (Allan and Miller, 1980) (Fig. S1 in the Supplement). In the present study, a stock solution of DAPI (1 mg mL−1, i.e., 2.85 mM) was prepared according to the manufacturer's instructions (Thermo Fischer Scientific, Rockford, USA). Solid DAPI (powder) was dissolved in ultrapure water, aliquoted and stored at −20 °C in the dark. For analysis, DAPI was diluted in the chosen buffer (HEPES (4-(2-hydroxyethyl)-1-piperazine ethane sulfonic acid buffer), Tris-EDTA (tris-hydrochloride and ethylenediaminetetraacetic acid buffer), PBS (phosphate buffer saline) or McIlvaine (citrate phosphate buffer); see Sect. 2.4) before use.
The synthetic fluorochrome JC-D7 is identified as a polyP-specific marker (Angelova et al., 2014). The JC-D7 dye excited at 405 nm shows blue-green fluorescence emission between 480 and 510 nm (Fig. S1). In this study, stock solutions (10 mM) of JC-D7 (Chemical Cellomics Laboratory, South Korea) were prepared in dimethyl sulfoxide (molecular biology grade DMSO, Merck, Darmstadt, Germany), aliquoted and stored at −20 °C in the dark. JC-D7 was diluted at 10 µM in HEPES buffer (see Sect. 2.4) before use.
SYTO®62 fluorophore is a polymethine cyanine dye (cell permeable) that binds to nucleic acids. The DNA–SYTO®62 complex emits red fluorescence (676 nm) without spectral interaction with the polyP–DAPI or polyP–JC-D7 complexes, allowing the co-localization of DNA in PAB cells with polyPs labeled with DAPI or JC-D7 (Fig. S1). In the present study, SYTO®62 stock solution (5 mM; Thermo Fischer Scientific, Rockford, USA) was stored at −20 °C in the dark. For analysis, SYTO®62 was diluted at 1 µM in the chosen buffer (HEPES, Tris-EDTA, PBS or McIlvaine; see Sect. 2.4) before use.
2.4 Preparation of isotonic staining buffers
The isotonic buffers used were as follows:
-
phosphate buffer saline (PBS; 1X; pH 7.2) containing per liter NaCl (8 g), KCl (0.2 g), Na2HPO4 (1.44 g), KH2PO4 (0.24 g) and Milli-Q® water;
-
4-(2-hydroxyethyl)-1-piperazine ethane sulfonic acid buffer (HEPES; 20 mM, pH 7.4) containing per liter 0.48 g of HEPES (Sigma Aldrich, CAS: 7365-45-9) and Milli-Q® water;
-
tris-hydrochloride and ethylenediaminetetraacetic acid buffer (Tris-EDTA; pH 7.4) containing a 10 mM Tris-HCl solution and a 1 mM EDTA solution (Merck KGaA, Darmstadt, Germany);
-
citrate phosphate buffer (McIlvaine; pH 7.2) containing per liter 869.5 mL of a 0.2 M Na2HPO4 solution, 115.5 mL of a 0.1 M citric acid solution and Milli-Q® water.
The buffers were sterilized by filtration on a 0.2 µm filter (Minisart® syringe filter, Sartorius).
2.5 Treatments tested to define the optimum conditions for polyP staining with DAPI and sample storage conditions
To determine optimal conditions for intracellular polyP staining, T. elongata (TE) and RX cell culture samples were subjected to different treatments, including different types of staining buffer (PBS, HEPES, Tris-EDTA, McIlvaine), percentages of fixative used (2 % and 4 % of formaldehyde, Merck KGaA, Darmstadt, Germany), storage temperatures (4, −20, −80 °C), storage times (1 h and 2, 7, 14 d) and detergent addition (0 % and 0.3 % Triton X100, Sigma CAS: 9002-93-1). Formaldehyde is a 37 % commercial solution (CAS: 50-00-0) then diluted directly in the sample.
2.6 Flow cytometric (FCM) analysis of PAB after DAPI staining
The samples (final volume 200 µL) were analyzed using a BD LSR Fortessa™ X-20™ flow cytometer (BD BioSciences, San Jose, CA, USA) in a three-laser configuration (405 nm, 50 mW; 488 nm, 60 mW; and 640 nm, 40 mW). Samples were diluted so that the event rate was less than 3000 cells s−1. Fluorescence intensity, total cell number, forward scatter (FSC) and side scatter (SSC) were recorded. The fluorescence from the DAPI–polyP complexes (excitation at 405 nm) and DNA–SYTO®62 complexes (excitation at 640 nm) was collected with 53030 nm and 67014 nm bandpass filters, respectively. Data were acquired and analyzed on logarithmic scales using FACSDiva™ version 9.0 (BD Biosciences).
2.7 Fluorescence-activated cell sorting (FACS) enrichment of polyP-containing cells stained with DAPI
We analyzed a water sample collected at a depth of 54 m in Lake Pavin and a culture sample of a fresh mixture of T. elongata and RX (50:50 abundance). The samples were centrifuged (4000 g, 20 min, 4 °C), resuspended in PBS solution, stained in the dark with DAPI (28.5 µM, 30 min) and SYTO®62 (1 µM, 10 min), and immediately processed. Analysis and cell sorting were performed with a BD FACSAria™ Fusion SORP cell sorter equipped with a 70 µm nozzle and a 1.5 neutral density filter (BD BioSciences, San Jose, CA, USA) in a three-laser configuration (405 nm, 50 mW; 488 nm, 50 mW; and 640 nm, 100 mW). A forward scatter (FSC) threshold of 200 was used, and DNA was monitored using a 640 nm excitation laser and 670/30 nm emission filter. PolyP fluorescence was monitored using a 405 nm violet laser and a 525/50 nm emission filter. Cell sorting was performed in purity mode, and cells were sorted at a rate of approximately 1500 cells s−1 into two fractions: polyP+ (i.e., positive green fluorescence signal regarding the fluorescence intensity limit defined by the controls) and polyP− (i.e., absence of green fluorescence signal regarding the fluorescence intensity limit defined by the controls). Data were acquired and analyzed on logarithmic scales using FACSDiva™ version 9.0 (BD Biosciences). Cell sorting was performed on a different machine from cell counting because the BD FACSAria™ Fusion SORP cell sorter, which is an extremely efficient cytometer for cell sorting, is cumbersome to set up. Cell counting was therefore performed on a BD LSR Fortessa™ X-20™, which is designed for this purpose. Both instruments have the same lasers and filters, making the analysis comparable, and internal quality control using fluorescent microbeads was used.
2.8 FCM and FACS controls
The settings for morphological (FSC and SSC) and fluorescence (DAPI, SYTO®62, JC-D7) parameters were set on the basis of samples not stained or independently stained by the different fluorochromes. Briefly, for each experiment, unstained cells were used to establish FSC and SSC signal acquisition thresholds. The minimum threshold was established for only FSC. Fluorescence thresholds for each dye (DAPI, JC-D7 and SYTO®62) were achieved by independent staining to determine the positive and negative limits for each. To avoid biases resulting from contamination or chemical interactions, we analyzed each staining buffer alone, with each fluorochrome or with a combination of dyes.
2.9 Observation by epifluorescence microscopy of intracellular polyPs after labeling with DAPI
Control counts of the polyP+ cells were carried out by epifluorescence microscopy. Samples were diluted with PBS (between 105 and 106 cells per sample), filtered through black polycarbonate membranes (0.22 µm porosity, 25 mm diameter, GTBP, Millipore®) and stained for 30 min with DAPI (28.5 µM final concentration). Filters were washed with 2 mL of PBS and incubated in the dark at 20 °C with DAPI (2.85 µM, 10 min) or SYTO®62 (1 µM, 10 min) to visualize cellular DNA. Filters were washed with 2 mL of PBS, dried and mounted with Immersol™ immersion oil (refractive index equals 1.518, Zeiss). It should be noted that in order to use labeling conditions similar to those used in cytometry (i.e., double labeling polyP–DAPI and DNA–SYTO®62), we used double labeling in epifluorescence microscopy (polyP–DAPI and DNA–DAPI). However, single labeling with a high concentration (30 min, 28.5 µM final concentration) of DAPI would have been sufficient.
Cells were imaged using a Zeiss™ Axio Imager 2 microscope equipped with a FLUO COLIBRI 5 source with the following light-emitting diodes: UV (385/30 nm), blue (469/38 nm), green (555/30 nm) and red (631/33 nm). The following bandpass filters were applied: 450/50 nm, 525/50 nm and 690/50 nm for blue DAPI (DNA), green DAPI (polyP) and SYTO®62, respectively. The diode intensity was adjusted as follows: DAPI blue 2 %, DAPI green 100 % and SYTO®62 100 %. PolyP and lipid inclusions are known to emit in the 450–650 nm range when excited at 360 nm, but lipid inclusions can be easily distinguished from polyPs, as the fluorescence intensity of the former is much lower and fades rapidly within a few seconds (Terashima et al., 2020). Therefore, all photographed images were exposed to excitation light for at least 1 min prior to imaging in order to detect consistent and long-lasting bright green-yellow fluorescence from the polyPs. Between 200 and 1000 cells were counted per sample. Images were captured and processed using the Zen 3.3 Blue Edition software.
2.10 Transmission electron microscope coupled with energy dispersive X-ray spectrometry (TEM-EDX)
The samples were fixed with a 2 % formaldehyde solution (final concentration) and collected on 400 mesh copper electron microscopy grids covered with a Formvar film (A03X, Pelanne Instruments, Toulouse, France) by centrifugation (18 000 g, 20 min, 14 °C). After drying, the samples were observed and photographed using a JEOL JEM 2100-Plus transmission electron microscope (TEM), operating at 200 KV (JEOL Ltd., Tokyo, Japan) and equipped with a GATAN RIO 9 M camera (Gatan Inc., Pleasanton, CA, USA). Chemical elements were analyzed in TEM (tilted to 20°) by energy dispersive X-ray spectrometry (EDX) using the X-Max 80 mm2 large area SDD (silicon drift detector; Oxford Instruments, Abingdon-on-Thames, United Kingdom) equipped with the AZtec software (Oxford Instruments, Abingdon-on-Thames, UK) in point mode or map mode.
2.11 Comparison of polyP staining using DAPI or JC-D7 dyes
The samples were stained with JC-D7 for polyP detection (10 µM final concentration, 30 min of incubation in the dark; Angelova et al., 2014) and with SYTO®62 for DNA co-localization (1 µM, 10 min, in the dark). The treatment used as reference was polyP staining with DAPI (28.5 µM final concentration, 30 min in the dark). The FCM analysis and controls were carried out as described in Sect. 2.6 and 2.8. The fluorescence of the polyP–JC-D7 complexes (after excitation at 405 nm) was collected with a 53030 nm bandpass filter (green fluorescence).
2.12 Statistical analyses
Statistical analyses were performed with GraphPad Prism software, version 8.0.1 for Windows (GraphPad Software, La Jolla, CA, USA). After Shapiro–Wilk normality and Brown–Forsythe homoscedasticity tests, the similarities between treatments were evaluated using a one-way ANOVA or a two-way repeated measures ANOVA, with Tukey's post hoc test to make multiple comparisons between the groups or an unpaired Student t test. Data were expressed as the mean ± standard deviation of the mean (mean ± SD). Differences were considered statistically significant if the p value was less than 0.05 (p<0.05).
3.1 Microscopy observations of polyP granules and DAPI–polyP complexes in T. elongata and RX cells
Transmission electron microscopy observations confirmed the presence of one or more intracellular electron-dense granules within the T. elongata cells (Fig. 1a). Although the distribution of carbon within the T. elongata cells was relatively homogeneous, energy dispersive X-ray spectrometry revealed higher amounts of P and oxygen as well as the presence of monovalent (Na+, K+) and divalent (Mg2+) cations in the granules (Figs. 1a and S2 in the Supplement).
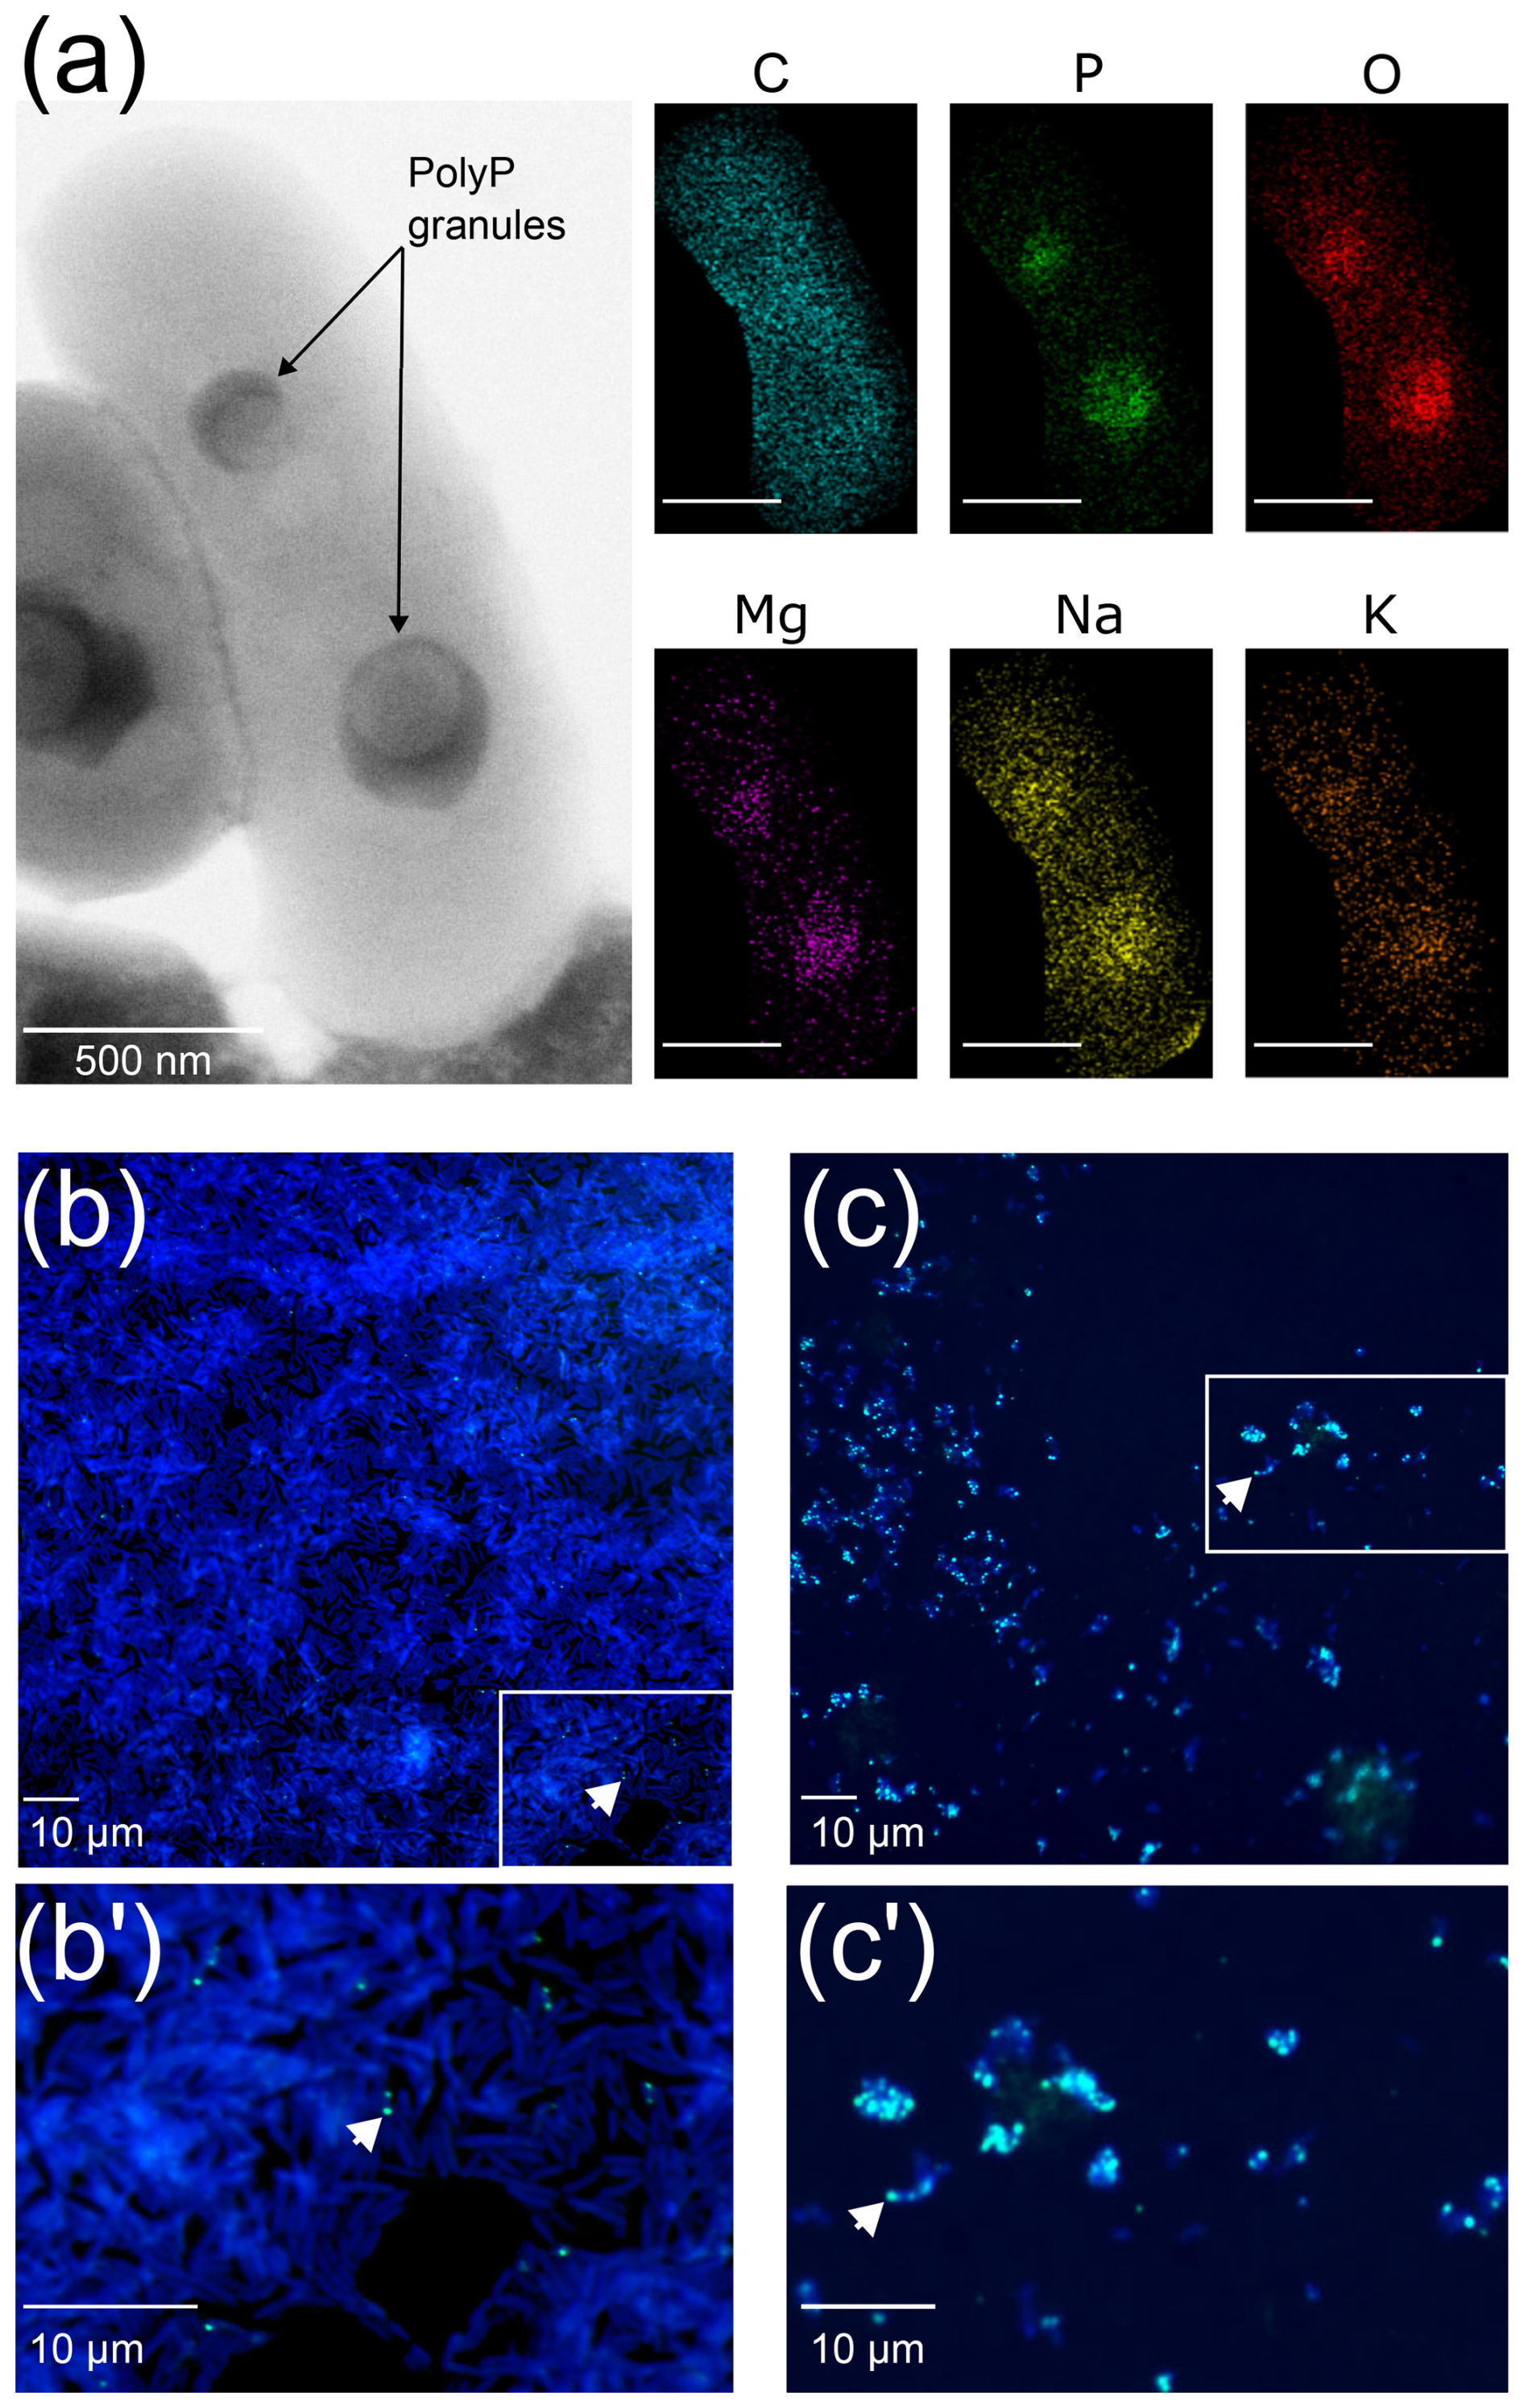
Figure 1Transmission electron microscope coupled with energy dispersive X-ray spectrometry (TEM-EDX) and epifluorescence microscopy images of T. elongata and RX cells. (a) Representative image of two polyphosphate granules in a Tetrasphaera elongata Lp2 cell (DSM 14184) with EDX analysis indicating the chemical composition in and out of the granules. The elements shown are C for carbon (false-colored in blue), O for oxygen (false-colored in red), Na for sodium (false-colored in yellow), Mg for magnesium (false-colored in purple), P for phosphorus (false-colored in green) and K for potassium (false-colored in orange). Scale bars represent 500 nm (bottom left of photographs). (b, c) DAPI-stained images by epifluorescence microscopy of RX and T. elongata cells, respectively. DNA and polyPs emit a blue and a green-yellow fluorescence (examples are shown by white arrows), respectively. Panels (b') and (c') are zooms of the panels delimited by a white rectangle in images (b) and (c), respectively.
Observations by epifluorescence microscopy revealed highly refractive granules that emit fluorescence consistent with that expected for polyPs after labeling with DAPI at 28.5 µM (Figs. 1b and b′, c and c′ and S3 in the Supplement). These observations confirm that the RX strain is a low accumulator (Fig. 1b and b′), whereas the T. elongata strain is a high accumulator (Fig. 1c and c′) of polyPs. The counting of DAPI–polyP complexes in epifluorescence microscopy was used to validate the cytometric data.
3.2 Isotonic buffer for labeling polyPs with DAPI in flow cytometry (FCM)
3.2.1 Staining buffers versus strain populations
The effect of staining buffers on the T. elongata and RX strains was tested in the absence of labeling. The FSC and SSC parameters were analyzed after 0, 10 and 20 min incubation of cells in the following buffers: Tris-EDTA, HEPES, PBS and McIlvaine. The Tris-EDTA buffer affected the RX population with the differentiation of a subpopulation (P2) with incubation time (Fig. 2a), suggesting that Tris-EDTA damaged the cellular integrity of RX cells. Therefore, the Tris-EDTA buffer was excluded from further analyses.
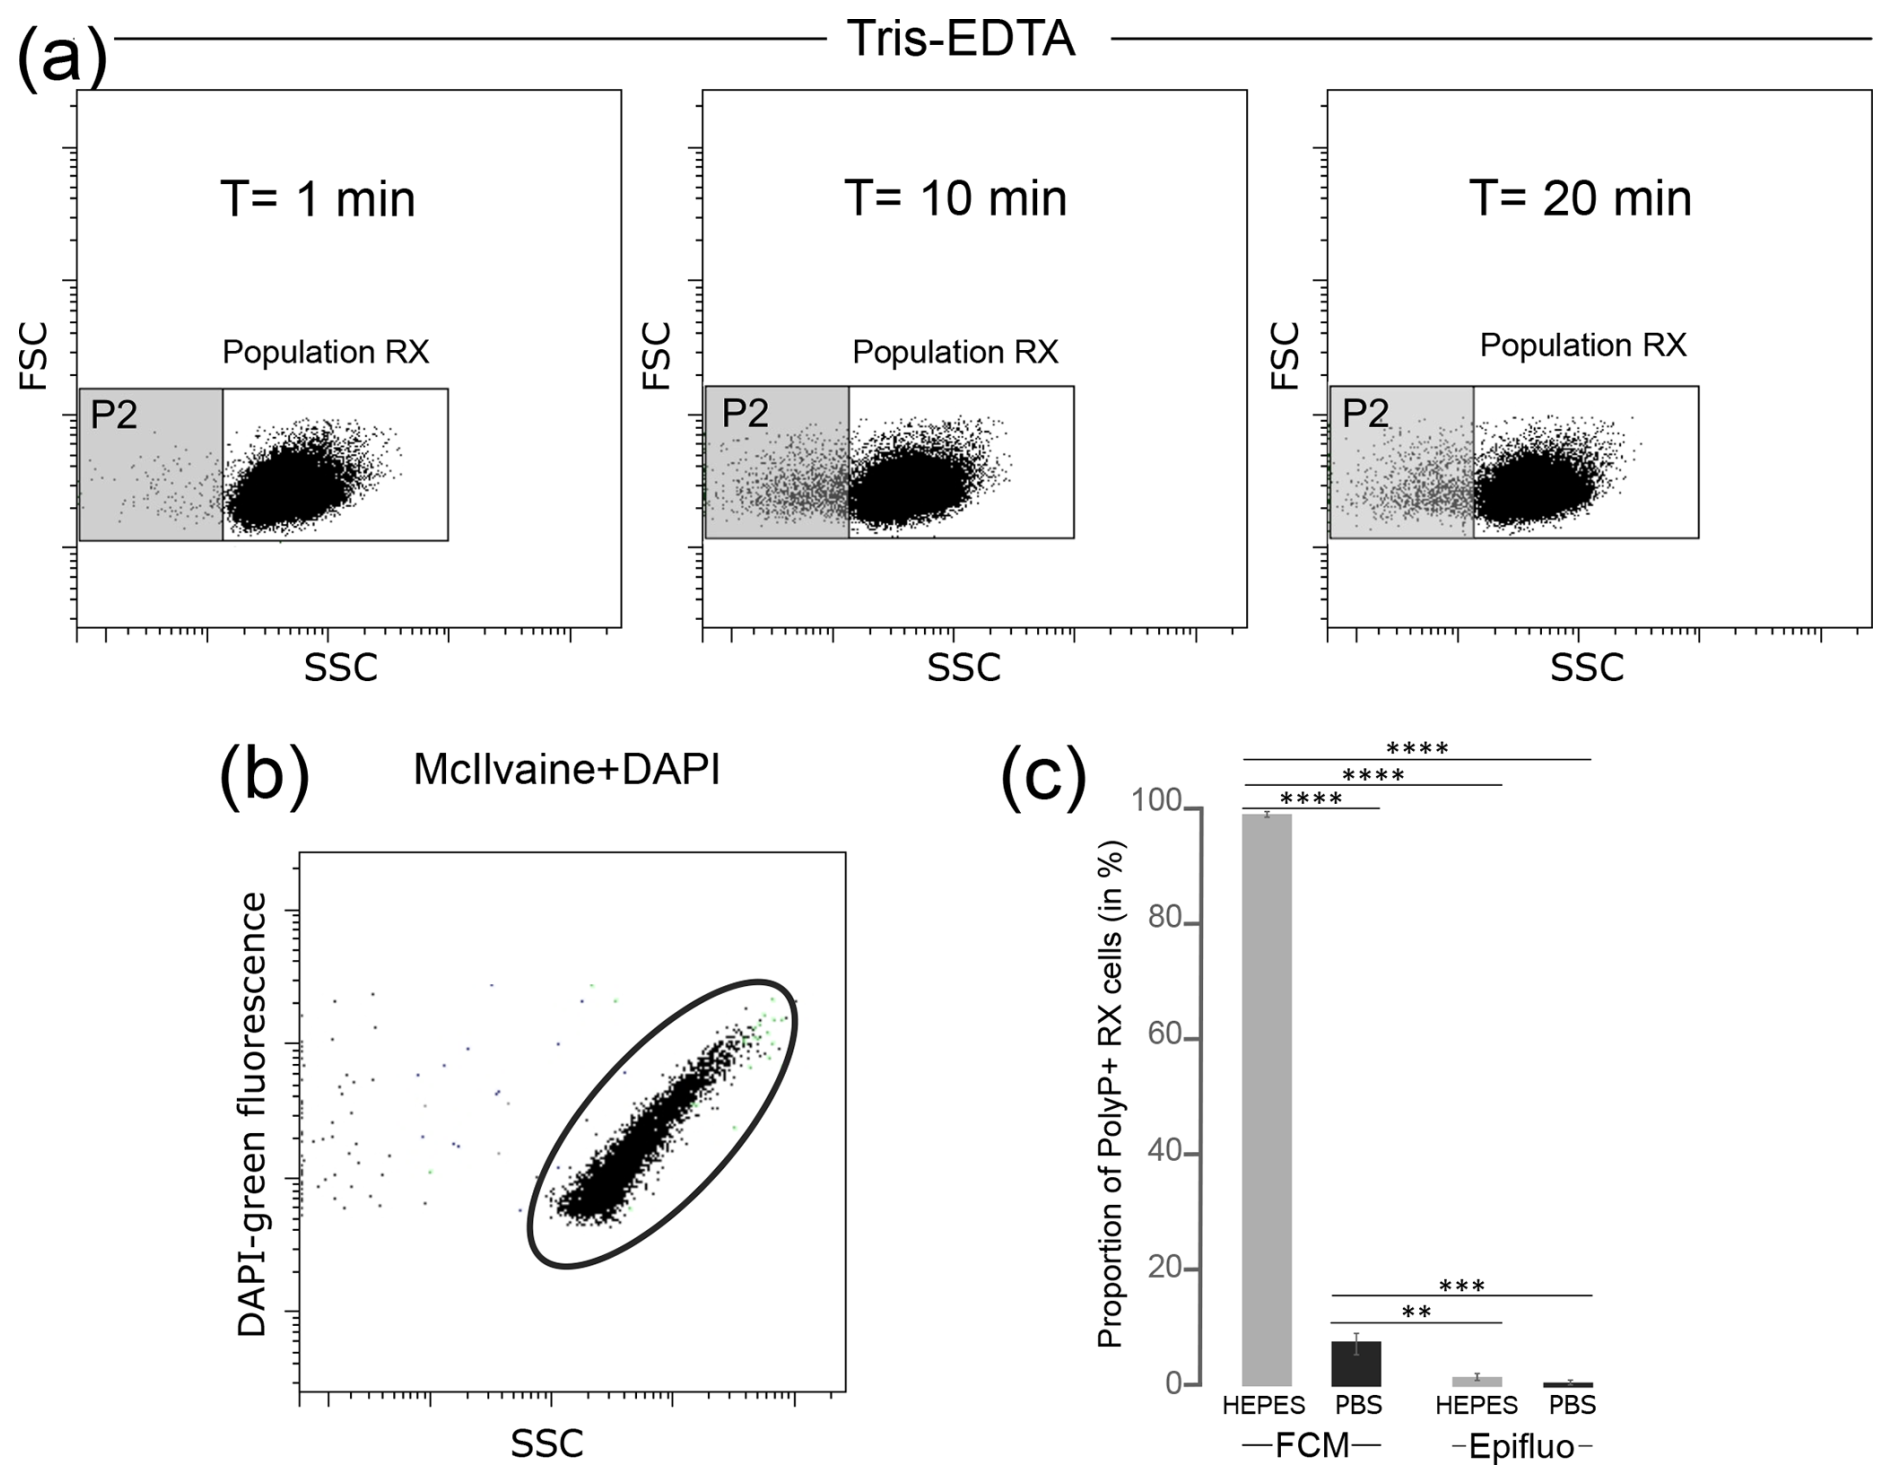
Figure 2Tests of different isotonic buffers for the labeling of polyPs with DAPI in flow cytometry. (a) Cytograms obtained after T=1 min, T=10 min and T=20 min incubation of unlabeled RX cells in Tris-EDTA buffer. (b) Cytogram obtained after DAPI labeling of McIlvaine buffer without cells revealing an artifact signal with green fluorescence. (c) Proportion of polyP+ cells counted by flow cytometry (FCM) or epifluorescence microscopy (Epifluo) after labeling RX cells with DAPI in HEPES or PBS buffer. Significance was determined using the one-way ANOVA test and Tukey's post hoc test for multiple comparisons denoted as follows: , , and . FSC: forward scatter; SSC: side scatter.
3.2.2 Staining buffers versus SYTO®62 and DAPI dyes
The potential interference between dyes and isotonic buffers in the absence of cells was evaluated. No interference was observed between SYTO®62 and the HEPES, PBS and McIlvaine buffers (Table S1 in the Supplement). Negative controls were also validated for DAPI in PBS and HEPES buffers (Table S2 in the Supplement). However, artifact labeling was observed between DAPI and McIlvaine buffer (Table S2), as evidenced by the detection of green fluorescent events in this cell-free buffer (Fig. 2b). The observed fluorescence was not linked to microbial contamination, as shown after the labeling of McIlvaine buffer with SYTO®62 (Table S1). Therefore, the McIlvaine buffer was excluded from further analyses.
3.2.3 Staining buffers versus labeling performance
Cells from T. elongata and RX strain cultures were labeled with the fluorochrome SYTO®62 in PBS or HEPES buffer. The number of total cells counted using the fluorescence of the DNA–SYTO®62 complexes was higher in the HEPES buffer for both strains (Table S3 in the Supplement). The same dye-buffer test was performed after labeling T. elongata and RX cell polyP with DAPI. Counts were carried out in FCM and checked by epifluorescence microscopy. The proportion of T. elongata cells counted by FCM and containing polyPs (polyP+ cells) over the total cells was 82.3 %±0.2 % and 87.5 %±0.1 % in PBS and HEPES buffer, respectively (Table S4 in the Supplement). The controls performed by epifluorescence microscopy after labeling the T. elongata cells with DAPI confirmed these proportions with polyP+ cells accounting for 87.2 %±5.5 % and 92.5 %±2.9 % in PBS and HEPES buffer, respectively (Table S5 in the Supplement). Regardless of the counting method (FCM or epifluorescence microscopy) or buffer (HEPES or PBS), the results for the T. elongata strain are consistent (Table S6 in the Supplement). On the other hand, the proportions of polyP+ cells detected in RX cultures diluted in HEPES (99.9 %±0.0 %) or PBS (7.2 %±2.4 %) buffer and counted by FCM were different (Fig. 2c and Table S7 in the Supplement).
Control counts by epifluorescence microscopy (1.9 %±1 % and 0.9 %±0.5 % for PBS and HEPES, respectively; Table S8 in the Supplement) were significantly different from the FCM (Table S9 in the Supplement), highlighting that the coupling of DAPI staining and FCM is not optimal for low-polyP-accumulating organisms. HEPES buffer, which gives an artifact green fluorescence signal for the Gram-negative RX strain, was excluded and PBS buffer, which is a better option than HEPES buffer, was used for subsequent FCM and FACS analyses. However, PBS buffer is already a compromise and also results in artifact labeling and false positives for the “low polyP accumulation” control strain.
3.3 Permeabilization and storage conditions
3.3.1 Cell permeabilization
To assess the degree of permeability on the efficiency of polyP labeling, RX and T. elongata cells were pre-treated with a synthetic detergent, Triton X-100, or a fixative, formaldehyde. As revealed by cytometry data after labeling with SYTO®62, cell incubation in 0.3 % Triton X-100 induced a cell loss of 43.5 %±5.2 % and 62.7 %±5.2 % for T. elongata and RX, respectively (Table S10 in the Supplement). After 1 h of incubation (day 0), fixation with formaldehyde at a final concentration of 2 % or 4 % had a significant impact on the detection of polyP+ cells for the RX strain compared with the unfixed culture (Fig. 3a, Tables S11 and S12 in the Supplement). No significant difference in the proportion of polyP+ cells was observed for T. elongata fixed with 2 % and 4 % formaldehyde compared to unfixed cells (Fig. 3b, Tables S13 and S14 in the Supplement).
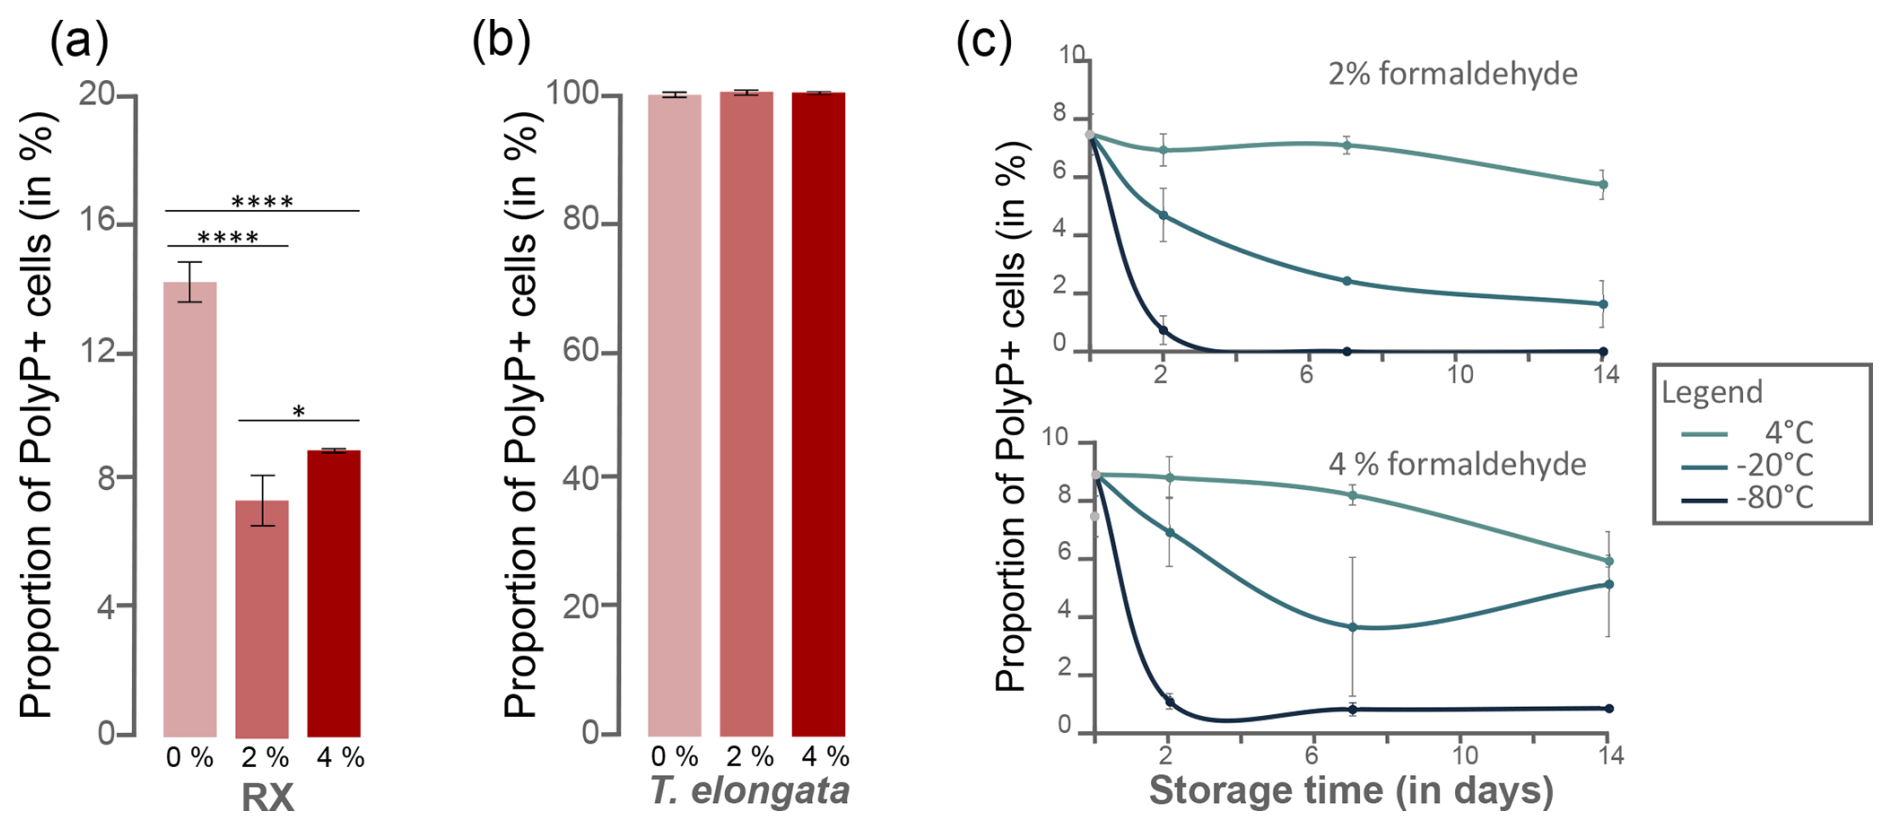
Figure 3Preservation of polyP+ as a function of formaldehyde concentration, temperature and storage time. Proportion of polyP+ cells detected in the (a) RX and (b) T. elongata strain cultures at day 0 without addition of fixative (0 %) and with 2 % and 4 % formaldehyde. Significance was determined using the one-way ANOVA test and Tukey's post hoc test for multiple comparisons, denoted as follows: and . (c) Proportion of polyP+ cells detected in the RX strain culture after fixation at 2 % (top graph) or 4 % (bottom graph) as a function of storage time (2, 7 and 14 d) and storage temperature (4, −20, −80 °C).
3.3.2 Cell preservation
PolyP preservation was assessed after formaldehyde fixation at 2 % or 4 % by investigating the proportion of polyP+ cells detected after different storage times (t=2, 7 and 14 d) and temperatures (4, −20, −80 °C) (Tables S11 and S13). No significant difference was observed for T. elongata strain, whatever the formaldehyde concentration, storage time or temperature (Table S15 in the Supplement). However, storage at −20 or −80 °C is not optimal for the RX strain, whatever the fixative concentration (Fig. 3c and Tables S16 and S17 in the Supplement). For this Gram-negative strain, storage at 4 °C after fixation with 2 % formaldehyde is the most suitable storage condition.
3.4 Validation of the DAPI labeling protocol for polyPs for FACS analyses
First, we prepared a mixed culture of T. elongata and RX. After determining the number of RX and T. elongata cells in each strain culture by FCM and SYTO®62 labeling, we mixed them in a 50:50 abundance ratio. Fluorescence-activated cell sorting (FACS) was performed on this 50:50 mixture (Fig. 4a). We determined the proportion of polyP+ cells by counting them by epifluorescence microscopy and FCM, after labeling with DAPI, prior to cell sorting (Fig. 4b). We also carried out these counts using these two approaches after cell sorting in each of the polyP+ (Fig. 4c and e) and polyP− fractions (Fig. 4d and f). Prior to cell sorting, 36.5 % and 12.6 %±7.5 % of cells were identified as polyP+ in the mixed T. elongata plus RX culture by FCM and epifluorescence microscopy, respectively (Fig. 4b and Table S18 in the Supplement).
After cell sorting, 4.5×10⁶ and 4.3×10⁶ cells were collected in the polyP+ and polyP− (i.e., negative green fluorescence signal regarding the fluorescence intensity limit defined by the controls) fractions, respectively (Fig. 4c and d). A strong enrichment of PAB was observed in the polyP+ fraction, as shown by FCM and epifluorescence microscopy counts (>80 % of polyP+ cells; Fig. 4e and Table S18). In contrast, PAB represented less than 15 % in the polyP− fraction (Fig. 4f and Table S18).
Cell sorting after labeling of polyPs with DAPI and DNA with SYTO®62 was also carried out on a lake water sample (Table S19 in the Supplement). Cells from the water sample were sorted by FACS, and 7.9×10⁶ and 6.3×10⁶ cells were collected in the polyP+ and polyP− fractions, respectively. PolyP+ cells were counted by epifluorescence microscopy before and after cell sorting (Table S19). Prior to cell sorting, the water sample contained 9.7 %±1.5 % of polyP+ cells (Table S19). Target cell enrichment was observed in the polyP+ fraction, with 52 %±1.8 % of polyP+ cells (Table S19). Although highly significant (p<0.0001), this enrichment was much less effective than that obtained with the mixture of T. elongata plus RX strains (Fig. 4).
3.5 Counting of PAB from strain cultures and environmental samples using DAPI or JC-D7 labeling
In parallel to the DAPI labeling of polyPs, tests were performed on fresh bacterial strain cultures or environmental samples using the dye JC-D7, which is known to be specific for polyPs. By staining T. elongata cells in HEPES buffer, as recommended by Angelova et al. (2014), we found that the green fluorescence intensity of JC-D7 at 525 nm was lower than that of DAPI (Fig. S4 in the Supplement). We also performed polyP labeling of cells with JC-D7 in PBS buffer, but this proved to be sub-optimal as it showed weak green fluorescence that was difficult to separate from the fluorescence of the negative controls (Fig. S4).
Culture samples of T. elongata and RX strains and lake sediments were labeled with DAPI or JC-D7 for polyPs and SYTO®62 for DNA. The proportion of polyP+ cells was counted in FCM, and control counts, on the same samples, were carried out using epifluorescence microscopy (Tables S20–S22 in the Supplement). For RX and T. elongata strains, as observed previously (Fig. 4), the DAPI-labeled polyP+ cell counts, although showing significant differences between FCM and epifluorescence microscopy, were in similar proportions (Fig. 5). For the T. elongata strain, the proportion of polyP+ cells after polyP labeling with JC-D7 fluorochrome (93.7 %±1.5 %) was not significantly different from that determined by epifluorescence microscopy (96.3 %±1.9 %; Fig. 5 and Table S20). For the RX strain, the proportions of polyP+ determined by FCM after labeling with JC-D7 (4.8 %±0.3 %) or DAPI (5.8 %±0.5 %) were not significantly different (Fig. 5 and Table S21). These proportions were significantly lower than those obtained after counting by epifluorescence microscopy (12.3 %±1.2 %; Fig. 5 and Table S21). For the lake sediment sample, DAPI and JC-D7 fluorochromes led to a very different detection of polyP+ cells by FCM (82.8 %±2.3 % and 5 %±0.1 % polyP+ cells, respectively; Fig. 5 and Table S22). Control counts by epifluorescence microscopy (10.5 %±7.2 %) were not significantly different from FCM counts after labeling with JC-D7 (Fig. 5 and Table S22).
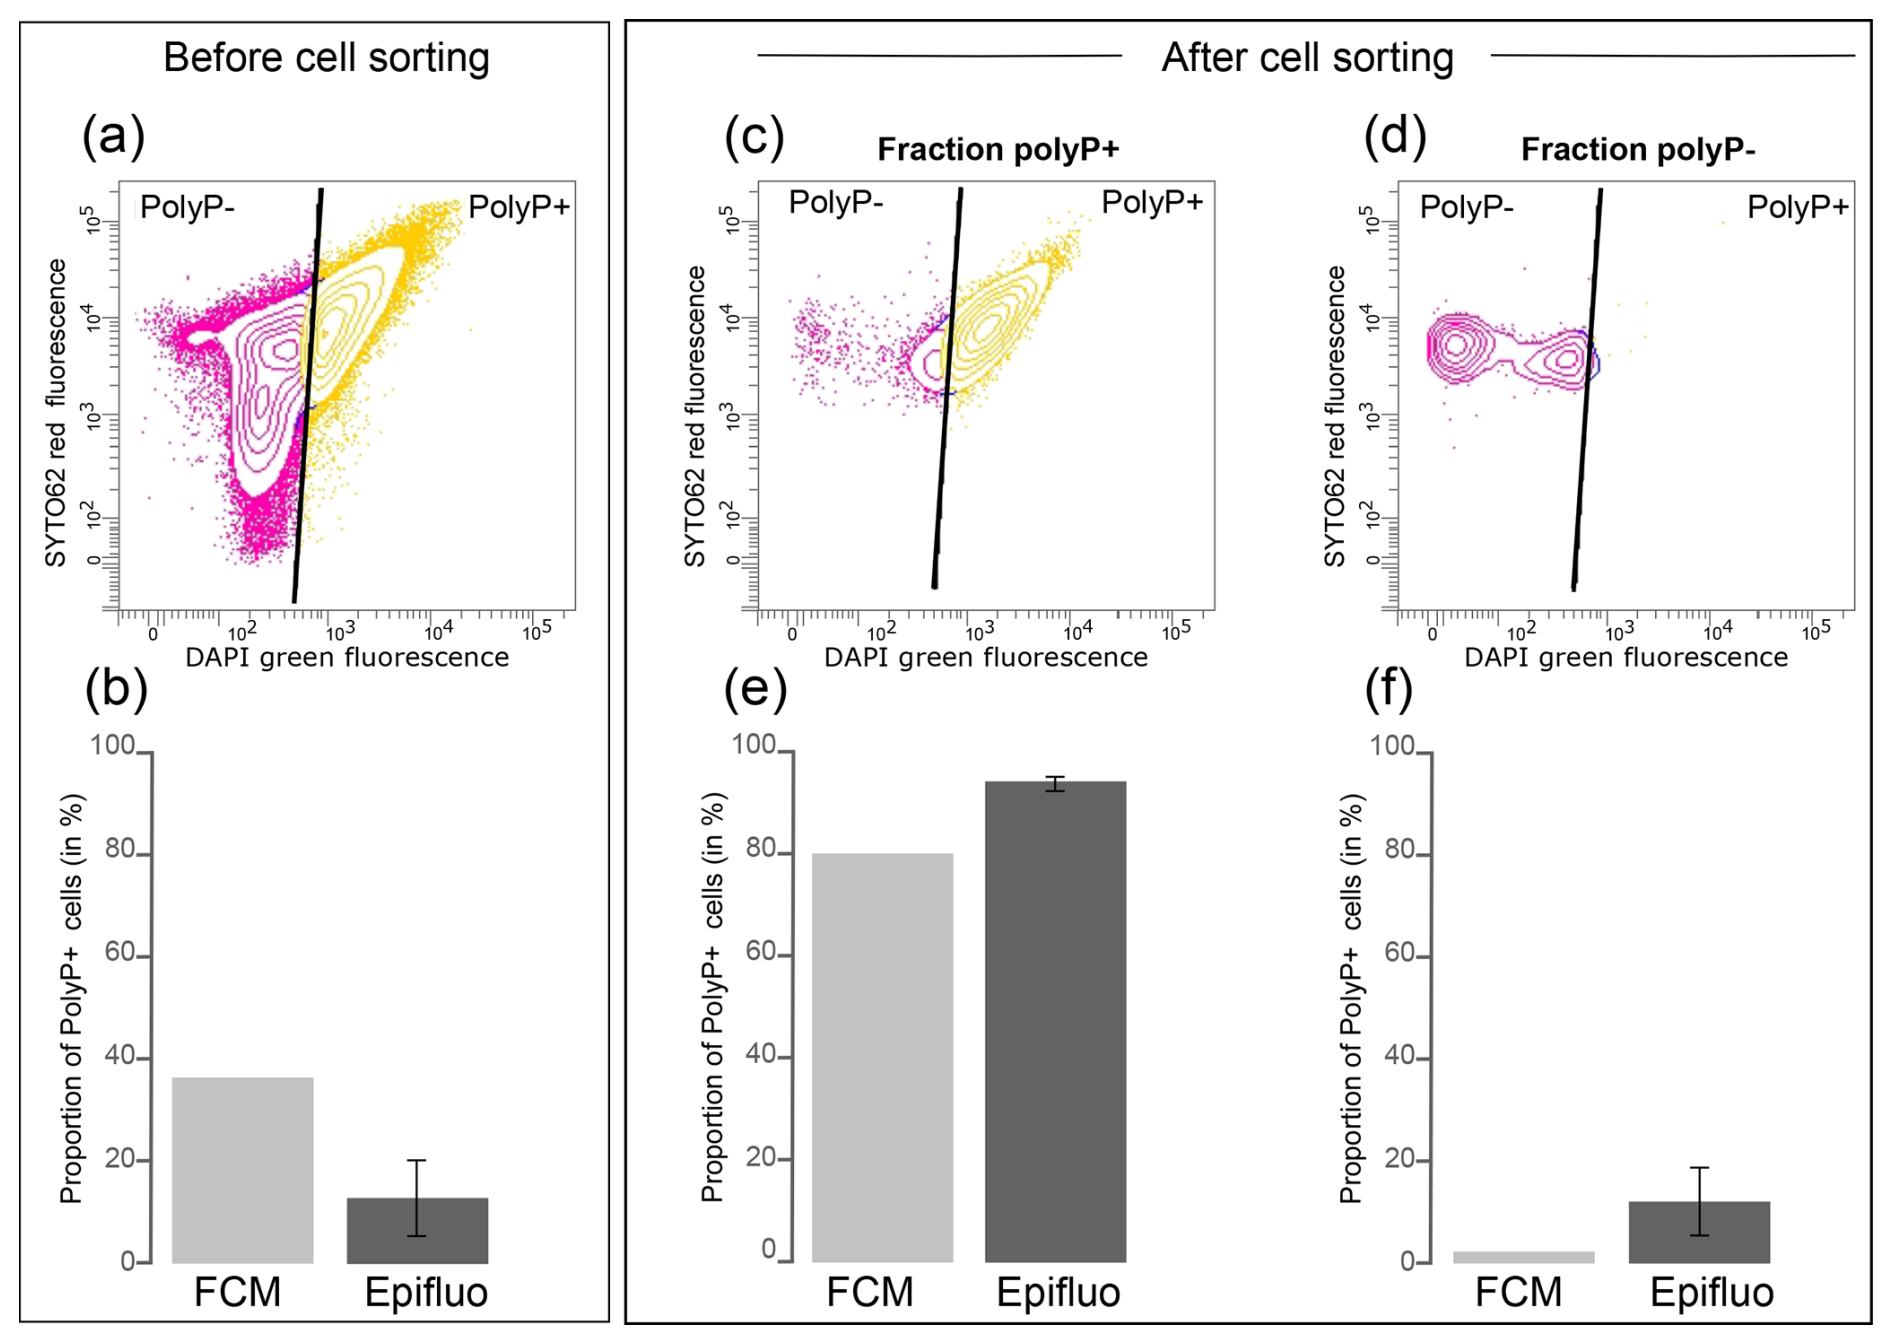
Figure 4PAB cell sorting from a mixed culture of T. elongata and RX. (a) Cytogram showing the fluorescence of polyP–DAPI complexes (green fluorescence) and the fluorescence of DNA–SYTO®62 complexes (red fluorescence) in the mixed culture of T. elongata and RX prior to cell sorting. (b) Proportion of polyP+ cells in the mixed culture of T. elongata and RX, labeled with DAPI prior to cell sorting and counted by flow cytometry (FCM) and epifluorescence microscopy (Epifluo). (c, d) Cytograms showing the fluorescence of polyP–DAPI complexes (green fluorescence) and the fluorescence of DNA–SYTO®62 complexes (red fluorescence) in the (c) polyP+ and (d) polyP− fractions after cell sorting of the mixed culture of T. elongata and RX. (e, f) Proportion of polyP+ cells in fractions (c) polyP+ and (d) polyP− after cell sorting of the mixed culture of T. elongata and RX and counted by flow cytometry (FCM) and epifluorescence microscopy (Epifluo). Standard deviations are not shown for FCM because only one sample was counted per fraction.
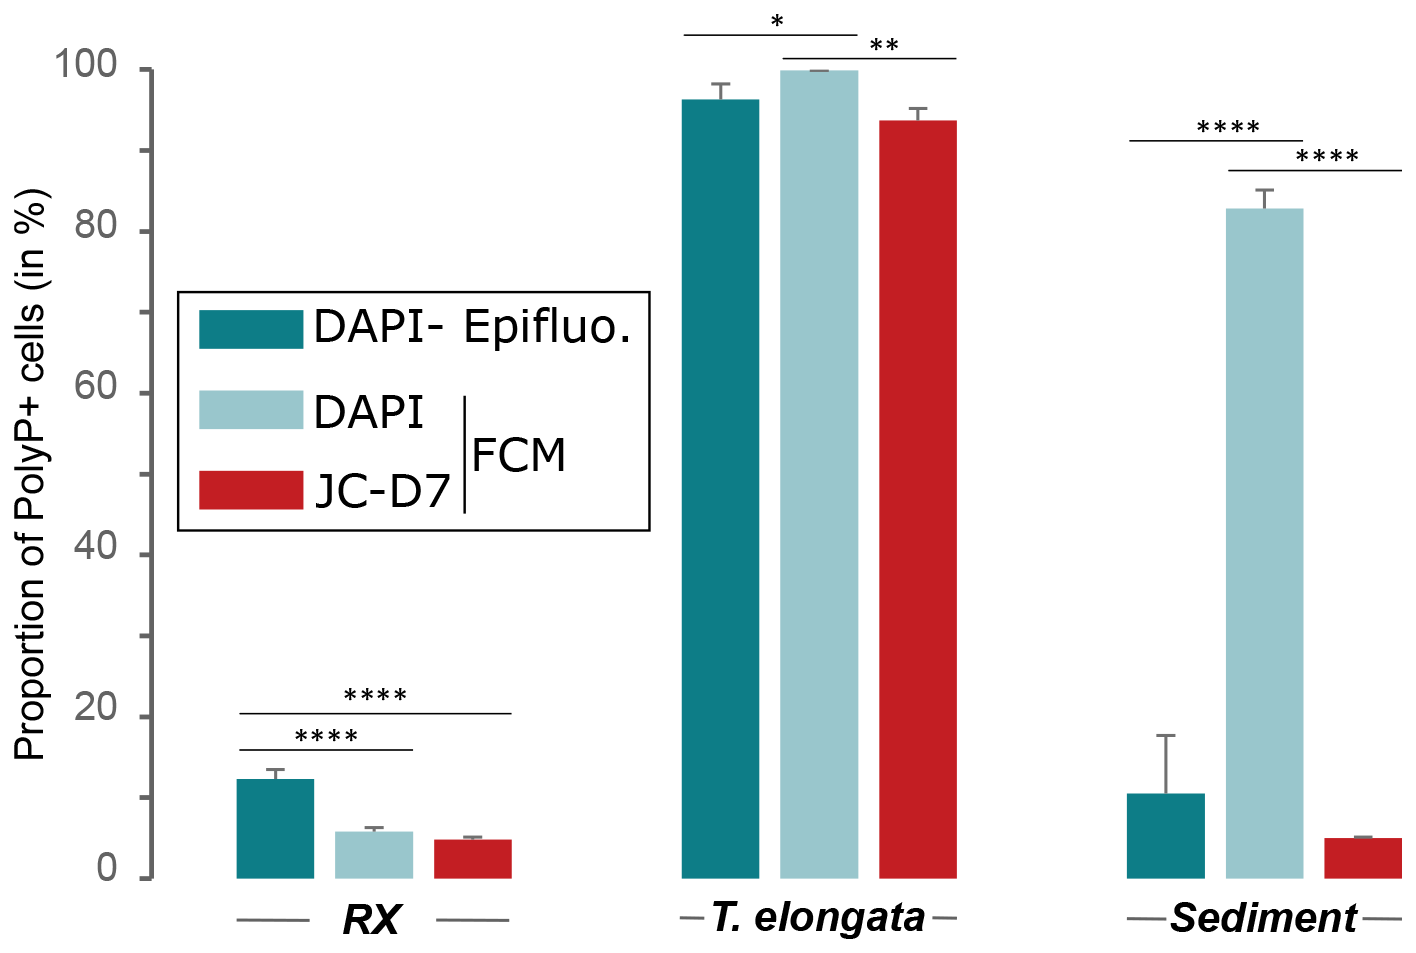
Figure 5Comparison of JC-D7 and DAPI labeling for PAB detection. Proportion of polyP+ cells after PAB labeling with DAPI and SYTO®62 or with JC-D7 and SYTO®62. Cells were counted by flow cytometry (FCM) or epifluorescence microscopy (Epifluo). Significance was determined using the one-way ANOVA test and Tukey's post hoc test for multiple comparisons, denoted as follows: , , and .
Comparative polyP labeling assays using the same methodology were extended to Gram-negative strains belonging to Acinetobacter lwoffii, Flavobacterium sp., Pseudomonas sp., Stenotrophomonas rhizophila and the Gram-positive strain Microbacterium hydrocarbonoxydans DSM 16089. A culture of T. elongata was also included in this series of experiments as a positive control (Fig. 6). In the T. elongata culture, the proportion of polyP+ cells counted by FCM after labeling with DAPI or JC-D7 was not significantly different but was overestimated as shown by the epifluorescence microscopy control counts (Fig. 6a and b, Tables S23 and S24 in the Supplement). For the other strains, no polyP+ cells were visualized by epifluorescence microscopy (data not shown). These observations are consistent with the FCM counts after labeling with DAPI or JC-D7 (Fig. 6c–g and Tables S23 and S24).
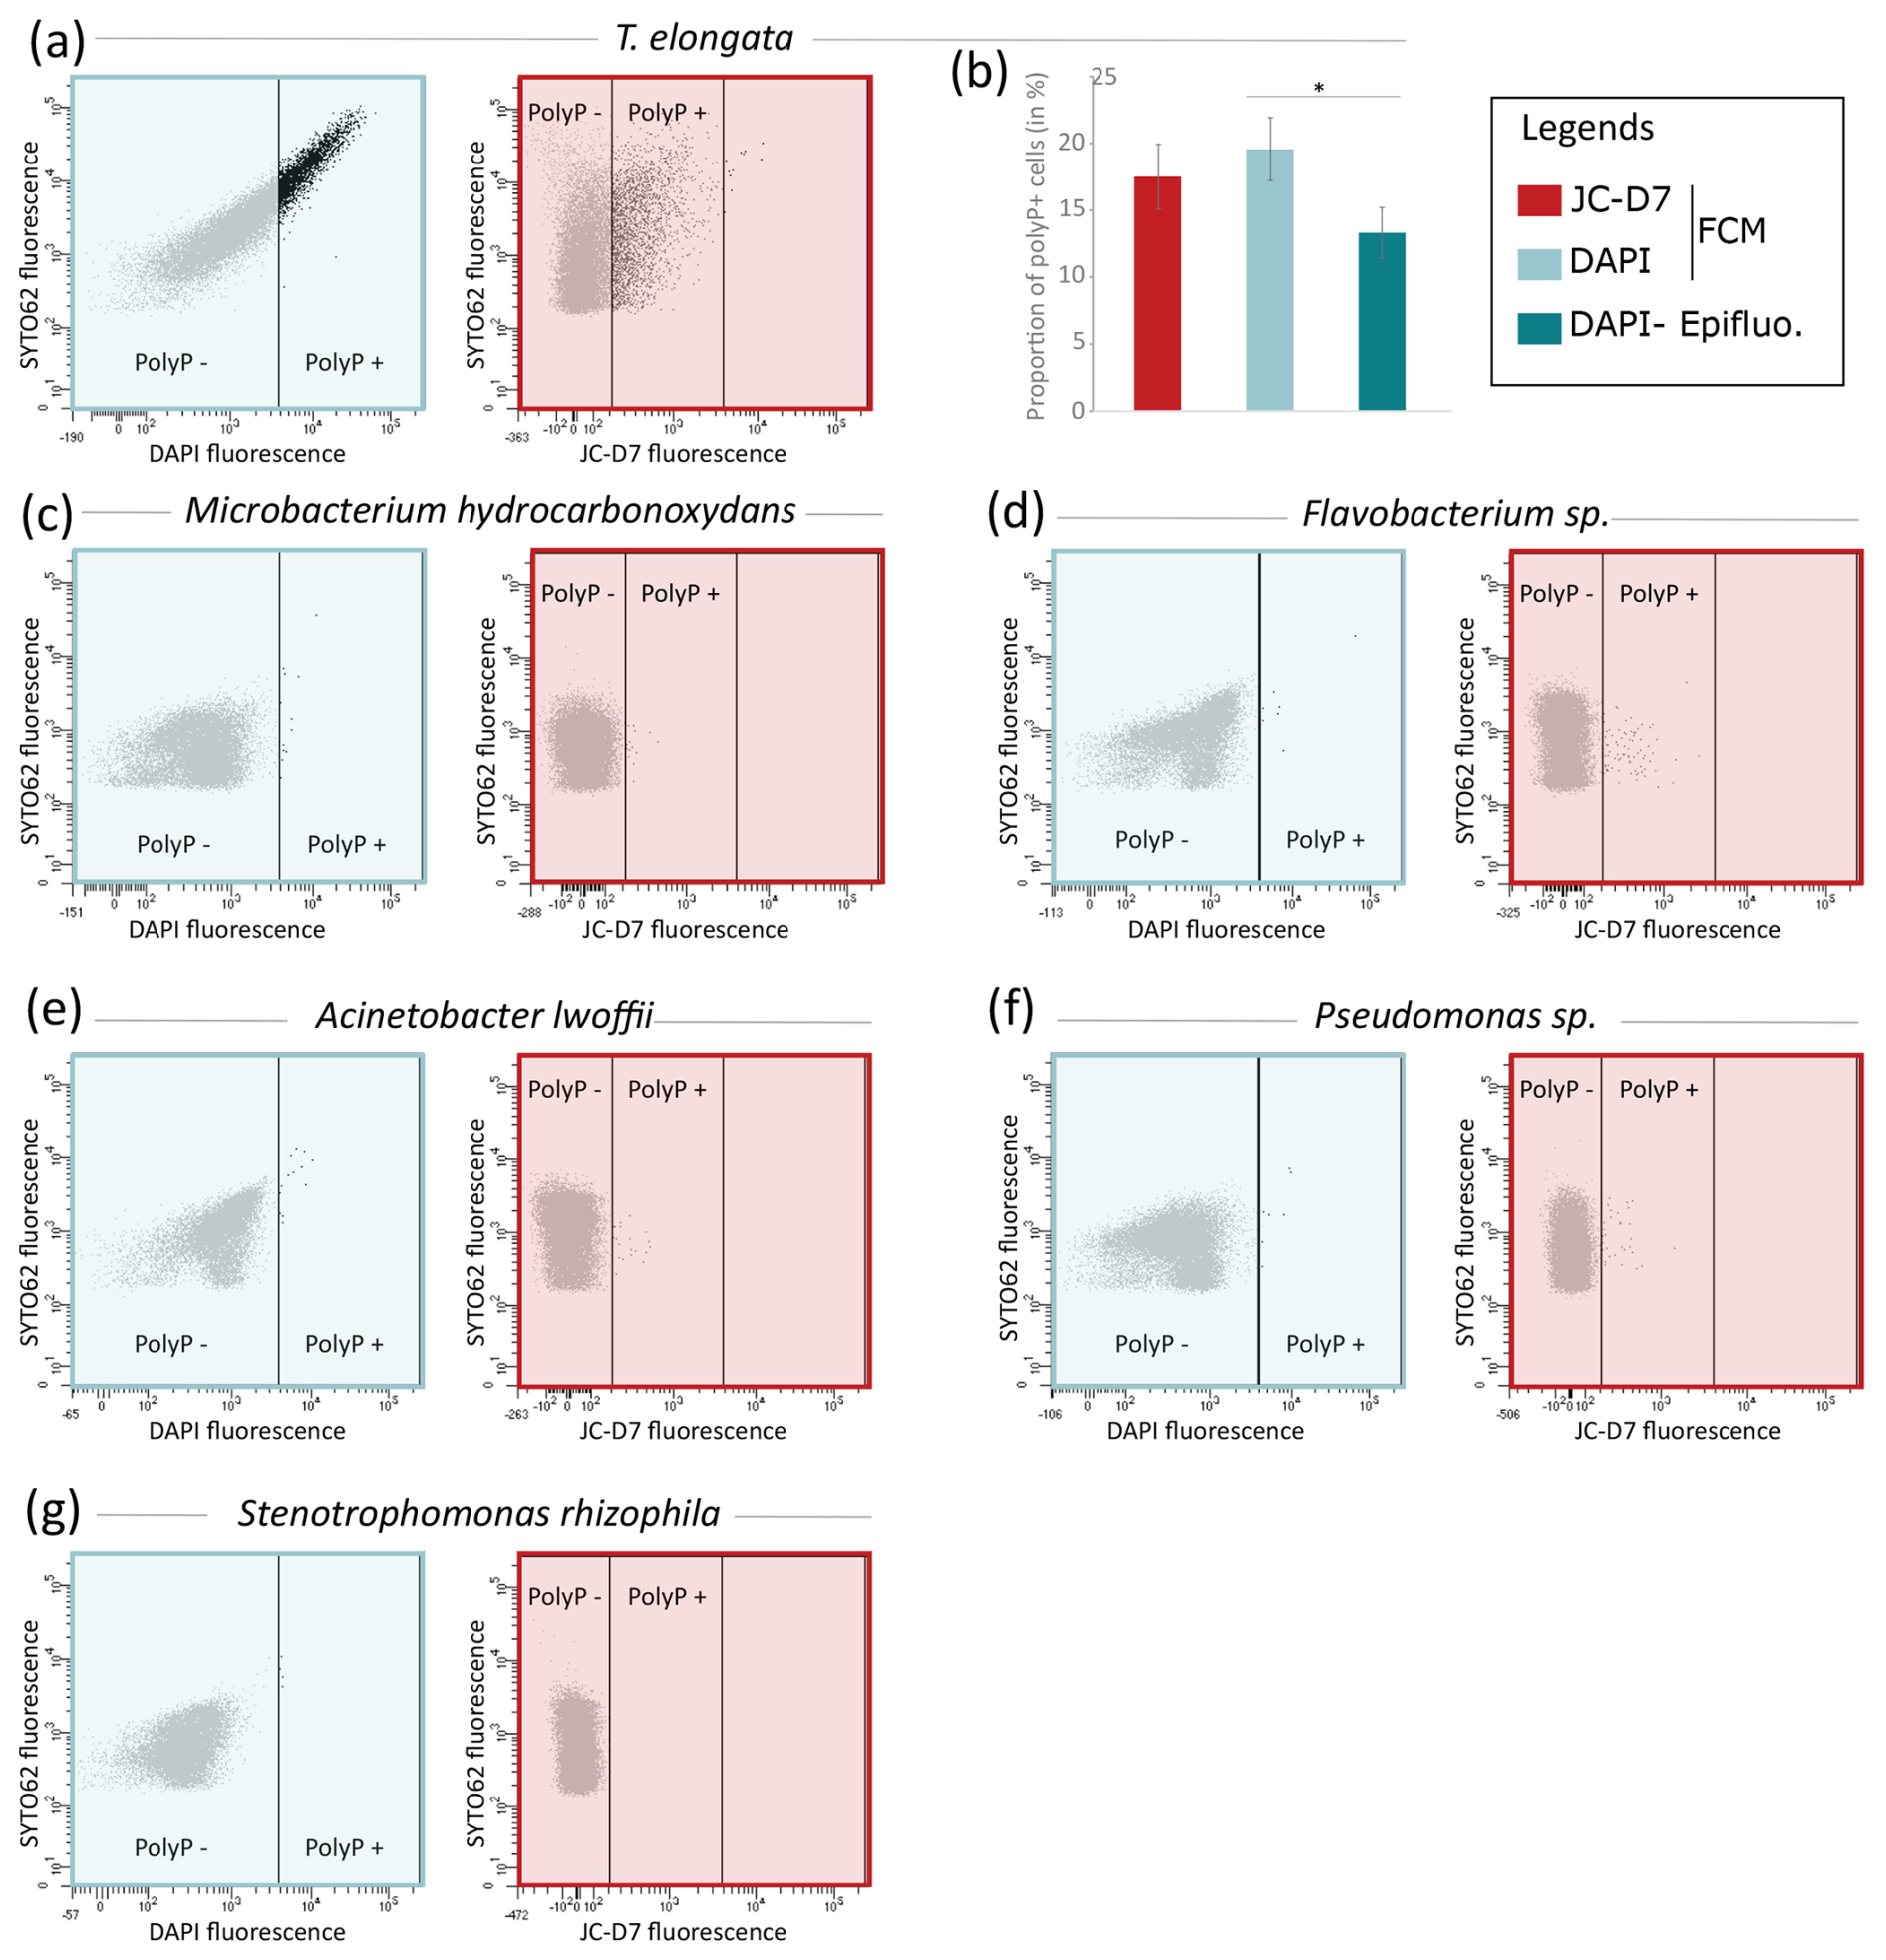
Figure 6JC-D7 and DAPI labeling tests for the detection of polyP+ cells for different bacterial strains. (a) Cytograms showing the fluorescence of polyP–DAPI or polyP–JC-D7 complexes and the fluorescence of DNA–SYTO®62 complexes in the culture of T. elongata. (b) Proportions of polyP+ cells for T. elongata after PAB labeling with DAPI or with JC-D7. Cells were counted by flow cytometry (FCM) or epifluorescence microscopy (Epifluo). Significance was determined using the one-way ANOVA test and Tukey's post hoc test for multiple comparisons, denoted as follows: . (b–g) Cytograms showing the fluorescence of polyP–DAPI (blue box) or polyP–JC-D7 complexes (red box) and the fluorescence of DNA–SYTO®62 complexes in the cultures of (c) Microbacterium hydrocarbonoxydans DSM 16089, (d) Flavobacterium sp., (e) Acinetobacter lwoffii, (f) Pseudomonas sp. and (g) Stenotrophomonas rhizophila.
3.6 Ecological relevance of flow cytometric detection of polyP–JC-D7 complex fluorescence
We tested the ecological relevance of coupling polyP–JC-D7 labeling with flow cytometry by enumerating PAB in soils, sampled in triplicate in conventional (n=3) or organic (n=3) farming parcels with contrasting concentrations of available orthophosphate (Table S25 in the Supplement). Concentrations of bioavailable orthophosphate averaged 72.6 %±34.2 and dry soil in conventional and organic farming parcels, respectively (Fig. 7, Table S25). The relative proportions of PAB were on average 3.7 %±1.4 % and 0.4 %±0.2 % in the conventional and organic parcels, respectively (Fig. 7 and Table S25). A significant positive correlation was observed between the proportion of PAB and the concentration of bioavailable P (r=0.69, p=0.003; Fig. 7).
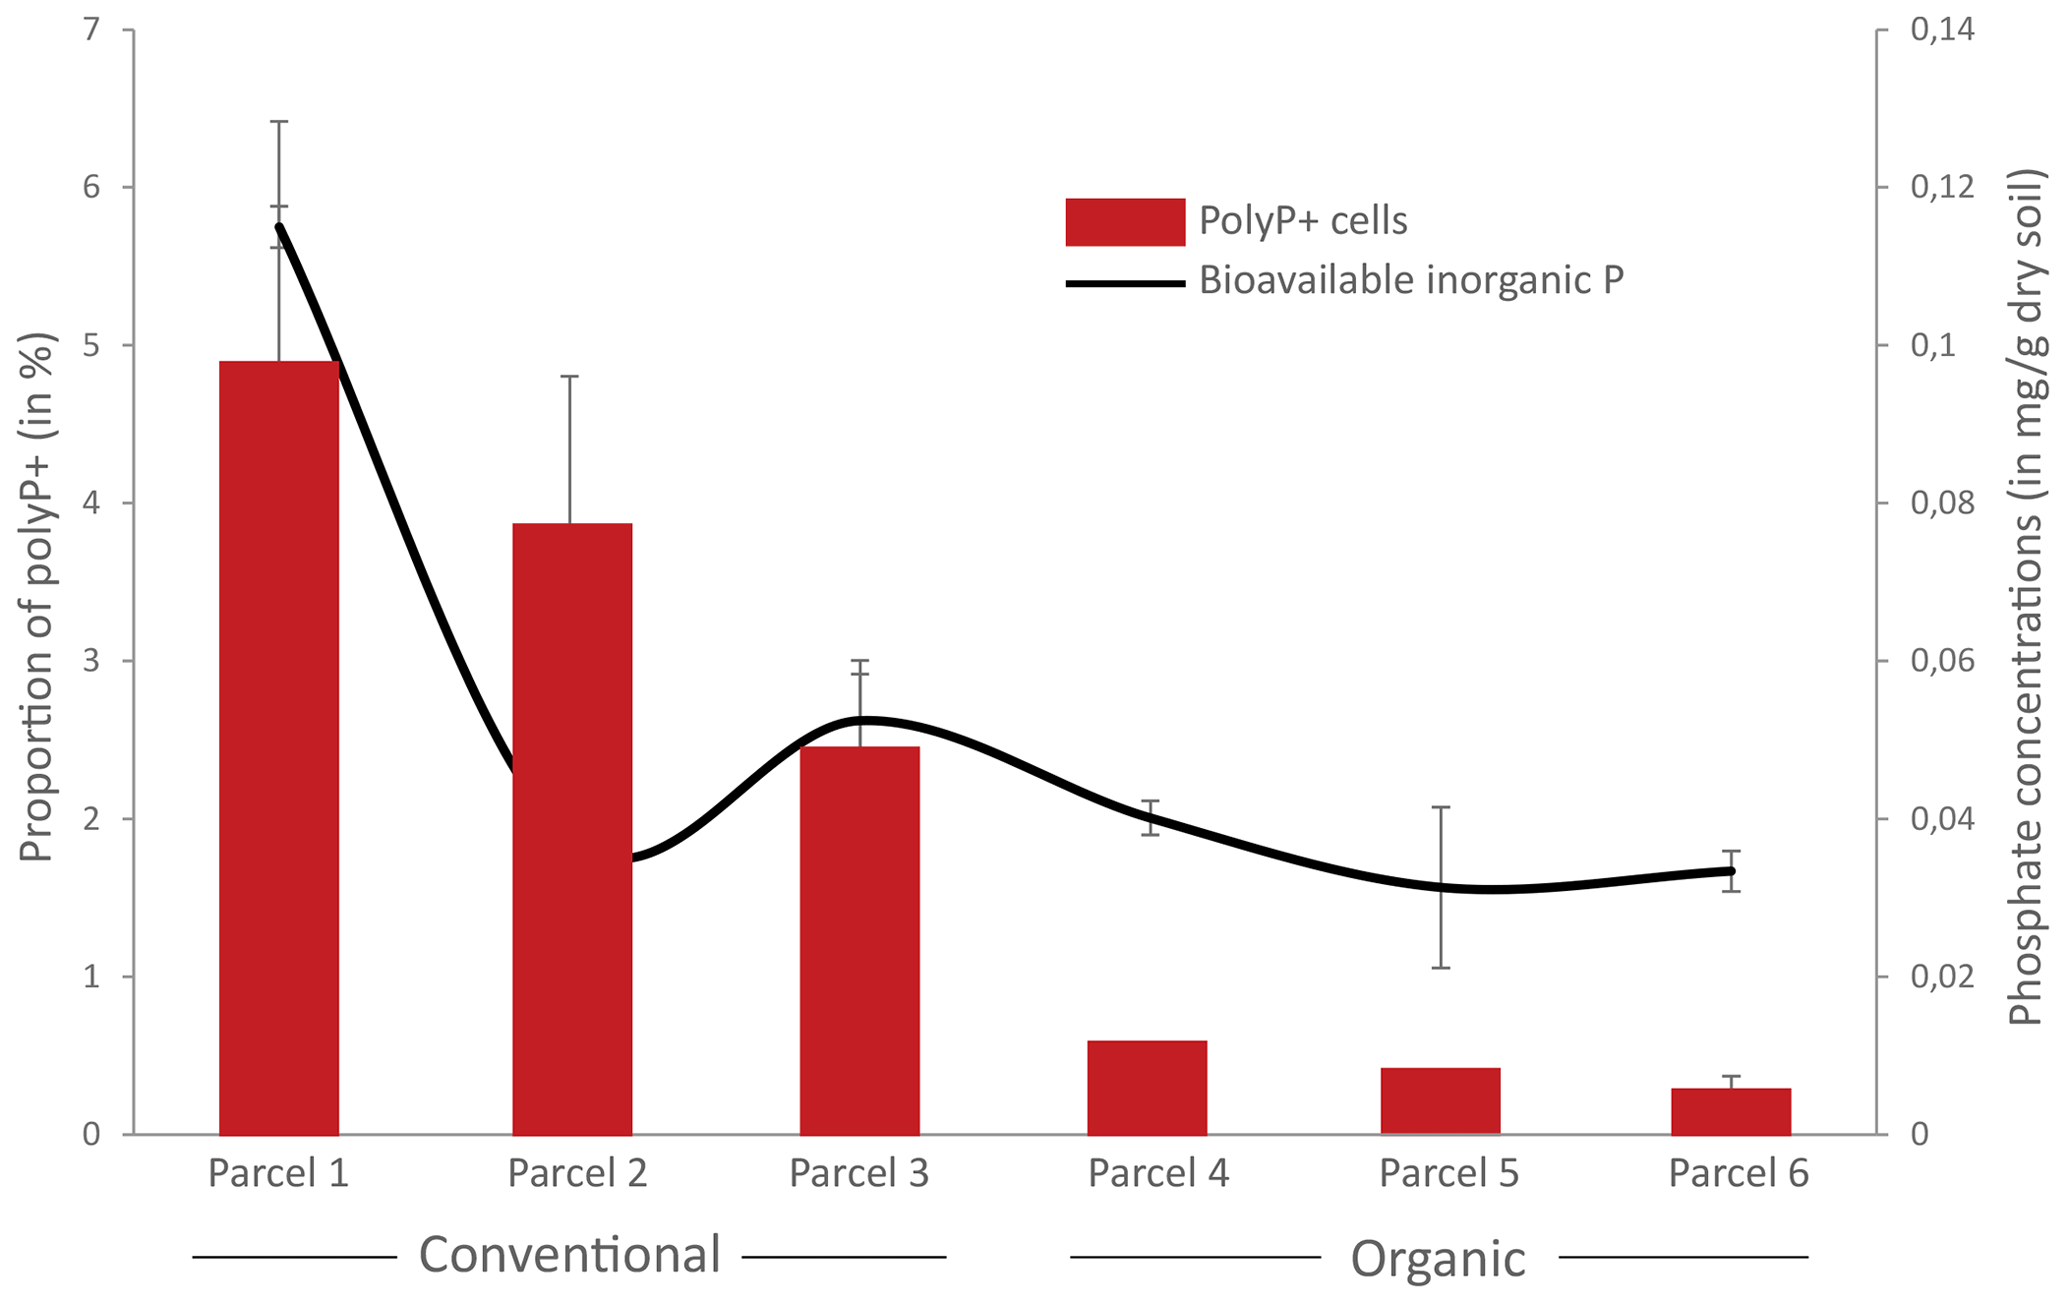
Figure 7Proportion of polyphosphate-accumulating bacteria (PAB) and concentrations of bioavailable orthophosphate in conventional or organic farming parcels. The proportion of polyP+ cells was determined by flow cytometry as the number of cells showing a positive green fluorescence signal after labeling with JC-D7 compared to the total number of cells after labeling with SYTO®62. Concentrations of bioavailable inorganic orthophosphates were estimated by the Olsen extraction method. Error bars are not shown for polyP+ cells for parcels 4 and 5 as only two replicate samples were analyzed.
4.1 Optimization of polyP labeling with DAPI
The coupling of specific polyP detection to FCM has been used in a very small number of studies that have applied standardized conditions previously defined in the literature, for example, for polyP detection by epifluorescence microscopy (e.g., Mesquita et al., 2013; Voronkov and Sinetova, 2019). In this study, we tested several variables likely to affect the efficiency and reliability of PAB detection in the environment. These variables, which include the choice of buffer, fluorochrome, fixative concentration or storage conditions, may seem trivial, but they are essential for defining future standardized protocols and should be acquired as a priority. This will enable the scientific community to avoid pitfalls and save time and effort in carrying out tedious analyses.
Our data show that the parameters for labeling polyPs with DAPI are not necessarily transposable from ad hoc conditions adapted to epifluorescence microscopy and that specific adaptation of the labeling methods is required for the FCM approach. For example, McIlvaine buffer, which has been identified to significantly enhance DAPI–polyP labeling in epifluorescence microscopy (Mukherjee and Ray, 2015), causes events whose size and structure mimic nonviable cells. These observed artifact signals, associated with McIlvaine–DAPI interactions, whose physicochemical origin has not been identified, are highlighted by FCM.
In contrast, the intense fluorescence of green DAPI when cells were labeled in HEPES buffer suggests that the latter is an optimal solvent for the detection of polyPs by flow cytometry. However, this fluorescence detection was artifactual and led to an overestimation of the proportion of polyP+ cells within the Gram-negative RX population as revealed by epifluorescence microscopy observations on the same samples. Based on the tests performed in this study, we conclude that the choice of buffer for labeling polyPs with DAPI should be PBS, which is also a frequently used buffer for labeling DNA with this fluorochrome. However, the PBS buffer is a compromise as false positives were also recorded for the low polyP accumulation control strain.
In addition, we show that membrane permeabilization steps are not necessary for the detection of polyPs by DAPI labeling in FCM. On the contrary, significant losses were recorded in terms of the total number of events and proportions of polyP+ cells with two compounds, a detergent (Triton X100) and a fixative (formaldehyde), which have different modes of action but both permeabilize cell membranes. The effect of fixation on the cytometric analysis of bacteria is well known in ecology (e.g., Kamiya et al., 2007; Troussellier et al., 1993), and a differential effect of fixative between Gram-positive and Gram-negative bacteria has already been observed (Liu et al., 2012).
In order to reconcile this methodological approach with the constraints of environmental studies, which often do not allow samples to be analyzed immediately, the conservation of polyPs was considered. The bias induced immediately after formaldehyde fixation for the detection of PAB did not increase significantly after samples were stored for 14 d at 4 °C for RX and for all storage temperatures for T. elongata. Consequently, we recommend storage, after fixation with 2 % formaldehyde, at 4 °C. This temperature avoids freeze–thaw cycles that could damage cells during repeated analyses of the same sample. It is also compatible with transporting samples from the sampling site under ad hoc conditions.
We also simultaneously applied DNA–SYTO®62 labeling and polyP–DAPI labeling. This double staining, which has not been used in previous studies (e.g., Günther et al., 2009; Terashima et al., 2020), enables the separation of PAB from common autofluorescent contaminants such as aggregates or organic matter. In addition, the choice of SYTO®62 avoids interference with the metachromatic properties of DAPI by using a fluorochrome whose emission spectra are perfectly separable from the green and blue fluorescence of DAPI (Fig. S1).
4.2 Is polyP labeling with DAPI really applicable to FCM in environmental samples?
The number of polyP cells counted by FCM was checked by epifluorescence microscopy, a standard method for quantification and visualization of PAB (Serafim et al., 2002). For almost all the data obtained, the observations by FCM and epifluorescence are significantly different, and especially in natural samples, the differences were striking. Should FCM therefore be recommended for the detection of DAPI-labeled polyPs?
DAPI is an inexpensive dye for which most epifluorescence microscopes and flow cytometers have combinations of excitation and emission filters compatible with the detection of its blue or green fluorescence (e.g., Tarayre et al., 2016). However, DAPI is also a non-specific polyP dye. In addition to labeling DNA (blue fluorescence), it also interacts with lipids, displaying metachromatic properties similar to those of polyPs (Serafim et al., 2002). Although the DAPI–lipid fluorescence is short-lived, with respect to the speed of flow cytometry analysis, it cannot be ignored, whereas in microscopy the longer exposure times for counting make it possible to avoid the artifact counting of lipids.
It should also be noted that FCM and epifluorescence microscopy are different methods, each with its own advantages and pitfalls. The main advantage of flow cytometry is its counting speed, which makes it possible to establish the proportions of PAB in a large sample of cells from the targeted microbial community or population. Collecting hundreds of thousands of events in minutes offers incredible opportunities but also bears certain risks, for example in defining the gating strategy. Microscopy, in turn, allows visualization of the research material but does not count many cells (generally up to 400; Kepner and Pratt, 1994) and often depends on the experimenter. Since the basic assumption of most statistical tests is that samples are randomly and independently selected, the approach of randomly selecting fields of view or squares of an ocular graticule to count bacteria is general practice in epifluorescence microscopy (Kirchman et al., 1982). However, this approach has been shown to produce a significant statistical bias, contributing for example to 60 %–80 % of the total variance in bacteria count data for seawater samples (Kirchman et al., 1982). This could be explained by the fact that the actual distribution of bacterial cells in environmental samples may not be random and thus may contribute to the overestimation or underestimation of total bacterial abundance.
Despite the substantial variation and subjectivity associated with microscopy and flow cytometry, both methods revealed, with appropriate labeling (e.g., appropriate staining buffer), fairly congruent proportions of polyP+ cells for high polyP accumulators in homogeneous samples, i.e., strain culture samples. The method combining FCM and DAPI labeling of polyPs can therefore be applied to such “simple” matrices, for example to screen a heterogeneous pool of PAB cells or a single PAB strain for gene–phenotype linkage analyses. The use of flow cytometry combined with DAPI labeling of polyPs to count PAB in complex matrices such as sediment or freshwater samples can be used for comparative purposes but cannot be recommended as a sole method due to a high risk of overestimation.
Although the FCM–DAPI labeling approach is not reliable for PAB counts in complex samples, our results confirm that PAB can be enriched from the environmental microbial community using FACS and DAPI–polyP labeling, which opens up interesting prospects. Terashima et al. (2020) have demonstrated that ∼70 % of cells remain viable after DAPI staining, enabling effective enrichment and isolation of PAB after FACS-based phenotype screening. This “targeted enrichment” may also be combined with metagenomics (Thompson et al., 2013) to improve recovery of metagenome-assembled genomes of environmental PAB. In light of our data, we acknowledge that this approach will be more effective in the enrichment and isolation of PAB that accumulate large amounts of polyPs.
4.3 The polyP-specific fluorochrome JC-D7 as a prospective marker for complex environmental samples
Considering that DAPI labeling is not suitable for enumerating PAB in environmental samples due to the non-specificity of this fluorochrome, the best option would therefore be to use markers specific to polyPs. This approach was advocated by Günther et al. (2009), who proposed using the bright green fluorescence of the antibiotic tetracycline when it complexes divalent cations acting as a countercharge in polyphosphate granules. Prior to the study presented here, we had carried out assays by labeling cultured strains and/or environmental samples with tetracycline but had not obtained convincing results. Therefore, an exploratory analysis was performed to determine the potential of a heterocycle of the benzimidazole family for the detection of PAB by flow cytometry. Prior to our study, the dye JC-D7, identified as specific for polyPs, had never been used to target PAB but only to stain polyPs in living eukaryotic cells and tissues (Angelova et al., 2014). The JC-D7 dye was shown to allow for specific labeling of synthetic polyPs in vitro as well as endogenous polyPs in living mammalian cells which have a dramatically lower abundance of polyPs compared to microorganisms. In addition, this probe demonstrated high selectivity for the labeling of polyPs that was not sensitive to a number of ubiquitous organic polyphosphates, notably RNA (Angelova et al., 2014).
Although we identified artifactual signals during polyP–DAPI labeling in HEPES buffer for the RX strain (Fig. 2), polyP–JC-D7 labeling was performed in this buffer as recommended by Angelova et al. (2014). Indeed, the fluorescence of JC-D7 in PBS buffer was not optimal, as it showed a weak green fluorescence that was difficult to separate from the fluorescence of the negative controls (Fig. S4). On the other hand, we did not observe any artifactual signals for the Gram-positive and Gram-negative strains tested when polyPs were stained with JC-D7 in HEPES (Fig. 6). The artifacts observed during polyP–DAPI labeling do not appear to be related to erroneous measurements of fluorescence parameters assessed by FCM due to changes in the bacterial membrane of Gram-negative cells caused by the composition of HEPES (e.g., absence of divalent cations; Tomasek et al., 2018).
We show that JC-D7 is a promising marker for the enumeration of polyP-accumulating strains. For example, data obtained on T. elongata show that this JC-D7–FCM approach particularly reveals the variation in the polyP content of microorganisms (e.g., 93.7 %±1.5 % and 17.5 %±2.4 % of polyP+ cells in T. elongata culture; Figs. 5 and 6), a common feature of PAB (Fleming, 1992). The data obtained in the present study show that the cell counts obtained with JC-D7 in FCM on environmental samples were not statistically different from those obtained by epifluorescence microscopy after labeling with DAPI (Fig. 5). JC-D7 looks promising for the use in natural samples and may prove useful in many environmental studies. In this context, we carried out PAB counts in soils with different concentrations of bioavailable orthophosphates. Our data, which show a significant positive correlation between the proportion of PAB and bioavailable orthophosphate concentrations (Fig. 7), are in line with what would be expected in soils (Fleming, 1992), underlining the relevance of this method for obtaining ecological data. Our results show that the JC-D7–FCM coupling could provide a direct method to detect the presence of polyPs in the biomass of soil microorganisms and to enumerate PAB, whereas current methods in these ecosystems only have the potential to indirectly indicate the presence of polyPs, i.e., growth on P-free media and the associated measurement of net changes in the stoichiometry of the microbial biomass and color of the microbial suspension stained by the Neisser method (Capek et al., 2024).
Our work is preliminary, and the relevance of JC-D7 for the study of PAB needs to be confirmed in further studies. Since the publication of our preprint in Biogeosciences Discussions on 2 May 2024, two articles reporting the use of JC-D7 for polyP quantification in microbial samples have been published and have also shown JC-D7 to be very promising and specific. The results of assays using JC-D7 to perform a semi-quantitative polyP assessment in yeast extracts suggest that staining with this dye provides a robust and sensitive method for detecting polyPs (Deidert et al., 2024). These authors showed that the fluorescence of JC-D7 was unaffected by inorganic phosphate up to 50 mM and only slightly affected by other parameters, such as pH and temperature. They also found that trace elements (e.g., FeSO4) and toxic mineral salts (e.g., PbNO3) decreased polyP-induced JC-D7 fluorescence, limiting its applicability to samples containing polyP–metal complexes (Deidert et al., 2024). The JC-D7 dye has also been used to quantify polyPs in planktonic environmental samples because, as in our study, the authors found that DAPI fluorescence greatly overestimated polyPs due to interference (Yang et al., 2024). These authors concluded from their study that polyP quantification using JC-D7 fluorescence overcomes the interference encountered by the DAPI method and provides an efficient, convenient and accurate method of quantifying polyPs in planktonic samples in both culture and natural samples (Yang et al., 2024).
Our study is a first step towards the quantification and enrichment of PAB in natural samples using the JC-D7 dye. The next important step will be to demonstrate the specificity of the JC-D7 labeling of PAB by using fluorescence microscopy to visualize the JC-D7 fluorescence in combination with, for example, scanning electron microscopy combined with energy dispersive spectroscopy (SEM-EDS) to perform co-localization analysis. The development of a standardized protocol to quantify PAB after staining polyPs with the JC-D7 probe using epifluorescence microscopy will require further development, particularly due to the weaker fluorescence of JC-D7 compared to DAPI that we demonstrated in our study. Technical advances in cytometry methods, particularly spectral cytometry, may also allow co-labeling of DAPI and JC-D7. This approach is currently not possible using conventional cytometry because the spectra of polyP–DAPI and polyP–JC-D7 overlap and the detection wavelengths are very close (520 and 530 nm respectively).
More information about data is available upon request.
The supplement related to this article is available online at https://doi.org/10.5194/bg-22-1729-2025-supplement.
CB, HB, CCB, KB, FSP, ED and ACL designed the work. CB, HB, and ACL designed the experiments. ED was responsible for the research project (ANR Phostore). CB, HB, CCB, JC, JA, IB and ACL carried out the experiments. ACL, CB and HB wrote the manuscript, and all the authors revised it.
The contact author has declared that none of the authors has any competing interests.
Publisher's note: Copernicus Publications remains neutral with regard to jurisdictional claims made in the text, published maps, institutional affiliations, or any other geographical representation in this paper. While Copernicus Publications makes every effort to include appropriate place names, the final responsibility lies with the authors.
Clémentin Bouquet was supported by a PhD fellowship from the French Ministry of Education and Research. Cécile Bidaud was supported by the École Doctorale FIRE-Programme Bettencourt. The authors would also like to thank Christopher Lefevre (BIAM, UMR 7265, CEA Cadarache) and Nicolas Menguy (IMPMC, UMR CNRS 7590, Sorbonne university). This work was supported by the Agence Nationale de la Recherche (PHOSTORE: ANR-19-CE01-0005). Young-Tae Chang was supported by the National Research Foundation of Korea (NRF) grant funded by the Korean government (MSIT) (2023R1A2C300453411) and by the Glocal University 30 project (Molecular Imaging Center, POSTECH).
This research has been supported by the Agence Nationale de la Recherche (PHOSTORE: ANR-19-CE01-0005) and the National Research Foundation of Korea (grant no. 2023R1A2C300453411).
This paper was edited by Lucia Fuchslueger and reviewed by two anonymous referees.
Akbari, A., Wang, Z., He, P., Wang, D., Lee, J., Han, I. L., Li, G., and Gu, A. Z.: Unrevealed roles of polyphosphate-accumulating microorganisms, Microb. Biotechnol., 14, 82–87, https://doi.org/10.1111/1751-7915.13730, 2021.
Allan, R. A. and Miller, J. J.: Influence of S-adenosylmethionine on DAPI-induced fluorescence of polyphosphate in the yeast vacuole, Can. J. Microbiol., 26, 912–920, https://doi.org/10.1139/m80-158, 1980.
Amini, M., Antelo, J., Fiol, S., and Rahnemaie, R.: Estimation of phosphate extractability in flooded soils: Effect of solid-solution ratio and bicarbonate concentration, Chemosphere, 303, 135188, https://doi.org/10.1016/j.chemosphere.2022.135188, 2022.
Angelova, P. R., Agrawalla, B. K., Elustondo, P. A., Gordon, J., Shiba, T., Abramov, A. Y., Chang, Y.-T., and Pavlov, E. V.: In situ investigation of mammalian inorganic polyphosphate localization using novel selective fluorescent probes JC-D7 and JC-D8, ACS Chem. Biol., 9, 2101–2110, https://doi.org/10.1021/cb5000696, 2014.
Aschar-Sobbi, R., Abramov, A. Y., Diao, C., Kargacin, M. E., Kargacin, G. J., French, R. J., and Pavlov, E.: High sensitivity, quantitative measurements of polyphosphate using a new DAPI-based approach, J. Fluoresc., 18, 859–866, https://doi.org/10.1007/s10895-008-0315-4, 2008.
Bennett, E. M., Carpenter, S. R., and Caraco, N. F.: Human impact on erodable phosphorus and eutrophication: a global perspective: increasing accumulation of phosphorus in soil threatens rivers, lakes, and coastal oceans with eutrophication, BioScience, 51, 227–234, https://doi.org/10.1641/0006-3568(2001)051[0227:HIOEPA]2.0.CO;2, 2001.
Bidaud, C. C., Monteil, C. L., Menguy, N., Busigny, V., Jézéquel, D., Viollier, E., Travert, C., Skouri-Panet, F., Benzerara, K., Lefevre, C. T., and Duprat, E.: Biogeochemical niche of magnetotactic cocci capable of sequestering large polyphosphate inclusions in the anoxic layer of the Lake Pavin Water Column, Front. Microbiol., 12, 789134, https://doi.org/10.3389/fmicb.2021.789134, 2022.
Brown, M. R. W. and Kornberg, A.: Inorganic polyphosphate in the origin and survival of species, P. Natl. Acad. Sci. USA, 101, 16085–16087, https://doi.org/10.1073/pnas.0406909101, 2004.
Button, D. K. and Robertson, B. R.: Determination of DNA content of aquatic bacteria by flow cytometry, Appl. Environ. Microb., 67, 1636–1645, https://doi.org/10.1128/AEM.67.4.1636-1645.2001, 2001.
Čapek, P., Tupá, A., and Choma, M.: Exploring polyphosphates in soil: presence, extractability, and contribution to microbial biomass phosphorus, Biol. Fert. Soils, 60, 667–680, https://doi.org/10.1007/s00374-024-01829-6, 2024.
Cordell, D., Drangert, J.-O., and White, S.: The story of phosphorus: Global food security and food for thought, Global Environ. Chang., 19, 292–305, https://doi.org/10.1016/j.gloenvcha.2008.10.009, 2009.
Cordell, D., Rosemarin, A., Schröder, J. J., and Smit, A. L.: Towards global phosphorus security: A systems framework for phosphorus recovery and reuse options, Chemosphere, 84, 747–758, https://doi.org/10.1016/j.chemosphere.2011.02.032, 2011.
Cosmidis, J., Benzerara, K., Morin, G., Busigny, V., Lebeau, O., Jézéquel, D., Noel, V., Dublet, A. G., and Othmane, G.: Biomineralization of iron-phosphates in the water column of Lake Pavin (Massif Central, France), Geochim. Cosmochim. Ac., 126, 78–96, https://doi.org/10.1016/j.gca.2013.10.037, 2014.
Deitert, A., Fees, J., Mertens, A., Nguyen Van, D., Maares, M., Haase, H., Blank, L. M., and Keil, C.: Rapid fluorescence assay for polyphosphate in yeast extracts using JC-D7, Yeast, 41, 593–604, https://doi.org/10.1002/yea.3979, 2024.
Diaz, J., Ingall, E., Benitez-Nelson, C., Paterson, D., de Jonge, M. D., McNulty, I., and Brandes, J. A.: Marine polyphosphate: a key player in geologic phosphorus sequestration, Science, 320, 652–655, https://doi.org/10.1126/science.1151751, 2008.
Diaz, R. J. and Rosenberg, R.: Spreading dead zones and consequences for marine ecosystems, Science, 321, 926–929, https://doi.org/10.1126/science.1156401, 2008.
Falkowski, P., Scholes, R. J., Boyle, E., Canadell, J., Canfield, D., Elser, J., Gruber, N., Hibbard, K., Högberg, P., Linder, S., Mackenzie, T., Moore III, B., Rosenthal, Y., Seitzinger, S., Smetacek, V., and Steffen, W.: The global carbon cycle: a test of our knowledge of earth as a system, Science, 290, 291–296, https://doi.org/10.1126/science.290.5490.291, 2000.
Fernando, E. Y., McIlroy, S. J., Nierychlo, M., Herbst, F.-A., Petriglieri, F., Schmid, M. C., Wagner, M., Nielsen, J. L., and Nielsen, P. H.: Resolving the individual contribution of key microbial populations to enhanced biological phosphorus removal with Raman–FISH, ISME J., 13, 1933–1946, https://doi.org/10.1038/s41396-019-0399-7, 2019.
Fleming, N. K.: Polyphosphates and microbial uptake of phosphorus: Studies with soil and solution culture, University of Adelaide, Department of Soil Science, Waite Agricultural Research Institute, https://core.ac.uk/download/pdf/130799004.pdf (last access: 20 November 2024), 1992.
Günther, S., Trutnau, M., Kleinsteuber, S., Hause, G., Bley, T., Röske, I., Harms, H., and Müller, S.: Dynamics of polyphosphate-accumulating bacteria in wastewater treatment plant microbial communities detected via DAPI (4′,6′-diamidino-2-phenylindole) and tetracycline labeling, Appl. Environ. Microb., 75, 2111–2121, https://doi.org/10.1128/AEM.01540-08, 2009.
Kamiya, E., Izumiyama, S., Nishimura, M., Mitchell, J. G., and Kogure, K.: Effects of fixation and storage on flow cytometric analysis of marine bacteria, J. Oceanogr., 63, 101–112, https://doi.org/10.1007/s10872-007-0008-7, 2007.
Kepner, R. L. and Pratt, J. R.: Use of fluorochromes for direct enumeration of total bacteria in environmental samples: past and present, Microbiol. Rev., 58, 603–615, https://doi.org/10.1128/mr.58.4.603-615.1994, 1994.
Kirchman, D., Sigda, J., Kapuscinski, R., and Mitchell, R.: Statistical analysis of the direct count method for enumerating bacteria, Appl. Environ. Microb., 44, 376–382, https://doi.org/10.1128/AEM.44.2.376-382.1982, 1982.
Kornberg, A., Rao, N. N., and Ault-Riché, D.: Inorganic polyphosphate: a molecule of many functions, Annu. Rev. Biochem., 68, 89–125, https://doi.org/10.1146/annurev.biochem.68.1.89, 1999.
Kulakova, A. N., Hobbs, D., Smithen, M., Pavlov, E., Gilbert, J. A., Quinn, J. P., and McGrath, J. W.: Direct quantification of inorganic polyphosphate in microbial cells using 4′-6-diamidino-2-phenylindole (DAPI), Environ. Sci. Technol., 45, 7799–7803, https://doi.org/10.1021/es201123r, 2011.
Lavergne, C., Beaugeard, L., Dupuy, C., Courties, C., and Agogué, H.: An efficient and rapid method for the enumeration of heterotrophic prokaryotes in coastal sediments by flow cytometry, J. Microbiol. Meth., 105, 31–38, https://doi.org/10.1016/j.mimet.2014.07.002, 2014.
Liu, B. Y., Zhang, G. M., Li, X. L., and Chen, H.: Effect of glutaraldehyde fixation on bacterial cells observed by atomic force microscopy, Scanning, 34, 6–11, https://doi.org/10.1002/sca.20269, 2012.
Lorenzo-Orts, L., Couto, D., and Hothorn, M.: Identity and functions of inorganic and inositol polyphosphates in plants, New Phytol., 225, 637–652, https://doi.org/10.1111/nph.16129, 2020.
Majed, N., Li, Y., and Gu, A. Z.: Advances in techniques for phosphorus analysis in biological sources, Curr. Opin. Biotech., 23, 852–859, https://doi.org/10.1016/j.copbio.2012.06.002, 2012.
Martin, P. and Van Mooy, B. A. S.: Fluorometric quantification of polyphosphate in environmental plankton samples: extraction protocols, matrix effects, and nucleic acid interference, Appl. Environ. Microb., 79, 273–281, https://doi.org/10.1128/AEM.02592-12, 2013.
Martin, P., Dyhrman, S. T., Lomas, M. W., Poulton, N. J., and van Mooy, B. A. S.: Accumulation and enhanced cycling of polyphosphate by Sargasso Sea plankton in response to low phosphorus, P. Natl. Acad. Sci. USA, 111, 8089–8094, https://doi.org/10.1073/pnas.1321719111, 2014.
Mesquita, D. P., Amaral, A. L., and Ferreira, E. C.: Activated sludge characterization through microscopy: A review on quantitative image analysis and chemometric techniques, Anal. Chim. Acta, 802, 14–28, https://doi.org/10.1016/j.aca.2013.09.016, 2013.
Mukherjee, C. and Ray, K.: An improved DAPI staining procedure for visualization of polyphosphate granules in cyanobacterial and microalgal cells, Protocol Exchange, 10, https://doi.org/10.1038/protex.2015.066, 2015.
Nguyen, H. T., Le, V. Q., Hansen, A. A., Nielsen, J. L., and Nielsen, P. H.: High diversity and abundance of putative polyphosphate-accumulating Tetrasphaera-related bacteria in activated sludge systems, FEMS Microbiol. Ecol., 76, 256–67, https://doi.org/10.1111/j.1574-6941.2011.01049.x, 2011.
Olsen, S. R. and Sommers, L. E.: Phosphorus, in: Methods of soil analysis: Part 2. Chemical and microbiological properties, edited by: Page, A. L., American Society of Agronomy, Soil Science Society of America, Madison, 403–430, https://doi.org/10.2134/agronmonogr9.2.2ed.c24, 1982.
Rao, N. N., Gómez-García, M. R., and Kornberg, A.: Inorganic polyphosphate: essential for growth and survival, Annu. Rev. Biochem., 78, 605–647, https://doi.org/10.1146/annurev.biochem.77.083007.093039, 2009.
Rivas-Lamelo, S., Benzerara, K., Lefèvre, C. T., Monteil, C. L., Jézéquel, D., Menguy, N., Viollier, E., Guyot, F., Férard, C., Poinsot, M., Skouri-Panet, F., Trcera, N., Miot, J., and Duprat, E.: Magnetotactic bacteria as a new model for P sequestration in the ferruginous Lake Pavin, Geochem. Perspect. Lett., 5, 35–41, https://doi.org/10.7185/geochemlet.1743, 2017.
Serafim, L. S., Lemos, P. C., Levantesi, C., Tandoi, V., Santos, H., and, Reis, M. A. M.: Methods for detection and visualization of intracellular polymers stored by polyphosphate-accumulating microorganisms, J. Microbiol. Meth., 51, 1–18, https://doi.org/10.1016/S0167-7012(02)00056-8, 2002.
Tarayre, C., Nguyen, H. T., Brognaux, A., Delepierre, A., De Clercq, L., Charlier, R., Michels, E., Meers, E., and Delvigne, F.: Characterization of phosphate accumulating organisms and techniques for polyphosphate detection: a review, Sensors, 16, 797, https://doi.org/10.3390/s16060797, 2016.
Terashima, M., Kamagata, Y., and Kato, S.: Rapid enrichment and isolation of polyphosphate accumulating organisms through 4′,6-Diamidino-2-Phenylindole (DAPI) staining with fluorescence-activated cell sorting (FACS), Front. Microbiol., 11, 793, https://doi.org/10.3389/fmicb.2020.00793, 2020.
Thompson, A., Bench, S., Carter, B., and Zehr, J.: Coupling FACS and genomic methods for the characterization of uncultivated symbionts, Method. Enzymol., 531, 45–60, https://doi.org/10.1016/B978-0-12-407863-5.00003-4, 2013.
Tijssen, J. P., Beekes, H. W., and Van Steveninck, J.: Localization of polyphosphates in Saccharomyces fragilis, as revealed by 4′,6-diamidino-2-phenylindole fluorescence, Biochim. Biophys. Acta, 721, 394–398, https://doi.org/10.1016/0167-4889(82)90094-5, 1982.
Tomasek, K., Bergmiller, T., and Guet, C. C.: Lack of cations in flow cytometry buffers affect fluorescence signals by reducing membrane stability and viability of Escherichia coli strains, J. Biotechnol., 268, 40–52, https://doi.org/10.1016/j.jbiotec.2018.01.008, 2018.
Troussellier, M., Courties, C., and Vaquer, A.: Recent applications of flow cytometry in aquatic microbial ecology, Biol. Cell, 78, 111–121, https://doi.org/10.1016/0248-4900(93)90121-T, 1993.
Voronkov, A. and Sinetova, M.: Polyphosphate accumulation dynamics in a population of Synechocystis sp. PCC 6803 cells under phosphate overplus, Protoplasma, 256, 1153–1164, https://doi.org/10.1007/s00709-019-01374-2, 2019.
Yang, X., Gao, R., Zhang, Q., Yung, C. C. M., Yin, H., and Li, J.: Quantification of polyphosphate in environmental planktonic samples using a novel fluorescence dye JC-D7, Environ. Sci. Technol., 58, 14249–14259, https://doi.org/10.1021/acs.est.4c04545, 2024.
Zilles, J. L., Peccia, J., Kim, M. W., Hung, C. H., and Noguera, D. R.: Involvement of Rhodocyclus-related organisms in phosphorus removal in full-scale wastewater treatment plants, Appl. Environ. Microb., 68, 2763–2769, https://doi.org/10.1128/AEM.68.6.2763-2769.2002, 2002.