the Creative Commons Attribution 4.0 License.
the Creative Commons Attribution 4.0 License.
 | 16 Apr 2025
Ocean alkalinity enhancement (OAE) does not cause cellular stress in a phytoplankton community of the subtropical Atlantic Ocean
Leonardo J. Pozzo-Pirotta
Aja Trebec
Víctor Manzanares-Vázquez
José L. Díez
Javier Arístegui
Ulf Riebesell
Stephen D. Archer
María Segovia
A natural plankton community from oligotrophic subtropical waters of the Atlantic near Gran Canaria, Spain, was subjected to varying degrees of ocean alkalinity enhancement (OAE) to assess the potential physiological effects in the context of the application of ocean carbon dioxide removal (CDR) techniques. We employed nine mesocosms with sediment traps attached to the bottom, each enclosing a volume of 8.3 m3, to create a gradient in total alkalinity (TA). OAE was based on the addition of carbonates (NaHCO3 and Na2CO3). The lowest point on this gradient was 2400 µmol L−1, which corresponded to the natural alkalinity of the environment, and the highest point was 4800 µmol L−1. Over the course of the 33 d experiment, the plankton community exhibited two distinct phases. In phase I (days 5–20), a notable decline in the photosynthetic efficiency () was observed. This change was accompanied by substantial reductions in the abundances of picoeukaryotes, small-size nanoeukaryotes (nanoeukaryotes-1), and microplankton. The cell viability of picoeukaryotes, as indicated by fluorescein diacetate hydrolysis by cellular esterases (FDA green fluorescence), slightly increased by the end of phase I, whilst the viability of nanoeukaryotes-1 and Synechococcus spp. did not change. Reactive oxygen species levels (ROS green fluorescence) showed no significant changes for any of the functional groups. In contrast, in phase II (days 21–33), a pronounced community response was observed. Increases in in the intermediate OAE treatments of Δ900 to Δ1800 µmol L−1 and in chlorophyll a (Chl a), chlorophyll c2 (Chl c2), fucoxanthin, and divinyl Chl a were attributed to the emergence of blooms of large-size nanoeukaryotes (nanoeukaryotes-2) from the genera Chrysochromulina, as well as picoeukaryotes. Synechococcus spp. also flourished towards the end of this phase. In parallel, we observed a significant change of 20 % in the overall metaproteome of the phytoplankton community. This is considered a significant alteration in protein expression, having a substantial impact on cellular functions and the physiology of the organisms. Medium levels of ΔTA showed more upregulated and less-downregulated proteins than higher ΔTA treatments. Under these conditions, cell viability significantly increased in pico- and nanoeukaryotes-1 at intermediate alkalinity levels, while in Synechococcus spp., nanoeukaryotes-2 and microplankton remained stable. ROS levels did not significantly change in any functional group. The pigment ratios DD+DT : FUCO and DD+DT : Chl a increased in medium ΔTA treatments, supporting the idea of nutrient deficiency alleviation and the absence of physiological stress. When all data are taken together, this study shows that OAE did not cause cellular stress in the phytoplankton community studied, and physiological fitness was not impaired. The drawdown in phytoplankton cell numbers that was observed at times seemed to have been most likely caused by nutrient limitation.
- Article
(2265 KB) - Full-text XML
-
Supplement
(3572 KB) - BibTeX
- EndNote


We are confronting one of the greatest challenges in the 21st century due to the progressive increase in atmospheric CO2 caused by anthropogenic activities. The 2015 Paris Agreement represented a pivotal moment in global climate policy by setting the objective of keeping global temperature rise well under 2 °C. This target was motivated by the urgency of preventing irreversible impacts and mitigating intolerable risks to human society. The Shared Socioeconomic Pathway (SSP) climate-simulation-based scenarios (sixth Assessment Report; IPCC, 2021, p. 20, line 45), combining elements from new models about future societal development (SSP) with the previous iteration of scenarios and the Representative Concentration Pathways (RPCs), describe new trajectories of changes in atmospheric greenhouse gases (GHGs) over time, including very ambitious mitigation policies (Riahi et al., 2017). According to this, the most likely scenarios that we will be facing up to the year 2100 are the “middle of the road” (SSP2-4.5) and the “rocky road” (SSP3-7) scenarios. The former is an intermediate GHG emission scenario, in which the predicted total cumulative CO2 emissions will reach 600 µatm by 2100. In the latter, high GHG emissions may take place, and CO2 concentrations of 900 µatm are to be expected by 2100. This scenario also comprises a concomitant reduction in the global ocean surface pH of 0.25 units by 2100 with respect to 1950 levels for SSP2-4.5 and 0.35 units for SSP3-7, clearly leading to severe ocean acidification (OA). OA is already altering the carbonate system (consisting of the proportions of the different inorganic carbon forms maintained by the carbonate pump, the carbonate counter-pump, and the solubility pump in the ocean) that controls seawater pH (Millero et al., 2009). Carbon speciation is predicted to be highly affected, with an expected 17 % increase in bicarbonate ions () and a 54 % decrease in carbonate () concentrations in equilibrium. Thereupon, the saturation state of calcite (Ωcalcite) and the rain ratio (RR; the ratio of calcite precipitation to organic matter production, i.e. the PIC : POC (particulate inorganic carbon to particulate organic carbon) ratio) will also change (Rost and Riebesell, 2004; Doney et al., 2020). The alteration of the carbonate chemistry in seawater due to higher CO2 levels will benefit some species, such as nitrogen-fixing cyanobacteria (Levitan et al., 2007), while being detrimental to others. OA negatively affects diatoms, prymnesiophytes, and calcifier organisms (Riebesell and Tortell, 2011). Among the latter, OA highly impacts haptophytes (e.g. coccolithophores). This phytoplankton group is of paramount significance in the global carbon cycle because it is responsible for marine biogenic calcification (CaCO3 formation) and/or the rain ratio (Riebesell and Tortell, 2011). Therefore, OA influences community primary production, species composition, nutritive values such as the increase in the C:N ratio and export, and the exchange of CO2 between the surface ocean and the atmosphere (Riebesell et al., 2007).
Due to the impacts already caused and to new predictions, it seems unlikely that we will achieve climate change mitigation aims without the help of ancillary technologies that reduce atmospheric CO2 concentrations. In this sense, negative emissions technologies (NETs) (IPCC, 2021) include mechanisms such as CDR (carbon dioxide removal) that address the reduction and even elimination of atmospheric CO2 (Riebesell et al., 2023). A potential CDR strategy involves increasing the total alkalinity (TA) of the ocean, also known as ocean alkalinity enhancement (OAE). The consequent increase in due to OAE would counteract ocean acidification by prompting proton uptake. This may also facilitate calcification (Feng et al., 2017), leading to an increase in the ocean's carbon sinking capacity. That is, OAE has the potential to increase the carbonate pump and the solubility pump, both maintaining a surface-to-deep-ocean gradient of dissolved inorganic carbon (DIC). Indeed, this type of NET consists of increasing the chemical storage capacity for atmospheric CO2 in the ocean by adding proton-neutralizing substances to the surface ocean (Kheshgi, 1995). The subsequent alkalinity increase causes a change in the speciation of inorganic carbon in seawater, creating new space for the absorption of additional atmospheric CO2 (Hartmann et al., 2013).
There are different methods of OAE to promote atmospheric carbon sequestration (Renforth and Henderson, 2017; Eisaman et al., 2023; Bach et al., 2024). OAE can be achieved through the weathering of alkaline minerals such as limestone by the addition of carbonates (as presented here) and silicate minerals such as the iron-containing mineral olivine through electrochemical processes used to generate alkalinity from chloride brines or strong bases such as NaOH. It can also be performed by the addition of hydrated carbonate minerals to seawater and ground minerals to the shelf seafloor.
However, we still lack an empirical foundation for a coherent comprehension of how the marine ecosystems will respond to any of the OAE approaches that have been proposed, as experimental data are scarce. Indeed, most of the available data are related to weathering experiments. Ferderer et al. (2022) found that when using NaOH and NaHCO3 as alkalinity treatments, OAE had significant but generally moderate effects on various groups in the phytoplankton community and on heterotrophic bacteria in natural coastal communities. In this experiment, more pronounced effects were observed for the diatom community where silicic acid drawdown and biogenic silica build-up were reduced at increased alkalinity. Hutchins et al. (2023) exposed cultures of several phytoplankton groups to olivine leachates and found both positive and neutral responses but no evident toxic effects for the relevant ecological species Nitzschia punctata, Ditylum bardawil, Emiliania huxleyi, Synechococcus spp., Trichodesmium erythraeum, and Crocosphaera watsonii. In both single and competitive co-cultures, silicifiers and calcifiers benefited from olivine dissolution products like iron, magnesium, and silicate or from enhanced alkalinity, respectively. The utilization of olivine may contribute to a significant fertilization of seawater that could theoretically benefit primary production.
Nevertheless, in real-world experiments, olivine additions can have some drawbacks that need to be seriously considered. Experiments with this mineral have shown that the increase in alkalinity led to an increase in Ni 3-fold higher than the natural concentration in seawater (Montserrat et al., 2017), within the toxic range for many eukaryotic microalgae (Glass and Dupont, 2017). Other trace metals, present in alkaline minerals including Fe, Cu, Cd, and Cr, might impose further eco-toxicological effects depending on their concentration in the minerals transferred to the water column or sediment (Beerling, 2017). In contrast, González-Santana et al. (2024) found in the very mesocosm experiment that we are discussing here that the introduction of carbon and sodium salts did not affect iron size fractionation, iron concentration, and iron-binding ligands at all, i.e. iron dynamics. Consequently, phytoplankton remained unaffected by alterations in this crucial element. Altogether, observed changes in phytoplankton communities suggest that a variety of physiological responses have been predicted and observed in laboratory cultures or coastal phytoplankton communities. However, it remains challenging to gauge what the response will be in more natural communities studied at sea, at larger scales, and under more realistic scenarios.
The aim of the present work was to investigate the physiological response of different phytoplankton functional groups to OAE using a mesocosm approach that simulated the environmental conditions following alkalinity additions and subsequent equilibration of the carbonate system with the atmosphere. Based on the previous studies mentioned above, we hypothesized that we would not expect to see potential physiological consequences of increased equilibrated alkalinity that were due to equilibration in particular. However, adding carbonate salts to the phytoplankton community could produce transient quick-acclimation processes in phytoplankton cells that most likely will display a reversible stress response. Such a response might be mediated by nutrients (Falkowski and Raven, 2007). Hence, the transcription of genes and the protein inventory will change accordingly. As a result, the metabolic activity (i.e. cell viability); variable chlorophyll fluorescence (related to photosynthetic function); pigment composition and ratios (proxies for photoinhibition and physiological stress); and reactive oxygen species – ROS – accumulation (accounting for oxidative stress management) might also change depending on whether OAE exerts negative, positive, or neutral effects.
By studying this complementary suite of physiological response metrics, we hoped to gain a better understanding of whether natural phytoplankton cells are able to thrive under OAE scenarios and whether this will subsequently translate into biological fitness. This constitutes a valuable tool for assessing the risks versus benefits of the effects of OAE on marine phytoplankton communities.
2.1 Experimental design
The mesocosm experiment was conducted at the port of Taliarte, Telde, Gran Canaria, during a 33 d period from September to October 2021 (Fig. S1 in the Supplement). These waters are characterized by warm surface temperatures and strong stratification of the water column, resulting in oligotrophic conditions, i.e. low nutrient content and low plankton biomass (Arístegui et al., 2001). The sampling for the set of variables presented here was carried out every other day. A 7 L plexiglass cylinder, equipped with an integrated closure system to capture the water column without inducing stress in the organisms, was introduced into the mesocosm. Water samples from each mesocosm were quickly transported to the laboratory, maintaining the experimental conditions.
The experimental design consisted of nine mesocosms (M1–M9) containing a natural water column of 8.3 m3 each at 5 m in depth, with a sediment trap attached to the bottom of each bag (Riebesell et al., 2013; Taucher et al., 2017). A simulation of air-balanced alkalinization based on the addition of carbonates (NaHCO3 and Na2CO3) was employed. On day 4 of the experiment, 40 L of natural seawater with different concentrations of previously homogenized carbonate salts was added to each mesocosm to achieve an alkalinity gradient between Δ0 (lowest) and Δ2400 µmol L−1 (highest), reaching actual values of total alkalinity (TA) of the seawater between 2300 and 4700 µmol L−1, respectively. To illustrate this alkalinity gradient between mesocosms, in this paper and in related studies in this special issue, a blue colour gradient is used, with the lightest colour corresponding to Δ0 and the darkest to Δ2400 µmol L−1, based on the pH colourimetric scale. The experimental design representing the alkalinity gradient (µmol L−1) in the nine mesocosms was M5 (Δ0), M1 (Δ300), M7 (Δ600), M4 (Δ900), M9 (Δ1200), M3 (Δ1500), M6 (Δ1800), M2 (Δ2100), and M8 (Δ2400) (Fig. S1). For more details, see Paul et al. (2024).
2.2 Pigments
Chlorophyll a (Chl a) and accessory pigments were analysed to discriminate between photosynthesis-related functions and cell stress or cell damage. The violaxanthin–antheraxanthin–zeaxanthin (VAZ) cycle and the diadinoxanthin–diatoxanthin (DD–DT) cycle may serve as indicators of activation of photoprotection mechanisms. The pigments analysed were Chl c3, Chl c2, total Chl a, total divinyl Chl a, 19-hexanoyloxyfucoxanthin, 19-butanoyloxyfucoxanthin, fucoxanthin, neoxanthin, violaxanthin, zeaxanthin, prasinoxanthan, peridinin, diadinoxanthin (DD), and diatoxanthin (DT). Samples were analysed by reverse-phase high-performance liquid chromatography (HPLC; Van Heukelem and Thomas, 2001) following collection by gentle vacuum filtration (< 200 mbar) onto glass-fibre filters (GF/F Whatman, nominal pore size of 0.7 µm), with care taken to minimize exposure to light during filtration. Samples were retained in cryovials at −80 °C prior to analysis in the laboratory. For the HPLC analyses, samples were extracted in acetone (100 %) in plastic vials by homogenization of the filters using glass beads in a cell mill. After centrifugation (10 min, 10 000 rpm, 4 °C) the supernatant was filtered through a 0.2 µm polytetrafluoroethylene (PTFE) filter (LLG). After this, a Thermo Scientific HPLC Ultimate 3 000 with an Eclipse XDB-C8 4.6 × 150 mm 3.5 µm column was used to determine phytoplankton pigment concentrations.
2.3 Chlorophyll-a fluorescence
An active chlorophyll fluorescence method was used to examine whether variations in the level of alkalinity enhancement influenced the photosynthetic physiology of the phytoplankton communities. Fast-repetition-rate fluorometry (FRRf) measurements were made using a FastOcean sensor (Chelsea Technologies Ltd, UK), either deployed directly in the mesocosms or attached to a FastAct module (Chelsea Technologies Ltd, UK), for discrete measurements at in situ temperatures. In each case, the FRRf single-turnover sequences consisted of 100 × 1 s excitation flashlets on a 2 s pitch, followed by 40 × 1 s relaxation flashlets on a 50 s pitch. Each acquisition consisted of 60 sequences with an interval of 150 ms between sequences. For both in situ and discrete measurements, excitation flashlet intensity was set at 1.00 × 10²² of blue light, centred at 450 nm. The FastPro8 software (Chelsea Technologies Ltd, UK) was used to process the single-turnover data using the biophysical model of Prasil et al. (2018). The background fluorescence, attributed to the instrument noise and fluorescent dissolved organic matter, was measured in 0.2 µm filtered seawater on each sampling date and subtracted from the fluorescence data using the FastPro8 software. To capture the dark-acclimated state of the phytoplankton communities, depth profiles of in situ FRRf measurements were measured in the predawn hours. Acquisitions were set at 10 s intervals so that ∼ 10 acquisitions were obtained over the 2.5 m depth range in each mesocosm.
To investigate the photosynthetic capacity, light-adaptation state, and the capacity to tolerate short-term changes in irradiance among phytoplankton communities at varied levels of alkalinity enhancement, discrete water samples from the depth-integrated 5 L sampler were used to create rapid light curves (RLCs). Samples were kept in the dark for a minimum of 30 min prior to RLC measurements to relax nonphotochemical processes. The RLC protocol comprised 10 levels of actinic light ranging from 0 to 1052 µmol , with a 30 s delay at the new light levels before the light-acclimated, single-turnover acquisitions and 10 s intervals between replicate acquisitions at each light level. A water jacket mounted on the FastOcean head kept samples at ambient water temperature during the measurements. The fluorescent terms derived from the single-turnover acquisitions of dark-adapted in situ or discrete samples are Fo, the fluorescence at t=0; Fm, the maximum fluorescence; and Fv (), the variable fluorescence. Their equivalents under light-adapted conditions, F′, , and , respectively, were generated at each level of photosynthetically active radiation (PAR) during the RLC measurements. Depth-averaged values of the parameter , measured in the predawn hours, provide an estimate of the photochemical efficiency of photosystem II (PSII) for the phytoplankton community in each mesocosm.
For the RLC analyses, relative PSII electron transport (rP, equivalent to rETR) was calculated as
Photosystem II electron flux per unit volume was calculated using the absorption algorithm (Oxborough et al., 2012):
where aLHII is the absorption coefficient of PSII light harvesting, and E is the incident photon irradiance. From the RLC of rP versus PAR and JVPSII versus PAR, the respective values of α, the initial slope; EK, the value of PAR at the inflection between α and the asymptote of the curve fit; and Pm, the light-saturated value of rP or JVPSII were derived from curve fits generated by FastPro8 software using two steps: an alpha phase to generate α and EK and a beta phase to estimate parameters beyond EK, such as Pm (Webb et al., 1974; Silsbe and Kromkamp, 2012; Boatman et al., 2019).
2.4 Metaproteome analyses
On day 27 of the experiment (t27), 2 L of seawater from each mesocosm was first prefiltered through a 200 µm nylon mesh and then filtered through 0.2 µm polycarbonate filters (Whatman, Nuclepore, UK). Proteins were extracted from filters according to Segovia et al. (2003) and normalized to the same protein concentration. Thereafter, a gel-assisted proteolysis was carried out, and digested protein samples were analysed according to the label-free quantitative liquid chromatography–mass spectrometry (LC–MS) protocol according to Marrero et al. (2023). For this purpose, they were injected into an Easy nLC 1200 ultra-high-performance liquid chromatography (UHPLC) system coupled to a linear quadrupole-trap hybrid mass spectrometer, Orbitrap Q-Exactive HF-X (ThermoFisher Scientific). The raw data acquired were analysed using the Proteome Discoverer 2.5 platform (Thermo Fisher Scientific) with the Sequest HT and MASCOT search engines. The software versions used for data acquisition and operation were Tune 2.9 and Xcalibur 4.1.31.9. Peptide quantification was implemented using the Minora function of Proteome Discoverer 2.5. The following protein databases were used for the identification of proteins: Synechoccocus (UniProt, tax. ID 1129), Chrysochromulina (Uniprot, tax. ID 1460289), microalgae (NCBI), Dynophyceae (NCBI), Bacillariophyta (UniProt), protists (NCBI), Dictyochophyceae (UniProt), and Emiliania huxleyi (NCBI, tax. ID 2903). The protein abundance values in each of the samples were normalized with respect to housekeeping proteins and scaled with respect to the control alkalinity treatment of Δ0 µmol L−1. The false-discovery rate (FDR) for peptide and protein assignments was determined using the Percolator software package, imposing a strict 1 % FDR threshold.
2.5 Cellular viability and oxidative stress
Cell viability and oxidative stress were studied using the cellular green fluorescence emission of specific probes (Invitrogen, USA) added to samples in vivo (Segovia and Berges, 2009). Organisms were size fractionated by filtering seawater through a 200 µm mesh followed by a 20 µm mesh. The fraction below 20 µm was used to analyse nanoeukaryotes (2–20 µm), picoeukaryotes (< 2 µm), and Synechochoccus spp. (< 2 µm). The fraction between 20 and 200 µm corresponded to microplankton.
Cell viability was assessed with fluorescein diacetate (FDA). FDA is a nonpolar, nonfluorescent stain that diffuses freely into cells. Inside the cell, the FDA molecule is cleaved (hydrolysed) by nonspecific esterases to yield the fluorescent product fluorescein and two acetates. Accumulations of fluorescein are the result of intracellular esterase activity, therefore indicating metabolic activity, i.e. cell viability. A 1 mL sample was incubated with FDA at a 20 µM final concentration at 21 °C for 2 h. Green fluorescence emitted by the cells was quantified with two flow cytometers, Accuri C6 (Becton Dickinson, Belgium) and QuantaCell Lab (Beckman Coulter, Inc. USA). Two distinct flow cytometers were employed due to technical issues encountered with one of the instruments at the beginning of the experiment. Consequently, we have used the data from both instruments after accurate inter-calibrations. Counts were triggered using forward-scatter (FSC) signals on the fluorescein isothiocyanate (FITC) channel.
Reactive oxygen species (ROSs) were assayed with carboxy-H2DFFDA, a cell-permeable fluorescent indicator that is nonfluorescent until oxidation by ROS occurs within the cell. H2DFFDA detects intracellular ROSs, and despite its lack of specificity, as it can be oxidized by any possible radical with oxidative activity, it has proven very useful and reliable for assessing the overall oxidative stress. A 1 mL sample was incubated with ROSs at a 20 µM final concentration at 21 °C for 2 h. Green fluorescence was measured as described above. The percentages of stained cells and controls were calculated using the FloJo_v10.8 software (Becton Dickinson, Belgium). Samples with FDA and ROSs were analysed individually, corresponding to the percentage of cells falling within the upper right of the flow cytometry (FCM) chart, indicating green fluorescence, versus the lower right of the FCM chart, indicating only red fluorescence.
The fraction between 20 and 200 µm corresponding to microplankton was incubated with the fluorescent probes as described above and then filtered in darkness through black Anodisc/Nucleopore filters (25 mm Whatman), using a peristaltic pump at 0.2 mb to avoid cell damage, and then placed onto glass slides. A drop of immersion oil was infiltrated between the filter and the coverslip. Samples were then stored at 4 °C until they were analysed using an Eclipse E800 Nikon epifluorescence microscope under the FITC filter set. Red fluorescent Chl-a cells were counted first, followed by the green fluorescent cells. The percentage of green fluorescent cells was calculated based on the total red fluorescent cell counts. A significant number of fields of vision (FOVs) had a significant N when counted. The percentages of stained cells and positive and negative controls were calculated using the Image J software.
It is important to note that fluorescent stains must be validated in each different experiment before use by analysing the optimal dye loading concentration and its kinetics for each specific phytoplankton community in order to avoid suboptimal fluorescence or saturated fluorescence reaching the flow cytometer's or epifluorescence microscope's laser detectors. This was done prior to the start of the experiment. In addition, negative controls for cell viability consisted of cells treated with 2 % glutaraldehyde (i.e. dead cells) (Segovia and Berges, 2009). Positive controls for cell viability consisted of cultured microalgae cells in log phase that were provided by the Spanish Algae Bank (Taliarte, Gran Canarias, Spain). Positive controls for ROSs (i.e. oxidized cellular components) consisted of cells treated with 0.05 % hydrogen peroxide, as indicated by Segovia and Berges (2009). General negative controls were done by substituting both 0.2 µm filtered seawater and MilliQ water for the cells.
2.6 Microplankton analyses
Microplankton cell abundance was obtained using the FlowCAM8400 equipped with a colour camera, a 10× objective for 100× magnification, an FOV100 flow cell, and a 1 mL syringe-driven sample pump. A 125 mL sample from each mesocosm was collected every 2 d and was prefiltered using a 280 µm mesh to exclude most of the zooplankton fraction. The samples were later preserved in a 1:1 solution of 37 % formaldehyde and 100 % acetic acid (glacial). The Utermöhl method was employed by subsampling 50 mL for sedimentation into 6 mL to concentrate the cells (Utermöhl, 1958). The sedimented volume was aspirated, prefiltered through a 200 µm mesh to avoid clogging, and transferred to the FlowCAM. Following the recommended factory settings, the sample was run in auto-image mode with a flow rate of 0.1 mL min−1. Plankton and detritus particles were imaged at 14 frames per second. Planktonic functional groups (diatoms, dinoflagellates, silicoflagellates, protozoa) found within the target size range of 20–200 µm were sorted semiautomatically using the VisualSpreadsheet® particle analysis software (Owen et al., 2022).
2.7 Statistical analyses
To examine the possible effects of the OAE treatments on the study variables, the data were tested for normality with the Shapiro–Wilks test, sphericity with the Mauchly test, and homoscedasticity with the Levene test. All data met the requirements for parametric tests. Simple linear regression analysis (p < 0.05) was then used for all variables. To compare phase I and phase II of the experiment, t tests (p < 0.05) were performed on FDA, ROSs, and pigments. For cell viability and oxidative stress, split-plot analysis of variance (ANOVA) tests were performed, followed by the Bonferroni post hoc test (p < 0.05). Statistical analyses were performed using the free software programs Jamovi (The jamovi project, 2022, version 2.3) and R (R Core Team, 2022, version 4.1)
To interpret the temporal responses, three distinct phases were defined according to variations in the seawater chemistry and the plankton community development. Phase 0 was established at the beginning of the experiment (t1–t3), representing the conditions in the mesocosms before the treatment was applied. Following this, phase I (t5–t20) commenced after alkalinization with NaHCO3 and Na2CO3. Finally, phase II occurred from t21 to t33. The trends in alkalinity, dissolved inorganic carbon (DIC), and pH are illustrated in Fig. S2 in the Supplement. Indirect abiotic precipitation occurred in the highest treatment (Δ2400 µmol L−1), lasting until the end of the experiment and leading to slight TA and DIC losses (Fig. S2). All nutrient levels measured were consistently low during the entire experiment (Fig. S3 in the Supplement), and there were no significant differences due to treatments. Silicic acid dropped off 1.5-fold between days 1 and 6 and remained stable around 0.2 µM (average) during the rest of the experimental period (Fig. S3a). Nitrate, nitrite, and phosphate were under the detection limits of the analysis techniques employed (Fig. S3b and c). All these data can be consulted for further details in the article by Paul et al. (2024).
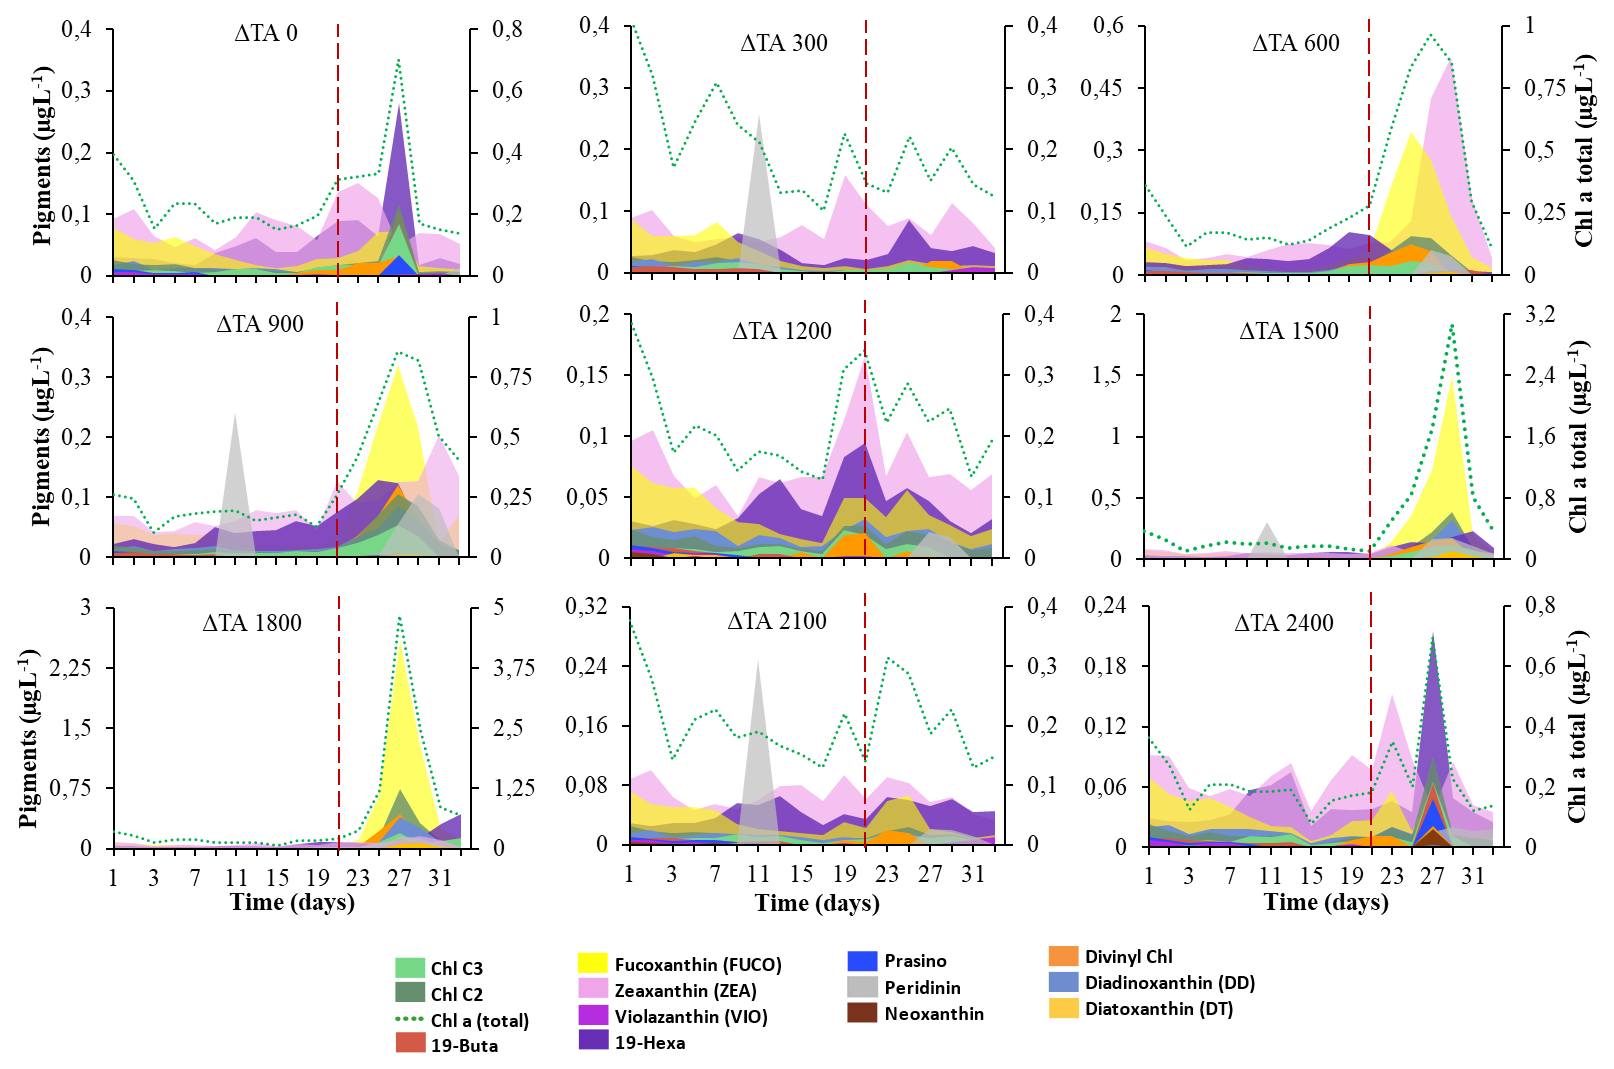
Figure 1Cumulative concentrations of accessory pigments in µg L−1 (left y axis) and the Chl-a total in µg L−1 (right y axis) by treatment. (a) OAE 0 (M5), (b) OAE 300 (M1), (c) OAE 600 (M7), (d) OAE 900 (M4), (e) OAE 1200 (M9), (f) OAE 1500 (M3), (g) OAE 1800 (M6), (h) OAE 2100 (M2), and (i) OAE 2800 (M8). Colour codes for each pigment are included. The dashed red line separates phase I and phase II.
The initial values of total Chl a were ∼ 0.5 µg L−1 up to t5, and then it diminished to minimum values by the end of phase I. Chl a significantly increased in phase II only in intermediate ΔTA treatments (i.e. Δ900, Δ1500, and Δ1800) between t21 and t33. The highest concentrations were achieved by t27 and ranged from 4- to 18-fold higher than in phase I, with a final decline in all treatments (Figs. 1 and S5 in the Supplement). The behaviour of the different plankton groups is summarized in Sect. 3.1 and in Fig. S6 in the Supplement. All these data can be consulted for further details in the article by Marín-Samper et al. (2024).
3.1 Community composition
During phase I, picoeukaryotes significantly increased in the Δ600, Δ900, Δ1800, and Δ2100 µmol L−1 treatments, as did the microplankton in the Δ900 µmol L−1 treatment. On the contrary, the group nanoeukaryotes-1 followed a decreasing trend from the beginning of the experiment. Their maximal abundances were observed before the addition of the OAE treatments (t1–t3). In phase II, nanoeukaryotes-2 dominated the community, specifically in the Δ1500 and Δ1800 µmol L−1 treatments. Microplankton also increased by the end of this phase. The diatoms showed a decrease in cell numbers during the whole experiment, except for M9 where they peaked twice on t18 and t23. Dinoflagellates presented a similar trend at the beginning of phase I. In phase II (t29–31) all the mesocosms showed significant increases in cells numbers in M6 and M3 (Δ1500 and Δ1800, respectively). Silicoflagellates were only detected during phase II. Synechococcus spp. were the only functional group that increased its cell density over time in most of the mesocosms, mainly in the intermediate and low treatments, reaching its maximum on t29 at Δ600 µmol L−1 (Fig. S6).
Pigmentary composition is used as a proxy to detect or confirm the presence of different functional groups in different assemblages over time. For instance, chlorophylls, fucoxanthins, or divinyl Chl a serve as proxies to detect haptophytes, Bacillariophyceae, dinoflagellates, or cyanobacteria (Takaichi, 2011; Rodriguez et al., 2016; Ito and Tanaka, 2011). The pigmentary composition analysed by HPLC confirmed the flow cytometry data. We observed significant differences in pigments between phase I and phase II in some of the mesocosms (Fig. 1). By t27, intermediate ΔTA treatments showed the highest total Chl a, chlorophyll c2 (Chl c2), fucoxanthin, and divinyl Chl a, especially in ΔTA 1800 (Fig. 1g). All subsequent treatments without the unit are in µmol L−1. DD, prasinoxanthin, and neoxanthin showed moderate accumulation in this mesocosm. Low and high ΔTA treatments presented significantly lower concentrations than medium ΔTA treatments (Fig. 1a–c, f, and h). For instance, total Chl a declined ∼ 25-fold at the two ends of the alkalinity scale compared to at Δ1800 on t27, as did fucoxanthin and divinyl Chl-a concentrations. The only pigment that significantly increased during phase I regardless of alkalinity was peridinin (Fig. 1b, d, and h), which also slightly increased again later in phase II on t25.
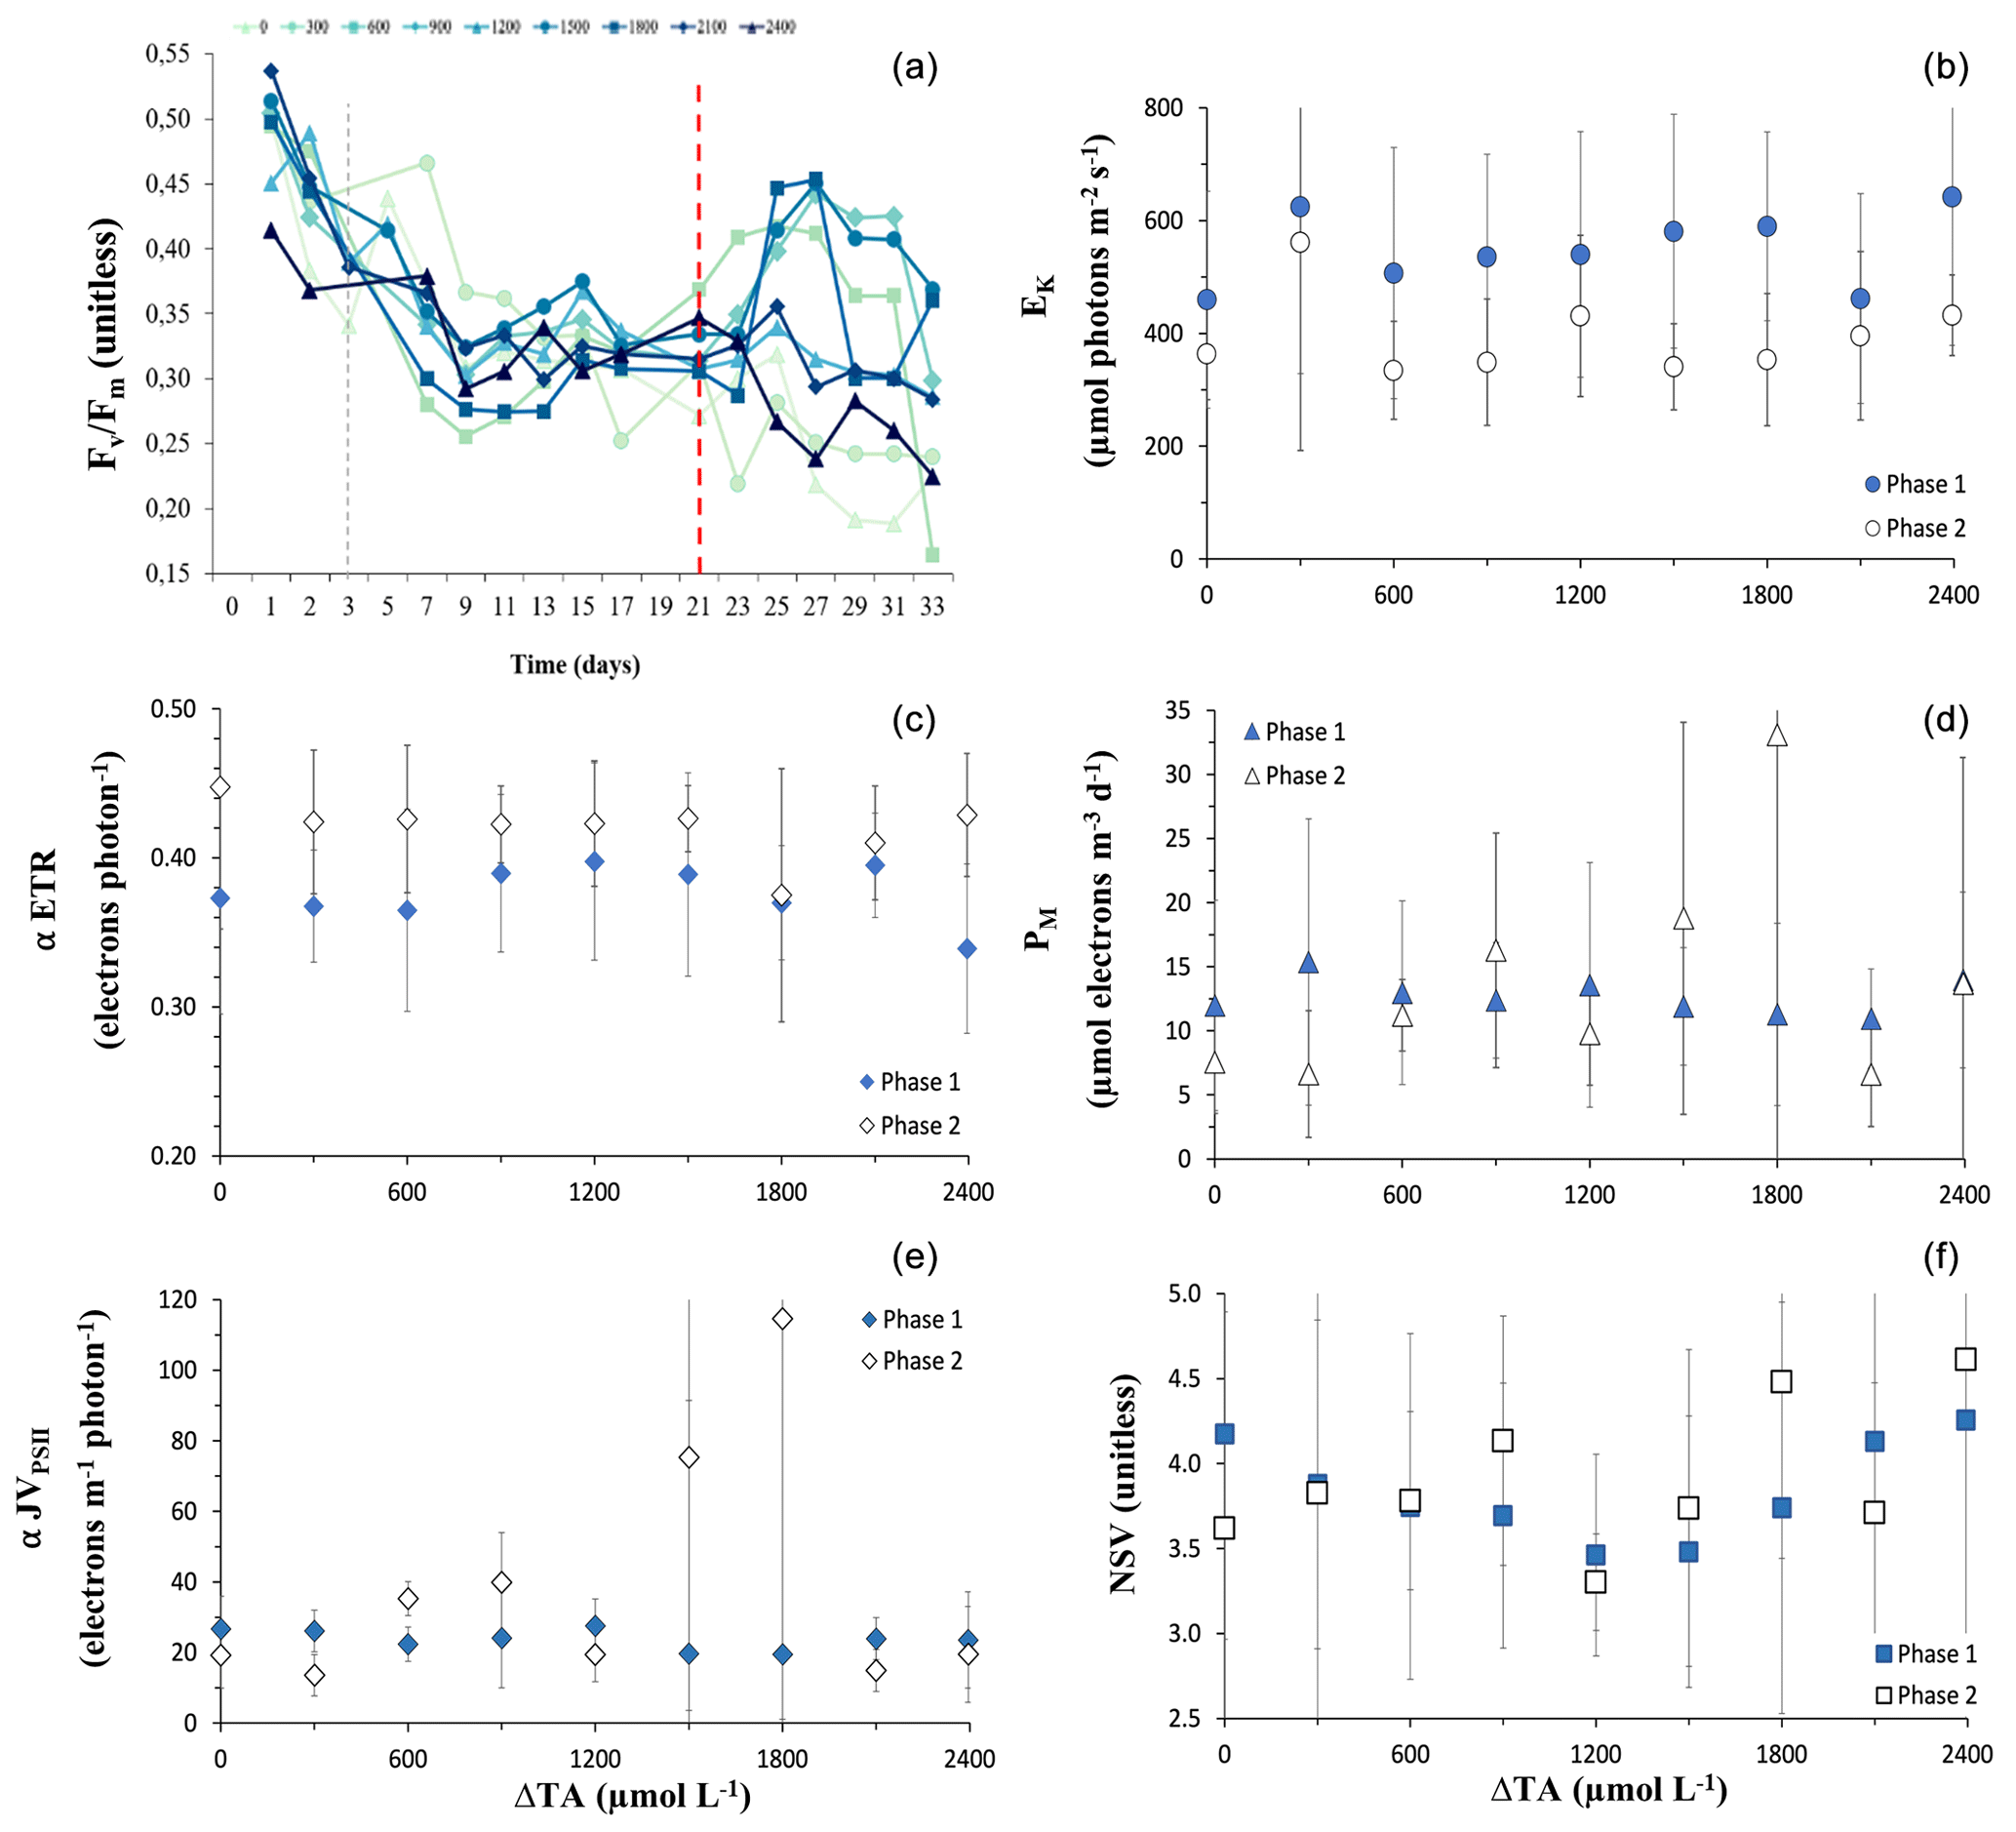
Figure 2(a) Temporal trends in dark-adapted PSII photochemical efficiency (). Values are averages of the predawn measurements through the water column from each mesocosm. The dashed red line differentiates between the two phases. The colour gradient and symbols according to mesocosm alkalinity correspond to mesocosms with high alkalinity. (b–f) Phase-averaged values of the rapid-light-curve-derived values with OAE of (b) α-rETR (relative electron transport rate), (c) α-JVPSII (volume-specific electron transport rate), (d) EK (light intensity for saturated JVPSII), (e) PM (maximum rate of JVPSII), and (f) NSV (nonphotochemical energy dissipation or normalized Stern–Volmer quenching). Error bars are the SD of the phase-averaged values. The dashed grey line in (a) indicates the day on which OAE was deployed.
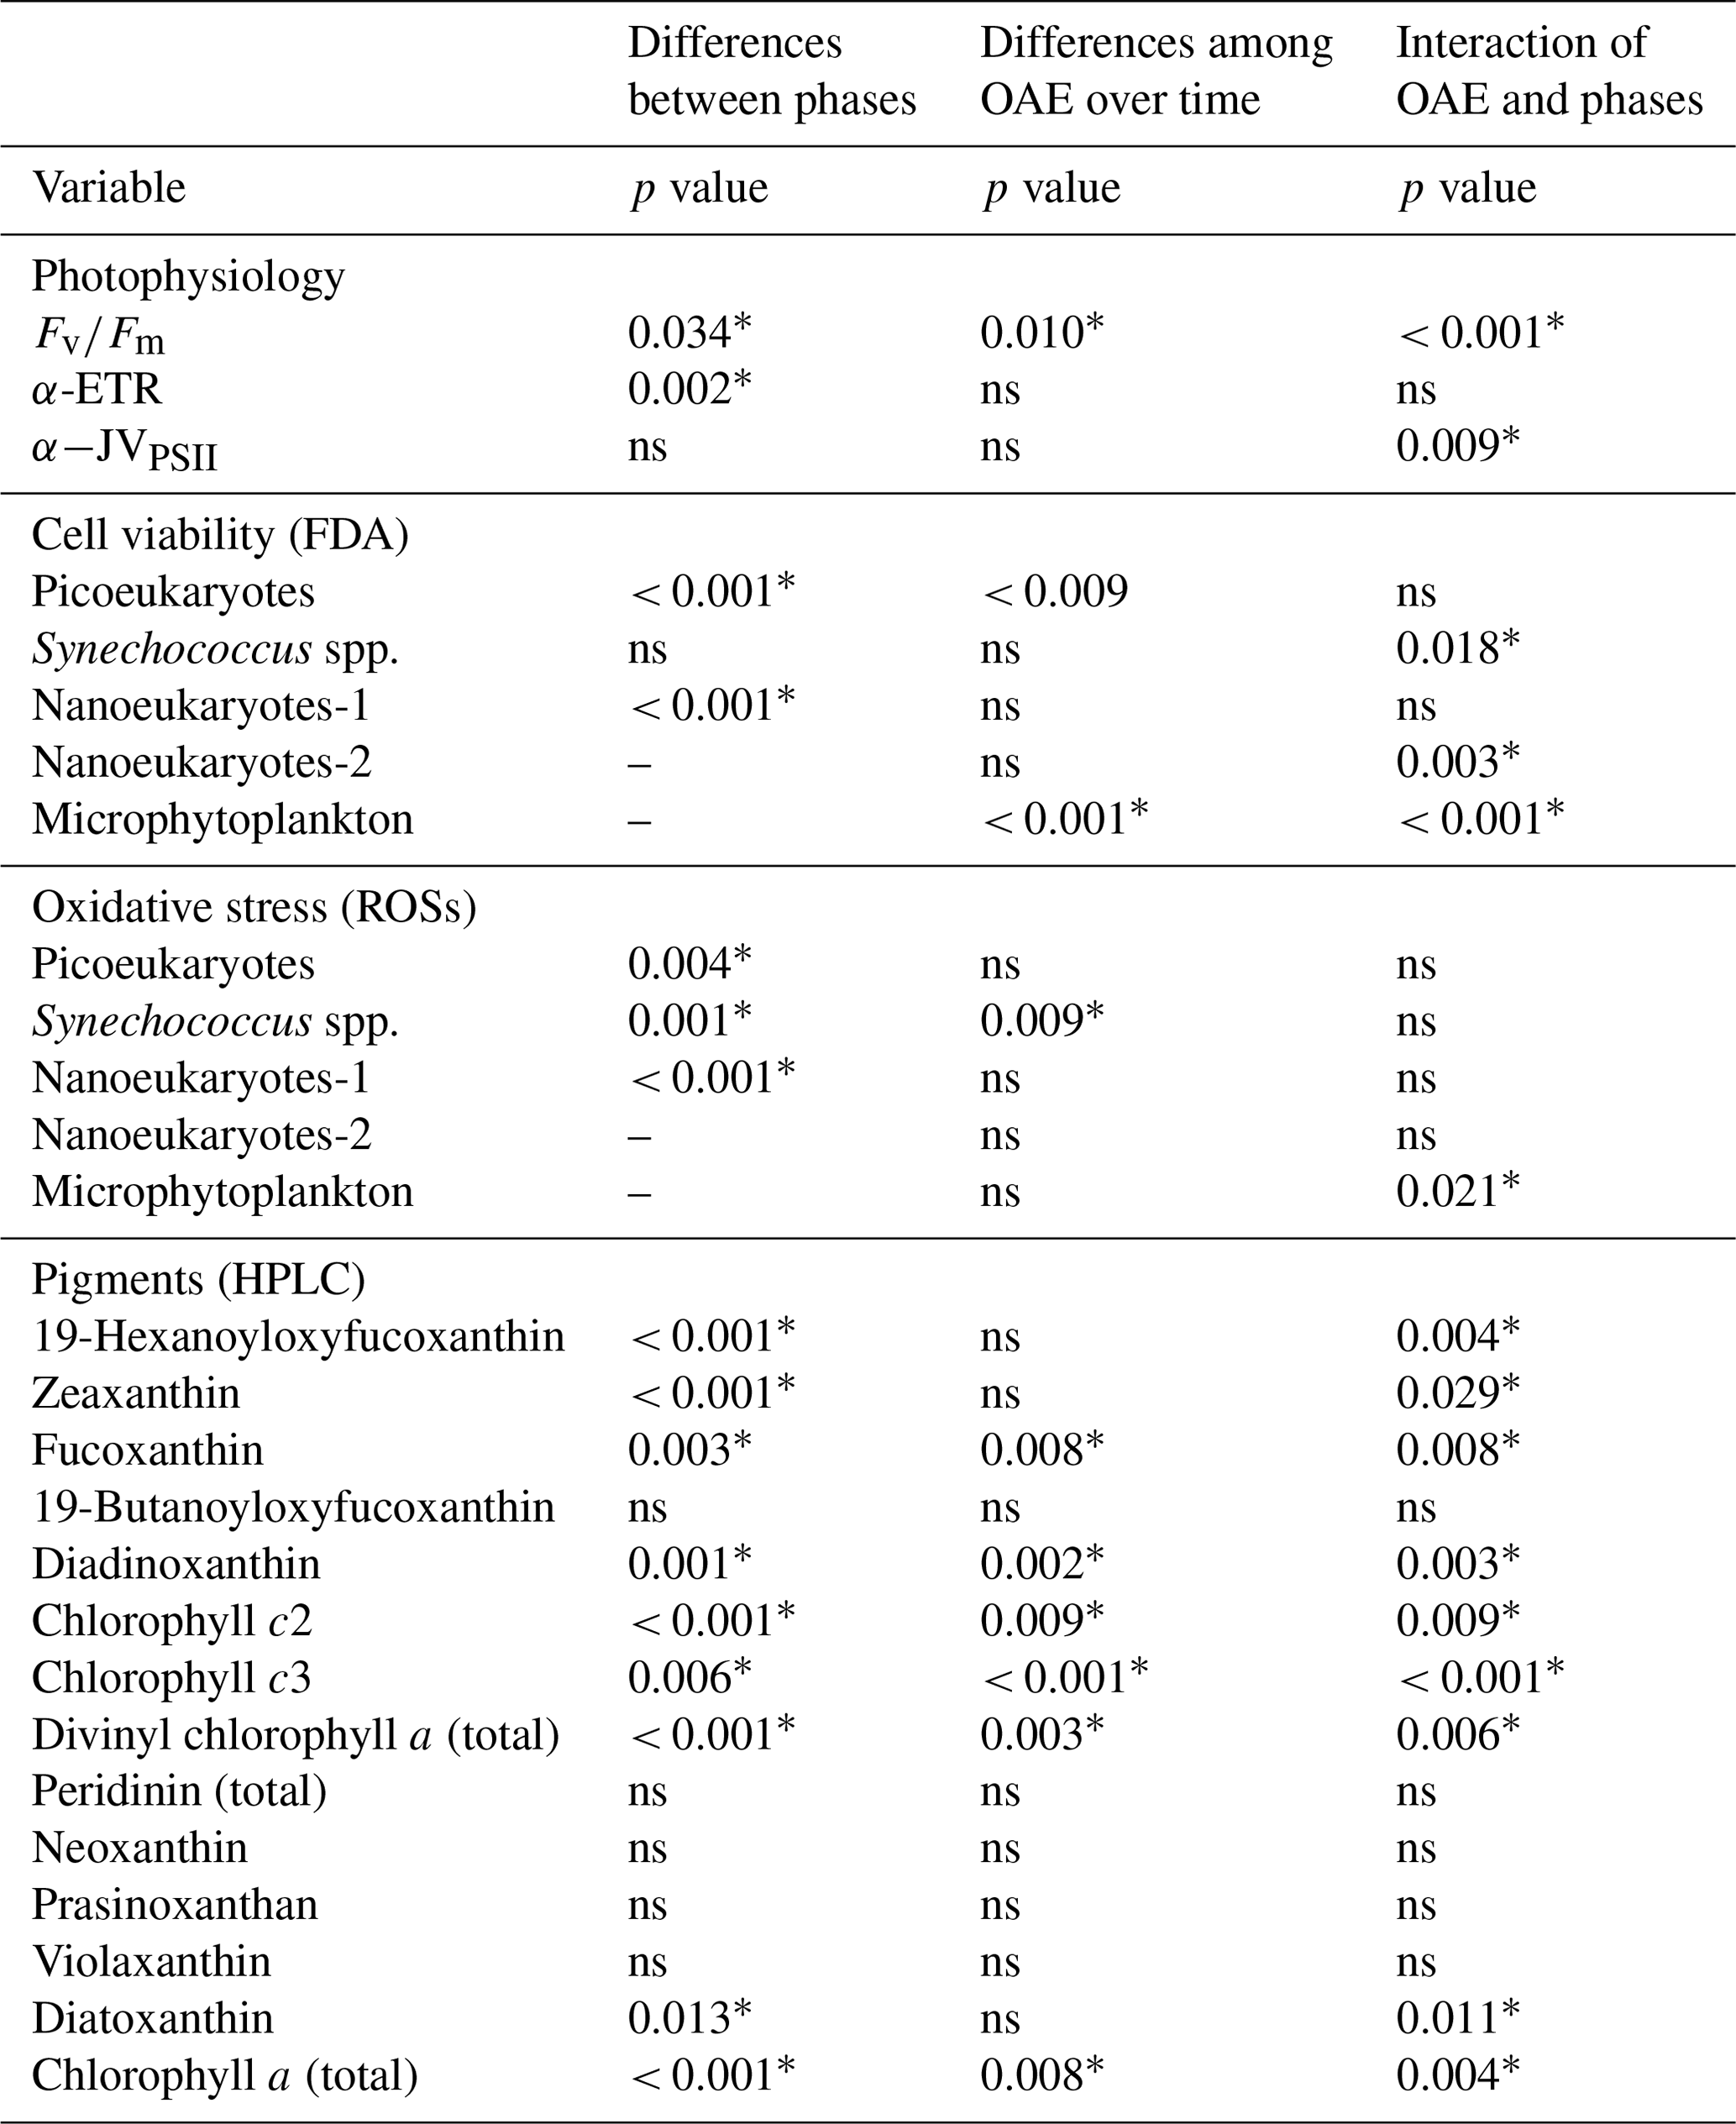
Table 1Statistical analysis of the effects of OAE between phase I and phase II of the experiment, as well as the differences among OAE treatments within each phase. Split-plot ANOVA tests (i.e. mixed model ANOVA and general linear models (GLMs)) followed by Bonferroni post hoc tests (p < 0.05) were performed on , α-rp, α-JVPSII, FDA, ROSs, and pigments. To analyse differences between treatments within phase II for nanoeukaryotes-2 and microphytoplankton, split-plot ANOVA tests with time as the repeated measure factor were used, followed by the Bonferroni post hoc test (p < 0.05). Statistically significant differences (p < 0.05) are indicated by an asterisk (∗); ns means not significant (p > 0.05).
3.2 Phytoplankton physiological response
3.2.1 Photophysiological changes
Dark-adapted PSII photochemical efficiency () of the phytoplankton communities initially exhibited a decline in all mesocosms, and for the remainder of phase I between t7 and t20 it stayed relatively constant, within the range of 0.25 to 0.38 (Fig. 2a). values were significantly different between levels of alkalinity and between phases, showing a highly significant interactive effect (Table 1). By the beginning of phase II, was close to 0.30 in all mesocosms. At the start of phase II, an increasing trend in and α-JVPSII (Fig. 2c) was observed in mesocosms with intermediate alkalinity (up to the Δ1800 treatment), with the highest ΔTA mesocosms showing ∼ 2-fold-lower values. No significant differences were observed between alkalinity levels in terms of the photosynthetic parameters α-rp and α-JVPSII during phase I or phase II (Fig. 2b, Table 1).
The increasing trend in the initial slope of electron flux per unit volume, α-JVPSII, with increasing alkalinity that paralleled as it increased with OAE up to ΔTA1800 was not apparent in the statistical analysis for variations in alkalinity alone but was apparent as a significant interactive effect of the phases and alkalinity (Table 1), possibly due to the discrepancy in the response of the community at ΔTA 1200. In contrast to α-JVPSII, the initial slope of the RLCs of relative PSII electron transport versus PAR, α-ETR, did show differences between phases but not between levels of alkalinity. The maximum rates of JVPSII (PM) and nonphotochemical quenching (NPQ) did not present significant differences. Yet, NPQ shows an increasing phase II pattern in the intermediate treatments.
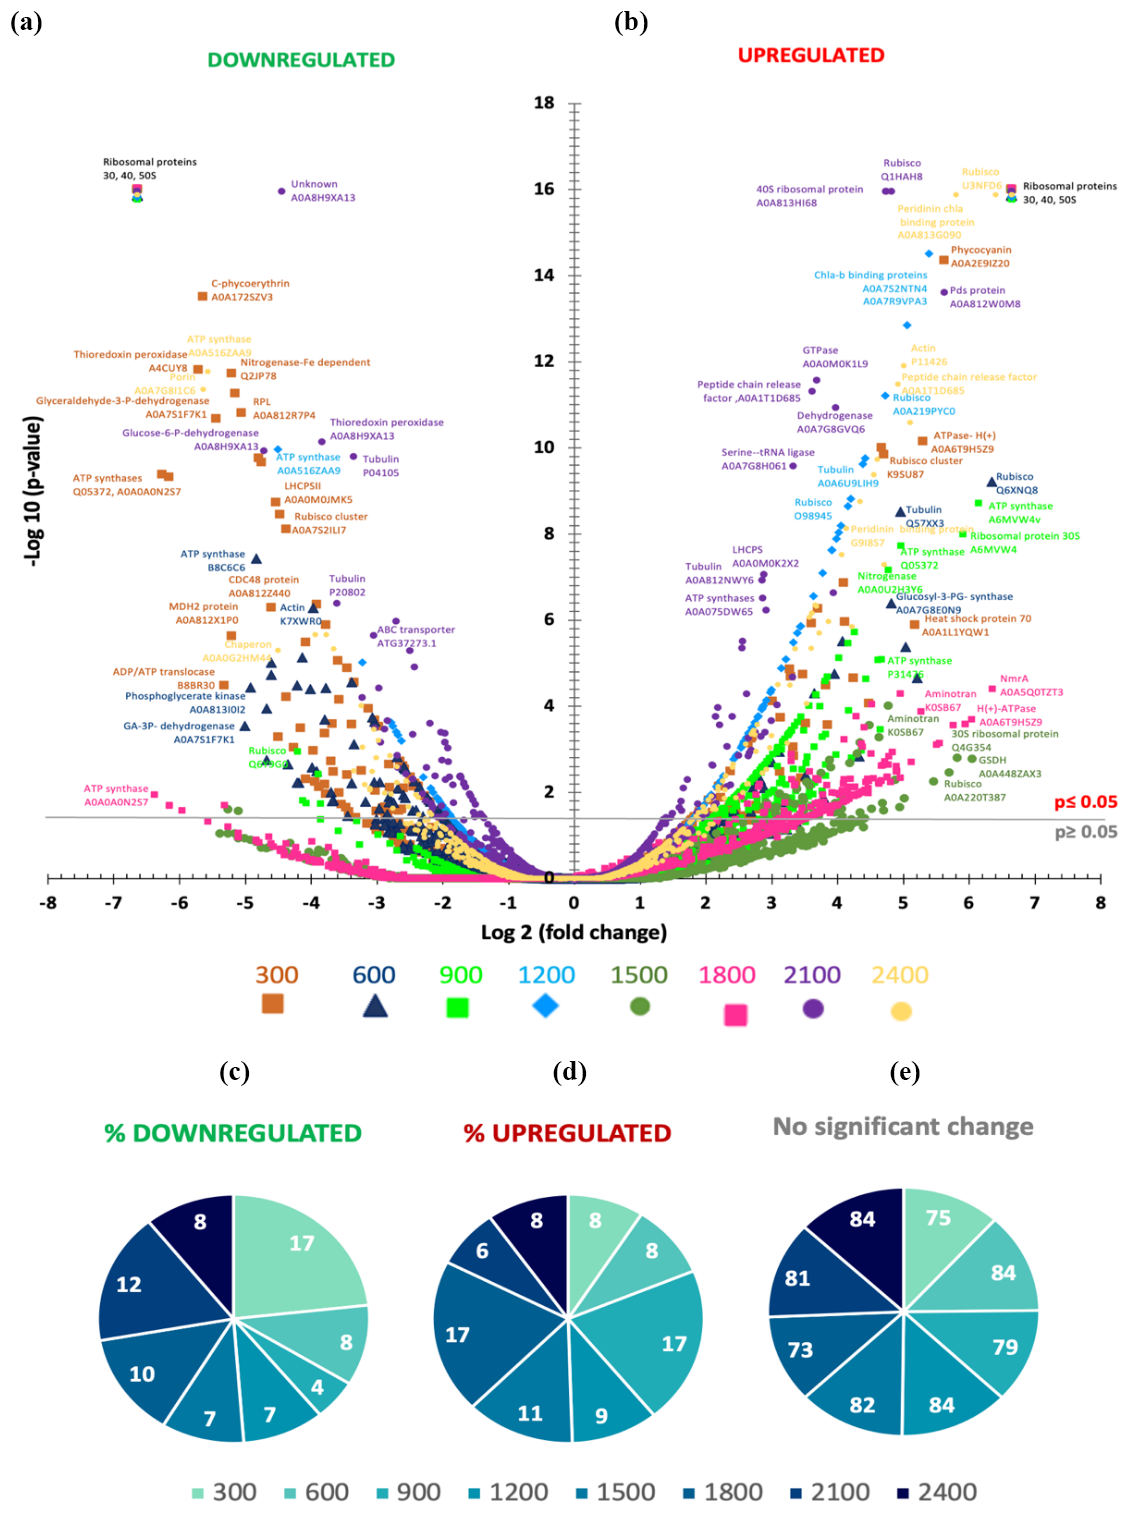
Figure 3(a, b) Volcano plot showing the metaproteome analysis on t27 of the experiment for all the mesocosms except for the control ΔTA 0. The statistical significance (−log 10 p value) of the magnitude of change (log 2-fold change) is tested with respect to the control. Each dot in the plot is one protein normalized by housekeeping proteins and by the control. Downregulated protein abundances appear on the left side of the plot, whilst upregulated ones are shown on the right side of the plot. (c–e) Pie charts represent the percentages of significant protein abundances in upregulated and downregulated mesocosms and in mesocosms with no changes. Colour and symbol codes for alkalinity levels for each mesocosm are shown below each plot.
3.2.2 Metaproteome
Figure 3a depicts the study of 1750 proteins that were extracted and analysed. Volcano plots were used to test the statistical significance (−log 10 p value) of the magnitude of change (log 2-fold change) for a large dataset subjected to various conditions relative to the control. The x axis represents the fold change, which indicates the effect of treatments on the abundance of a specific protein. On the y axis, values ≤ 1.30 for a p value of 0.05 are considered nonsignificant. Thus, the higher the value on the y axis, the more significant the change in abundance of a specific protein. Proteins that are downregulated appear on the left side of the plot, while upregulated proteins are on the right. We can then distinguish the main tendencies of proteins that are subjected to significant changes in abundance depending on the treatment.
Focusing on proteins that showed significant changes in abundance (y axis > 1.30), we observed differences between the mesocosms at the high points of the alkalinity spectrum and those in the middle. That is, less downregulation and more upregulation occurred in mid-TA mesocosms compared to the higher TA treatments (Fig. 3b and c). The Δ1800 and Δ2100 µmol L−1 treatments experienced 10 % and 12 % significant protein downregulation (Fig. 3b). Among the proteins with decreased abundances in these treatments were ATP synthase, RuBisCO (with high homology to diatoms and dinoflagellates), metal-binding proteins (similar to dinoflagellates), ribosomal proteins from prokaryotes, cytochromes (with high homology to dinoflagellates and diatoms), and exopeptidases. No proteins related to photosynthesis, nutrient acquisition, or cell growth seemed to be downregulated in these treatments.
Protein abundances dropped by approximately half in the high and low treatments. The only exception of high downregulation in the low TA treatments appeared to be at Δ300 µmol L−1 (17 %, Fig. 3b), probably due to high concentrations of ribosomal protein downregulation from both prokaryotes and eukaryotes. ATP synthases were also highly represented, with similarities to Synechococcus spp., diatoms, and Pedinellales. Chlorophyll a and peridinin binding proteins followed in abundance, with high homology to dinoflagellates. Cytochromes of various types were also downregulated, with similarities to Synechococcus spp., dinoflagellates, and diatoms.
In the case of upregulated proteins (Fig. 3c), Δ900 and Δ1800 µmol L−1 exhibited a 17 % increase in abundance, with much of the increase corresponding to ribosomal proteins and ATP synthases. Urea–ABC transporters were significantly increased, with high homology to Haptophyta and Cyanophyta, as well as photosystems I and II and RuBisCO. Chaperones and other proteins from the thylakoidal transport chain and Calvin cycle also contributed to the pool. The Δ1500 µmol L−1 treatment showed an 11 % increase. The major percentages of accumulated proteins in this treatment were ribosomal proteins, mainly from eukaryotes, chaperones, and AAA–ATP synthases. The Δ1200 µmol L−1 treatment showed a 9 % increase, consistently corresponding to ATP synthases, ribosomal proteins from eukaryotes and prokaryotes, PSII-associated proteins, and chaperones.
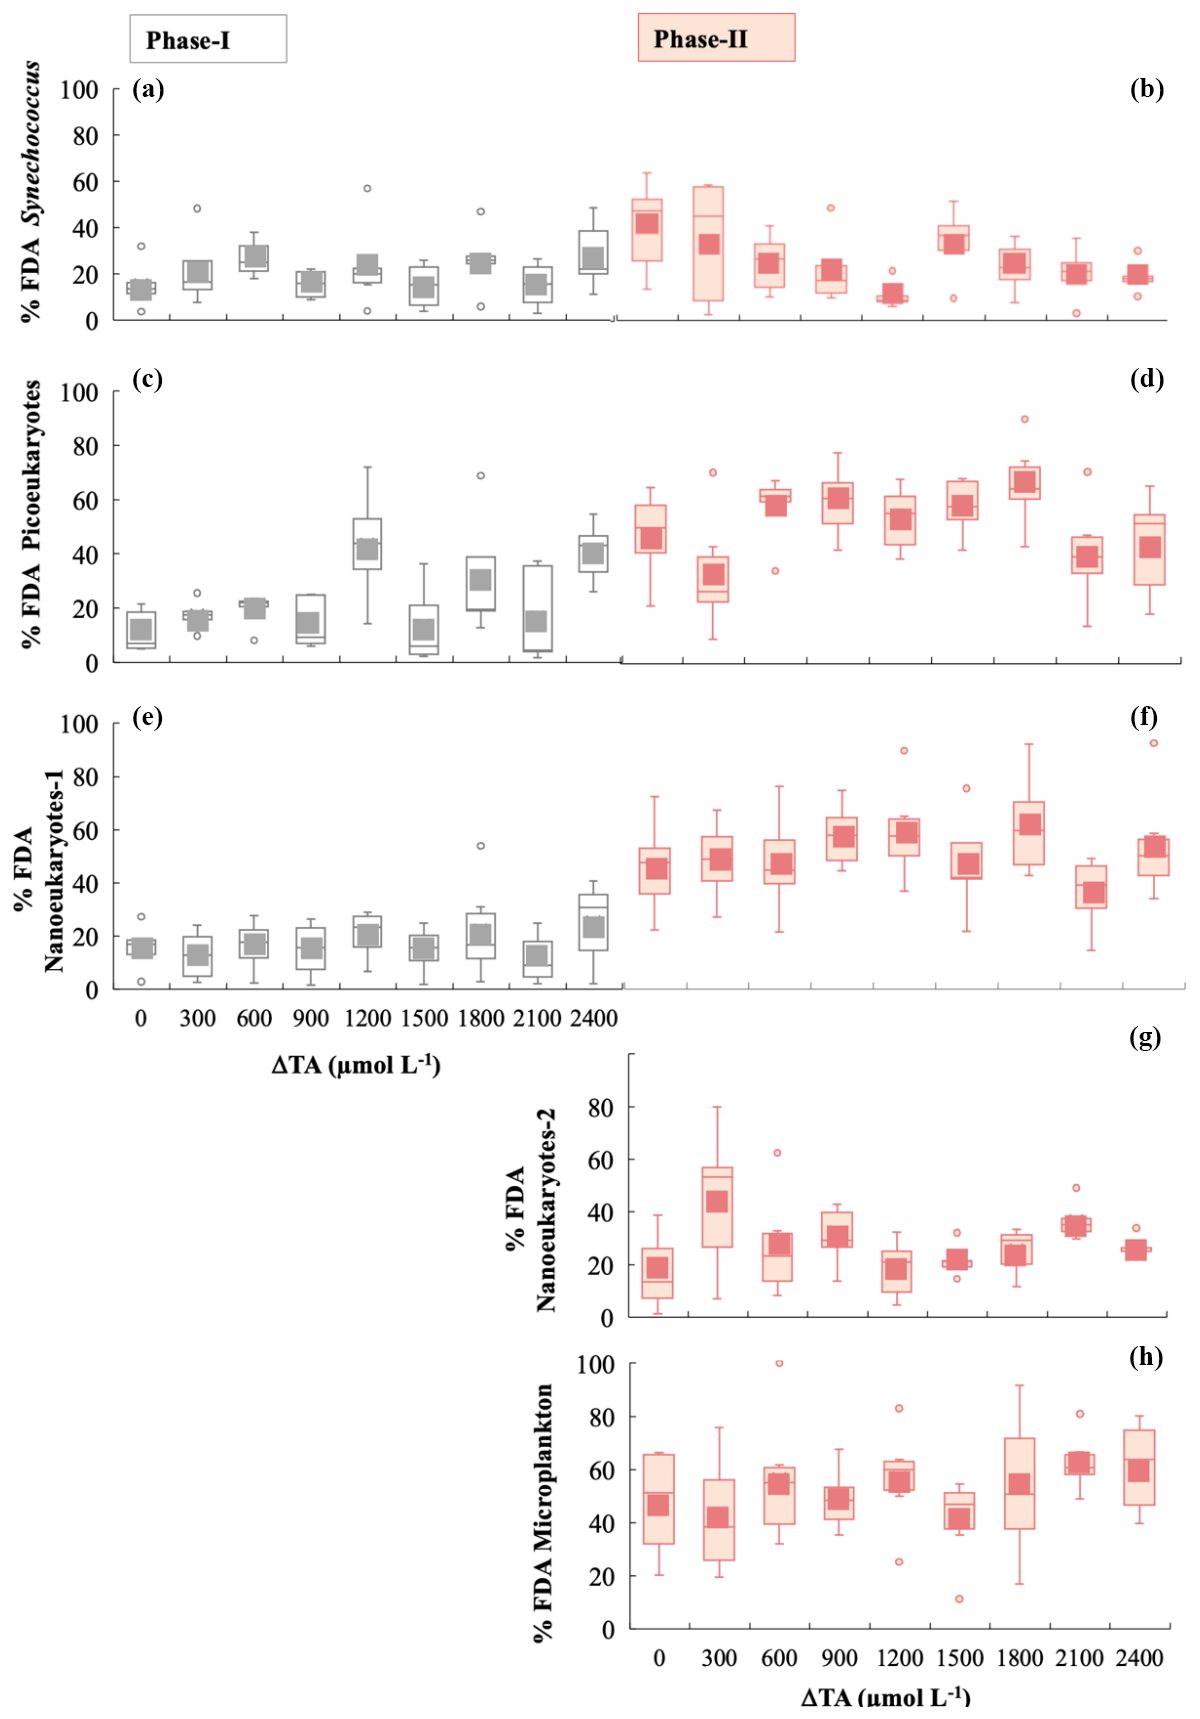
Figure 4Box-and-whisker plots of the percentage of viable cells, determined using the FDA green fluorescence stain for phases I and II for all functional groups. The grey colour is for phase I and the salmon colour for phase II. (a, b) Synechococcus < 2 µm, (c, d) picoeukaryotes < 2 µm, (e, f) nanophytoplankton-1 < 20 µm, (g) nanophytoplankton-2 > 20 µm, and (h) microphytoplankton (30–280 µm).
It is important to mention that the upregulated and downregulated data represent approximately 20 % of the total proteins. The significance of this 20 % will be further discussed in the following sections. Most of the proteins, averaging 80 %, did not exhibit changes in their abundances in response to the different ΔTA treatments (Fig. 3a and d).
3.3 Specific functional group responses
3.3.1 Cell viability and cell stress
We analysed cell viability and ROS accumulation to study the physiological status of the community. During phase I, averaged Synechoccocus spp., picoeukaryotes, and nanoeukaryotes-1 stained by FDA each represented ∼ 25 % of the total cell numbers (Fig. 4a, c, and e). The latter two groups increased cell viability green fluorescence 2.2-fold in phase II, evidencing significant differences between phases for the three functional groups (Table 1) (Fig. 4d and f). Only Synechoccocus spp. and nanoeukaryotes-2 were significant in the interaction, indicating that the differences between phases and/or alkalinities were close to significant (Table 1). Microplankton exhibited significant differences between treatments in phase II. Unfortunately, technical issues prevented us from detecting microphytoplankton and nanoeukaryotes-2 using FDA and ROS fluorescent probes in phase I; therefore, we cannot assess the differences between phases.
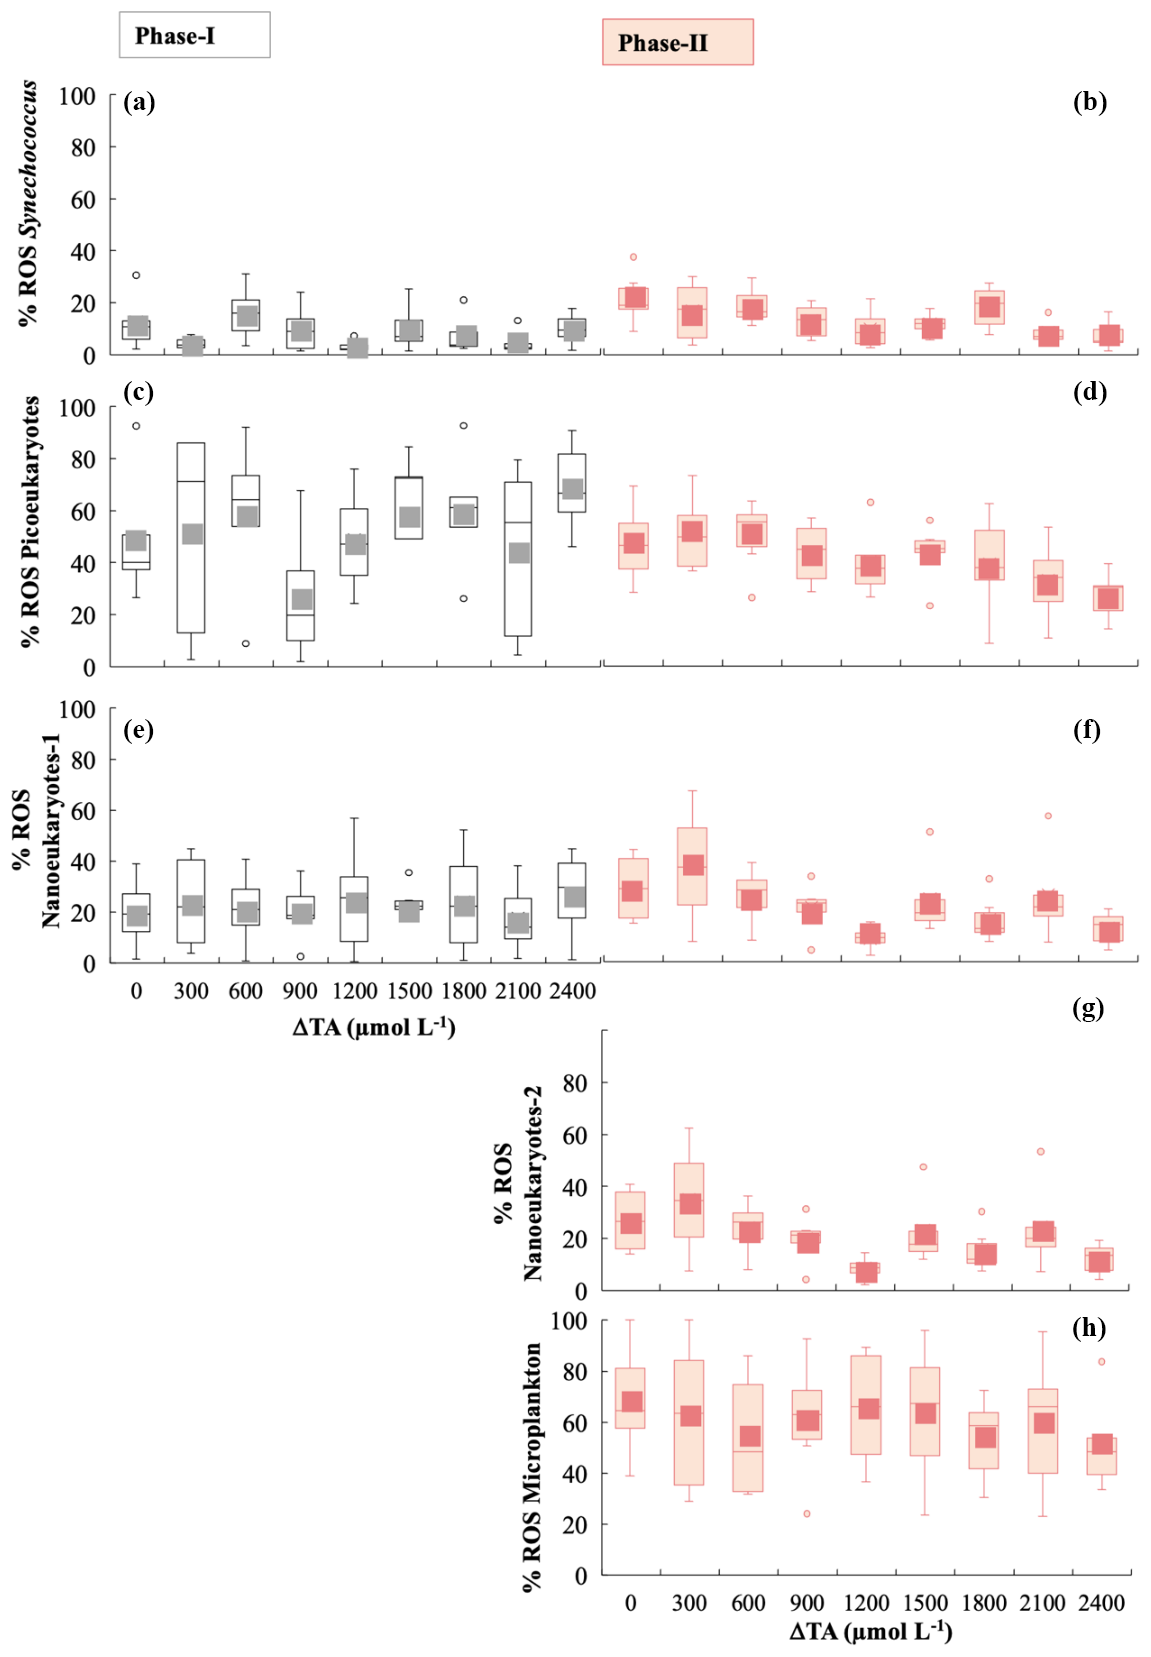
Figure 5Box-and-whisker plots of the percentage of cells exhibiting the presence of ROS green fluorescence for phases I and II for all functional groups. The grey colour is for phase I and the salmon colour for phase II. (a, b) Synechococcus < 2 µm, (c, d) picoeukaryotes < 2 µm, (e, f) nanophytoplankton-1 < 20 µm, (g) nanophytoplankton-2 > 20 µm, and (h) microphytoplankton (30–280 µm).
Averaged ROS fluorescence was 10 % in Synechoccocus (Fig. 5a), 45 % in picoeukaryotes (Fig. 5b), and 23 % in nanophytoplankton < 20 µm in phase I. ROS accumulation in the phase II period seemed to slightly decline at medium TA levels for picoeukaryotes and nanoeukaryotes (Fig. 5d, f, and g), with the differences between phases being significant (Table 1). In contrast, none of the groups showed significant changes with respect to treatment, except for Synechoccocus ssp. (Fig. 4b; Table 1).
3.3.2 Pigments related to the cellular physiological status
Nonphotochemical quenching (NPQ) is a regulated electron dissipation mechanism carried out via the xanthophyll cycles (VAZ and DD–DT), providing an indication of the phytoplankton communities' capacity for photoprotection (Raven, 2011).
Pigments related to the xanthophyll cycle were analysed. They did not accumulate in significant amounts during phase I. In phase II, violaxanthin (VIO) and zeaxanthin (ZEA) acting in the VAZ cycle were detected, although antheraxanthin was not. They did not accumulate much in medium ΔTA treatments, except for in ΔTA1200 (Fig. 1d, f, and g). However, these pigments specifically increased in low and high ΔTA treatments during phase II. VIO increased towards the end of phase II (t31–33) in Δ300 and Δ2100 (Fig. 1i). ZEA peaked at Δ600 and Δ900 by t27. Diadinoxanthin (DD) and diatoxanthin (DT), pigments involved in the photoprotective de-epoxidation DD : DT cycle, followed the opposite pattern to VAZ pigments. They increased moderately in the medium Δ1800 and Δ1500 treatments on t27 and t29 (Fig. 1f and g), but their concentration declined in low and high ΔTA mesocosms. In summary, 19-hexanoyloxyfucoxanthin, zeaxanthin, fucoxanthin, diadinoxanthin, chlorophylls c2 and c3, divinyl Chl a (total), diatoxanthin, and Chl a (total) showed significant differences between phases I and II. Fucoxanthin, chlorophylls c2 and c3, diadinoxanthin, divinyl Chl a (total), and Chl a presented differences between OAE treatments, and the interaction of most of them was also significant (Table 1).
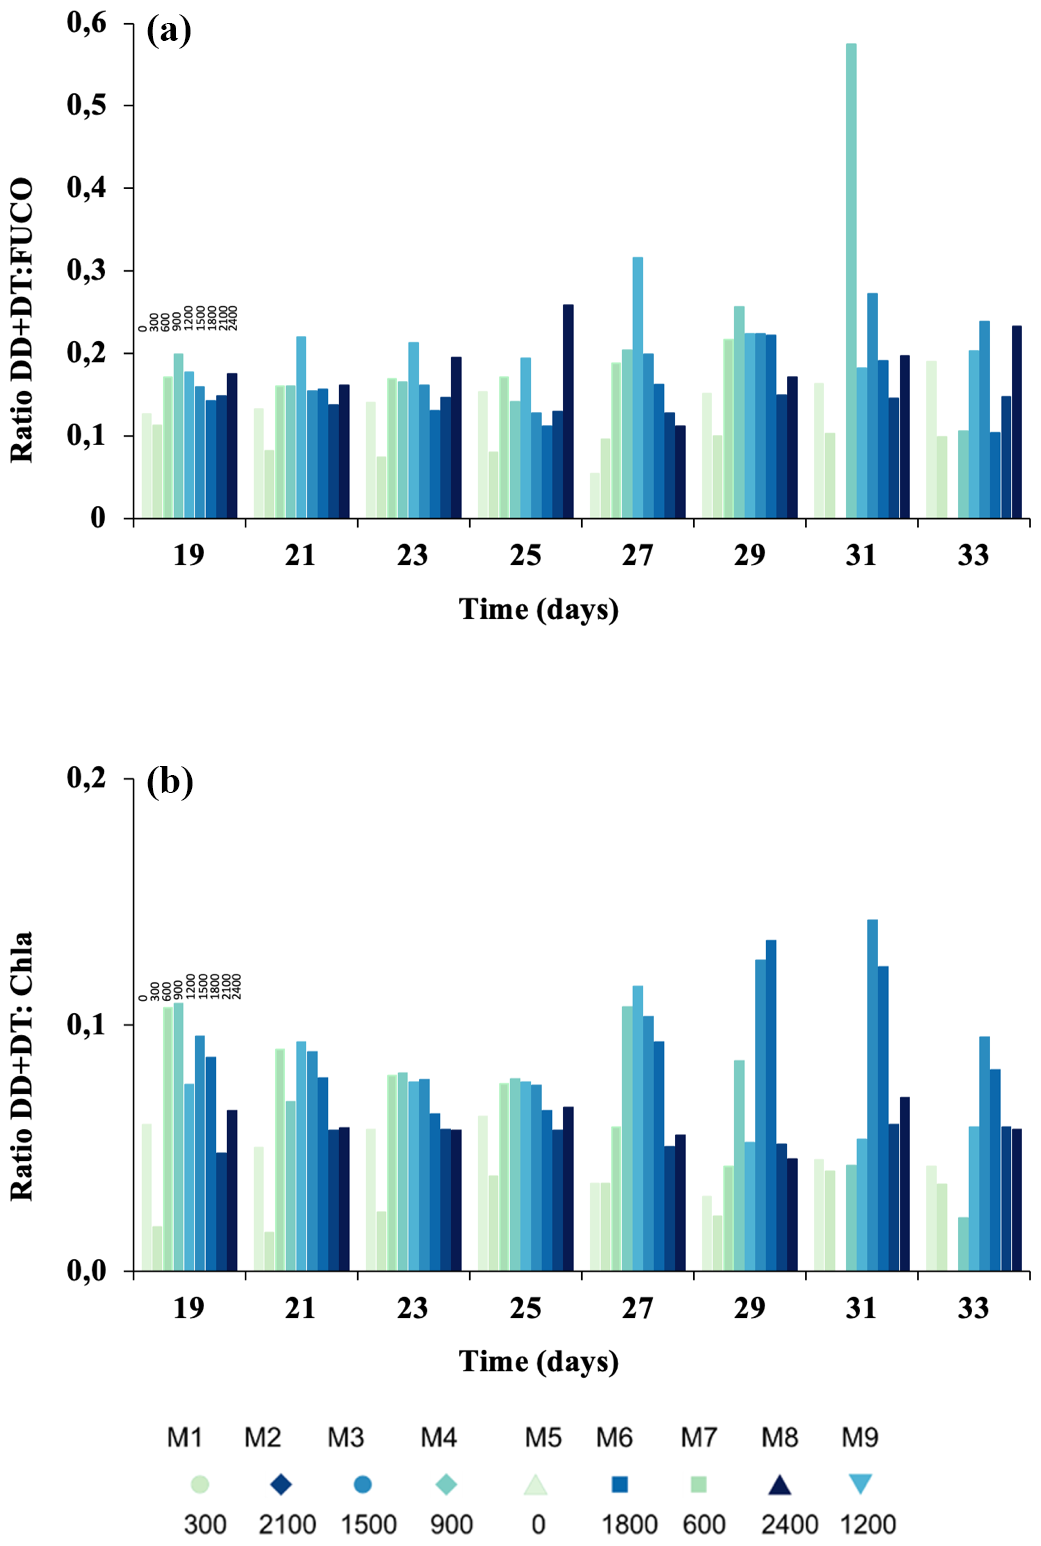
Figure 6The ratio of (a) diadinoxanthin and diatoxanthin to total fucoxanthins (DD+DT : TFUCO) as a proxy for physiological stress; the ratio of (b) diadinoxanthin and diatoxanthin to chlorophyll a (DD+DT : Chl a) as a proxy for nutrient stress. Colour gradient according to Fig. 2.
The ratios DT+DD : TFUCO and DT+DD : Chl a can be used as proxies for the cellular physiological status of the cells as well as nutrient limitation (Stolte et al., 2003). DD+DT : TFUCO (mol : mol) remained constant with values below 0.3 mol : mol (Fig. 6a), except for Δ1500 on t27 and Δ900 on t31, when it increased significantly (p< 0.05). The DD+DT : Chl-a ratio experienced a continuous decline during phase I (Fig. 6b) and a later recovery in intermediate ΔTA (i.e. Δ1800, Δ1500, and Δ900), except for Δ2100 during the last days of the experiment. Values for both ratios are presented from t19 onwards, as in phase I of the experiment the pigment concentrations were close to zero.
The main goal of this study was to characterize the physiological status of the phytoplankton in each of the mesocosms to assess whether there was a response within the communities to variation in the levels of equilibrated alkalinity enhancement.
One major concern regarding ocean alkalinity enhancement experiments is the stability of alkalinity over time since solid carbonate precipitation can occur when alkalinity is raised due to the accompanying increase in . As a result, surface ocean total alkalinity (TA) can decrease, provoking the opposite effect to the targeted one. To overcome such an undesirable outcome, CO2 equilibrated solutions are applied to reduce the risk of precipitation. Our experimental setup effectively replicated an ocean liming scenario using a TA gradient increasing in 300 µmol L−1 intervals, while dissolved inorganic carbon (DIC) and TA remained constant, at least until day 21. On that day, in the highest treatment of Δ2400 µmol L−1, abiotic precipitation occurred (Marín-Samper et al., 2024), but this event was not expected to have influenced the phytoplankton community response as measured in this study.
4.1 Decrease in photophysiological fitness (phase I)
Photophysiological fitness refers to the ability of cells to thrive in their environment by maintaining active photosynthesis, and it is different from the Darwinian concept of biological fitness, which denotes an organism's ability to pass its genetic material to its offspring. Therefore, the direct assessment of the physiological fitness is given in our experiment for the phytoplankton community by variable fluorescence-based photochemical measurements and for specific functional groups by cell-specific fluorescence probes of cell viability and oxidative stress as estimations of metabolic activity.
In phase I, the ratio started at 0.55 during t1. Subsequently, steadily declined across all treatments, coinciding with low chlorophyll (Chl a) concentrations. One of the causes of the decreasing photophysiological fitness during phase I may be attributed to the dominance of heterotrophic processes within the community, a phenomenon commonly observed in the more unproductive regions of the ocean (Agustí et al., 2001). It may also be due to the drop in nutrient concentrations since the beginning of phase I; this depletion of inorganic nutrients may have benefited heterotrophic organisms. Nevertheless, considering that picoeukaryotes and small nanoeukaryotes were initially present at substantial concentrations, a more plausible explanation is that the values obtained for Chl a and during phase I reflected the community's overall low photosynthetic activity and low nutrient concentration. It is likely that confinement in the mesocosms led to decreasing physiological fitness because of decreased nutrient availability at all levels of alkalinity.
A slight increase in the proportion of viable cells in picoeukaryotes and nanoeukaryotes-1 indicated by FDA green fluorescence at the end of phase I suggests populations with an increasing capacity for growth. However, these groups' cell numbers were low in the mesocosms, which is consistent with a decline in for the bulk phytoplanktonic community. Cell viability serves as a direct measure of metabolic activity in phytoplankton since the emission of green fluorescence following the cleavage of fluorescein diacetate molecules by cytoplasmic esterases is associated with the basal metabolism. Metabolic (esterase) activity remains in a steady state or increases when cells are well acclimated and not affected by stressful or disturbing conditions. The opposite occurs when one or more drivers exert pressure on the cells (Sobrino et al., 2014). The reason for diminished FDA fluorescent cells could be nutrient limitation, metabolic downregulation, photoinhibition, or a combination of all three (Harrison and Smith, 2013). Certainly, there was nutrient limitation due to the oligotrophic conditions of the Atlantic waters (Paul et al., 2024). Studying different phytoplankton species, Garvey et al. (2007) demonstrated that even with well-tested species, transient phases of apparently low cell viability may occur during times of physiological changes, e.g. due to nutrient limitation, aggregation, and any environmental stress. Consequently, live cells with low esterase activity can easily be mistaken for nonviable or dead cells, although they may recover and resume metabolic activity again when the stress ceases.
The low levels of FDA green fluorescence were possibly due to the downregulation of carbon concentration mechanisms (CCMs) by increased DIC levels (Giordano et al., 2005; Sobrino et al., 2014). The CCMs function to actively transport dissolved inorganic carbon (DIC) species within the cell that are then utilized to provide an elevated CO2 concentration around RuBisCO and are activated when DIC is limiting. This was not the case in our study because DIC was maintained steady at high levels in each mesocosm during the entire experiment (Fig. S2). For instance, it has been reported that TWCA1, a cluster of carbonic anhydrases found in numerous marine phytoplankton species, exhibits both CO2 hydration and esterase function (Lee et al., 2013), signifying that some esterase functions in phytoplankton are closely linked to the CCMs. However, if these circumstances had applied, cell viability would have been unlikely to increase during phase II due to the high DIC levels maintained. Our results seem to align with the idea of esterase function being contingent upon a basal metabolism. But still, is it basal metabolism due to downregulation or due to restricted cell growth? It is conceivable that during phase I, low levels of FDA (∼ 25 %) were detected even though the cells remained alive and viable because the cells were undergoing a physiological deficit, which in turn hindered their growth and slowed down their proper acclimation, and not because of the inhibition of CCMs leading to metabolic downregulation.
Another possible scenario that may curtail metabolic activity is photoinhibition. This typically entails a reduction in the rate of photosynthesis and the thylakoidal electron transport chain and changes in pigment composition because of excessive irradiance and/or high ROS accumulation (Falkowski and Raven, 2007). The decrease in ROSs agrees with the premises discussed just above since they are a direct by-product of highly active photosynthesis, and 14C fixation dropped off in this period (Marín-Samper et al., 2024) due to a lowered metabolism. The concentration of accessory pigments, specifically the decrease in oxygenated carotenoids from the VAZ cycle and the unchanged concentration of DD and DT in phase I coupled with the nonsignificant slight decrease in photosynthetic efficiency, suggests that cells were not photoinhibited in any of the mesocosms (García-Gómez et al., 2016; Segovia et al., 2018). In Synechococcus spp., cell viability and ROSs exhibited a steady-state pattern independent of the prolonged upward trend in cell numbers during phase I. It is well-documented that cyanobacteria metabolism exhibits niche differences (Desai et al., 2012), and the mechanisms regulating the growth of Synechococcus are further discussed in the next section.
Taking all factors into consideration, we suggest that during phase I, depleted , cell viability, and ROS levels reflected the low basal metabolism in the functional groups that were present. Under this scenario, active photosynthesis was sustained as much as possible in a nutrient-deficient environment rather than being associated with any cellular stress induced by ΔTA. The nonsignificant regression analyses support the hypothesis that ΔTA did not exert effects on the cell stress variables according to our starting hypothesis because of the equilibrated state.
4.2 Changes in the community (phase II)
Phase II occurred between t20 and t33, and several noteworthy changes were observed. Chlorophyll-a (Chl a) levels increased in parallel with a significant recovery in the ratio and raised the α-JVPSII and α-rp values, particularly in treatments with medium ΔTA (Δ900, Δ1500, and Δ1800 µmol L−1), except for Δ1200. Conversely, values dropped off in the low and high ΔTA mesocosms during this phase. As mentioned earlier, variations in can be indicative of stress directly affecting photosystem II (PSII). Excess irradiance injures phytoplankton by inducing photobleaching of photosynthetic pigments and by altering complexes and molecules present in the photosynthetic apparatus, such as the photosystem II (PSII) complex and/or the RuBisCO enzyme (Häder et al., 1998), due to overshooting electrons and oxy radicals (Segovia et al., 2015). However, the cells react to high light conditions by triggering photoprotection mechanisms (Segovia et al., 2015). Pigments serve as a proxy because some of them are related to photoinhibition and/or photodamage processes. The xanthophyll cycle (oxygenated carotenoids) is directly related to nonphotochemical quenching (NPQ). On the other hand, the violaxanthin–antheraxanthin–zeaxanthin (VAZ) cycle has been described in chlorophytes, and the diadinoxanthin–diatoxanthin (DD–DT) cycle is present in Bacillariophyceae, Haptophyta, and most algae that contain chlorophyll (Takaichi, 2011).
Our data suggest that under moderate ΔTA conditions, the community experienced a relaxation in its photosynthetic state since increased, indicating the increasingly effective transfer of electrons to photochemistry without causing the accumulation of reactive oxygen species (ROSs). Such relaxation is further supported by the lack of an increase in accessory pigments (Fig. 1) and the behaviour of the DD+DT : TFUCO and DD+DT : Chl-a (mol : mol) ratios (Fig. 6). In multispecies bloom situations, the ratios of DT+DD : TFUCO and DT+DD : Chl a can be used as an indicator of the cellular physiological status (Stolte et al., 2000). Indeed, what in part determines phytoplankton species fitness, succession, and distribution is the physiological trade-off between light harvesting, photoacclimation or photoprotection, and dissipation of excess energy, including oxy radicals, in which all pigments participate. This is reflected by changes in the pigment ratios of DT+DD : TFUCO and HEXA : TFUCO, indicating physiological stress (Stolte et al., 2000). Upon examining DD+DT : TFUCO, we observed a significant increase in this ratio in intermediate ΔTA. Fucoxanthins serve as a highly efficient light-harvesting pigments when irradiance is optimal (Harris et al., 2009). The lower these ratios are, the more stress is exerted upon the cells. For instance, a lowered (DT+DD) : TFUCO (mol:mol) ratio implies a dilution of the DD–DT cycle, meaning that the cells' capacity for nonphotochemical quenching (NPQ or NSV (normalized Stern–Volmer), as denoted in Fig. 2) is decreased, as they are prone to excessive ROSs and photodamage (Segovia et al., 2018). NSV quenching increased in phase II, coinciding with bloom peaks in the intermediate treatments (Fig. 2f). In parallel, increases in were observed. A higher NPQ means that the capacity of the cells to dissipate excess energy is enhanced; thus, we can exclude photodamage as being directly responsible for declines. Additionally, no differences were observed between treatments, suggesting that the OAE treatments did not negatively influence the photophysiological state of the phytoplankton community. It is important to note that all these pigments are involved in the long-term photoresponse (Dimier et al., 2009), explaining their absence during phase I. Along this line, the DD+DT : Chl-a ratio also might have increased in intermediate ΔTA as well due to the possible input of nutrients.
However, the abovementioned pigment concentrations and pigment ratio functionality might not be the only explanation as to why and in general all the photobiology parameters changed during the experiment with different ΔTA. Pigment content can vary based on taxonomic shifts as well as on physiological adjustments (Aiken et al., 2009). These significant improvements in Chl a, chlorophyll c2 (Chl c2), fucoxanthin, and divinyl Chl-a-containing species, as well as in photophysiology data during phase II, are ascribed to the emergence of blooms of nanoeukaryotes-2 from t23 to t27 (when they peaked), specifically haptophytes from the genus Chrysochromulina in Δ1500 and in Δ1800. Picoeukaryotes also peaked in this period in the same mesocosms. The increase in zeaxanthin (ZEA) in ΔTA 600 matched the significant growth of Synechococcus spp. ZEA also increased in ΔTA 1200 when higher diatom numbers were present at the same time as the nutrients because there was an increase in silicic acid (Fig. S3a). The fucoxanthin increase seemed to be related to silicoflagellate increases in ΔTA 1800, and peridinin elevation was related to dinoflagellates but only in phase I.
There are several studies suggesting that the values of of natural phytoplankton are largely determined by the algal taxa present (particularly those contributing the most to total Chl a) and by changes in composition over time, i.e. taxonomic dependence of (Suggett et al., 2004, 2009). This is indisputably part of the explanation for the changes observed in our experiment. However, there is another component to it. Some authors use the parameter as “photosynthetic competence”, assessing the behaviour of phytoplankton regarding nutrient availability (Li et al., 2015). That is, is enhanced when nutrients are supplied to oligotrophic communities, and total Chl a increases in turn, enhancing the photosynthetic competence of some functional groups over the others. We do concur with this sense of since as explained above in this paper, photophysiological fitness refers to the ability of cells to thrive in their environment by maintaining active photosynthesis, in this case within an environment that was oligotrophic in origin.
It is indeed somewhat striking that given the high oligotrophy of the system, phytoplankton (Chrysochromulina in Δ1500 and in Δ1800) flourished during phase II. Metabolism drives traits that determine fitness, growth, and survival of populations; thus, one may wonder what may have helped the cells to meet the extra metabolic demands imposed by limiting nutrients and increased TA, allowing them to sustain and/or increase growth, especially during phase II. Unfortunately, neither nor heterotrophic bacterial production was measured in this experiment, and these factors may hold the key to understanding the phytoplankton growth dynamics. However, heterotrophic bacterial numbers did increase in this phase (unpublished data), as well as dissolved organic nitrogen (DON) and dissolved organic carbon (DOC).
We could speculate that ammonium (NH4+) increased in phase II, likely because of remineralization and nutrient release from the decaying phytoplankton, specifically from nanoeukaryotes-1 and micro-phytoplanktonic diatoms and dinoflagellates that died during phase I. In spite of the fact that most of the phytoplankton are osmotrophs (Paulino et al., 2008), phytoplankton using for growth have reduced metabolic demands compared to phytoplankton using organic compounds and nitrate () because can be directly incorporated into amino acids (Maldonado and Price, 1996; Schoffmann et al., 2016). Henceforth, the ability of phytoplankton to thrive at low levels can be explained by its ability to efficiently use and organic nitrogen sources, as observed in the North Sea and in Norwegian fjords (Lessard et al., 2005; Segovia et al., 2017). McKew et al. (2015) reported that coccolithophores, for example, can use N sources other than nitrate highly efficiently by increasing the abundance of transporters under nitrate limitation.
We observed a significant total change of 20 % in the proteome. This is considered a significant alteration in protein composition. Proteome changes, especially of that magnitude, can have a substantial impact on cellular functions and the physiology of an organism. Therefore, we regarded it as a substantial shift in protein expression with significant biological implications (Goeminne et al., 2018). Our metaproteome study supports the concept of cells benefitting from during phase II, based on the finding of urea–ABC transporters being highly upregulated in most of the mesocosms by t27 (Fig. S9 in the Supplement). Urea is the direct precursor of , and many phytoplankton groups exploit this molecule (Baek et al., 2008). ABC transporters are one of the largest and possibly one of the oldest transport system superfamilies (Thomas and Tampé, 2020). They are represented in all extant phyla, from prokaryotes to humans, and they consist of multiple subunits, which are transmembrane proteins and membrane-associated AAA–ATPases. Coincidentally, AAA–ATPases were also noted in the metaproteome to be highly upregulated in most of the mesocosms on t27 (Fig. S9), further evidence reinforcing the assumption that phytoplankton utilizes . The proteome analyses also revealed that on t27, 7 % of protein abundances were downregulated, and 11 % were upregulated in Δ1500 µmol L−1. For Δ1800 µmol L−1, 10 % were downregulated, and 17 % were upregulated. Notably, the biological functions and processes associated with these proteins were similar in both ΔTA treatments. The upregulated protein abundances corresponded to functions such as chloroplast ATP synthesis (ATP synthases), eukaryote mRNA translation (ribosomal proteins), protein folding during translation (chaperones), carbon fixation (RuBisCO), mitochondrial oxidative phosphorylation (cytochromes), photosystem-II turnover (reaction centre proteins), and N transport into the cell (urea–ABC transporters), all of which belonged to both the Eukarya and Prokarya kingdoms. Among the proteins with the highest downregulated abundances were ribosomal proteins of prokaryotic origin. Additionally, there was a decrease in light-harvesting processes (peridinin-like chlorophyll-a/b binding protein) and in physiological stress management (heat shock 70). The proteome data support the evidence of active growth and biomass increase in phase II at intermediate levels of alkalinity enhancement without the development of physiological stress.
Cell viability increased 2.2-fold in picoeukaryotes and in nanophytoplankton < 20 µm during phase II. However, while the cell numbers of picoeukaryotes increased during this period, cell density decreased in the latter group. This inverse correlation between FDA fluorescence and the trend in cell numbers could possibly be due to high grazing pressure on highly viable cells. Unfortunately, despite the occurrence of blooms and presumably higher growth rates for nanoeukaryotes > 20 µm and microplankton during phase II, we cannot assess whether their cell viability and/or ROS content changed with respect to phase I since we were not able to measure these variables because of technical issues. Synechococcus spp. dominated the abundance of the picoplankton community (Fig. S6), and their increasing cell abundance during phase II also contributed to the restoration of Chl a and , particularly in medium ΔTA treatments. Nonsignificant differences were observed between phases for both FDA and ROS green fluorescence. This species distribution displayed a slow but consistent growth rate from the onset of the experiment until it peaked at the end. We were able to identify two distinct clusters of Synechococcus spp. based on their fluorescence characteristics in the flow cytometry analysis. This distinctness in clusters was probably the result of the variations in light acclimation.
Proteome analyses unveiled substantial upregulation of the Synechococcus spp. rod-linker polypeptide and allophycocyanines (Fig. S9), which are integral components of the phycobilisomes, a sophisticated light-harvesting system particularly advantageous deeper in the water column that has been described for cyanobacteria (Adir et al., 2020). On the other hand, it is possible that Synechococcus spp. CCMs were downregulated since cell density and increased during phase II, but ROS fluorescent cells decreased, and FDA-stained cells did not vary. The genes for several CCM transporters are genetically induced under DIC limitation via transcriptional and translational regulatory processes (Price, 2011). Nevertheless, we did not find any CCMs in the metaproteome study, confirming that only DIC was in excess. The ultimate aetiology for low cell viability can be on one side a physiological deficit, as in phase I, and on the other metabolic downregulation due to an excess of DIC in phase II, explaining the absence of an increased FDA green fluorescence signal. The latter takes place while nutrients allow for the activation of photosynthesis, therefore increasing α-JVPSII and α-ETR. We propose that both light acclimation and CCM downregulation may well constitute the underlying mechanisms responsible for this remarkable acclimation capacity of cyanobacteria and the constant growth along the time course of the experiment.
This study demonstrates that there is no evidence for a detrimental influence of high alkalinity on the natural phytoplankton community that occurs in the oligotrophic environment of the subtropical Atlantic Ocean. OAE treatments did not cause negative physiological effects on the community, and physiological fitness was not hampered. In general, statistical analyses yielded nonsignificant results, pointing towards neutral effects of OAE. However, the experimental conditions were clearly differentiated in a principal component analysis (PCA; Fig. S10 in the Supplement), suggesting that the variables measured were effectively distinguished depending on the OAE treatments. Intermediate OAE data are more dispersed within the PCA space, precisely explaining the major changes occurring during the experimental treatments. Indeed, the phytoplankton that developed in the intermediate OAE treatments seemed to be able to more effectively recycle and/or utilize nutrients, thus allowing markedly higher productivity to occur under oligotrophic conditions. The capacity for enhanced net growth under these circumstances was specific to certain groups of phytoplankton. Most of the significant changes in the community took place between t20 and t33 of the experiment (phase II). Cell abundances for the nanoeukaryotes > 20 µm from the genus Chrysochromulina, picoeukaryotes, and some of the microplankton significantly increased in this period. In parallel, photosynthetic efficiency was higher and cell viability was not compromised even at the relatively high levels of alkalinity of the intermediate treatments (up to Δ1800 µmol L−1). This did not occur at the lowest level and at extremely high alkalinity levels.
The mechanism underlying the phytoplankton communities' apparently ability to make use of remineralized nutrients to grow rapidly to high abundances under intermediate OAE conditions is not fully understood, and we do not know at present whether nutrient limitation steered the effects caused by OAE. However, the metaproteome analysis revealed a higher expression and activation of proteins related to N transport, thylakoidal electron transport, and the Calvin cycle. Whether this effect of intermediate OAE treatments that enhances recycling capacity is a consistent or a repeatable phenomenon in other communities and time frames remains to be elucidated, as do the precise mechanisms behind it. It may be restricted to oligotrophic communities under severe nutrient stress. Ecological stress is defined as the impact of any set of abiotic and biotic factors negatively affecting the performance of an individual and eventually deteriorating the growth rate of the population through the reduction in individual survival, growth, and reproduction (Grime, 2009; Vinebrooke et al., 2004). According to this definition, we can conclude that OAE did not cause stress in the phytoplankton community studied. Considering the phytoplanktonic compartment of the ecosystem, evaluating whether the advantages of implementing OAE at a global scale would exceed the risks, or simply assessing how sustainable OAE is once the treatments are deployed in the sea, other factors primarily associated with seawater chemical alterations must be considered in order to safely apply OAE practices in our oceans.
The raw data supporting the conclusions of this article will be made available by the authors upon request.
The supplement related to this article is available online at https://doi.org/10.5194/bg-22-1865-2025-supplement.
Experimental concept and design – UR and JA. Execution of the experiment – all authors. Data analysis – LR, LJPP, SDA, and MS. Paper preparation – LR. Paper revisions – all authors.
The contact author has declared that none of the authors has any competing interests.
Publisher's note: Copernicus Publications remains neutral with regard to jurisdictional claims made in the text, published maps, institutional affiliations, or any other geographical representation in this paper. While Copernicus Publications makes every effort to include appropriate place names, the final responsibility lies with the authors.
This article is part of the special issue “Environmental impacts of ocean alkalinity enhancement”. It is not associated with a conference.
We would like to thank the Oceanic Platform of the Canary Islands (PLOCAN) and its staff for the use of their facilities and for their help with the logistics and organization of this experiment. We are also grateful to Andrea Ludwig, and Jana Meyer (KOSMOS Logistics and Coordination); to Jan Hennke, Michael Krudewig, and Anton Theileis (KOSMOS technical staff); and to Michael Sswat, Carsten Spisla, Daniel Brüggemann, Silvan Goldenberg, Joaquin Ortiz, Nicolás Sánchez, and Philipp Suessle (KOSMOS Scientific Diving and Maintenance Team). We thank Levka Hansen and Kirstin Nachtigall for the pigment HPLC analyses. We are grateful to Juan Luis Pinchetti and Antera Martel from the Spanish Algae Bank (Taliarte, Gran Canaria, Spain) for providing us with cultures for FCM calibrations and for letting us use their flow cytometers. We are also indebted to Minerva Espino for daily assistance and willingness to help during our stay at the experimental site. We thank the reviewer Katherina Petrou and the other anonymous reviewer for very insightful and much appreciated comments on the paper.
This study was funded by the OceanNETS project (“Ocean-based Negative Emissions Technologies – analysing the feasibility, risks and co-benefits of ocean-based negative emission technologies for stabilizing the climate”, EU Horizon 2020 Research and Innovation Programme, grant agreement no. 869357) and by the Helmholtz European Partnering project Ocean-CDR (“Ocean-based carbon dioxide removal strategies”, project no. PIE-0021), with additional support from the AQUACOSM-plus project (EU H2020-INFRAIA project no. 871081 – “AQUACOSM-plus: Network of Leading European AQUAtic MesoCOSM Facilities Connecting Rivers, Lakes, Estuaries and Oceans in Europe and beyond”).
This paper was edited by Lydia Kapsenberg and reviewed by Katherina Petrou and one anonymous referee.
Adir, N., Bar-Zvi, S., and Harris, D.: The amazing phycobilisome, BBA-Bioenergetics, 1861, 148047, https://doi.org/10.1016/j.bbabio.2019.07.002, 2020.
Agusti, S., Duarte, C. M., Vaqueh, D., Hein, M., Gasol, J. M., and Vidal, M.: Food-web structure and elemental (C, N and P) fluxes in the eastern tropical North Atlantic, Deep-Sea Res. Pt. II, edited by: Koeve, W. and Ducklow, H., Deep-Sea Res. Pt. II, 48, 2295–2321, https://doi.org/10.1016/S0967-0645(00)00179-X, 2001.
Aiken, J., Pradhan, Y., Barlow, R., Lavender, S., Poulton, A., Holligan, P., and Hardman-Mountford, N.: Phytoplankton pigments and functional types in the Atlantic Ocean: A decadal assessment, 1995–2005, Deep Sea Res. Pt. II, 56, 899–917, https://doi.org/10.1016/j.dsr2.2008.09.017, 2009.
Arístegui, J., Hernández-León, S., Montero, M. F., and Gómez, M.: The seasonal planktonic cycle in coastal waters of the Canary Islands, Sci. Mar., 65, 51–58, https://doi.org/10.3989/scimar.2001.65s151, 2001.
Bach, L. T., Ferderer, A. J., LaRoche, J., and Schulz, K. G.: Technical note: Ocean Alkalinity Enhancement Pelagic Impact Intercomparison Project (OAEPIIP), Biogeosciences, 21, 3665–3676, https://doi.org/10.5194/bg-21-3665-2024, 2024.
Baek, S. H., Shimode, S., Han, M. S., and Kikuchi, T.: Growth of dinoflagellates, Ceratium furca and Ceratium fusus in Sagami Bay, Japan: the role of nutrients, Harmful Algae, 7, 729–739, https://doi.org/10.1016/j.hal.2008.02.007, 2008.
Beerling, D. J.: Enhanced rock weathering: biological climate change mitigation with co-benefits for food security?, Biol. Letters, 13, 20170149, https://doi.org/10.1098/rsbl.2017.0149, 2017.
Boatman, T. G., Geider, R. J., and Oxborough, K.: Improving the accuracy of single turnover active fluorometry (STAF) for the estimation of phytoplankton primary productivity (PhytoPP), Front. Mar. Sci., 6, 319, https://doi.org/10.3389/fmars.2019.00319, 2019.
Desai, D. K., Desai, F. D., and LaRoche, J.: Factors influencing the diversity of iron uptake systems in aquatic microorganisms, Front. Microbiol., 3, 362, https://doi.org/10.3389/fmicb.2012.00362, 2012.
Dimier, C., Giovanni, S., Ferdinando, T., and Brunet, C.: Comparative ecophysiology of the xanthophyll cycle in six marine phytoplanktonic species, Protist, 160, 397–411, https://doi.org/10.1016/j.protis.2009.03.001, 2009.
Doney, S. C., Busch, D. S., Cooley, S. R., and Kroeker, K. J.: The impacts of ocean acidification on marine ecosystems and reliant human communities, Annu. Rev. Env. Resour., 45, 83–112, https://doi.org/10.1146/annurev-environ-012320-083019, 2020.
Eisaman, M. D., Geilert, S., Renforth, P., Bastianini, L., Campbell, J., Dale, A. W., Foteinis, S., Grasse, P., Hawrot, O., Löscher, C. R., Rau, G. H., and Rønning, J.: Assessing the technical aspects of ocean-alkalinity-enhancement approaches, in: Guide to Best Practices in Ocean Alkalinity Enhancement Research, edited by: Oschlies, A., Stevenson, A., Bach, L. T., Fennel, K., Rickaby, R. E. M., Satterfield, T., Webb, R., and Gattuso, J.-P., Copernicus Publications, State Planet, 2-oae2023, 3, https://doi.org/10.5194/sp-2-oae2023-3-2023, 2023.
Falkowski, P. G. and Raven, J. A. (Eds.): Aquatic photosynthesis, Second edition, Princeton University Press, Oxford, United Kingdom, ISBN 9780691115511, 488 pp., 2007.
Feng, E. Y., Koeve, W., Keller, D. P., and Oschlies, A.: Model-Based Assessment of the CO2 Sequestration Potential of Coastal Ocean Alkalinization, Earths Future, 5, 1252–1266, https://doi.org/10.1002/2017EF000659, 2017.
Ferderer, A., Chase, Z., Kennedy, F., Schulz, K. G., and Bach, L. T.: Assessing the influence of ocean alkalinity enhancement on a coastal phytoplankton community, Biogeosciences, 19, 5375–5399, https://doi.org/10.5194/bg-19-5375-2022, 2022.
García-Gómez, C., Mata, M. T., Van Breusegem, F., and Segovia, M.: Low-steady-state metabolism induced by elevated CO2 increases resilience to UV radiation in the unicellular green-algae Dunaliella tertiolecta, Environ. Exp. Bot., 132, 163–174, https://doi.org/10.1016/j.envexpbot.2016.09.001, 2016.
Garvey, M., Moriceau, B., and Passow, U.: Applicability of the FDA assay to determine the viability of marine phytoplankton under different environmental conditions, Mar. Ecol. Prog. Ser., 352, 17–26, https://doi.org/10.3354/meps07134, 2007.
Giordano, M., Beardall, J., and Raven, J. A.: CO2 concentrating mechanisms in algae: mechanisms, environmental modulation, and evolution, Annu. Rev. Plant Biol., 56, 99–131, https://doi.org/10.1146/annurev.arplant.56.032604.144052, 2005.
Glass, J. B. and Dupont, C. L.: Oceanic Nickel Biogeochemistry and the Evolution of Nickel Use, in: The Biological Chemistry of Nickel, edited by: Zamble, D., Rowińska-Żyrek, M., and Kozlowski, H., Royal Society of Chemistry, 12–26, https://doi.org/10.1039/9781788010580-00012, 12–26, 2017.
Goeminne, L. J. E., Gevaert, K., and Clement, L.: Experimental design and data-analysis in label-free quantitative LC/MS proteomics: A tutorial with MSqRob, J. Proteomics, 171, 23–36, https://doi.org/10.1016/j.jprot.2017.04.004, 2018.
González-Santana, D., Segovia, M., González-Dávila, M., Ramírez, L., González, A. G., Pozzo-Pirotta, L. J., Arnone, V., Vázquez, V., Riebesell, U., and Santana-Casiano, J. M.: Ocean alkalinity enhancement using sodium carbonate salts does not lead to measurable changes in Fe dynamics in a mesocosm experiment, Biogeosciences, 21, 2705–2715, https://doi.org/10.5194/bg-21-2705-2024, 2024.
Grime, J. P.: The stress debate: symptom of impending synthesis?, Biol. J. Linn. Soc., 37, 3–17, https://doi.org/10.1111/j.1095-8312.1989.tb02002.x, 2009.
Häder, D. P., Kumar, H. D., Smith, R. C., and Worrest, R. C.: Effects on aquatic ecosystems, J. Photoch. Photobio. B, 46, 53–68, https://doi.org/10.1016/S1011-1344(98)00185-7, 1998.
Harris, G. N., Scanlan, D. J., and Geider, R. J.: Responses of Emiliania huxleyi (Prymnesiophyceae) to step changes in photon flux density, Eur. J. Phycol., 44, 31–48, https://doi.org/10.1080/09670260802233460, 2009.
Harrison, J. W. and Smith, R. E.: Effects of nutrients and irradiance on PSII variable fluorescence of lake phytoplankton assemblages, Aquat. Sci., 75, 399–411, https://doi.org/10.1080/09670260802233460, 2013.
Hartmann, J., West, A. J., Renforth, P., Köhler, P., de La Rocha, C. L., Wolf-Gladrow, D. A., Dürr, H. H., and Scheffran, J.: Enhanced chemical weathering as a geoengineering strategy to reduce atmospheric carbon dioxide, supply nutrients, and mitigate ocean acidification, Rev. Geophys., 51, 113–149, https://doi.org/10.1002/rog.20004, 2013.
Hutchins, D. A., Fu, F.-X., Yang, S.-C., John, S. G., Romaniello, S. J., Andrews, M. G., and Walworth, N. G.: Responses of globally important phytoplankton species to olivine dissolution products and implications for carbon dioxide removal via ocean alkalinity enhancement, Biogeosciences, 20, 4669–4682, https://doi.org/10.5194/bg-20-4669-2023, 2023.
IPCC: Climate Change 2021: The Physical Science Basis. Contribution of Working Group I to the Sixth Assessment Report of the Intergovernmental Panel on Climate Change, edited by: Masson-Delmotte, V., Zhai, P., Pirani, A., Connors, S. L., Péan, C., Berger, S., Caud, N., Chen, Y., Goldfarb, L., Gomis, M. I., Huang, M., Leitzell, K., Lonnoy, E., Matthews, J. B. R., Maycock, T. K., Waterfield, T., Yelekçi, O., Yu, R., and Zhou, B., Cambridge University Press, Cambridge, United Kingdom and New York, NY, USA, 2391 pp., https://doi.org/10.1017/9781009157896, 2021.
Ito, H. and Tanaka, A.: Evolution of a divinyl chlorophyll-based photosystem in Prochlorococcus, P. Natl. Acad. Sci.-Biol., 108, 18014–18019, https://doi.org/10.1073/pnas.1107590108, 2011.
Kheshgi, H. S.: Sequestering atmospheric carbon dioxide by increasing ocean alkalinity, Energy, 20, 915–922, https://doi.org/10.1016/0360-5442(95)00035-F, 1995.
Lee, R. B. Y., Smith, J. A. C., Rickaby, R. E. M.: Cloning, expression and characterization of the δ-carbonic anhydrase of Thalassiosira weissflogii (Bacillariophyceae), J. Phycol., 49, 170–177, https://doi.org/10.1111/j.1529-8817.2012.01226.x, 2013.
Lessard, E. J., Merico, A., and Tyrrell, T.: Nitrate : phosphate ratios and Emiliania huxleyi blooms, Limnol. Oceanogr., 50, 1020–1024, https://doi.org/10.4319/lo.2005.50.3.1020, 2005.
Levitan, O., Rosenberg, G., Setlik, I., Setlikova, E., Grigel, J., Klepetar, J., Prasil, O., and Berman-Frank, I.: Elevated CO2 enhances nitrogen fixation and growth in the marine cyanobacterium Trichodesmium, Glob. Change Biol., 13, 531–538, https://doi.org/10.1111/j.1365-2486.2006.01314.x, 2007.
Li, Q., Legendre, L., and Jiao, N.: Phytoplankton responses to nitrogen and iron limitation in the tropical and subtropical Pacific Ocean, J. Plankton Res., 37, 306–319, https://doi.org/10.1093/plankt/fbv008, 2015.
Maldonado, M. T. and Price, N. M.: Influence of N substrate on Fe requirements of marine centric diatoms, Mar. Ecol. Prog. Ser., 141, 161–172, https://doi.org/10.3354/meps14116, 1996.
Marín-Samper, L., Arístegui, J., Hernández-Hernández, N., Ortiz, J., Archer, S. D., Ludwig, A., and Riebesell, U.: Assessing the impact of CO2-equilibrated ocean alkalinity enhancement on microbial metabolic rates in an oligotrophic system, Biogeosciences, 21, 2859–2876, https://doi.org/10.5194/bg-21-2859-2024, 2024.
Marrero, A. D., Quesada, A. R., Martínez-Poveda, B., Medina, M. Á., and Cárdenas, C.: A proteomic study of the bioactivity of Annona muricata leaf extracts in HT-1080 fibrosarcoma cells, Int. J. Mol. Sci., 24, 12021, https://doi.org/10.3390/ijms241512021, 2023.
McKew, B. A., Metodieva, G., Raines, C. A., Metodiev, M. V., and Geider, R. J.: Acclimation of Emiliania huxleyi (1516) to nutrient limitation involves precise modification of the proteome to scavenge alternative sources of N and P, Environ. Microbiol., 17, 4050–4062, https://doi.org/10.1111/1462-2920.12957, 2015.
Millero, F. J., Woosley, R., DiTrolio, B., and Waters, J.: Effect of ocean acidification on the speciation of metals in seawater, Oceanography, 22, 72–85, https://doi.org/10.5670/oceanog.2009.98, 2009.
Montserrat, F., Renforth, P., Hartmann, J., Leermakers, M., Knops, P., and Meysman, F. J. R.: Olivine Dissolution in Seawater: Implications for CO2 Sequestration through Enhanced Weathering in Coastal Environments, Environ. Sci. Technol., 51, 3960–3972, https://doi.org/10.1021/acs.est.6b05942, 2017.
Owen, B. M., Hallett, C. S., Cosgrove, J. J., Tweedley, J. R., and Moheimani, N. R.: Reporting of methods for automated devices: A systematic review and recommendation for studies using FlowCam for phytoplankton, Limnol. Oceanogr.-Meth., 20, 400–427, https://doi.org/10.1002/lom3.10496, 2022.
Oxborough, K., Moore, C. M., Suggett, D. J., Lawson, T., Chan, H. G., and Geider, R. J.: Direct estimation of functional PSII reaction center concentration and PSII electron flux on a volume basis: a new approach to the analysis of Fast Repetition Rate fluorometry (FRRf) data, Limnol. Oceanogr.-Meth., 10, 142–154, https://doi.org/10.4319/lom.2012.10.142, 2012.
Paul, A. J., Haunost, M., Goldenberg, S. U., Hartmann, J., Sánchez, N., Schneider, J., Suitner, N., and Riebesell, U.: Ocean alkalinity enhancement in an open ocean ecosystem: Biogeochemical responses and carbon storage durability, EGUsphere [preprint], https://doi.org/10.5194/egusphere-2024-417, 2024.
Paulino, A. I., Egge, J. K., and Larsen, A.: Effects of increased atmospheric CO2 on small and intermediate sized osmotrophs during a nutrient induced phytoplankton bloom, Biogeosciences, 5, 739–748, https://doi.org/10.5194/bg-5-739-2008, 2008.
Prášil, O., Kolber, Z. S., and Falkowski, P. G.: Control of the maximal chlorophyll fluorescence yield by the QB binding site, Photosynthetica, 56, 150–162, https://doi.org/10.1007/s11099-018-0768-x, 2018.
Price, G. D.: Inorganic carbon transporters of the cyanobacterial CO2 concentrating mechanism, Photosynth. Res., 109, 47–57, https://doi.org/10.1007/s11120-010-9608-y, 2011.
Raven, J. A.: The cost of photoinhibition, Physiol. Plantarum, 142, 87–104, https://doi.org/10.1111/j.1399-3054.2011.01465.x, 2011.
R Core Team: R: A language and environment for statistical computing, R Foundation for Statistical Computing, Vienna, Austria, https://www.R-project.org/ (last access: 22 September 2024), 2022.
Renforth, P. and Henderson, G.: Assessing ocean alkalinity for carbon sequestration, Rev. Geophys., 55, 636–674, https://doi.org/10.1002/2016RG000533, 2017.
Riahi, K., van Vuuren, D. P., Kriegler, E., Edmonds, J., O’Neill, B. C., Fujimori, S., Bauer, N., Calvin, K., Dellink, R., Fricko, O., Lutz, W., Popp, A., Crespo Cuaresma, J., KC, S., Leimbach, M., Jiang, L., Kram, T., Rao, S., Emmerling, J., Ebi, K., Hasegawa, T., Havlik, P., Humpenöder, F., Da Silva, L. A., Smith, S., Stehfest, E., Bosetti, V., Eom, J., Gernaat, D., Masui, T., Rogelj, J., Strefler, J., Drouet, L., Krey, V., Luderer, G., Harmsen, M., Takahashi, K., Baumstark, L. C., Doelman, J. C., Kainuma, M., Klimont, Z., Marangoni, G., Lotze-Campen, H., Obersteiner, M., Tabeau, A., and Tavoni, M.: The Shared Socioeconomic Pathways and their energy, land use, and greenhouse gas emissions implications: An overview, Global Environ. Chang., 42, 153–168, https://doi.org/10.1016/j.gloenvcha.2016.05.009, 2017.
Riebesell U. and Tortell P. D.: Effects of ocean acidification on pelagic organisms and ecosystems, in: Ocean acidification, edited by: Gattuso J.-P. and Hansson L., Oxford University Press, Oxford, United Kingdom, 99–121, ISBN 9780199591091, 2011.
Riebesell U., Schulz K. G., Bellerby R. G. J., Botros M., Fritsche P., Meyerhöfer M., Neill C., Nondal G., Oschlies A., Wohlers J., and Zöllner E.: Enhanced biological carbon consumption in a high CO2 ocean, Nature, 450, 545–548, https://doi.org/10.1038/nature06267, 2007.
Riebesell, U., Czerny, J., von Bröckel, K., Boxhammer, T., Büdenbender, J., Deckelnick, M., Fischer, M., Hoffmann, D., Krug, S. A., Lentz, U., Ludwig, A., Muche, R., and Schulz, K. G.: Technical Note: A mobile sea-going mesocosm system – new opportunities for ocean change research, Biogeosciences, 10, 1835–1847, https://doi.org/10.5194/bg-10-1835-2013, 2013.
Riebesell, U., Basso, D., Geilert, S., Dale, A. W., and Kreuzburg, M.: Mesocosm experiments in ocean alkalinity enhancement research, in: Guide to Best Practices in Ocean Alkalinity Enhancement Research, edited by: Oschlies, A., Stevenson, A., Bach, L. T., Fennel, K., Rickaby, R. E. M., Satterfield, T., Webb, R., and Gattuso, J.-P., Copernicus Publications, State Planet, 2-oae2023, 6, https://doi.org/10.5194/sp-2-oae2023-6-2023, 2023.
Rodríguez, F., Garrido, J. L., Sobrino, C., Johnsen, G., Riobó, P., Franco, J., Aamot, I., Ramilo, I., Sanz, N., and Kremp, A.: Divinyl chlorophyll a in the marine eukaryotic protist Alexandrium ostenfeldii (Dinophyceae), Environ. Microbiol., 18, 627–643, https://doi.org/10.1111/1462-2920.13042, 2016.
Rost, B. and Riebesell, U.: Coccolithophores and the biological pump: responses to environmental changes, in: Coccolithophores, edited by: Thierstein, H. R. and Young, J. R., Springer, Berlin, Heidelberg, Germany, https://doi.org/10.1007/978-3-662-06278-4_5, 99–125, 2004.
Schoffmann, H., Lis, H., Shaked, Y., and Keren, N.: Iron-Nutrient interactions within Phytoplankton, Front. Plant. Sci., 7, 1223, https://doi.org/10.3389/fpls.2016.01223, 2016.
Segovia, M. and Berges, J. A.: Inhibition of caspase-like activities prevents the appearance of reactive oxygen species and dark-induced apoptosis in the unicellular chlorophyte Dunaliella tertiolecta, J. Phycol., 45, 1116–1126, https://doi.org/10.1111/j.1529-8817.2009.00733.x, 2009.
Segovia, M., Haramaty, L., Berges, J. A., and Falkowski, P. G.: Cell death in the unicellular chlorophyte Dunaliella tertiolecta. A hypothesis on the evolution of apoptosis in higher plants and metazoans, Plant Physiol., 132, 99–105, https://doi.org/10.1104/pp.102.017129, 2003.
Segovia, M., Mata, T., Palma, A., García-Gómez, C., Lorenzo, R., Rivera, A., and Figueroa, F. L.: Dunaliella tertiolecta (Chlorophyta) avoids cell death under ultraviolet radiation by triggering alternative photoprotective mechanisms, Photoch. Photobio., 91, 1389–1402, https://doi.org/10.1111/php.12502, 2015.
Segovia, M., Lorenzo, M. R., Maldonado, M. T., Larsen, A., Berger, S. A., Tsagaraki, T. M., and Egge, J. K.: Iron availability modulates the effects of future CO2 levels within the marine planktonic food web, Mar. Ecol. Prog. Ser., 565, 17–33, https://doi.org/10.3354/meps12025, 2017.
Segovia, M., Lorenzo, M. R., Iñiguez, C., and García-Gómez, C.: Physiological stress response associated with elevated CO2 and dissolved iron in a phytoplankton community dominated by the coccolithophore Emiliania huxleyi, Mar. Ecol. Prog. Ser., 586, 73–89, https://doi.org/10.3354/meps12389, 2018.
Silsbe, G. M. and Kromkamp, J. C.: Modeling the irradiance dependency of the quantum efficiency of photosynthesis, Limnol. Oceanogr.-Meth., 10, 645–652, https://doi.org/10.4319/lom.2012.10.645, 2012.
Sobrino, C., Segovia, M., Neale, P. J., Mercado, J. M., García-Gómez, C., Kulk, G., Lorenzo, M. R., Camarena, T., van de Poll, W. H., Spilling, K., and Ruan, Z.: Effect of CO2, nutrients and light on coastal plankton. IV. Physiological responses, Aquat. Biol., 22, 77–93, https://doi.org/10.3354/ab00590, 2014.
Stolte, W., Kraay, G. W., Noordeloos, A. A., and Riegman, R.: Genetic and physiological variation in pigment composition of Emiliania huxleyi (Prymnesiophyceae) and the potential use of its pigment ratios as a quantitative physiological marker, J. Phycol., 36, 529–539, https://doi.org/10.1046/j.1529-8817.2000.99158.x, 2000.
Stolte, W., Kraay, G. W., Noordeloos, A. A. M., and Riegman, R.: Genetic and physiological variation in pigment composition of Emiliania huxleyi (Prymnesiophyceae) and the potential use of its pigment ratios as a quantitative physiological marker, J. Phycol., 36, 529–539, https://doi.org/10.1046/j.1529-8817.2000.99158.x, 2003.
Suggett, D. J., MacIntyre, H. L., and Geider, R. J.: Evaluation of biophysical and optical determinations of light absorption by photosystem II in phytoplankton, Limnol. Oceanogr.-Meth., 2, 316–332, 2004.
Suggett, D. J., Moore, C. M., Hickman, A. E., and Geider, R. J.: Interpretation of fast repetition rate (FRR) fluorescence signatures of phytoplankton community structure versus physiological state, Mar. Ecol. Prog. Ser., 376, 1–19, 2009.
Takaichi, S.: Carotenoids in algae: distributions, biosyntheses and functions, Mar. Drugs, 9, 1101–1118, https://doi.org/10.3390/md9061101, 2011.
Taucher, J., Bach, L. T., Boxhammer, T., Nauendorf, A., The Gran Canaria KOSMOS Consortium, Achterberg, E. P., Algueró-Muñiz, M., Arístegui, J., Czerny, J., Esposito, M., Guan, W., Haunost, M., Horn, H. G., Ludwig, A., Meyer, J., Spisla, C., Sswat, M., Stange, P., and Riebesell, U.: Influence of ocean acidification and deep water upwelling on oligotrophic plankton communities in the subtropical North Atlantic: Insights from an in situ mesocosm study, Front. Mar. Sci., 4, 85, https://doi.org/10.3389/fmars.2017.00085, 2017.
The jamovi project: jamovi (Version 2.3) [Computer Software], https://www.jamovi.org (last access: 22 September 2024), 2022.
Thomas, C. and Tampé, R.: Structural and mechanistic principles of ABC transporters, Annu. Rev. Biochem., 89, 605–636, https://doi.org/10.1146/annurev-biochem-011520-105201, 2020.
Utermohl, H.: Zur Vervollkommung der quantitativen phytoplankton-methodik, Mitt. Int. Ver. Limnol., 9, 1–38, https://doi.org/10.1080/05384680.1958.11904091, 1958.
Van Heukelem, L. and Thomas, C. S.: Computer-assisted high-performance liquid chromatography method development with applications to the isolation and analysis of phytoplankton pigments, J. Chromatogr. A, 910, 31–49, https://doi.org/10.1016/s0378-4347(00)00603-4, 2001.
Vinebrooke, R. D., Cottingham, K. L., Norberg, J., Scheffer, M., Dodson, S. I., Maberly, S. C., and Sommer, U.: Impacts of multiple stressors on biodiversity and ecosystem functioning: the role of species co-tolerance, Oikos, 104, 451–457, https://doi.org/10.1111/j.0030-1299.2004.13255.x, 2004.
Webb, W. L., Newton, M., and Starr, D.: Carbon dioxide exchange of Alnus rubra, Oecologia, 17, 281–291, https://doi.org/10.1007/BF00345747, 1974.