the Creative Commons Attribution 4.0 License.
the Creative Commons Attribution 4.0 License.
 | 17 Jun 2025
Depth effects of long-term organic residue application on soil organic carbon stocks in central Kenya
Claude Raoul Müller
Johan Six
Daniel Mugendi Njiru
Bernard Vanlauwe
Marijn Van de Broek
In arable soils, a substantial portion of soil organic carbon (SOC) is stored below the plough layer. To develop sustainable soil management strategies, it is important to assess how they affect the quantity of SOC stored in the subsoil. Therefore, we investigated the impact of organic and inorganic nutrient inputs on SOC stocks down to 70 cm depth in a long-term field trial in Embu, Kenya. There were three organic input treatments (manure, Tithonia diversifolia residues, and maize stover) and a control treatment, each with and without the application of mineral nitrogen. These different treatments were applied to a maize monoculture over 38 growing seasons (19 years). Our results show that manure application had the largest positive impact on SOC stocks compared to the control; this effect was observed down to 60 cm depth. In contrast, Tithonia diversifolia and maize stover application led to significantly larger SOC stocks compared to the control, although this was only within the top 20 cm and 40 cm, respectively. Among the three organic residue treatments, only the application of manure had a significant effect on the SOC stock of the subsoil (i.e. the 30–70 cm depth layer). However, when considering the whole measured profile (i.e. 0–70 cm), all treatments led to significantly higher SOC stocks compared to the 91 ± 12 t C ha−1 of the control: manure had the highest stocks (120 ± 24 t C ha−1), followed by maize stover (112 ± 17 t C ha−1) and Tithonia diversifolia (105 ± 11 t C ha−1). Mineral nitrogen application did not have a significant impact on SOC stocks down to 70 cm depth. Our findings demonstrate that SOC in the subsoil comprised 48.5 % ± 1.7 % of the total SOC stocks across the 0–70 cm soil profile; however, only manure application affected subsoil OC levels, whereas other organic amendments solely increased SOC in the surface layer. Our results imply that gathering knowledge on the soil below the typically studied 0–30 cm depth layer will improve the overall assessment of agroecosystem properties, which is necessary to optimize soil system resilience, limit organic matter losses, and improve crop productivity.
- Article
(1983 KB) - Full-text XML
-
Supplement
(708 KB) - BibTeX
- EndNote


Globally, food production systems need to satisfy the food demand of an increasingly taxing and growing population. However, changing land use for food production and increasing productivity leads to intense utilization of our limited natural resources, which can have a negative impact on the quality of groundwater and the atmosphere. In the long term, intensifying agriculture also leads to soil quality degradation (e.g. through crusting, compaction, erosion, and the depletion of organic matter) (Lal, 2008). Tropical regions are currently experiencing the most significant land-use change globally, largely due to the rapid conversion of natural habitats to agricultural land (Hansen et al., 2013). Between 1988 and 2017, eastern Africa followed this trend, experiencing a substantial land-use transformation, with cropland expanding by 35 % and settlements by 43 %, primarily at the expense of woody vegetation (Bullock et al., 2021). This swift alteration of land use has had substantial effects on the amount of soil organic carbon (SOC) stored in tropical ecosystems, which contain approximately 44 % of the global SOC (Veldkamp et al., 2020). The concentration of SOC is an important component of soil fertility, as it serves as a vital nutrient source for plants and microbes (Chen and Aviad, 1990; Trevisan et al., 2010). Thus, maintaining SOC levels over time is crucial for sustaining soil productivity, especially in the highly weathered soils of tropical regions, which are particularly prone to organic carbon (OC) loss (Feller and Beare, 1997). The conversion of tropical forests to agriculture typically results in an average reduction in the OC concentration in the topsoil (down to a depth of 30 cm) of around 50 % within 25 years (Veldkamp et al., 2020).
The regular harvesting of crops in farming systems results in the removal of nutrients that the plants have taken up. Thus, inadequate inputs of organic matter and nutrients in the farming systems of sub-Saharan Africa (SSA) often lead to the loss of SOC and nutrient depletion, contributing to the lower yields observed in SSA compared to other regions of the world (Vanlauwe and Giller, 2006). Therefore, agricultural management should not only aim at increasing crop yield in the short term but also at maintaining SOC at a level that retains the key functions that it regulates (e.g. nutrient cycling, water retention, improved cation exchange capacity (CEC), soil structure stabilization, and promotion of biodiversity) in the long term (Wiesmeier et al., 2019). Ideally, the management of cropping systems should respect the principles of sustainable intensification by maximizing production while preserving the environment; different management approaches exist to reach this goal (Pretty, 2011). An example of this is integrated soil fertility management (ISFM), which is defined by Vanlauwe et al. (2010) as “a set of soil fertility management practices that necessarily include the use of fertilizer, organic inputs, and improved germplasm combined with the knowledge on how to adapt these practices to local conditions, aiming at maximizing agronomic use efficiency of the applied nutrients and improving crop productivity. All inputs need to be managed following sound agronomic principles”. This approach promotes various practices, including the combined application of mineral fertilizer and organic residues (ORs) such as plant residues, manure, and, compost. Such practices aim to enhance crop productivity while preserving soil fertility, especially in a context where input availability is often limited, as is the case for smallholder farming in SSA.
Applying ORs over multiple years in tropical croplands can significantly increase the SOC content (Fujisaki et al., 2018), despite faster SOC turnover rates in tropical climates compared to temperate regions (Wang et al., 2018). However, the contribution of ORs to the amount of SOC is, in part, controlled by the type of added OR (Córdova et al., 2018). The residue quality has traditionally been defined by the nitrogen, lignin, and polyphenol content of organic inputs; overall, the lower the (lignin + polyphenol) N ratio, the higher the quality of the residue (Chivenge et al., 2011b; Vanlauwe et al., 2005). According to Córdova et al. (2018), applying high-quality residues has the potential to lead to a higher accumulation of stable C in the soil compared with low-quality residues. However, an incubation experiment on tropical soil indicated that, while this might be true in the short term, the initial OR quality does not affect SOC accumulation in the long term (Gentile et al., 2011). Moreover, Laub et al. (2023b) found that, for four tropical agroecosystems in Kenya, it is mainly the application of animal manure that has the potential to limit SOC losses from intensive arable soil use. Most importantly, according to Vanlauwe et al. (2015), the efficiency of strategies to increase the SOC content is determined by variations in local soil conditions. This is supported by the variability in results obtained by different studies in tropical soils that either suggest that (1) increasing the SOC content with adapted practices is possible (Adams et al., 2020; Fujisaki et al., 2018; Laub et al., 2022) or (2) the application of large amounts of organic residues is not sufficient to increase or even maintain the SOC content (Kihara et al., 2020; Cardinael et al., 2022; Laub et al., 2023b). The contradictory findings across tropical regions highlight the complexity of SOC dynamics in these agroecosystems, where different factors, such as initially high SOC contents, favourable conditions to decomposition, and the limited capacity of 1:1 kaolinite clay minerals to stabilize OC, contribute to consistent SOC losses despite the application of organic residues in tropical soils (Laub et al., 2023b; Six et al., 2002; Sommer et al., 2018). This knowledge gap is particularly evident in tropical agroecosystems, where the interactions between organic amendments, soil properties, and SOC stabilization mechanisms remain poorly understood, necessitating further research.
In most studies on agroecosystems, soils are studied down to 30 cm on average (Yost and Hartemink, 2020). Therefore, we defined the threshold between the topsoil and subsoil as 30 cm. Additionally, while field studies on plant nutrient acquisition from the subsoil are rare, it has been shown that crop nutrient availability can be improved when ORs and mineral fertilizer are placed in deeper soil layers (20–40 cm depth), suggesting that subsoil OC can play an active role in nutrient use efficiency (Liu et al., 2021; Ma et al., 2022). This seems rational, as most plant roots extend beyond a depth of 30 cm, allowing them to benefit from nutrient availability and cycling in the subsoil (Greenwood et al., 1982; Tardieu, 1988). Also, studying only topsoil OC is not sufficient to estimate the effect of management practices on the OC storage capacity of soils, as it is estimated that 50 % of SOC stocks are located below 30 cm (Balesdent et al., 2018; Lal, 2018; Shumba et al., 2024; Yost and Hartemink, 2020). Moreover, not only do plant roots and their associated exudates provide direct OC inputs to the subsoil (Van de Broek et al., 2020), but organic matter applied in the topsoil also undergoes cycles of sorption and desorption through microbial processing, gradually migrating down the soil profile (Kaiser and Kalbitz, 2012a). The average residence time of subsoil OC ranges from decades to millennia (Balesdent et al., 2018; Mathieu et al., 2015), making the subsoil a potential long-term carbon sink (Rumpel and Kögel-Knabner, 2011). However, only a small proportion of new OC inputs to the subsoil can potentially be stabilized in the long term or are able to affect the subsoil environment in the short term (Sierra et al., 2024). These new OC inputs in the subsoil can be detected through their Δ14C signature, which is used as a proxy for the age of carbon-containing soil components (Ehleringer et al., 2000; Trumbore et al., 1989). Furthermore, δ13C can be used to detect the portion of C3 plant residues compared to C4 plant residues in the subsoil, enabling, for example, the tracking of maize-derived carbon inputs (Balesdent et al., 1987; Farquhar et al., 1989). Understanding the impact of the application of ORs on SOC storage in the subsoil would aid the investigation of the importance of the subsoil environment for plant nutrient accessibility.
In a recent study conducted at the same long-term field trial location studied in this paper (Embu), Laub et al. (2023b) showed that all nutrient management treatments resulted in significant topsoil SOC losses, while the use of farmyard manure was the most effective strategy to minimize the loss of SOC. In their study on the Embu site, they observed consistent decreases in the SOC concentration over time for all treatments (Fig. S8). The control treatment showed the greatest decline, with a loss of about 0.6–0.7 g C kg−1 yr−1. Despite differences in treatment effectiveness with respect to maintaining OC, farmyard manure (at 4 t C ha−1 yr−1) emerged as the most effective strategy to limit SOC losses at Embu, with the lowest OC loss (i.e. 0.4 g C kg−1 yr−1). However, the focus of the aforementioned work was on the effects of treatments above 15 cm depth. Therefore, in this study, we explore the effects on the deeper soil layers, with a high vertical resolution (5 cm), at the sites studied by Laub et al. (2023b).
Given the limited knowledge on how organic amendments and fertilizer management affect subsoil OC dynamics in tropical agroecosystems, this study aims to examine the impact of different organic residue treatments on SOC stocks down to 70 cm by answering the following research question: “Down to which depth do the different organic residues affect SOC stocks?”.
2.1 Study design
2.1.1 Study area
The field trial was initiated in Embu (0°30′ S, 37°27′ E; 1380 m above sea level), central Kenya, in 2002. At the site, a continuous maize monoculture has been grown in two annual growing seasons that coincide with the bimodal precipitation pattern. The long rainy season generally occurs from March to September, with the precipitation amount gradually decreasing toward the end of the season, leading into a dry period. The short rainy season spans from October to February, also tapering off into a dry period. The average annual precipitation is 1175 mm, and the mean annual temperature is 20.1 °C. The soil in this area is a highly weathered Humic Nitisol. Originally, the site was covered by tropical evergreen forest before conversion to a low-intensity agricultural area. Before the experiment started, the site was terraced to ensure that the plots were level. Additional details about the site can be found in previously published studies (Chivenge et al., 2009, 2011a; Gentile et al., 2008; Laub et al., 2023b).
2.1.2 Experimental design
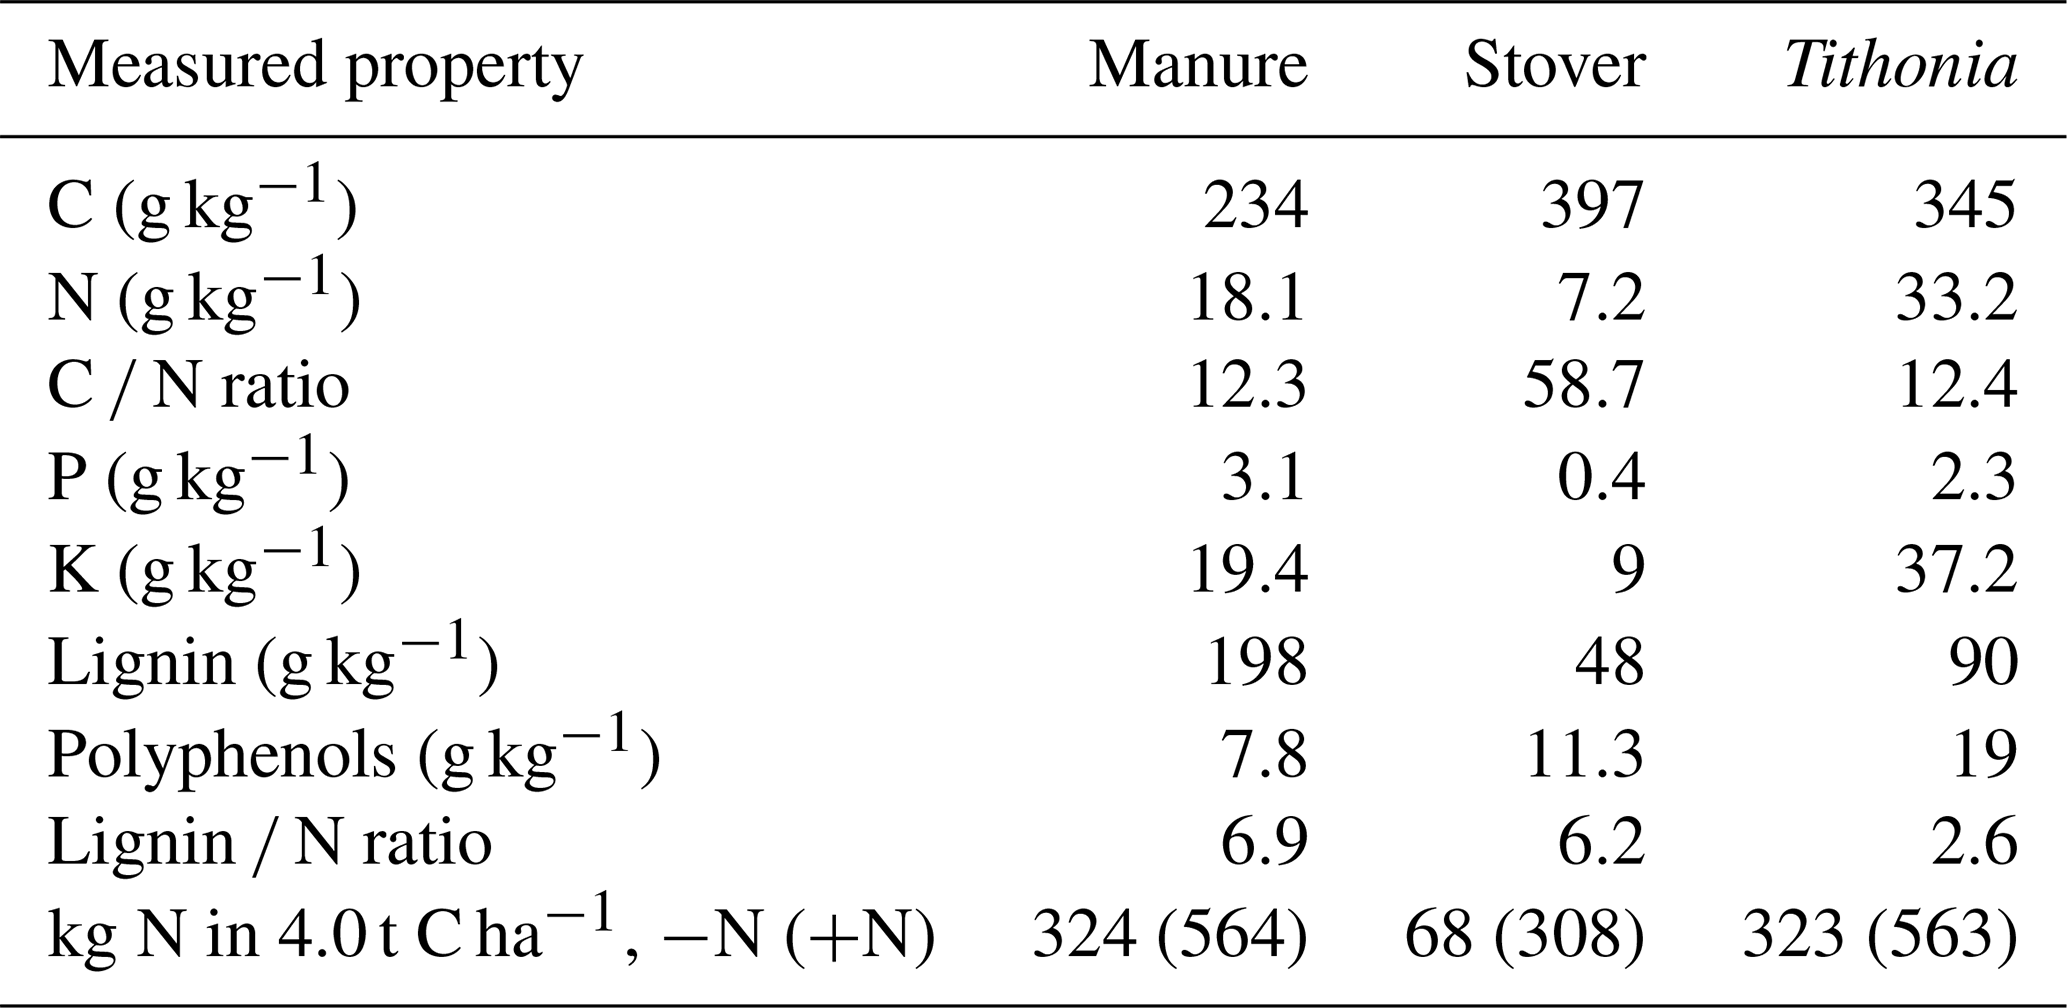
The field experiment has a split-plot design with three replications. Four nutrient management treatments were selected for the present study, involving the application of three organic residues with varying qualities (at a rate of 4.0 t C ha−1 yr−1) and a control treatment (Control; no organic residues were added). These application rates are higher than those typically used by local farmers, thereby allowing for a more pronounced assessment of the potential impacts on SOC. These organic residues were applied once annually before the long rainy season and were incorporated in the soil through manual tilling to a depth of approximately 15 cm. Each plot was further divided into two subplots, with one subplot receiving an application of 120 kg of mineral nitrogen per hectare per growing season (+N treatment), while the other others did not receive any mineral nitrogen input (−N treatment). Mineral N (CaNH4NO3) was applied twice during each growing season: an initial 40 kg N ha−1 at planting and the remaining 80 kg N ha−1 approximately 6 weeks later as a top dressing. In every growing season, all plots were subjected to a uniform application of 60 kg P ha−1 in the form of triple superphosphate and 60 kg K ha−1 as muriate of potash at planting. The organic resources utilized in the present study exhibited variations in quality, characterized by differences in the nitrogen, lignin, and polyphenol contents (Table 1). These included pruned leaves, comprising stems with a thickness of less than 2 cm, from Tithonia diversifolia (Tithonia; high quality with rapid turnover), stover of Zea mays (Stover; low quality and fast turnover), and locally available farmyard manure (Manure; intermediate to high quality with intermediate turnover). The relevant properties of the different organic inputs are given in Table 1. After harvest, any remaining parts of the maize plant were removed from the plots. Therefore, the only OC inputs left from the maize crop came from the roots and root exudates.
This study focuses on the effect of organic residues as compared to the control. The treatments include both the −N and +N alternatives combined and are referred to here as Manure (i.e. farmyard manure), Tithonia (i.e. residues of Tithonia diversifolia), Stover (i.e. residues of maize stover), and Control (i.e. no organic residue added). Whenever we refer to a treatment specifically with or without mineral N, a “−N” or a “+N” symbol is added to the treatment name. For example, Manure −N represents the application of manure without mineral N, whereas Control +N means no that only mineral fertilizer was added; however, Tithonia includes both the Tithonia +N and Tithonia −N treatments.
Table 1Mean dry-matter properties of the organic resources applied (source: Laub et al., 2023b).
2.1.3 Sample collection
The field campaign took place in February 2021, 19 years after the establishment of the long-term field trial and following 38 maize growing seasons. Undisturbed soil samples were collected down to 70 cm using a gauge auger: one core was taken near the middle of each sampled plot. Given the auger's 50 cm length, samples were obtained in two stages: (1) a first sample down to 50 cm and (2) a second sample from 50 to 70 cm using an extension for the auger. Subsections of 5 cm were obtained and weighed, and a 5 g subsample of each sample was immediately placed in an air-tight recipient to determine the water content and calculate the bulk density (see Sect. 2.2.1). The samples were sieved through an 8 mm sieve on the day of collection and air-dried in Kenya. In the lab, ca. 1 week later, the samples were sieved through a 2 mm sieve, and the large organic residues (> 2 mm) that passed through the sieve were removed by hand. The samples were dried at 45 °C. Using a soil splitter, samples were separated homogeneously in two parts, with one part being ground and the other part being stored without grinding. The stocks of SOC were determined for the following depth layers: 0–5, 5–10, 15–20, 25–30, 35–40, 45–50, 55–60, and 65–70 cm. Each treatment (including the control) had two variations (with and without mineral nitrogen input), each variation was replicated 3 times (i.e. 4 treatments × 2 variations × 3 replicates = 24 plots), and 8 depth layers were selected, resulting in 192 samples.
2.2 Laboratory analyses
2.2.1 Bulk density
The dry weight of each subsection and the inside volume of the auger were used to calculate the bulk density. Because of disturbances to samples collected from the 45–50 and 50–55 cm sections during sampling, the 45–50 and 50–55 cm sections' bulk density values were replaced by the mean value of the 40–45 and 55–60 cm layers from the same profile.
2.2.2 Soil organic carbon stocks and δ13C values
Before the analysis of OC and nitrogen, large organic matter particles were removed with tweezers after the sample was spread on a smooth surface. Samples were not treated with HCl before OC analysis, as the pH of all samples was ≤ 6 and none of 12 samples to which HCl was added showed any reaction, indicating the absence of carbonates. Afterward, 11–15 mg of dried and ground soil was weighed in a tin cup. The samples were analysed using an elemental analyser–isotope ratio mass spectrometer (Thermo Flash HT/EA or CE 1110 coupled to a DELTA V Advantage), to obtain the OC and nitrogen concentrations and δ13C values. The OC concentration was subsequently converted to stocks using the measured bulk density. While bulk density was available for each depth layer in 5 cm increments, the OC concentration was only measured on selected layers (i.e. 0–5, 5–10, 15–20, 25–30, 35–40, 45–50, 55–60, and 65–70 cm). To calculate SOC stocks over the whole profile, depth layers without OC concentration measurements were first interpolated using available data from adjacent layers within each profile. This interpolation was performed using the “approxfun” function in R.
2.2.3 Δ14C values
Homogenized soil samples were fumigated in silver capsules (Elementar) with HCl (37 %) for 72 h to remove carbonate (Komada et al., 2008). Fumigated samples were neutralized for 24 h at 60 °C over solid NaOH to remove residual acid. The samples were wrapped in an 8 mm × 8 mm × 15 mm tinfoil boat (Elementar) and pressed prior to analysis. Fumigated samples were analysed for Δ14C using a gas ion source of the MICADAS system at ETH Zurich. Samples were normalized using oxalic acid II (NIST SRM4990C). The measured Δ14C δ12C ratios are reported as radiocarbon (F14C), as established by Stuiver and Polach (1977) (Reimer et al., 2004).
2.2.4 Effective cation exchange capacity
Before the analysis of the effective cation exchange capacity (CECeff), organic matter macroparticles were removed from the soil sample. Subsequently, 2 g of dried and milled soil was measured and placed in a centrifugation tube, and 25 mL of 0.01 M BaCl2 was added. The sample was then agitated on a reciprocal shaker at 150 rpm for 2 h. Next, the sample was centrifugated for 10 min at 2500 rpm. The supernatant was then filtered through a Whatman 41 filter. After filtration, 1 mL of the solution was diluted in 4 mL of water ( solution). The diluted solution was analysed using inductively coupled plasma optical emission spectrometry (ICP-OES; G8010A Agilent 5100 SVDV ICP-OES, Parent Asset SYS-10-5100). The concentrations of Al, Ca, K, Mg, Mn, and Na in the solution were subsequently converted to centimoles per kilogram of soil before calculating the CECeff by summing the concentrations of all of the aforementioned cations (Hendershot and Duquette, 1986). CECeff was measured for the 0–5, 35–40, and 65–70 cm depth layers.
2.2.5 Soil texture
To analyse soil texture, 200–300 mg of soil sieved through a 2 mm sieve was weighed in a glass jar and treated four times with 10 mL H2O2 in a warm water bath (ca. 50 °C) to completely remove organic matter. The samples were then transferred into a plastic tube, 7 mL of 10 % (NaPO3)6 was added, and the mixture was shaken overnight to completely disperse the soil minerals. The particle size was analysed using a particle size analyser (LS13320, Beckman Coulter) to obtain the fraction of clay (vol % < 2 µm), silt (vol % 2–53 µm), and sand (vol % > 53 µm). Texture was measured for the 0–5, 45–50, and 65–70 cm depth layers.
2.2.6 Soil pH
The soil pH was determined using a pH meter (150 Series waterproof handheld meter, Thermo Scientific™ Eutech™). To prepare the soil samples, 10 g of dried soil was placed in a tube, and 25 mL of deionized water was added. The tubes were shaken on a reciprocal shaker at 150 rpm for 2 h. Afterward, the slurry was allowed to settle for 24 h. Prior to measurement, the pH electrode was calibrated using buffer solutions with pH values of 7 and 4. Care was taken to ensure that the diaphragm of the electrode did not come into contact with the soil particles. The pH was considered stable when the measured pH value remained constant within 0.02 units over a period of 5 s. The soil pH was measured for the 5–10, 15–20, 35–40, and 55–60 cm depth layers.
2.3 Statistical analysis
2.3.1 Linear mixed-effects models of the treatment effects over the depth profile
To test which measured variables significantly affect SOC stocks along the depth profile, a linear mixed-effects model was constructed. Linear mixed-effects models are linear models that allow one to separate an independent variable into fixed effects and random effects. They are particularly useful when more than one measurement is made on a given statistical unit. Therefore, this type of model is suitable for this work, as there was more than one sample for each site. No outliers were detected, using the box plot method with the “identify_outliers” R function (Kassambara, 2022). Normality of the data was confirmed visually (Fig. S1a), and homogeneity of variance was verified, showing no evident relationship between residuals and fitted values (Fig. S1b). The linear mixed-effects model was built with the “lmer” function of the “lmerTest” package (Kuznetsova et al., 2017). To avoid overfitting and ensure the robustness of the results, interactions were excluded. This approach simplified the model, focusing on the main effects and accounting for variability through random effects, thereby reducing the risk of capturing noise rather than true patterns. We evaluated the robustness of the model by fitting six different linear mixed-effects models using the lmer function. Each model included OC stocks as the response variable, the sampling plot as a random effect, and different combinations of fixed-effect predictor variables: model 1 (depth, organic residues, mineral fertilizer, silt content, and sand content), model 2 (depth, silt content, and sand content), model 3 (depth and organic residues), model 4 (depth and mineral fertilizer), model 5 (organic fertilizer), and model 6 (mineral fertilizer). Other measured parameters, such as pH and CECeff, were not considered in this model, as they correlated with the application of all three types of organic residues (especially manure) (Fig. 1). We then compared these models with an ANOVA to determine the best-fitting model based on the Akaike information criterion (AIC), Bayesian information criterion (BIC), log-likelihood, and deviance values (Table S1). To further test the effect of organic residue treatment application in the deeper soil layers, the same analysis was performed on a subset containing only subsoil layers (Table S2).
2.3.2 Two-sample t tests between treatments
To evaluate the impact of organic residue treatments on SOC stocks along the soil profile, we examined SOC stocks at different depth intervals. This analysis involved conducting a two-sample t test for each organic residue treatment to assess the difference in SOC stocks between the treatment and the control across various depth layers. The depth layers examined included the OC stocks of the entire profile (0–70 cm), the OC stocks of two combined topsoil or combined subsoil depth layers (0–30 and 30–70 cm), and the OC stocks of each individual 5 cm depth layer (0–5, 5–10, 15–20, 25–30, 35–40, 45–50, 55–60, and 65–70 cm). To increase the statistical power, statistical analyses were performed by combining the +N and −N sub-treatments of the same treatment, thereby focusing solely on the effect of organic residue application on SOC stocks. This approach was justified by the results of the linear mixed-effects model, which indicated that mineral fertilizer did not significantly affect SOC over the depth profile.
Due to the violation of homogeneity of variance for some depth layers, OC stock data were log-transformed. An ANOVA was then performed on each depth layer, after normality and homogeneity assumptions of the log-transformed data were confirmed (Table S5). Given the limited data from the long-term field trial and the increasing variability with depth, we opted for t tests over Tukey's test to identify which OR treatment had significantly higher OC stocks than the control treatment and at which depth layers. Compared to t tests, Tukey's test following an ANOVA would be more negatively affected by the limited statistical power in this study. Our choice was supported by the fact that, when the statistical significance of the t test was not achieved, the statistical power (see Sect. 2.3.3) was always below 80 % (Fig. 4). Therefore, we argue that type-I error inflation due to the number of t tests performed does not apply in our context, and we are more likely to encounter type-II errors.
We conducted a Welch two-sample t test on log-transformed OC stocks between the control and each organic residue treatment at every depth layer mentioned earlier. This analysis was performed using the “t.test” function in R, after normality and homogeneity assumptions of the log-transformed data were confirmed (Table S4, Fig. S9). Treatments were considered significantly different than the control when their p value was ≤ 0.05. In the analysis of each 5 cm depth layer, if one layer showed a p value greater than 0.05 while the two layers above and the two layers below showed significant differences compared to the control, the lack of significance in the layer above was attributed to sampling variability. Consequently, the treatment was considered to affect OC stocks down to the deepest layer where a significant deviation from the control was observed. This was only the case for the Manure treatment at a depth of 25–30 cm.
The impact of organic residue treatments on soil pH and CECeff was further assessed using a Welch two-sample t test, similar to the approach used for the analysis of SOC stocks. These tests compared organic residue treatments with the control treatment, with all treatments including combined +N and −N sub-treatments, at each individual depth layer where these parameters were measured.
To validate the findings of the linear mixed-effects model regarding the effect of mineral fertilizer, we compared the difference between the +N and −N versions of each organic residue treatment (as well as the control). This comparison was performed using a Welch two-sample t test across the same depth layers utilized in the analysis of the effects of organic residues (i.e. 0–70, 0–30, 30–70, 0–5, 5–10, 15–20, 25–30, 35–40, 45–50, 55–60, and 65–70 cm). The results indicated no significant difference for any treatment at any depth layer. This supports the methodology of combining +N and −N treatments for the analysis of the effect of organic residues.
2.3.3 Power analysis of statistics on 5 cm depth layers
To determine whether the number of replicates was optimal for testing the difference between OR application and control, a power analysis was performed using the “pwr.t.test” R function (Champely, 2006). The analysis was performed twice, and both times the Cohen d effect size measure (i.e. standardized difference between two means) was used as an input, along with a significance level of α=0.05. The first analysis determined the actual power, based on the number of samples used in each statistical analysis that we performed. The second analysis calculated the number of samples needed to reach a power of 80 % (i.e. the probability that the test correctly rejects the null hypothesis when the alternative hypothesis is true); therefore, power = 0.8 was used. This was performed for the analyses done at each individual 5 cm depth layer (0–5, 5–10, 15–20, 25–30, 35–40, 45–50, 55–60, and 65–70 cm) to assess if our study design had sufficient statistical power to determine the exact depth layer down to which the ORs were significantly affecting OC stocks.
3.1 Soil characteristics
The incorporation of organic residues, particularly manure, resulted in overall higher pH values, compared to the other treatments, and led to a higher CECeff (Fig. 1). Although the differences were not always significant between the treatments at the same depth, the tendency was consistent across all depth layers, suggesting that the effect of organic matter application on soil properties may not be limited to the topsoil. Variability in the soil pH and CECeff between treatments was greater in the topsoil, ranging from 4.2 to 6.6 for pH and from 5.3 to 19.0 (milliequivalents per 100 g) across all treatments. Mineral N fertilizer application had a non-significant but consistently negative effect on pH and CECeff in the control treatment (Fig. S3). Soil texture was uniform across all treatments, with average clay, silt, and sand proportions of 70 %, 26.6 %, and 1.6 %, respectively (Fig. S4).
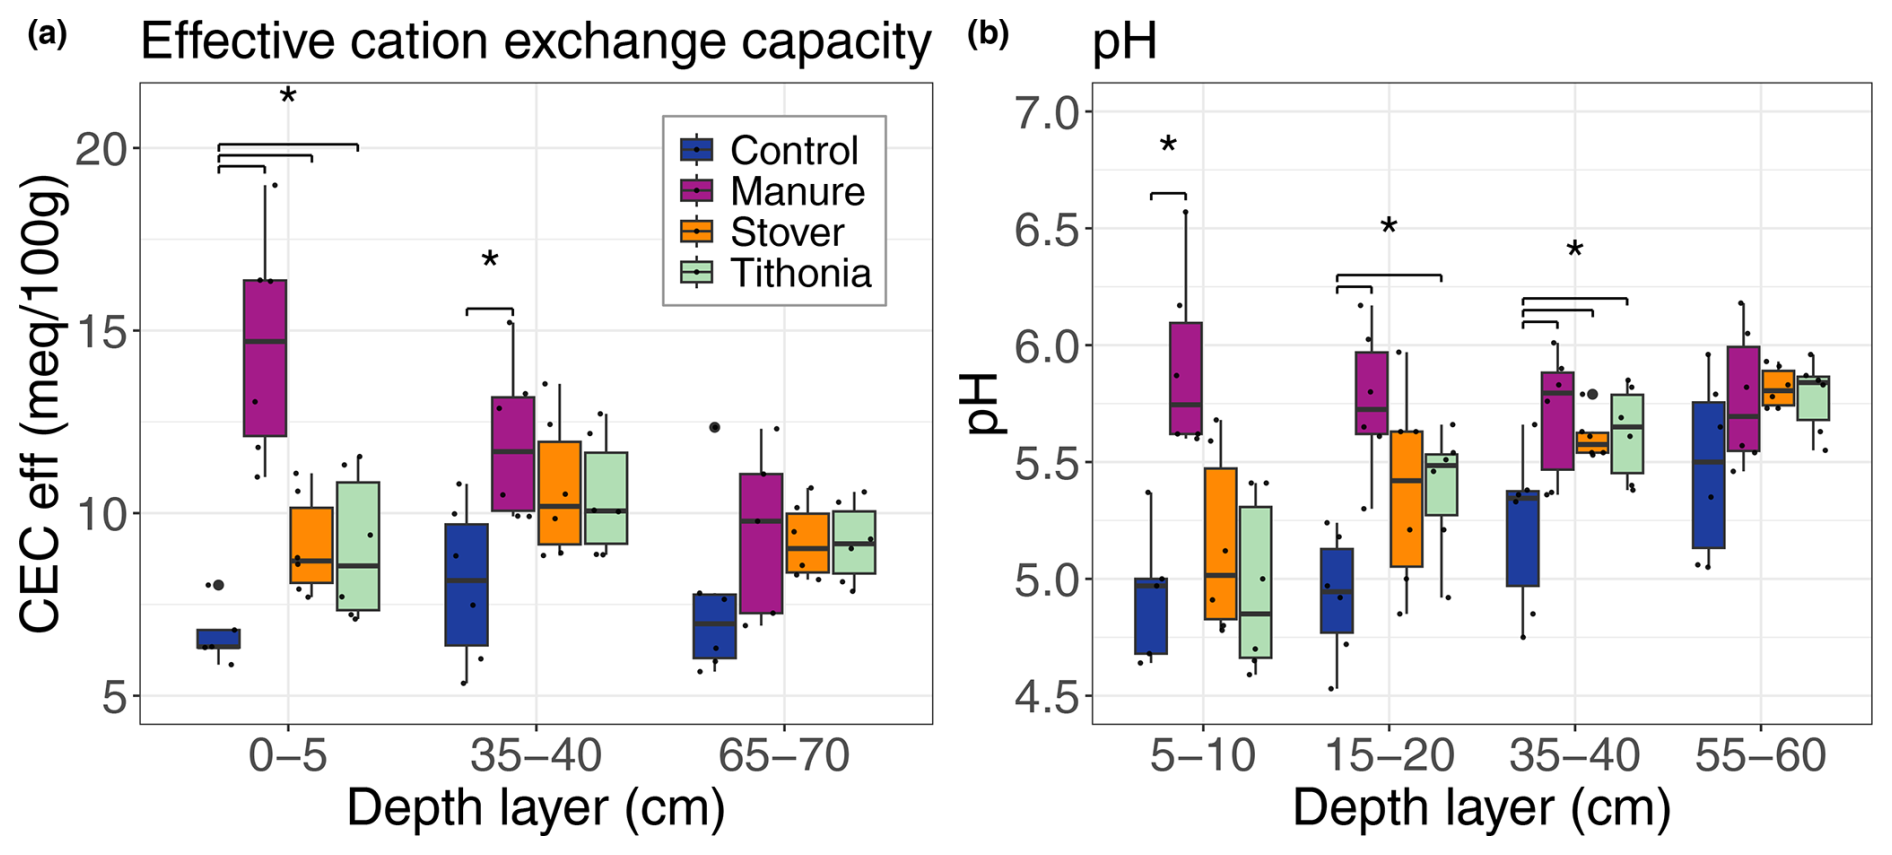
Figure 1Box plots of the (a) effective cation exchange capacity (CECeff) and (b) pH for organic residue treatments at different depth layers. Significant differences between treatments at a similar depth are highlighted using an asterisk (*).
3.2 Effect of organic residues on SOC stocks
3.2.1 Effect of organic residue inputs on SOC stocks in the top- and subsoil
When calculating the OC stocks for the topsoil and subsoil separately, we found that, on average for all treatments, the subsoil layer (30–70 cm depth) contained 48.5 % ± 1.7 % of the total stocks of the entire 0–70 cm soil profile (Fig. 2). Considering the whole measured profile, every treatment receiving organic amendments (combined for N) led to OC stocks that were significantly higher than OC stocks of the control treatment. It is noted that this difference was significant mainly because of the high differences in the topsoil layer. Only the Manure treatment was significantly different from Control in the subsoil (i.e. the 30–70 cm depth layer).
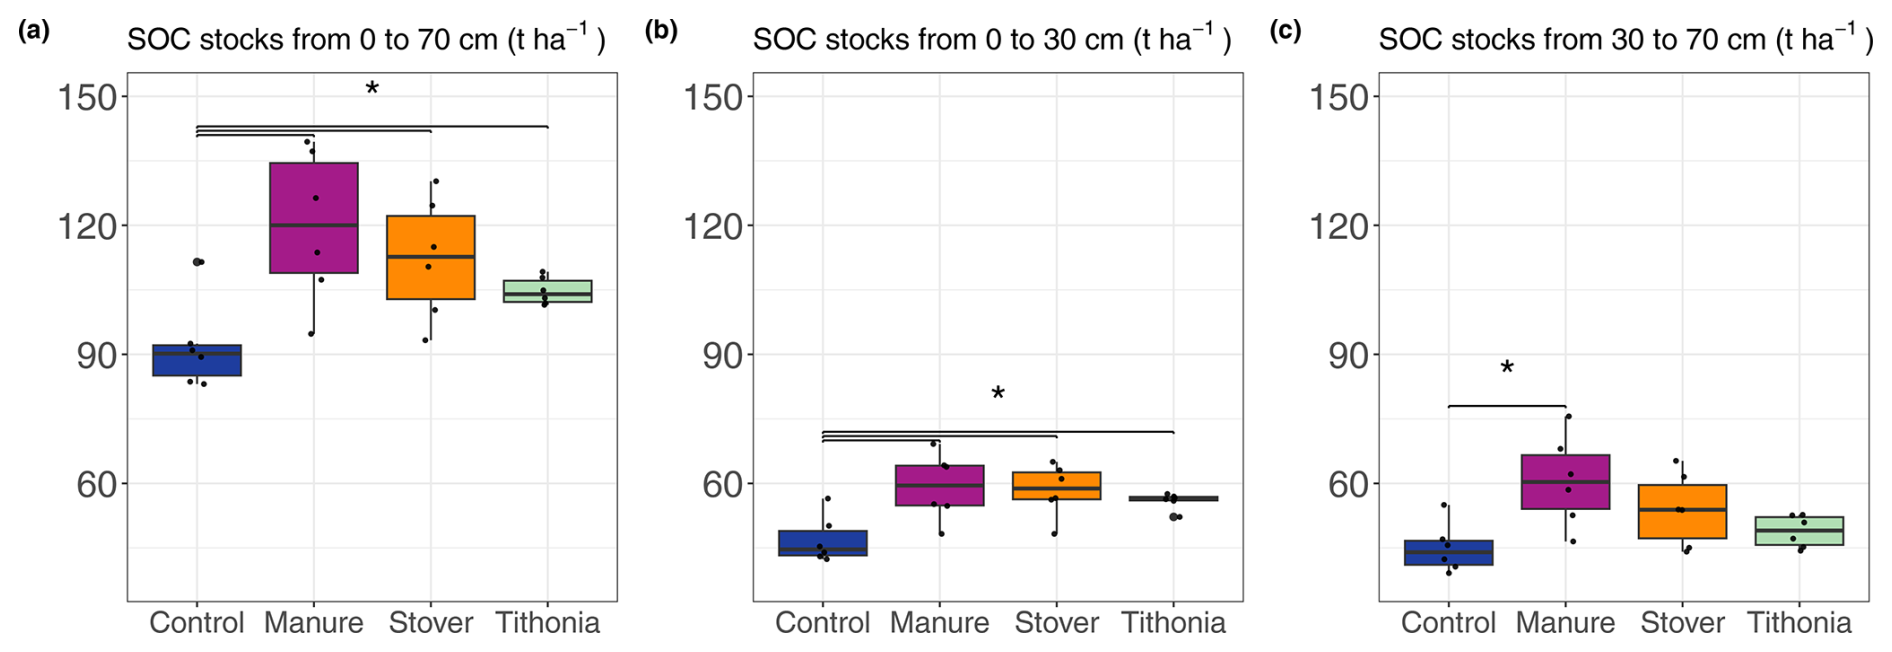
Figure 2Total stocks of organic carbon for (a) the 0–70 cm soil layer, (b) the topsoil (0–30 cm), and (c) the subsoil (30–70 cm). Significant differences between organic residue treatments and the control are highlighted using an asterisk (*).
3.2.2 Effect of organic residue inputs on SOC stocks along the soil profile
The difference in SOC stocks between the organic residue treatments and the control was most pronounced in the topsoil and gradually decreased with depth (Fig. 3). According to the ANOVA performed on all of the different statistical models, the model including all depths and the OR (i.e. model 1) had the lowest AIC (596.05) and BIC (618.56), the highest log-likelihood (−291.03), and the lowest deviance (582.05) values, suggesting it was the best-fitting model (Table S1). The R2 of this model was 0.76, representing the variation in OC levels that this model explained, with 0.65 attributed to fixed effects and 0.11 to random effects. According to the model, depth and the application of manure and maize stover significantly impacted OC stocks but the application of Tithonia did not (Table 2). The same analysis performed on a subset containing only subsoil data yielded similar results, with the best-fitting model including only depth and organic residues as fixed effects and having an R2 value of 0.64. According to the best-fitting model for subsoils, manure and depth were the only significant variables affecting OC stocks (Table S2). The application of mineral fertilizer was not found to significantly affect OC stocks by any model.
Table 2Summary statistics of the linear mixed-effects model for soil organic carbon stocks on all measured depth layers.
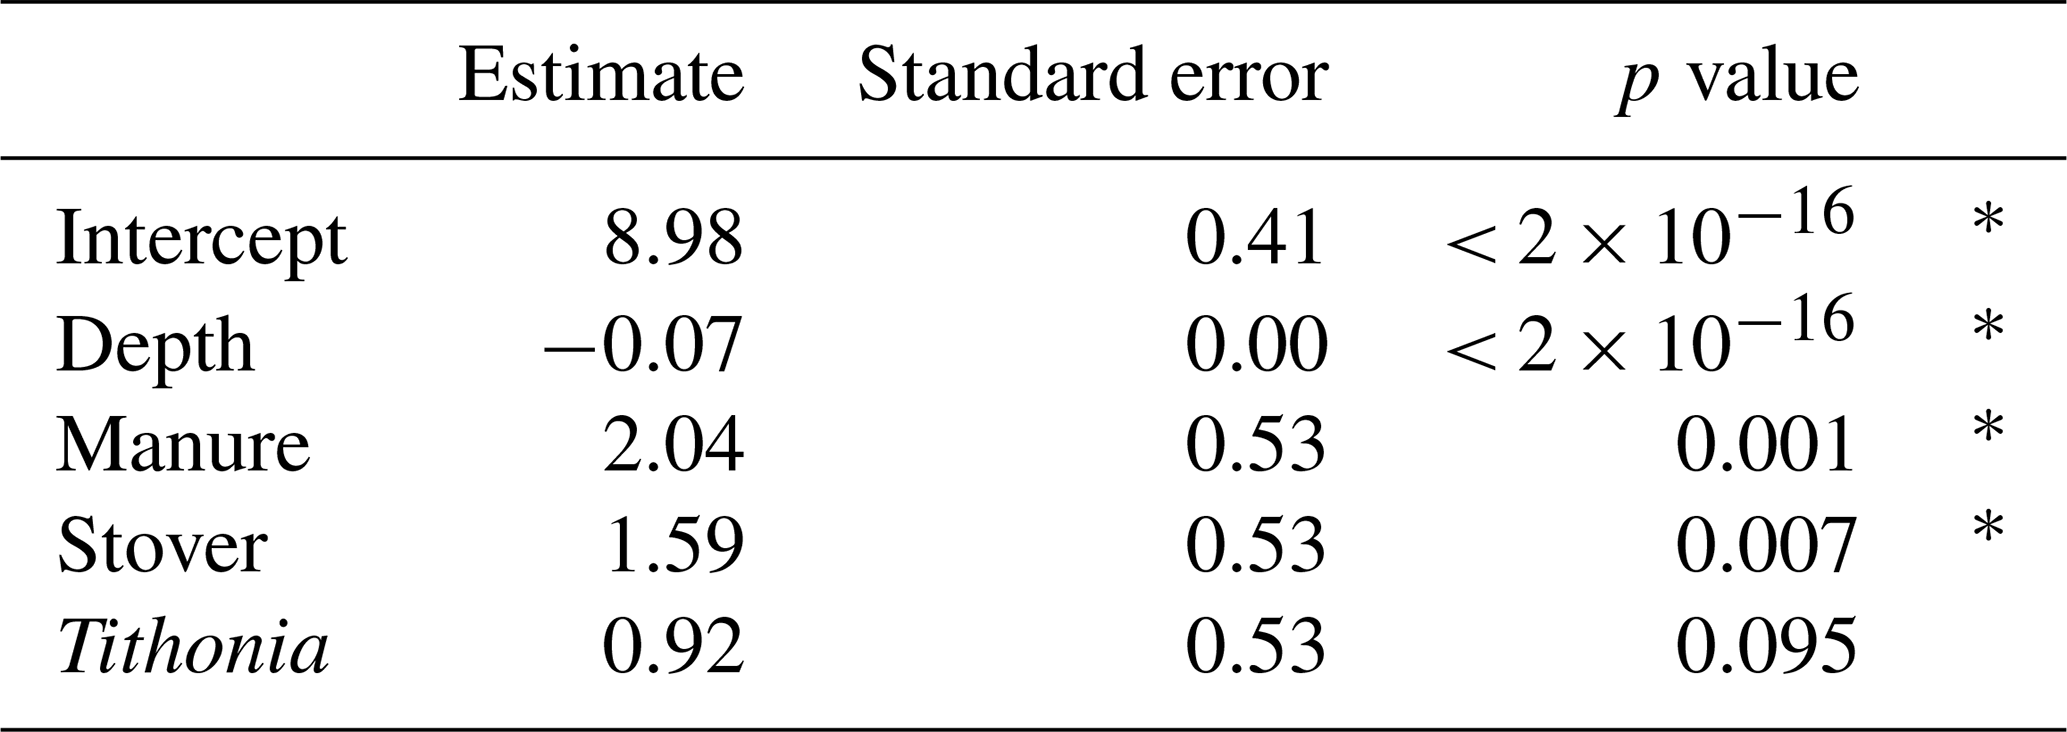
An asterisk (*) in the right-hand column means that the dependent variable is significantly affecting the independent variable with a p value ≤ 0.05.
In the topsoil (i.e. within the 0–30 cm depth layer), OC stocks ranged from 5.5 to 13.1 t OC ha−1 per 5 cm depth layer (Fig. 3). The effect of organic residues on OC stocks per 5 cm layer revealed the depth to which the different organic residues had a significant effect on SOC stocks (Fig. 3). The ANOVA and the comparison of each organic residue treatment with the control treatment per 5 cm layer revealed that the application of organic residues had a significant effect on SOC stocks down to 60 cm (Fig. 3, Table 3). In the top 0–5 cm, Manure had the highest OC stocks, with 11.2 ± 1.6 t ha−1, and Control had a significantly lower OC stock, with 8.3 ± 0.4 t ha−1. Manure significantly impacted OC stocks down to 60 cm. At this depth layer (i.e. 55–60 cm), Manure had an OC stock of 7.2 ± 1.8 t ha−1, whereas Control had an OC stock of 5.2 ± 0.6 t ha−1. Stover was significantly different from Control down to 40 cm. The OC stocks of the Tithonia treatment were only significantly different from Control in the top 5–20 cm.
Table 3Summary statistics of the ANOVA testing the effect of all OR treatments on OC stocks across depth layers.
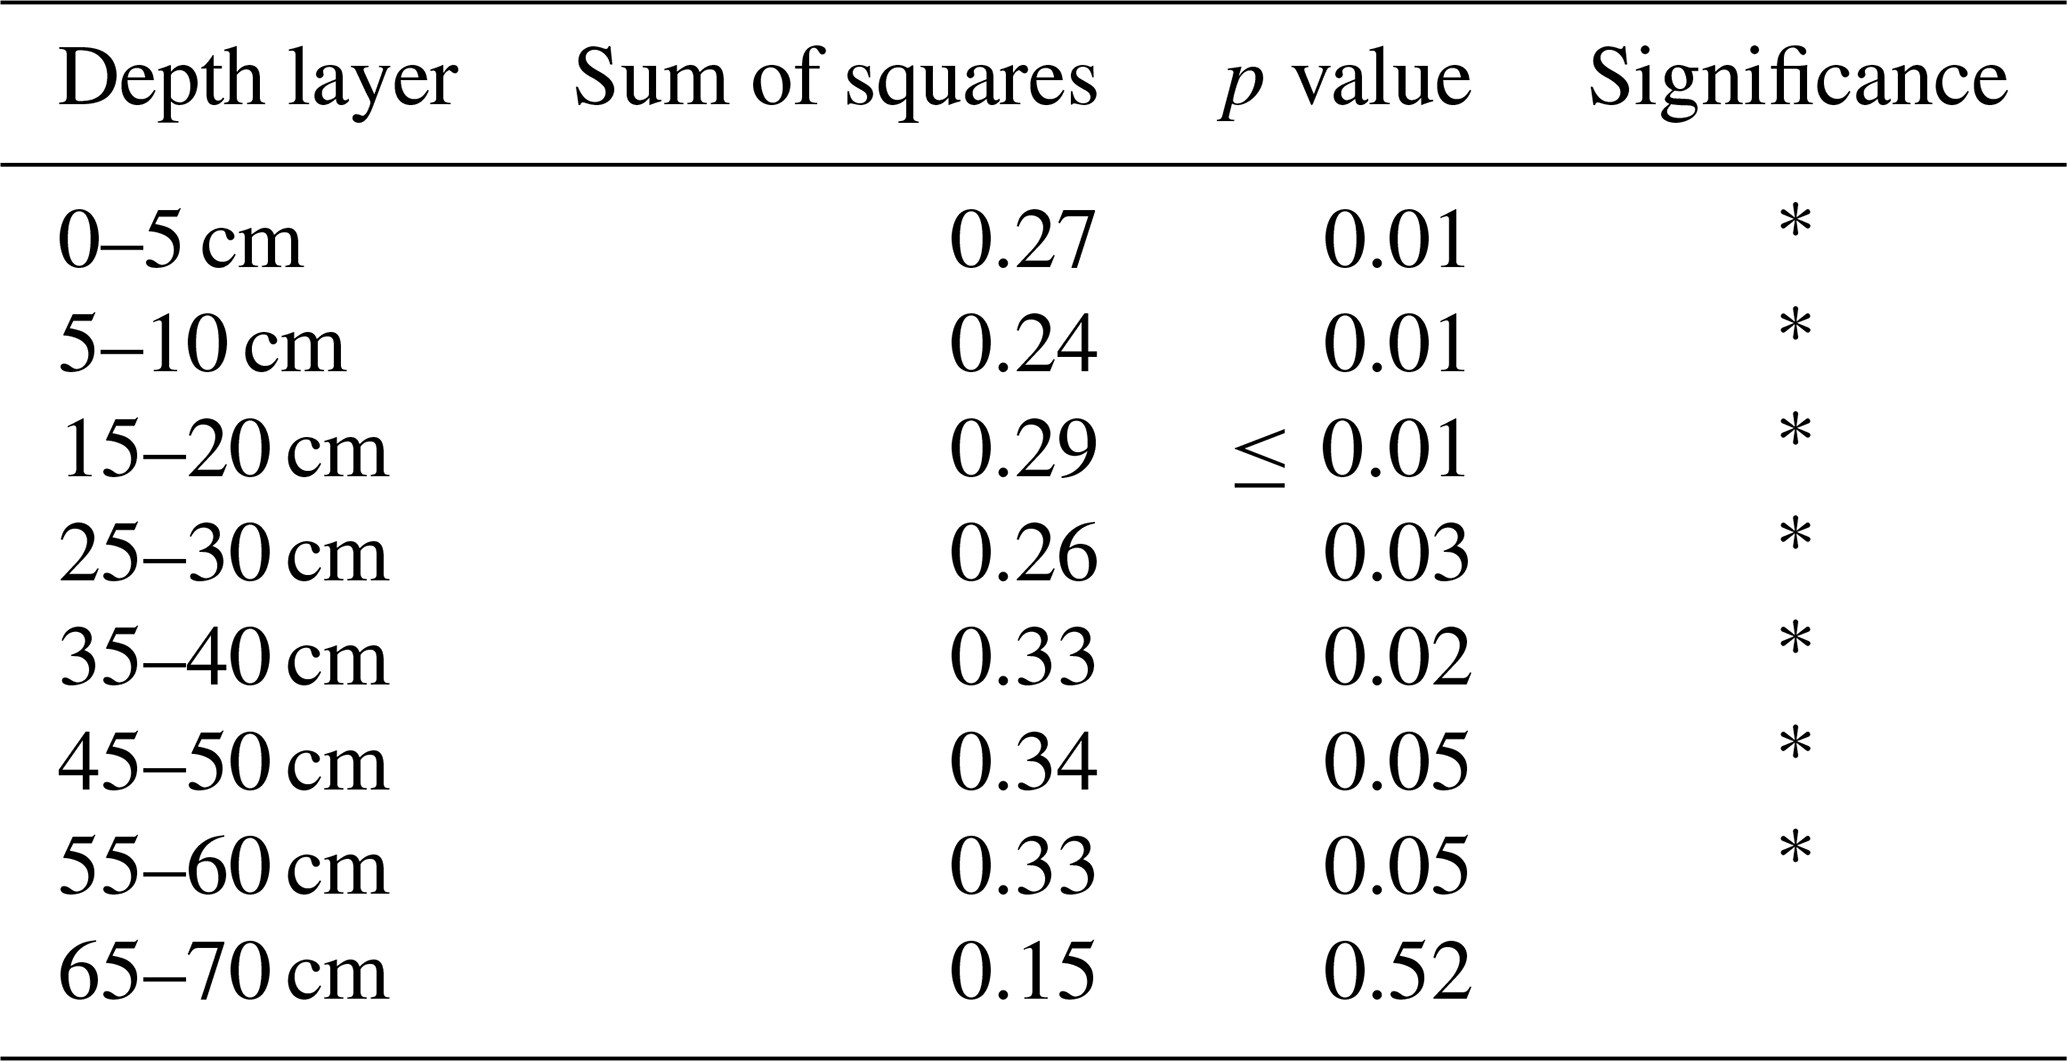
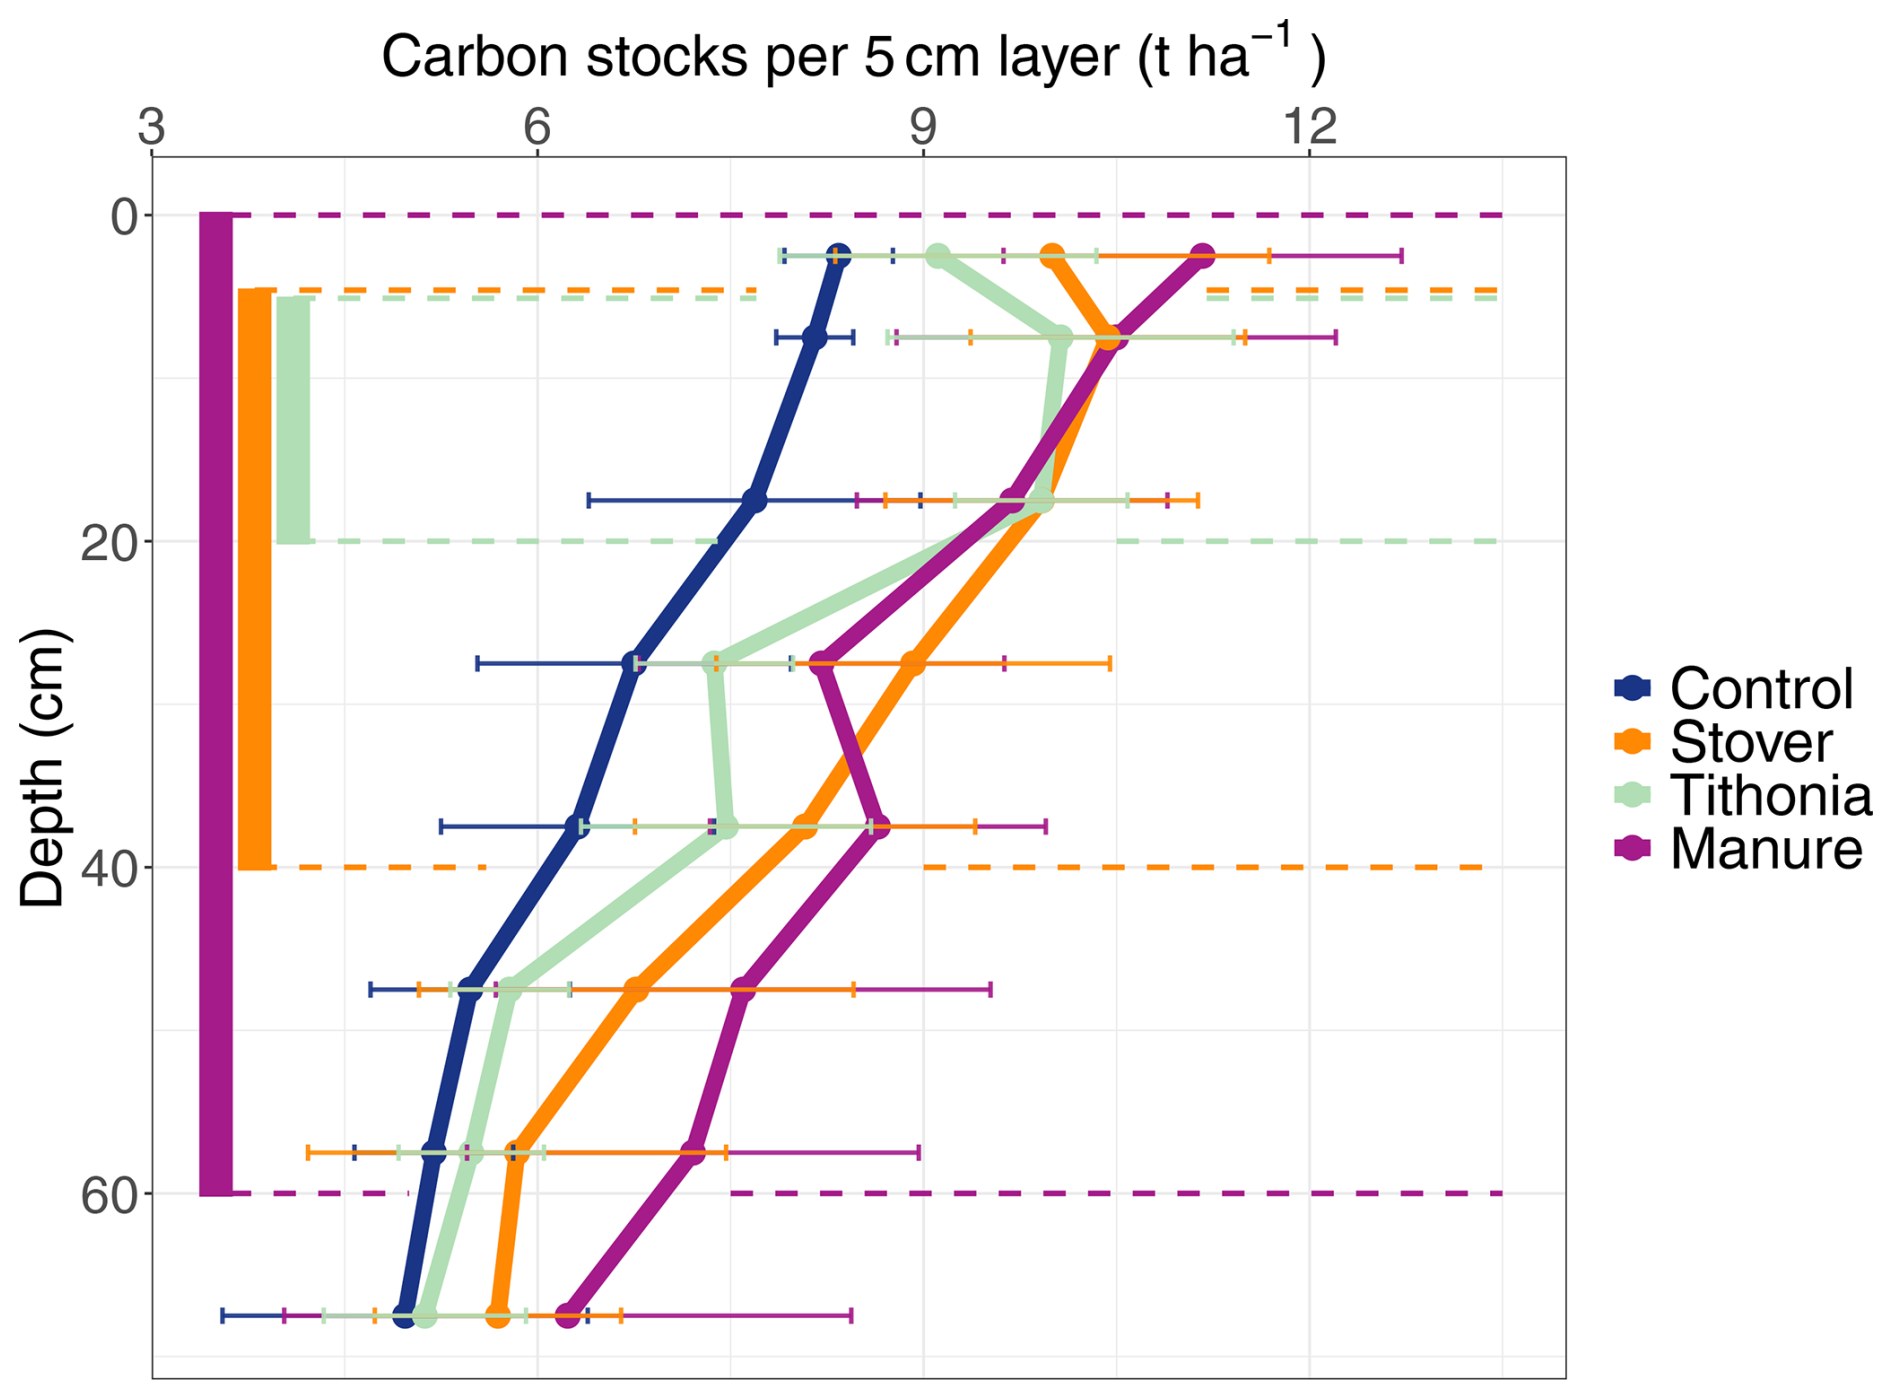
Figure 3Profile of SOC stocks for each measured 5 cm layer (not cumulative). The vertical bars on the left side of the graph show the depth layers over which the SOC stocks for the different treatments are significantly different from the control treatment.
The power analysis indicated a high risk of type-II errors (i.e. incorrectly rejecting that there is a significant difference), particularly in soil layers below 20 cm. For each OR treatment and at each depth layer, the power of the test fell below 80 % when no significant difference was detected between the OR and the control (Fig. 4a). This suggests that, for these statistical tests, there is a greater than 20 % chance of failing to detect a true effect. This implies that the absence of a significant difference between the Control and either the Stover or Tithonia treatments in deeper soil layers should be interpreted with care. This is possibly due to the increased data variability with increasing depth. Thus, the deeper down the soil profile, the more samples are needed to detect a true effect of the treatment (Fig. 4b).
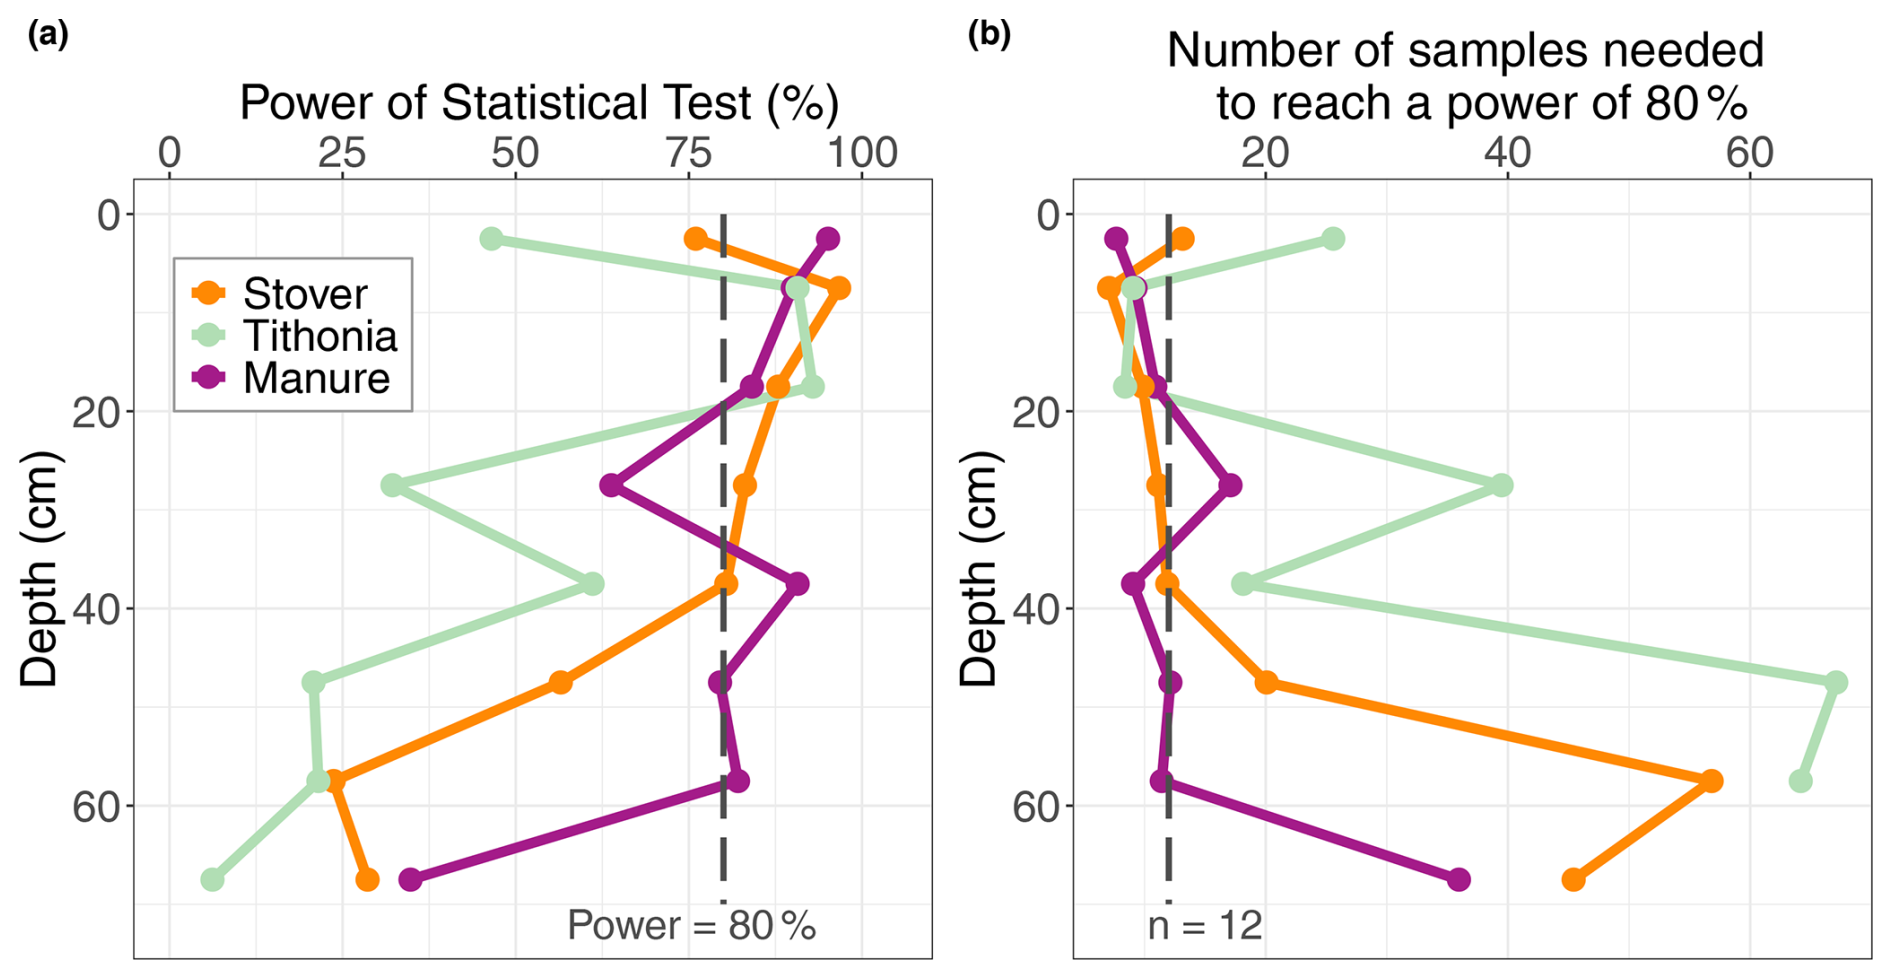
Figure 4(a) Power of the statistical analysis at each depth layer for each organic residue treatment and at each 5 cm depth layer. The 80 % power threshold is indicated by the dashed line. (b) The number of sample samples required to reach a statistical power of 80 % for each organic residue treatment and each 5 cm depth layer. The actual number of samples (n=12) is indicated by the dashed line.
3.2.3 Effect of treatment on SOC stocks considering the +N and −N treatments separately
The SOC stock in the 0–30 cm layer was highest for Manure −N and lowest for Control +N, with values of 60.9 ± 8.0 and 44.1 ± 2.6 t OC ha−1, respectively (Fig. 5a). Similarly, over the measured profile (0–70 cm depth), Manure −N showed the highest OC stocks, whereas Control +N showed the lowest, with mean values of 124.4 ± 24.5 and 85.9 ± 15.7 t OC ha−1, respectively (Fig. 5a). Therefore, the Manure −N treatment maintained 38.5 ± 8.8 t OC ha−1 more SOC in the 0–70 cm depth layer compared to the Control+N treatment. Adding mineral nitrogen resulted in consistently lower OC stock across the soil profile for Control but not for Manure, Stover, or Tithonia (Fig. 5b). However, the difference between the +N and −N variation in each treatment was not statistically significant for any depth layer.
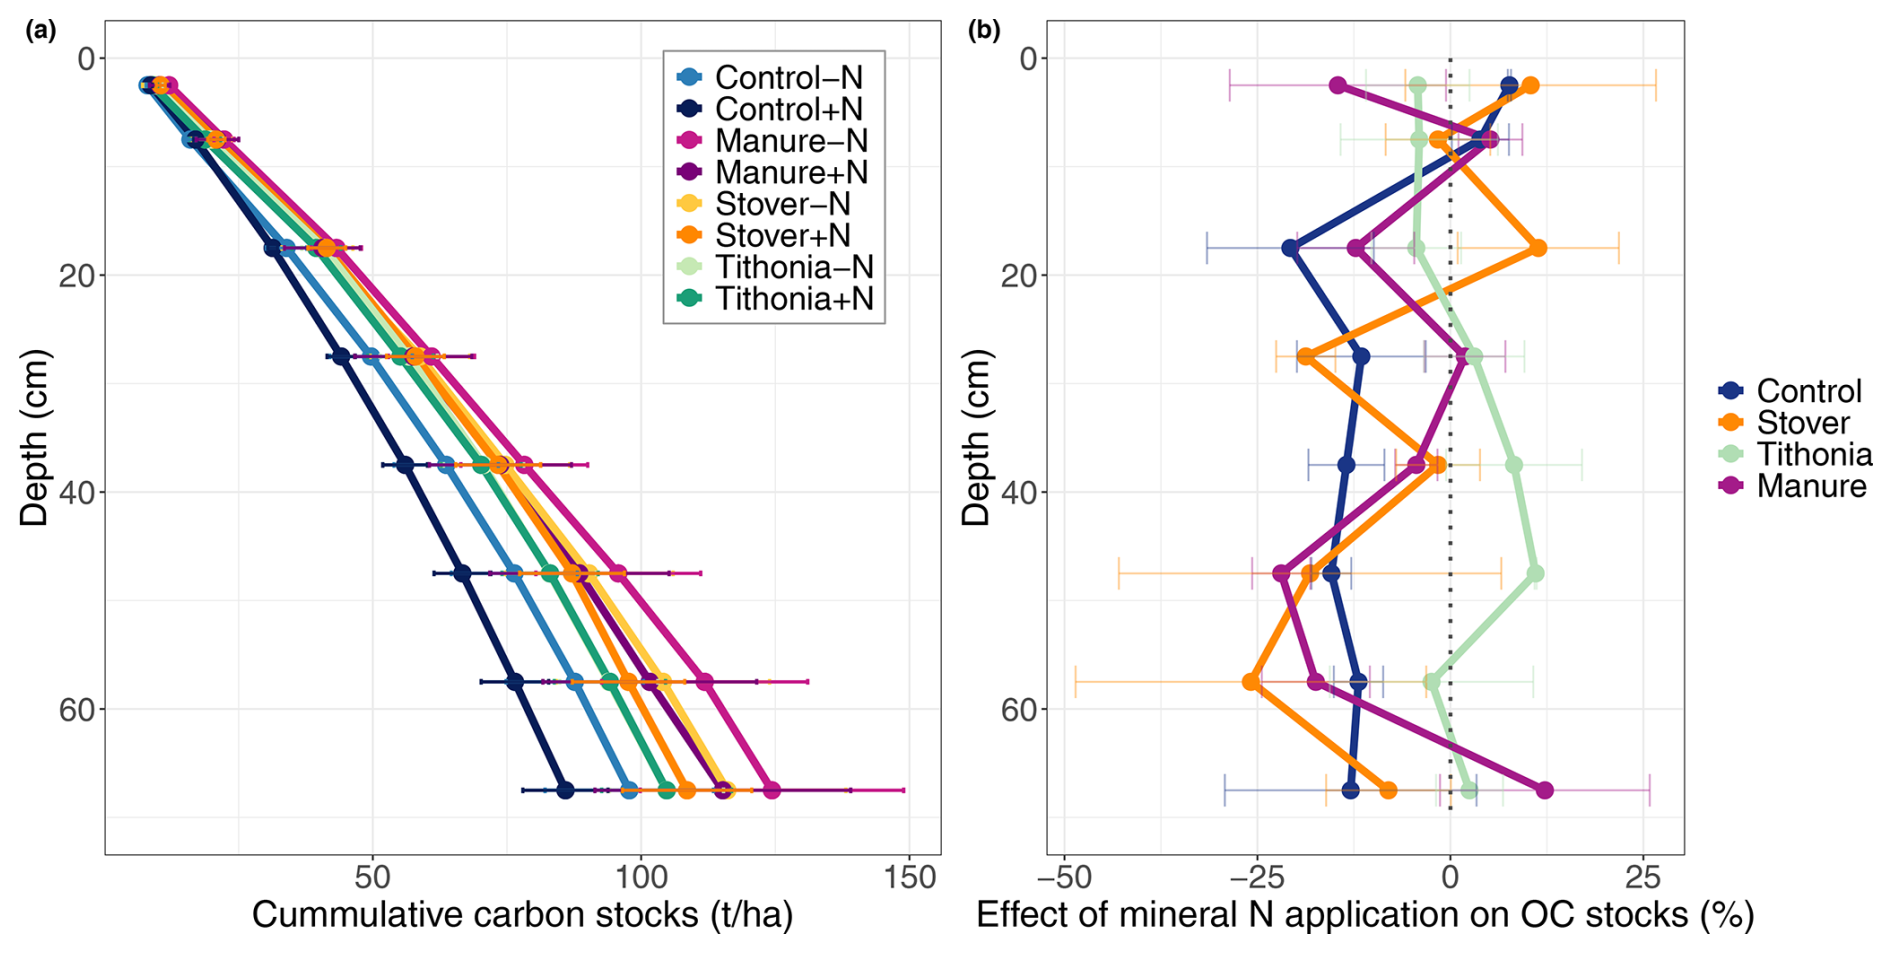
Figure 5(a) The cumulative stocks of organic carbon plotted against depth for the −N and +N treatments and (b) the difference in OC stocks between the +N and −N treatments at each measured 5 cm depth layer (not cumulative); values below zero indicate a loss of OC when mineral nitrogen was applied. The differences in SOC stocks between the −N and +N treatments were never significant.
3.3 The C N ratio and stable isotopes of organic carbon
The ratio of organic matter had values of between 10 and 12 along the soil profile, and it decreased with depth below 30 cm (Fig. 6a). The ratio across the depth profiles was not significantly different between treatments; however, below 30 cm, it tended to be lower in the Control treatment compared to all organic residue treatments. This difference was primarily due to the consistently lower ratio of the Control +N treatment at intermediate depths (Fig. S5).
Depth profiles of the δ13C value of SOC show that the largest differences between the treatments are in the top 20 cm of the soil (Fig. 6b). The lowest values are for the Manure treatment (−19.5 ‰ to −20 ‰), whereas the Stover and Control treatments have the highest values (ca. −18 ‰). The δ13C value for the Tithonia treatment is intermediate (ca. −18.5 ‰). Below this depth, all treatments have similar δ13C values, in the range of −17.5 ‰ to −18.5 ‰, with a tendency toward lower values in the Manure treatment. The δ13C value of SOC for the Stover treatment is within the range of the Control along the whole profile. Additionally, the δ13C signatures of all treatments at depths below 50 cm are similar, suggesting no influence of organic amendments on SOC below this depth.
As observed in the depth profile of radiocarbon (F14C), the OC becomes older with depth, i.e. lower F14C values (Fig. 6c). However, below the surface layer (i.e. the 0–5 cm depth layer), the F14C values are higher (i.e. the OC is younger) for all three treatments receiving organic amendments, compared to the control treatment, suggesting that the organic residue input affected OC below the layers at which it was applied. The higher F14C values for the Manure treatment in the deepest layer suggest that this treatment had the largest impact on subsoil OC.
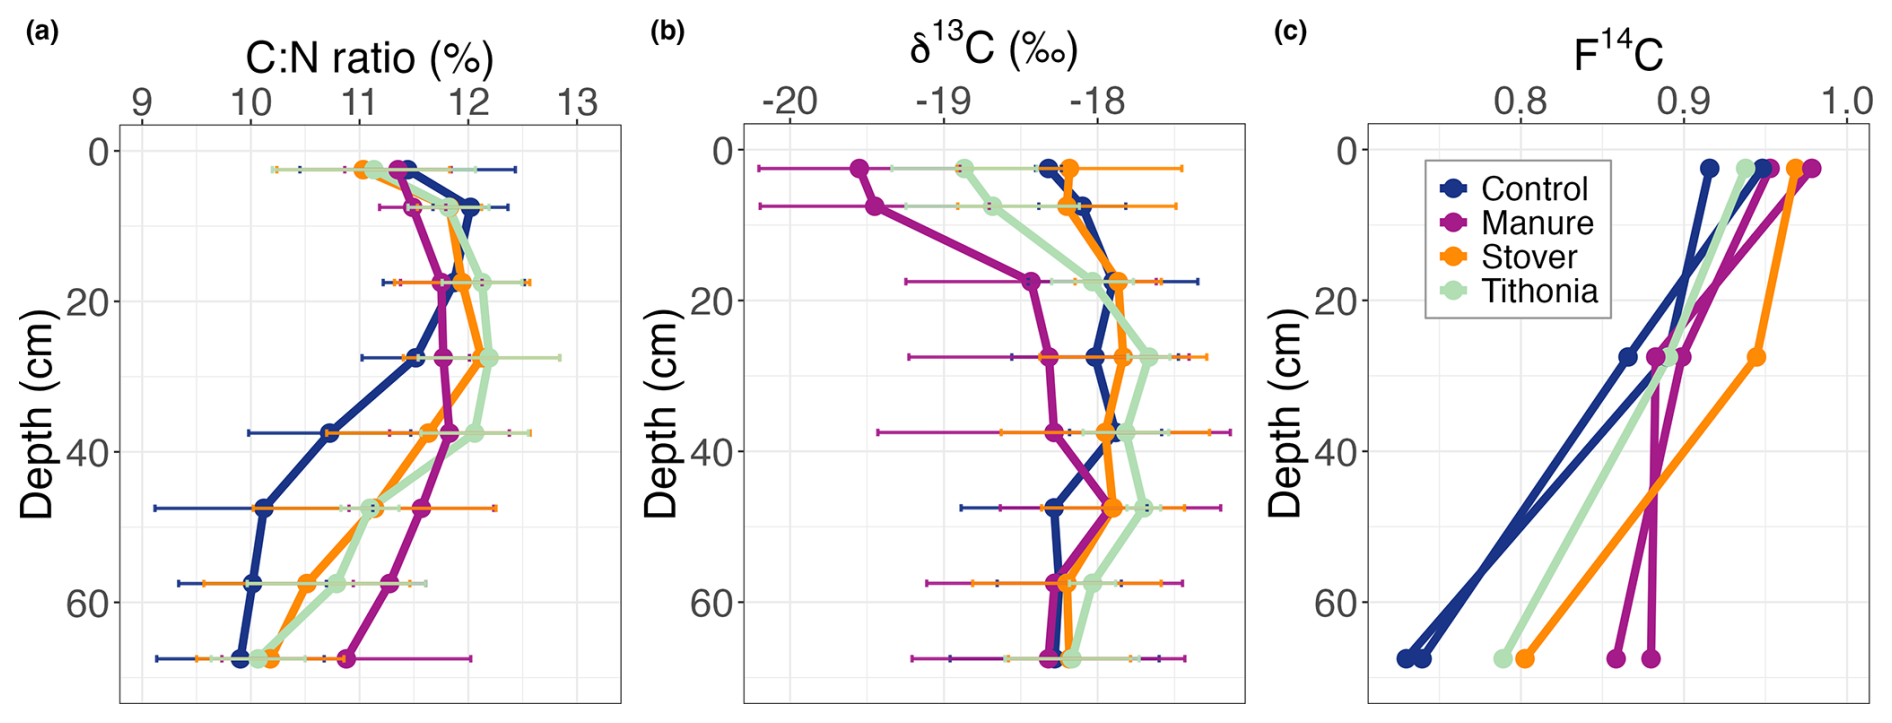
Figure 6Soil profiles of the (a) ratio, (b) δ13C, and (c) F14C for the different organic residue treatments. For F14C, only six plots were measured, and there were two replicates for the Control and for Manure treatments.
Our results show that, at the studied tropical field trial site, about 50 % of the SOC stock measured down to 70 cm was located below 30 cm, highlighting the importance of subsoil OC stocks. Moreover, the addition of farmyard manure, Tithonia residue, and maize stover all had a positive impact on SOC stocks, limiting the loss of organic matter compared to the control treatment. Although this effect was greatest in the top 20 cm, it could be observed down to 40 cm and 60 cm for the Stover and Manure treatments, respectively. The Manure treatment led to the highest OC stock values down to 70 cm. However, a power analysis indicated that more samples are required to accurately assess whether the effect of organic residues on OC stocks in the subsoil is statistically significant.
4.1 Application of manure affects OC in the subsoil
Our study shows that, although the calculated statistical power indicated that more samples are needed to increase confidence, the application of manure affected SOC stocks in the subsoil at a tropical long-term field trial site. Among all of the organic residues applied, only Manure had OC stocks that were significantly larger than the Control in the 30–70 cm depth layer (Fig. 2), and the application of manure significantly impacted OC stocks down to 60 cm (Fig. 3). This shows that organic residues can also influence SOC in the subsoil. In addition, the Δ14C values along the soil profile suggest that the addition of manure led to the introduction of fresh OC down to a depth of 65–70 cm. This was not mirrored in the δ13C values for the deeper layers, suggesting that only a small portion of the added organic amendments made their way downward and that larger SOC stocks because of the Manure treatment are due to lower SOC losses compared to the Control. However, the application of manure resulted in a significant increase in pH and CECeff down to 40 cm compared to the Control. These results indicate that this treatment can make the subsoil environment more favourable to support plant growth.
Our findings are in line with those of Leuther et al. (2022), who reported that high levels of manure application in a long-term (36-year) field study in Germany increased OC stocks at 35–45 cm depth, and Anandakumar et al. (2022), who observed a significant increase in OC stocks between 25 and 50 cm depth after applying manure in a semi-arid tropical Alfisol in India. A known mechanism for OC transport across the soil profile is in the form of dissolved organic carbon (DOC), which moves downward through cycles of sorption and desorption (Kaiser and Kalbitz, 2012b; Uselman et al., 2007). In a long-term study in China, Liu et al. (2013) observed that manure application increased the amount of DOC down to 60 cm, compared with straw residue application, supporting the fact that manure may percolate further down in the soil profile than plant residue. However, a study by Sommer et al. (2018) revealed that manure was able to slow steady losses of SOC from the topsoils of Kenyan Ferralsols over time, although only when at least 4.0 t C ha−1 yr−1 was applied. While this is the same amount applied in our study, it is the largest amount (compared to the common range of 0.9–4 t C ha−1 yr−1) applied by Kenyan farmers who own cattle (Tittonell et al., 2008). Therefore, the impact of using manure may not be as great in the deeper layers when considering a scenario in which the common rates of manure application are utilized. For instance, Laub et al. (2023b) did not observe a significant effect on topsoil OC when the annual application of manure was 1.2 t C ha−1 yr−1.
4.2 The effect of Tithonia diversifolia and maize stover residues on OC could only be detected in the topsoil
In contrast to the Manure treatment, our results showed that Tithonia and Stover did not significantly affect subsoil OC stocks in the 30–70 cm layer (Fig. 2). Also, no significant differences below 20 and 40 cm were observed in the individual 5 cm depth layers (Fig. 3) for Tithonia and Stover, respectively. However, for both treatments, the statistical power was below 80 % at every depth layer where the treatments were not significantly different from the control. This suggests that the sample size was insufficient to prevent type-II errors in the subsoil (Fig. 4a, b). Therefore, one must be cautious when interpreting these non-significant differences. Moreover, both the Tithonia and Stover treatments showed signs of younger OC below 30 cm depth compared to the Control, as indicated by the higher F14C values (Fig. 6c). Nevertheless, these effects in the 65–70 cm depth layer were less pronounced compared to the Manure treatment. This suggest that the effect of stover and Tithonia residues can be traced below 30 cm but that this effect is not strong enough to exert a significant impact on subsoil OC stocks. Thus, further studies with more samples are needed to conclusively reject the hypothesis that the application of Tithonia or stover affects the subsoil environment. For instance, all OR treatments had a significantly higher pH than the Control down to 40 cm (Fig. 1). Our observations differ from the observations of Córdova et al. (2018), who found that high-quality residues led to a higher accumulation of OC in the soil compared to low-quality residues, as stover had higher OC stocks than Tithonia in the topsoil and in the subsoil. Nevertheless, our results are in line with the meta-analysis results of Gross and Glaser (2021), who found manure to be more effective with respect to stabilizing SOC than green manure. Their meta-analysis was dominated by temperate soils, but their results are similar to those found here for a tropical soil.
The δ13C signatures of OC in the topsoil under the Stover and Control treatments were similar. However, as maize is a C4 plant, it would be expected that, if more maize stover residues were incorporated into the soil compared to the Control treatment, the δ13C signature of SOC would be highest under the Stover treatment (Tieszen, 1991). As the Stover treatment received 4 t C ha−1 yr−1 more maize-derived residues (i.e. stover) compared to the Control treatment, the similar δ13C value in the topsoil suggests that the additional organic matter inputs for the Stover treatment did not result in additional SOC sequestration compared to the Control. However, as topsoil OC stocks were significantly larger for the Stover treatment compared to the Control treatment, this indicates that the larger SOC stocks were due to lower losses of initial SOC in the Stover treatment, not to additional SOC sequestration.
Concerning the Tithonia treatment, the lower δ13C values of topsoil OC and the significantly larger topsoil SOC stocks compared to the Control treatment suggest that the latter is at least partly caused by the incorporation of OC originating from the Tithonia residues. The limited effect of both the Stover and Tithonia treatments on topsoil δ13C values suggests that both residues are being quickly mineralized upon application, which explains why they do not compensate for the steady loss of OC in both treatments.
4.3 Mineral nitrogen does not significantly affect SOC stocks
The linear mixed-effects model did not select mineral N as a parameter with a significant impact on the SOC stocks. This corroborates the meta-analysis conducted by Gram et al. (2020) on integrated soil fertility management in sub-Saharan Africa, which showed that mineral N fertilizer had no significant impact on topsoil SOC concentrations. However, the interaction between SOC and mineral fertilizer is complex, and two global meta-analyses on the effect of mineral N on agricultural topsoil, conducted by Ladha et al. (2011) and Liu et al. (2023), have suggested that the addition of mineral N fertilizer typically has a positive impact on SOC content. One reason for this impact is that as mineral fertilizer tends to enhance biomass production, it commonly leads to an increase in the quantity of plant residues returned to the soil, thereby positively impacting the soil organic matter content (Geisseler and Scow, 2014). This does not apply at our study site in Embu, as the yield was not very responsive to N fertilization and crop residues were removed from the field after harvest (Laub et al., 2023a). Also, while Liu et al. (2023) emphasize the significance of specific climatic and environmental factors on the effects of mineral fertilizer application on SOC, neither of the two meta-analyses included studies from eastern Africa (Ladha et al., 2011; Liu et al., 2023). For instance, in a study conducted in Kenya, Ndung'u et al. (2021) observed a decrease in the topsoil OC concentration after the application of mineral nitrogen to Ferralsols, while Laub et al. (2023b) did not observe a consistent effect of mineral N on SOC stocks in four long-term agricultural field trials in central and western Kenya.
The Control had the largest difference in OC stocks between the +N and the −N treatments when considering OC stock over the whole 0–70 cm depth profile; i.e. Control +N had a consistently lower OC stock than Control −N below 10 cm (Fig. 5a). While this difference was not significant, it suggests that the sole application of mineral nitrogen increased the rate of OC loss at the study site. One possible explanation for this observation is that the application of mineral fertilizer stimulates the activity of fast-growing microorganisms that can lead to a priming effect, accelerating the decomposition of organic matter in the soil (Chen et al., 2014). It is also possible that mineral nitrogen alone leads to increased rates of OC loss, as it increases the degradation of below-ground plant residues; for instance, mineral fertilizer was shown to increase the degradation of young C4 lignin (Hofmann et al., 2009).
4.4 The potential of organic inputs to reduce SOC loss in tropical agroecosystems
There is a motivation to adopt agricultural practices to reduce the atmospheric CO2 concentration by increasing SOC storage (Bossio et al., 2020; Minasny et al., 2017). According to Corbeels et al. (2019), there is a potential to achieve this in sub-Saharan Africa, not only as a measure to mitigate climate change but also to improve crop productivity. However, the low F14C values measured in each treatment, especially in the subsoil, indicate that very little of the freshly added organic matter remains in the soil, suggesting that even the application of significant amounts of OR would not contribute substantially to climate change mitigation. This aligns with the findings of Sierra et al. (2024), who demonstrated that only a minimal amount of new OC input makes its way through the profile and has the potential to remain stable for periods extending beyond 50 years. Also, results from Laub et al. (2023b) show that all treatments of the long-term trial in Embu lost topsoil OC during the first ca. 20 years of the field trials, despite the differences in magnitude between treatments. In accordance with the results of Laub et al. (2023b) for topsoils (0–15 cm), we show that, after 19 years, OC stocks down to 70 cm were largest for Manure −N and lowest for Control +N, with values of 124 and 85 t ha−1, respectively. This is a difference of 39 t C ha−1, which represents about a 50 % higher OC stock in Manure −N than in Control +N. Therefore, although the OC storage potential in soils that have been recently deforested, with mainly low-activity clay minerals, is low, it is possible to optimize agricultural nutrient management to minimize SOC losses. Furthermore, this could be combined with other appropriate agricultural practices, such as increasing crop diversity and rotating crops, which have the potential to improve OC stocks and positively impact yields (Yang et al., 2024). Combining these practices with the application of manure could lead to the stabilization of SOC stocks over time.
Our study shows that organic amendments have an influence on the SOC stocks throughout the soil profile in a tropical arable soil. Using soil samples down to 70 cm from a long-term field trial in central Kenya, we show that the application of 4 t C ha−1 yr−1 in the form of manure led to significantly larger SOC stocks down to 60 cm compared to a control treatment. In contrast, the application of residues of Tithonia diversifolia and maize stover impacted SOC stocks to a lower extent, and this effect was limited to the topsoil. Due to insufficient statistical power for the subsoil for these treatments, further research with larger sample sizes is necessary to draw definitive conclusions on their effects. The application of mineral nitrogen did not contribute positively to the effect of organic residues on SOC stocks, while it had a negative effect in the Control treatment. Our study indicates that, for the studied tropical soils, the application of manure is the most appropriate nutrient management strategy to limit SOC losses in recently established croplands and that agricultural practices affect soil layers deeper than the 0–30 cm layer usually studied. Therefore, we argue that (1) appropriate agricultural management has the potential to partially mitigate the effects of deforestation on SOC loss while also improving the soil quality for food production and (2) studying soil deeper than 30 cm can improve our understanding of agroecosystems.
The code can be provided upon request.
The data used in this study are open access and are available from https://figshare.com/s/c2f2787b7a56ef7ad656 (Müller, 2025).
The supplement related to this article is available online at https://doi.org/10.5194/bg-22-2733-2025-supplement.
MVdB and JS conceived of and designed the field campaign and designed the experiment. CRM performed the experiment. CRM and MVdB analysed and interpreted the data. CRM and MVdB wrote the manuscript with input from all co-authors.
The contact author has declared that none of the authors has any competing interests.
Publisher’s note: Copernicus Publications remains neutral with regard to jurisdictional claims made in the text, published maps, institutional affiliations, or any other geographical representation in this paper. While Copernicus Publications makes every effort to include appropriate place names, the final responsibility lies with the authors.
We thank Britta Jahn-Humphrey, for help with soil processing, and ChatGPT (an AI language model developed by OpenAI), for assistance during the writing process.
This research has been supported by the Schweizerischer Nationalfonds zur Förderung der Wissenschaftlichen Forschung (grant no. PZ00P2_193617).
This paper was edited by Lucia Fuchslueger and reviewed by two anonymous referees.
Adams, A. M., Gillespie, A. W., Dhillon, G. S., Kar, G., Minielly, C., Koala, S., Ouattara, B., Kimaro, A. A., Bationo, A., Schoenau, J. J., and Peak, D.: Long-term effects of integrated soil fertility management practices on soil chemical properties in the Sahel, Geoderma, 366, 114207, https://doi.org/10.1016/j.geoderma.2020.114207, 2020.
Anandakumar, S., Bakhoum, N., Chinnadurai, C., Malarkodi, M., Arulmozhiselvan, K., Karthikeyan, S., and Balachandar, D.: Impact of long-term nutrient management on sequestration and dynamics of soil organic carbon in a semi-arid tropical Alfisol of India, Appl. Soil Ecol., 177, 104549, https://doi.org/10.1016/j.apsoil.2022.104549, 2022.
Balesdent, J., Mariotti, A., and Guillet, B.: Natural 13C abundance as a tracer for studies of soil organic matter dynamics, Soil Biol. Biochem., 19, 25–30, https://doi.org/10.1016/0038-0717(87)90120-9, 1987.
Balesdent, J., Basile-Doelsch, I., Chadoeuf, J., Cornu, S., Derrien, D., Fekiacova, Z., and Hatté, C.: Atmosphere–soil carbon transfer as a function of soil depth, Nature, 559, 599–602, https://doi.org/10.1038/s41586-018-0328-3, 2018.
Bossio, D. A., Cook-Patton, S. C., Ellis, P. W., Fargione, J., Sanderman, J., Smith, P., Wood, S., Zomer, R. J., Von Unger, M., Emmer, I. M., and Griscom, B. W.: The role of soil carbon in natural climate solutions, Nat. Sustain., 3, 391–398, https://doi.org/10.1038/s41893-020-0491-z, 2020.
Bullock, E. L., Healey, S. P., Yang, Z., Oduor, P., Gorelick, N., Omondi, S., Ouko, E., and Cohen, W. B.: Three Decades of Land Cover Change in East Africa, Land, 10, 150, https://doi.org/10.3390/land10020150, 2021.
Cardinael, R., Guibert, H., Brédoumy, S. T. K., Gigou, J., N'Goran, K. E., and Corbeels, M.: Sustaining maize yields and soil carbon following land clearing in the forest–savannah transition zone of West Africa: Results from a 20-year experiment, Field Crops Res., 275, 108335, https://doi.org/10.1016/j.fcr.2021.108335, 2022.
Champely, S.: pwr: Basic Functions for Power Analysis, https://doi.org/10.32614/CRAN.package.pwr, 2006.
Chen, R., Senbayram, M., Blagodatsky, S., Myachina, O., Dittert, K., Lin, X., Blagodatskaya, E., and Kuzyakov, Y.: Soil C and N availability determine the priming effect: microbial N mining and stoichiometric decomposition theories, Glob. Change Biol., 20, 2356–2367, https://doi.org/10.1111/gcb.12475, 2014.
Chen, Y. and Aviad, T.: Effects of Humic Substances on Plant Growth, in: Humic Substances in Soil and Crop Sciences: Selected Readings, edited by: MacCarthy, P., Clapp, C. E., Malcolm, R. L., and Bloom, P. R., Soil Science Society of America, Madison, WI, USA, 161–186, https://doi.org/10.2136/1990.humicsubstances.c7, 1990.
Chivenge, P., Vanlauwe, B., Gentile, R., Wangechi, H., Mugendi, D., van Kessel, C., and Six, J.: Organic and Mineral Input Management to Enhance Crop Productivity in Central Kenya, Agron. J., 101, 1266–1275, https://doi.org/10.2134/agronj2008.0188x, 2009.
Chivenge, P., Vanlauwe, B., Gentile, R., and Six, J.: Comparison of organic versus mineral resource effects on short-term aggregate carbon and nitrogen dynamics in a sandy soil versus a fine textured soil, Agr. Ecosyst. Environ., 140, 361–371, https://doi.org/10.1016/j.agee.2010.12.004, 2011a.
Chivenge, P., Vanlauwe, B., and Six, J.: Does the combined application of organic and mineral nutrient sources influence maize productivity? A meta-analysis, Plant Soil, 342, 1–30, https://doi.org/10.1007/s11104-010-0626-5, 2011b.
Corbeels, M., Cardinael, R., Naudin, K., Guibert, H., and Torquebiau, E.: The 4 per 1000 goal and soil carbon storage under agroforestry and conservation agriculture systems in sub-Saharan Africa, Soil Till. Res., 188, 16–26, https://doi.org/10.1016/j.still.2018.02.015, 2019.
Córdova, S. C., Olk, D. C., Dietzel, R. N., Mueller, K. E., Archontouilis, S. V., and Castellano, M. J.: Plant litter quality affects the accumulation rate, composition, and stability of mineral-associated soil organic matter, Soil Biol. Biochem., 125, 115–124, https://doi.org/10.1016/j.soilbio.2018.07.010, 2018.
Ehleringer, J. R., Buchmann, N., and Flanagan, L. B.: Carbon Isotope Ratios in belowground carbon cycle processes, Ecol. Appl., 10, 412–422, https://doi.org/10.1890/1051-0761(2000)010[0412:CIRIBC]2.0.CO;2, 2000.
Farquhar, G. D., Ehleringer, J. R., and Hubick, K. T.: Carbon isotope discrimination and photosynthesis, Annu. Rev. Plant Phys., 40, 503–537, https://doi.org/10.1146/annurev.arplant.40.1.503, 1989.
Feller, C. and Beare, M. H.: Physical control of soil organic matter dynamics in the tropics, Geoderma, 79, 69–116, https://doi.org/10.1016/S0016-7061(97)00039-6, 1997.
Fujisaki, K., Chevallier, T., Chapuis-Lardy, L., Albrecht, A., Razafimbelo, T., Masse, D., Ndour, Y. B., and Chotte, J.-L.: Soil carbon stock changes in tropical croplands are mainly driven by carbon inputs: A synthesis, Agr. Ecosyst. Environ., 259, 147–158, https://doi.org/10.1016/j.agee.2017.12.008, 2018.
Geisseler, D. and Scow, K. M.: Long-term effects of mineral fertilizers on soil microorganisms – A review, Soil Biol. Biochem., 75, 54–63, https://doi.org/10.1016/j.soilbio.2014.03.023, 2014.
Gentile, R., Vanlauwe, B., Chivenge, P., and Six, J.: Interactive effects from combining fertilizer and organic residue inputs on nitrogen transformations, Soil Biol. Biochem., 40, 2375–2384, https://doi.org/10.1016/j.soilbio.2008.05.018, 2008.
Gentile, R., Vanlauwe, B., and Six, J.: Litter quality impacts short- but not long-term soil carbon dynamics in soil aggregate fractions, Ecol. Appl., 21, 695–703, https://doi.org/10.1890/09-2325.1, 2011.
Gram, G., Roobroeck, D., Pypers, P., Six, J., Merckx, R., and Vanlauwe, B.: Combining organic and mineral fertilizers as a climate-smart integrated soil fertility management practice in sub-Saharan Africa: A meta-analysis, PLoS ONE, 15, e0239552, https://doi.org/10.1371/journal.pone.0239552, 2020.
Greenwood, D. J., Gerwitz, A., Stone, D. A., and Barnes, A.: Root development of vegetable crops, Plant and Soil, 68, 75–96, https://www.jstor.org/stable/42934072 (last access: 5 August 2024), 1982.
Gross, A. and Glaser, B.: Meta-analysis on how manure application changes soil organic carbon storage, Sci. Rep., 11, 5516, https://doi.org/10.1038/s41598-021-82739-7, 2021.
Hansen, M. C., Potapov, P. V., Moore, R., Hancher, M., Turubanova, S. A., Tyukavina, A., Thau, D., Stehman, S. V., Goetz, S. J., Loveland, T. R., Kommareddy, A., Egorov, A., Chini, L., Justice, C. O., and Townshend, J. R. G.: High-Resolution Global Maps of 21st-Century Forest Cover Change, Science, 342, 850–853, https://doi.org/10.1126/science.1244693, 2013.
Hendershot, W. H. and Duquette, M.: A Simple Barium Chloride Method for Determining Cation Exchange Capacity and Exchangeable Cations, Soil Sci. Soc. Am. J., 50, 605–608, https://doi.org/10.2136/sssaj1986.03615995005000030013x, 1986.
Hofmann, A., Heim, A., Gioacchini, P., Miltner, A., Gehre, M., and Schmidt, M. W. I.: Mineral fertilization did not affect decay of old lignin and SOC in a 13C-labeled arable soil over 36 years, Biogeosciences, 6, 1139–1148, https://doi.org/10.5194/bg-6-1139-2009, 2009.
Kaiser, K. and Kalbitz, K.: Cycling downwards – dissolved organic matter in soils, Soil Biol. Biochem., 52, 29–32, https://doi.org/10.1016/j.soilbio.2012.04.002, 2012a.
Kaiser, K. and Kalbitz, K.: Cycling downwards – dissolved organic matter in soils, Soil Biol. Biochem., 52, 29–32, https://doi.org/10.1016/j.soilbio.2012.04.002, 2012b.
Kassambara, A.: rstatix: Pipe-Friendly Framework for Basic Statistical Tests, R package version 0.7.1, https://CRAN.R-project.org/package=rstatix (last access: 5 August 2024), 2022.
Kihara, J., Bolo, P., Kinyua, M., Nyawira, S. S., and Sommer, R.: Soil health and ecosystem services: Lessons from sub-Sahara Africa (SSA), Geoderma, 370, 114342, https://doi.org/10.1016/j.geoderma.2020.114342, 2020.
Komada, T., Anderson, M. R., and Dorfmeier, C. L.: Carbonate removal from coastal sediments for the determination of organic carbon and its isotopic signatures, δ13C and Δ14C: comparison of fumigation and direct acidification by hydrochloric acid, Limnol. Ocean Method., 6, 254–262, https://doi.org/10.4319/lom.2008.6.254, 2008.
Kuznetsova, A., Brockhoff, P. B., and Christensen, R. H. B.: lmerTes Package: Tests in Linear Mixed Effects Models, J. Stat. Soft., 82, 1–26, https://doi.org/10.18637/jss.v082.i13, 2017.
Ladha, J. K., Reddy, C. K., Padre, A. T., and Van Kessel, C.: Role of Nitrogen Fertilization in Sustaining Organic Matter in Cultivated Soils, J. Environ. Qual., 40, 1756–1766, https://doi.org/10.2134/jeq2011.0064, 2011.
Lal, R.: Soils and sustainable agriculture, A review, Agron. Sustain. Dev., 28, 57–64, https://doi.org/10.1051/agro:2007025, 2008.
Lal, R.: Digging deeper: A holistic perspective of factors affecting soil organic carbon sequestration in agroecosystems, Glob. Change Biol., 24, 3285–3301, https://doi.org/10.1111/gcb.14054, 2018.
Laub, M., Schlichenmeier, S., Vityakon, P., and Cadisch, G.: Litter Quality and Microbes Explain Aggregation Differences in a Tropical Sandy Soil, J. Soil Sci. Plant Nutr., 22, 848–860, https://doi.org/10.1007/s42729-021-00696-6, 2022.
Laub, M., Corbeels, M., Mathu Ndungu, S., Mucheru-Muna, M. W., Mugendi, D., Necpalova, M., Van De Broek, M., Waswa, W., Vanlauwe, B., and Six, J.: Combining manure with mineral N fertilizer maintains maize yields: Evidence from four long-term experiments in Kenya, Field Crops Res., 291, 108788, https://doi.org/10.1016/j.fcr.2022.108788, 2023a.
Laub, M., Corbeels, M., Couëdel, A., Ndungu, S. M., Mucheru-Muna, M. W., Mugendi, D., Necpalova, M., Waswa, W., Van de Broek, M., Vanlauwe, B., and Six, J.: Managing soil organic carbon in tropical agroecosystems: evidence from four long-term experiments in Kenya, SOIL, 9, 301–323, https://doi.org/10.5194/soil-9-301-2023, 2023b.
Leuther, F., Wolff, M., Kaiser, K., Schumann, L., Merbach, I., Mikutta, R., and Schlüter, S.: Response of subsoil organic matter contents and physical properties to long-term, high-rate farmyard manure application, Europ. J. Soil Sci., 73, e13233, https://doi.org/10.1111/ejss.13233, 2022.
Liu, E., Yan, C., Mei, X., Zhang, Y., and Fan, T.: Long-Term Effect of Manure and Fertilizer on Soil Organic Carbon Pools in Dryland Farming in Northwest China, PLoS ONE, 8, e56536, https://doi.org/10.1371/journal.pone.0056536, 2013.
Liu, N., Li, Y., Cong, P., Wang, J., Guo, W., Pang, H., and Zhang, L.: Depth of straw incorporation significantly alters crop yield, soil organic carbon and total nitrogen in the North China Plain, Soil Till. Res., 205, 104772, https://doi.org/10.1016/j.still.2020.104772, 2021.
Liu, Y., Li, C., Cai, G., Sauheitl, L., Xiao, M., Shibistova, O., Ge, T., and Guggenberger, G.: Meta-analysis on the effects of types and levels of N, P, and K fertilization on organic carbon in cropland soils, Geoderma, 437, 116580, https://doi.org/10.1016/j.geoderma.2023.116580, 2023.
Ma, Q., Bell, R. W., and Mattiello, E. M.: Nutrient Acquisition with Particular Reference to Subsoil Constraints, in: Subsoil Constraints for Crop Production, edited by: Oliveira, T. S. D. and Bell, R. W., Springer International Publishing, Cham, 289–321, https://doi.org/10.1007/978-3-031-00317-2_12, 2022.
Mathieu, J. A., Hatté, C., Balesdent, J., and Parent, É.: Deep soil carbon dynamics are driven more by soil type than by climate: a worldwide meta-analysis of radiocarbon profiles, Glob. Change Biol., 21, 4278–4292, https://doi.org/10.1111/gcb.13012, 2015.
Minasny, B., Malone, B. P., McBratney, A. B., Angers, D. A., Arrouays, D., Chambers, A., Chaplot, V., Chen, Z.-S., Cheng, K., Das, B. S., Field, D. J., Gimona, A., Hedley, C. B., Hong, S. Y., Mandal, B., Marchant, B. P., Martin, M., McConkey, B. G., Mulder, V. L., O'Rourke, S., Richer-de-Forges, A. C., Odeh, I., Padarian, J., Paustian, K., Pan, G., Poggio, L., Savin, I., Stolbovoy, V., Stockmann, U., Sulaeman, Y., Tsui, C.-C., Vågen, T.-G., Van Wesemael, B., and Winowiecki, L.: Soil carbon 4 per mille, Geoderma, 292, 59–86, https://doi.org/10.1016/j.geoderma.2017.01.002, 2017.
Müller, C. R.: EmbuPub_SOC, Figshare [date set], https://figshare.com/s/c2f2787b7a56ef7ad656, last access: 20 April 2025.
Ndung'u, M., Ngatia, L. W., Onwonga, R. N., Mucheru-Muna, M. W., Fu, R., Moriasi, D. N., and Ngetich, K. F.: The influence of organic and inorganic nutrient inputs on soil organic carbon functional groups content and maize yields, Heliyon, 7, e07881, https://doi.org/10.1016/j.heliyon.2021.e07881, 2021.
Pretty, J.: Sustainable intensification in Africa, Int. J. Agr. Sustain., 9, 3–4, https://doi.org/10.3763/ijas.2011.91ED, 2011.
Reimer, P., Brown, T., and Reimer, R.: Discussion: Reporting and Calibration of Post-Bomb 14C Data, Radiocarbon, 46, 1299–1304, https://doi.org/10.1017/S0033822200033154, 2004.
Rumpel, C. and Kögel-Knabner, I.: Deep soil organic matter—a key but poorly understood component of terrestrial C cycle, Plant Soil, 338, 143–158, https://doi.org/10.1007/s11104-010-0391-5, 2011.
Shumba, A., Chikowo, R., Thierfelder, C., Corbeels, M., Six, J., and Cardinael, R.: Mulch application as the overarching factor explaining increase in soil organic carbon stocks under conservation agriculture in two 8-year-old experiments in Zimbabwe, SOIL, 10, 151–165, https://doi.org/10.5194/soil-10-151-2024, 2024.
Sierra, C. A., Ahrens, B., Bolinder, M. A., Braakhekke, M. C., Von Fromm, S., Kätterer, T., Luo, Z., Parvin, N., and Wang, G.: Carbon sequestration in the subsoil and the time required to stabilize carbon for climate change mitigation, Glob. Change Biol., 30, e17153, https://doi.org/10.1111/gcb.17153, 2024.
Six, J., Feller, C., Denef, K., Ogle, S. M., de Moraes, J. C., and Albrecht, A.: Soil organic matter, biota and aggregation in temperateand tropical soils - Effects of no-tillage, Agronomie, 22, 755–775, https://doi.org/10.1051/agro:2002043, 2002.
Sommer, R., Paul, B. K., Mukalama, J., and Kihara, J.: Reducing losses but failing to sequester carbon in soils – the case of Conservation Agriculture and Integrated Soil Fertility Management in the humid tropical agro-ecosystem of Western Kenya, Agr. Ecosyst. Environ., 254, 82–91, https://doi.org/10.1016/j.agee.2017.11.004, 2018.
Stuiver, M. and Polach, H. A.: Discussion reporting of 14C data, Radiocarbon, 19, 355–363, 1977.
Tardieu, F.: Analysis of the spatial variability of maize root density, Plant and Soil, 107, 259–266, https://doi.org/10.1007/BF02370555, 1988.
Tieszen, L. L.: Natural variations in the carbon isotope values of plants: Implications for archaeology, ecology, and paleoecology, J. Archaeol. Sci., 18, 227–248, https://doi.org/10.1016/0305-4403(91)90063-U, 1991.
Tittonell, P., Corbeels, M., Van Wijk, M. T., Vanlauwe, B., and Giller, K. E.: Combining Organic and Mineral Fertilizers for Integrated Soil Fertility Management in Smallholder Farming Systems of Kenya: Explorations Using the Crop-Soil Model FIELD, Agron. J., 100, 1511–1526, https://doi.org/10.2134/agronj2007.0355, 2008.
Trevisan, S., Francioso, O., Quaggiotti, S., and Nardi, S.: Humic substances biological activity at the plant-soil interface: From environmental aspects to molecular factors, Plant Signal. Behav., 5, 635–643, https://doi.org/10.4161/psb.5.6.11211, 2010.
Trumbore, S. E., Vogel, J. S., and Southon, J. R.: AMS 14C Measurements of Fractionated Soil Organic Matter: An Approach to Deciphering the Soil Carbon Cycle, Radiocarbon, 31, 644–654, https://doi.org/10.1017/S0033822200012248, 1989.
Uselman, S. M., Qualls, R. G., and Lilienfein, J.: Contribution of Root vs. Leaf Litter to Dissolved Organic Carbon Leaching through Soil, Soil Sci. Soc. Am. J., 71, 1555–1563, https://doi.org/10.2136/sssaj2006.0386, 2007.
Van de Broek, M., Ghiasi, S., Decock, C., Hund, A., Abiven, S., Friedli, C., Werner, R. A., and Six, J.: The soil organic carbon stabilization potential of old and new wheat cultivars: a 13CO2-labeling study, Biogeosciences, 17, 2971–2986, https://doi.org/10.5194/bg-17-2971-2020, 2020.
Vanlauwe, B. and Giller, K.: Popular myths around soil fertility management in sub-Saharan Africa, Agr. Ecosyst. Environ., 116, 34–46, https://doi.org/10.1016/j.agee.2006.03.016, 2006.
Vanlauwe, B., Gachengo, C., Shepherd, K., Barrios, E., Cadisch, G., and Palm, C. A.: Laboratory Validation of a Resource Quality-Based Conceptual Framework for Organic Matter Management, Soil Sci. Soc. Am. j., 69, 1135–1145, https://doi.org/10.2136/sssaj2004.0089, 2005.
Vanlauwe, B., Chianu, J., Giller, K. E., Merckx, R., Mokwunye, U., Pypers, P., Shepherd, K., Woomer, P. L., and Sanginga, N.: Integrated soil fertility management: operational definition and consequences for implementation and dissemination, Outlook Agr., 39, 17–24, https://doi.org/10.5367/000000010791169998, 2010.
Vanlauwe, B., Descheemaeker, K., Giller, K. E., Huising, J., Merckx, R., Nziguheba, G., Wendt, J., and Zingore, S.: Integrated soil fertility management in sub-Saharan Africa: unravelling local adaptation, SOIL, 1, 491–508, https://doi.org/10.5194/soil-1-491-2015, 2015.
Veldkamp, E., Schmidt, M., Powers, J. S., and Corre, M. D.: Deforestation and reforestation impacts on soils in the tropics, Nat. Rev. Earth Environ., 1, 590–605, https://doi.org/10.1038/s43017-020-0091-5, 2020.
Wang, J., Sun, J., Xia, J., He, N., Li, M., and Niu, S.: Soil and vegetation carbon turnover times from tropical to boreal forests, Funct. Ecol., 32, 71–82, https://doi.org/10.1111/1365-2435.12914, 2018.
Wiesmeier, M., Urbanski, L., Hobley, E., Lang, B., von Lützow, M., Marin-Spiotta, E., van Wesemael, B., Rabot, E., Ließ, M., Garcia-Franco, N., Wollschläger, U., Vogel, H.-J., and Kögel-Knabner, I.: Soil organic carbon storage as a key function of soils – A review of drivers and indicators at various scales, Geoderma, 333, 149–162, https://doi.org/10.1016/j.geoderma.2018.07.026, 2019.
Yang, X., Xiong, J., Du, T., Ju, X., Gan, Y., Li, S., Xia, L., Shen, Y., Pacenka, S., Steenhuis, T. S., Siddique, K. H. M., Kang, S., and Butterbach-Bahl, K.: Diversifying crop rotation increases food production, reduces net greenhouse gas emissions and improves soil health, Nat. Commun., 15, 198, https://doi.org/10.1038/s41467-023-44464-9, 2024.
Yost, J. L. and Hartemink, A. E.: How deep is the soil studied – an analysis of four soil science journals, Plant Soil, 452, 5–18, https://doi.org/10.1007/s11104-020-04550-z, 2020.