the Creative Commons Attribution 4.0 License.
the Creative Commons Attribution 4.0 License.
 | 01 Jul 2025
Phylogeochemistry: exploring evolutionary constraints on belemnite rostrum element composition
Kevin Stevens
René Hoffmann
Adrian Immenhauser
The biogenic carbonate hard parts of a large range of marine organisms are among the most important geochemical archives of Earth's climate dynamics through time and the evolution of life. That said, biomineralization pathways, i.e. the secretion of mineral phases by organisms, are complex and may differ significantly between different taxa. In light of this, it is critically important to evaluate if related taxa might display similar hard parts geochemistry. If so, this relation might bear information on evolutionary relationships and has great significance in carbonate archive research. Here, we test the evolutionary constraints on element Ca ratios of belemnite rostra using Bayesian phylogenetic tools. For this purpose, we assembled a large dataset of element ratios from 2241 published samples of belemnite rostra. We used comparative Bayesian phylogenetic tools to reconstruct ancestral states and phenotypic evolutionary rates of these geochemical data based on trees inferred from morphological data. While and appear to be taxon-independent and probably mainly reflect environmental and diagenetic effects, and display stronger taxon-specific patterns, even though their interpretation remains complex. The phenotypic evolutionary rates are high, with average estimated changes in element ratios of 12.4 % (; confidence interval 9.0 %–16.9 %) and 12.3 % (; confidence interval 5.5 %–18.3 %) of the overall mean element ratio within 1 million years (Myr). While the distribution of ratios is relatively homogeneous across the tree, Mg concentrations are divided among two distinct groups (<5.5 and >7.5 mmol mol−1, respectively), with at least five transitions between them. Beyond carbonate archive research, our phylogenetic analysis provides insights into the evolution of belemnites. This study highlights the complex interplay between evolutionary, ontogenetic, environmental, and diagenetic effects and calls for caution when using belemnite element ratios as proxies for palaeoclimatic studies. We propose the term “phylogeochemistry” for the investigation of geochemical data using phylogenetic modelling techniques.
- Article
(7652 KB) - Full-text XML
- BibTeX
- EndNote


Belemnites are a group of coleoid cephalopods, likely representing stem group decabrachians (today's squids, cuttlefishes and relatives) that were particularly abundant and diverse in mainly open marine waters of the Jurassic and Cretaceous oceans (Hoffmann and Stevens, 2020, and references therein). Their calcitic internal skeletal element, the rostrum, is a common fossil in Mesozoic marine sedimentary rocks and a widely used carbonate archive (e.g. Urey, 1948; Urey et al., 1951; Lowenstam and Epstein, 1954; Spaeth, 1971; Rosales et al., 2004; Dutton et al., 2007; Arabas, 2016). Palaeoenvironmental parameters based on belemnite archive calcite include seawater oxygenation level, seawater temperature, alkalinity (pH) or seawater isotope and elemental data, among others (Wierzbowski, 2004; Gómez et al., 2008). Further, the calcite of a belemnite rostrum from the Upper Cretaceous Peedee Formation also served as the base for the PeeDee Belemnite standard (now Vienna PeeDee Belemnite, VPDB; Slater et al., 2001) in analytical geochemistry. Despite their wide distribution in (hemi)pelagic sections worldwide, and regardless of many decades of dedicated research, the interpretation of belemnite geochemical data is still fraught with complications.
Specifically, complexity results from (i) metabolic processes, i.e. biomineralization strategies, likely resulting in ontogenetic trends in sclerochronologically sampled rostra (Spaeth, 1971; Vonhof et al., 2011; Ullmann et al., 2015; Immenhauser et al., 2016). (ii) Further, the complex rostrum calcite ultrastructure is not well understood. High-resolution petrographic studies of rostra from multiple belemnite genera revealed the presence of two distinct calcite phases (Benito et al., 2016; Hoffmann et al., 2016, 2021). The first phase represents an (arguably porous) biomineral fabric secreted during the lifetime of the animal from extrapallial fluids (geochemically close to the ambient seawater), while the second phase is less well constrained in terms of its formation time and arguably had an amorphous precursor phase (Hoffmann et al., 2021). (iii) Post-mortem diagenetic alteration processes commonly complicate these patterns. Specifically, the organic-rich layers in the rostrum were subject to microbial biodegradation, with microbes targeting the organic matter. The relation between organic matter, biodegradation and diagenetic alteration is a typical feature of all marine skeletal carbonates (Lange et al., 2018). During the subsequent burial, alteration is most pronounced and can cause the recrystallization of portions (or all) of the rostrum (Wierzbowski and Joachimski, 2009; Immenhauser et al., 2016). Numerous geochemical and optical screening methods have been proposed to separate well-preserved from altered material (e.g. Veizer, 1974, 1983; Saelen, 1989; Ullmann and Korte, 2015; Stevens et al., 2017). (iv) Moreover, significant variation in geochemical proxies, such as element concentrations or isotope data between different belemnite species sampled at the same stratigraphical level, was observed (Spaeth et al., 1971; Niebuhr and Joachimski, 2002; McArthur et al., 2004, 2007; Mutterlose et al., 2010; Li et al., 2013; Stevens et al., 2022). This is particularly noteworthy as trace element concentrations have been shown to be phylogenetically correlated in living calcifying organisms (Ulrich et al., 2021), and taxon-specific signals in element Ca ratios have been shown in brachiopods (e.g. Grossman et al., 1996; Ullmann et al., 2017). Furthermore, a recent study showed consistent, lineage-dependent offsets of and δ18O data in Miocene to extant foraminifera (Boscolo-Galazzo et al., 2025). In a similar context, recent studies have documented that biomineralization patterns are strongly constrained by phylogeny. Examples include the calcite-aragonite ratios in modern bryozoans (Piwoni-Piórewicz et al., 2024) or the crystal orientation in conodont dental elements (Shirley et al., 2024). However, a similar phylogenetic perspective on element incorporation into belemnite rostra has not been studied systematically.
This omission forms a strong motivation for the present paper proposing the term “phylogeochemistry” for the rigorous combination of phylogenetic tools and geochemical proxy data in rostra. The working hypothesis is that the rostra of different clades of belemnites differ in their geochemical properties. If that axiom holds, acknowledging the intrinsic complexity of belemnite geochemistry in general, then these data have the potential to be used as a character in elucidating phylogenetic relationships of belemnites, which are currently challenging to constrain due to the scarcity of morphological characters. First quantitative efforts in this direction have only been explored recently (Stevens et al., 2023). Beyond phylogenetic relationships, understanding taxonomic patterns in belemnite rostrum geochemistry has wide significance for studies with a focus on palaeoceanography.
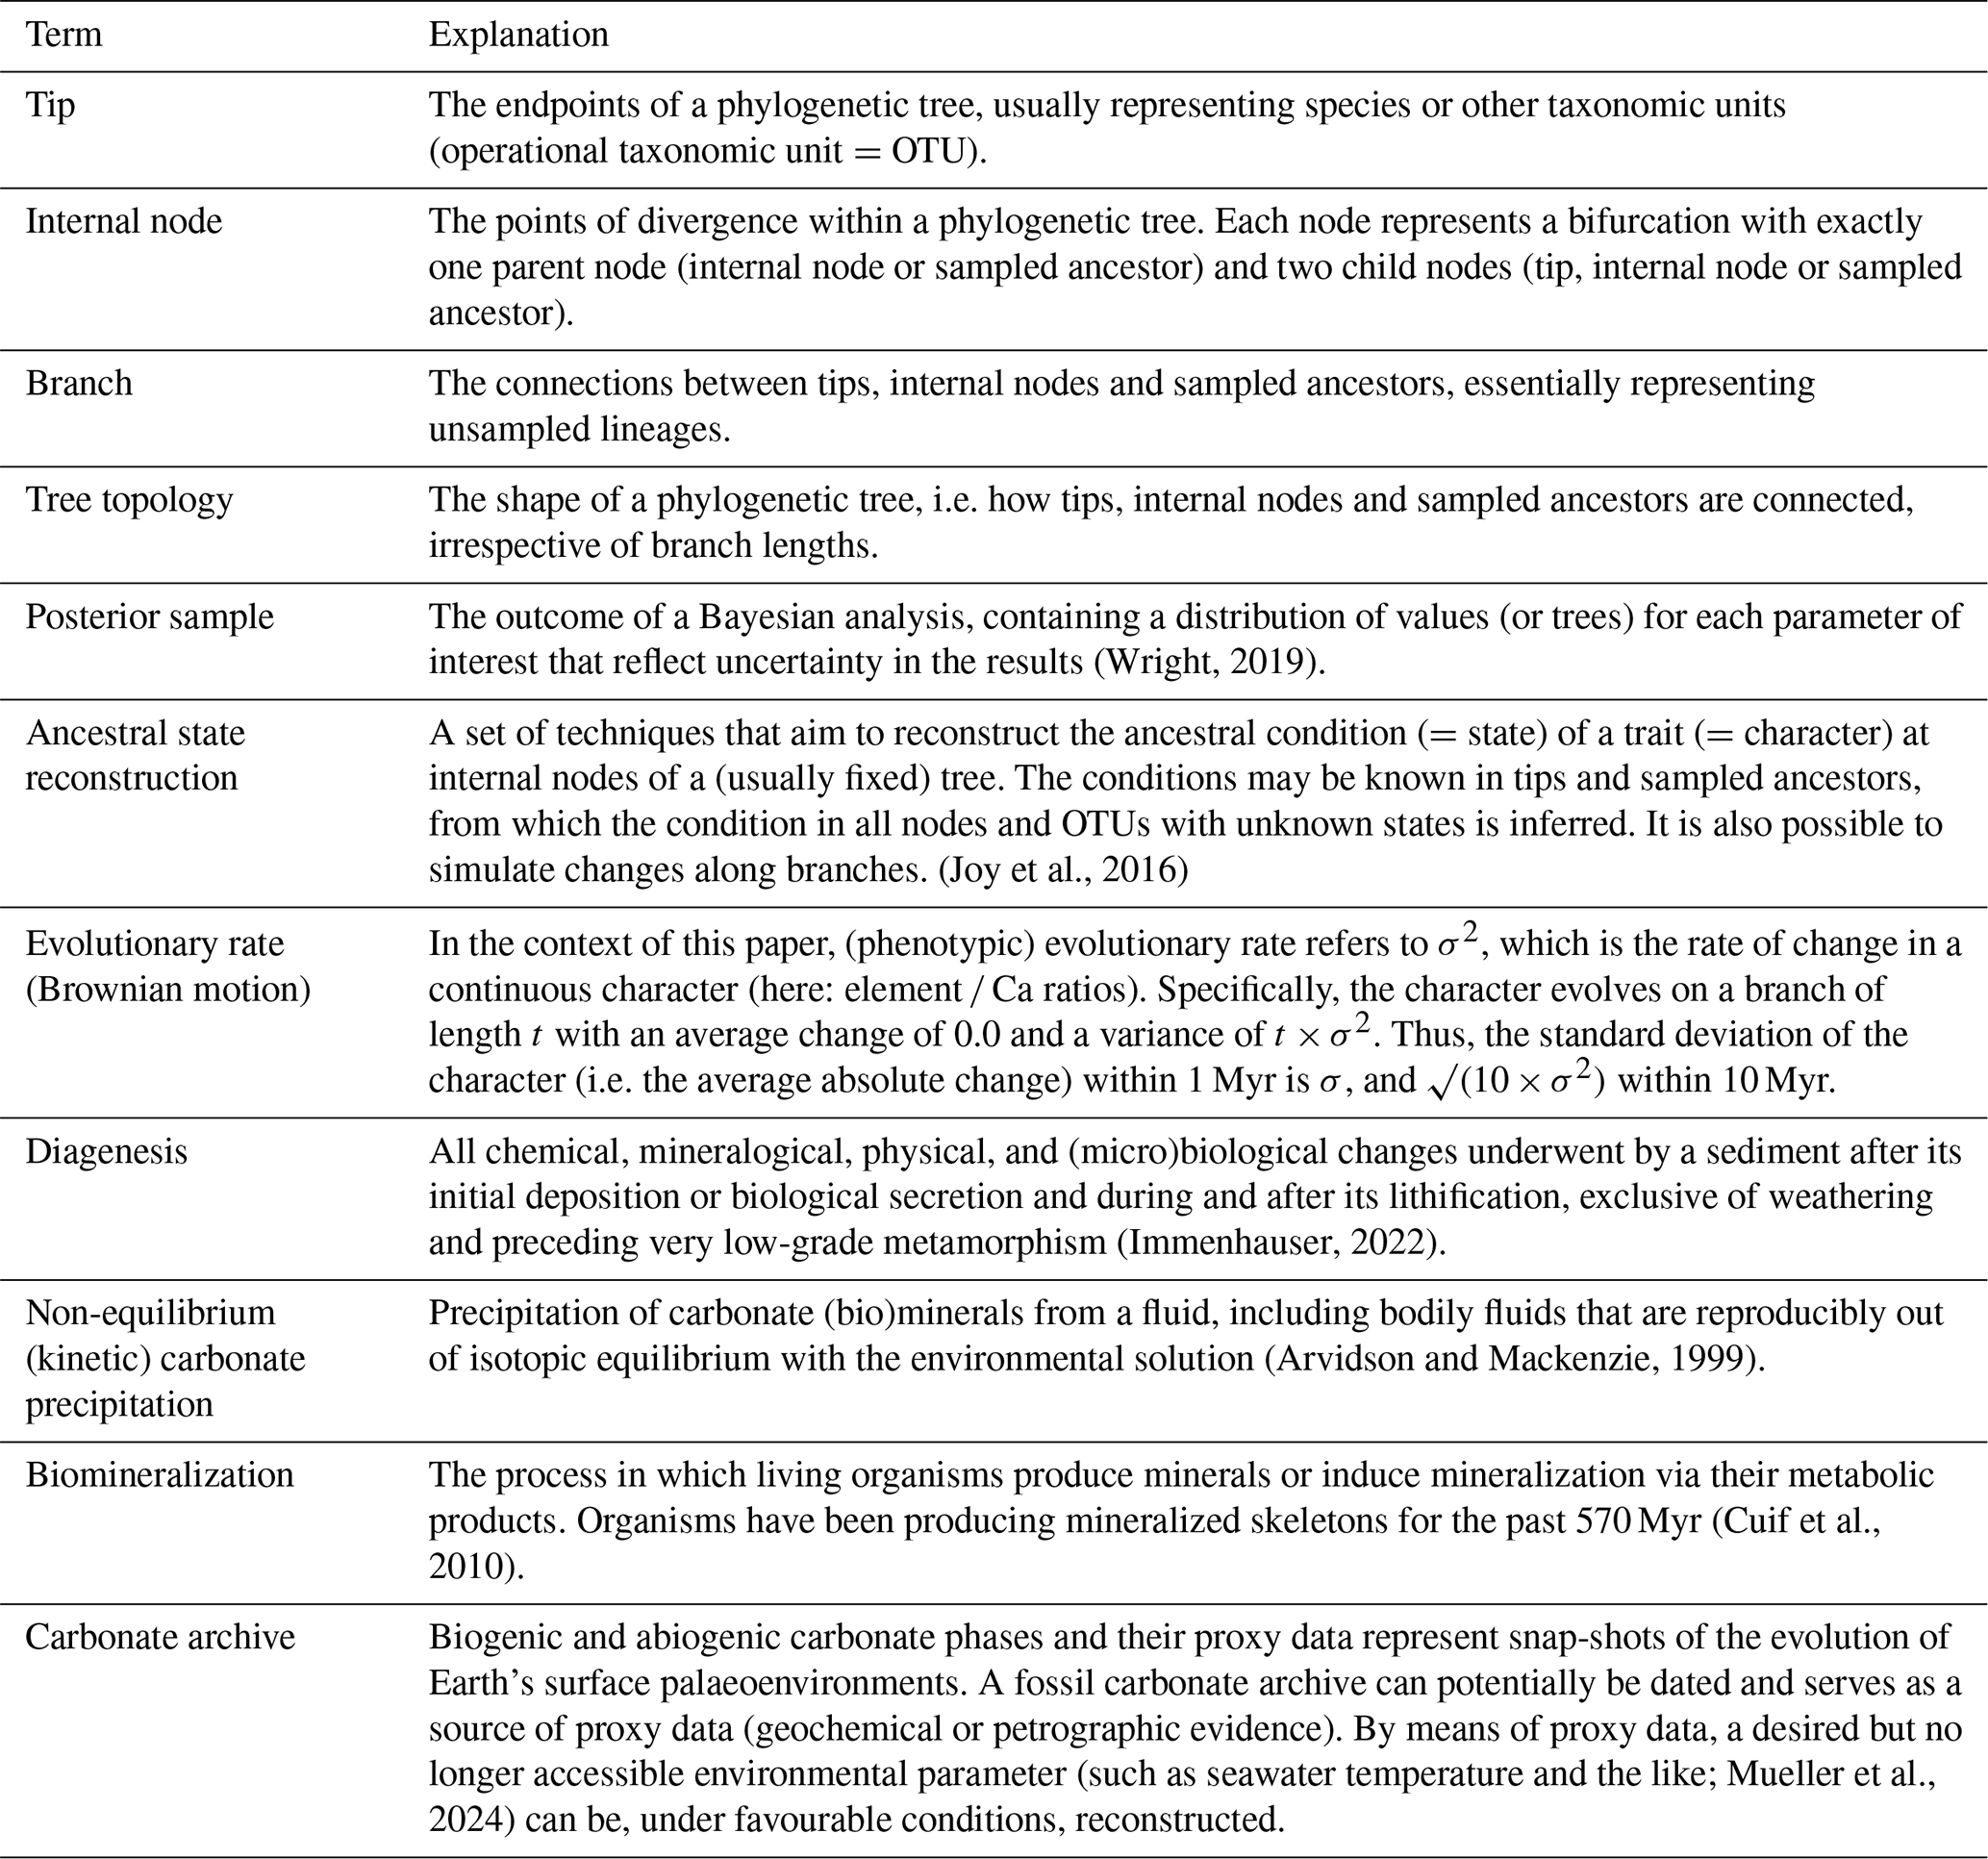
(Wright, 2019)(Joy et al., 2016)(Immenhauser, 2022)(Arvidson and Mackenzie, 1999)(Cuif et al., 2010)(such as seawater temperature and the like; Mueller et al., 2024)Table 1Definition of important terms and concepts used in this paper. See Felsenstein (2003) for a comprehensive introduction to phylogenetic methods. Further references are listed below (see also references therein).
This paper has the following aims: (i) a large (literature) dataset of taxon-specific element Ca ratios and the application of ancestral state estimation approaches serves to test whether these proxy data are phylogenetically constrained. Importantly, this means that we do not use geochemical data to infer phylogenetic relationships, but rather compare how they change across a tree reconstructed by morphological data. (ii) Based on this, we explore how to interpret geochemical data from an evolutionary perspective. For the sake of focus, we limit this study to a set of element Ca ratios (, , , and ). The application of phylogeochemistry to isotope data from belemnite rostra must be the focus of forthcoming work.
Our article is aimed at researchers with different scientific backgrounds, such as evolutionary biologists and palaeontologists on the one hand and geochemists and oceanographers on the other hand. This might imply that part of the terminology will be unfamiliar to potential readers. To improve the accessibility of the science presented here, we provide definitions of important terms in Table 1. For further reading, we recommend scholarly overview papers of the respective literature for Bayesian phylogenetics (e.g. Wright, 2019; Wright et al., 2022), belemnite palaeobiology (Hoffmann and Stevens, 2020), and geochemical proxy data and their interpretation (e.g. Veizer, 1974; Rosales et al., 2004; Schöne, 2008; Swart, 2015; Ullmann et al., 2015; Immenhauser et al., 2016; Immenhauser, 2022, and references therein).
An overview of the methodology applied is given in Fig. 1. The approach used is divided into three main work packages: (i) acquisition of geochemical data from the literature (Fig. 1f–i), (ii) Bayesian inference of an updated belemnite phylogeny to include taxa for which geochemical data is available, based on morphological characters (Fig. 1a–e), and (iii) phenotypic evolutionary rate estimation and ancestral state reconstructions (Fig. 1j–l) based on trees from (i) and data from (ii). Details on each of these work packages are given below.
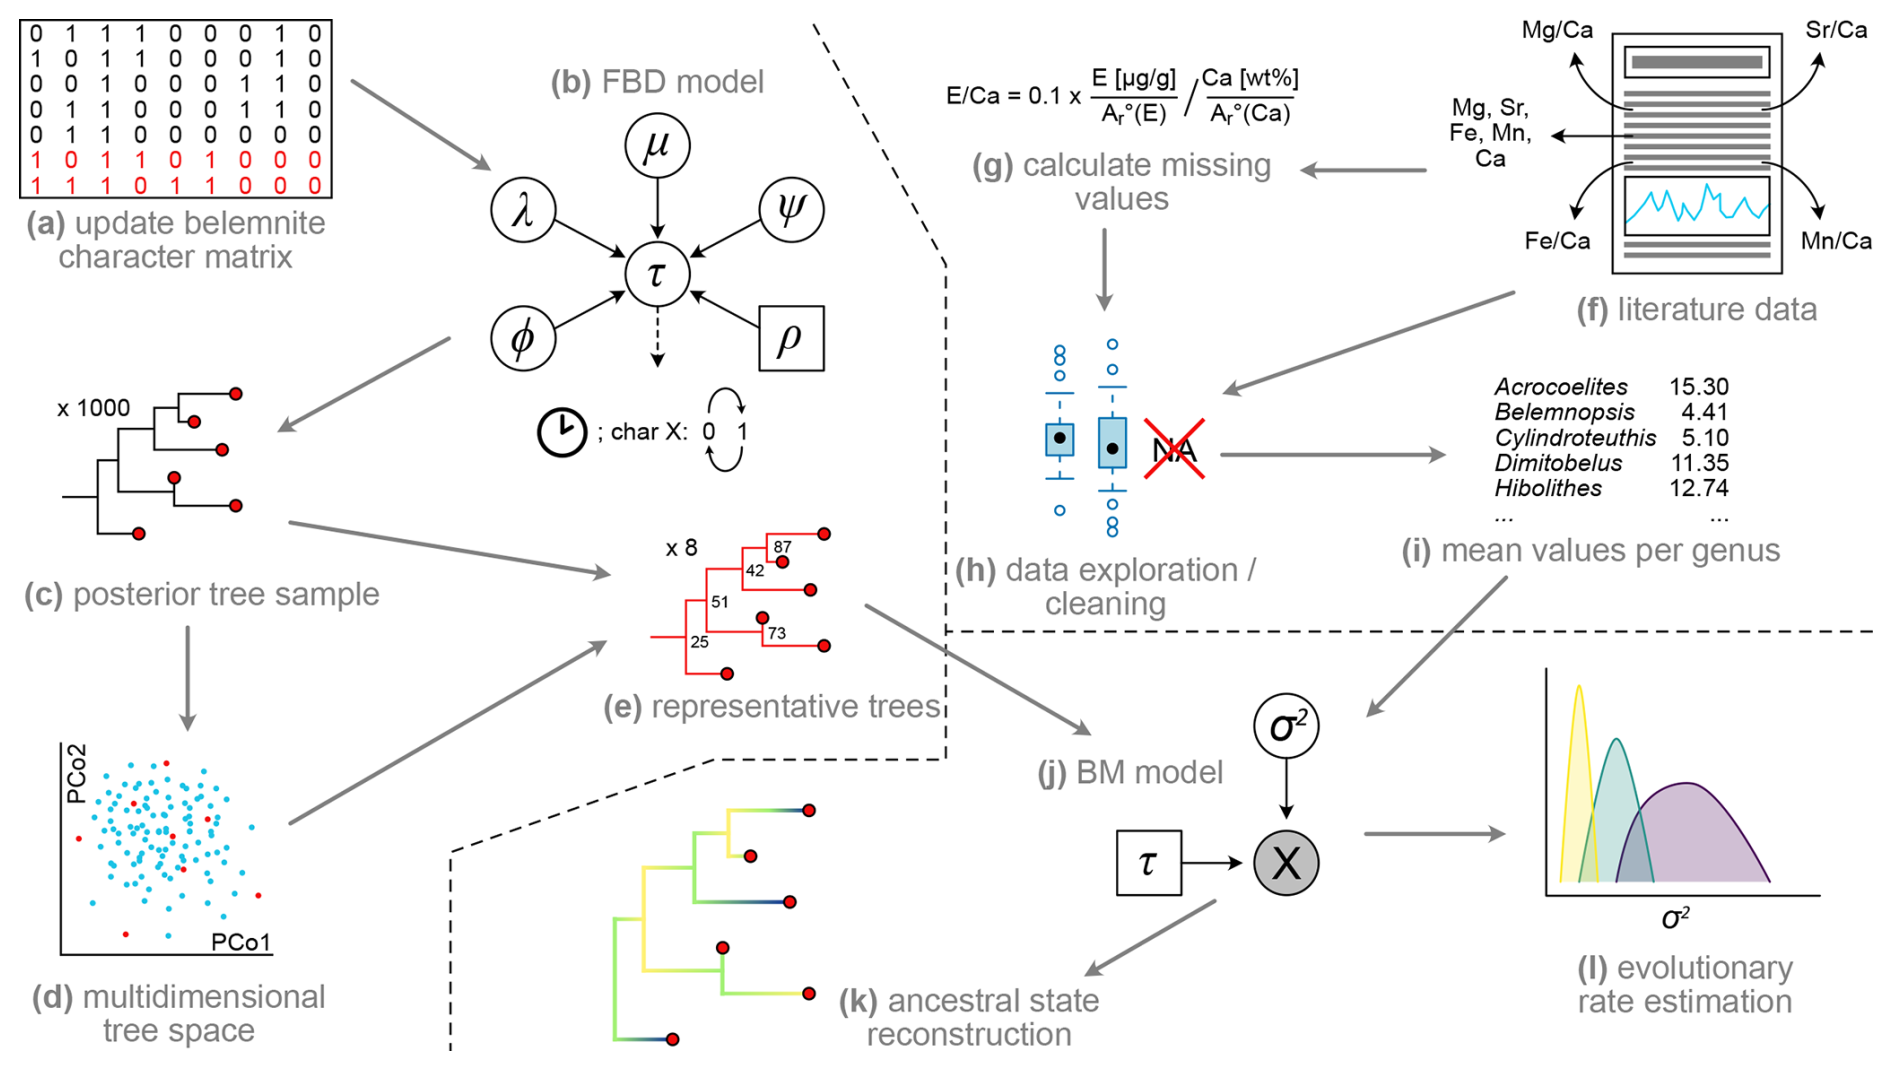
Figure 1Workflow of the present study. (a) Collecting additional data for morphological character matrix to include taxa for which element ratio data are available. (b) Inference of tree topology (τ) in RevBayes using the fossilized birth–death (FBD) model, consisting of extinction rate (µ), speciation rate (λ), fossilization rate (ψ), extant sampling rate (ρ), and origin time (φ) in combination with the clock and character models (see Höhna et al., 2014, for details on graphical model representation). (c) Reduction of posterior trees to random sample of 1000 trees. (d) Multidimensional scaling (= principal coordinate analysis, PCo) of tree space to investigate topological differences between trees. (e) Choose representative trees from posterior tree sample, based on multidimensional scaling. (f) Literature survey, extracting element ratios and raw element concentrations. (g) Calculate element Ca ratios where only raw values were given. (h) Remove non-informative values, compare element ratios between genera, localities, etc. (i) Calculate mean values for each genus. (j) Brownian motion (BM) model consisting of the single parameter σ2 and a fixed tree topology from previous steps. (k) Ancestral state reconstruction of element ratios in R. (l) Estimation of evolutionary rates in RevBayes.
2.1 Element Ca ratio data
We compiled a large belemnite rostrum dataset of element concentrations (expressed as element Ca ratios) from the published literature (Table 2, Fig. 1f). Specifically, we compiled , , , and ratios, in addition to the elemental concentrations for Ca (in wt %), Mg, Sr, Fe, and Mn (usually in ppm = µg g−1), where available. We only included data from studies that identified rostra at least to the genus level. A small proportion of the data may contain variable (undetected) alteration features and, hence, reset elemental concentrations. After some consideration, this potential shortcoming was accepted because we aimed to (i) maximize the dataset, (ii) cover a large range in sampling localities across the world and from different stratigraphic levels, and (iii) include several genera recorded from multiple studies and collection sites. For some data points, alteration had been suspected based on specific threshold values of element Ca ratios (Sørensen et al., 2015; see the Discussion section of this paper). Excluding data points based on the threshold in the latter study shows that the impact is minimal. The median ratio of the data from Sørensen et al. (2015) would accordingly only change from 11.6 to 11.5 mmol mol−1 and the ratio from 2.07 to 2.12 mmol mol−1, despite 27 % of the data being affected. Thus, despite some inherent potential for a diagenetic bias, our dataset is expected to represent an acceptable approximation of what might have been the element ratio distributions at the time of the secretion of the rostra. We also included a sensitivity test that randomly altered the original data to see whether slightly biased data would affect the results (see below).
As expected, the reporting of elemental concentrations was inconsistent between the different sources used. Some authors reported all values of interest, while others reported raw values, relatively commonly omitting raw Ca content. For cases with all raw values known, we calculated the missing ratios as follows (Fig. 1g):
First, the molar amount of Ca (nCa) was calculated using the amount of Ca (mCa) in g, derived from the weight percentage of Ca per 1 g sample, and the molar weight of Ca (MCa) according to the equation
Second, the molar amount of Sr (nSr) was calculated using the concentration of Sr (CSr) in µg g−1, and the molar weight of Sr (MSr) using the formula
Third, the molar ratio of Ca to Sr () in mmol mol−1 was calculated according to
The molar amount of Fe, Mn, and Mg, as well as the molar ratios of Fe, Mn, and Mg to Ca, were calculated accordingly.
In cases where both the raw element concentrations and the element Ca ratios were given, we still calculated the element Ca ratios according to the above formula to compare them to the published values. Where a mismatch was detected, we gave priority to the calculated values, as the element Ca ratios may be affected by conversion errors or rounding. We thereby detected incorrectly calculated ratios of Arabas et al. (2017) and a ratio mismatch in Stevens et al. (2022; note that erroneous calculations were restricted to the supplement file, figures were not affected).
Alberti et al. (2021a)Alberti et al. (2021b)Arabas (2016)Arabas et al. (2017)Armendáriz et al. (2012)Benito and Reolid (2012)Dutton et al. (2007)Li et al. (2012)Li et al. (2013)Malkoč et al. (2010)McArthur et al. (2004)McArthur et al. (2007)Pirrie et al. (2004)Price and Mutterlose (2004)Price et al. (2009)Price et al. (2011)Price et al. (2012)Sørensen et al. (2015)Stevens et al. (2014)Stevens et al. (2017)Stevens et al. (2022)Ullmann et al. (2013)Ullmann et al. (2014)Ullmann et al. (2015)Ullmann and Pogge von Strandmann (2017)van de Schootbrugge et al. (2000)Vickers et al. (2021)Wierzbowski and Joachimski (2007)Wierzbowski and Rogov (2011)Table 2Literature sources for belemnite geochemical data. Abbreviations of genus names: Acc. = Acrocoelites, Act. = Acroteuthis, Adi. = Adiakritobelus, Aul. = Aulacoteuthis, Bai. = Bairstowius, Ber. = Berriasibelus, Blp. = Belemnopsis, Blt. = Belemnites, Blx. = Belemnellocamax, Brv. = Brevibelus, Con. = Conohibolites, Cst. = Castellanibelus, Cyl. = Cylindroteuthis, Dim. = Dimitobelus, Duv. = Duvalia, Hib. = Hibolithes, Hlc. = Holcobelus, Hst. = Hastites, Lag. = Lagonibelus, Mes. = Mesohibolites, Mir. = Mirabelobelus, Nan. = Nannobelus, Neo. = Neohibolithes, Oxy. = Oxyteuthis, Pas. = Passaloteuthis, Per. = Peratobelus, Pox. = Praeoxyteuthis, Ppa. = Parapassaloteuthis, Psb. = Pseudobelus, Psd. = Pseudoduvalia, Sim. = Simpsonibelus, Vau. = Vaunagites, and Yng. = Youngibelus.
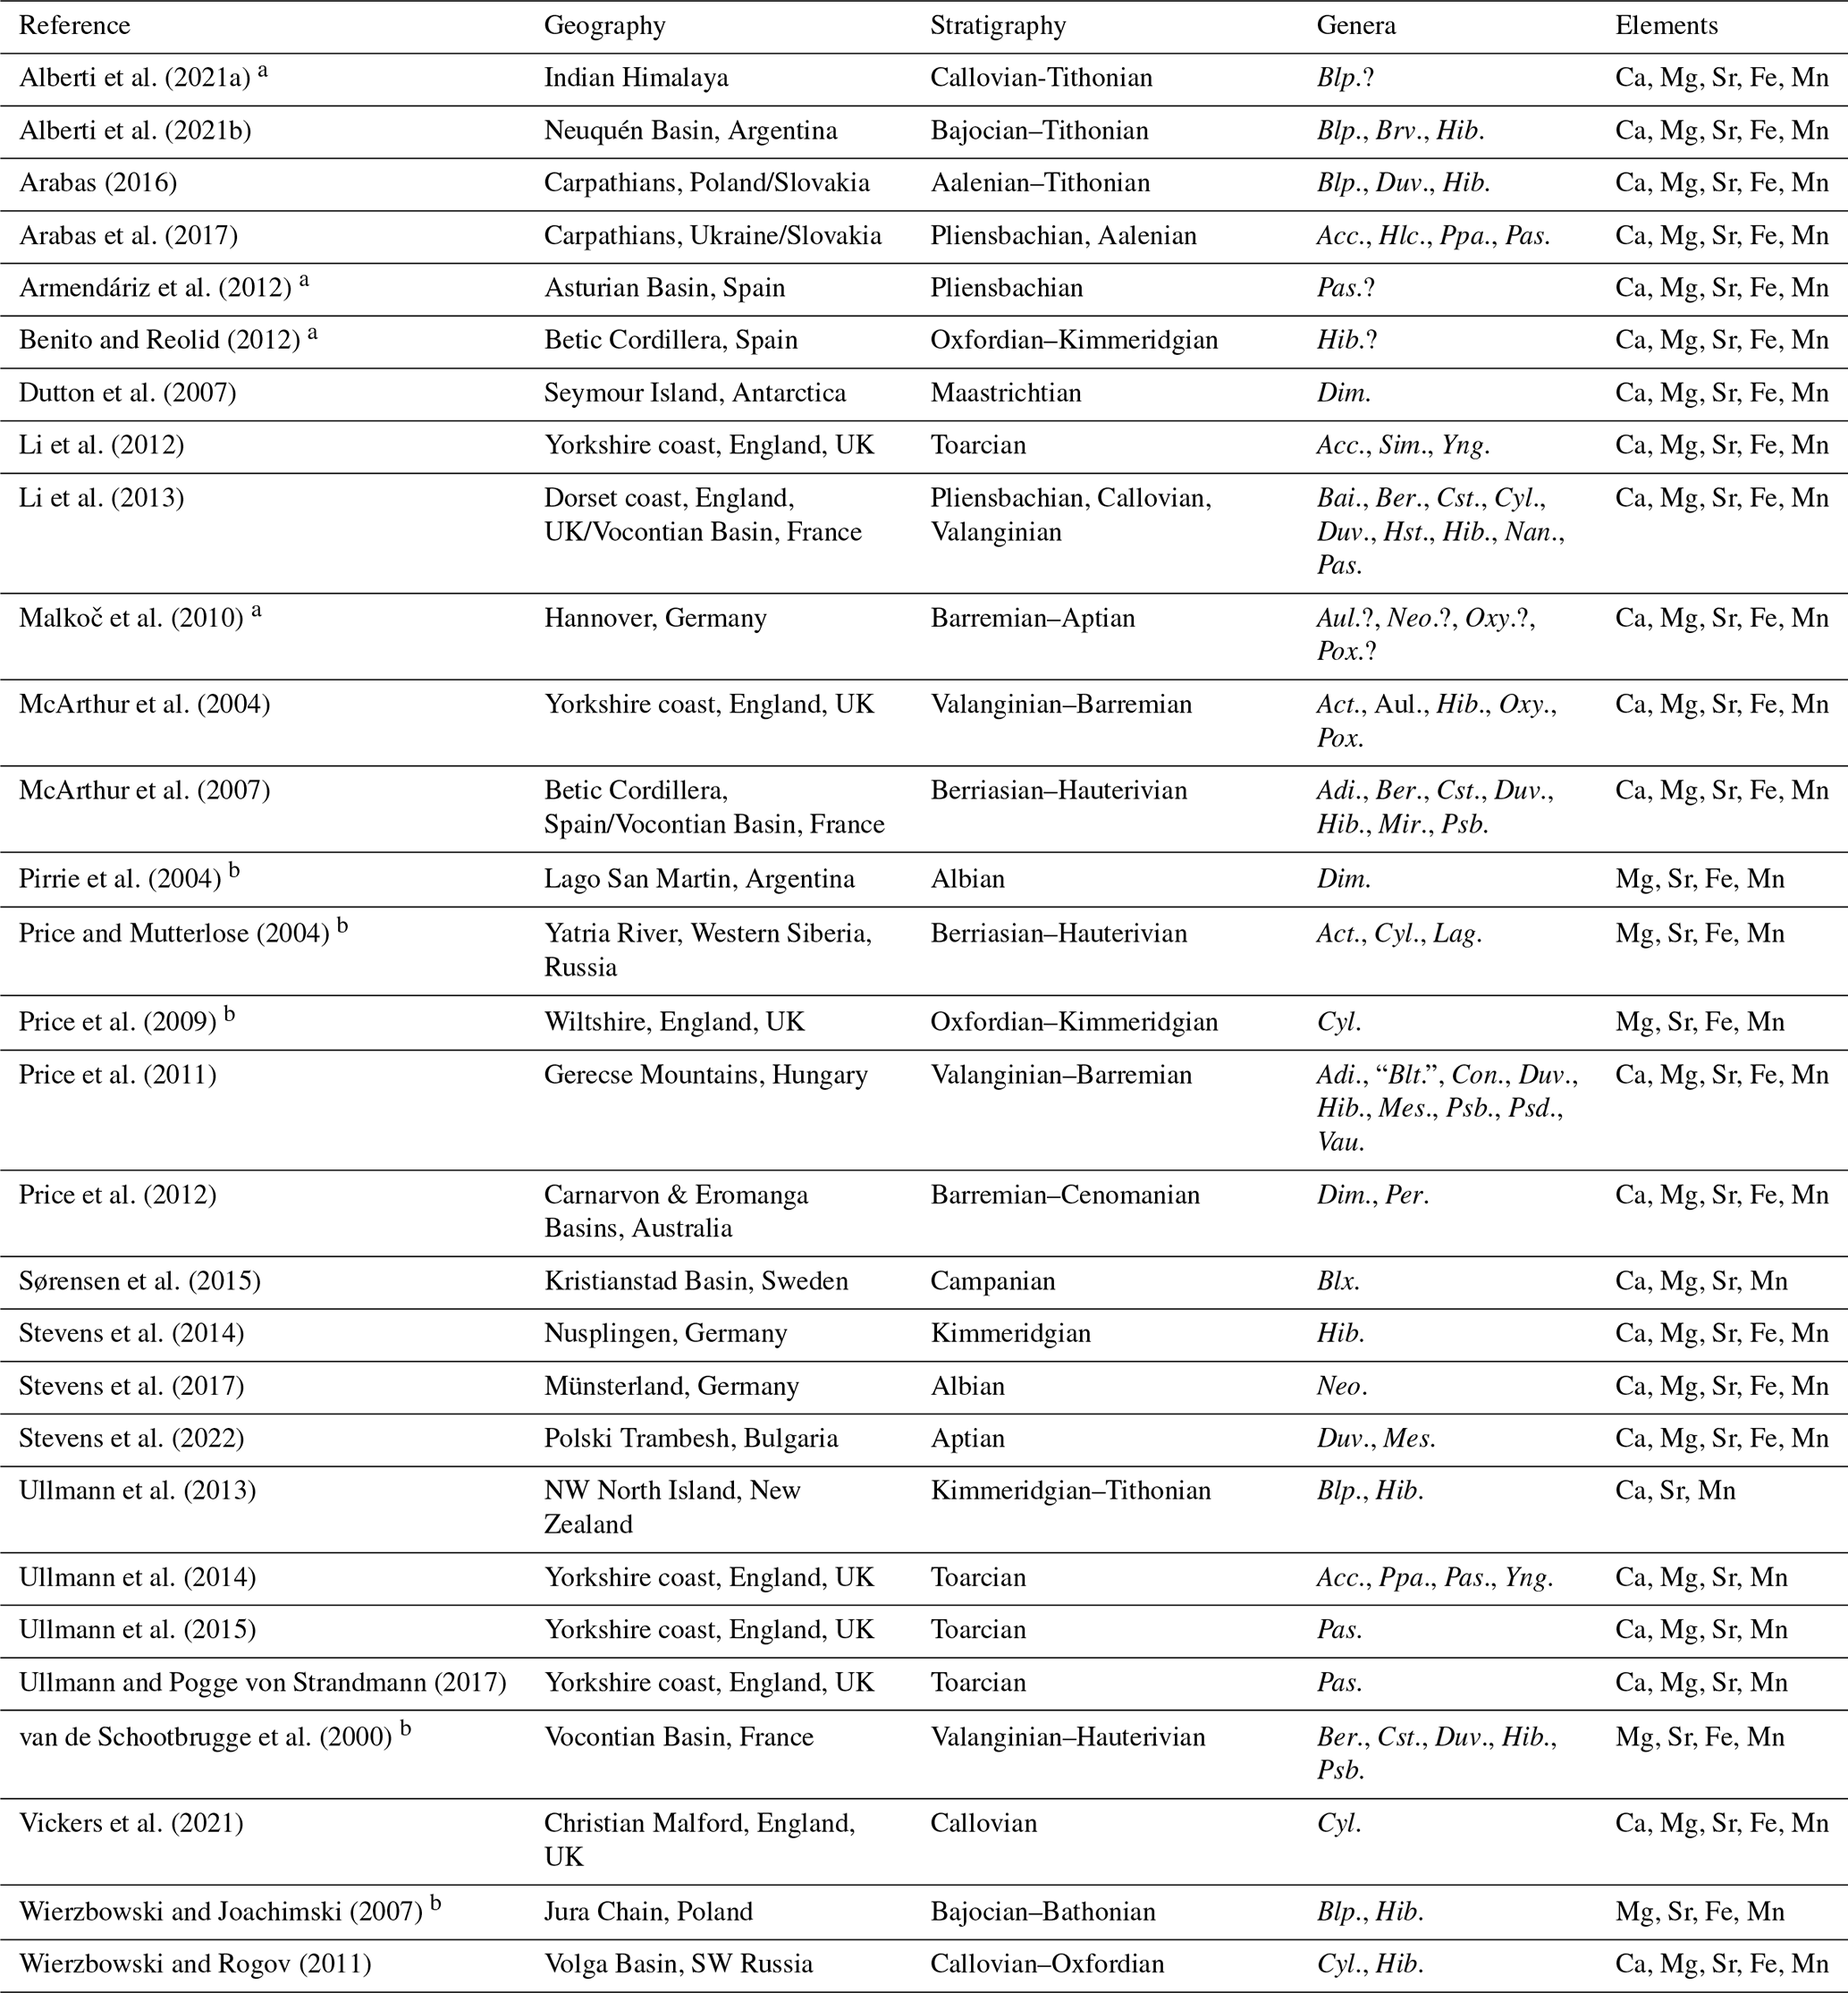
a Generic affinity uncertain for all taxa in publication, no data included in our analyses.
b Only raw element concentrations given, but not for Ca, no element ratios calculated.
Despite the fact that geochemical data have been collected from a large number of species, we restricted our analyses to the genus level (Fig. 1i). This is because we assume that the interspecific variation within the same genus is comparatively small. Moreover, this approach provides larger sample sizes for each taxon. We then inspected and cleaned this dataset according to several criteria (Fig. 1h): In most cases, identifications are given without any detailed justifications or images. Accordingly, it seems possible that the original authors included isolated cases of misidentifications. To mitigate this problem, we excluded specimens where the authors only tentatively assigned the specimens to a certain genus (but retained them when only the species level was uncertain). Large interspecific variation within genera could potentially cause biased average element ratios in these genera. However, there is currently no large belemnite phylogeny available that goes down to the species level and could be used as a basis for comparative phylogenetic studies. In any case, for many of the species reported in the literature, only a few data points are available, so results derived from a species-level analysis would be fraught with uncertainty. Because these species-level identifications are commonly ambiguous and the number of species per genus is variable, we did not apply any weighting in calculating genus-level summary statistics. To ensure basic statistical robustness, we only included taxa with more than five measurements in the dataset. To assess the significance of basin and intra-basin effects, we compared data from the same section, where several different genera were reported. Lastly, we also compared data from genera that were reported from multiple localities.
2.2 Morphology-based phylogeny
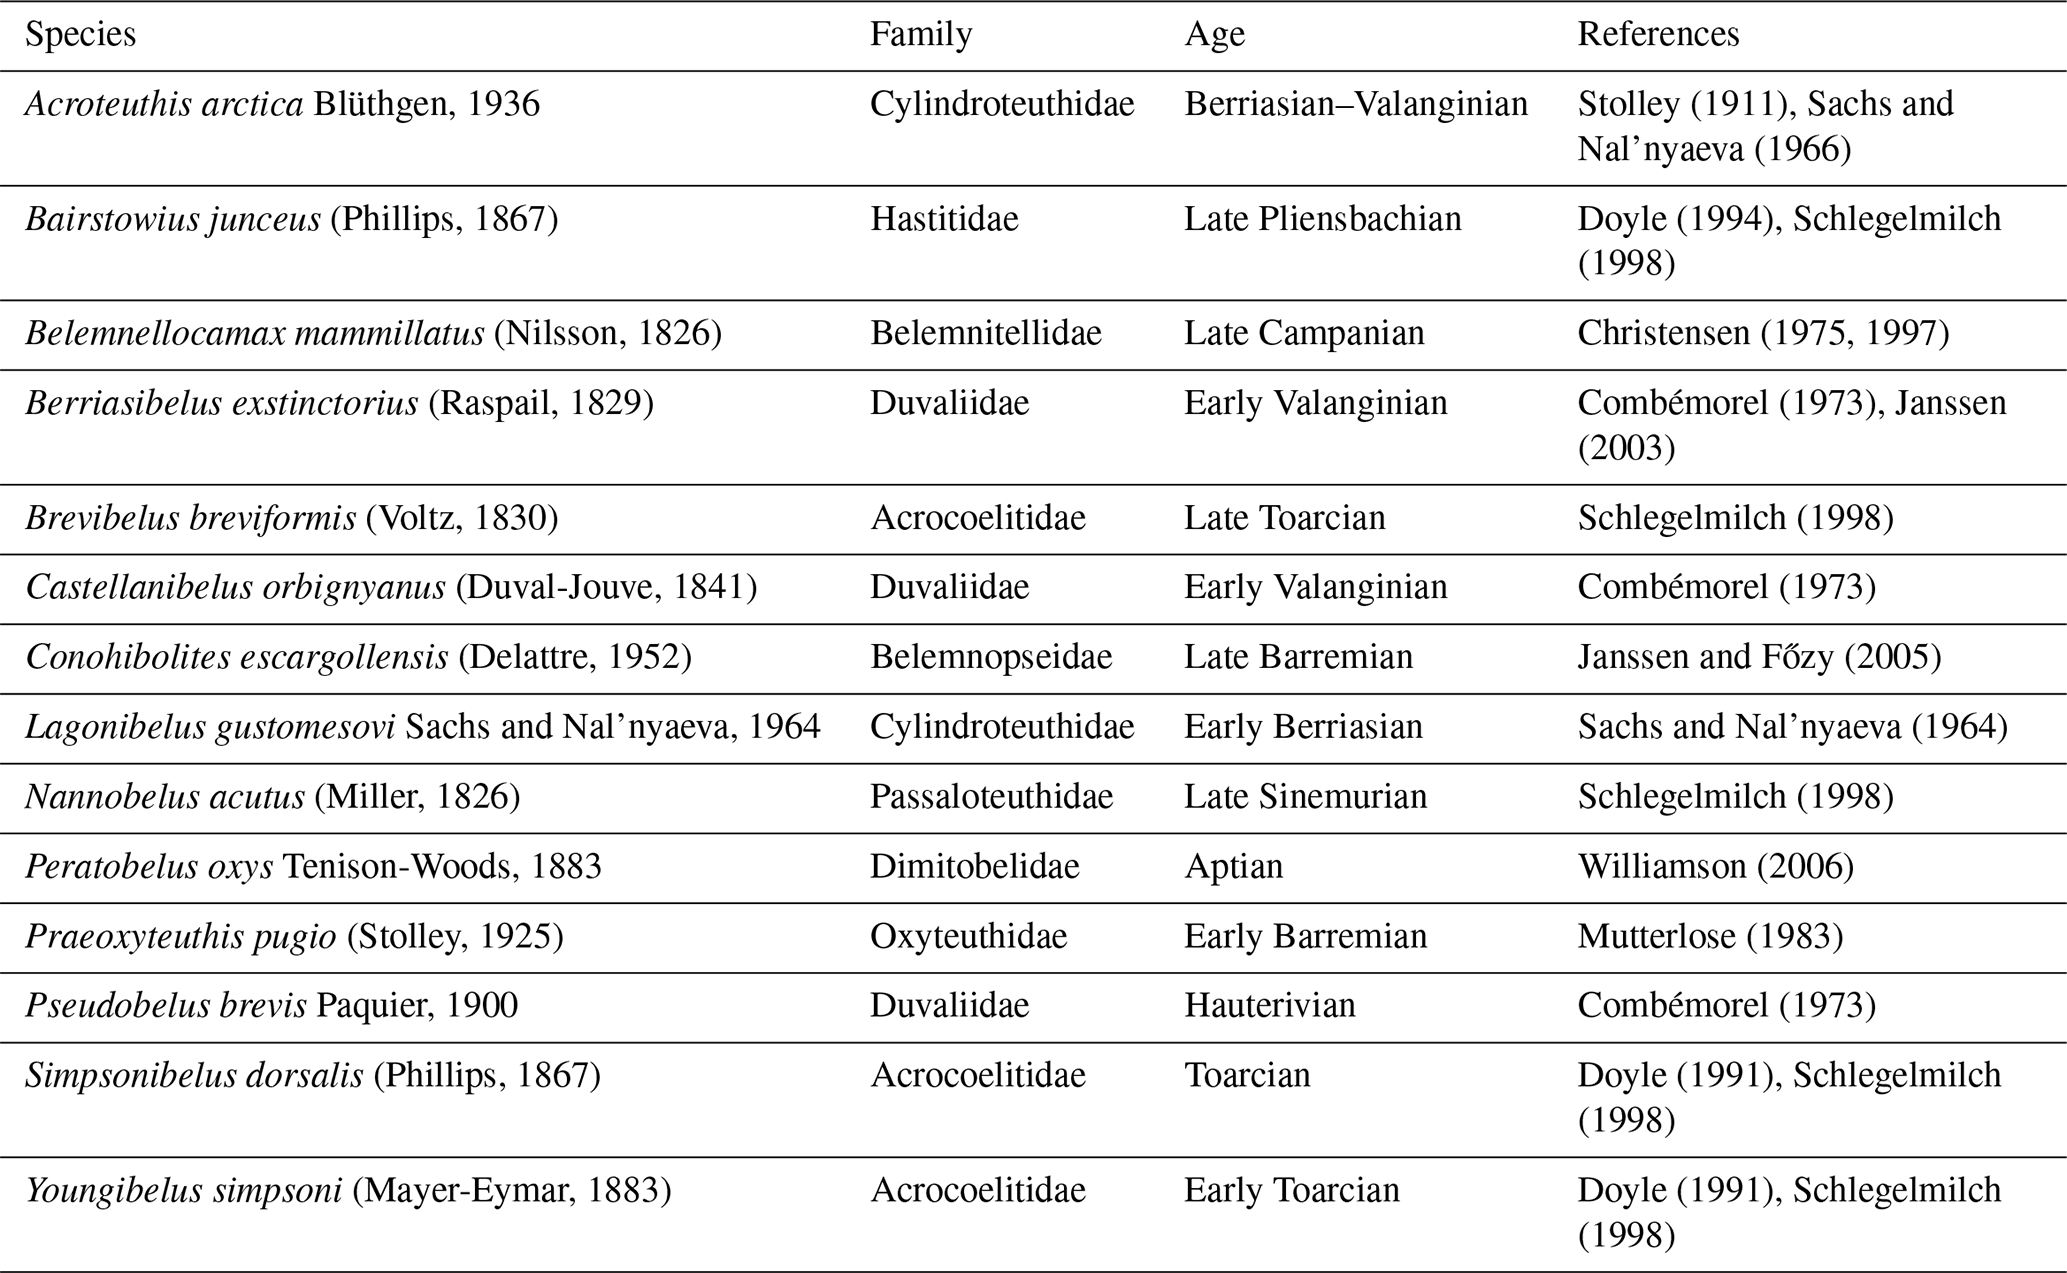
We used the morphological character matrix from Stevens et al. (2023) as a basis for our analyses (Fig. 1a). Several genera for which element ratios are available are missing from that phylogeny. Consequently, we updated the character matrix and ran a new analysis to include the missing taxa. The additional taxa and the corresponding references are listed in Table 3. We removed aulacoceratids (Atractites, Aulacoceras and Palaeobelemnopsis) and sinobelemnitids (Sinobelemnites and Tohokubelus) from the analysis because geochemical data have not been reported for any of these taxa. Aulacoceratids also have a primary aragonitic rather than calcitic rostrum (Dauphin and Cuif, 1980). Both groups are considered to be ancestral to other belemnitids: aulacoceratids are likely stem coleoids (Mariotti et al., 2021; Hoffmann et al., 2022; Stevens et al., 2023), while sinobelemnitids are probably paraphyletic and basal to other belemnitids (Iba et al., 2012; Niko and Ehiro, 2022; Stevens et al., 2023). In the original character matrix, Neohibolites minimus was scored as “absent” for the primary character “ventral alveolar furrow(s)” but included secondarily dependent characters that were not scored as “inapplicable”. This (unintentional) character scoring represents a logically impossible character state combination (see Sereno, 2007) and was therefore corrected. Accordingly, we changed the primary character to “present”. Otherwise, we left the character coding and scoring unchanged, apart from the addition of new species and the removal of phylogenetically uninformative characters (i.e. characters that were only relevant for sinobelemnitids and aulacoceratids).
The morphological character matrix was analysed with Bayesian phylogenetic inference using the software RevBayes 1.2.1 (Höhna et al., 2016). The following parameter settings were therefore relevant in a first step of the study to recover trees without involving geochemical data (Fig. 1b) and roughly follow what was used in Stevens et al. (2023). We supply brief explanations for each model component but refer the reader to the literature for further methodological background (e.g. Wright, 2019; Wright et al., 2022). We applied the fossilized birth–death (FBD) model (Stadler, 2010; Gavryushkina et al., 2014; Heath et al., 2014) with exponential priors on extinction and speciation rate with λ = 10, respectively, the same for the fossil recovery rate. Extinction and speciation rates here model the underlying diversification process, while the fossil recovery rate represents sampling in the FBD model. Another exponential prior with λ = 0.1 and an offset of 201.4 was put on origin time (i.e. the time where the diversification process started in Ma), corresponding to the appearance of the oldest belemnite in our sample and the oldest known non-sinobelemnitid belemnite in general, Schwegleria feifeli (Schlegelmilch, 1998, Hettangian). Priors represent the distributions from which model parameters are drawn. The exclusively binary morphological characters were modelled using the Mkv model (Lewis, 2001), which represents a simple model of morphological evolution where the transition rates between character states (e.g. loss or gain of a structure) are assumed to be equal. As not all characters are expected to evolve at the same rate, we used a discretized gamma distribution with four rate categories to model rate heterogeneity across characters. A lognormal morphological clock was then applied to account for variable rates across branches, i.e. the morphological rates also vary between different lineages. Finally, to account for uncertainties in the stratigraphic ages of the taxa, we applied operators for variable tip dates (Barido-Sottani et al., 2019, 2020). This provides minimum and maximum age constraints for each taxon in the analysis. Importantly, because sampling is modelled as a single event for each taxon, a different age (complying with these constraints) of the taxon was drawn for each iteration of the algorithm. With all of these settings, we ran four independent replicates with 100 000 generations, each using a random move schedule, sampling every 10 generations and discarding 25 % of the samples as burn-in. Convergence was assessed using Tracer 1.7.2 (Rambaut et al., 2018) by visual inspection and checking that all parameters reached effective sampling sizes above 200.
Stolley (1911)Sachs and Nal'nyaeva (1966)Doyle (1994)Schlegelmilch (1998)Christensen (1975, 1997)Combémorel (1973)Janssen (2003)Schlegelmilch (1998)Combémorel (1973)Janssen and Főzy (2005)Sachs and Nal'nyaeva (1964)Schlegelmilch (1998)Williamson (2006)Mutterlose (1983)Combémorel (1973)Doyle (1991)Schlegelmilch (1998)Doyle (1991)Schlegelmilch (1998)Table 3List of additional species for the updated phylogeny, with references used to collect morphological data.
The result of a Bayesian phylogenetic analysis is a large sample of trees, which is non-trivial to summarize (e.g. Heled and Bouckaert, 2013; O'Reilly and Donoghue, 2018; Berling et al., 2025). Ancestral state estimation aims to reconstruct the evolutionary changes of a trait along a given tree. This is typically performed on a single fixed tree, which may not be a good representative of the tree sample. On the other hand, performing ancestral state reconstruction on a larger sample of trees is challenging to interpret, as a summary tree with mapped character changes can include reconstructions from very different topologies. For these reasons, we opted for a middle ground between these approaches, using different trees from the posterior sample that are representative of (i) the entire sample, (ii) identified clusters of the multidimensional tree space, and (iii) the extremes of the sampled tree space. To select these trees, we used the package treespace 1.1.4.2 (Jombart et al., 2017) in R 4.3.0 (R Core Team, 2018). For computational reasons, we selected a random sample of 1000 trees from the posterior trees (Fig. 1c). Pairwise distances were calculated for these trees using the quartet distance metric in the package Quartet 1.2.6 (Smith, 2019), which overcomes some of the limitations of several other tree metrics (Smith, 2020, 2022). Examples include the Kendall–Colijn metric (Kendall and Colijn, 2016) and the Robinson–Foulds distance (Robinson and Foulds, 1979, 1981), which are implemented as a standard in treespace (Jombart et al., 2017). Analogous to functions in treespace, the resulting distance matrix was first transformed into a Euclidean distance matrix using the package ade4 1.7.22 (Dray and Dufour, 2007).
We then performed metric multidimensional scaling (= principal coordinate analysis) on this distance matrix (Fig. 1d), as implemented in treespace and identified clusters of trees (denoted as A, B, C) using Ward's method (Ward, 1963). To compare the distribution of clade supports among these clusters, we used the package ape 5.7.1 (Paradis and Schliep, 2019). We calculated the proportion of trees that contained an identical clade (i.e. the posterior probability of the clade, PP) for every clade in every tree and the average value for each tree. We additionally calculated partial posterior probabilities of clades, where we only considered trees that belong to the same cluster as identified above. These partial posterior probabilities are then compared to the total posterior probability of the clade to gain insights into what degree the tree clusters supported certain topologies. Posterior clade probabilities of the total posterior tree sample are abbreviated as PPtot, and partial posterior probabilities of the corresponding clusters are PPA, PPB, and PPC, respectively.
After exploring the tree landscape as described above, we selected eight trees as representatives for our subsequent analyses of ancestral state reconstruction and phenotypic evolutionary rates (Fig. 1e):
-
The median tree of the entire tree sample (see Jombart et al., 2017).
-
The maximum clade credibility (MCC) tree of cluster A.
-
The MCC tree of cluster B. This tree coincides with the MCC tree from the entire tree sample.
-
The MCC tree of cluster C.
-
The tree with the smallest value for principal coordinate axis 1.
-
The tree with the highest value for principal coordinate axis 1.
-
The tree with the smallest value for principal coordinate axis 2.
-
The tree with the highest value for principal coordinate axis 2.
Branch lengths were not rescaled but kept at the values of the original trees, i.e. the timing of branching events (nodes) in these trees are not averaged over all trees. Instead, each tree represents a single sample from the posterior.
2.3 Ancestral states and phenotypic evolutionary rates
and ratios did not yield reliable data, as the values were commonly below the detection limits (the detection limit varied depending on the study cited); therefore, we only used and ratios for the analysis of ancestral states and phenotypic evolutionary rates (Fig. 1j–l). As input for each taxon, we used the median of the element ratio within the genus. Taxa that did not have any data for the corresponding element ratios were removed prior to the analyses (e.g. Megateuthis for both element ratios or Holcobelus for ). Consequently, the analyses for and ratios were based on a tree with 25 and 24 taxa, respectively.
We reconstructed ancestral states (Fig. 1k) using the fastAnc function in the R package phytools 2.1.1 (Revell, 2024). For visualization, we also plotted a phenogram using the same package. The latter plots the continuous trait values of all taxa on the y axis, and time on the x axis. The taxa are then connected by their phylogenetic relationships, as indicated in the corresponding tree. For the sake of brevity, we only used the overall MCC tree as input for this analysis.
The estimation of phenotypic evolutionary rates was performed in RevBayes 1.2.1 (Höhna et al., 2016), with one analysis fixing each of the eight trees mentioned in the previous section (Fig. 1l). To all combinations of the trees and the two element ratios, we applied a simple evolutionary model of Brownian motion (Felsenstein, 1985), with the rate σ2 as the only parameter (Fig. 1j). Thus, for simplicity, the phenotypic evolutionary rate was assumed to be constant throughout the tree. We placed a log-uniform prior between 10 and 100 on σ2 to allow for a wide range of values. For each analysis, we ran two independent replicates using a random move schedule for 50 000 generations after a burn-in of 5000 generations, sampling every 10 generations. As for the tree inference, convergence was checked using Tracer (Rambaut et al., 2018).
Although a step forward from the inference based on a single tree, the above-described eight trees still only reflect point estimates of the tree space. For this reason, we repeated the same procedure for the random subsample of posterior trees from the tree space analysis, resulting in 2000 additional analyses (note that the exemplar trees are contained within the posterior tree sample; 16 analyses were, therefore, technically duplicated). We compared the distribution of σ2 of and in the exemplar trees to its distribution across all trees. We also tested whether different tree clusters implied different phenotypic evolutionary rates. The advantage of having analyses based on a small number of trees alongside the full tree sample is that it allows for a more direct comparison with tree topology while at the same time accounting for uncertainty across tree space.
To test the sensitivity of our models, we applied another test where the primary data (i.e. the median values of and for each taxon) were randomly altered. For the vectors containing the median values of and per taxon, we applied the following R script to retrieve randomly altered values.
n_Mg <- length(Mg_ratio)
n_Sr <- length(Sr_ratio)
abs(Mg_ratio + (sample(c(-1, 1), n_Mg,
replace = TRUE) * rexp(n_Mg, 1)))
abs(Sr_ratio + (sample(c(-1, 1), n_Sr,
replace = TRUE) * rexp(n_Sr, 10)))
This means that a random number was drawn from an exponential distribution and either added or subtracted (with equal probability) from the original value. The rate parameter of the exponential distribution was 1 for the ratio and 10 for the ratio, i.e. with expected mean values of 1 and 0.1, respectively. Thus, the median values for each taxon were altered on average by the latter values, which roughly corresponds to 10 % of the mean of these element ratios (see Table 4). This is intended to model a situation where some of the data may be affected by diagenetic alteration, with most of the data being close to the original data but some data points changed by a larger amount. We repeated this process 100 times for each element and ran the analyses with the same settings as above, fixing the MCC tree of the entire sample. These results were then compared with the results from the analysis of cluster B's MCC tree, which used the unaltered data on the same tree.
3.1 Element Ca ratio data
In total, we compiled element ratio data from 29 published studies (Table 2). Four studies were discarded because they contained only taxa with uncertain generic assignments or genera with less than five measurements in the entire dataset. Five studies could not be used because the authors neither supplied element ratios nor raw Ca concentrations. Without these data, we were unable to calculate element ratios. The total dataset included 2749 individual data points. After excluding the studies mentioned above and data as specified in the methods, our dataset included 2241 data points.
A statistical summary of the element ratios is given in Table 4. For all four element ratios, belemnite genera showed distinct, although partly overlapping distributions (Fig. 2; Table A1). The total ranges of element ratios within each genus were relatively wide, especially where rostra had been sampled ontogenetically (e.g. Ullmann et al., 2013, 2015; Sørensen et al., 2015; Ullmann and Pogge von Strandmann, 2017; Stevens et al., 2017, 2022). The second quartile and third quartile (i.e. the central 50 % of the data) were relatively narrow for and in most genera.
In the case of and , extremely positive outliers were much more common. The mean skewness of the element ratio data per genus amounts to 0.42 for , 0.31 for , 2.39 for , and 3.12 for . A skewness of 0.0 represents a balanced distribution, while negative values indicate left skew and positive values right skew. Higher values indicate an increasingly longer tail of the distribution. The skewness becomes even stronger when considering that many values were excluded because they were below the detection limits. Thus, a large portion of the and ratios were close to zero. These element ratios were not used in the remainder of the analyses because the skew may reduce the representativeness of mean or median values for the genera. In addition, the and ratios were more homogeneous between genera; this induces difficulty when aiming to recognize a phylogenetic pattern.
For and ratios, the variation within genera, as expressed by the standard deviation, was generally lower than the variation between genera, i.e. the range of median values per genus (Fig. S2). Thus, the median ranged between 3.0 and 16.6 for ratios and between 1.0 and 2.7 for ratios, while the standard deviation ranged between 0.8 and 4.5 for ratios and between 0.1 and 0.6 for ratios. A contrasting pattern was observed in and ratios, where the median ranged between 0.01 and 0.40, and between 0.004 and 0.18, respectively, while the corresponding standard deviation was between 0.002 and 10.3, and between 0.002 and 0.9, respectively. This variability implies that taxonomy is a poor predictor for and ratios, and these are most likely mainly controlled by other factors such as diagenesis.
Table 4Statistical summary of element ratios of the entire dataset.
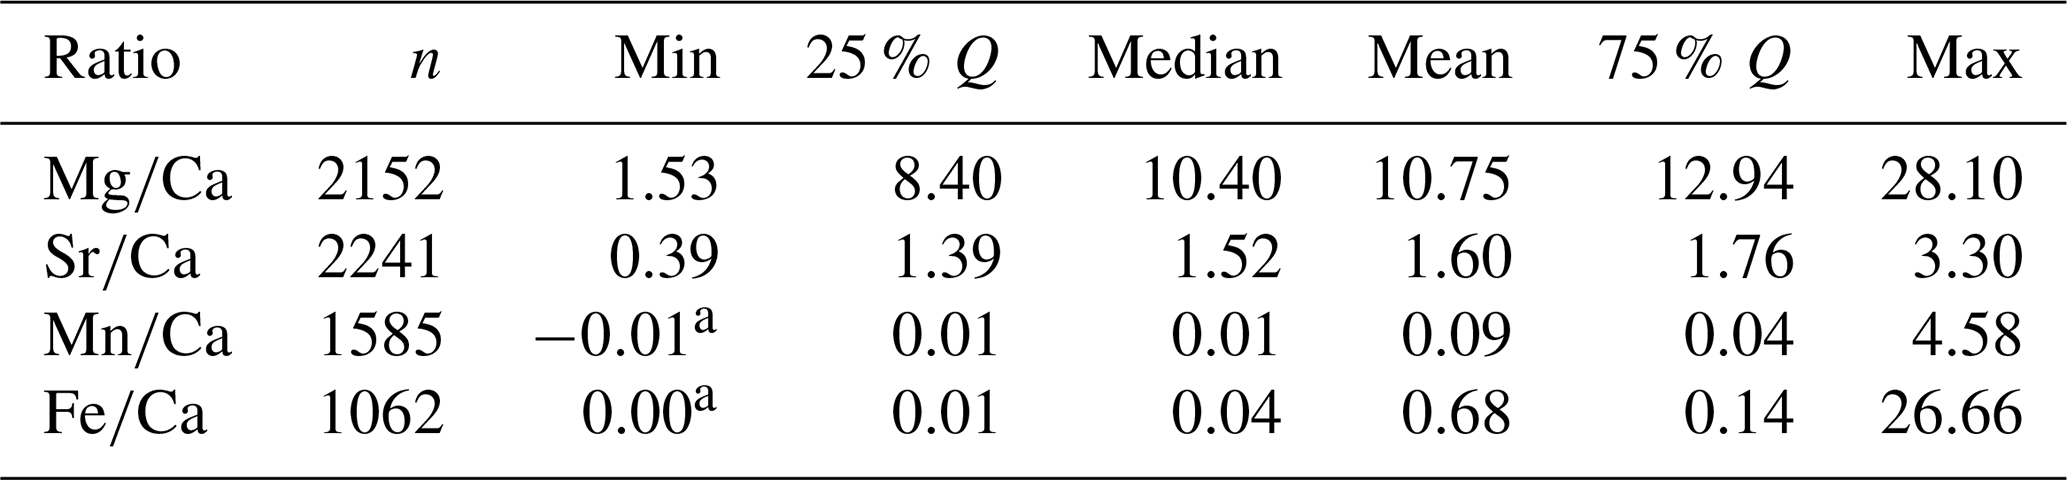
a Ratios are taken directly from the original publications, likely representing values below detection limit, but not referenced as such. These are included in the statistical summary here, though neither ancestral state analyses nor phenotypic evolutionary rate estimations were performed for and .
Distributions of element ratios had strong overlap within species of the same genus (Fig. 3). Specimens in open nomenclature (i.e. only determined to genus level) showed a wider range of ratios than identified species in Hibolithes (Fig. 3a) and Duvalia (Fig. 3b). In the latter case, the average ratios were distinctly lower than in identified species of the genus. The pattern in Passaloteuthis shows a clear bimodal distribution, with Passaloteuthis bisculata, P. elongata, P. cuspidatus and specimens in open nomenclature containing higher ratios than other species (Fig. 3c). Note that Passaloteuthis specimens with lower ratios came from the same study that includes data on the early to late Pliensbachian at the locality Priborzhavske in Ukraine (Arabas et al., 2017). All other data for Passaloteuthis come from two localities in the UK, spanning the Pliensbachian and early Toarcian (Li et al., 2013; Ullmann et al., 2014, 2015; Ullmann and Pogge von Strandmann, 2017). It is thus possible that some of the identifications were incorrect or that there were other factors involved in the anomalous values of the former study. The conversion of Sr and Ca concentrations to ratios is incorrect in Arabas et al. (2017), see Supplement File S1 (Pohle et al., 2024, columns S and T, rows 119–157). Unfortunately, the supplementary material of Arabas et al. (2017) does not provide raw Mg concentrations and thus, it is difficult to test whether the lower ratios in these Passaloteuthis specimens was caused by a calculation error. Nevertheless, as the correct ratios can be calculated by multiplying the published values with = 18.3, it appears that ratios in Arabas et al. (2017), and potentially also values given in Arabas (2016) may also be modified by a corresponding factor of = 2.8. If this is the case, the ratios of Passaloteuthis in Arabas et al. (2017) would fall within the same range of values as other Passaloteuthis species. However, as these specimens make up only a small fraction of the Passaloteuthis specimens in the dataset, we kept the published values in a conservative manner.
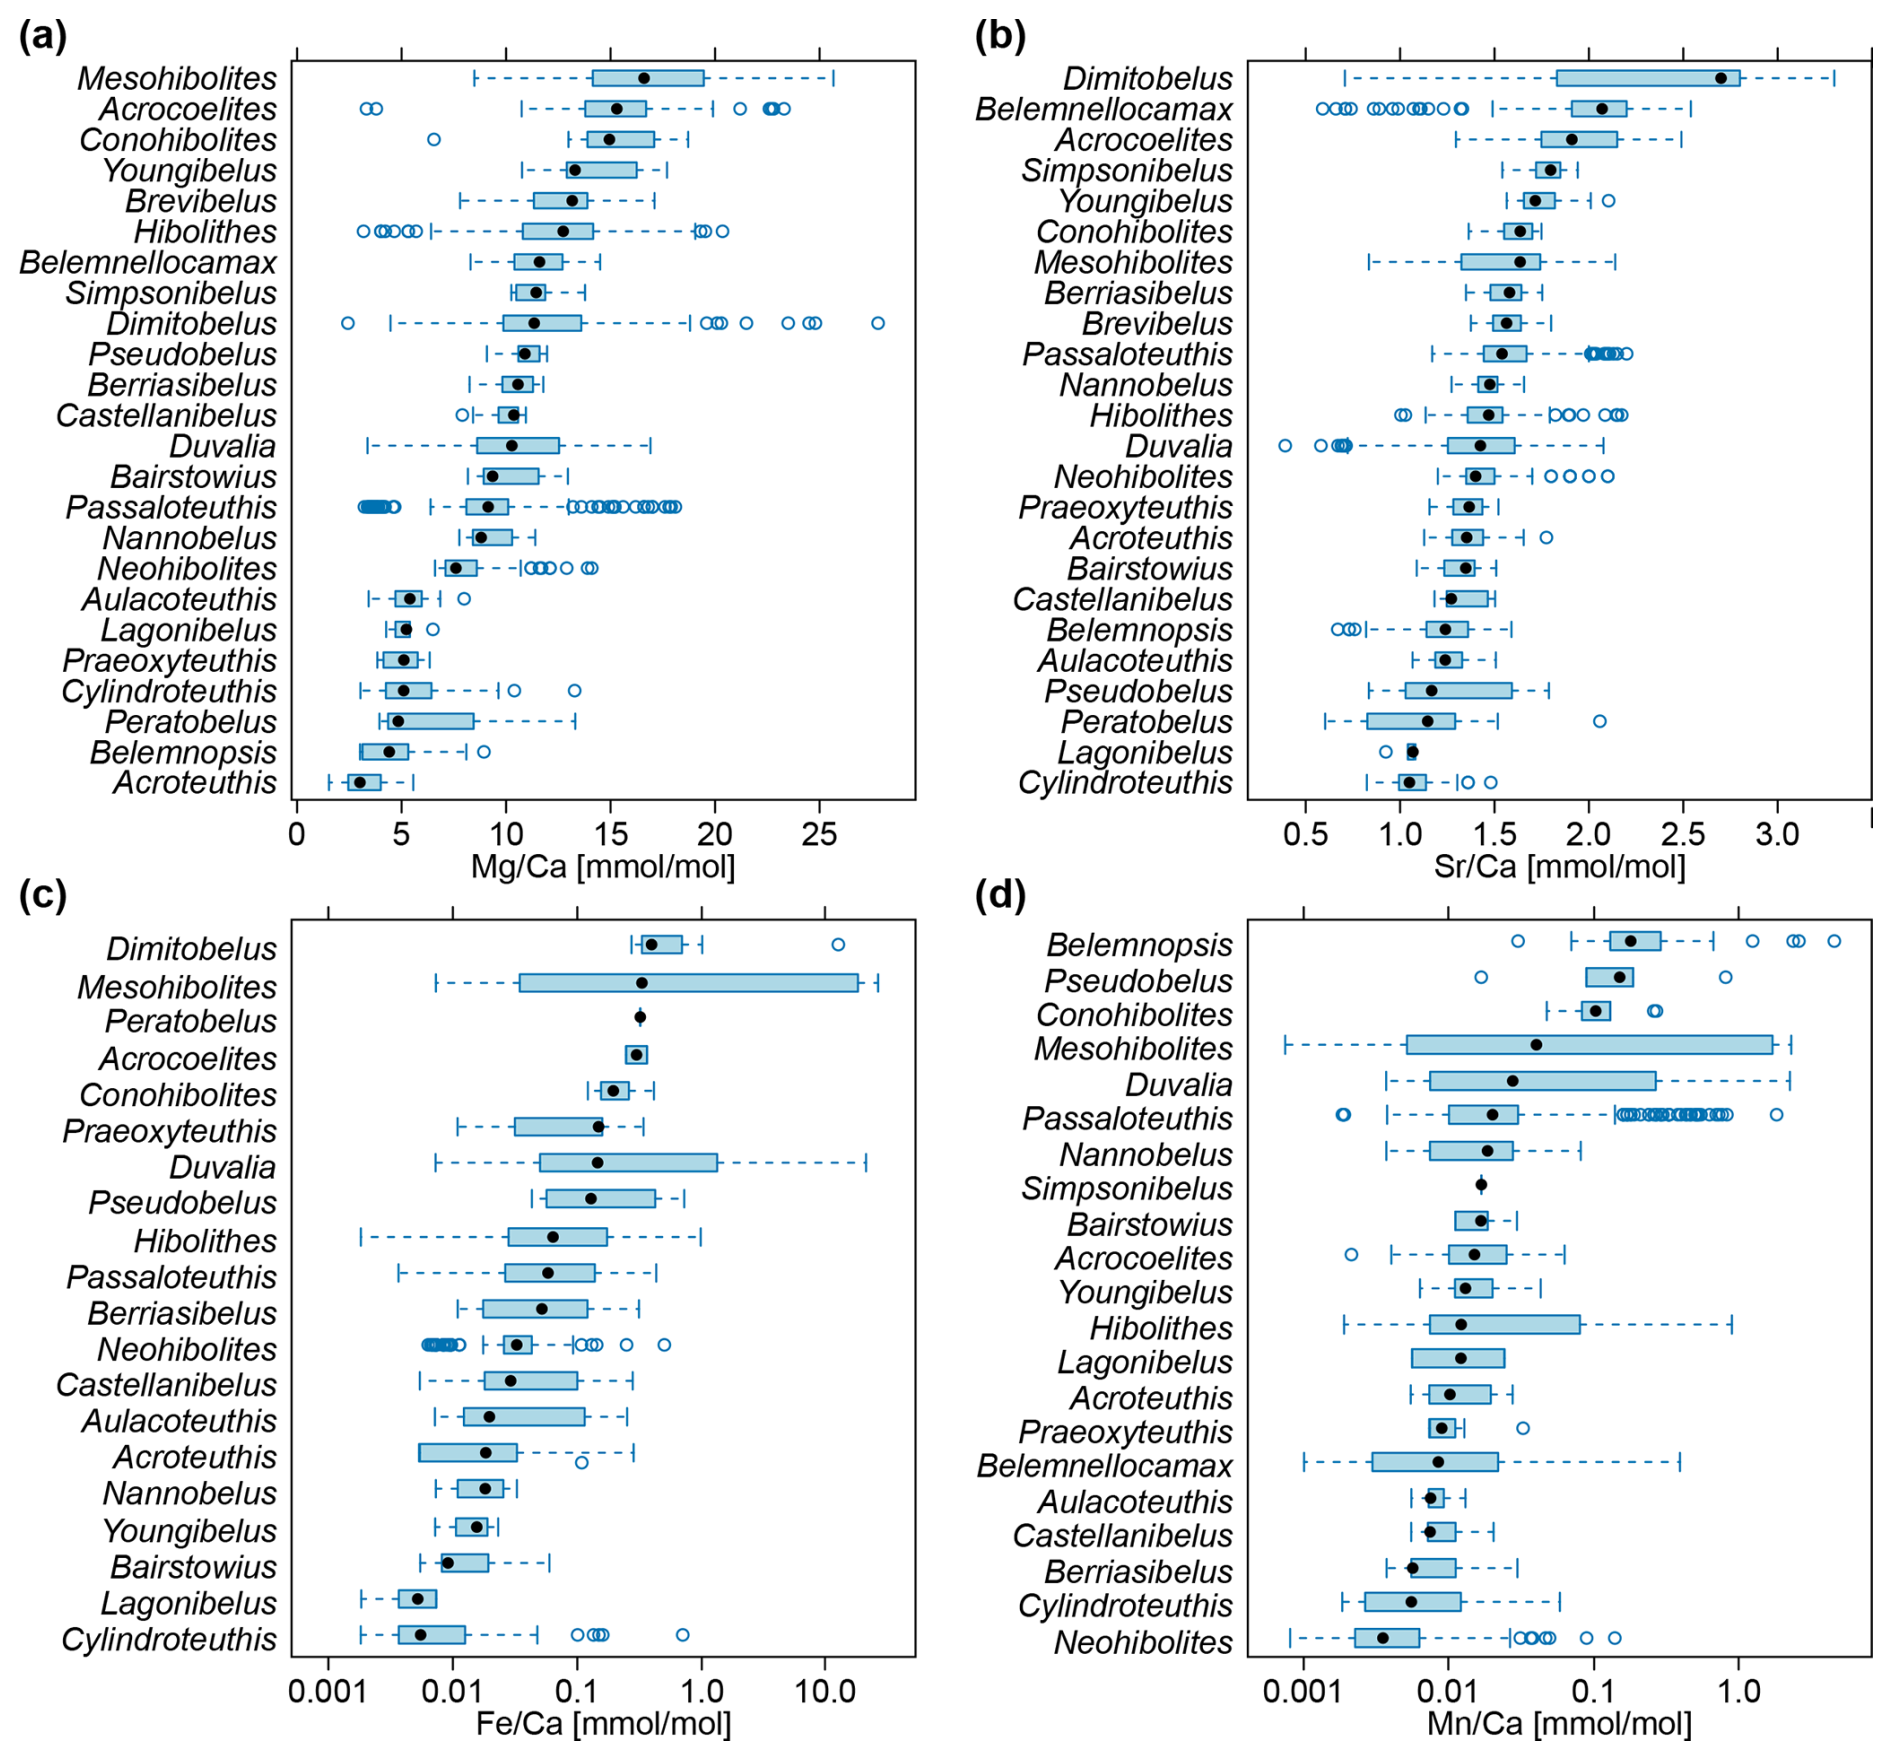
Figure 2Belemnite rostrum element ratio distributions per genus. (a) ratios. (b) ratios. (c) ratios, log scale. (d) ratios, log scale. Data taken from entire literature dataset, see text for references.
The distributions of ratios were taxon-specific within the same locality and congruent between localities (Fig. 4). This pattern was independent of the stratigraphic position. For example, at Dubki (Russian Platform), Hibolithes rostra occur throughout the section but do not overlap in their distribution of ratios with the co-occurring Lagonibelus and Cylindroteuthis (data from Wierzbowski and Rogov, 2011). Conversely, specimens of Hibolithes, Duvalia, and Belemnopsis at Stankowa Skała (Poland) from several stratigraphic positions have almost identical ratios (data from Arabas, 2016).

Figure 3Belemnite rostrum ratios of species within the same genus. (a) Species of Hibolithes, Callovian to Barremian (van de Schootbrugge et al., 2000; McArthur et al., 2004, 2007; Wierzbowski and Joachimski, 2007; Price et al., 2011; Li et al., 2013; Ullmann et al., 2013; Stevens et al., 2014; Arabas, 2016; Alberti et al., 2021b). (b) Species of Duvalia, Oxfordian to Aptian (van de Schootbrugge et al., 2000; McArthur et al., 2007; Price et al., 2011; Li et al., 2013; Arabas, 2016; Stevens et al., 2022). (c) Species of Passaloteuthis, Pliensbachian to Toarcian (Li et al., 2013; Ullmann et al., 2014, 2015; Arabas et al., 2017; Ullmann and Pogge von Strandmann, 2017).
3.2 Morphology-based phylogeny
Overall, our morphological phylogenetic analyses recovered similar topologies to Stevens et al. (2023), although the topological uncertainties were generally high. Multidimensional scaling revealed three clusters of trees, here termed clusters A, B, and C (Fig. 5). The first two clusters make up the largest portion of tree space, with 41 % of the trees falling into cluster A and 49 % into cluster B; the remaining 10 % make up cluster C. The boundaries between the clusters are gradual in all investigated PCo axes. It is notable that cluster C is less dense and occupies an intermediate position between the other clusters in PCo axis 1 (Fig. 5b, c). This implies that clusters A and B have higher posterior densities and represent opposite optimal islands. Transitional topologies are represented by cluster C and are less frequent. In PCo axis 2 (Fig. 5b, d), all three clusters overlap; therefore, this axis does not account for differences between the clusters. PCo axis 3 shows a separation of cluster C from the other two clusters (Fig. 5c, d). The average posterior probabilities across all clades calculated for each tree did not fall outside the interval between 0.1 and 0.4. Trees in clusters A and B have higher average posterior probabilities due to a higher density of similar trees (Fig. 5a).
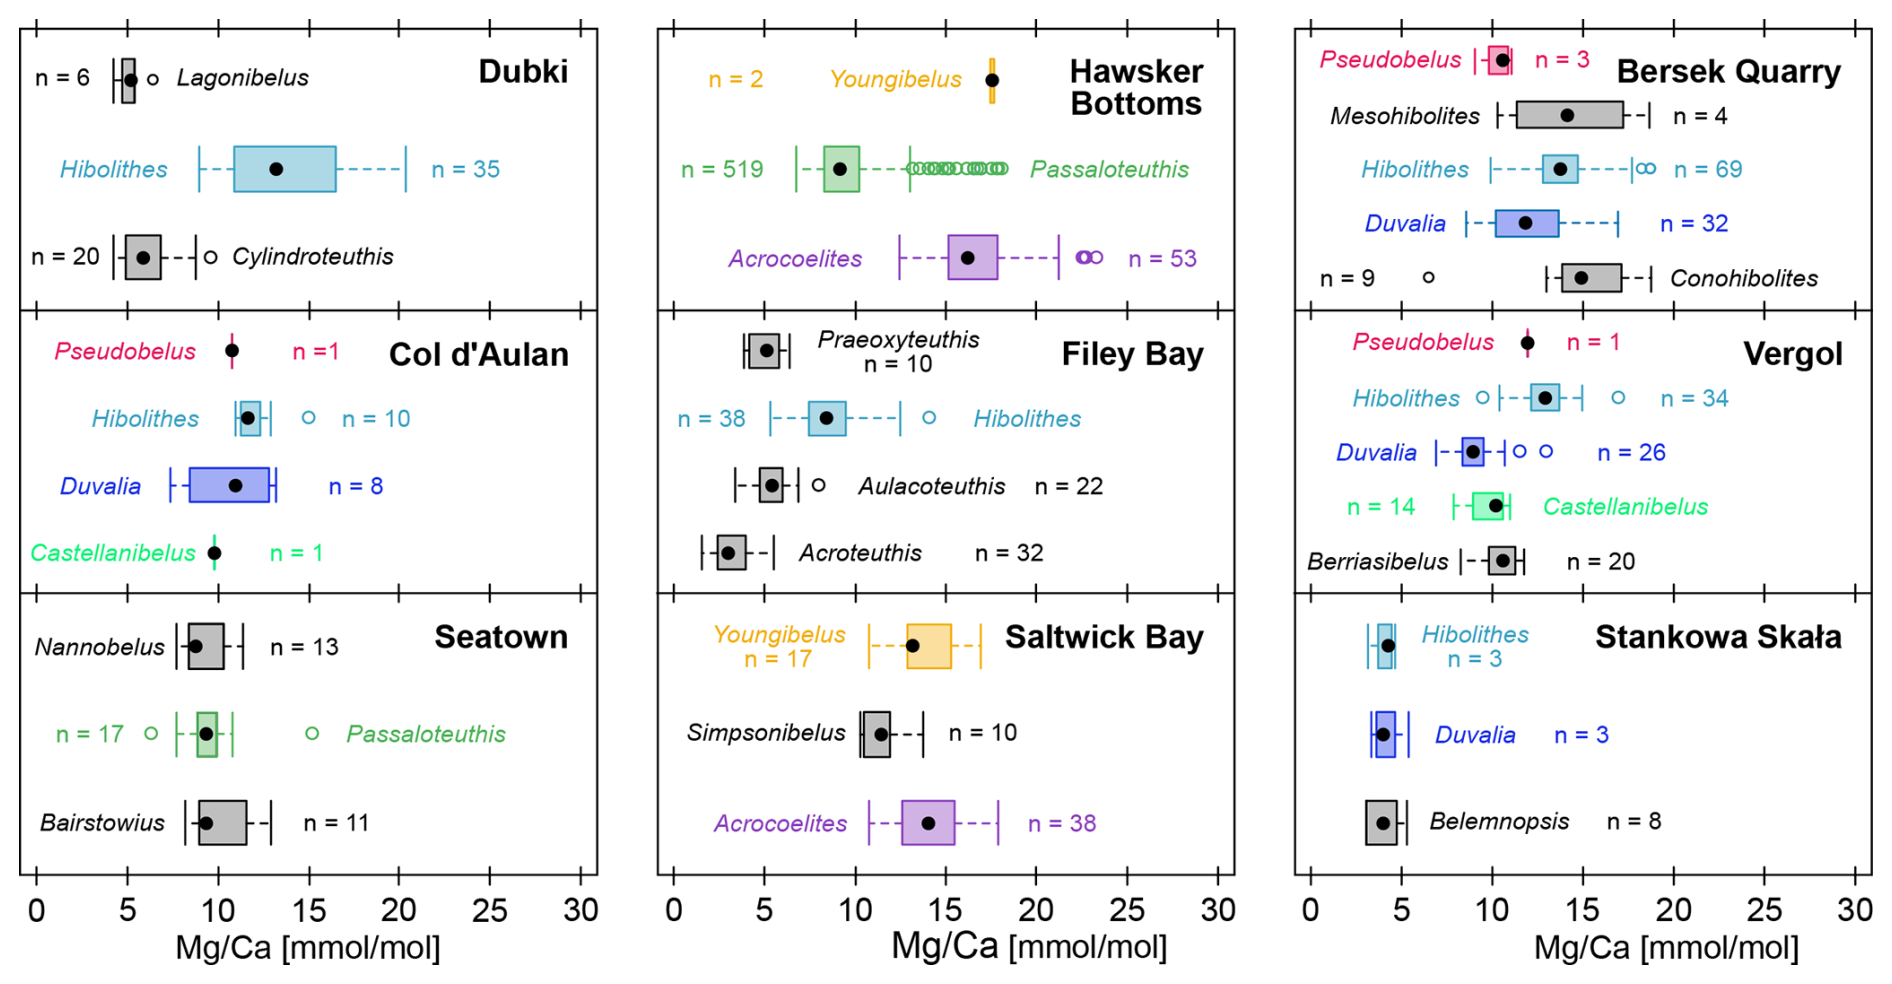
Figure 4 ratios per genus within the same locality. Colours represent unique genera that occur in more than a single locality. Genera in black only occur once in this comparison. Note that we do not account for time averaging here, and individual genera may show non-overlapping stratigraphic ranges. Localities: Dubki, Russian Platform, late Callovian to early Oxfordian (Wierzbowski and Rogov, 2011); Col d'Aulan, Southeastern France, early to late Valanginian (McArthur et al., 2007); Seatown, Southern England, Pliensbachian (Li et al., 2013); Hawsker Bottoms, Northern England, Early Toarcian (Ullmann et al., 2014, 2015; Ullmann and Pogge von Strandmann, 2017); Filey Bay, Northern England, Valanginian to Barremian (McArthur et al., 2004); Saltwick Bay, Northern England, Early Toarcian (Li et al., 2012; Ullmann et al., 2014); Bersek Quarry, Northern Hungary, late Valanginian to Barremian (Price et al., 2011); Vergol, Southeastern France, early to late Valanginian (McArthur et al., 2007; Li et al., 2013). Stankowa Skała, Southern Poland, late Oxfordian to early Kimmeridgian (Arabas, 2016).
The selected exemplar trees provide an overview of the topological variation between tree clusters (Fig. 6). For ease of comparison, we designated four monophyletic clades in the general MCC tree (which is equivalent to the MCC tree from cluster B; Fig. 6b):
-
Pseudoalveolata (see definition in Stevens et al., 2023), PPtot = 0.64.
-
Belemnitina, including Megateuthidae and Passaloteuthidae, PPtot = 0.06.
-
A clade here referred to as DuvPO, comprising Duvaliidae, Praeoxyteuthis and Oxyteuthis, PPtot = 0.44.
-
A clade here referred to as CylABY, encompassing Cylindroteuthidae, Aulacoteuthis, Bairstowius and Youngibelus, PPtot = 0.16.
Note that except for the Pseudoalveolata, we do not consider any of these clades as definite taxonomic units due to the high uncertainties. Rather, we use them to facilitate comparison with alternative topological configurations across tree space. The posterior support for the Pseudoalveolata was variable between tree clusters (PPA = 0.83; PPB = 0.53; PPC = 0.37; PPtot = 0.64). This is partly caused by the uncertainty in the position of the DuvPO clade, which was occasionally recovered as forming part of the Pseudoalveolata (PPtot = 0.16). Alternative positions of DuvPO included a sister group relationship with some of the Cylindroteuthidae (PPtot = 0.18), which was more prevalent in tree cluster A, resulting in PPA = 0.43 for the same clade (Fig. 6a).
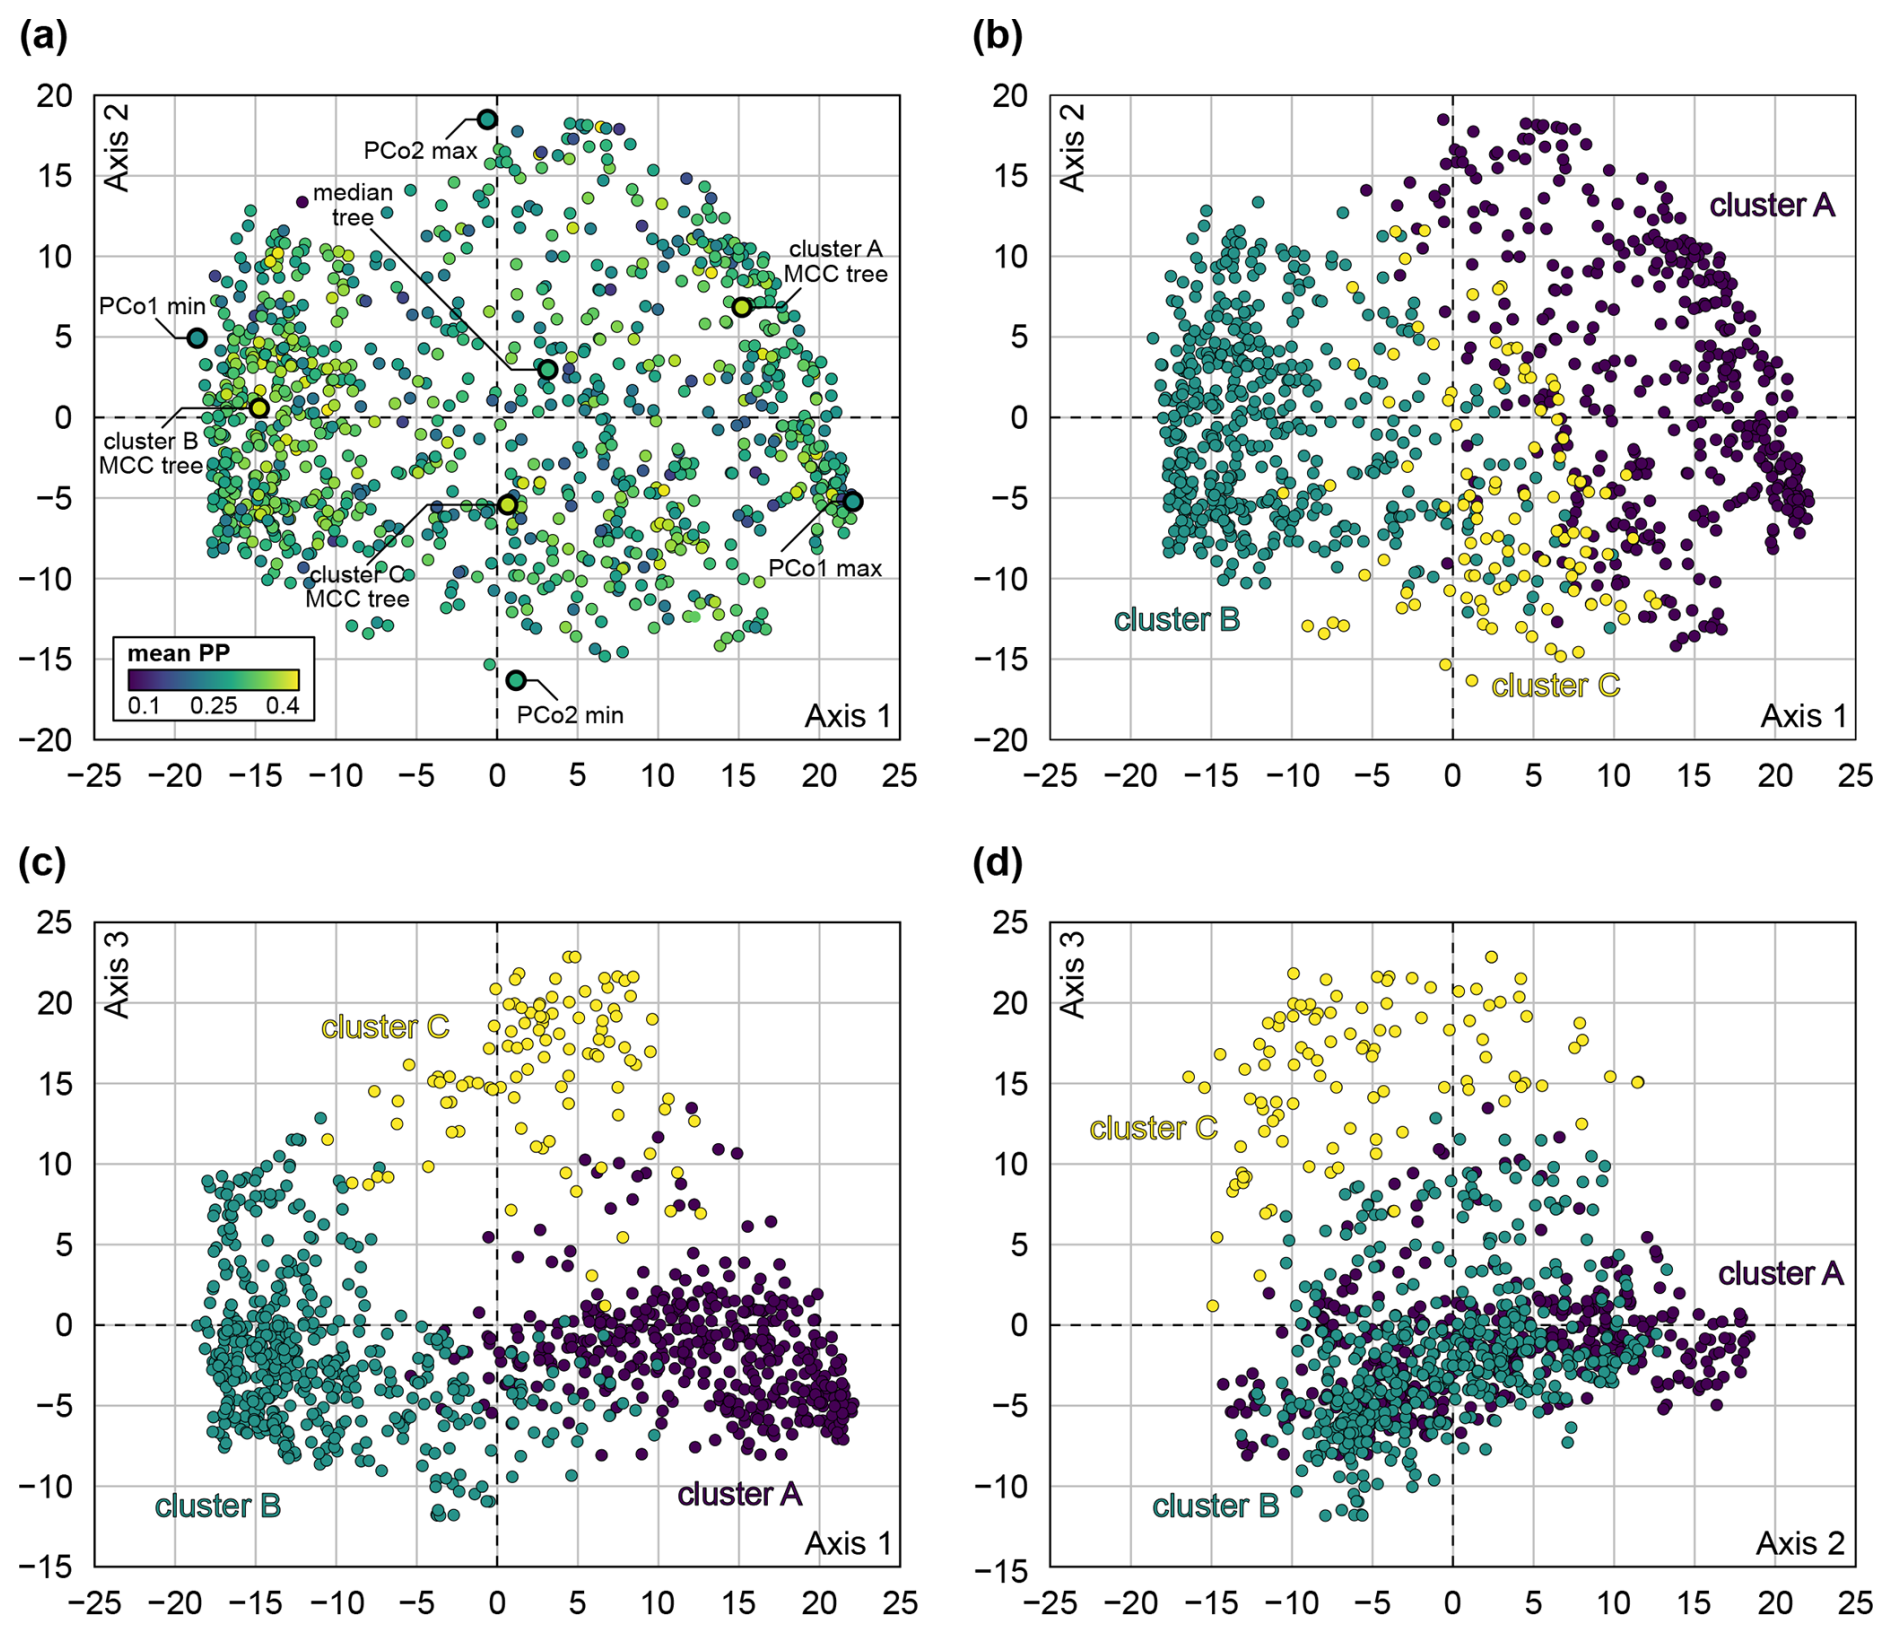
Figure 5Principal coordinate analysis (PCo, multidimensional scaling) of tree space of subsample of 1000 trees, based on quartet distance. (a) PCo axes 1 and 2, coloured by mean posterior probability of corresponding tree, with position of exemplar trees highlighted. (b) PCo axes 1 and 2, coloured by tree cluster. (c) PCo axes 1 and 3, coloured by tree cluster. (d) PCo axes 2 and 3, coloured by tree cluster.
Likewise, in cluster A, CylABY was paraphyletic, but a monophyletic clade uniting the Cylindroteuthidae and DuvPO received higher support than in the total tree sample (PPA = 0.48; PPtot = 0.19). DuvPO was paraphyletic in tree cluster C (Fig. 6c), with Praeoxyteuthis and Oxyteuthis forming a monophyletic clade together with the Pseudoalveolata (PPC = 0.70; PPtot = 0.10). Therefore, the two genera occupied a more nested position within the Pseudoalveolata rather than being its sister group (i.e. monophyletic Pseudoalveolata: PPC = 0.37) in about half of the trees in cluster C. Concurrently, the Duvaliidae received considerably higher support in cluster C than in the total tree sample (PPC = 0.80; PPtot = 0.44). The support values in tree cluster C thus differ strongly from the total posterior tree sample. However, cluster C accounts only for a small proportion of the trees; thus, deviations in clade probabilities are to be expected. In comparison with tree clusters A and B, the MCC tree of cluster C contains several clades which are not supported by the total tree sample. These clades had posterior probabilities below 0.01, which means that out of 1000 trees, less than 10 trees shared an identical clade. The Cylindroteuthidae were more frequently monophyletic in tree cluster B (PPB = 0.78; PPtot = 0.57), which also applied to the CylABY, although with higher uncertainty (PPB = 0.23; PPtot = 0.16).
As the median tree was part of cluster C, its topological configurations resembled the MCC tree of cluster C (Fig. 6d). The clades in the median tree had even lower posterior probabilities, with 10 out of 35 nodes having posterior probabilities of 0.01 or below. As a comparison, the MCC tree from cluster C contained three nodes with PPtot ≤ 0.01, while the MCC trees from clusters A and B contained none. This suggests that the median tree is a very poor point estimate of the general tree topology despite its central position within the tree space.
The trees representing the limits of tree space (Fig. 6e–h) had a generally similar arrangement of the clades as the MCC trees of their respective clusters. However, the number of barely supported clades was higher (between 5 and 9 nodes with PPtot ≤ 0.01). Accordingly, the maximum trees of the PCo1 and PCo2 axes, as part of cluster A, contained a monophyletic clade containing a paraphyletic DuvPO and part of the CylABY. This clade was more closely related to the Belemnitina in the PCo1 maximum tree with negligible support (PPtot = 0.01). In the PCo2 maximum tree, this mixed DuvPO-CylABY clade formed a monophyletic group together with Belemnopsis as the sister group to the Pseudoalveolata (PPtot = 0.01). Note that the latter tree recovered Cylindroteuthis itself elsewhere. As part of cluster B, the minimum tree of the PCo1 axis recovered a monophylum uniting DuvPO and Pseudoalveolata. In contrast to the MCC tree, DuvPO was paraphyletic and not the sister group of the (polyphyletic) Pseudoalveolata. Lastly, in the minimum tree of the PCo2 axis, DuvPO and CylABY were polyphyletic. Meanwhile, Belemnitina and Pseudoalveolata were paraphyletic in the same tree.
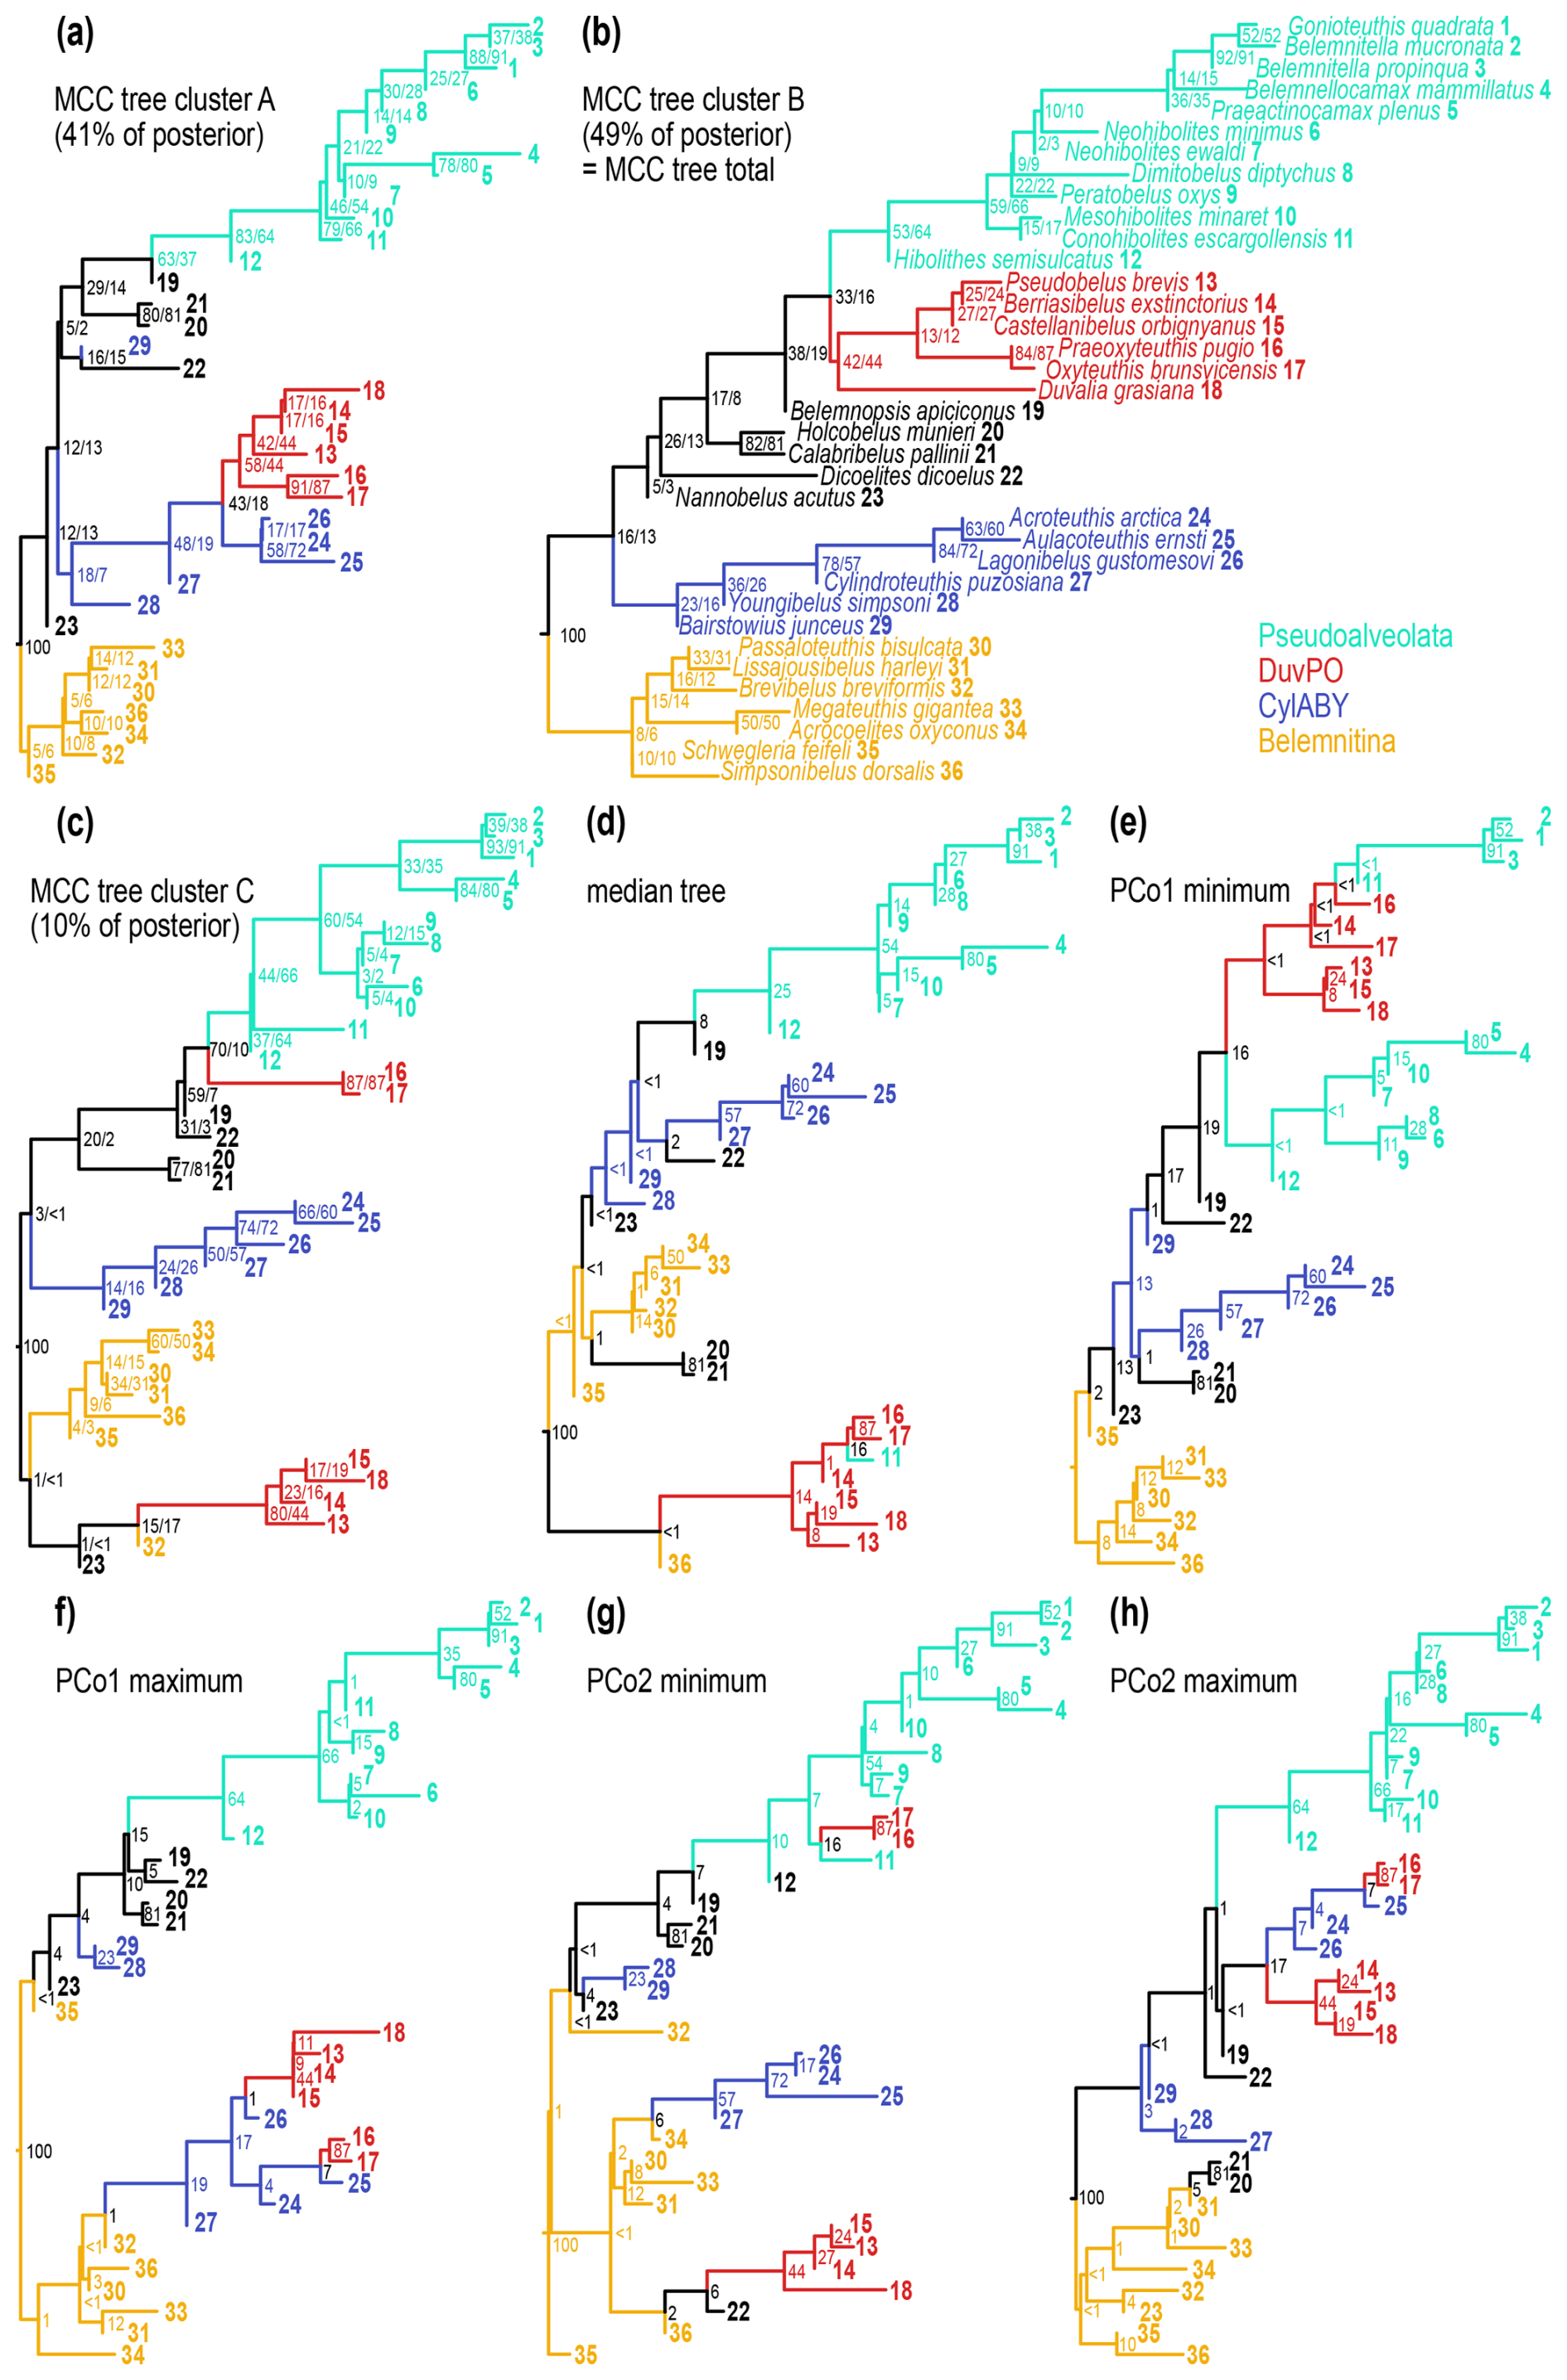
Figure 6Sampled trees from the tip-dated analyses. Values at nodes represent proportion of trees that recover the same clade as monophyletic, i.e. the posterior probability of the clade. Where two values are given, the first value represents the proportion of agreeing clades within the same cluster, while the second value refers to the entire dataset. (a–c) Maximum clade credibility (MCC) trees for each of the three tree clusters in the posterior (see Fig. 5). Note that the MCC tree of cluster B is identical to the MCC tree of the entire dataset. Percentages refer to the proportion of trees within the same cluster. (d) Median tree, calculated from the entire dataset. This tree represents an average estimate of the phylogeny within tree space. (e–h) Extreme topological limits of the first two axes tree space (see Fig. 5). These trees represent opposite outliers of the posterior sample, showing the range of expected topological configurations.
In summary, the topology of the two main clusters differs mainly in the position of DuvPO. This clade is more closely related to the Cylindroteuthidae in cluster A but more closely related to the Pseudoalveolata in cluster B. Differences in posterior probabilities are partially caused by different branching positions of DuvPO, breaking up the monophyly of other clades. The minor cluster C splits DuvPO into two clades: one is related to the Pseudoalveolata while the position of the other clade is volatile. Outlier trees contain a relatively high number of aberrant clades that are only present in a tiny fraction of the trees.
3.3 Ancestral states and phenotypic evolutionary rates
When plotting element ratios as a phenogram on the MCC tree, it becomes obvious that these data are inconsistently distributed across the tree (Fig. 7). For , there appear to be two distinct groups: (i) one group with consistently low ratios, i.e. between 3.0 mmol mol−1 (Acroteuthis) and 5.3 mmol mol−1 (Aulacoteuthis) and (ii) one with Mg elemental concentrations being higher, between 7.6 mmol mol−1 (Neohibolites) and 16.6 mmol mol−1 (Mesohibolites) (Fig. 7a). This pattern is not only restricted to the average values per genus. Comparing the distributions of each genus reveals the same gap with relatively little overlap between the two groups, although outliers exist in both directions (Fig. 2a).
In the phenogram, ratios contain rapid changes between neighbouring nodes, e.g. between Cylindroteuthis and its sampled ancestor, Youngibelus. On this branch, ratios decrease from 13.3 to 5.1 mmol mol−1 within approximately 15 Myr (Fig. 7a). The two groups only weakly reflect phylogeny, as the transition from high to low Mg happened at least five times independently. Meanwhile, only a single reversal occurs at the base of the clade comprising Pseudoalveolata and DuvPO. However, note that this observation is based only on the MCC tree and does not account for topological uncertainty.
Conversely, does not show distinct groups but also shows generally smaller changes between neighbouring tips (Fig. 7b). Most are confined to an interval between 1.0 and 2.0 mmol mol−1. A few outliers deviate from this pattern with elevated ratios compared to their nearest relatives, such as Dimitobelus (2.70 mmol mol−1) and Belemnellocamax (2.07). A drop from 1.72 to 1.05 mmol mol−1 in ratio was found from the sampled ancestor Youngibelus and its descendant Cylindroteuthis.
Ancestral state reconstructions draw a similar picture (Fig. 8). ratios of 10.1 mmol mol−1 are reconstructed at the root (SD = 2.9 mmol mol−1). The mean ratio of all internal nodes was 9.2 and 9.6 mmol mol−1 when excluding sampled ancestors (SD = 1.9 mmol mol−1). The two groups of lower and higher Mg concentrations are visible as well, although except for the node including Holcobelus and its sister group, all internal nodes fall into the lower part of the high Mg group, i.e. between 8 and 12 mmol mol−1 (Fig. 8c). There are two transitions to low ratios (<6.0 mmol mol−1) at the base of larger clades. These are found in the clade comprising the sister group of Youngibelus (Cylindroteuthidae) and the sister group of Nannobelus. In the latter case, this is followed by a reversal to ratios of 8.4 mmol mol−1 (SD = 1.8 mmol mol−1) in the sister group of Belemnopsis (Pseudoalveolata and DuvPO). The other two transitions to low ratios were restricted to Praeoxyteuthis (5.1 mmol mol−1) and Peratobelus (4.8 mmol mol−1), respectively.
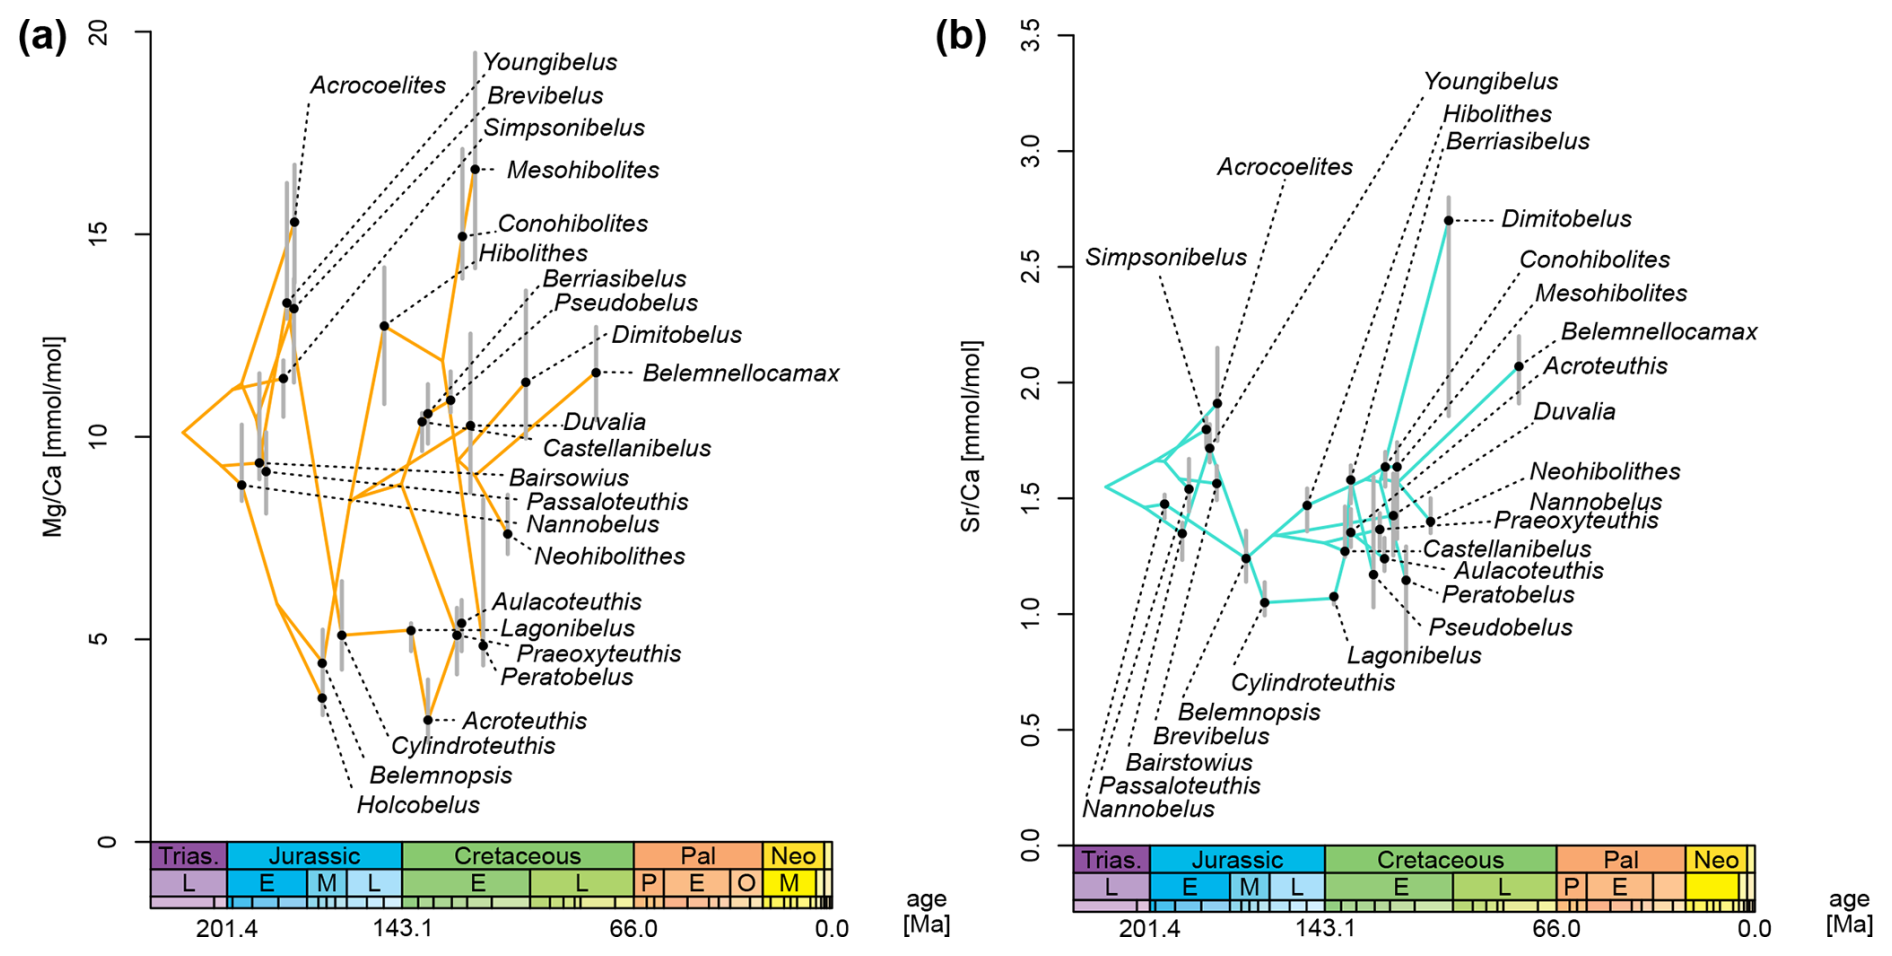
Figure 7Phenogram of element ratios, plotted to MCC tree. Grey bars represent 75 % quantiles of the data (cf. boxes in Fig. 2). Chronostratigraphy after Gradstein and Ogg (2020). (a) ratio. (b) ratio.
Ancestral states of ratios were reconstructed as relatively homogeneous across the majority of the branches with only gradual changes except for the outliers mentioned above (Fig. 8b). The mean ratio was 1.45 mmol mol−1 across all nodes (SD = 0.099 mmol mol−1) and 1.55 at the root (SD = 0.086 mmol mol−1). The ancestral states of ratios at the nodes fall between 1.05 and 1.72 mmol mol−1.
Overall, our simulations of phenotypic evolutionary rates of ratios inferred a mean of σ2 = 1.70, which means that the standard deviation of change (i.e. the average absolute change, mean change is 0.0 mmol mol−1) per 1 Myr is σ = 1.30 mmol mol−1 and σ = 4.12 mmol mol−1 per 10 Myr. Given that the mean ratio is 10.51 mmol mol−1, these phenotypic evolutionary rates suggest a change of 12.4 % of the mean value per 1 Myr. The inferred values of σ2 for ratios are consistent regardless of the exemplar tree. The mean of σ2 ranges between 0.97 for the MCC tree of cluster B and 2.38 for the median tree (Fig. 9a). Across the sample of 1000 trees from the posterior, the 95 % confidence interval of mean values from all trees was between 0.90 and 3.17 (σ between 0.95 mmol mol−1 and 1.78 mmol mol−1 per 1 Myr, or 9.0 %–16.9 % of the mean). Notably, the MCC tree of cluster B, which coincides with the overall MCC tree, resulted in a comparatively low mean value of σ2 with a narrow confidence interval for both (Fig. 9a) and (Fig. 9b).
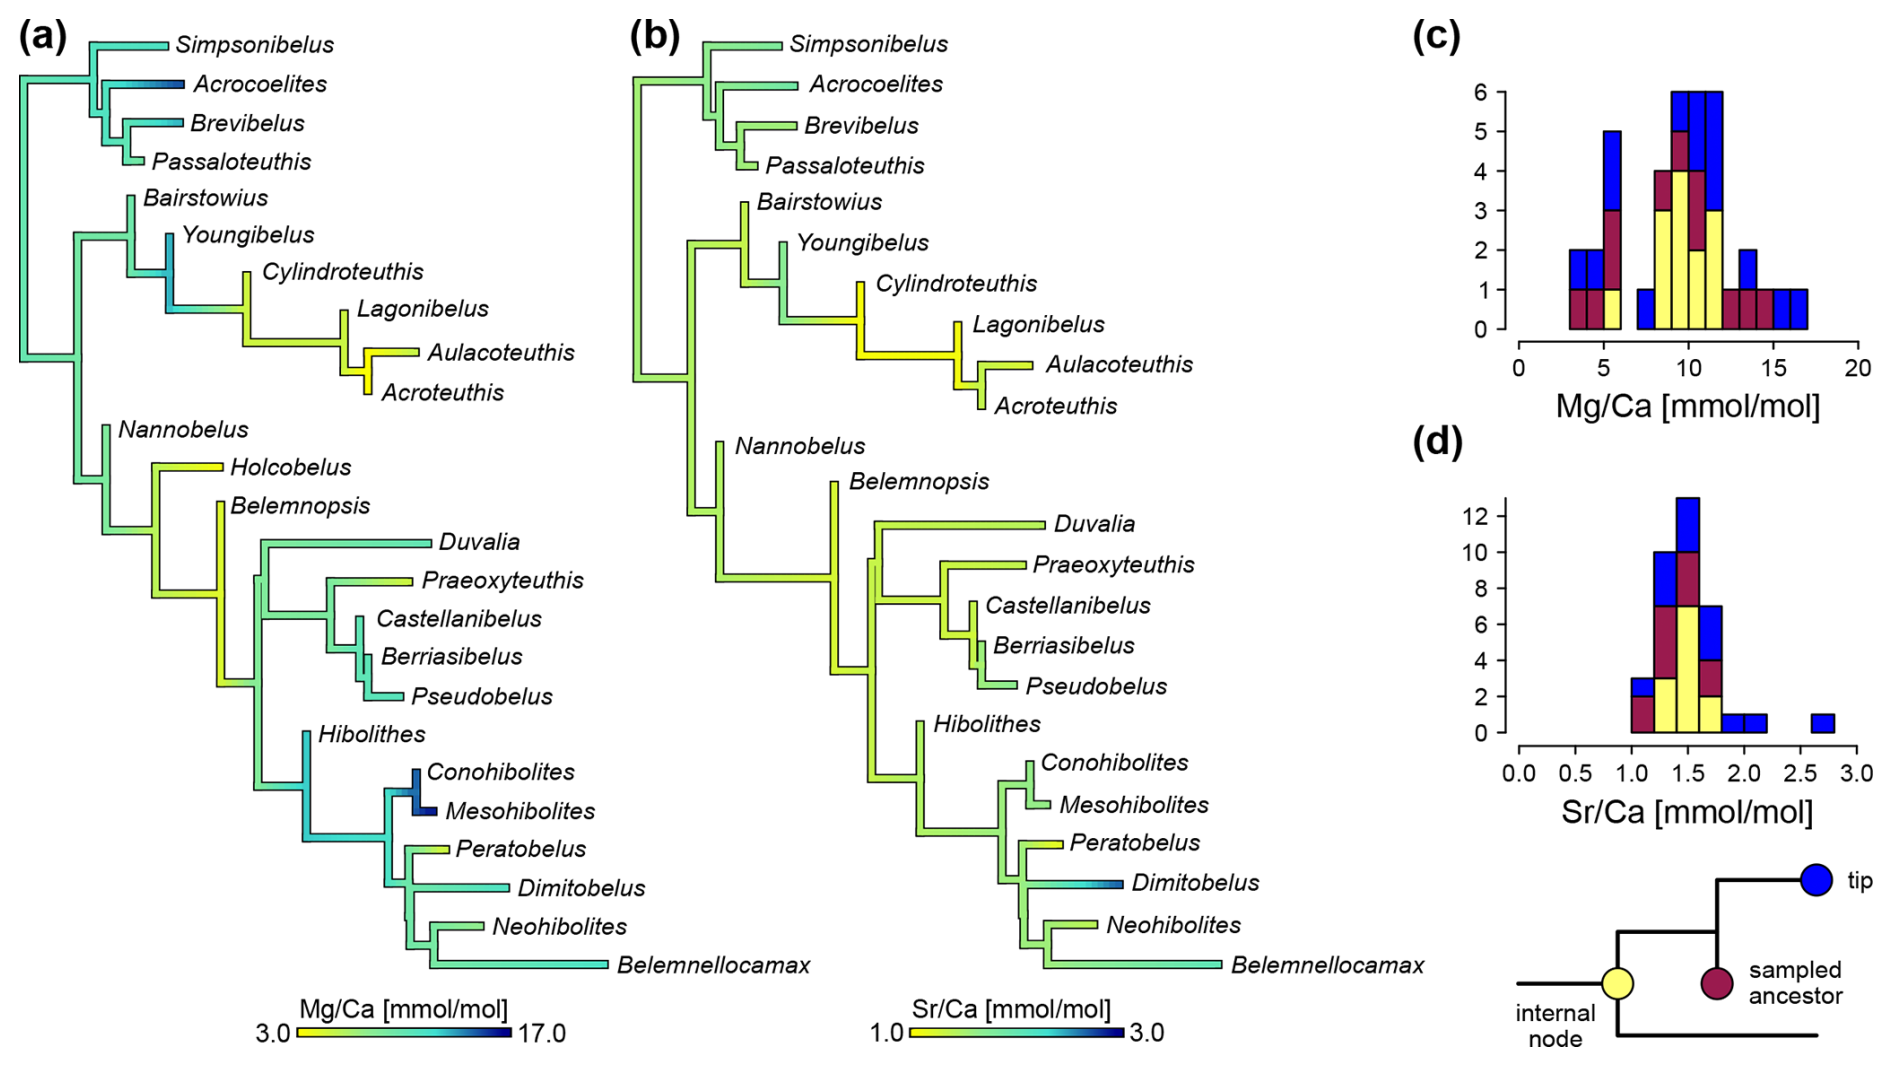
Figure 8Ancestral state reconstructions of elemental ratios, based on MCC tree. (a) ratio. (b) ratio. (c) Histogram of values, coloured by internal node, sampled ancestor and tip. (d) Histogram of values, coloured by internal nodes, sampled ancestors and tips. Note that values at tips and sampled ancestors are directly measured, while internal nodes use average values from ancestral state reconstruction.
The phenotypic evolutionary rates of ratios are lower than those of , but only when given as absolute values. For the entire sample, we inferred a mean value of σ2 = 0.04. In analogy to the above, this corresponds to an average absolute change of σ = 0.2 mmol mol−1 per 1 Myr and σ = 0.63 mmol mol−1 per 10 Myr. The overall mean of was 1.62 mmol mol−1 across all rostra in our dataset, i.e. σ reflects a change of 12.3 % of the mean per 1 Myr. This percentage is close to the corresponding value for ratios. Variations in σ2 between trees were higher for than for , with only slightly or non-overlapping distributions (Fig. 9b). Mean values of σ2 in the exemplar trees ranged between 0.010 for the MCC tree of cluster B and 0.628 for the tree with the maximum value on the PCo1 axis. Across the mean values from all posterior samples, the 95 % confidence contained values between 0.008 and 0.088 (σ between 0.089 mmol mol−1 and 0.297 mmol mol−1 per 1 Myr, or 5.5 %–18.3 % of the mean).
When all posterior samples are combined, the distributions of σ2 values based on trees from clusters A and B show almost complete congruence, while those inferred from trees of cluster C display a slightly shifted distribution for both and ratios (Fig. 10). Note that cluster A and B are roughly similar in size, comprising together about 90 % of the trees and cluster C is less dense and occupies an intermediate position in tree space (Fig. 5).
Randomly altered data (Fig. A2) led to slightly higher values of σ2 than the original data for the MCC tree of cluster B (Fig. 9, compare mccB vs. rdat). This pattern was observed for both and . The variation between the original data and randomly altered data was distinctly smaller than the differences observed using the original data but fixing different trees.
4.1 Rostrum phylogeochemistry
Elemental concentrations of belemnite rostrum calcite are influenced by the ambient chemistry of seawater, as well as by kinetic, biological, and post-mortem (diagenetic) factors. Because of the complex interplay of different factors, reconstruction of potential evolutionary constraints (i.e. biological factors) is challenging but crucial for the interpretation of geochemical proxy data derived from these archives (e.g. Ullmann et al., 2015; Immenhauser et al., 2016; Ullmann and Pogge von Strandmann, 2017; Hoffmann and Stevens, 2020, and references therein). Results documented here are in agreement with a taxon-specific distribution of rostrum elemental ratios (McArthur et al., 2007; Wierzbowski and Joachimski, 2009; Li et al., 2013; Stevens et al., 2022). For example, the rostra of Cylindroteuthis, Belemnopsis, Acroteuthis, and others show particularly low ratios (between 3.0 and 5.3 mmol mol−1), while those of Acrocoelites, Hibolithes, and Mesohibolites display higher Mg concentrations (between 7.6 and 16.6 mmol mol−1). The distribution of ratios is comparably homogenous across different taxa and plots into a relatively narrow window between 1.0 and 2.0 mmol mol−1. Exceptions include high ratios in Dimitobelus and Belemnellocamax. With regard to and ratios, the variability is found to be more significant within the same taxon compared to that between different taxa, which is what would be expected if diagenesis were the primary controlling factor. Another possible interpretation of this pattern is a stronger biomineralization effect, perhaps combined with kinetic factors.
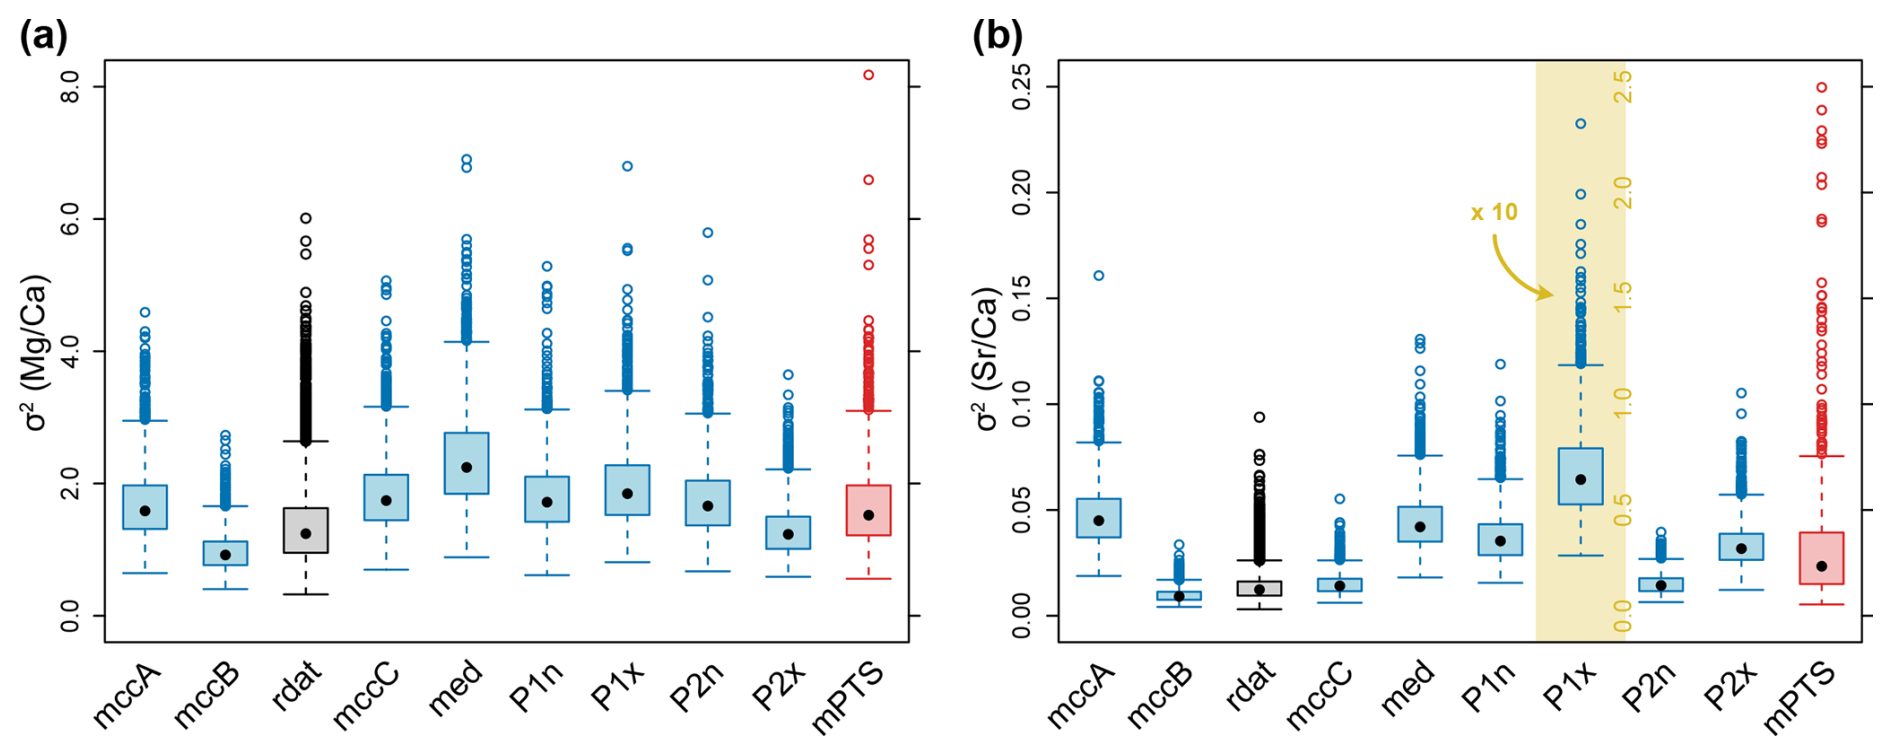
Figure 9Phenotypic evolutionary rates (σ2) of element ratios. Blue boxplots represent posterior distributions inferred from a single tree, while the red boxplot includes the mean of every analysis for each tree from the posterior tree sample (mean posterior tree samples = mPTS). Thus, the mean of each blue boxplot corresponds to a single point of mPTS. The grey boxplot (rdat) corresponds to the analyses of randomly altered data, using the MCC tree of the entire tree sample (= mccB). Note that σ2 of rdat is subsampled to correspond to the same sample size as mccB. (a) Phenotypic evolutionary rate of ratio. (b) Phenotypic evolutionary rate of ratio. Note that for display reasons, the boxplot in the yellow area (P1x) is rescaled, see corresponding axis labels.
The analyses presented here imply that element ratios in belemnite rostra were subject to high phenotypic evolutionary rates. The simple Brownian motion model assumes a constant phenotypic evolutionary rate across the tree but this is likely a simplification. In particular, short-term environmental disturbances would have probably led to sudden changes in proxy data. Nevertheless, it is important to understand the phenotypic evolutionary rate as an increase in variance through time, and not as projected absolute changes in the trait value (i.e. element Ca). Specifically, under our model, the expected average change for element Ca within 1 Myr is 0.0, meaning that positive and negative changes cancel each other out. The expected absolute average change is σ = 1.30, which means that there would be lineages expected with stasis or minor changes, as well as lineages with larger changes. Thus, the phenotypic evolutionary rate estimates should not be taken literally for individual lineages but understood in the context of the model specifications as a global average of a stochastic process. We also stress that σ2 is simply a metric for the tempo of changes in the trait value, independently of the underlying causes.
As for the primary data, differences in element ratios may be, in part, biased by differences in the seawater properties inhabited by the belemnites or inherent variability in the form of variable degrees of diagenetic alteration overprinting the primary geochemical composition of the rostra.
Nevertheless, our sensitivity tests with randomly altered data suggest that the estimation of phenotypic evolutionary rates is robust against the inclusion of some samples that may be diagenetically altered. Especially in taxa with a high number of samples, it would take a lot of data points to significantly affect the median of the or ratios. In comparison, uncertainty in tree topology had a larger effect on σ2 (Fig. 9). As the values for σ2 reported above account for uncertainty in tree topology, we consider these estimates to be reliable despite some inherent potential for biased data. The inclusion of geochemical data from further taxa would likely refine the estimates. As the estimated rates appear to be independent of topological uncertainty to some degree, more precise estimates may be achieved even if phylogenetic relationships are not always known in detail.
Seawater properties (water depth, latitudinal differences, basin-specific properties of aquafacies, etc.) influenced the composition of the body fluids of belemnites, from which the rostrum was precipitated. Thus, these environmental properties are thought to have a direct impact on the chemical signature of the rostrum (Gröcke and Gillikin, 2008; Immenhauser et al., 2016). Even though these represent non-genetic and, therefore, phylogeny-independent factors, we argue that reconstructing phenotypic evolutionary rates can still be meaningful. This is because it seems unlikely that the geochemical proxy data of different taxa would record sudden and non-systematic shifts in seawater properties, with the possible exception of major short-term disturbances (e.g. the Toarcian Oceanic Anoxic Event, see Ullmann et al., 2014). Moreover, due to the stratigraphically and geographically restricted ranges of belemnite taxa, a single species would not be expected to record significantly differing seawater properties. Widely distributed generalist and long-ranging taxa are expected to display a broader distribution in elemental ratios. Phenotypic evolutionary rates would arguably reflect the frequency of habitat shifts (coastal versus open oceanic settings). Nevertheless, as differences in element ratios of belemnite taxa from the same locality exist (Fig. 4), seawater properties are probably not the only contributing factor.
Post-mortem (diagenetic) alteration and poorly constrained kinetic (disequilibrium) effects are significant problems in the analysis of phenotypic evolutionary rates. That said, it seems likely that the proxy data analysed should display some degree of homogenization of the differences between taxa if diagenetic resetting were a dominant control. Diagenetic homogenization would be most pronounced for specimens in a given section that has seen above-average diagenetic overprint (i.e. deep burial and hydrothermal or meteoric alteration, etc.), independent of taxonomy. Note that this would likely also result in a larger scatter of the proxy data on the individual scale.
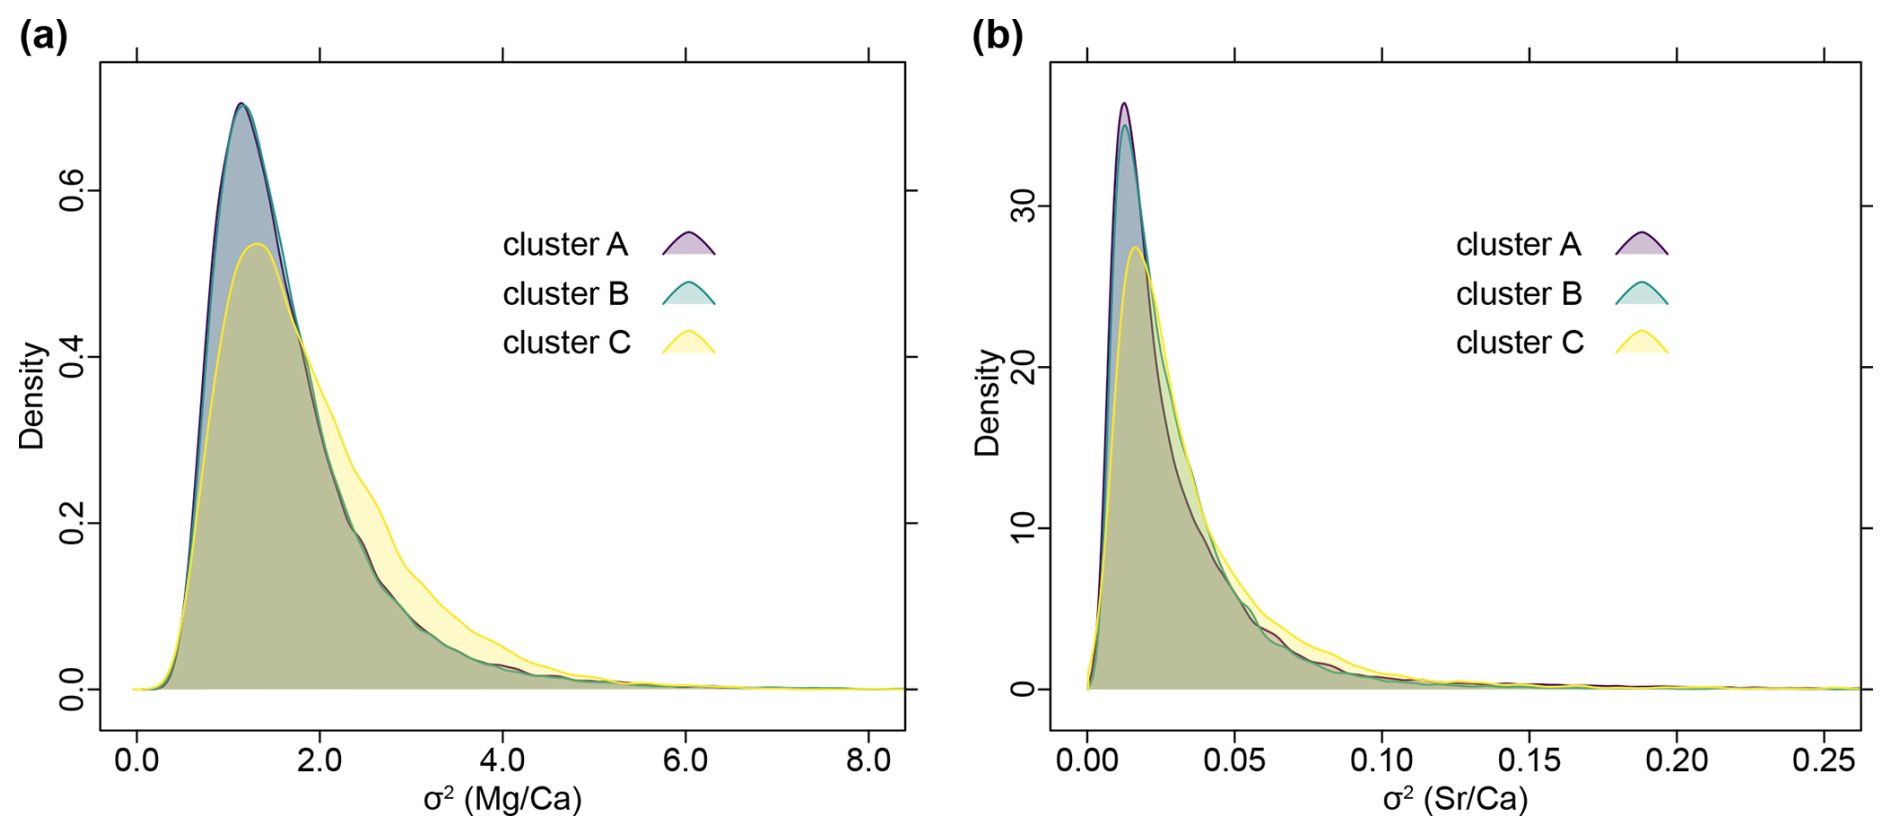
Figure 10Density plots of combined posterior samples of σ2 inferred from all trees, grouped after tree clusters (see Fig. 5). Note that cluster A and cluster B almost entirely overlap, while cluster C is slightly shifted. (a) Distribution of phenotypic evolutionary rate of ratios. (b) Distribution of phenotypic evolutionary rate of ratios.
The ancestral state reconstructions and inferred phenotypic evolutionary rates suggest that element ratios show a complex pattern with frequent clade-independent changes despite their taxon-specific distributions. There are several, not mutually exclusive, explanations for this pattern:
-
High phenotypic evolutionary rates are a genuine feature of belemnite rostrum geochemistry. Given that the dataset used includes a limited amount of taxa, the changes are perhaps too rapid to be accurately detected. A much denser species sampling would be required to support or reject this hypothesis. Given that the amount of available characters is limited, producing a phylogeny with the required level of accuracy is challenging. In addition, for many species, only a limited number of well-constrained elemental concentrations are available in the literature.
Moreover, the identification of species in published works is often difficult to confirm. This is because sample extraction (usually drilling of powder samples or crushing of bulk rostra) is a destructive process. Not every specimen is documented both before and after sampling. Moreover, the identification at the species level was not necessarily the aim of the published studies, many of which focussed on palaeoceanographic aspects and often lacked guidance by belemnite taxonomists. This effect is demonstrated by the fact that taxa in open nomenclature (i.e. only identified to genus level) have relatively wide ranges of element ratios (Fig. 3). This indicates that the specimens may belong to different species.
A wide range of data for persistent and widespread taxa like Hibolithes might also be caused by hidden genetic diversity that is not observable in rostrum morphology alone. It always has to be kept in mind that the rostrum represents a phylogenetically informative character, but every “rostrotaxon” probably contains several “biological taxa” and potentially vice versa. This can be compared to the situation in sepiids, in which the congruence of taxa (genera/subgenera/species) based on genetic markers and cuttlebone morphology is complex (e.g. Lupše et al., 2023). A better understanding of the chemical signatures of different species is urgently needed for geochemical studies but may also have some taxonomic relevance. We thus encourage the inclusion of geochemical data in taxonomic studies, if available. If homologous spatial and ontogenetic areas of the rostrum are targeted, it may be possible to identify “chemospecies” within a contemporary assemblage.
-
The elemental concentrations are strongly ontogenetically and spatially controlled. Differences in proxy data related to ontogenetic stages and position within the rostrum are not always reported. That said, there is evidence that element ratios of rostra vary during ontogeny and a trend towards higher ratios in early ontogenetic stages and close to the apical line of several taxa was reported (Ullmann et al., 2015; Stevens et al., 2017, 2022; Ullmann and Pogge von Strandmann, 2017). Depending on the volume of the subsamples drilled, later ontogenetic stages and parts that are further away from the apical line might be overrepresented in our data as these form larger portions of the rostrum and, hence, are more likely sampled or dominate the signature of bulk sampled rostra. Examples of sampling that include highly resolved ontogenetic and spatial data are Passaloteuthis (Ullmann et al., 2015), Neohibolites (Stevens et al., 2017) and Duvalia (Stevens et al., 2022), all of which contain outliers in and to a lesser degree in . However, the bulk of the data overlaps with data from other genera that were not sampled with a focus on ontogenetic stages (Fig. 2a).
-
Patterns in rostrum proxy data reflect genuine patterns in seawater hydrogeochemistry (see Hoffmann and Stevens, 2020 for discussion and critique). If this holds, element concentrations, and hence ratios, are expectedly controlled by phenotypic plasticity as opposed to evolutionary (i.e. genetic) constraints. Detecting plasticity in the fossil record is challenging because genetic and environmental factors are not easily separated (Lister, 2021). Recent coleoid cephalopods are known for increased levels of plasticity (e.g. Boyle and von Boletzky, 1996), which may, in part, be due to extensive amounts of RNA editing (Liscovitch-Brauer et al., 2017). It may also be possible that each belemnite taxon has a distinct partition coefficient for each element, which may be used to calculate seawater properties. However, the pathways that form mollusc biominerals are complex, and bodily fluids differ in their elemental composition from seawater (Immenhauser et al., 2016). Thus, calculating such coefficients is challenging and requires a much wider sampling coverage than is currently available.
-
The dataset is too heterogeneous and obscures any underlying pattern. This heterogeneity might include a sampling and analytical bias. Even if most studies use the same analytical method (e.g. wet chemical analysis), minor technical differences such as experimental protocols, equipment or even human factors might play a small role. In the case of sample material that was drilled mechanically from rostra, the position of the sampling point and the volume of subsamples might affect the resulting data (see, e.g. Ullmann et al., 2015). If all data were collected for a single study, good scientific practice would dictate that the same protocol would be used for every sample. For obvious reasons, this was not possible for our study. All of these features are difficult to constrain, but it is argued that the effect is likely negligible but, if present, should be non-systematic (i.e. affects all specimens regardless of their taxonomic position).
Besides the phylogenetic patterns, we noted that there is a strong correlation between the phenotypic evolutionary rate σ2 of the and ratios (Spearman's rank correlation: ρ = 0.57, p value <0.001; Fig. 11b). It seems likely that this feature is caused by the general correlation of and ratios across all belemnite rostra in our dataset (Spearman's rank correlation: ρ = 0.49, p value <0.001; Fig. 11a). Alternatively, it might also be argued that if element ratios (of individual specimens) would be distributed independently of phylogeny and taxonomy, a direct link with phenotypic evolutionary rates (the average of individual trees) is not necessarily to be expected. At the level of a working hypothesis, we take this notion as evidence for a taxon-specific vital effect of element ratios. Another possibility is that this pattern is caused by extreme outliers being relatively short-lived – since and are correlated, a peak would decrease more rapidly in both, while lower element ratios would remain stable for a longer period.
Our study shows that rostrum ratios if properly understood, need to be interpreted in an evolutionary context. Cylindroteuthids appear to contain relatively low ratios, while the Pseudoalveolata and Belemnitina have relatively high ratios. However, these are general trends, and the changes are rapid in some cases. There is a strong overlap between individual taxa, suggesting that identifications based on element ratios alone are not possible. Thus, element ratios should be used carefully as a character in phylogenetic analyses. It also shows the importance of identifying belemnite material as accurately as possible before using it for geochemical studies.
In contrast, they are well suited for the reconstruction of ancestral states and inference of phenotypic evolutionary rates. Future studies may also investigate their potential in species-level analyses, where rapid changes can be more easily detected, and the amount of characters is particularly poor. In contrast, ratios appear to be relatively independent of phylogeny, although they still show a more or less taxon-specific distribution. Comparing the two elemental ratios implies that there was some genetic control on the incorporation of Mg into the rostrum. Presumably, this is related to the biomineralization strategy that underwent evolutionary changes between taxa. Alternatively, the discrepancy might be related, at least in part, to solid solution geochemistry; specifically, the ionic radii of Mg and Sr. Mg ionic radii (0.72 Å) are more suitable to substitute Ca (1.0 Å) in the calcite crystal lattice. In contrast, Sr ionic radii (1.31 Å) are more suitable for substituting Ca in the aragonite crystal lattice (see Immenhauser et al., 2016, for details and explanation). For the calcitic belemnite rostra, this means that (arguably) the amount of Mg was more variable than Sr, allowing for a higher number of different expressions in the genetics in the biomineralization apparatus with respect to its incorporation.
In conclusion, rostrum element ratios likely represent a complex interplay of evolutionary, ontogenetic, environmental, kinetic, and diagenetic factors, which all need to be accounted for if these archives are to be used as geochemical proxies. Diagenetic bias can be reduced by various screening processes, including cathodoluminescence analysis, although there are potential pitfalls (see Stevens et al., 2022). Ontogenetic variation can be accounted for by appropriate sampling strategies that either compare their trajectories or only compare similar ontogenetic stages (e.g. Ullmann et al., 2013, 2015; Sørensen et al., 2015; Stevens et al., 2017, 2022; Ullmann and Pogge von Strandmann, 2017). The sampling position within the rostrum needs to be specifically tailored to align with the research goal, i.e. a study on environmental effects will likely require a broader sampling. In contrast, for phylogenetic studies, sampling the same position and the same ontogenetic stage is important due to homology. To account for evolutionary constraints, the taxonomy of the studied specimens should be precisely controlled, ideally with well-documented reference images and/or measurements. This complexity calls for a greater interdisciplinary effort to collaborate between geochemists, oceanographers and palaeontologists when interpreting proxy data from belemnite rostra.
Due to uncertainties in their phylogenetic relationships, taxonomic identity of taxa used for proxy data and complications arising from the nektic lifestyle of belemnites, the use of phylogeochemistry in this group currently only provides incomplete information. Nevertheless, there is hardly any other group for which a large and well-constrained set of proxy data and time-calibrated phylogenies are available at the same time. Thus, belemnites still represent one of the currently best systems to test applications of phylogeochemistry. It will be therefore of interest to further expand and align taxonomic, phylogenetic and geochemical work on belemnites.
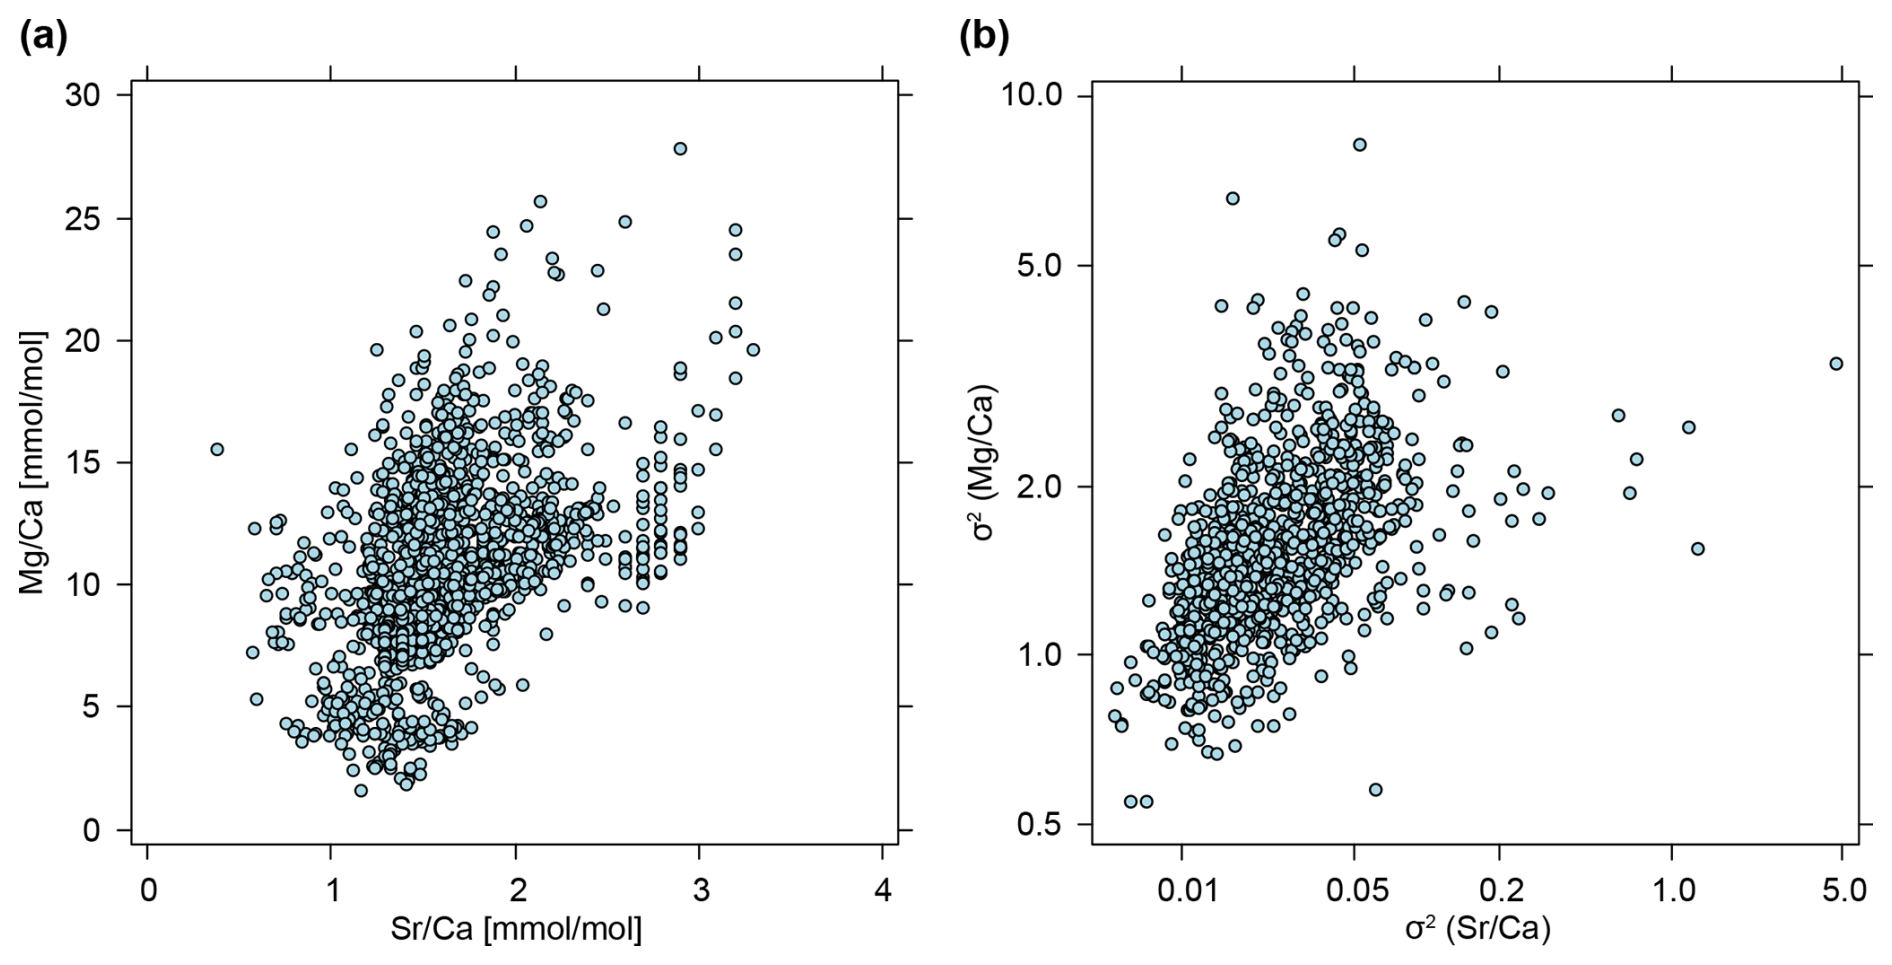
Figure 11Correlation between element ratios and their phenotypic evolutionary rates. (a) Element ratios as raw values, taken from entire data set, i.e. each point represents a single measurement from a belemnite rostrum (n=2241). (b) Phenotypic evolutionary rates (σ2), taken as means of posterior samples, i.e. each point represents the average phenotypic evolutionary rate inferred for a single tree (n=1000). Note that B is shown on a double logarithmic scale.
4.2 Belemnite phylogeny
Reconstructing a well-supported phylogeny was not a primary goal of this study, though extending previous results from Stevens et al. (2023) was a necessary first step. Consequently, our results provide additional insights into this still largely uncharted area. We find further support for the Pseudoalveolata (Stevens et al., 2023), while the position of the Duvaliidae remains obscure, with some support for its closer association with the Pseudoalveolata. The decreased support of the Pseudoalveolata in comparison with Stevens et al. (2023) is partly caused by the uncertainty in the position of the DuvPO clade, which was occasionally recovered as forming part of the Pseudoalveolata. This question requires further investigation, e.g. by analysing the rostrum microstructures of additional species. Improved species sampling may also be useful, as the number of Jurassic and Early Cretaceous pseudoalveolates and duvaliids is still rather low in our matrix.
In comparison with the earlier study, our analysis also included a denser sampling of Duvaliidae, Cylindroteuthidae, and Oxyteuthidae. These three families previously formed a (poorly supported) monophyletic clade together with Dicoelites (Stevens et al., 2023) but were here resolved differently. Instead of being a sister group to the Cylindroteuthidae, our results suggest that Oxyteuthis and Praeoxyteuthis are more closely related to the (paraphyletic) Duvaliidae, while Aulacoteuthis received high support as a member of the Cylindroteuthidae. Mutterlose and Baraboshkin (2003) suggested that the Hauterivian boreal Aulacoteuthis absolutiformis belongs to the Cylindroteuthidae, while the mid-Barremian Aulacoteuthis from northwestern Europe (which is included here with A. ernsti) was thought to be a member of the endemic Oxyteuthidae. Our results imply a possible alternative, with the cylindroteuthid Aulacoteuthis migrating into Europe during the mid-Barremian, contrasting with the conclusion of Mutterlose (1983) based on a biometric, stratophenetic approach.
The previous analysis suggested a monophyletic Belemnitina that excludes the families Cylindroteuthidae and Oxyteuthidae (Stevens et al., 2023). Our results suggest alternative scenarios where the “Belemnitina” represent an ancestral paraphyletic group from which later belemnitid lineages evolved. However, topological uncertainties are particularly high near the base of the tree. Note that we excluded sinobelemnitids here, which may be relevant for the early diversification of the group but are still poorly known (Zhu and Bian, 1984; Iba et al., 2012; Ma et al., 2023). Neither microstructures nor geochemistry of sinobelemnitids have been investigated so far.
The volatility of belemnitid relationships retrieved from this study and compared to the previous analysis highlights that further research is needed. The number of characters needs to be expanded in the future, e.g. by implementing geometric morphometric data (e.g. Dera et al., 2016). Further insights may also be gained by including taxa from several currently un(der)sampled families (e.g. Hastidae, Salpingoteuthidae).
Beyond belemnitid relationships, our study serves as a practical example of how topological uncertainties within a posterior tree sample may be investigated using available tools of tree space analysis. In palaeontological phylogenetic studies, only a single reference tree is usually given with support values reflecting uncertainty, e.g. posterior probability in trees inferred with Bayesian methods or bootstrap support in Parsimony trees (e.g. O'Reilly and Donoghue, 2018). Summary trees, however, represent only a point estimate, and clade supports are difficult to interpret because alternative topological configurations are not obvious. By using multidimensional scaling and analysing individual tree clusters (Jombart et al., 2017), we show how to investigate the extent and potential sources of topological incongruence in trees resulting from a single analysis. In particular, we suggest that using partial posterior probabilities of clades only within clusters of trees is helpful in identifying clades with conflicting positions between tree clusters. For example, a clade may show weak overall support but concurrently show highly supported, incompatible positions in different tree clusters. The approach thus allows us to explicitly formulate alternative phylogenetic configurations rather than generally reporting high topological uncertainty. Furthermore, by reporting trees with maximum and minimum values on the principal coordinate axes, it is possible to assess the limits of the topological variation within the posterior tree sample.
4.3 Implications for chemical diagenesis-screening of belemnite rostra
Screening of belemnite rostra calcite for evidence of post-mortem alteration (note, diagenetic modification of biominerals can commence during the lifetime of an organism, Immenhauser et al., 2016) has been a topic for many decades. Besides optical methods such as SEM imaging and cathodoluminescence (e.g. Saelen, 1989; Barbin et al., 1991), element concentrations were introduced as a sensitive tool to assess alteration (Veizer, 1974). The increase of Mn and Fe elemental concentrations and the decrease of Sr and Mg concentrations are thought to indicate diagenetic alteration (e.g. Veizer, 1983; Ullmann and Korte, 2015). The threshold limits were set at variable values, depending on the local context (cf. Dutton et al., 2007; Price and Mutterlose, 2004; Wierzbowski and Joachimski, 2007). Moreover, recent work has documented that diagenesis may result in fabric-retentive carbonates with altered geochemical proxy values or, vice versa, in fabric-destructive carbonates with largely preserved marine geochemical signatures (Bernard et al., 2017; Immenhauser, 2022; Mueller et al., 2024).
The results shown here are in agreement with the work by Stevens et al. (2022), suggesting that the threshold limits for Mn and Fe elemental concentrations have often been set too high in earlier studies. This may be, in part, caused by underlying assumptions on the (unknown) original composition of the belemnite rostrum. Due to potential environmental (different water masses with different geochemical properties through which the nektic belemnites move), kinetic (non-equilibrium fractionation), and biological (biomineralization strategies) impact on and ratios, we urge for caution when using threshold limits on screening approaches. We propose that taxonomy should be taken into account when defining threshold limits, in addition to the local diagenetic context and depending on the proxy of interest. Importantly, there is no global “one-size-fits-all” threshold as an indicator for the degree of preservation and the geological context, as well as the original in vivo carbonate composition of the taxon need to be taken into account. Tentatively, the values indicated in Table 4 might give hints for more refined threshold limits for and ratios at a very high taxonomic level (belemnites). Additionally, and ratios may also be compared at the genus level (Fig. 2c, d; Table A1). However, we highlight that in state-of-the-art diagenesis screening of fossil biominerals, screening techniques should not be used in isolation, and chemical assessments need to be combined with thorough analyses by microstructural, SEM-based methods, or cathodoluminescence microscopy.
“Phylogeochemistry” is proposed here as a new term for the application of Bayesian phylogenetic tools to study evolutionary pathways of the chemical composition of fossil biomineralizing organisms. The term may even be defined more broadly, when considering macroevolutionary patterns of geochemical proxy data (e.g. Boscolo-Galazzo et al., 2025). Here, we tested the utility of element Ca ratio data as a phylogenetic character. Our results show that phenotypic evolutionary rates of and ratios in belemnites are relatively high, so they are likely of limited use in reconstructing evolutionary relationships unless applied at a high taxonomic resolution. The heterogeneous changes in provide insights into the evolution of biomineralization patterns. Our study highlights that care must be taken when interpreting geochemical data of belemnite rostra, as evolutionary constraints cause biased element ratios, particularly if samples are taken from distantly related taxa. Therefore, it is crucial to accurately document the taxonomic identity of the analysed material in geochemical studies. Although not all proxy data are necessarily affected by primary taxonomic differences, and taxonomy may be irrelevant to the goals of the respective study, this allows re-usability of the data for other studies where it may be relevant. For future research, we propose detailed analyses on a lower taxonomic level to analyse short-term changes in element compositions.
Phylogeochemistry has a high potential for future studies, as using this approach makes it possible to link proxy data with taxa in a time-calibrated phylogeny directly. Thus, rather than comparing a phylogenetic tree to a (global) curve of proxy data, each tip in the phylogeny will have associated proxy data, ideally reflecting local environmental conditions. This opens the door for a large amount of potential applications by adding an evolutionary dimension. Potential applications include testing the influence of local temperatures on extinction or speciation rates or the frequency of evolutionary transitions between cold water and warm water clades. Naturally, this kind of study requires either strongly environmentally-driven proxy data or a profound understanding of their evolutionary constraints. Performing comparable studies for isotope data (δ13C, δ18O) is, therefore, an obvious next step. For such studies, it would be reasonable to restrict the data per taxon to a much narrower spatial and temporal window, in order to retrieve a local signal. Our methodology can also easily be transferred to other groups of fossil or even living biomineralizing organisms. Last but not least, the flexibility of Bayesian techniques allows for extending the complexity of the models, e.g. by incorporating locality-specific factors to account for environmental effects or testing alternative evolutionary models that allow for variable rates (relaxed Brownian motion) or evolutionary optima (Ornstein–Uhlenbeck). This study thus represents an important starting point for an evolutionary perspective on geochemical archive data and offers a plethora of opportunities for further research.
Table A1Statistical summary of element Ca ratios and sample size per genus, listing median (= med), standard deviation (= SD) and sample size (=n). All values are rounded, but the highest available precision was used for subsequent analyses. Note that sample size refers to the total number of measurement points, but individual measurements per genus may be lower.
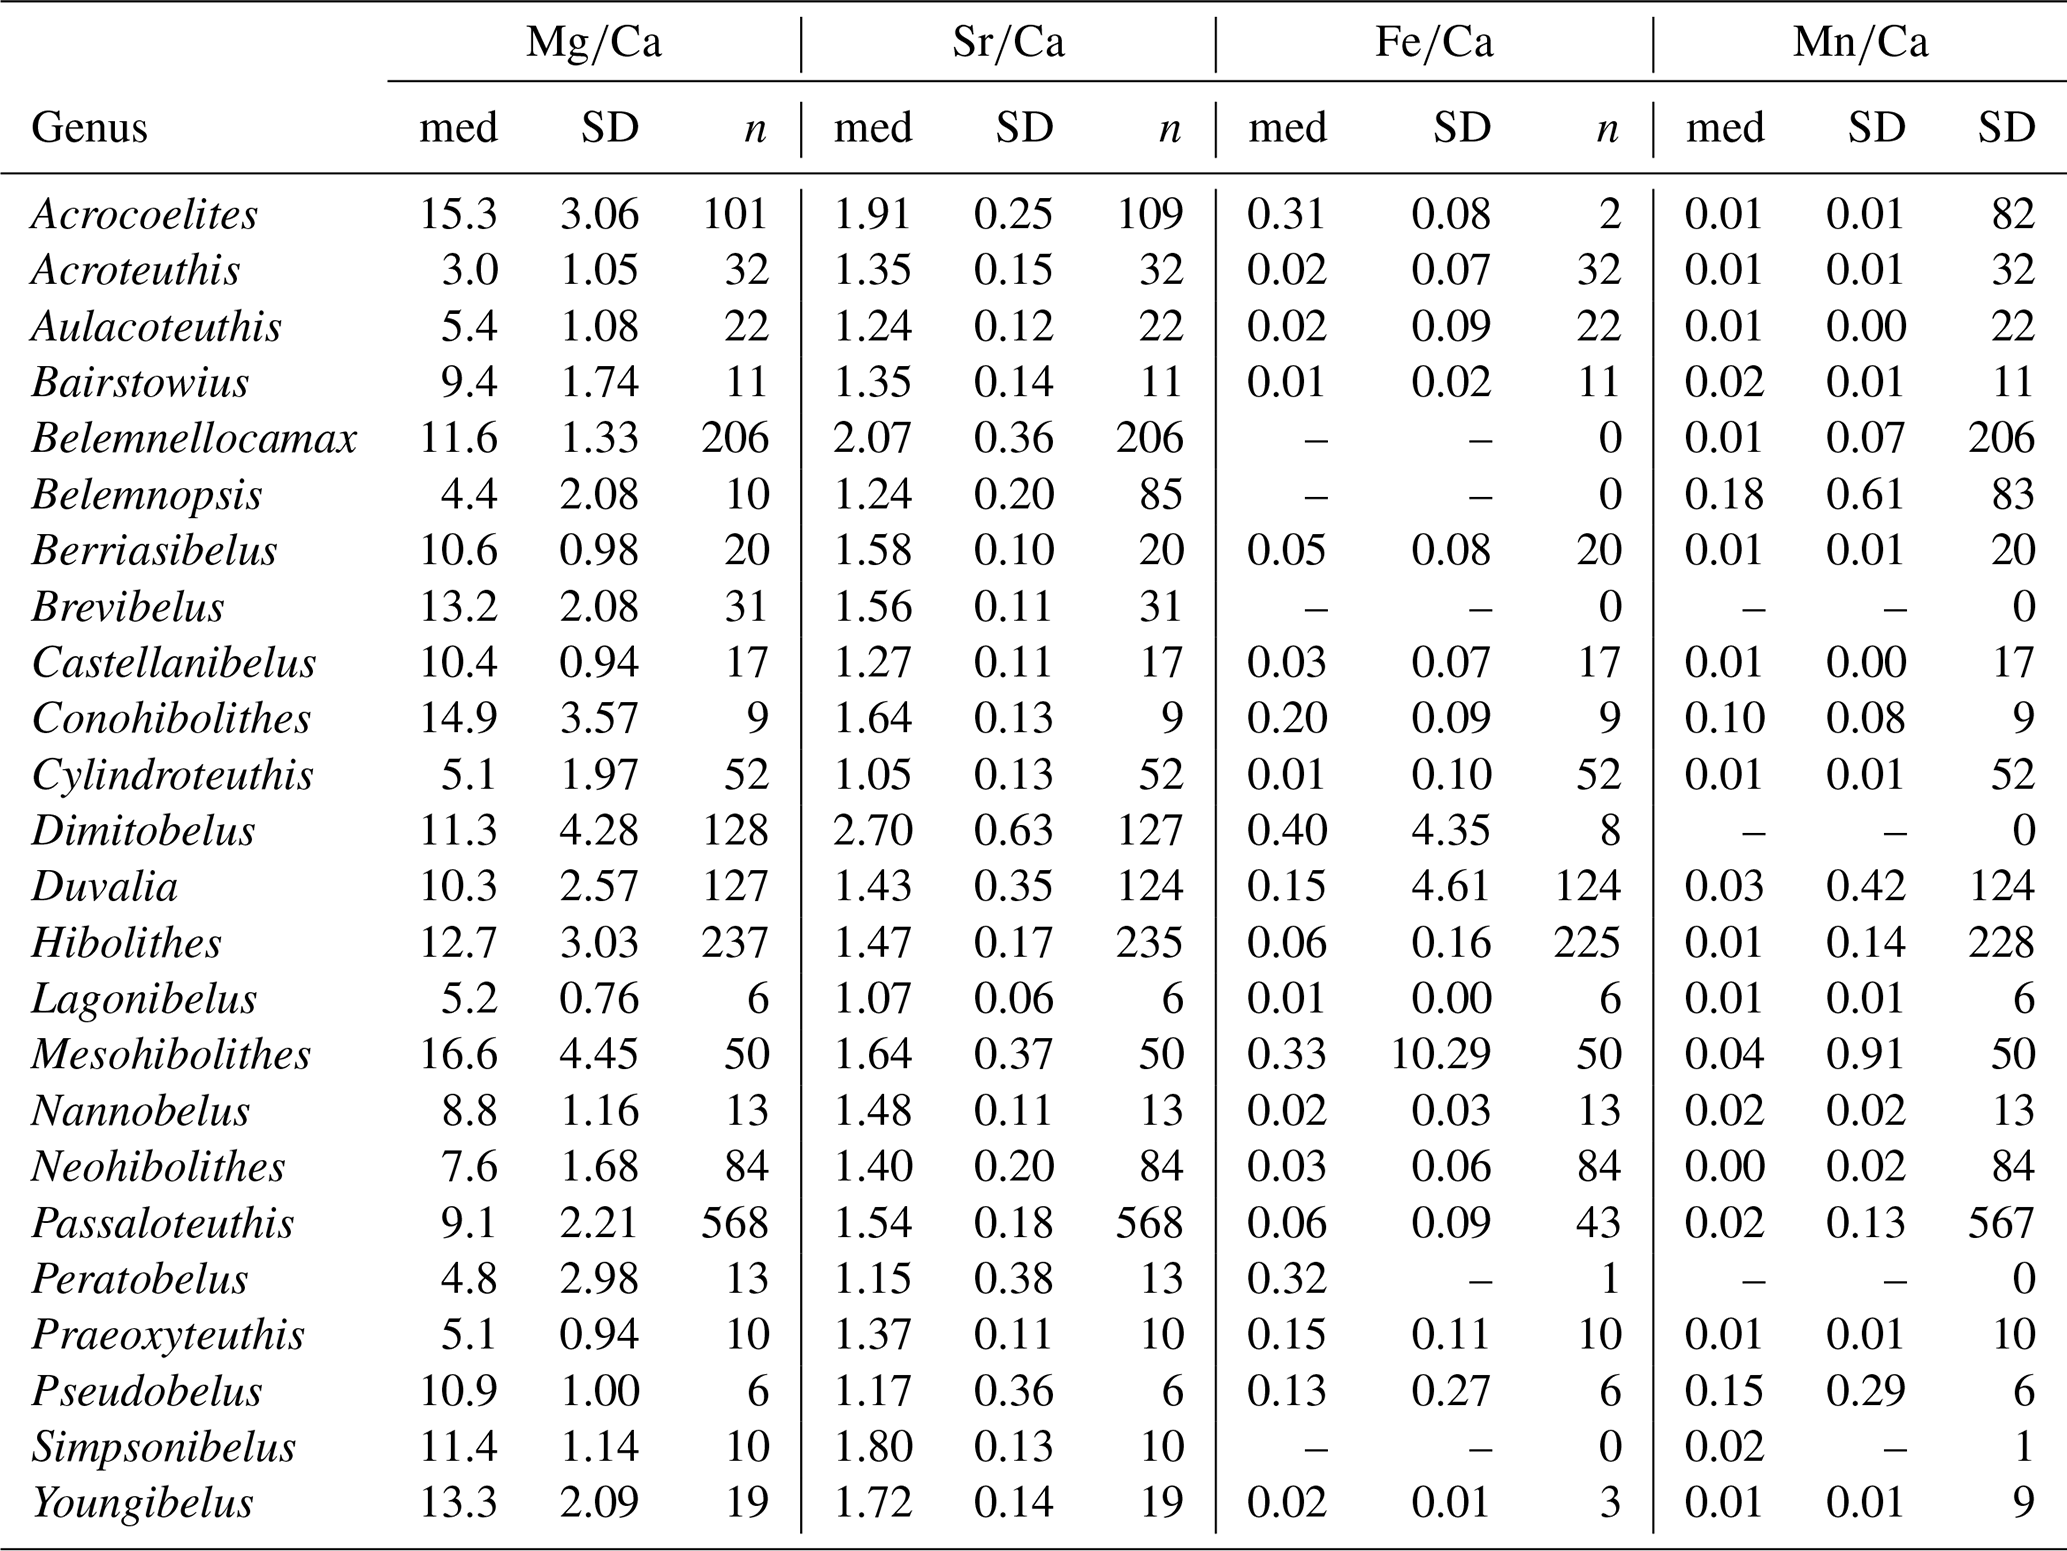
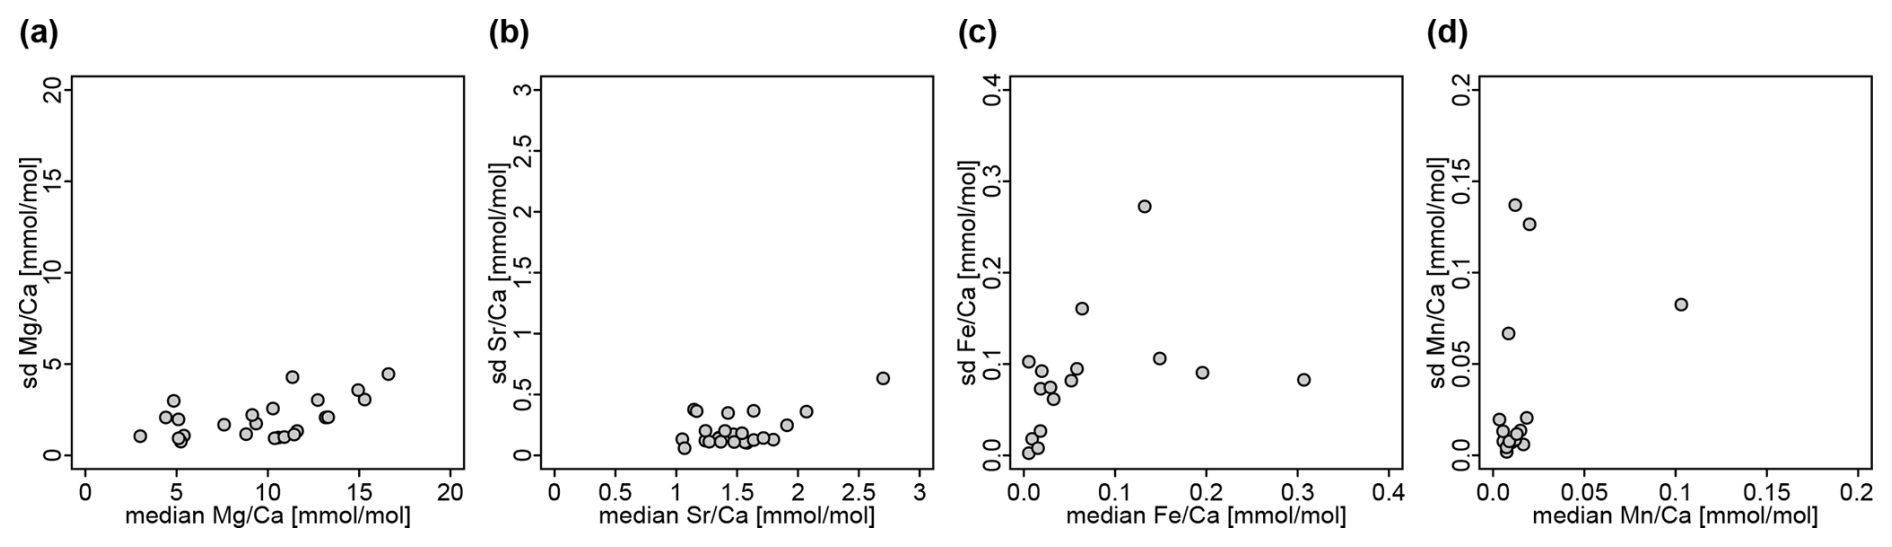
Figure A1Intra- and intergeneric variation of element Ca ratios, with the standard deviation (SD) plotted against the median for each genus. Note that the range of standard the deviation is lower than the range of median values for and , implying that variation between genera is larger than variation within genera. The opposite is the case for and . (a) . (b) . (c) . (d) .
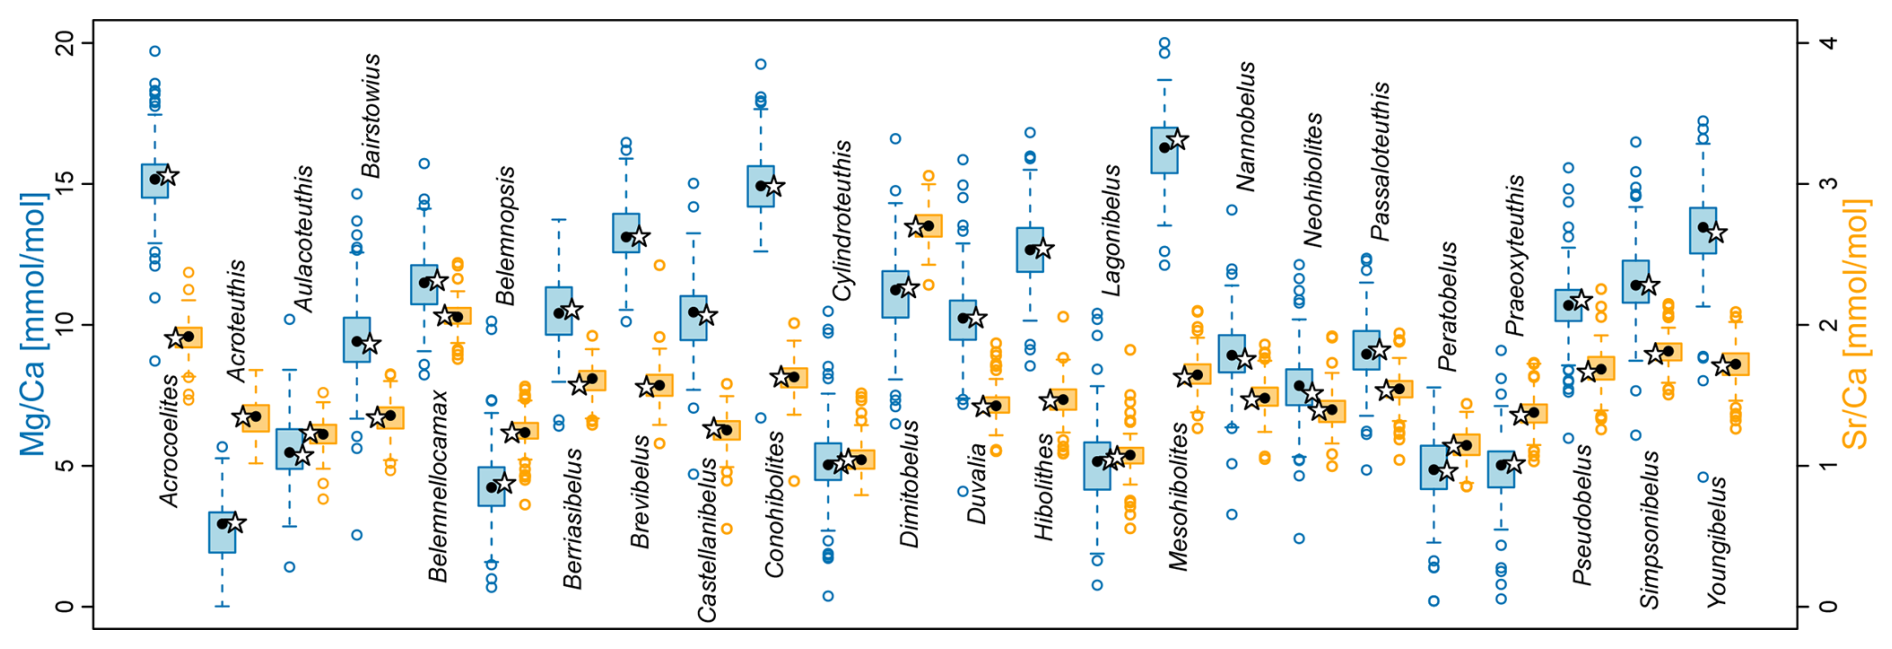
Figure A2Randomly altered data for sensitivity test. Stars represent the original input values for the analyses, i.e. the median of the element Ca ratios for each taxon. Boxplots represent the distribution of the 100 random iterations of altered data, each of which were then used as input for a separate analysis to test the sensitivity of the results.
All script and data files are available at https://doi.org/10.5281/zenodo.14004248 (Pohle et al., 2024). File S1 includes the literature dataset of element ratios of belemnite rostra (including calculated missing values). Note that the literature dataset is much more inclusive and not all data therein were used for the analyses. Excluded data are thus highlighted in red. S2 is a zip file that contains the RevBayes scripts files used for the phylogenetic analyses and estimation of phenotypic evolutionary rates, the nexus file containing the morphological character matrix, and the output log and trees files. and ratios for all genera and estimated values at nodes are listed in file S3.
KS, AP, and RH conceptualized the study; AP assembled literature data with the help of KS and RH, developed the methods, wrote the script files, analysed the data and produced the figures; KS and AI acquired funding; AP wrote the initial manuscript with input from KS, RH, and AI; all authors revised and edited the manuscript.
The contact author has declared that none of the authors has any competing interests.
Publisher's note: Copernicus Publications remains neutral with regard to jurisdictional claims made in the text, published maps, institutional affiliations, or any other geographical representation in this paper. While Copernicus Publications makes every effort to include appropriate place names, the final responsibility lies with the authors.
We thank Laura Jonas for her help with calculations of some of the compiled element ratios. We are grateful for the reviews by Clemens Vinzenz Ullmann and Madeleine Vickers, who greatly helped to improve the final version of the manuscript.
This research has been supported by the Deutsche Forschungsgemeinschaft (grant no. 507867999).
This paper was edited by Niels de Winter and reviewed by Clemens Vinzenz Ullmann and Madeleine Vickers.
Alberti, M., Fürsich, F. T., Pandey, D. K., Andersen, N., Garbe-Schönberg, D., Bhosale, S., Chaskar, K., and Habermann, J. M.: First record of stable isotopes (δ13C, δ18O) and element ratios (Mg/Ca, Sr/Ca) of Middle to Late Jurassic belemnites from the Indian Himalayas and their potential for palaeoenvironmental reconstructions, J. Palaeogeogr., 10, 24, https://doi.org/10.1186/s42501-021-00103-2, 2021a. a
Alberti, M., Parent, H., Garrido, A. C., Andersen, N., Garbe-Schönberg, D., and Danise, S.: Stable isotopes (δ13C, δ18O) and element ratios (, ) of Jurassic belemnites, bivalves and brachiopods from the Neuquén Basin (Argentina): challenges and opportunities for palaeoenvironmental reconstructions, J. Geol. Soc. London, 178, jgs2020–163, https://doi.org/10.1144/jgs2020-163, 2021b. a, b
Arabas, A.: Middle–Upper Jurassic stable isotope records and seawater temperature variations: New palaeoclimate data from marine carbonate and belemnite rostra (Pieniny Klippen Belt, Carpathians), Palaeogeogr. Palaeocl., 446, 284–294, https://doi.org/10.1016/j.palaeo.2016.01.033, 2016. a, b, c, d, e, f, g
Arabas, A., Schlögl, J., and Meister, C.: Early Jurassic carbon and oxygen isotope records and seawater temperature variations: Insights from marine carbonate and belemnite rostra (Pieniny Klippen Belt, Carpathians), Palaeogeogr. Palaeocl., 485, 119–135, https://doi.org/10.1016/j.palaeo.2017.06.007, 2017. a, b, c, d, e, f, g, h
Armendáriz, M., Rosales, I., Bádenas, B., Aurell, M., García-Ramos, J. C., and Piñuela, L.: High-resolution chemostratigraphic records from Lower Pliensbachian belemnites: Palaeoclimatic perturbations, organic facies and water mass exchange (Asturian basin, northern Spain), Palaeogeogr. Palaeocl., 333–334, 178–191, https://doi.org/10.1016/j.palaeo.2012.03.029, 2012. a
Arvidson, R. S. and Mackenzie, F. T.: The dolomite problem; control of precipitation kinetics by temperature and saturation state, Am. J. Sci., 299, 257–288, https://doi.org/10.2475/ajs.299.4.257, 1999. a
Barbin, V., Ramseyer, K., Debenay, J. P., Schein, E., Roux, M., and Decrouez, D.: Cathodoluminescence of Recent biogenic carbonates: environmental and ontogenetic fingerprint, Geol. Mag., 128, 19–26, https://doi.org/10.1017/S001675680001801X, 1991. a
Barido-Sottani, J., Aguirre-Fernández, G., Hopkins, M. J., Stadler, T., and Warnock, R.: Ignoring stratigraphic age uncertainty leads to erroneous estimates of species divergence times under the fossilized birth–death process, P. Roy. Soc. B, 286, 20190685, https://doi.org/10.1098/rspb.2019.0685, 2019. a
Barido-Sottani, J., van Tiel, N. M. A., Hopkins, M. J., Wright, D. F., Stadler, T., and Warnock, R. C. M.: Ignoring Fossil Age Uncertainty Leads to Inaccurate Topology and Divergence Time Estimates in Time Calibrated Tree Inference, Front. Ecol. Evol., 8, 1–13, https://doi.org/10.3389/fevo.2020.00183, 2020. a
Benito, M. I. and Reolid, M.: Belemnite taphonomy (Upper Jurassic, Western Tethys) part II: Fossil–diagenetic analysis including combined petrographic and geochemical techniques, Palaeogeogr. Palaeocl., 358–360, 89–108, https://doi.org/10.1016/j.palaeo.2012.06.035, 2012. a
Benito, M. I., Reolid, M., and Viedma, C.: On the microstructure, growth pattern and original porosity of belemnite rostra: insights from calcitic Jurassic belemnites, J. Iber. Geol., 42, 201–226, https://doi.org/10.5209/rev_JIGE.2016.v42.n2.53232, 2016. a
Berling, L., Klawitter, J., Bouckaert, R., Xie, D., Gavryushkin, A., and Drummond, A. J.: A tractable tree distribution parameterized by clade probabilities and its application to Bayesian phylogenetic point estimation, PLoS Comput. Biol. 21, e1012789, https://doi.org/10.1371/journal.pcbi.1012789, 2025. a
Bernard, S., Daval, D., Ackerer, P., Pont, S., and Meibom, A.: Burial-induced oxygen-isotope re-equilibration of fossil foraminifera explains ocean paleotemperature paradoxes, Nat. Commun., 8, 1134, https://doi.org/10.1038/s41467-017-01225-9, 2017. a
Boscolo-Galazzo, F., Evans, D., Mawbey, E. M., Gray, W. R., Pearson, P. N., and Wade, B. S.: Exploring macroevolutionary links in multi-species planktonic foraminiferal and δ18O from 15 Ma to recent, Biogeosciences, 22, 1095–1113, https://doi.org/10.5194/bg-22-1095-2025, 2025. a, b
Boyle, P. R. and von Boletzky, S.: Cephalopod populations: definition and dynamics, Philos. T. Roy. Soc. Lond. B, 351, 985–1002, https://doi.org/10.1098/rstb.1996.0089, 1996. a
Christensen, W. K.: Upper Cretaceous belemnites from the Kristianstad area in Scania, no. no. 7 in Fossils and strata, Universitetsforlaget, Oslo, ISBN 978-82-00-09374-9, 1975. a
Christensen, W. K.: The Late Cretaceous belemnite family Belemnitellidae: Taxonomy and evolutionary history, Bull. Geol. Soc. Denmark, 44, 59–88, https://doi.org/10.37570/bgsd-1998-44-04, 1997. a
Combémorel, R.: Les Duvaliidae Pavlow (Belemnitida) du Crétacé inférieur français [The Duvaliidae Pavlow (Belemnitida) from the French Lower Cretaceous], Documents des Laboratoires de Géologie de la Faculté des Sciences de Lyon, Notes et Mémoires, 57, 131–186, 1973. a, b, c
Cuif, J.-P., Dauphin, Y., and Sorauf, J. E.: Biominerals and Fossils Through Time, Cambridge University Press, 1st edn., ISBN 978-0-521-87473-1 978-0-511-78107-0, https://doi.org/10.1017/CBO9780511781070, 2010. a
Dauphin, Y. and Cuif, J. P.: Implications systématiques de l'analyse microstructurale des rostres de trois genres d'Aulacocéridés triasiques (Cephalopoda – Coleoidea) [Systematic implications of the microstructural analysis of rostra of three genera of Triassic aulacoerids (Cephalopoda – Coleoidea)], Palaeontographica Abteilung A, 169, 28–50, 1980. a
Dera, G., Toumoulin, A., and De Baets, K.: Diversity and morphological evolution of Jurassic belemnites from South Germany, Palaeogeogr. Palaeocl., 457, 80–97, https://doi.org/10.1016/j.palaeo.2016.05.029, 2016. a
Doyle, P.: The British Toarcian (Lower Jurassic) belemnites – part 2, Monographs of the Palaeontographical Society, 145, 50–75, https://doi.org/10.1080/25761900.2022.12131770, 1991. a, b
Doyle, P.: Aspects of the distribution of Early Jurassic belemnites, Palaeopelagos Special Publication, 1, 109–120, 1994. a
Dray, S. and Dufour, A.-B.: The ade4 package: implementing the duality diagram for ecologists, J. Stat. Softw., 22, 1–20, https://doi.org/10.18637/jss.v022.i04, 2007. a
Dutton, A., Huber, B. T., Lohmann, K. C., and Zinsmeister, W. J.: High-resolution stable isotope profiles of a dimitobelid belemnite: implications for paleodepth habitat and late Maastrichtian climate seasonality, Palaios, 22, 642–650, https://doi.org/10.2110/palo.2005.p05-064r, 2007. a, b, c
Felsenstein, J.: Phylogenies and the comparative method, The American Naturalist, 125, 1–15, https://doi.org/10.1086/284325, 1985. a
Felsenstein, J.: Inferring Phylogenies, Oxford University Press, Oxford, New York, ISBN 978-0-87893-177-4, 2003. a
Gavryushkina, A., Welch, D., Stadler, T., and Drummond, A. J.: Bayesian inference of sampled ancestor trees for epidemiology and fossil calibration, PLoS Computational Biology, 10, e1003919, https://doi.org/10.1371/journal.pcbi.1003919, 2014. a
Gómez, J., Goy, A., and Canales, M.: Seawater temperature and carbon isotope variations in belemnites linked to mass extinction during the Toarcian (Early Jurassic) in Central and Northern Spain. Comparison with other European sections, Palaeogeogr. Palaeocl., 258, 28–58, https://doi.org/10.1016/j.palaeo.2007.11.005, 2008. a
Gradstein, F. M. and Ogg, J. G.: The Chronostratigraphic Scale, in: Geologic Time Scale 2020, vol. 1, edited by: Gradstein, F. M., Ogg, J. G., Schmitz, M. D., and Ogg, G. M., 21–32, Elsevier, ISBN 978-0-12-824360-2, https://doi.org/10.1016/B978-0-12-824360-2.00002-4, 2020. a
Gröcke, D. R. and Gillikin, D. P.: Advances in mollusc sclerochronology and sclerochemistry: tools for understanding climate and environment, Geo-Marine Lett., 28, 265–268, https://doi.org/10.1007/s00367-008-0108-4, 2008. a
Grossman, E. L., Mii, H.-S., Zhang, C., and Yancey, T. E.: Chemical variation in Pennsylvanian brachiopod shells – diagenetic, taxonomic, microstructural, and seasonal effects, J. Sediment. Res., 66, 1011–1022, https://doi.org/10.1306/D4268469-2B26-11D7-8648000102C1865D, 1996. a
Heath, T. A., Huelsenbeck, J. P., and Stadler, T.: The fossilized birth-death process for coherent calibration of divergence-time estimates, P. Natl. Acad. Sci. USA, 111, E2957–E2966, https://doi.org/10.1073/pnas.1319091111, 2014. a
Heled, J. and Bouckaert, R. R.: Looking for trees in the forest: Summary tree from posterior samples, BMC Evol. Biol., 13, 221, https://doi.org/10.1186/1471-2148-13-221, 2013. a
Hoffmann, R. and Stevens, K.: The palaeobiology of belemnites – foundation for the interpretation of rostrum geochemistry, Biol. Rev., 95, 94–123, https://doi.org/10.1111/brv.12557, 2020. a, b, c, d
Hoffmann, R., Richter, D., Neuser, R., Jöns, N., Linzmeier, B., Lemanis, R., Fusseis, F., Xiao, X., and Immenhauser, A.: Evidence for a composite organic–inorganic fabric of belemnite rostra: Implications for palaeoceanography and palaeoecology, Sediment. Geol., 341, 203–215, https://doi.org/10.1016/j.sedgeo.2016.06.001, 2016. a
Hoffmann, R., Linzmeier, B. J., Kitajima, K., Nehrke, G., Dietzel, M., Jöns, N., Stevens, K., and Immenhauser, A.: Complex biomineralization pathways of the belemnite rostrum cause biased paleotemperature estimates, Minerals, 11, 1406, https://doi.org/10.3390/min11121406, 2021. a, b
Hoffmann, R., Howarth, M. K., Fuchs, D., Klug, C., and Korn, D.: The higher taxonomic nomenclature of Devonian to Cretaceous ammonoids and Jurassic to Cretaceous ammonites including their authorship and publication, Neues Jahrbuch für Geologie und Paläontologie – Abhandlungen, 305, 187–197, https://doi.org/10.1127/njgpa/2022/1085, 2022. a
Höhna, S., Heath, T. A., Boussau, B., Landis, M. J., Ronquist, F., and Huelsenbeck, J. P.: Probabilistic Graphical Model Representation in Phylogenetics, Syst. Biol., 63, 753–771, https://doi.org/10.1093/sysbio/syu039, 2014. a
Höhna, S., Landis, M. J., Heath, T. A., Boussau, B., Lartillot, N., Moore, B. R., Huelsenbeck, J. P., and Ronquist, F.: RevBayes: Bayesian Phylogenetic Inference Using Graphical Models and an Interactive Model-Specification Language, Syst. Biol., 65, 726–736, https://doi.org/10.1093/sysbio/syw021, 2016. a, b
Iba, Y., Sano, S.-I., Mutterlose, J., and Kondo, Y.: Belemnites originated in the Triassic – A new look at an old group, Geology, 40, 911–914, https://doi.org/10.1130/G33402.1, 2012. a, b
Immenhauser, A.: On the delimitation of the carbonate burial realm, The Depositional Record, 8, 524–574, https://doi.org/10.1002/dep2.173, 2022. a, b, c
Immenhauser, A., Schöne, B. R., Hoffmann, R., and Niedermayr, A.: Mollusc and brachiopod skeletal hard parts: Intricate archives of their marine environment, Sedimentology, 63, 1–59, https://doi.org/10.1111/sed.12231, 2016. a, b, c, d, e, f, g, h
Janssen, N. M. M.: Mediterranean Neocomian belemnites, part 2: the Berriasian-Valanginian boundary in southeast Spain (Río Argos, Cañada Lengua and Tornajo), Scripta Geologica, 126, 121–183, 2003. a
Janssen, N. M. M. and Főzy, I.: Neocomian belemnites and ammonites from the Bersek-hegy (Gerecse Mountains, Hungary), part II: Barremian, Fragmenta Palaeontologica Hungarica, 23, 59–86, 2005. a
Jombart, T., Kendall, M., Almagro-Garcia, J., and Colijn, C.: treespace: Statistical exploration of landscapes of phylogenetic trees, Mol. Ecol. Resour., 17, 1385–1392, https://doi.org/10.1111/1755-0998.12676, 2017. a, b, c, d
Joy, J. B., Liang, R. H., McCloskey, R. M., Nguyen, T., and Poon, A. F. Y.: Ancestral reconstruction, PLOS Computational Biology, 12, e1004763, https://doi.org/10.1371/journal.pcbi.1004763, 2016. a
Kendall, M. and Colijn, C.: Mapping phylogenetic trees to reveal distinct patterns of evolution, Mol. Biol. Evol., 33, 2735–2743, https://doi.org/10.1093/molbev/msw124, 2016. a
Lange, S. M., Krause, S., Ritter, A.-C., Fichtner, V., Immenhauser, A., Strauss, H., and Treude, T.: Anaerobic microbial activity affects earliest diagenetic pathways of bivalve shells, Sedimentology, 65, 1390–1411, https://doi.org/10.1111/sed.12428, 2018. a
Lewis, P. O.: A likelihood approach to estimating phylogeny from discrete morphological character data, Syst. Biol., 50, 913–925, https://doi.org/10.1080/106351501753462876, 2001. a
Li, Q., McArthur, J., and Atkinson, T.: Lower Jurassic belemnites as indicators of palaeo-temperature, Palaeogeogr. Palaeocl., 315–316, 38–45, https://doi.org/10.1016/j.palaeo.2011.11.006, 2012. a, b
Li, Q., McArthur, J., Doyle, P., Janssen, N., Leng, M., Müller, W., and Reboulet, S.: Evaluating Mg/Ca in belemnite calcite as a palaeo-proxy, Palaeogeogr. Palaeocl., 388, 98–108, https://doi.org/10.1016/j.palaeo.2013.07.030, 2013. a, b, c, d, e, f, g, h, i
Liscovitch-Brauer, N., Alon, S., Porath, H. T., Elstein, B., Unger, R., Ziv, T., Admon, A., Levanon, E. Y., Rosenthal, J. J., and Eisenberg, E.: Trade-off between transcriptome plasticity and genome evolution in cephalopods, Cell, 169, 191–202.e11, https://doi.org/10.1016/j.cell.2017.03.025, 2017. a
Lister, A. M.: Phenotypic plasticity in the fossil record, in: Phenotypic plasticity & evolution, 267–297, CRC Press, https://doi.org/10.1201/9780429343001, 2021. a
Lowenstam, H. A. and Epstein, S.: Paleotemperatures of the post-Aptian Cretaceous as determined by the oxygen isotope method, J. Geol., 62, 207–248, https://doi.org/10.1086/626160, 1954. a
Lupše, N., Reid, A., Taite, M., Kubodera, T., and Allcock, A. L.: Cuttlefishes (Cephalopoda, Sepiidae): the bare bones – an hypothesis of relationships, Marine Biol., 170, 93, https://doi.org/10.1007/s00227-023-04195-3, 2023. a
Ma, Z., Zhang, T., Chen, J., Popa, M. E., Li, H., Li, S., Zeng, J., and Zhang, X.: The earliest belemnite linked with the Carnian Pluvial Episode, Front. Ecol. Evol., 11, 1236222, https://doi.org/10.3389/fevo.2023.1236222, 2023. a
Malkoč, M., Mutterlose, J., and Pauly, S.: Timing of the Early Aptian δ13C excursion in the Boreal Realm, Newsletters on Stratigraphy, 43, 251–273, https://doi.org/10.1127/0078-0421/2010/0043-0251, 2010. a
Mariotti, N., Pignatti, J. S., and Riegraf, W.: Part M, Chapter 23B: Systematic descriptions: Aulacoceratida, Treatise Online, 148, 1–18, https://doi.org/10.17161/to.vi.15255, 2021. a
McArthur, J., Mutterlose, J., Price, G., Rawson, P., Ruffell, A., and Thirlwall, M.: Belemnites of Valanginian, Hauterivian and Barremian age: Sr-isotope stratigraphy, composition (87Sr/86Sr, δ13C, δ18O, Na, Sr, Mg), and palaeo-oceanography, Palaeogeogr. Palaeocl., 202, 253–272, https://doi.org/10.1016/S0031-0182(03)00638-2, 2004. a, b, c, d
McArthur, J., Janssen, N., Reboulet, S., Leng, M., Thirlwall, M., and Van De Schootbrugge, B.: Palaeotemperatures, polar ice-volume, and isotope stratigraphy (, δ18O, δ13C, 87Sr 86Sr): The Early Cretaceous (Berriasian, Valanginian, Hauterivian), Palaeogeogr. Palaeocl., 248, 391–430, https://doi.org/10.1016/j.palaeo.2006.12.015, 2007. a, b, c, d, e, f, g
Mueller, M., Walter, B., Giebel, R., Beranoaguirre, A., Swart, P., Lu, C., Riechelmann, S., and Immenhauser, A.: Towards a better understanding of the geochemical proxy record of complex carbonate archives, Geochim. Cosmochim. Ac., 376, 68–99, https://doi.org/10.1016/j.gca.2024.04.029, 2024. a, b
Mutterlose, J.: Phylogenie und Biostratigraphie der Unterfamilie Oxyteuthinae (Belemnitida) aus dem Barreme (Unter-Kreide) NW-Europas [Phylogeny and biostratigraphy of the subfamily Oxyteuthinae (Belemnitida) from the Barremian (Lower Cretaceous) of NW Europe], Palaeontographica Abteilung A, 180, 1–90, 1983. a, b
Mutterlose, J. and Baraboshkin, E. J.: Taxonomy of the Early Cretaceous belemnite species Aulacoteuthis absolutiformis (Sinzow, 1877) and its type status, Berliner paläobiologische Abhandlungen, 3, 179–187, 2003. a
Mutterlose, J., Malkoc, M., Schouten, S., Sinninghe Damsté, J. S., and Forster, A.: TEX86 and stable δ18O paleothermometry of early Cretaceous sediments: Implications for belemnite ecology and paleotemperature proxy application, Earth Planet. Sc. Lett., 298, 286–298, https://doi.org/10.1016/j.epsl.2010.07.043, 2010. a
Niebuhr, B. and Joachimski, M. M.: Stable isotope and trace element geochemistry of Upper Cretaceous carbonates and belemnite rostra (Middle Campanian, north Germany), Geobios, 35, 51–64, https://doi.org/10.1016/S0016-6995(02)00009-8, 2002. a
Niko, S. and Ehiro, M.: Tohokubelus gen. nov., the oldest belemnite from the Olenekian (Lower Triassic) of Northeast Japan, Paleontol. Res., 26, 115–123, https://doi.org/10.2517/PR200036, 2022. a
O'Reilly, J. E. and Donoghue, P. C. J.: The efficacy of consensus tree methods for summarizing phylogenetic relationships from a posterior sample of trees estimated from morphological data, Syst. Biol., 67, 354–362, https://doi.org/10.1093/sysbio/syx086, 2018. a, b
Paradis, E. and Schliep, K.: ape 5.0: an environment for modern phylogenetics and evolutionary analyses in R, Bioinformatics, 35, 526–528, https://doi.org/10.1093/bioinformatics/bty633, 2019. a
Pirrie, D., Marshall, J., Doyle, P., and Riccardi, A.: Cool early Albian climates; new data from Argentina, Cretaceous Res., 25, 27–33, https://doi.org/10.1016/j.cretres.2003.10.002, 2004. a
Piwoni-Piórewicz, A., Liow, L. H., Krzemińska, M., Chełchowski, M., Iglikowska, A., Ronco, F., Mazurkiewicz, M., Smith, A. M., Gordon, D. P., Waeschenbach, A., Najorka, J., Figuerola, B., Boonzaaier-Davids, M. K., Achilleos, K., Mello, H., Florence, W. K., Vieira, L. M., Ostrovsky, A. N., Shunatova, N., Porter, J. S., Sokolover, N., Cumming, R. L., Novosel, M., O'Dea, A., Lombardi, C., Jain, S. S., Huang, D., and Kukliński, P.: Skeletal mineralogy of marine calcifying organisms shaped by seawater temperature and evolutionary history – A case study of cheilostome bryozoans, Global Ecol. Biogeogr., 33, e13874, https://doi.org/10.1111/geb.13874, 2024. a
Pohle, A., Stevens, K., Hoffmann, R., and Immenhauser, A.: Supplementary material: Phylogeochemistry: exploring evolutionary constraints on belemnite rostrum element composition, Zenodo [data set], https://doi.org/10.5281/zenodo.14004248, 2024. a, b
Price, G. and Mutterlose, J.: Isotopic signals from late Jurassic–early Cretaceous (Volgian–Valanginian) sub-Arctic belemnites, Yatria River, Western Siberia, J. Geol. Soc. London, 161, 959–968, https://doi.org/10.1144/0016-764903-169, 2004. a, b
Price, G., Wilkinson, D., Hart, M., Page, K., and Grimes, S.: Isotopic analysis of coexisting Late Jurassic fish otoliths and molluscs: Implications for upper-ocean water temperature estimates, Geology, 37, 215–218, https://doi.org/10.1130/G25377A.1, 2009. a
Price, G., Főzy, I., Janssen, N., and Pálfy, J.: Late Valanginian–Barremian (Early Cretaceous) palaeotemperatures inferred from belemnite stable isotope and Mg/Ca ratios from Bersek Quarry (Gerecse Mountains, Transdanubian Range, Hungary), Palaeogeogr. Palaeocl., 305, 1–9, https://doi.org/10.1016/j.palaeo.2011.02.007, 2011. a, b, c, d
Price, G., Williamson, T., Henderson, R., and Gagan, M.: Barremian–Cenomanian palaeotemperatures for Australian seas based on new oxygen-isotope data from belemnite rostra, Palaeogeogr. Palaeocl., 358–360, 27–39, https://doi.org/10.1016/j.palaeo.2012.07.015, 2012. a
R Core Team: R: A Language and Environment for Statistical Computing, R Foundation for Statistical Computing, https://www.r-project.org/ (last access: 23 June 2025), 2018. a
Rambaut, A., Drummond, A. J., Xie, D., Baele, G., and Suchard, M. A.: Posterior Summarization in Bayesian Phylogenetics Using Tracer 1.7, Syst. Biol., 67, 901–904, https://doi.org/10.1093/sysbio/syy032, 2018. a, b
Revell, L. J.: phytools 2.0: an updated R ecosystem for phylogenetic comparative methods (and other things), PeerJ, 12, e16505, https://doi.org/10.7717/peerj.16505, 2024. a
Robinson, D. F. and Foulds, L. R.: Comparison of weighted labelled trees, in: Combinatorial Mathematics VI, edited by Horadam, A. F. and Wallis, W. D., vol. 748, pp. 119–126, Springer, Berlin, Heidelberg, ISBN 978-3-540-09555-2 978-3-540-34857-3, https://doi.org/10.1007/BFb0102690, 1979. a
Robinson, D. F. and Foulds, L. R.: Comparison of phylogenetic trees, Math. Biosci., 53, 131–147, https://doi.org/10.1016/0025-5564(81)90043-2, 1981. a
Rosales, I., Quesada, S., and Robles, S.: Paleotemperature variations of Early Jurassic seawater recorded in geochemical trends of belemnites from the Basque–Cantabrian basin, northern Spain, Palaeogeogr. Palaeocl., 203, 253–275, https://doi.org/10.1016/S0031-0182(03)00686-2, 2004. a, b
Sachs, V. N. and Nal'nyaeva, T. I.: Verkhneyurskie i nizhnemelovye belemnity severa SSSR: rody Cylindroteuthis i Lagonibelus [Upper Jurassic and Lower Cretaceous belemnites from the northern USSR: genera Cylindroteuthis and Lagonibelus], Izdatelstvo Akademiya Nauk SSSR, Moscow, 1964. a
Sachs, V. N. and Nal'nyaeva, T. I.: Verkhneyurskie i nizhnemelovye belemnity severa SSSR: rody Pachyteuthis i Acroteuthis [Upper Jurassic and Lower Cretaceous belemnites from the northern USSR: genera Pachyteuthis and Acroteuthis], Izdatelstvo Akademiya Nauk SSSR, Moscow, 1966. a
Saelen, G.: Diagenesis and construction of the belemnite rostrum, Palaeontology, 32, 765–798, 1989. a, b
Schlegelmilch, R.: Die Belemniten des süddeutschen Jura [The belemnites of the South German Jurassic], Gustav Fischer Verlag, Stuttgart, ISBN 978-3-8274-3082-3 978-3-8274-3083-0, https://doi.org/10.1007/978-3-8274-3083-0, 1998. a, b, c, d, e, f
Schöne, B. R.: The curse of physiology – challenges and opportunities in the interpretation of geochemical data from mollusk shells, Geo-Marine Lett., 28, 269–285, https://doi.org/10.1007/s00367-008-0114-6, 2008. a
Sereno, P. C.: Logical basis for morphological characters in phylogenetics, Cladistics, 23, 565–587, https://doi.org/10.1111/j.1096-0031.2007.00161.x, 2007. a
Shirley, B., Leonhard, I., Murdock, D. J. E., Repetski, J., Świś, P., Bestmann, M., Trimby, P., Ohl, M., Plümper, O., King, H. E., and Jarochowska, E.: Increasing control over biomineralization in conodont evolution, Nat. Commun., 15, 5273, https://doi.org/10.1038/s41467-024-49526-0, 2024. a
Slater, C., Preston, T., and Weaver, L. T.: Stable isotopes and the international system of units, Rapid Commun. Mass Sp., 15, 1270–1273, https://doi.org/10.1002/rcm.328, 2001. a
Smith, M. R.: Quartet: comparison of phylogenetic trees using quartet and split measures. R package version 1.2.2, Zenodo [code], https://doi.org/10.5281/zenodo.2536318, 2019. a
Smith, M. R.: Information theoretic generalized Robinson–Foulds metrics for comparing phylogenetic trees, Bioinformatics, 36, 5007–5013, https://doi.org/10.1093/bioinformatics/btaa614, 2020. a
Smith, M. R.: Robust analysis of phylogenetic tree space, Syst. Biol., 71, 1255–1270, https://doi.org/10.1093/sysbio/syab100, 2022. a
Sørensen, A. M., Ullmann, C. V., Thibault, N., and Korte, C.: Geochemical signatures of the early Campanian belemnite Belemnellocamax mammillatus from the Kristianstad Basin in Scania, Sweden, Palaeogeogr. Palaeocl., 433, 191–200, https://doi.org/10.1016/j.palaeo.2015.05.025, 2015. a, b, c, d, e
Spaeth, C.: Aragonitische und calcitische Primärstrukturen im Schalenbau eines Belemniten aus der englischen Unterkreide [Aragonitic and calcitic primary structures in the shell construction of a belemnite from the English Lower Cretaceous], Paläont. Z., 45, 33–40, 1971. a, b
Spaeth, C., Hoefs, J., and Vetter, U.: Some aspects of isotopic composition of belemnites and related paleotemperatures, Geol. Soc. Am. B., 82, 3139, https://doi.org/10.1130/0016-7606(1971)82[3139:SAOICO]2.0.CO;2, 1971. a
Stadler, T.: Sampling-through-time in birth–death trees, J. Theor. Biol., 267, 396–404, https://doi.org/10.1016/j.jtbi.2010.09.010, 2010. a
Stevens, K., Mutterlose, J., and Schweigert, G.: Belemnite ecology and the environment of the Nusplingen Plattenkalk (Late Jurassic, southern Germany): evidence from stable isotope data, Lethaia, 47, 512–523, https://doi.org/10.1111/let.12076, 2014. a, b
Stevens, K., Griesshaber, E., Schmahl, W., Casella, L. A., Iba, Y., and Mutterlose, J.: Belemnite biomineralization, development, and geochemistry: The complex rostrum of Neohibolites minimus, Palaeogeogr. Palaeocl., 468, 388–402, https://doi.org/10.1016/j.palaeo.2016.12.022, 2017. a, b, c, d, e, f
Stevens, K., Mutterlose, J., Ohnemus, B., Idakieva, V., and Ivanov, M.: Microstructures of Early Cretaceous belemnite rostra and their diagenesis, Cretaceous Res., 137, 105259, https://doi.org/10.1016/j.cretres.2022.105259, 2022. a, b, c, d, e, f, g, h, i, j, k, l
Stevens, K., Pohle, A., Hoffmann, R., and Immenhauser, A.: Bayesian inference reveals a complex evolutionary history of belemnites, Palaeontol. Electron., 26, a13, https://doi.org/10.26879/1239, 2023. a, b, c, d, e, f, g, h, i, j, k, l
Stolley, E.: Studien an den Belemniten der unteren Kreide Norddeutschlands [Studies on the belemnites of the Lower Cretaceous of northern Germany], Jahresberichte des Niedersächsischen geologischen Vereins, 4, 174–189, 1911. a
Swart, P. K.: The geochemistry of carbonate diagenesis: The past, present and future, Sedimentology, 62, 1233–1304, https://doi.org/10.1111/sed.12205, 2015. a
Ullmann, C., Frei, R., Korte, C., and Hesselbo, S.: Chemical and isotopic architecture of the belemnite rostrum, Geochim. Cosmochim. Ac., 159, 231–243, https://doi.org/10.1016/j.gca.2015.03.034, 2015. a, b, c, d, e, f, g, h, i, j, k, l
Ullmann, C., Frei, R., Korte, C., and Lüter, C.: Element/Ca, C and O isotope ratios in modern brachiopods: Species-specific signals of biomineralization, Chem. Geol., 460, 15–24, https://doi.org/10.1016/j.chemgeo.2017.03.034, 2017. a
Ullmann, C. V. and Korte, C.: Diagenetic alteration in low-Mg calcite from macrofossils: a review, Geol. Q., 59, 3–20, https://doi.org/10.7306/gq.1217, 2015. a, b
Ullmann, C. V. and Pogge von Strandmann, P. A. E.: The effect of shell secretion rate on and ratios in biogenic calcite as observed in a belemnite rostrum, Biogeosciences, 14, 89–97, https://doi.org/10.5194/bg-14-89-2017, 2017. a, b, c, d, e, f, g, h
Ullmann, C. V., Campbell, H. J., Frei, R., Hesselbo, S. P., Pogge von Strandmann, P. A., and Korte, C.: Partial diagenetic overprint of Late Jurassic belemnites from New Zealand: Implications for the preservation potential of δ7Li values in calcite fossils, Geochim. Cosmochim. Ac., 120, 80–96, https://doi.org/10.1016/j.gca.2013.06.029, 2013. a, b, c, d
Ullmann, C. V., Thibault, N., Ruhl, M., Hesselbo, S. P., and Korte, C.: Effect of a Jurassic oceanic anoxic event on belemnite ecology and evolution, P. Natl. Acad. Sci. USA, 111, 10073–10076, https://doi.org/10.1073/pnas.1320156111, 2014. a, b, c, d, e, f
Ulrich, R. N., Guillermic, M., Campbell, J., Hakim, A., Han, R., Singh, S., Stewart, J. D., Román-Palacios, C., Carroll, H. M., De Corte, I., Gilmore, R. E., Doss, W., Tripati, A., Ries, J. B., and Eagle, R. A.: Patterns of element incorporation in calcium carbonate biominerals recapitulate phylogeny for a diverse range of marine calcifiers, Front. Earth Sci., 9, 641760, https://doi.org/10.3389/feart.2021.641760, 2021. a
Urey, H. C.: Oxygen isotopes in nature and in the laboratory, Science, 108, 489–496, https://doi.org/10.1126/science.108.2810.489, 1948. a
Urey, H. C., Lowenstam, H. A., Epstein, S., and McKinney, C. R.: Measurement of paleotemperatures and temperatures of the Upper Cretaceous of England, Denmark, and the southeastern United States, Geol. Soc. Am. B., 62, 399, https://doi.org/10.1130/0016-7606(1951)62[399:MOPATO]2.0.CO;2, 1951. a
van de Schootbrugge, B., Föllmi, K. B., Bulot, L. G., and Burns, S. J.: Paleoceanographic changes during the early Cretaceous (Valanginian–Hauterivian): evidence from oxygen and carbon stable isotopes, Earth Planet. Sc. Lett., 181, 15–31, https://doi.org/10.1016/S0012-821X(00)00194-1, 2000. a, b, c
Veizer, J.: Chemical diagenesis of belemnite shells and possible consequences for paleotemperature determinations, Neues Jahrbuch für Geologie und Paläontologie, Abhandlungen, 147, 91–111, 1974. a, b, c
Veizer, J.: Chemical diagenesis of carbonates: Theory and trace element technique, 3-1–3-100, no. 10, in: SEPM Short Courses, SEPM (Society for Sedimentary Geology), Dallas, ISBN 978-1-56576-239-8, https://doi.org/10.2110/scn.83.10, 1983. a, b
Vickers, M. L., Bernasconi, S. M., Ullmann, C. V., Lode, S., Looser, N., Morales, L. G., Price, G. D., Wilby, P. R., Hougård, I. W., Hesselbo, S. P., and Korte, C.: Marine temperatures underestimated for past greenhouse climate, Sci. Rep., 11, 19109, https://doi.org/10.1038/s41598-021-98528-1, 2021. a
Vonhof, H., Jagt, J., Immenhauser, A., Smit, J., Van Den Berg, Y., Saher, M., Keutgen, N., and Reijmer, J.: Belemnite-based strontium, carbon and oxygen isotope stratigraphy of the type area of the Maastrichtian Stage, Netherlands J. Geosci., 90, 259–270, https://doi.org/10.1017/S0016774600001141, 2011. a
Ward, J. H.: Hierarchical grouping to optimize an objective function, J. Am. Stat. A., 58, 236–244, https://doi.org/10.1080/01621459.1963.10500845, 1963. a
Wierzbowski, H.: Carbon and oxygen isotope composition of Oxfordian–Early Kimmeridgian belemnite rostra: palaeoenvironmental implications for Late Jurassic seas, Palaeogeogr. Palaeocl., 203, 153–168, https://doi.org/10.1016/S0031-0182(03)00673-4, 2004. a
Wierzbowski, H. and Joachimski, M. M.: Reconstruction of late Bajocian–Bathonian marine palaeoenvironments using carbon and oxygen isotope ratios of calcareous fossils from the Polish Jura Chain (central Poland), Palaeogeogr. Palaeocl., 254, 523–540, https://doi.org/10.1016/j.palaeo.2007.07.010, 2007. a, b, c
Wierzbowski, H. and Joachimski, M. M.: Stable isotopes, elemental distribution, and growth rings of belemnopsid belemnite rostra: proxies for belemnite life habitat, Palaios, 24, 377–386, https://doi.org/10.2110/palo.2008.p08-101r, 2009. a, b
Wierzbowski, H. and Rogov, M.: Reconstructing the palaeoenvironment of the Middle Russian Sea during the Middle–Late Jurassic transition using stable isotope ratios of cephalopod shells and variations in faunal assemblages, Palaeogeogr. Palaeocl., 299, 250–264, https://doi.org/10.1016/j.palaeo.2010.11.006, 2011. a, b, c
Williamson, T.: Systematics and biostratigraphy of Australian Early Cretaceous belemnites with contributions to the timescale and palaeoenvironmental assessment of the Australian Early Cretaceous System derived from stable isotope proxies, Doctoral thesis, James Cook University, Australia, https://researchonline.jcu.edu.au/4906/ (last access: 23 June 2025), 2006. a
Wright, A. M.: A systematist's guide to estimating Bayesian phylogenies from morphological data, Insect Systematics and Diversity, 3, 2, https://doi.org/10.1093/isd/ixz006, 2019. a, b, c
Wright, A. M., Bapst, D. W., Barido-Sottani, J., and Warnock, R. C.: Integrating fossil observations into phylogenetics using the fossilized birth–death model, Annu. Rev. Ecol. Syst., 53, 251–273, https://doi.org/10.1146/annurev-ecolsys-102220-030855, 2022. a, b
Zhu, K.-Y. and Bian, Z.-X.: Sinobelemnitidae, a new family of Belemnitida from the Upper Triassic of Longmenshan, Sichuan, Acta Palaeontologica Sinica, 23, 300–317, 1984. a