the Creative Commons Attribution 4.0 License.
the Creative Commons Attribution 4.0 License.
 | 02 Jul 2025
Mismatch between coccolithophore-based estimates of particulate inorganic carbon (PIC) concentration and satellite-derived PIC concentration in the Pacific Southern Ocean
Mariem Saavedra-Pellitero
Karl-Heinz Baumann
Nuria Bachiller-Jareno
Harold Lovell
Nele Manon Vollmar
Elisa Malinverno
Coccolithophores are the main type of calcifying phytoplankton in the Southern Ocean (SO) and are key organisms in the production of particulate inorganic carbon (PIC). However, in situ studies of coccolithophores and in particular of their importance for the input of PIC in the SO are sparse in space and time due to the harsh weather conditions in the subantarctic realm. An alternative tool for monitoring PIC is the use of optical remote sensing, as coccolithophores account for most of the optical PIC backscattering in the sea. The aim of the present study is to provide coccolithophore-based estimates of PIC derived from Scanning Electron Microscope coccolith morphometric analyses and MODIS Aqua Level-2 and Level-3 PIC concentration values along two latitudinal transects from New Zealand to Antarctica and across the Drake Passage. In general, the coccolith-estimated PIC and satellite-derived PIC datasets show comparable trends in the Subantarctic and Polar Frontal zones of both transects, with coccolith-derived PIC values being generally lower than satellite PIC values. According to the coccolithophorid data, Emiliania huxleyi type A, over-calcified type A, and other taxa (e.g., Calcidiscus leptoporus) only contribute to coccolithophore PIC in the northernmost sampling locations, whereas E. huxleyi morphogroup B contributes substantially to the PIC content south of the Subantarctic Front in both transects. High satellite-derived PIC concentrations south of the Polar Front are not apparent in the coccolith-based PIC data. We suggest that the high reflectance signal in the Antarctic Zone may instead relate to the presence of small biogenic opal particles (e.g., diatoms, silicoflagellates, and/or small siliceous plankton) or other unknown highly reflective particles (such as Phaeocystis aggregations). Our results highlight the challenges presented by the lack of reliable satellite data in some parts of the SO as well as the importance of in situ measurements and methodological accuracy when estimating PIC values.
- Article
(9827 KB) - Full-text XML
-
Supplement
(1679 KB) - BibTeX
- EndNote


Coccolithophores are a major component of calcifying phytoplankton communities in the Southern Ocean (SO) (e.g., Saavedra-Pellitero et al., 2014, 2019; Malinverno et al., 2015; Charalampopoulou et al., 2016; Rigual Hernández et al., 2020a) and play an important and complex role in the carbon cycle through the production of particulate inorganic carbon (PIC) and particulate organic carbon (POC) (e.g., Rost and Riebesell, 2004; Salter et al., 2014). These haptophyte algae produce an external covering (coccosphere) of interlocking calcite platelets (coccoliths). Coccolith calcification decreases the alkalinity of surface waters, thereby reducing the uptake of CO2 from the atmosphere into the surface ocean and acting in opposition to photosynthetic carbon fixation (Rost and Riebesell, 2004). Furthermore, coccolithophores influence the export of PIC and POC into the deep ocean through the ballasting effects of their coccoliths in the deep sea (e.g., Klaas and Archer, 2002). Previous work has suggested that calcification during blooms of the coccolithophore Emiliania huxleyi, also known as Gephyrocapsa huxleyi (Bendif et al., 2023), might alter the air–sea flux of CO2 (e.g., Harlay et al., 2010; Shutler et al., 2013), although, to date, the impact of this has mostly only been explored on a limited regional basis (e.g., Holligan et al., 1993; Robertson et al., 1994; Balch et al., 2016).
Since the early days of satellite-based color measurements of the oceans, large coccolithophore blooms have been visible as highly reflective regions in satellite images (e.g., Holligan et al., 1983). Coccolithophores and their detached coccoliths are strongly optically active in the entire visible spectrum (400–700 nm) and notably affect the optical budget of the surface ocean; they can thus be seen from space using satellite remote sensing (Smyth et al., 2002; Tyrrell and Taylor, 1996). Coccolithophores are responsible for most of the optical PIC backscatter in the ocean; the other, larger PIC particles associated with foraminifera and pteropods provide negligible backscatter per unit mass and therefore have minimal optical impact (Balch et al., 1996). In general, detached coccoliths account for 10 %–20 % of the total light backscattered from the sea under non-bloom conditions, whereas under bloom conditions this can be more than 90 % (Balch et al., 1991, 1999). Gordon et al. (2001) and Balch et al. (2005) developed algorithms to estimate the PIC concentration in the surface layer of the water column from the radiance emanating from the water. The relationship between inherent optical properties and the resultant light fields is understood well (e.g., Mitchell et al., 2017). The difficulty lies in understanding the combined effects of different in-water constituents on the inherent optical properties and ultimately the underwater light fields. While there have been many advances in this area (e.g., Babin et al., 2003a, 2003b; Devred et al., 2006), there will always be some uncertainty when calculating these relationships. For example, it has been shown that satellite ocean-color-based PIC estimates did not match (ship-based) in situ observations and that satellite-derived PIC can be overestimated in Antarctic waters (e.g., Holligan et al., 2010; Trull et al., 2018). One potential source of error is that aquamarine waters characterized by high reflectance of light can also be caused by suspended sediment and even opal particles, such as fragments of diatom frustules (e.g., Broerse et al., 2003).
The band of high reflectance and elevated PIC waters observed in the SO between 30 and 60° S during austral summer, known as “the Great Calcite Belt”, has been linked to a region of increased seasonal abundance of coccolithophores (Balch et al., 2011, 2016). Comparisons of in situ and remote sensing measurements of PIC have been undertaken in different sectors of the SO (mostly the Atlantic and Indian sectors) for coccolithophore bloom conditions (e.g., Holligan et al., 2010; Poulton et al., 2011; Balch et al., 2014, 2016; Oliver et al., 2023). However, this type of comparison is very limited in specific areas of the globe (such as the vast Pacific sector of the SO) and also under non-bloom coccolithophore conditions (e.g., Oliver et al., 2023). This is partly due to the fact that available coccolithophore measurements are sparse in space and time in the SO. Many of the subpolar studies focus on coccospheres, whilst there are scarce data on free coccoliths (Mohan et al., 2008).
Recent concerns about climate change have motivated the scientific community to focus on E. huxleyi as a target cosmopolitan species and in particular to divide it into different morphotypes (e.g., Young et al., 2003), which are included in two main morphogroups, A and B (Young et al., 2023). The high-latitude distribution of E. huxleyi has undergone a recent poleward expansion in both the Northern Hemisphere (Rivero-Calle et al., 2015) and the Southern Hemisphere (Cubillos et al., 2007; Winter et al., 2014). The subpolar realm is characterized by more calcified coccoliths north of the Subantarctic Front (SAF) and more weakly calcified placoliths southwards (Cubillos et al., 2007). Significant zonal differences are shown in the relationship between coccolithophore data and Antarctic Circumpolar Current (ACC) frontal positions across the different sectors of the SO (e.g., Saavedra-Pellitero et al., 2014), but no strong evidence of recent expansion on a circumpolar scale has been identified (Malinverno et al., 2015). Several estimates of coccolith PIC exist, e.g., estimation of coccolith mass from coccolith volume calculated from coccolith size (Young and Ziveri, 2000; Beuvier et al., 2019) using polarizing light microscopy (Beaufort, 2005; Bollmann, 2014; Fuertes et al., 2014) or the Coulter multisizer (i.e., electric field disturbance; Valença et al., 2024).
Here, we focus on the contributions of E. huxleyi and other coccolithophore taxa to sea surface PIC along two latitudinal transects across the ACC fronts: a New Zealand transect (sampled during December 2004–January 2005) and a Drake Passage transect (sampled during February–March 2016). Coccosphere concentrations in the New Zealand transect were below 1.4×10⁵ cells per liter, and in the Drake Passage transect they were below 1.5×10⁵ cells per liter (Malinverno et al., 2015; Saavedra-Pellitero et al., 2019), corresponding to non-bloom to moderate-bloom conditions (Poulton et al., 2011). Our aims are (1) to evaluate the contributions of different coccolithophore taxa and E. huxleyi morphotypes to coccolith morphometric-based PIC estimates and (2) to compare coccolith-derived PIC values with satellite-derived PIC values in the Pacific SO.
The SO is a high-nutrient, low-chlorophyll area in the Southern Hemisphere (e.g., de Baar et al., 1995) that connects all the main oceans through the strong and eastward-flowing ACC. In the SO, there are a number of oceanographic fronts characterized by increased horizontal transport and rapid changes in water properties (Orsi et al., 1995; Klinck and Nowlin, 2001). The ACC is bounded by the Subtropical Front (STF) in the north, which separates it from the warmer and saltier waters of the subtropics, and its southern edge is marked by the Southern Boundary, which separates it from subpolar cold, silicate-rich waters (Orsi et al., 1995). The ACC flow is mostly driven by westerly winds. The position of the fronts varies seasonally as well as spatially, being controlled by steep topographic features such as oceanic plateaus or ridges (Gordon et al., 1978). South of the STF, the SAF separates the Subantarctic Zone (SAZ) and the Polar Frontal Zone (PFZ) (Fig. 1). The location of the SAF is indicated by a strong thermal gradient and the rapid northward sinking of a salinity (S) minimum associated with the Antarctic Intermediate Water from the surface in the PFZ (S<34) to depths greater than 300 m in the SAZ (S<34.20) (Orsi et al., 1995; Whitworth, 1980). South of the SAF, the prominent Polar Front (PF) separates the PFZ and the Antarctic Zone (AZ). The PF represents the northernmost extent of the 2 °C isotherm at 200 m depth and corresponds to a 2 °C gradient in sea surface temperature (Orsi et al., 1995). The southern ACC Front is characterized by temperatures below 0 °C at the minimum temperature in the subsurface (<150 m) and above 1.8 °C at the maximum temperature at depths > 500 m (Orsi et al., 1995). A more detailed description of the property indicators at each SO front can be found in Orsi et al. (1995).
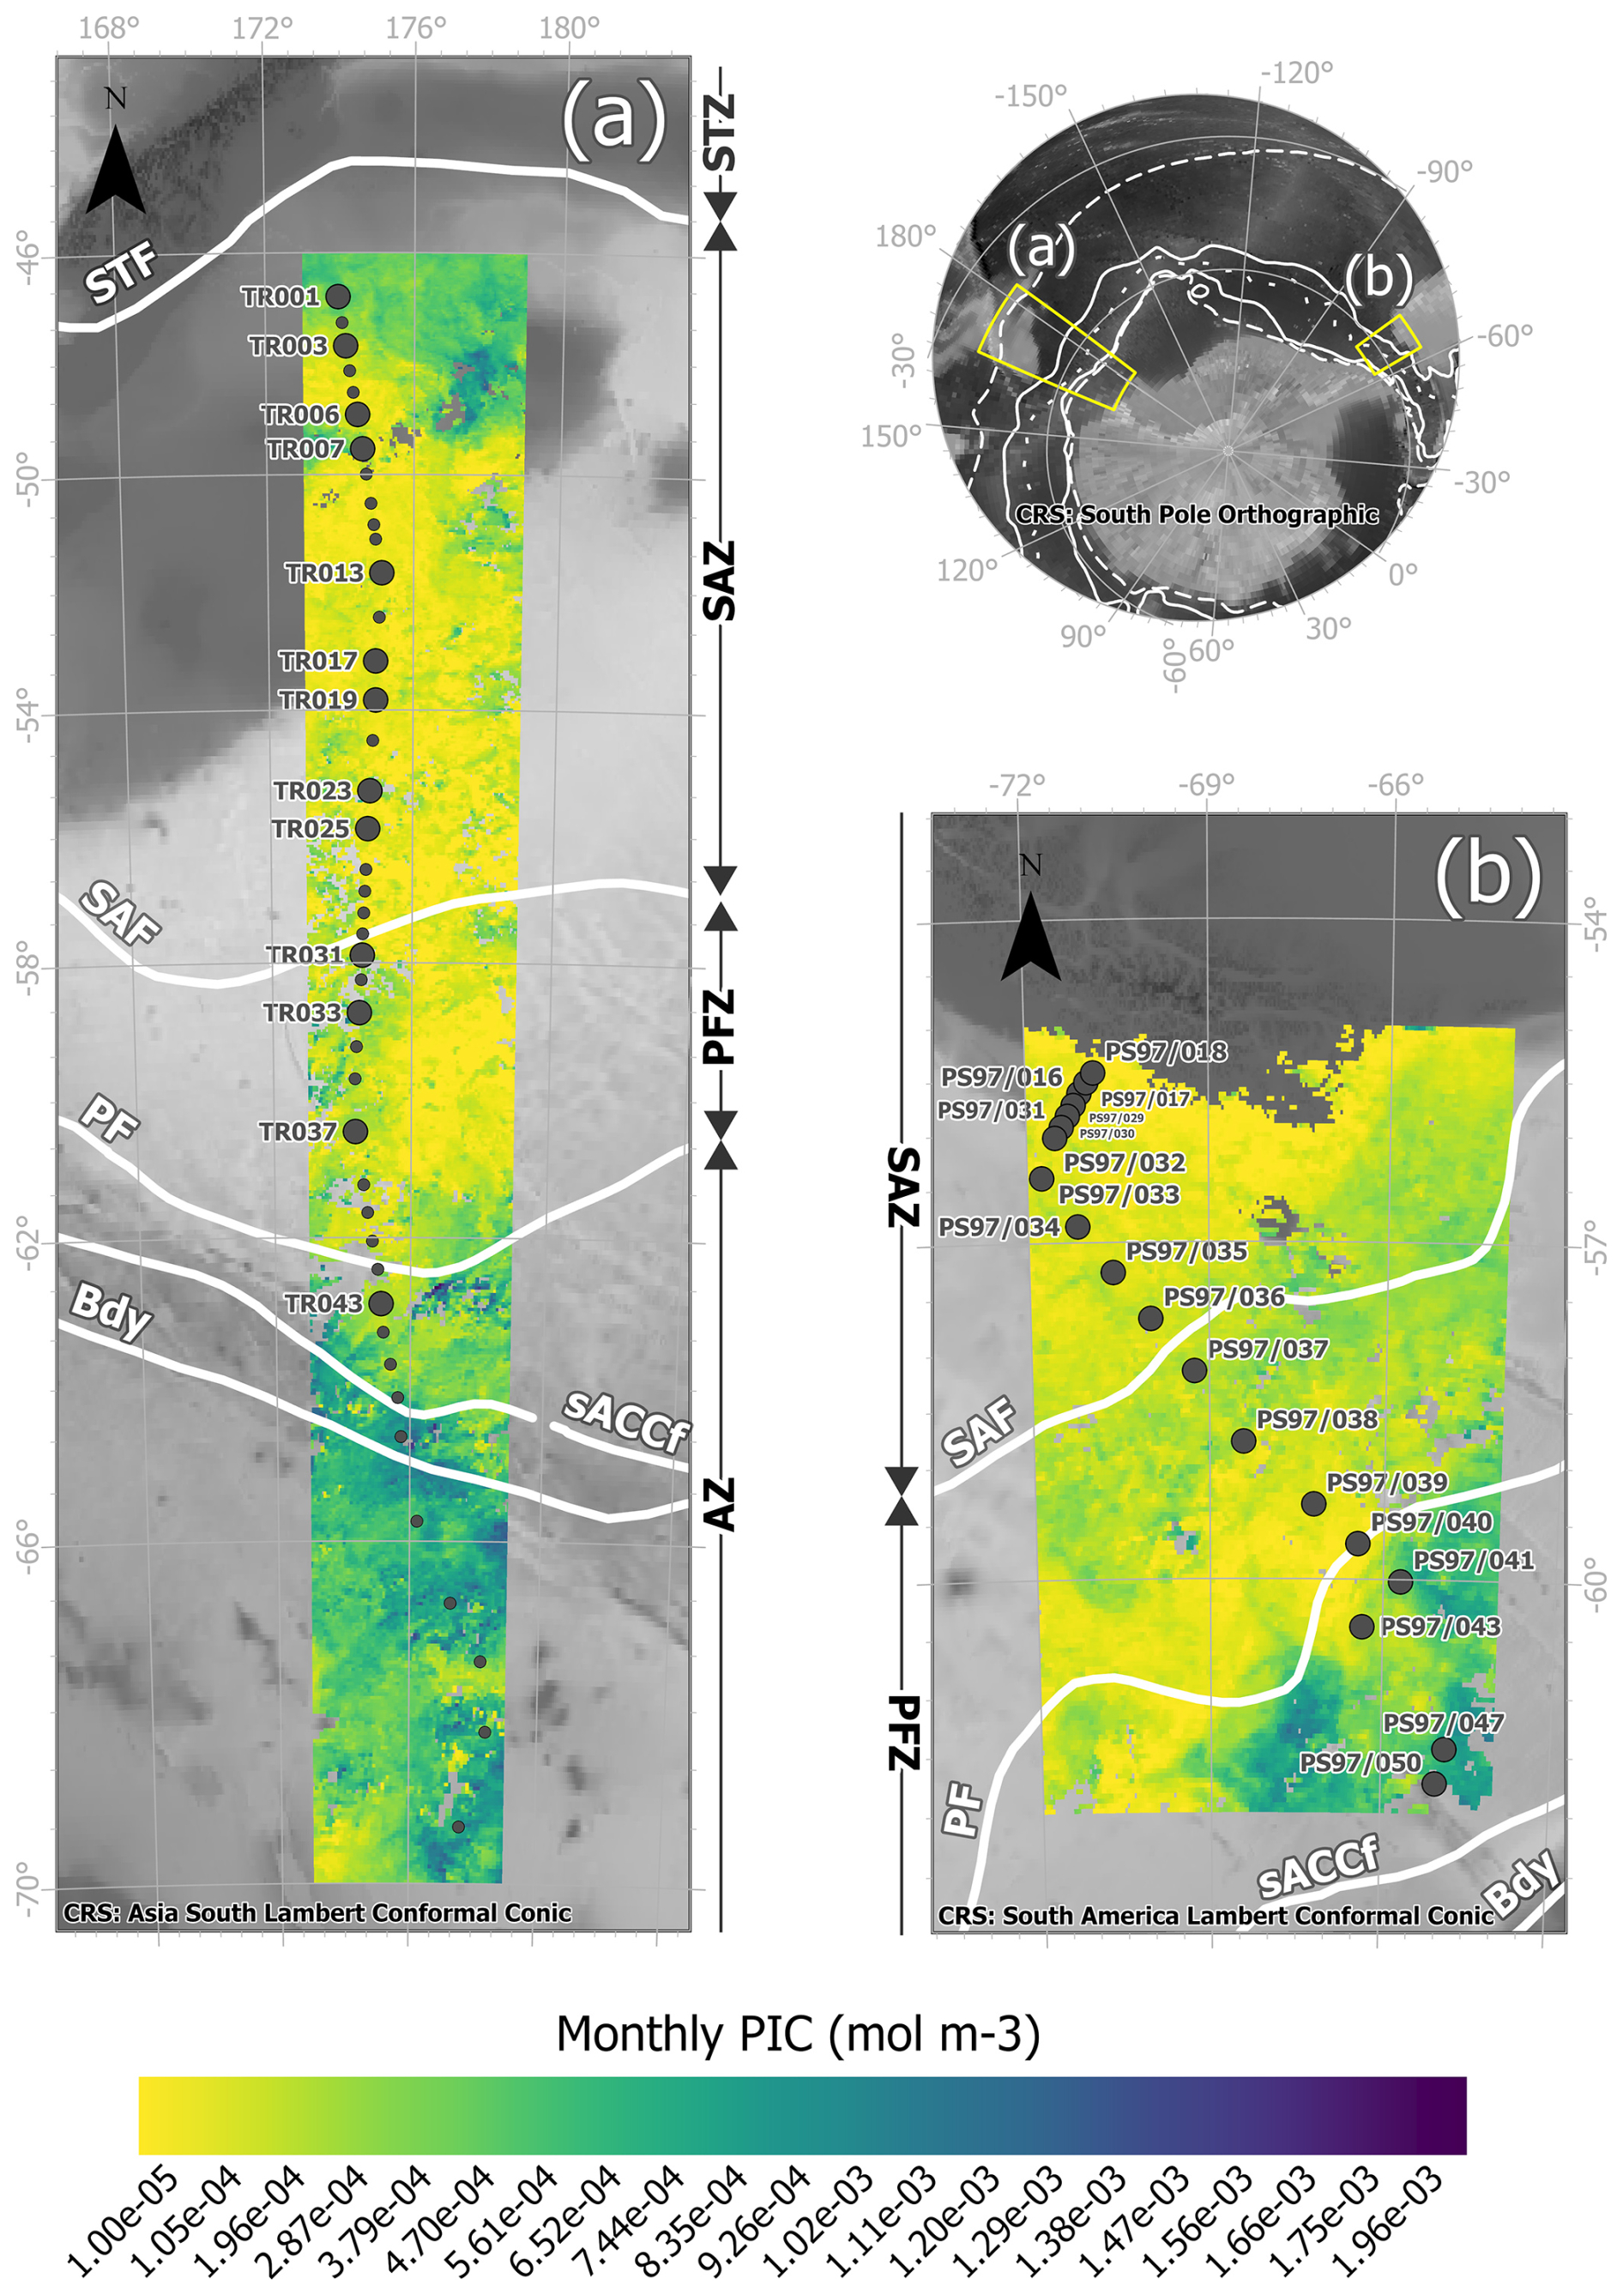
Figure 1Study area showing the locations of the water samples retrieved from (a) the New Zealand transect during the XX Italian Antarctic Expedition from New Zealand to Antarctica on board R/V Italica (December 2004–January 2005) and (b) the Drake Passage transect during R/V Polarstern Expedition PS97 across the Drake Passage (February–March 2016). The large dots indicate samples in which biometries on Emiliania huxleyi were performed and small dots where coccolithophore censuses were available. The maps show MODIS Aqua Level-3 PIC concentrations (mol m−3 g) corresponding to (a) the monthly mean over January 2005 and (b) the monthly mean over February and March 2016, overlain on a bathymetry background (GEBCO Compilation Group, 2022). The white lines indicate the average positions of the Antarctic Circumpolar Current (ACC) fronts (Orsi and Harris, 2019). From north to south, these are SAF (Subantarctic Front), PF (Polar Front), sACCf (southern ACC Front), and Bdy (Southern Boundary). The Southern Ocean zones are labeled on the side of each map: STZ, Subtropical Zone; SAZ, Subantarctic Zone; PFZ, Polar Frontal Zone; and AZ, Antarctic Zone.
Coccolithophores are important components of some of the SO phytoplankton communities, especially in the SAZ, where they reach relatively high numbers and diversity (e.g., Gravalosa et al., 2008; Saavedra-Pellitero et al., 2014, 2019; Malinverno et al., 2015; Charalampopoulou et al., 2016; Rigual Hernández et al., 2020a). South of the PF, diatoms and other siliceous microfossils dominate (e.g., Saavedra-Pellitero et al., 2014; Malinverno et al., 2016; Cárdenas et al., 2018). The coccolithophore abundance and diversity in the Drake Passage drop drastically from north to south, with the oceanographic fronts appearing to act as ecological boundaries (Saavedra-Pellitero et al., 2019), whereas the total coccolithophore abundance is highest in the PFZ south of New Zealand (Malinverno et al., 2015). Similar marked shifts in coccolithophore numbers, community composition, and diversity at the SAF and PF were also previously noted in other sectors of the SO (e.g., Mohan et al., 2008; Gravalosa et al., 2008; Holligan et al., 2010; Saavedra-Pellitero et al., 2014; Balch et al., 2016; Charalampopoulou et al., 2016) and are in accordance with previous observations in both transects (Malinverno et al., 2015; Saavedra-Pellitero et al., 2019). In particular, the PF (Drake Passage) and the southern ACC Front (New Zealand transect) are natural barriers marked by a clear drop in the amount of E. huxleyi, which often is the only species found in the PFZ and almost always occurs as a B morphogroup (types B/C, C, and O). Furthermore, a general southwards decreasing trend in E. huxleyi mass, linked to a latitudinal trend from the more calcified E. huxleyi (A morphogroup) to weakly calcified morphotypes (B morphogroup), was already recorded across the Drake Passage (Saavedra-Pellitero et al., 2019).
3.1 Sampling considerations and morphometrics
3.1.1 The New Zealand transect
Forty-two surface water samples were collected from the pump of the R/V Italica (at ca. 3 m water depth) from 46.81 to 69.37° S during the XX Italian Antarctic Expedition from New Zealand to Antarctica from 31 December 2004 to 6 January 2005 (Fig. 1 and Table 1). Details of the sample locations, sampling volumes, and coccolithophore and coccolith counts can be found in Malinverno et al. (2015).
We selected a total of 13 water samples for Scanning Electron Microscope (SEM Tescan Vega at the University of Milano-Bicocca) morphometric analyses of E. huxleyi covering the various biogeographic zones across the ACC (Fig. 1). For each sample, 30–50 images of E. huxleyi free coccoliths and coccospheres were collected as encountered during filter scanning (377 images in total; Table S1 in the Supplement). The distal shield length and width, the tube thickness, and the number and thickness of distal shield elements were measured manually in micrometers (µm) based on the scale bar of the SEM images using the ImageJ software (Schneider et al., 2012) (Fig. 2).
Table 1Overview of the samples considered for this study, including the sampling area, the number of plankton samples considered, the expedition, the research vessel, the water sampling dates, the coordinates, and the data already available from previous publications.
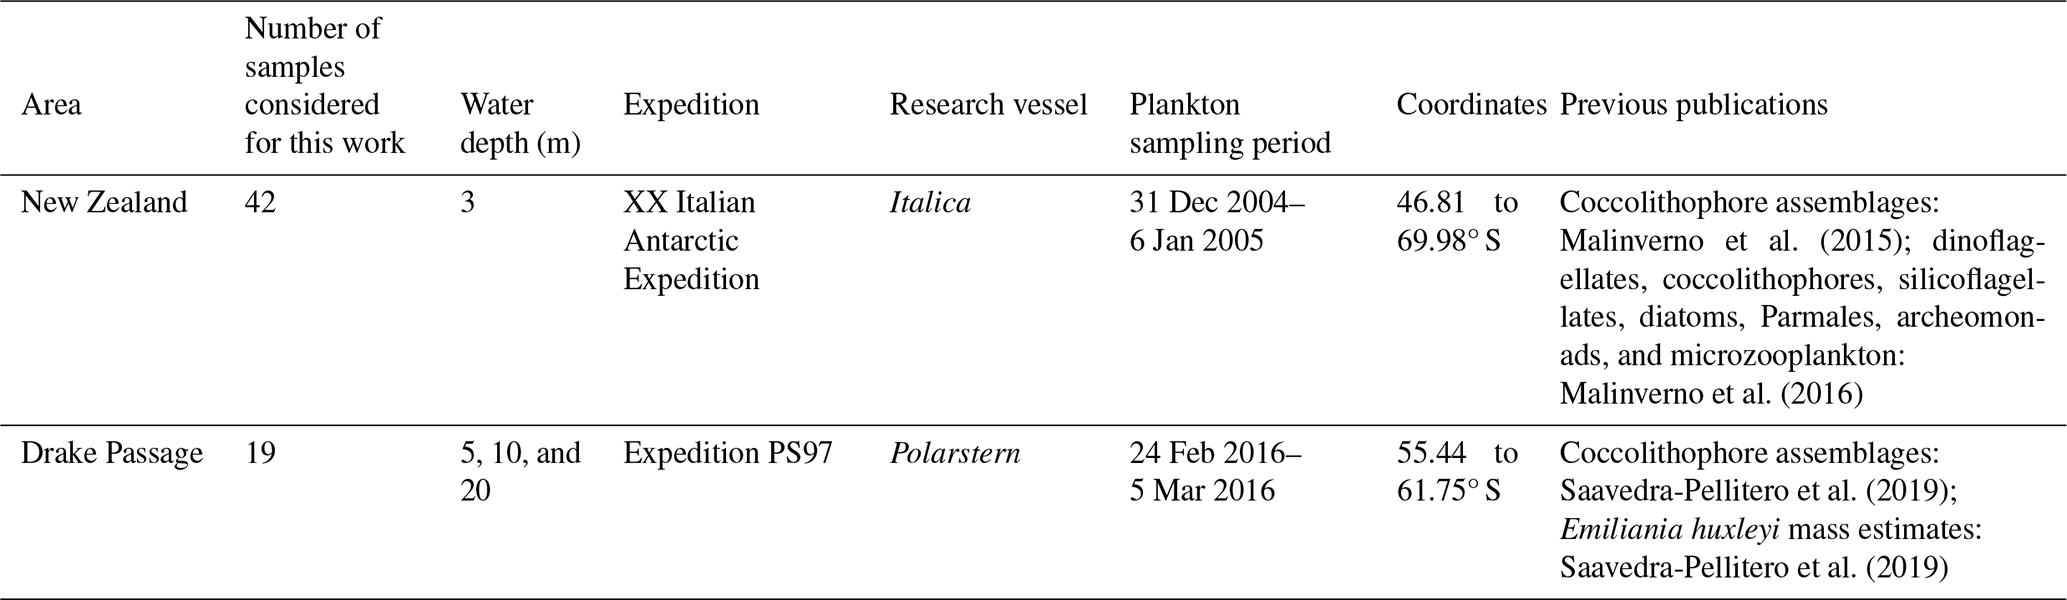
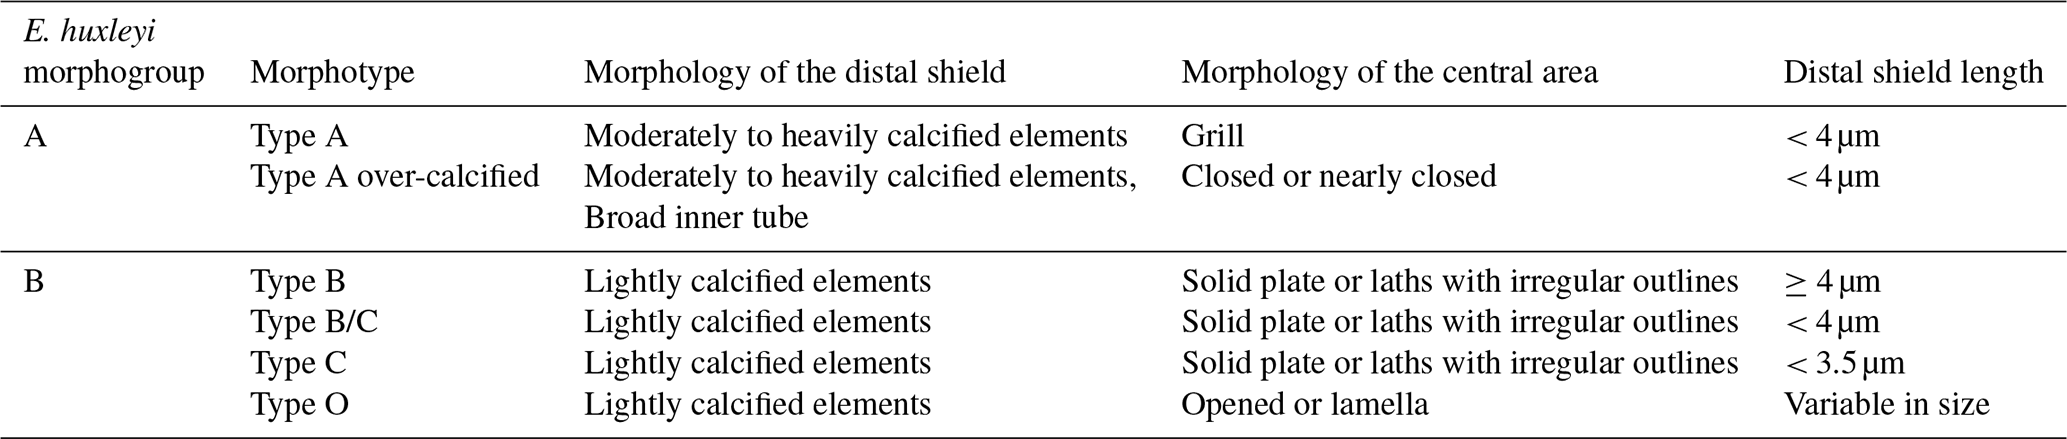
Table 2Classification scheme of the E. huxleyi morphotypes observed in the present study (modified from Saavedra-Pellitero et al., 2019, and Vollmar et al., 2022).
3.1.2 The Drake Passage transect
Nineteen water samples were collected on a transect at the western end of the Drake Passage from 55.44 to 61.75° S during R/V Polarstern Expedition PS97 from 2 February 2016 to 5 March 2016 (Fig. 1 and Table 1). These selected plankton samples were obtained using a rosette sampler with 24×12 L Niskin bottles (Ocean Test Equipment Inc.) attached to a CTD Seabird SBE911plus device (Lamy, 2016). The bottles were fired by a SBE32 carousel, and only the shallowest samples, from 5, 10, and 20 m water depths, were considered in this work. Details of the sampling locations, sampling volumes, coccolithophore assemblages, and coccospheres per liter can be found in Saavedra-Pellitero et al. (2019).
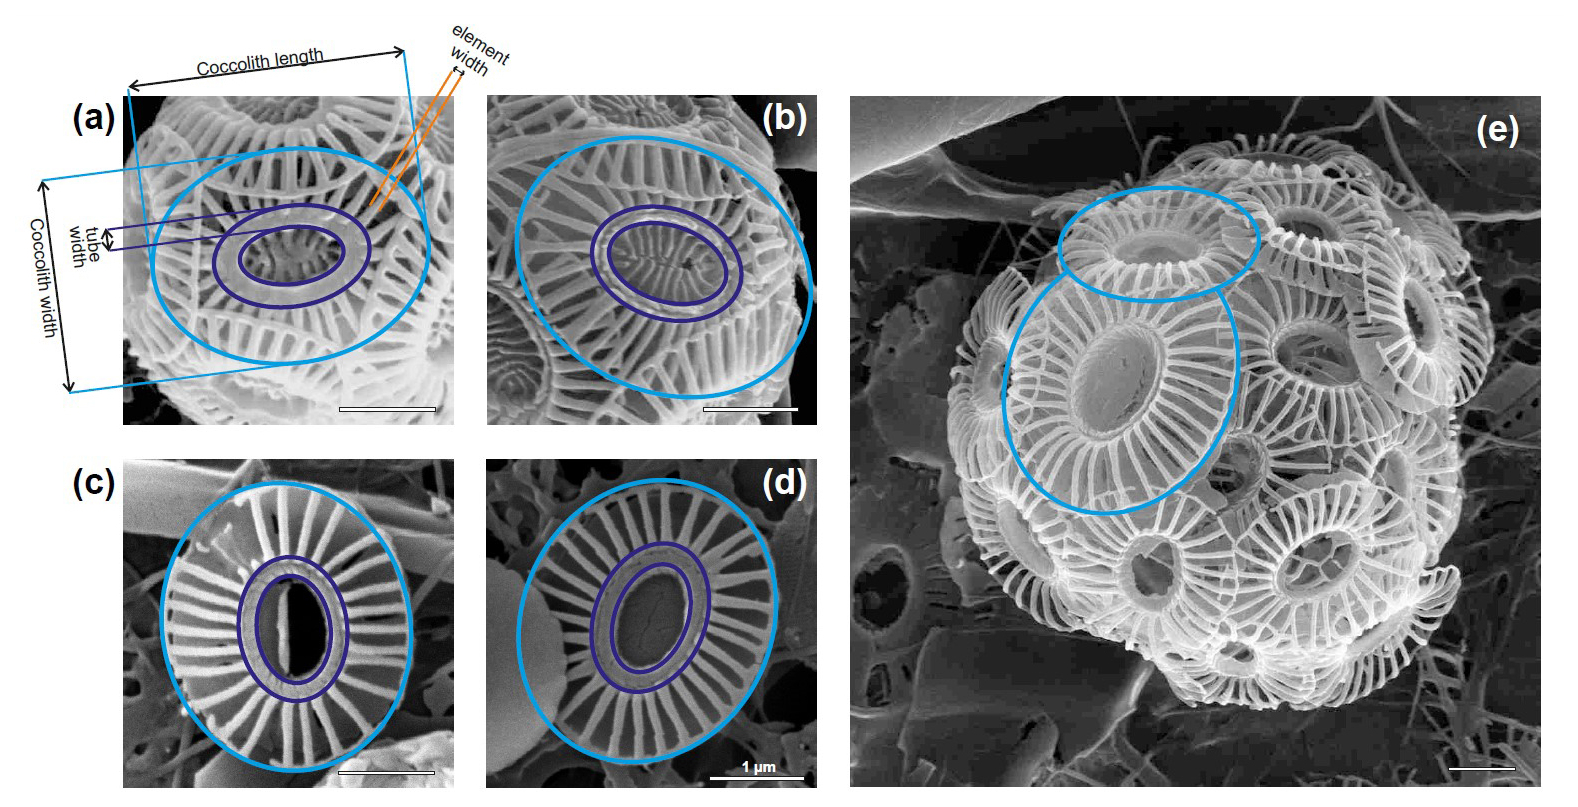
Figure 2Parameters measured in Emiliania huxleyi coccolith (a, b) type A and (c, d, e) type O in plankton samples from the New Zealand transect. Note the coccolith size variation in panel (e) within the same coccosphere.
A total of 203 images of E. huxleyi coccospheres were taken from the samples in the Drake Passage while scanning the filters within another SEM (Zeiss DSM 940A at the Geosciences Faculty, University of Bremen; Table S2). Coccoliths were measured using the Coccobiom2 macro (Young, 2015) in the Fiji software program, an image processing package based on ImageJ (Schindelin et al., 2012). Measurements were taken in micrometers, based on the scale bar of the SEM images. Note that the images were scaled to 100 % with a Coccobiom2 SEM calibration of 1.09 and the specific magnification.
3.2 Coccolithophore taxonomical considerations
Emiliania huxleyi specimens were classified following Young et al. (2003, 2023) during the SEM morphometric analyses. Initially, six different morphotypes were distinguished in the study area, belonging to morphogroups A and B (for further details, see Table 2). These are E. huxleyi type A, type A over-calcified, type B, type B/C, type C, and type O. Specific taxonomical considerations regarding the rest of the coccolithophore taxa can be found in Malinverno et al. (2015) and Saavedra-Pellitero et al. (2019).
3.3 Coccolithophore PIC estimates
The species-specific coccolith PIC (pmol) was estimated following the volume calculation of Young and Ziveri (2000):
where 2.7 is the density of calcite (pg µm−3), Ks is the species-specific shape factor provided by Young and Ziveri (2000) and modified for E. huxleyi according to the degree of calcification obtained for each morphotype as compiled by Vollmar et al. (2022) (further details in Table 3), and L is the coccolith mean length from measurements (µm) in the case of E. huxleyi. For minor species, we considered the averaged coccolith length provided by Young and Ziveri (2000); 100 is the molecular weight of calcite (g mol−1).
Measurements of the distal shield diameters of Calcidiscus leptoporus, the second most abundant species that is significantly larger and much more massive than E. huxleyi, were taken on different samples offshore of New Zealand, corresponding to the highest abundances of this taxon (Tables 3 and S3). The importance of taking size measurements of the communities analyzed for the determination of species-dependent coccolith PIC, rather than using size measurements from the scientific literature, has been clearly emphasized (Baumann, 2004). The coccolith PIC contribution for each sample was calculated by applying the obtained species-specific calcite quota to the abundances of species and morphotypes (i.e., coccospheres per liter) from Malinverno et al. (2015) and Saavedra-Pellitero et al. (2019) (Tables 1 and 3). In the New Zealand transect, the single or double coccolith layers were considered in the estimates (Table S1), while in the Drake Passage transect, where this information was not available, an average was considered based on our own observations (Tables 3 and S4). Additionally, detached coccoliths per liter were considered for the PIC estimates in the New Zealand transect (Malinverno et al., 2015). To estimate the number of coccoliths per coccosphere, we counted the visible placoliths (half coccosphere) and multiplied them by 2 (Table S4).
We also calculated the relative tube width in E. huxleyi as a size-independent index to estimate the degree of calcification in this taxon following Young et al. (2014) (Fig. 2):
Note that, because the relative tube width is a ratio, it is dimensionless and should be size-independent (Young et al., 2014).
Table 3Lengths, shape factors (Ks), and numbers of coccoliths per coccosphere used in this work for the New Zealand transect and the Drake Passage transect. * indicates an average of the number of coccoliths per coccosphere. Note that the different Ks values used here were mostly based on Young and Ziveri (2000). The shape factor for morphotype O (Ks = 0.015) was introduced by Poulton et al. (2011) in a plankton study along the Patagonian Shelf for a morphotype with a central area described as an “open or thin plate”, which the authors called type B/C but which we identified as morphotype O.
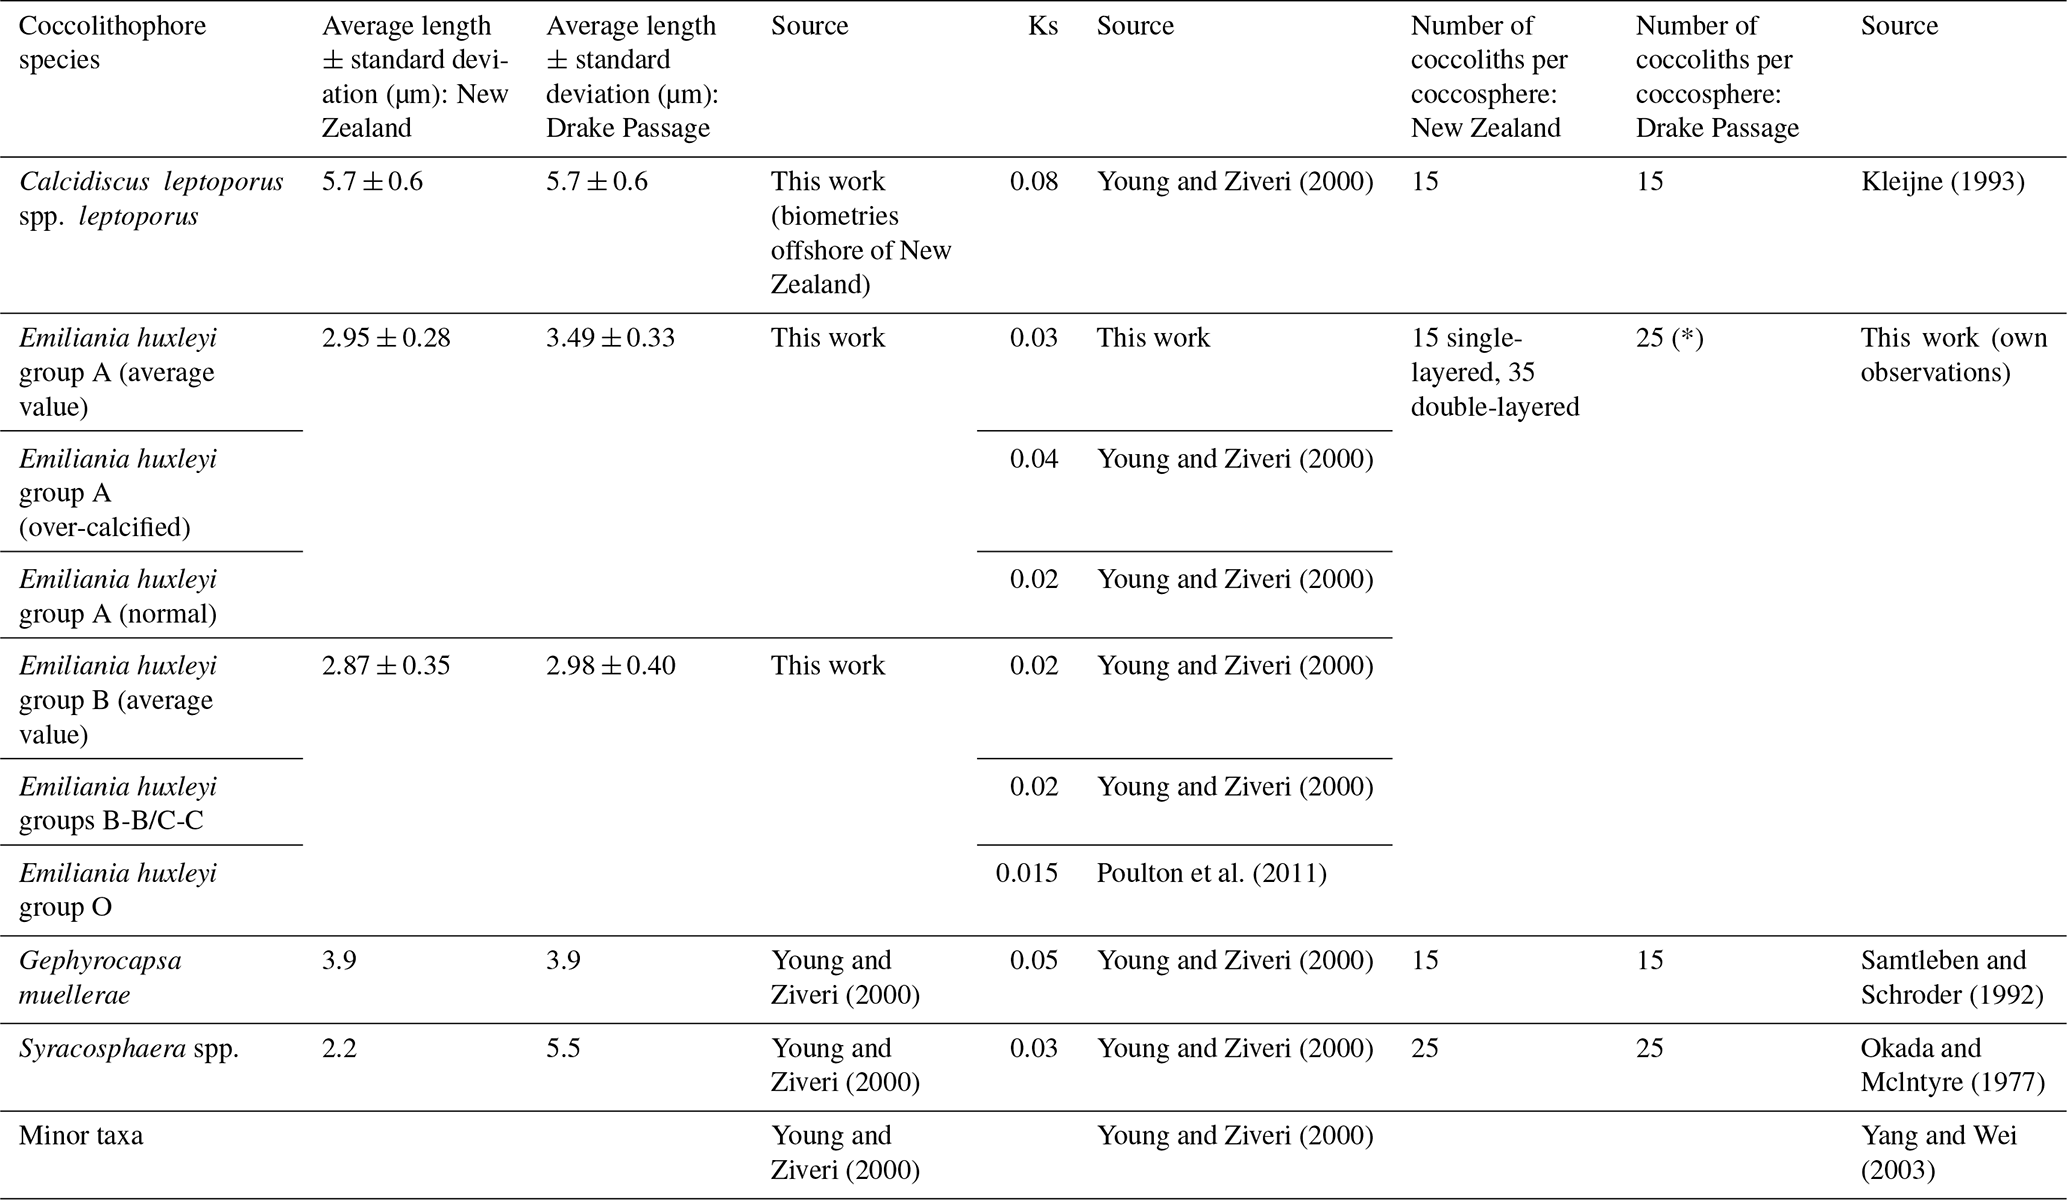
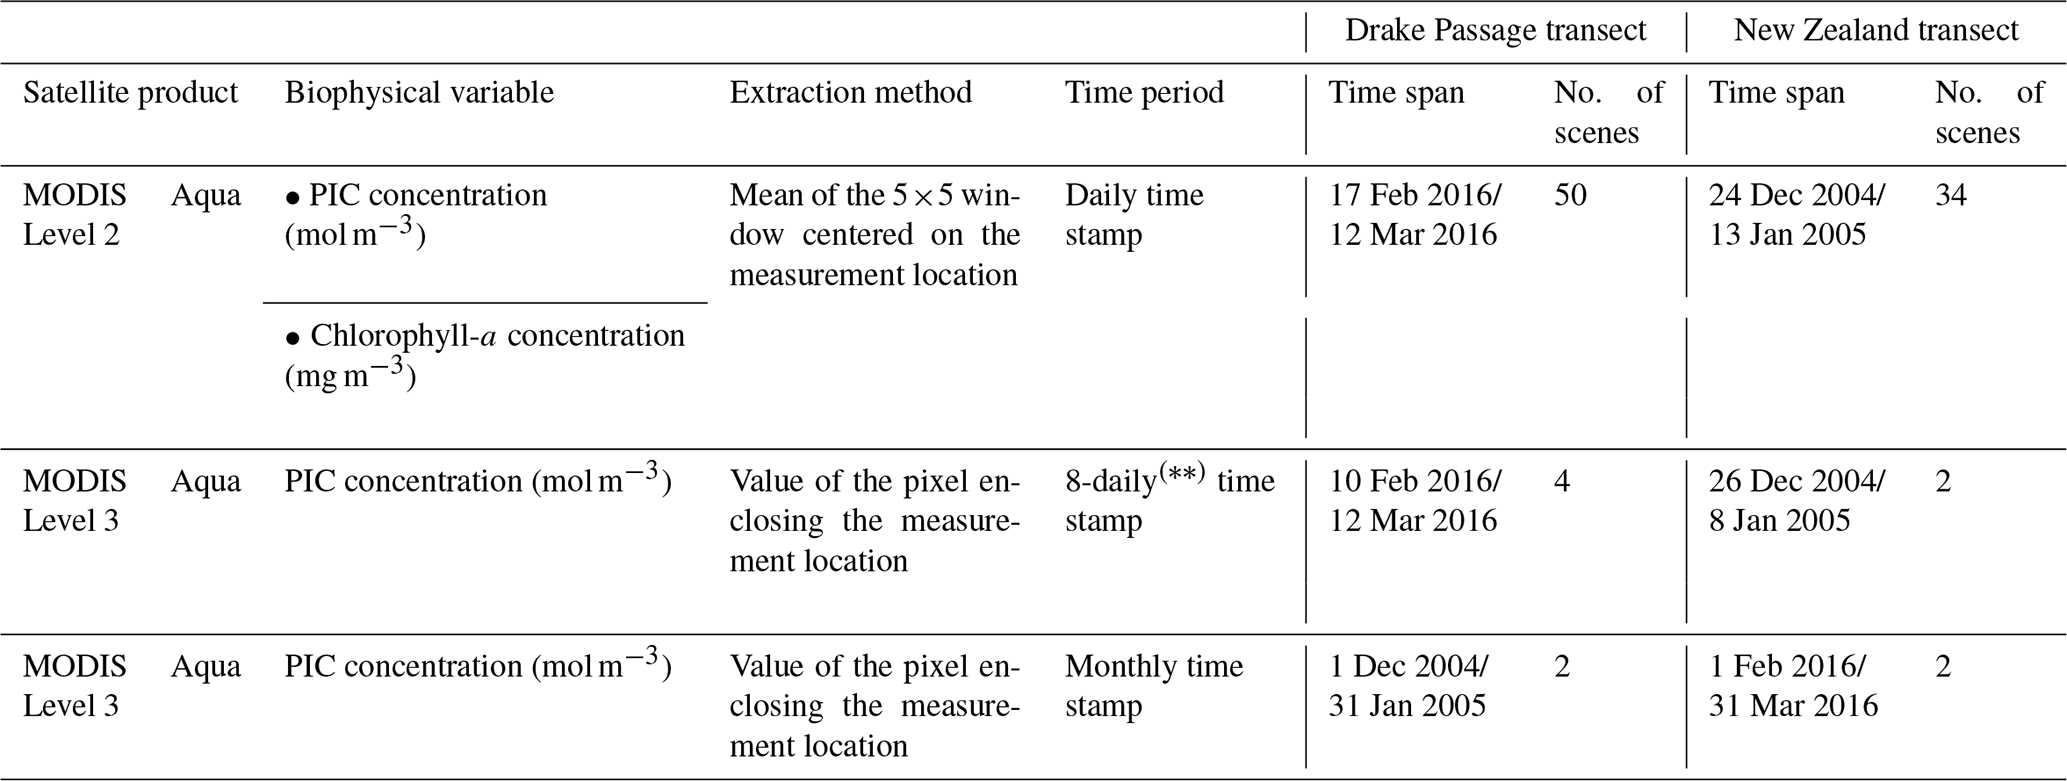
Table 4Summary of the MODIS Aqua products used in this study. The first 8 d period of each year always begins with 1 January, the second with 9 January, the third with 17 January, and so on. The final 8 d composite of each year comprises only 5 d in non-leap years (27–31 December) or 6 d in leap years (26–31 December).
3.4 Coccolith-estimated PIC errors
There are sources of errors and uncertainties linked to the approach chosen to estimate the coccolith PIC. To assess the precision of the measurements, two different coccoliths were measured 50 times each. The standard deviations (SDs) for the coccolith lengths were 0.014 and 0.017 µm, and the standard error was 0.002 µm in both cases. Coccolith volume estimates are likely to contain errors around 40 %–50 % according to Young and Ziveri (2000), so we assumed the largest potential error and added 50 % error bars to our plots. However, we note that measuring the actual size range in the sample can reduce this error to about 5 %–10 % in length and 15 %–30 % in volume, so we also added 15 % error bars to our plots to show the minimum potential error.
3.5 Satellite-derived PIC and chlorophyll-a data processing
To compare the coccolith-estimated PIC with satellite-derived values, the PIC concentration (mol m−3) was obtained from the MODIS Aqua Level-2 and Level-3 products (NASA Goddard Space Flight Center, Ocean Ecology Laboratory, Ocean Biology Processing Group, 2023, 2024). To encompass the broad range of PIC concentrations observed in the global ocean, a combination of two independent approaches is used to calculate the backscattering coefficient for PIC (a description of the algorithm can be found in the NASA Ocean Biology Processing Group, 2023; for further details, see also Balch and Mitchel, 2023). The Ocean Biology Processing Group validates MODIS Aqua PIC retrievals against in situ measurements, which results in a mean bias of ± 0.31623 and a mean absolute error (MAE) of ± 3.91664 (both values are calculated based on log10 transformation of the PIC values) (NASA Ocean Biology Processing Group, 2023). These metrics indicate the degree of accuracy and potential bias in the satellite-derived estimates compared to direct observations.
MODIS Aqua Level-2 scenes encompassing both the sampling period and the geographical extent of each transect were downloaded from NASA's Ocean Color Level 1 & 2 browser (https://oceancolor.gsfc.nasa.gov/, last access: 12 July 2024). The downloaded MODIS Level-2 scenes corresponded to swaths covering at least 50 % of the study area and included more than one daily scene. Table 4 summarizes the number of downloaded scenes as well as their time coverage. To obtain the satellite-derived PIC concentration for comparison with the coccolith-estimated PIC concentration at each sample location, the mean of a 5×5 window centered on the measurement location (Bailey and Werdell, 2006) was extracted from the downloaded scenes using the SNAP 9.0.0 pixel extraction tool (European Space Agency, 2022). This tool provides basic statistics, such as the number of pixels (N) contributing to each mean value and the SD of these pixel values, allowing the homogeneity of the extraction point to be assessed. Pixels flagged with atmospheric correction failure (ATMFAIL) or very low water-leaving radiance (LOWLW) were excluded from the extraction. To ensure statistical confidence in the retrieved values, all PIC mean values resulting from the aggregation of 12 or fewer N within the 5×5 window were discarded (Bailey and Werdell, 2006). Duplicate daily mean PIC values (i.e., PIC values for a measuring location extracted from more than one scene captured on the same day) and their corresponding SD were then weighted according to their uncertainties (Bevington, 1969) to give more prominence to measurements with a lower SD, which are generally considered to be more reliable. When the SD of the daily mean values was equal to 0, these values were taken directly. As a result, they are indicative of homogeneity.
Due to high cloud cover and other conditions that interfere with the detection of water-leaving radiances (NASA Ocean Biology Processing Group, 2023), daily PIC grids yielded a high number of missed observations, or gaps, which prevented us from acquiring daily satellite-derived PIC values of the sampling dates for most sample locations in both transects (Figs. S1 and S2 show the availability of MODIS Aqua Level-2 PIC values across the stations over the sampling period). This lack of cloud-free satellite images made it impossible to use a time window of 24 h to determine the coincidence between coccolith-estimated PIC and satellite-derived PIC. Therefore, to increase the possibility of a ship–satellite matchup, we extended the satellite period to 7 d before and after the sampling dates (see Table 4 for the specific dates) and extracted the PIC for all of the sample locations, regardless of their sampling dates. We deliberately chose that time range considering that E. huxleyi can double its numbers in 2 or 3 d without accounting for grazing by zooplankton (based on studies in the North Atlantic; Holligan et al., 1993), ensuring no drastic changes from non-coccolithophore bloom to bloom conditions. We then generated a mean PIC value for each location by aggregating the available daily means over the full period to explore the latitudinal variation of this variable. We also, independently, obtained monthly (Figs. S3 and S4) and 8-daily (hereafter referred to as weekly) satellite-derived PIC concentrations (mol m−3) from the MODIS Aqua Level-3 product (NASA Goddard Space Flight Center, Ocean Ecology Laboratory, Ocean Biology Processing Group, 2023). This allowed us to have additional satellite-derived PIC values for comparison with the coccolith-estimated PIC in the study area. Images encompassing both the sampling period and the geographical extent of each transect were acquired from NASA's Ocean Color Level 3 & 4 browser (https://oceancolor.gsfc.nasa.gov/l3/, last access: 24 May 2023) as 4 km cell size gridded files in NetCDF file format. Table 4 summarizes the number of downloaded scenes as well as their temporal coverage. The Level-3 extracted values corresponded to the PIC concentration of the grid cell enclosing the sample location. As per Level-2 data extraction, PIC concentrations for all of the sample locations were acquired from all available monthly and weekly scenes. The MODIS Aqua Level-2 chlorophyll-a concentration (mg m−3) was also extracted and processed as an indicator of the presence of diatoms and other phytoplanktonic groups. The algorithm used to calculate chlorophyll-a is documented by Werdell et al. (2023).
4.1 Morphometries and mass estimates of Emiliania huxleyi
Emiliania huxleyi is the dominant species in the coccolithophore assemblage of the Pacific SO, and it consists of different morphotypes that show different and partly overlapping distributions along both latitudinal transects (Malinverno et al., 2015; Saavedra-Pellitero et al., 2019). Type A is mostly restricted to the northern SAZ, but it is occasionally present in the PFZ in the Drake Passage (Figs. 3 and 4) and is the only type within morphogroup A in this study. Morphotypes belonging to E. huxleyi morphogroup B (which includes morphotypes B, B/C, C, and O) are present in the SAZ and the PFZ, but they disappear south of the PF. Morphometric measurements of coccoliths of E. huxleyi from the selected samples show that the lengths of types A, B/C-C, and O overlap in both transects (Fig. 5). In the Drake Passage, coccolith lengths range from 2.86 to 3.96 ± 0.43 µm (unless specified, ± refers to the SD from now on), with mean averages of 3.49 ± 0.33 µm for type A (including normal and over-calcified specimens), 2.87 to 4.11 ± 0.45 µm for type B, 2.20 to 3.98 ± 0.37 µm for types B/C-C, and 2.42 to 4.16 ± 0.41 µm for type O as well as an average of 2.98 ± 0.40 µm for morphogroup B. In the New Zealand transect, the maximum lengths range from 2.25 to 3.59 µm, with averages of 2.95 ± 0.28 µm for E. huxleyi type A, 1.95 to 3.62 ± 0.33 µm for types B/C-C, 2.07 to 4.14 ± 0.36 µm for type O, and 2.87 ± 0.35 µm for morphogroup B.
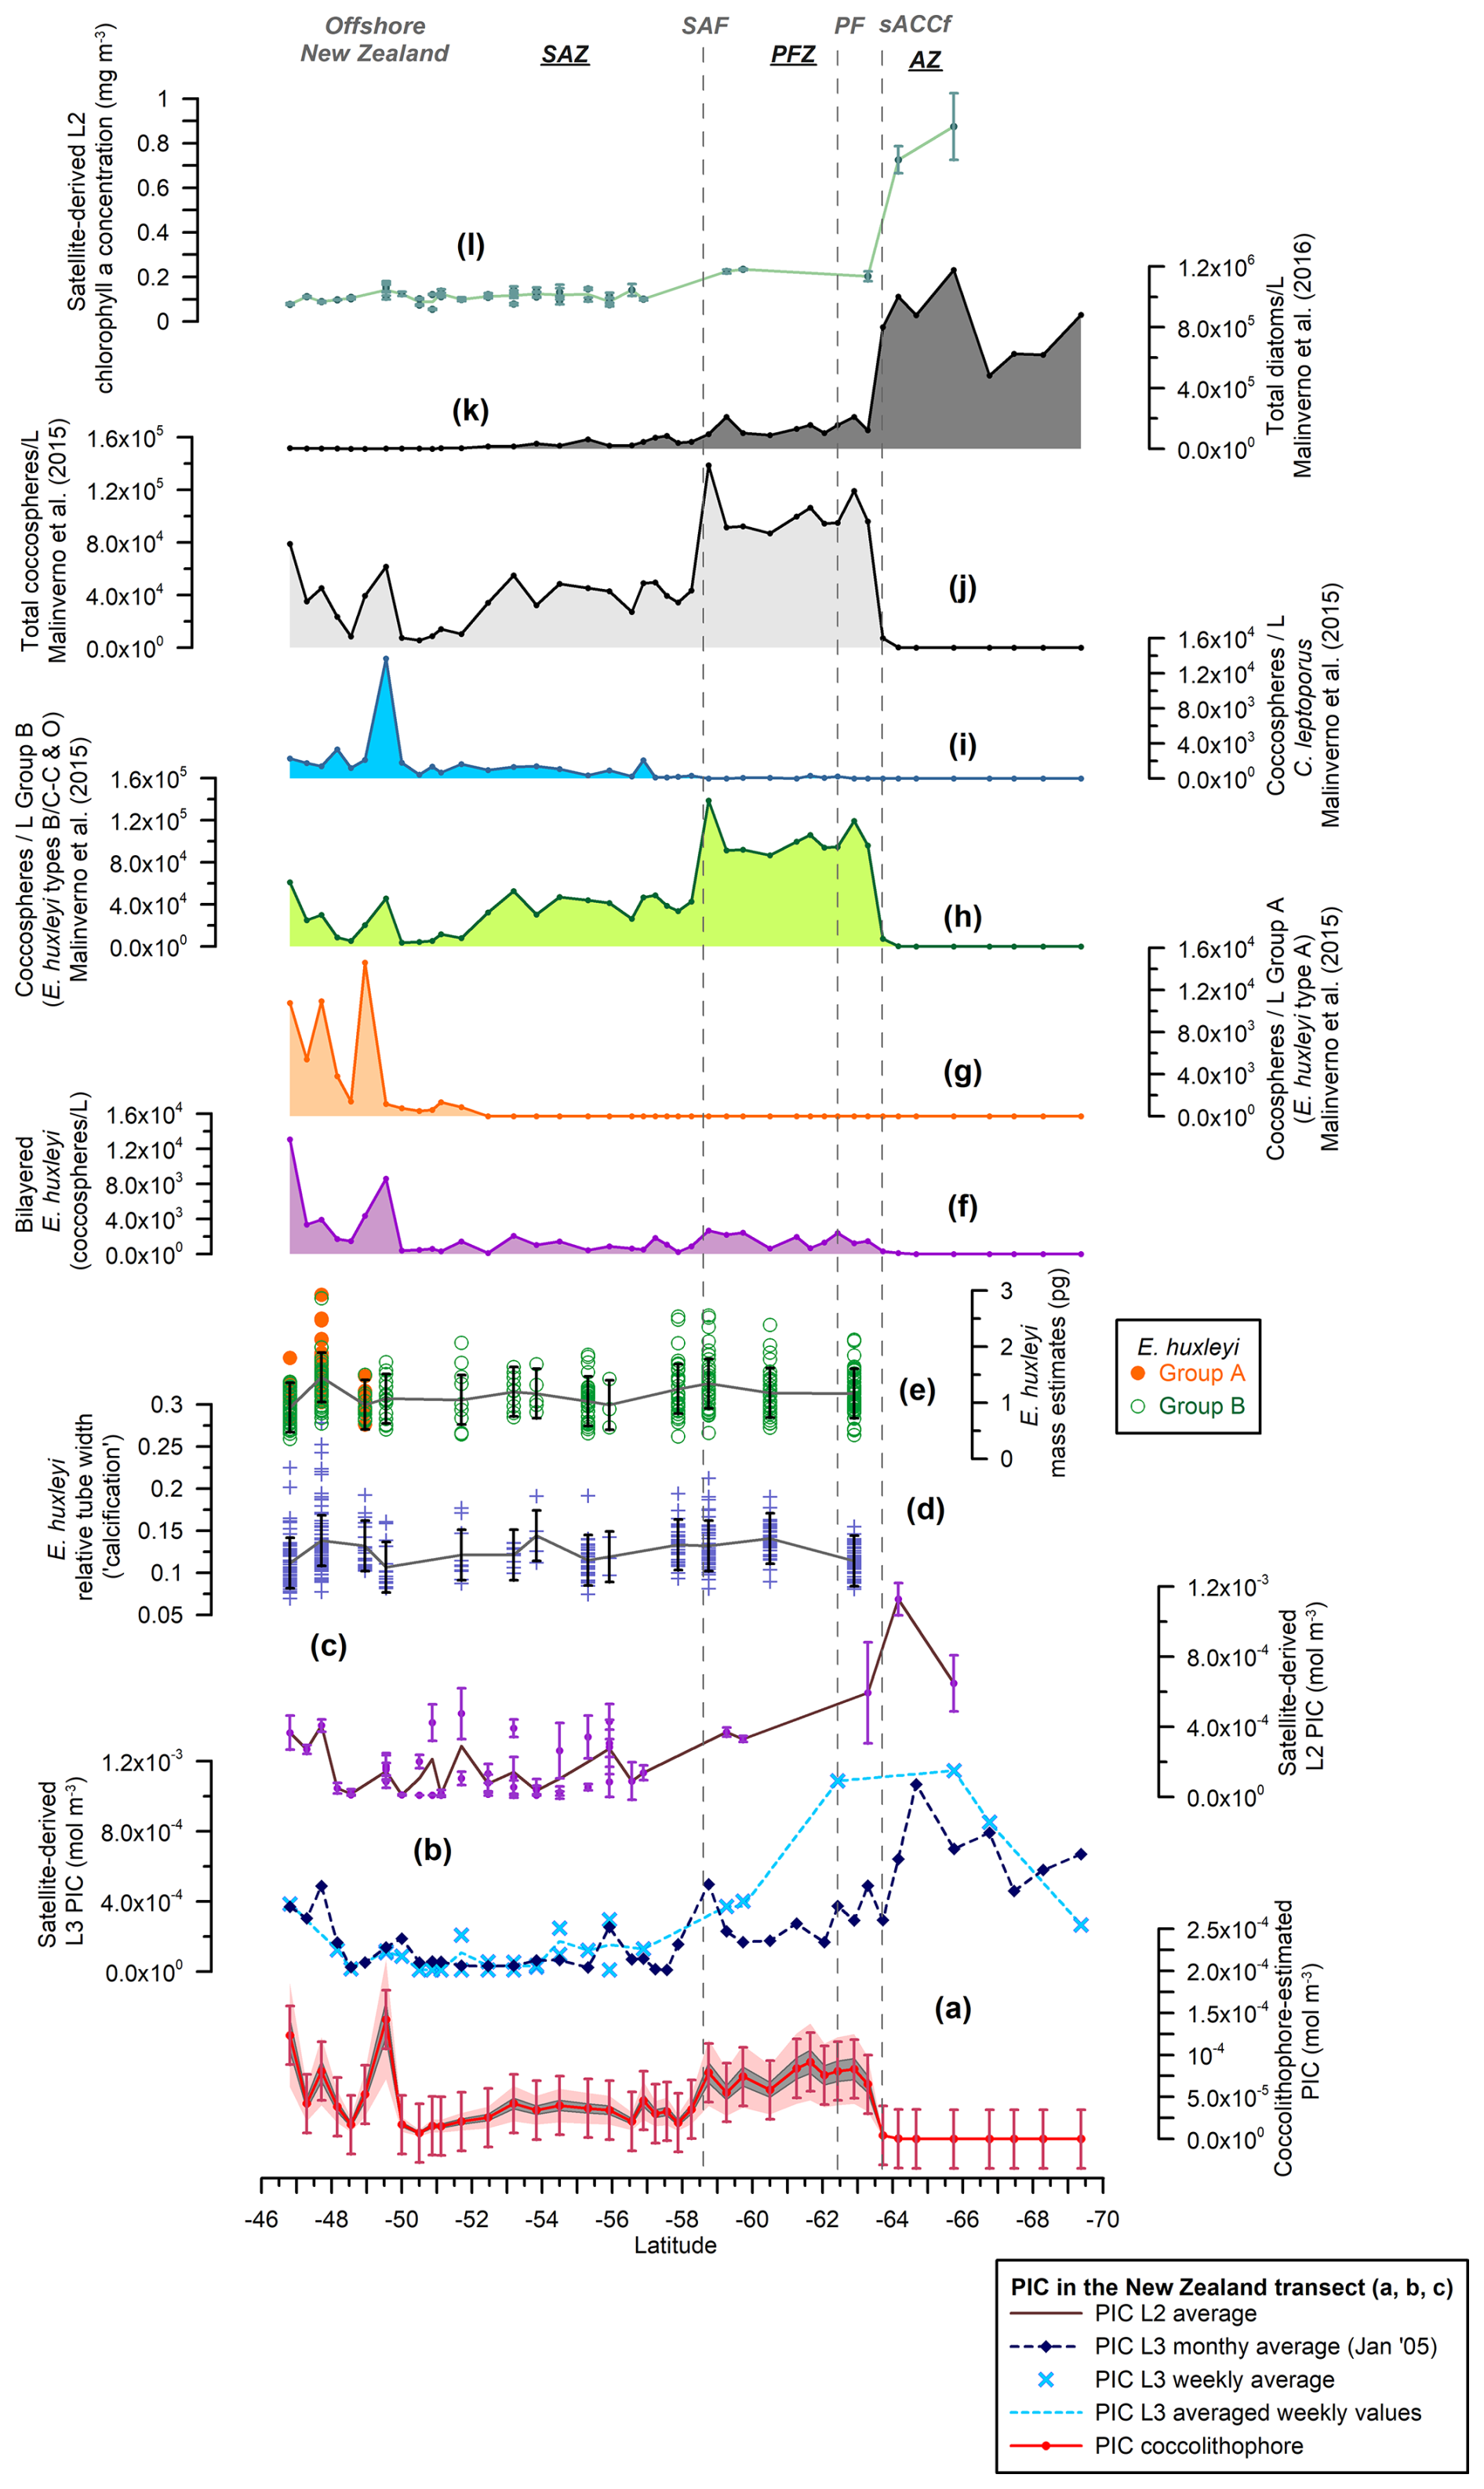
Figure 3New Zealand transect showing (a) the estimated total coccolithophore PIC (red line with dots) (mol m−3), (b) the MODIS Aqua Level-3 PIC concentration values (mol m−3) corresponding to a monthly average (January 2005, dark-blue dashed line with diamonds) and a weekly average (light-blue dashed line with crosses), (c) the MODIS Aqua Level-2 PIC concentration values (mol m−3) (average in brown), (d) the Emiliania huxleyi relative tube width index (average in gray), (e) the E. huxleyi coccolith mass estimates (pg) for morphogroups A (dots) and B (circles) (average in gray), (f) the number of bi-layered E. huxleyi (coccospheres per liter), (g) the number of E. huxleyi morphogroup A (coccospheres per liter), (h) the number of E. huxleyi morphogroup B (coccospheres per liter), (i) the number of Calcidiscus leptoporus (coccospheres per liter), (j) the total number of coccolithophores (coccospheres per liter) (Malinverno et al., 2015), (k) the total number of diatoms (cells per liter) (Malinverno et al., 2016), and (l) the MODIS Aqua Level-2 chlorophyll-a concentration (mg m−3) (average in light green). Note that the plankton samples were retrieved at ca. 3 m water depth. The vertical bars indicate 1 standard deviation of the entire population in panels (a), (d), and (e), together with the standard deviation (considering a 5×5 window) in panels (c) and (l). The dark-gray-shaded area in panel (a) represents a 15 % error and the light-pink-shaded area a 50 % error. The vertical dashed lines indicate some of the ACC fronts (Orsi and Harris, 2019): SAF, PF, and sACCf. The Southern Ocean zones are labeled SAZ, PFZ, and AZ.
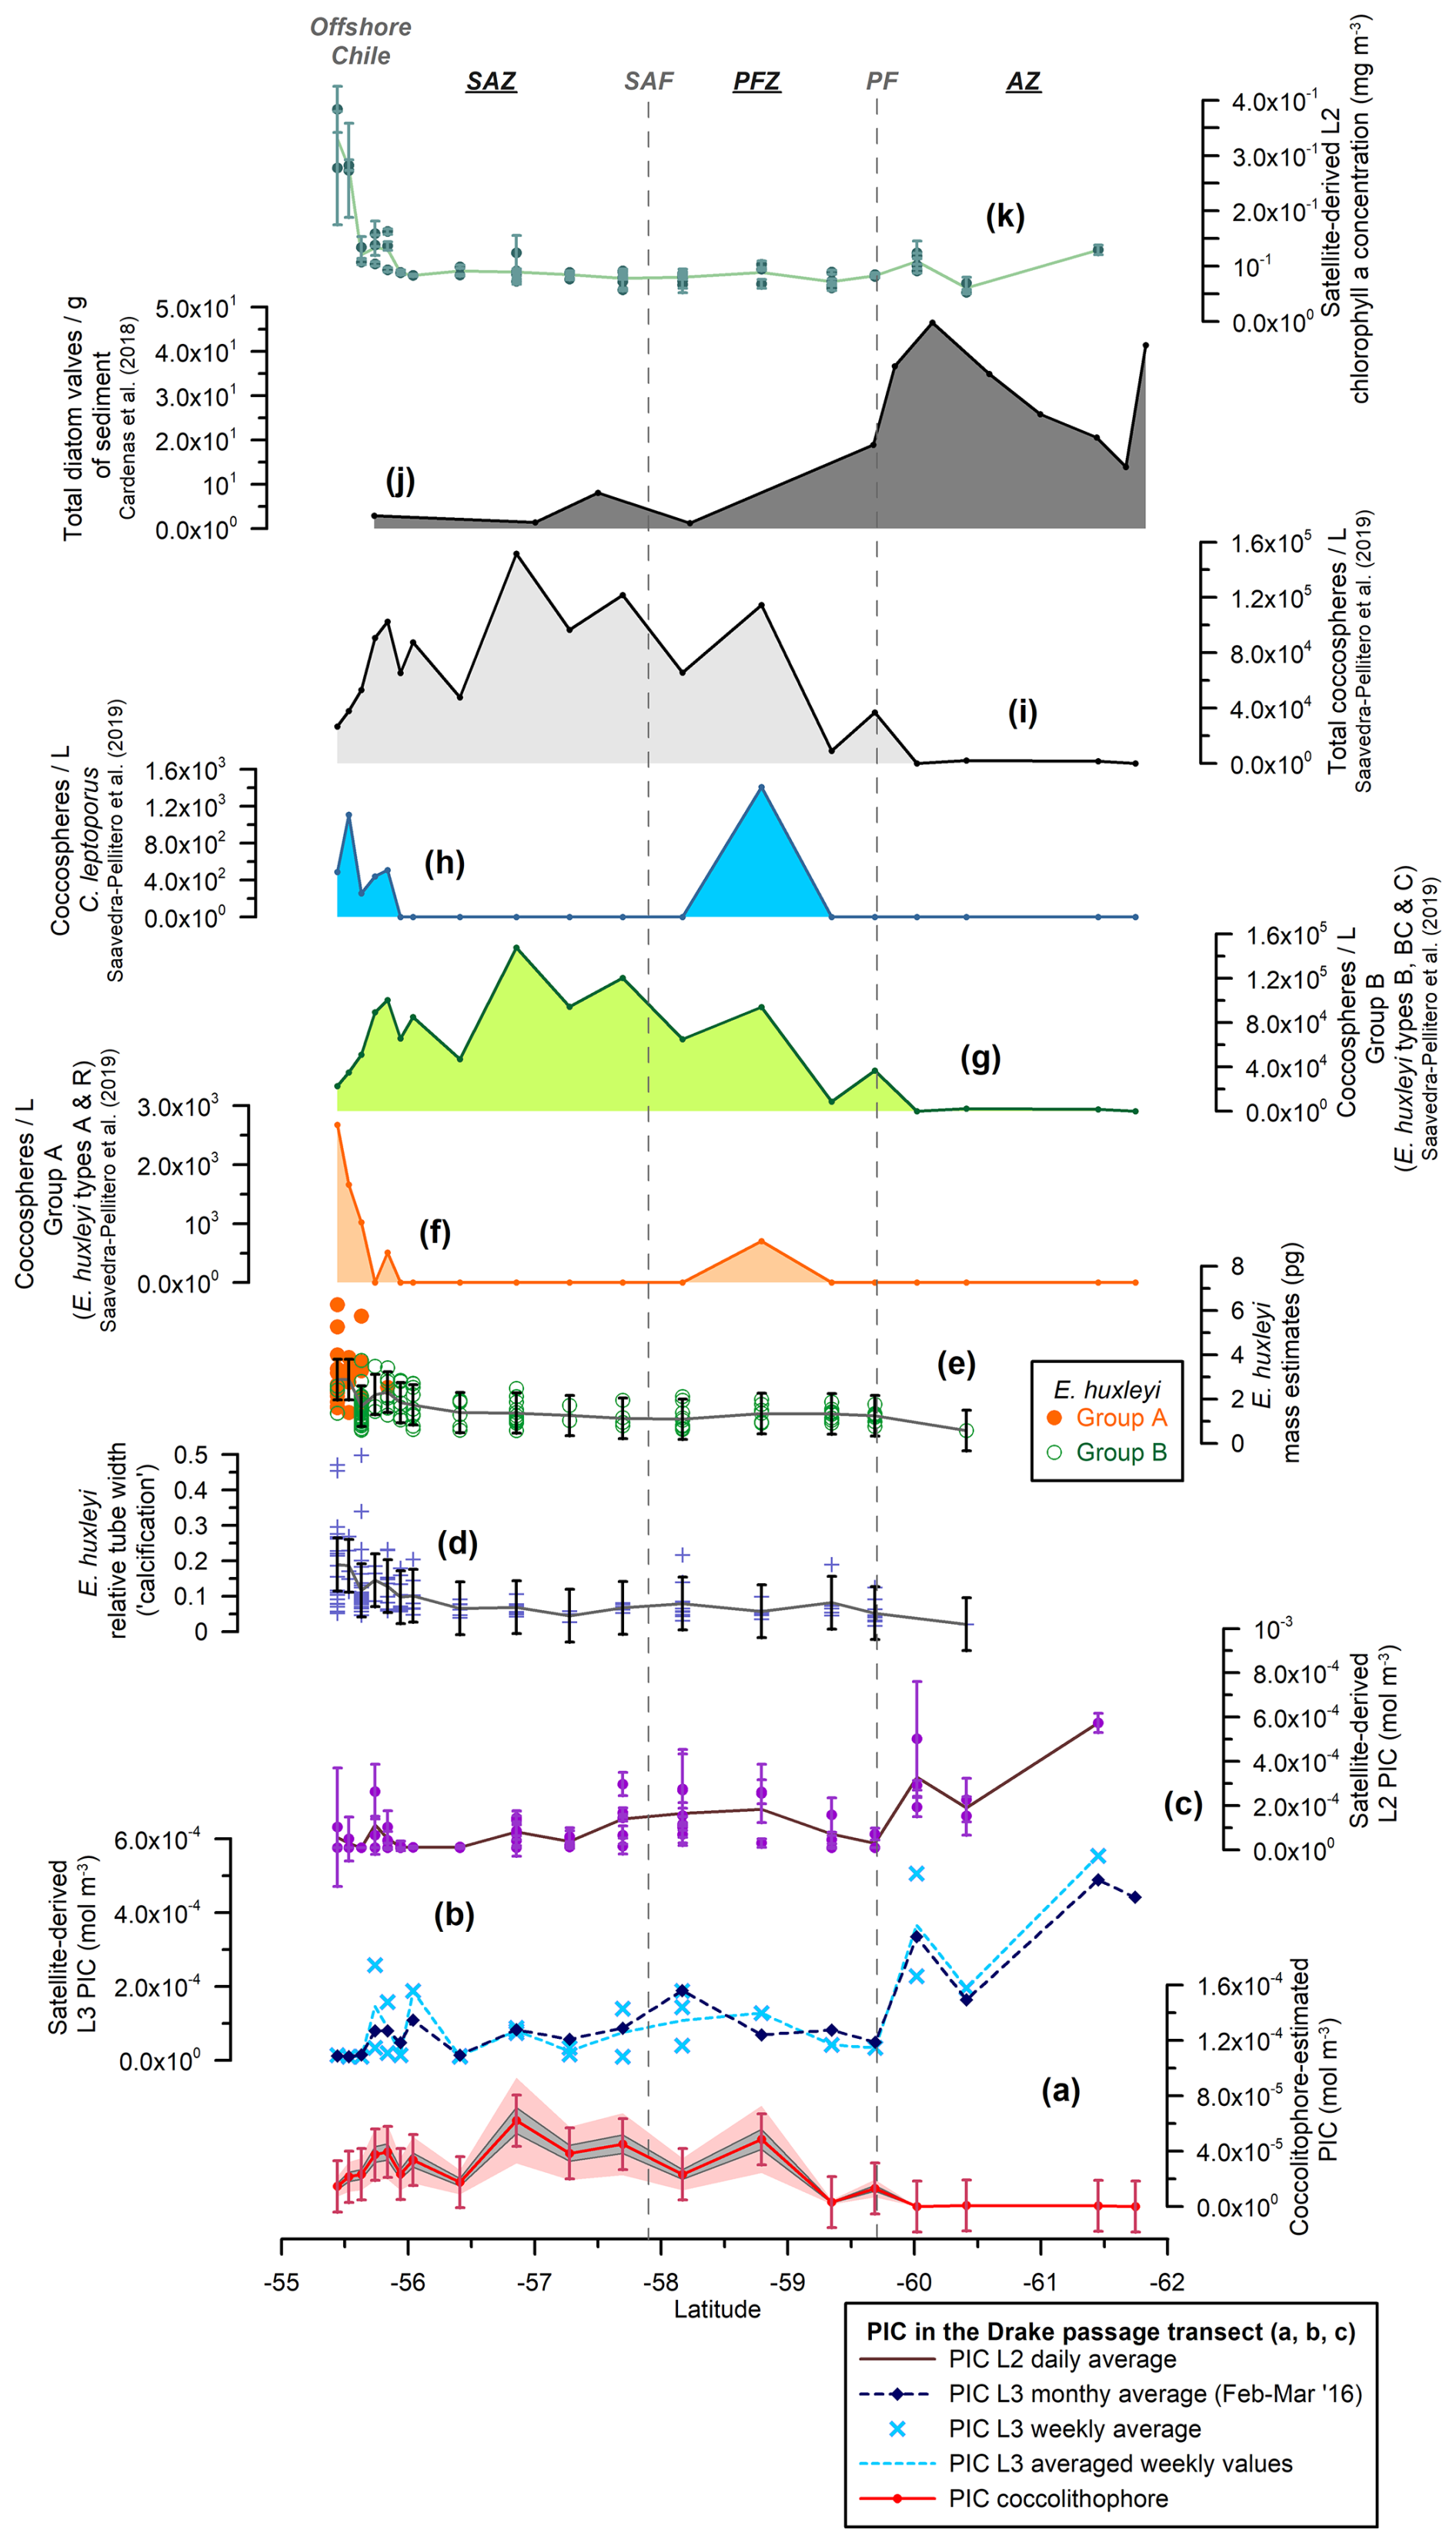
Figure 4Drake Passage transect showing (a) the estimated total coccolithophore PIC (red line with dots) (mol m−3), (b) the MODIS Aqua Level-3 PIC concentration (mol m−3) corresponding to a monthly average (February and March 2016, dark-blue dashed line with diamonds) and a weekly average (light-blue dashed line with crosses), (c) the MODIS Aqua Level-2 PIC concentration (mol m−3) (average in brown), (d) the Emiliania huxleyi relative tube width index (average in gray), (e) the E. huxleyi coccolith mass estimates (pg) for morphogroups A (dots) and B (circles) (average in gray), (f) the number of E. huxleyi morphogroup A (coccospheres per liter), (g) the number of E. huxleyi morphogroup B (coccospheres per liter), (h) the number of Calcidiscus leptoporus (coccospheres per liter), (i) the total number of coccolithophores (coccospheres per liter) (Saavedra-Pellitero et al., 2019), (j) the number of valves per gram of sediment from surface sediment samples across the Drake Passage and Scotia Sea (Cárdenas et al., 2018), and (k) the MODIS Aqua Level-2 chlorophyll-a concentration (mg m−3) (average in light green). Note that the plankton samples were retrieved at 5, 10, and 20 m water depths. The vertical bars indicate 1 standard deviation of the entire population in panels (a), (d), and (e) and the standard deviation (considering a 5×5 window) in panels (c) and (k). The dark-gray-shaded area in panel (a) represents a 15 % error and the light-pink-shaded area a 50 % error. The vertical dashed lines indicate two of the ACC fronts (Orsi and Harris, 2019): SAF and PF. The Southern Ocean zones are labeled SAZ, PFZ, and AZ.
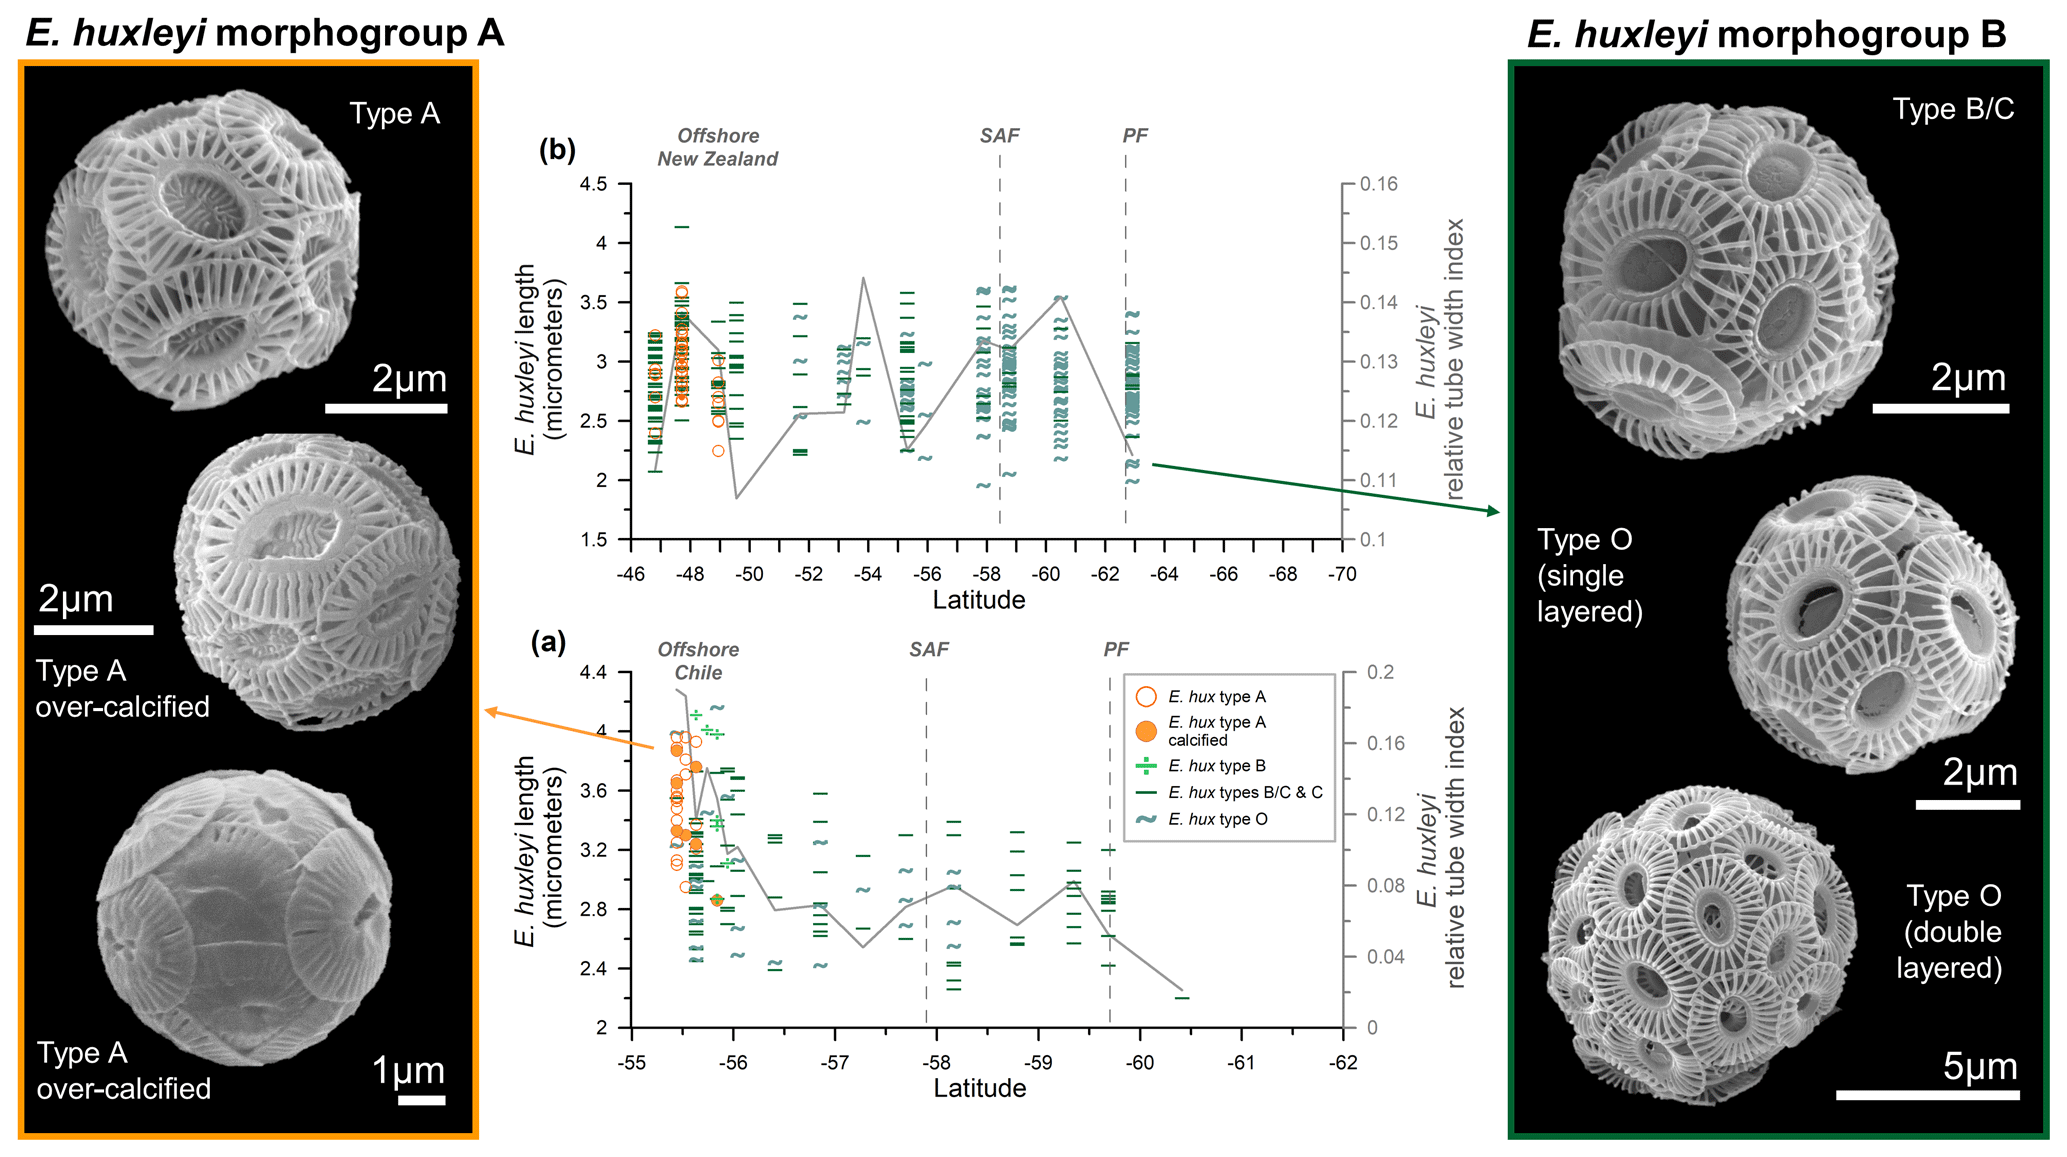
Figure 5Emiliania huxleyi length (µm) (indicated with different symbols, depending on the type, and different colors, depending on the morphogroup – A or B) and the averaged relative tube width index (gray line) in the (a) Drake Passage and (b) New Zealand transects. On the left-hand side: pictures of coccospheres of E. huxleyi type A (within morphogroup A) showing different degrees of calcification. On the right-hand side: pictures of type B/C and type O belonging to morphogroup B. All the images of coccospheres are from the New Zealand transect, except for the bottom-left one, which was retrieved offshore of Chile.
Figure 5 provides a latitudinal overview of morphometric data compared to the (averaged) degree of calcification (indicated by the dimensionless relative tube width index; Young et al., 2014). In the New Zealand transect there are no significant changes in coccolith lengths, except for a wide scatter of values characterizing the size class distribution of each sample. This feature reflects the large variability in coccolith size as observed in coccoliths from a single coccosphere (Fig. 2e). However, in the Drake Passage transect, E. huxleyi coccoliths are notably larger offshore of Chile (Fig. 5a).
The Emiliania huxleyi masses calculated in the New Zealand transect range from 0.61 to 2.93 pg, with an average of 1.47 ± 0.46 pg per coccolith within morphogroup A, and from 0.36 to 2.86 pg, with an average of 1.15 ± 0.43 pg per placolith within morphogroup B (Fig. 3e). In the Drake Passage, the masses per coccolith within morphogroup A are almost double those in the New Zealand transect, varying between 1.39 and 6.26 pg, with an average of 3.00 ± 1.19 pg. The placolith masses within morphogroup B range from 0.57 to 3.75 pg, with a mean of 1.44 ± 0.62 pg across the Drake Passage (Fig. 4e). The coccolith-estimated PICs for just the species E. huxleyi are generally lower in the New Zealand transect (average for morphogroup A: 0.015 ± 0.005 pmol; average for morphogroup B: 0.011 ± 0.004 pmol per coccolith; mean including both morphogroups: 1.19 ± 0.44 pmol per coccolith) than in the Drake Passage (average for morphogroup A: 0.030 ± 0.012 pmol; average for morphogroup B: 0.014 ± 0.007 pmol per coccolith; mean including both morphogroups: 1.66 ± 0.91 pmol per coccolith). Across both transects, the average coccolith mass for E. huxleyi in the study area is 1.35 ± 0.69 pmol per coccolith (Table 5).
We observed that some coccoliths are clearly over-calcified (see Fig. 5), with a thick inner tube (up to 0.76 µm in sample PS97/018-1) that extends into the central area. Specimens belonging to morphogroup A show a higher degree of calcification than those belonging to morphogroup B, resulting not only in a thicker inner tube, but also thicker distal shield T elements. The over-calcified coccospheres co-occur with normally calcified coccospheres, but they are restricted to the northernmost samples (Fig. 5). The relative tube width, calculated using Eq. (2), varies from 0.10 to 0.28 ± 0.04 in morphogroup A and from 0.07 to 0.21 ± 0.03 in morphogroup B for the New Zealand transect. The values are higher in the Drake Passage, ranging from 0.05 to 0.50 ± 0.12 for E. huxleyi morphogroup A and from 0.02 to 0.22 ± 0.04 for morphogroup B. The degree of calcification is highly variable within each sample of the New Zealand transect (Fig. 3d), but over-calcified specimens (relative tube width > 0.23), typically represented by type A, only occur in the northernmost samples (Fig. 5b). The averaged relative tube width index shows increased values not only in the SAZ offshore of New Zealand, but also around 54 °S and in the PFZ (Figs. 3d and 5b), which points to a certain degree of variation in the calcification within morphotypes B/C, C, and O. A more marked N–S decrease in the relative tube width values is observed in the Drake Passage, with notably higher values offshore of Chile (Figs. 4d and 5a), where relatively large and heavily calcified type-A coccospheres are present.
4.2 Coccolith-estimated PIC and satellite-derived PIC
Emiliania huxleyi dominates the coccolithophore assemblage in the study area, with abundances of 1.4×10⁵ coccospheres per liter (at station TR033) south of the SAF in the New Zealand transect and 1.5×10⁵ coccospheres per liter (at station PS97/034-2) in the Drake Passage SAZ (Malinverno et al., 2015; Saavedra-Pellitero et al., 2019), and it is also the main contributor to the sea surface PIC (Figs. 3 and 4). Calcidiscus leptoporus (mostly the intermediate-sized form) is the second most abundant species and makes significant contributions to the coccolithophore PIC at certain locations (up to 1.4×10⁴ cells per liter in the New Zealand transect and 1.4×10³ cells per liter in the Drake Passage, Figs. 3 and 4) (Malinverno et al., 2015; Saavedra-Pellitero et al., 2019). Calcidiscus leptoporus generally represents an average of 20.2 % of the total coccolithophore PIC in the New Zealand transect and 5.3 % in the Drake Passage but can occasionally reach maximum PIC contributions of 68.3 % (at station TR008 in the SAZ) and 31.1 % (at station PS97/017-1 in the SAZ) (Figs. 1 and 6).
A minor contribution from less abundant or rare species is found in the northern SAZ of both transects, where diversity is higher (for a species list, see Malinverno et al., 2015, and Saavedra-Pellitero et al., 2019), with a poleward decreasing trend and almost no contribution south of the SAF (Fig. 6). Emiliania huxleyi is responsible for almost all of the coccolith-estimated PIC in the PFZ, but its contribution decreases at the PF (in the Drake Passage), the southern ACC Front (in the New Zealand transect, ca. 63.7° S), and further south. Daily, weekly, and monthly satellite (MODIS Aqua) PIC values at the sampling locations are generally higher than the coccolith-estimated PIC in both transects. This difference is larger in the Drake Passage (Fig. 4) than in the New Zealand transect (Fig. 3). There are discrepancies in the absolute values, in addition to the already inherent variations in the weekly compared to monthly PIC estimates and the limited availability of the Level-2 data. These are particularly obvious at the PF (ca. 60° S in the Drake Passage) or to the south of it (ca. 62.5° S in the New Zealand transect), where the satellite-derived PIC and the coccolith-estimated PIC become decoupled, which is characterized by high reflectance in the satellite data but no coccolithophores in the AZ (Figs. 7 and 8).
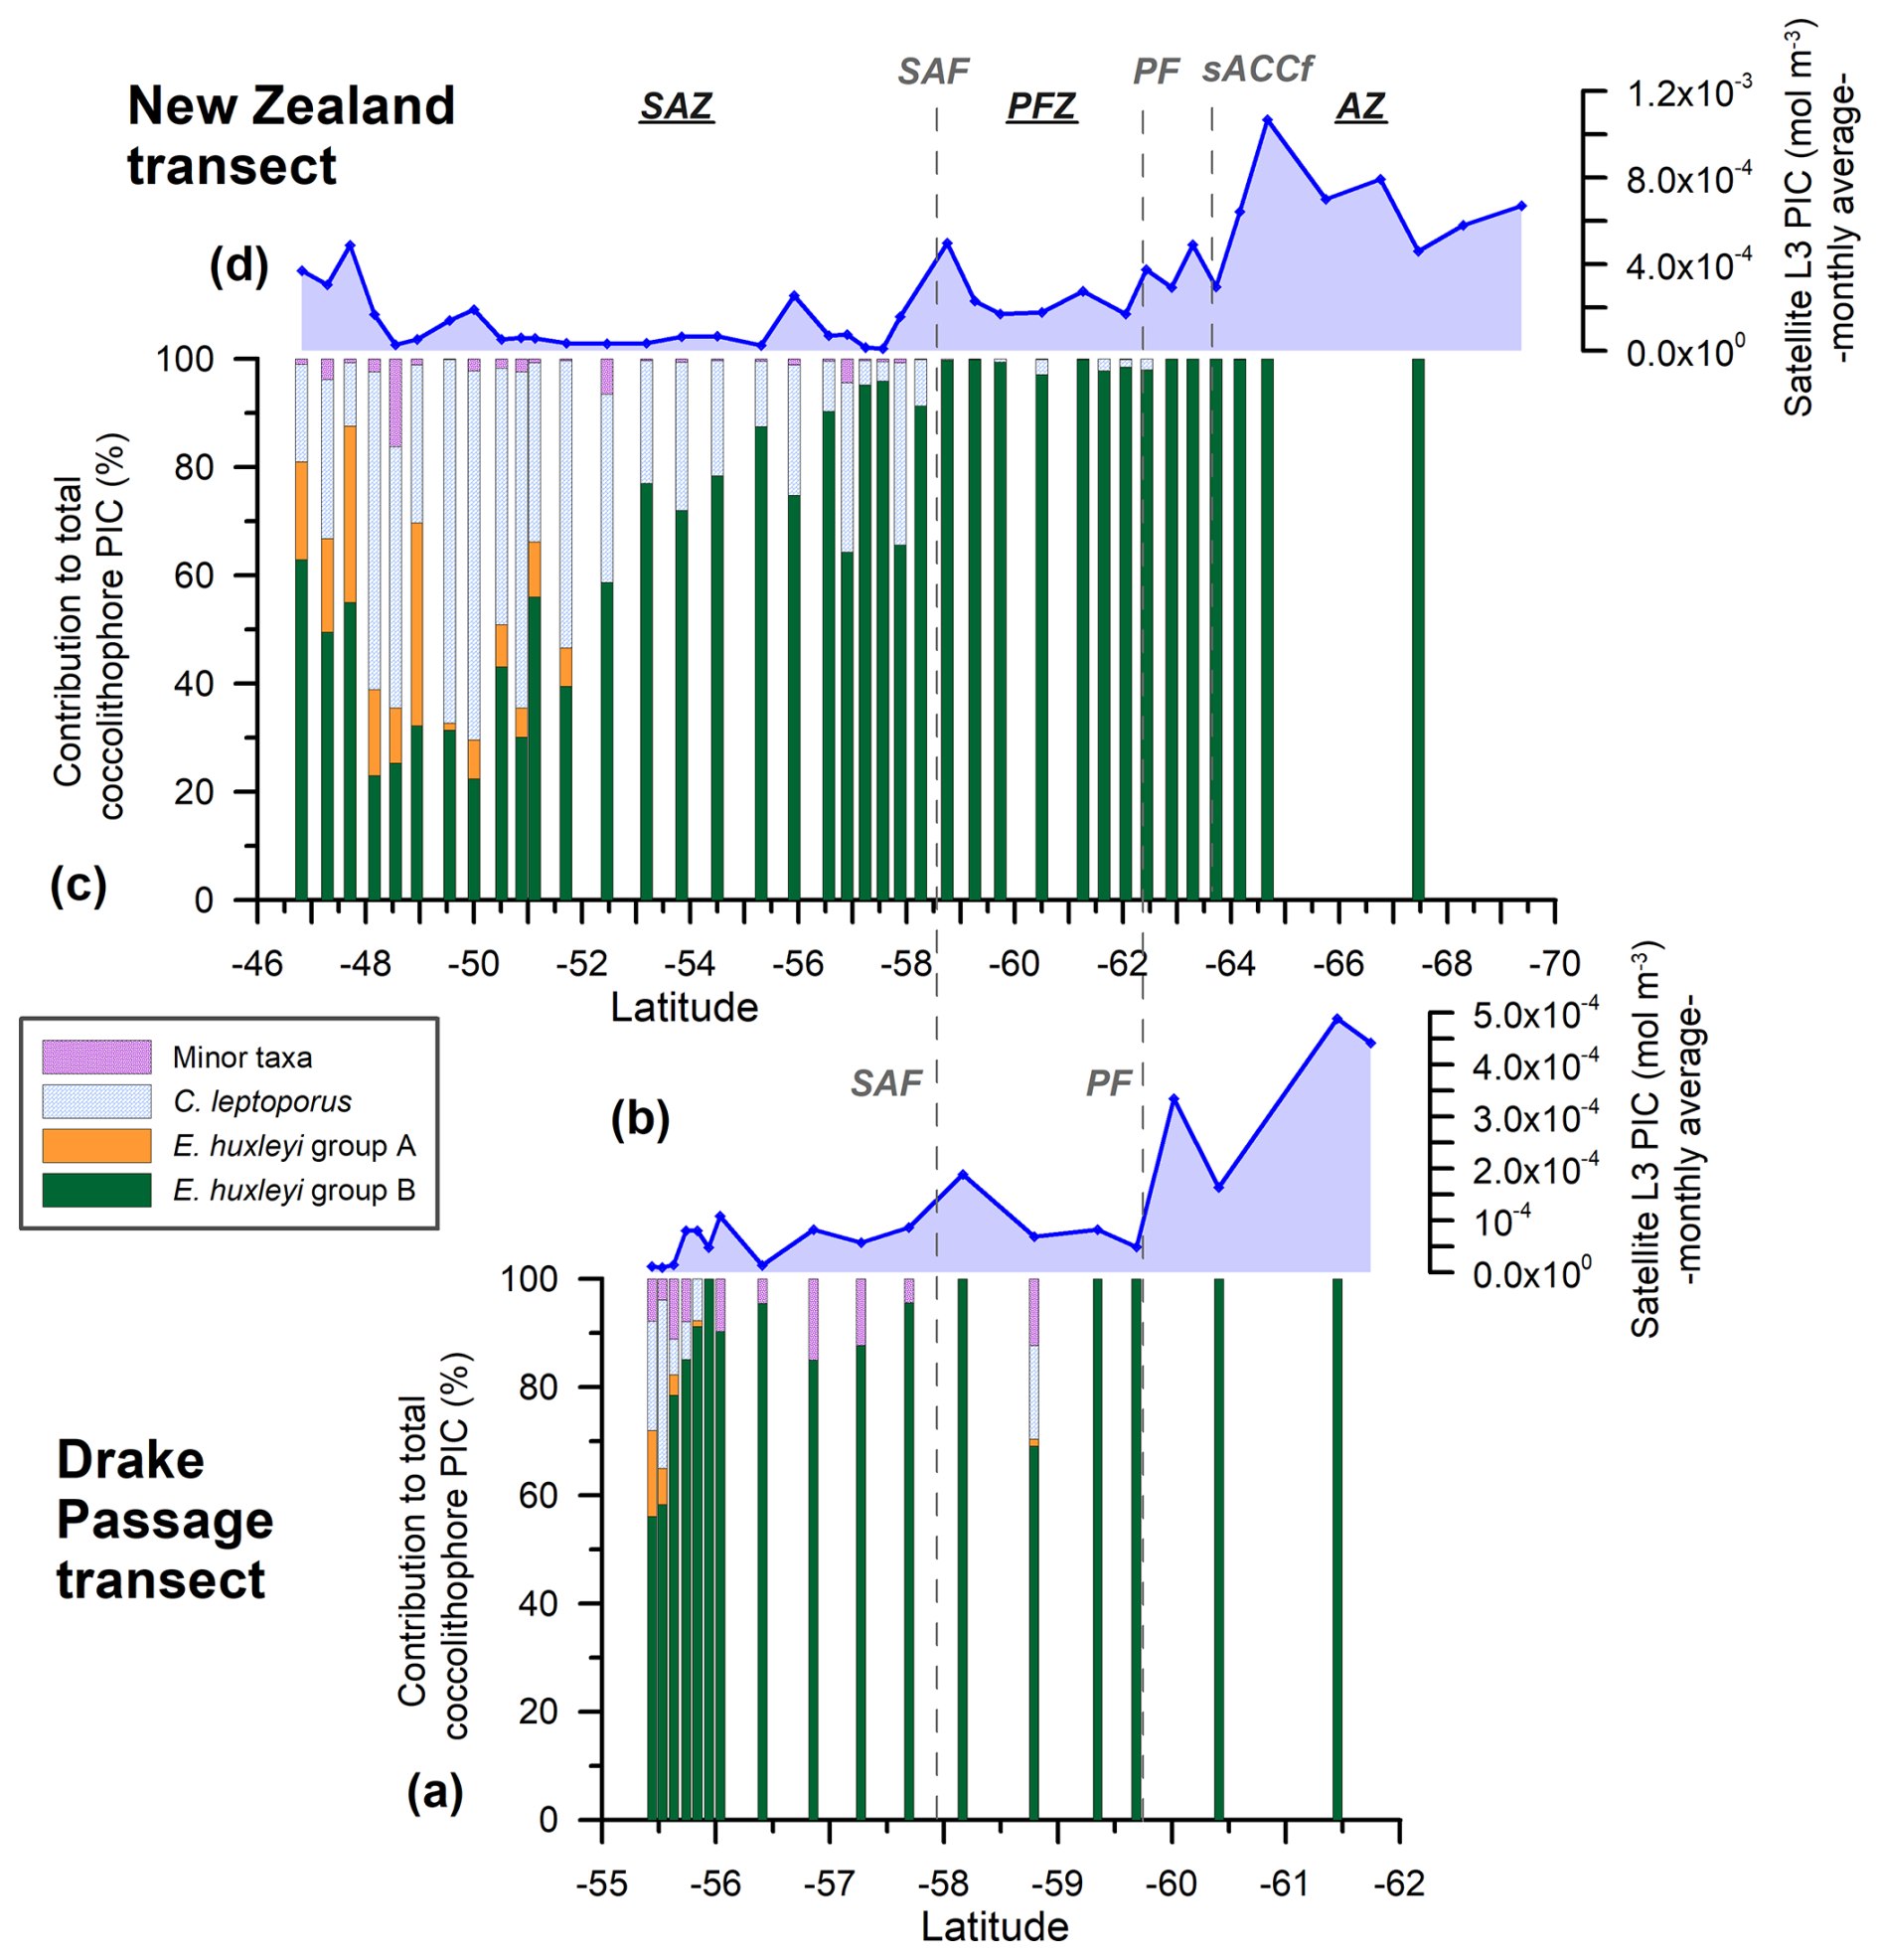
Figure 6New Zealand (NZ) and Drake Passage (DP) transects showing (a, c) the relative PIC contributions of the different nannofloral taxa (E. huxleyi morphogroups A and B, Calcidiscus leptoporus, and minor species) to the estimated coccolithophore PIC in 38 NZ samples and 17 DP samples bearing coccospheres. (b, d) MODIS Aqua Level-3 monthly average satellite-derived PIC values (February and March 2016, dark-blue line with diamonds) (mol m−3). The vertical dashed lines indicate two of the ACC fronts (Orsi and Harris, 2019): SAF and PF. The Southern Ocean zones are labeled SAZ, PFZ, and AZ.
5.1 PIC variability in the SAZ and PFZ
In the studied transects, the coccolith-estimated PIC and the satellite-derived PIC show a comparable trend in the SAZ and PFZ, but there is a strong discrepancy in the AZ (Fig. 7). The fact that the coccolith-estimated PIC is generally lower than the satellite-derived PIC in the SAZ and PFZ (Figs. 3, 4, and 7) could be due to an underestimation of the calculated species-specific coccolith PIC. The potential assumptions linked to the coccolith-estimated PIC, including Ks, L, the number of coccoliths per coccosphere, and/or the number of coccolith layers per cell (Table 3), have associated uncertainties. Although we have tried to minimize these errors by measuring the actual coccolith size range and counting the number of coccoliths per coccosphere (rather than using assumed values), the total error can still add up to ± 15 % and even ± 50 % (Young and Ziveri, 2000; Figs. 3 and 4). Additionally, the fact that the difference between coccolith-estimated PIC and satellite-derived PIC is greater in the Drake Passage transect than in the New Zealand transect may be partly due to the fact that detached coccoliths (in addition to coccospheres) were only included in the estimates for the New Zealand transect.
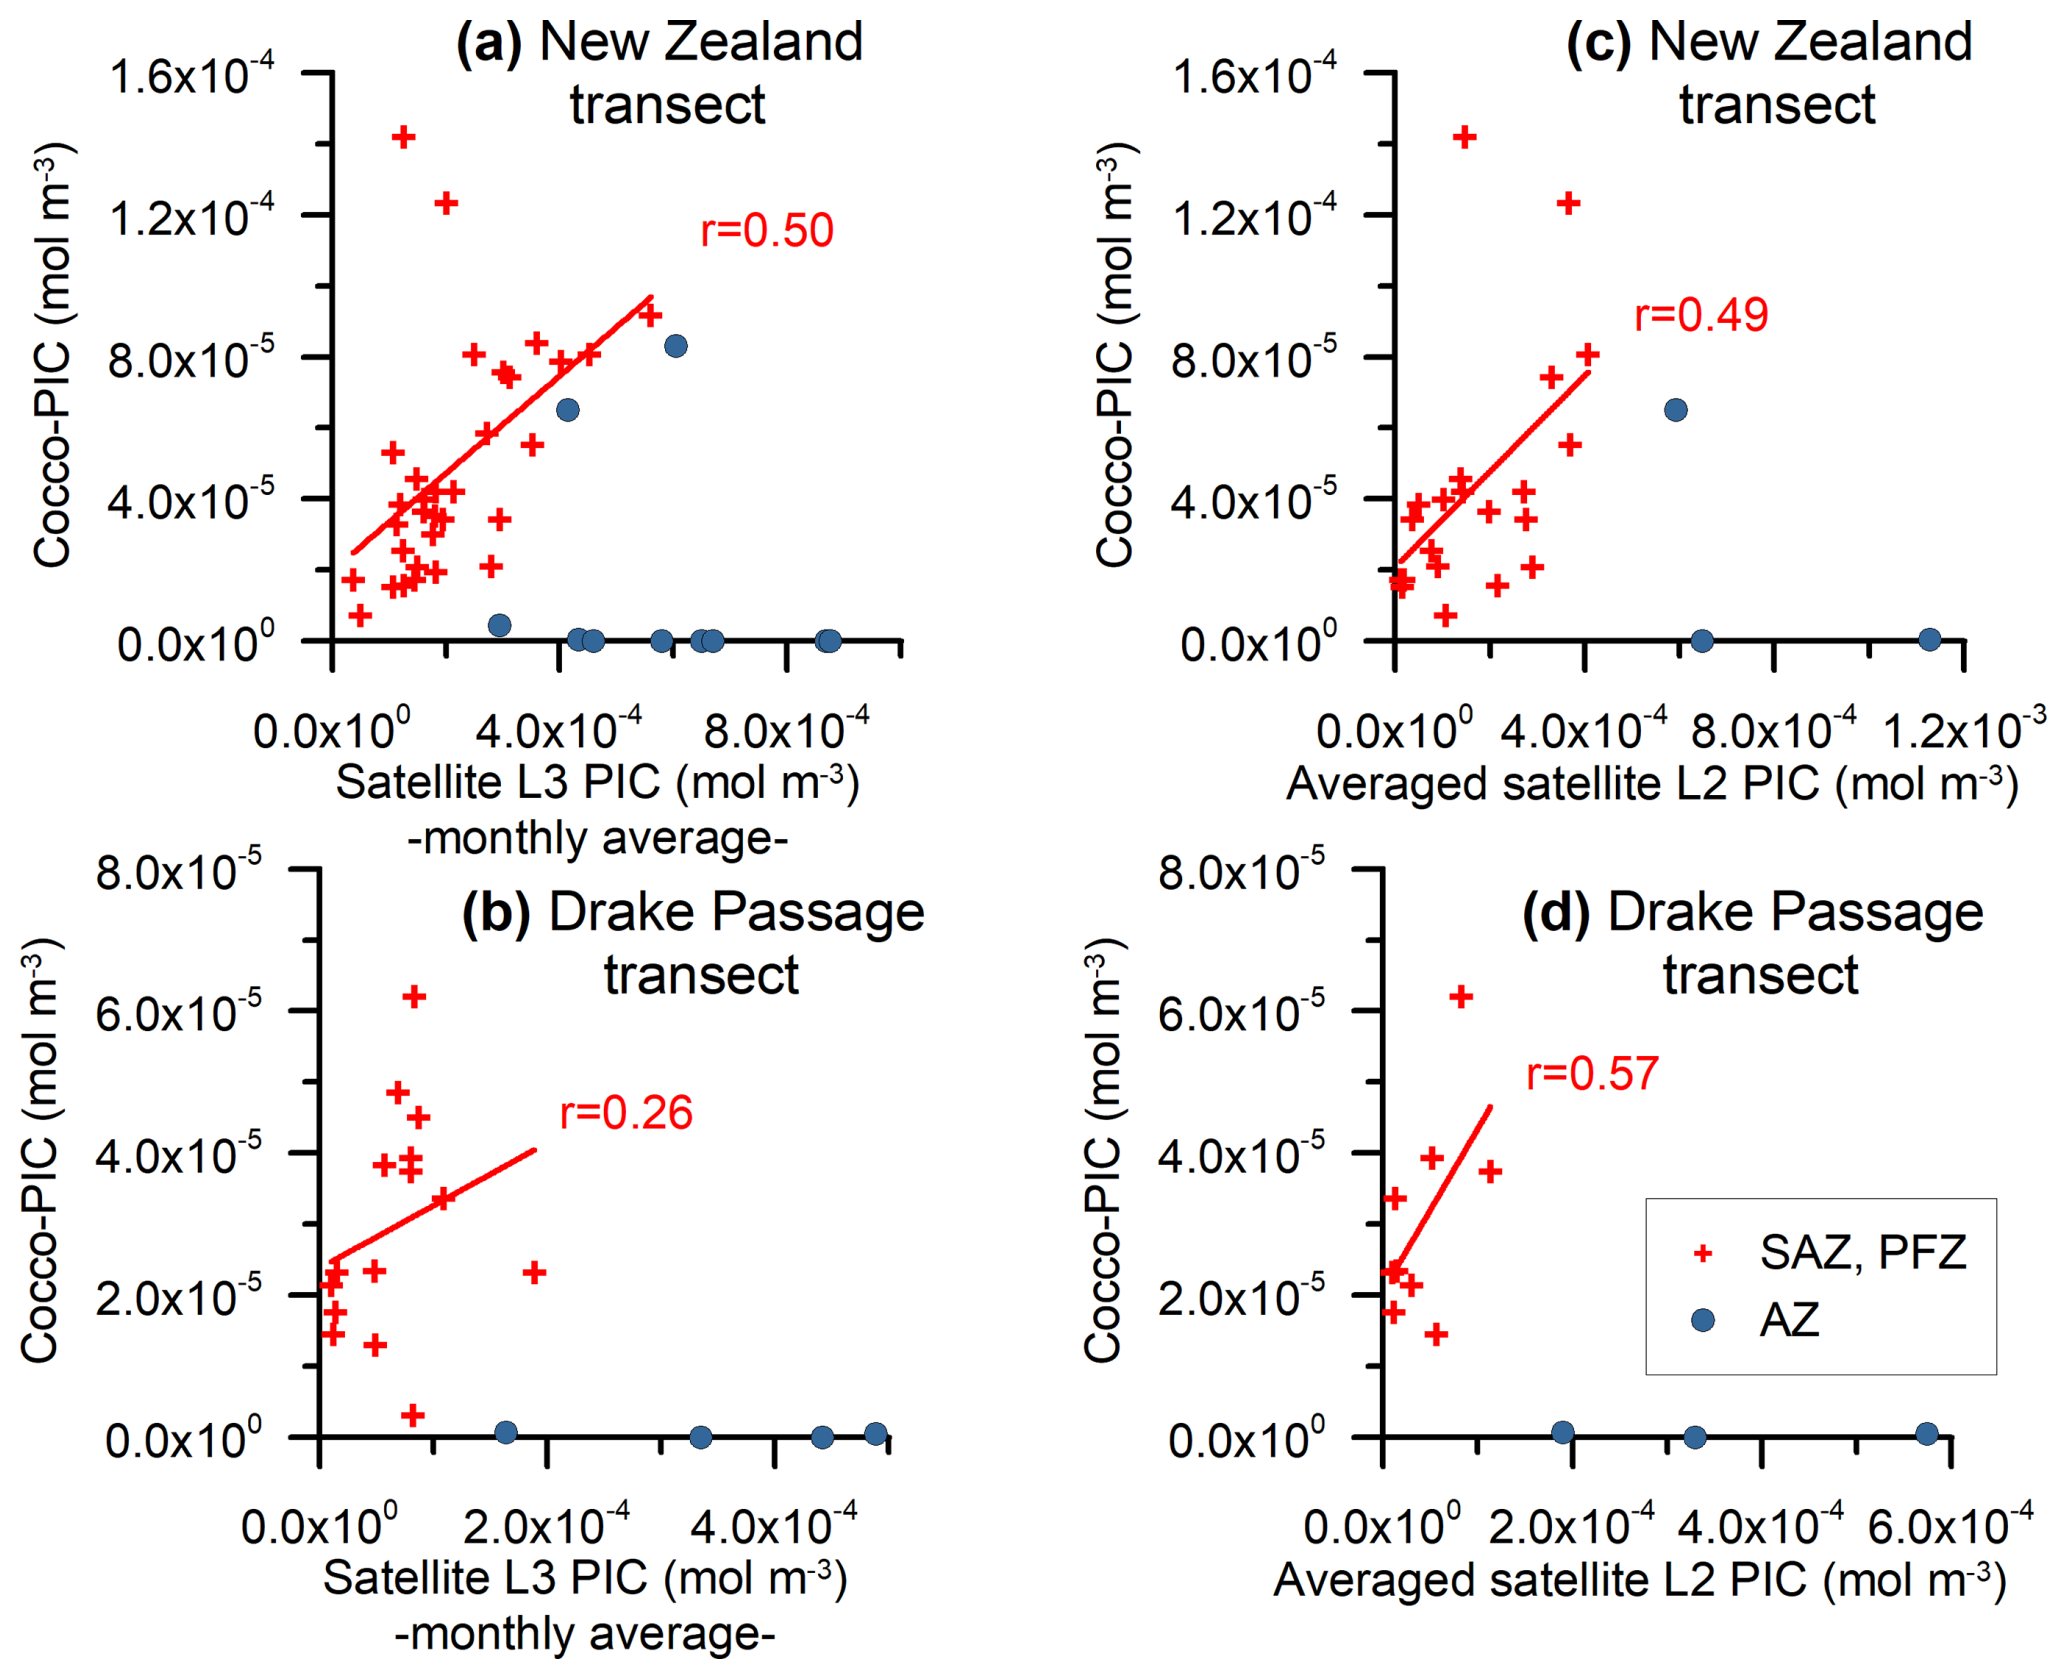
Figure 7Monthly MODIS Aqua Level-3 PIC values and the estimated total coccolithophore PIC for the (a) New Zealand and (b) Drake Passage transects (mol m−3). Averaged MODIS Aqua Level-2 PIC values and the estimated total coccolithophore PIC for the (c) New Zealand and (d) Drake Passage transects (mol m−3). The samples located in the SAZ and PFZ have been indicated with crosses and those located in the AZ with dots. A regression line and the Pearson correlation coefficient (r) have been indicated for the samples in the SAZ and PFZ.
Given that E. huxleyi is the dominant species and the main contributor to the coccolith-estimated PIC in the SAZ and PFZ of both transects (Fig. 6), we focused on its abundance, morphotype distribution, morphometrics, and calcite mass per coccolith to assess potential PIC discrepancies. Overall, our morphometric data from selected samples along the New Zealand and Drake Passage transects show (1) differences in calcification between the different E. huxleyi morphotypes, which are particularly evident in type A (Figs. 3, 4, and 6); (2) a large scatter of the relative tube width within the morphotypes and within each sample that is particularly pronounced in the New Zealand transect (Figs. 3 and 5); and (3) a slight decreasing trend in coccolith size and degree of calcification in the Drake Passage (Figs. 4 and 5) that is not observed in the New Zealand transect. This suggests that environmental influences have no significant effect on the degree of calcification but clearly control the distribution of E. huxleyi morphotypes (which are genetically determined; Bendif et al., 2023) and thus indirectly affect the coccolith mass variation. This could also explain the southwards decreasing trend in calcification in the Drake Passage, as the relatively large and heavily calcified type-A coccospheres occur almost exclusively in the northern parts of both transects.
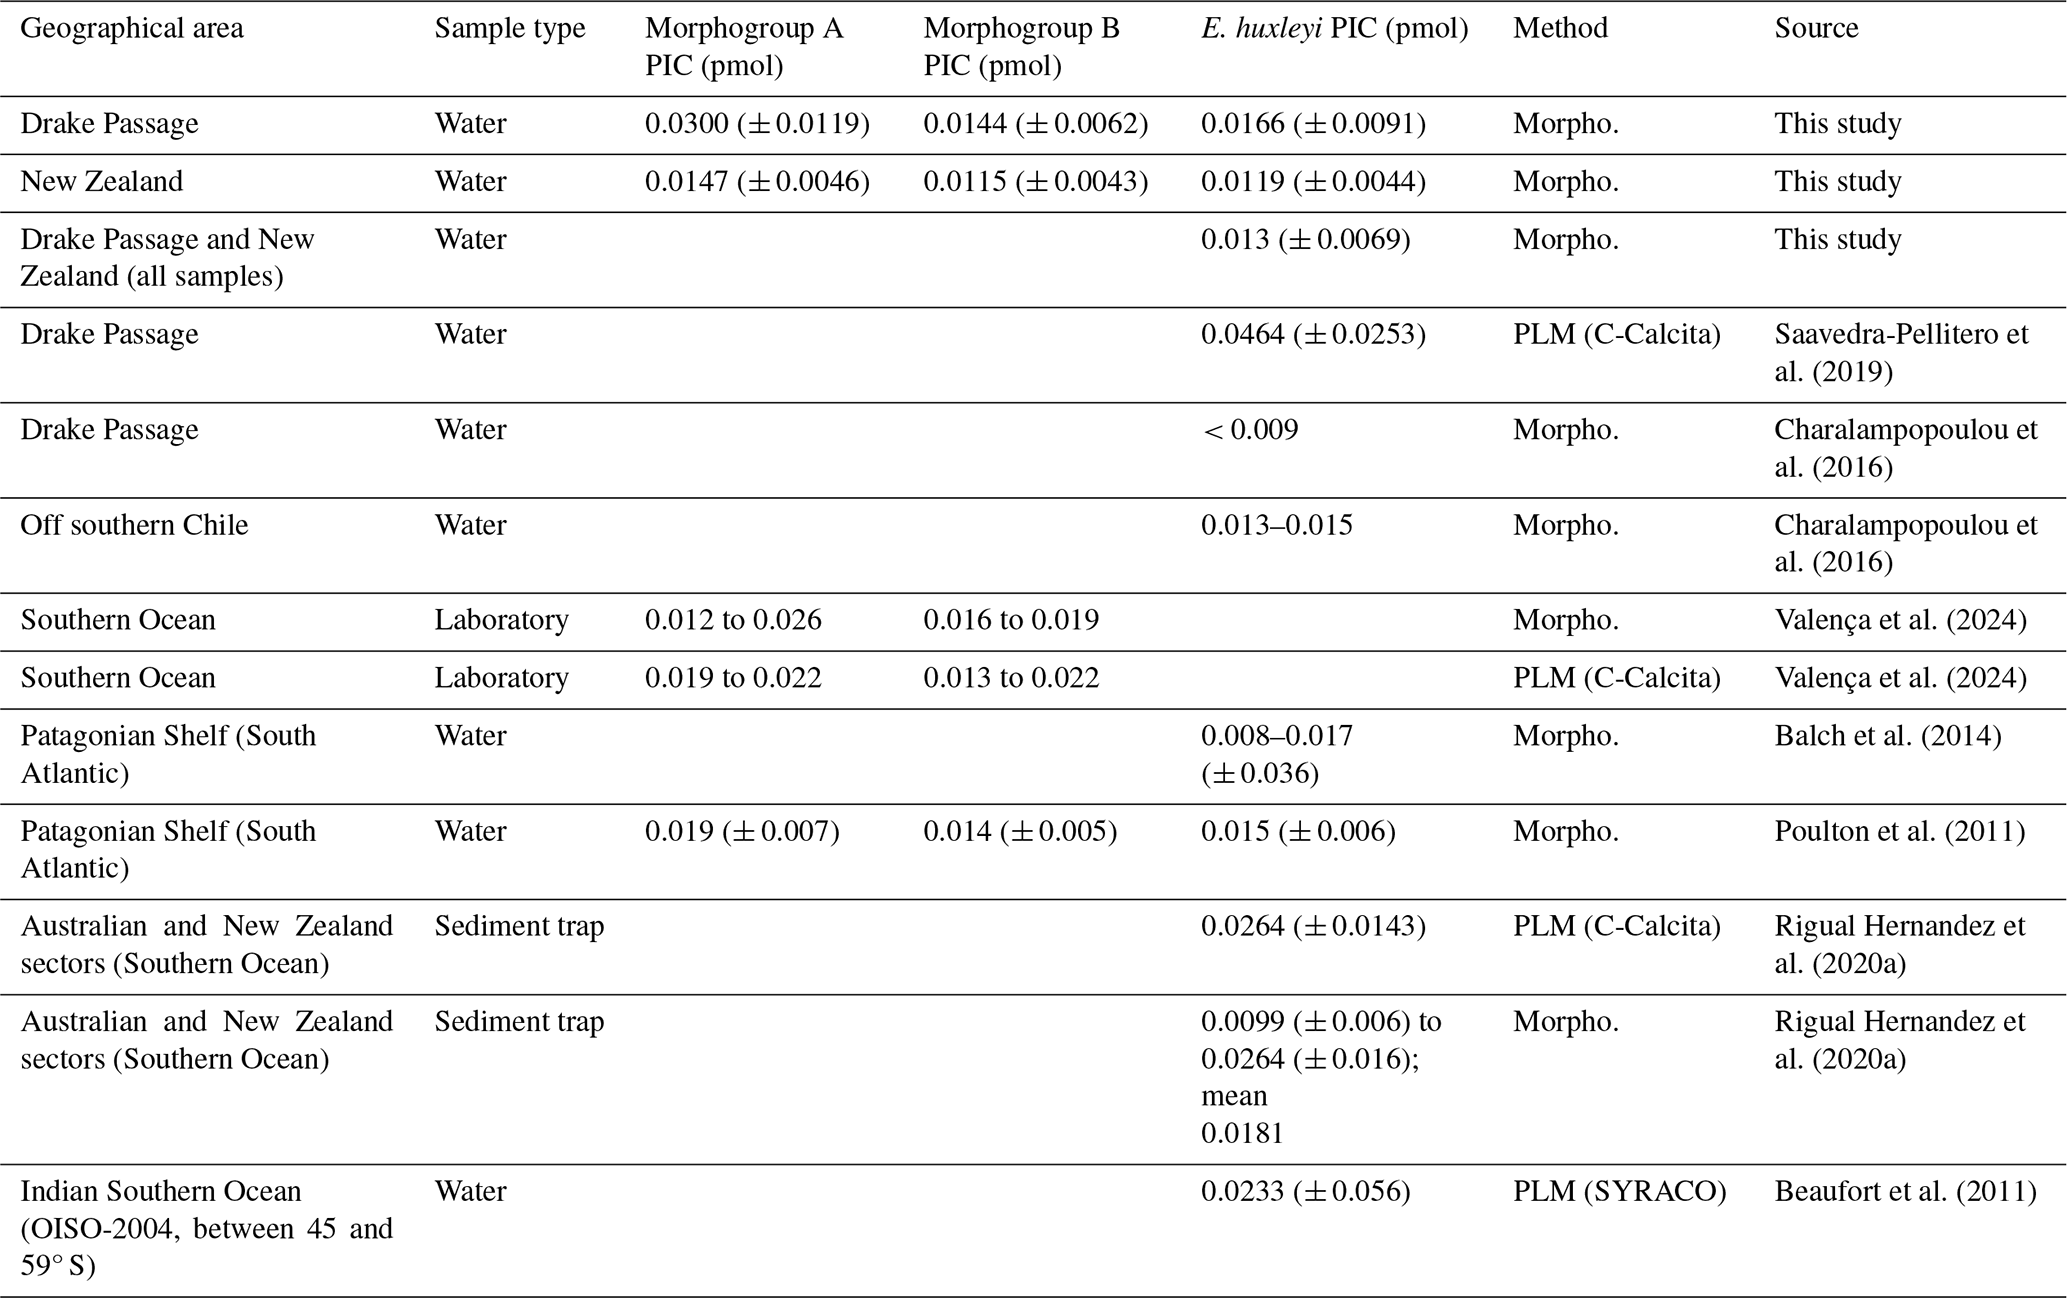
The coccolith-estimated PIC for E. huxleyi is generally in agreement with the calcite content per coccolith obtained by Balch et al. (2014) and Poulton et al. (2011) along the Patagonian Shelf and by Charalampopoulou et al. (2016) off southern Chile (Table 5). However, our E. huxleyi PIC estimates are generally higher than those estimated by Charalampopoulou et al. (2016) in the rest of the Drake Passage. Our values are slightly lower than those obtained by Rigual Hernández et al. (2020a) in the Australian and New Zealand sectors of the SO, those from the same latitudinal range in the Indian SO obtained by Beaufort et al. (2011), and the coccolith-based PIC values obtained by Valença et al. (2024) using various methodologies in laboratory-cultured specimens (Table 5). Our E. huxleyi PIC estimates are also notably lower than the values obtained by Saavedra-Pellitero et al. (2019), who used circularly polarized light plus the C-Calcita software developed by Fuertes et al. (2014) across the Drake Passage (Fig. 9a). The mass estimates by Saavedra-Pellitero et al. (2019) for the same samples, for which an average mass of 4.64 ± 2.53 pg (i.e., 0.0464 ± 0.0253 pmol per coccolith) was assumed for E. huxleyi (n=796) without distinguishing between different morphotypes (Fig. 9c), are 2.8 times higher than in our current study (Table 5). We extrapolated the potential contribution of the remaining coccolithophore taxa by this factor (i.e., multiplied by 2.8 times the PIC values calculated in this study for C. leptoporus and minor species) (Fig. 9c). N–S coccolith mass and PIC trends mirror each other, showing that both methods are valid for tracking PIC variations, but the C-Calcita-derived PICs tend to overestimate satellite-derived PIC values, except in a couple of locations. This can be attributed to the calibration of the coccolith thickness within the C-Calcita software, which has been improved in recent years with the use of a calcite wedge instead of a calcareous spine (e.g., Guitián et al., 2022). The generally higher mass coccolith values using polarized light microscopy compared to morphometric approaches in the same sample set have already been observed in previous studies (e.g., Rigual Hernández et al., 2020a), but due to recent technical developments the results from these two methods are becoming more comparable (e.g., Valença et al., 2024).
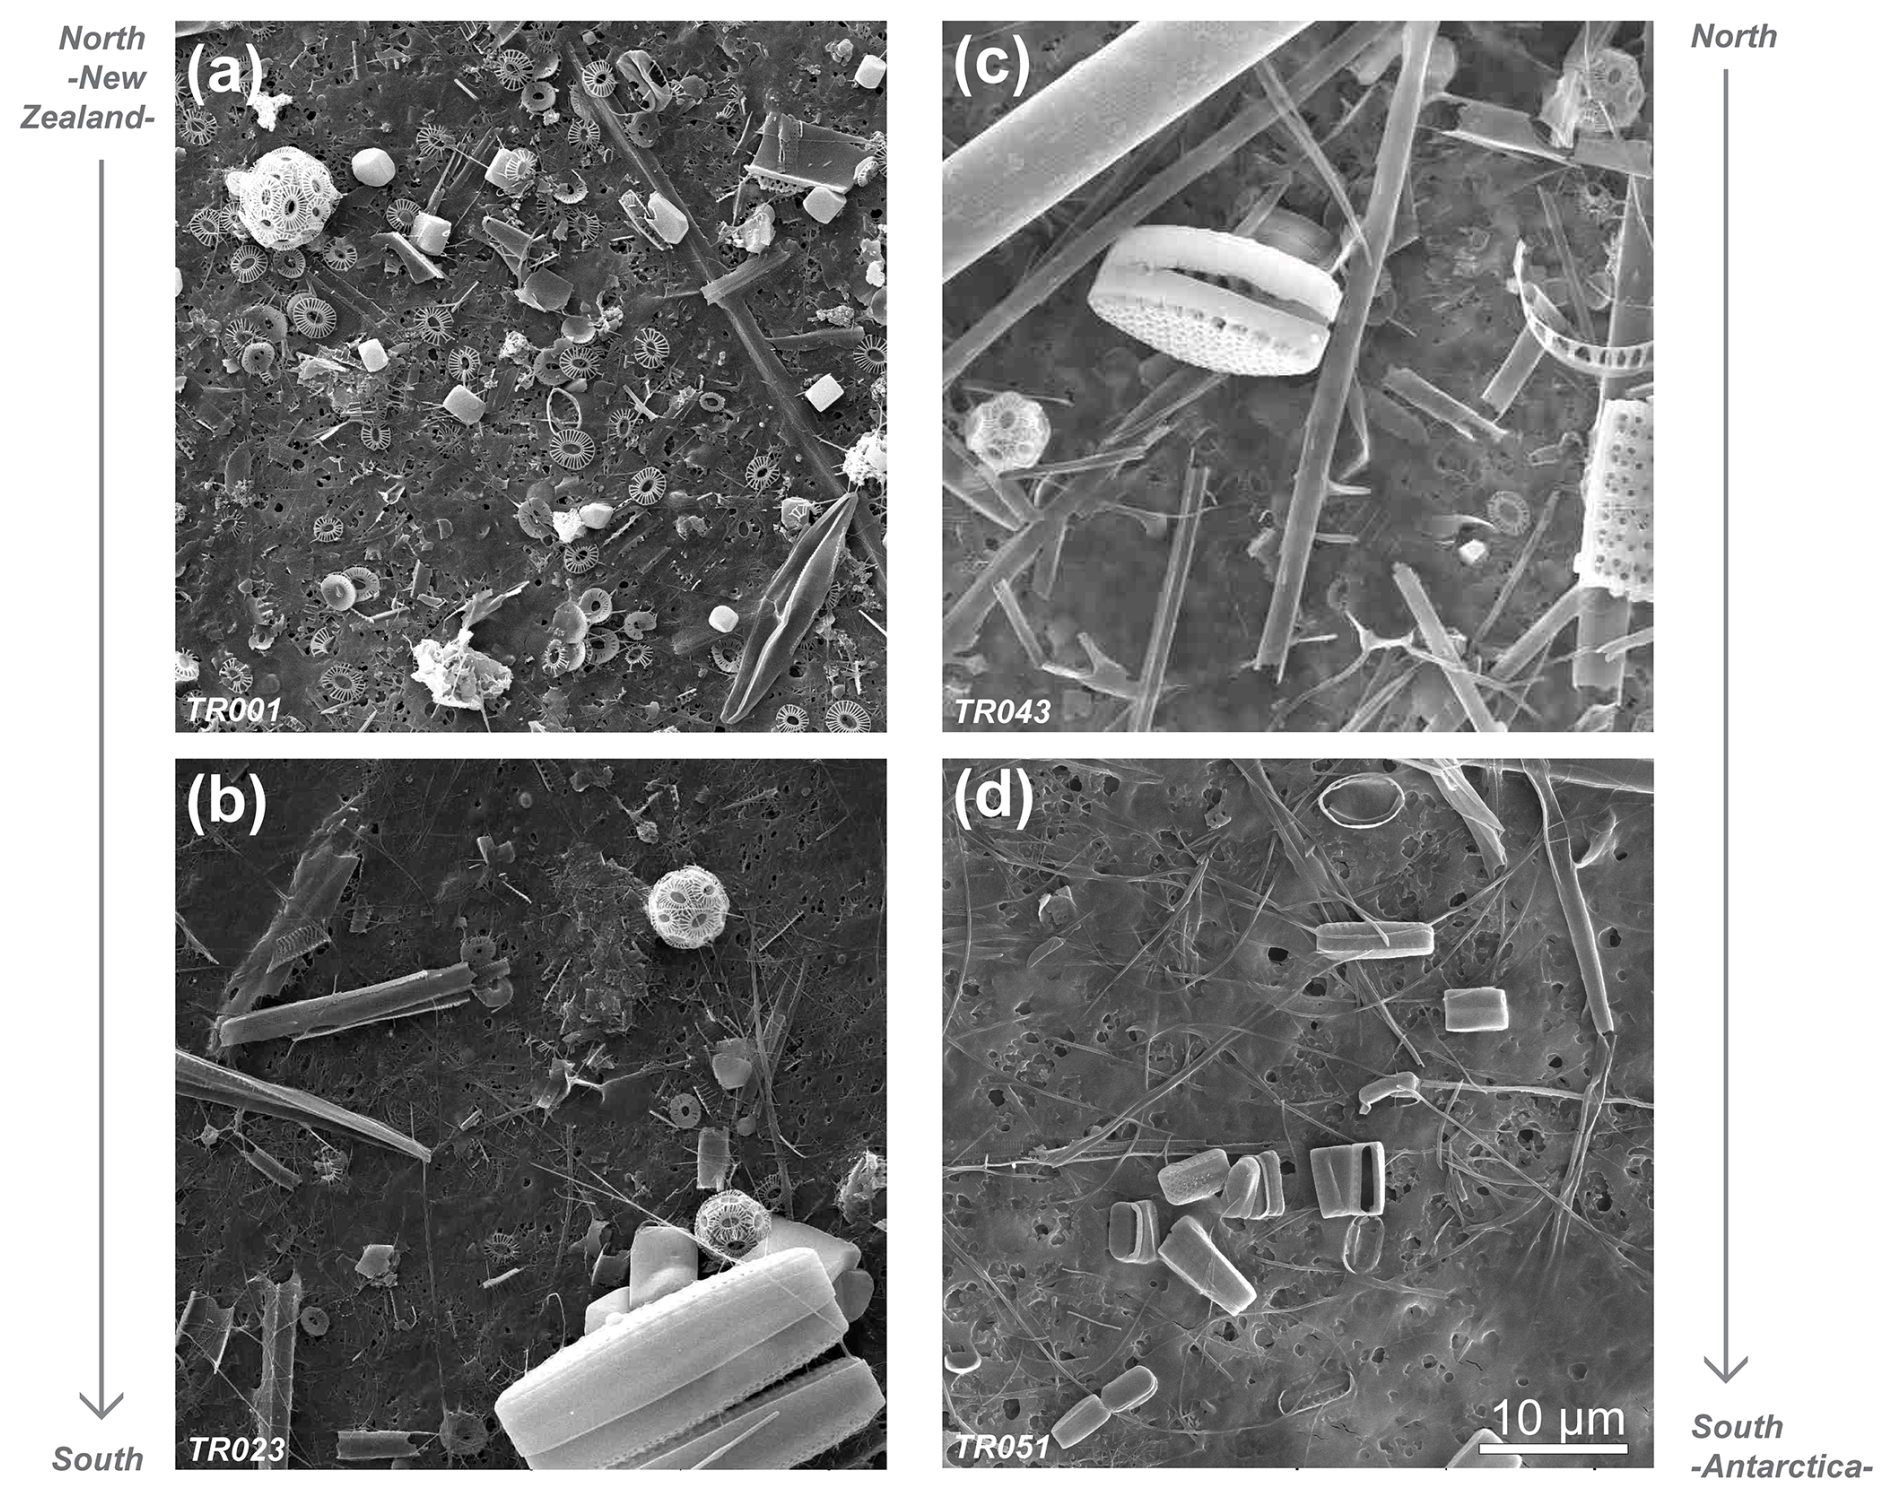
Figure 8SEM pictures of samples retrieved in the Subantarctic Zone (a, b) and south of the Polar Front (c, d) in the New Zealand transect.
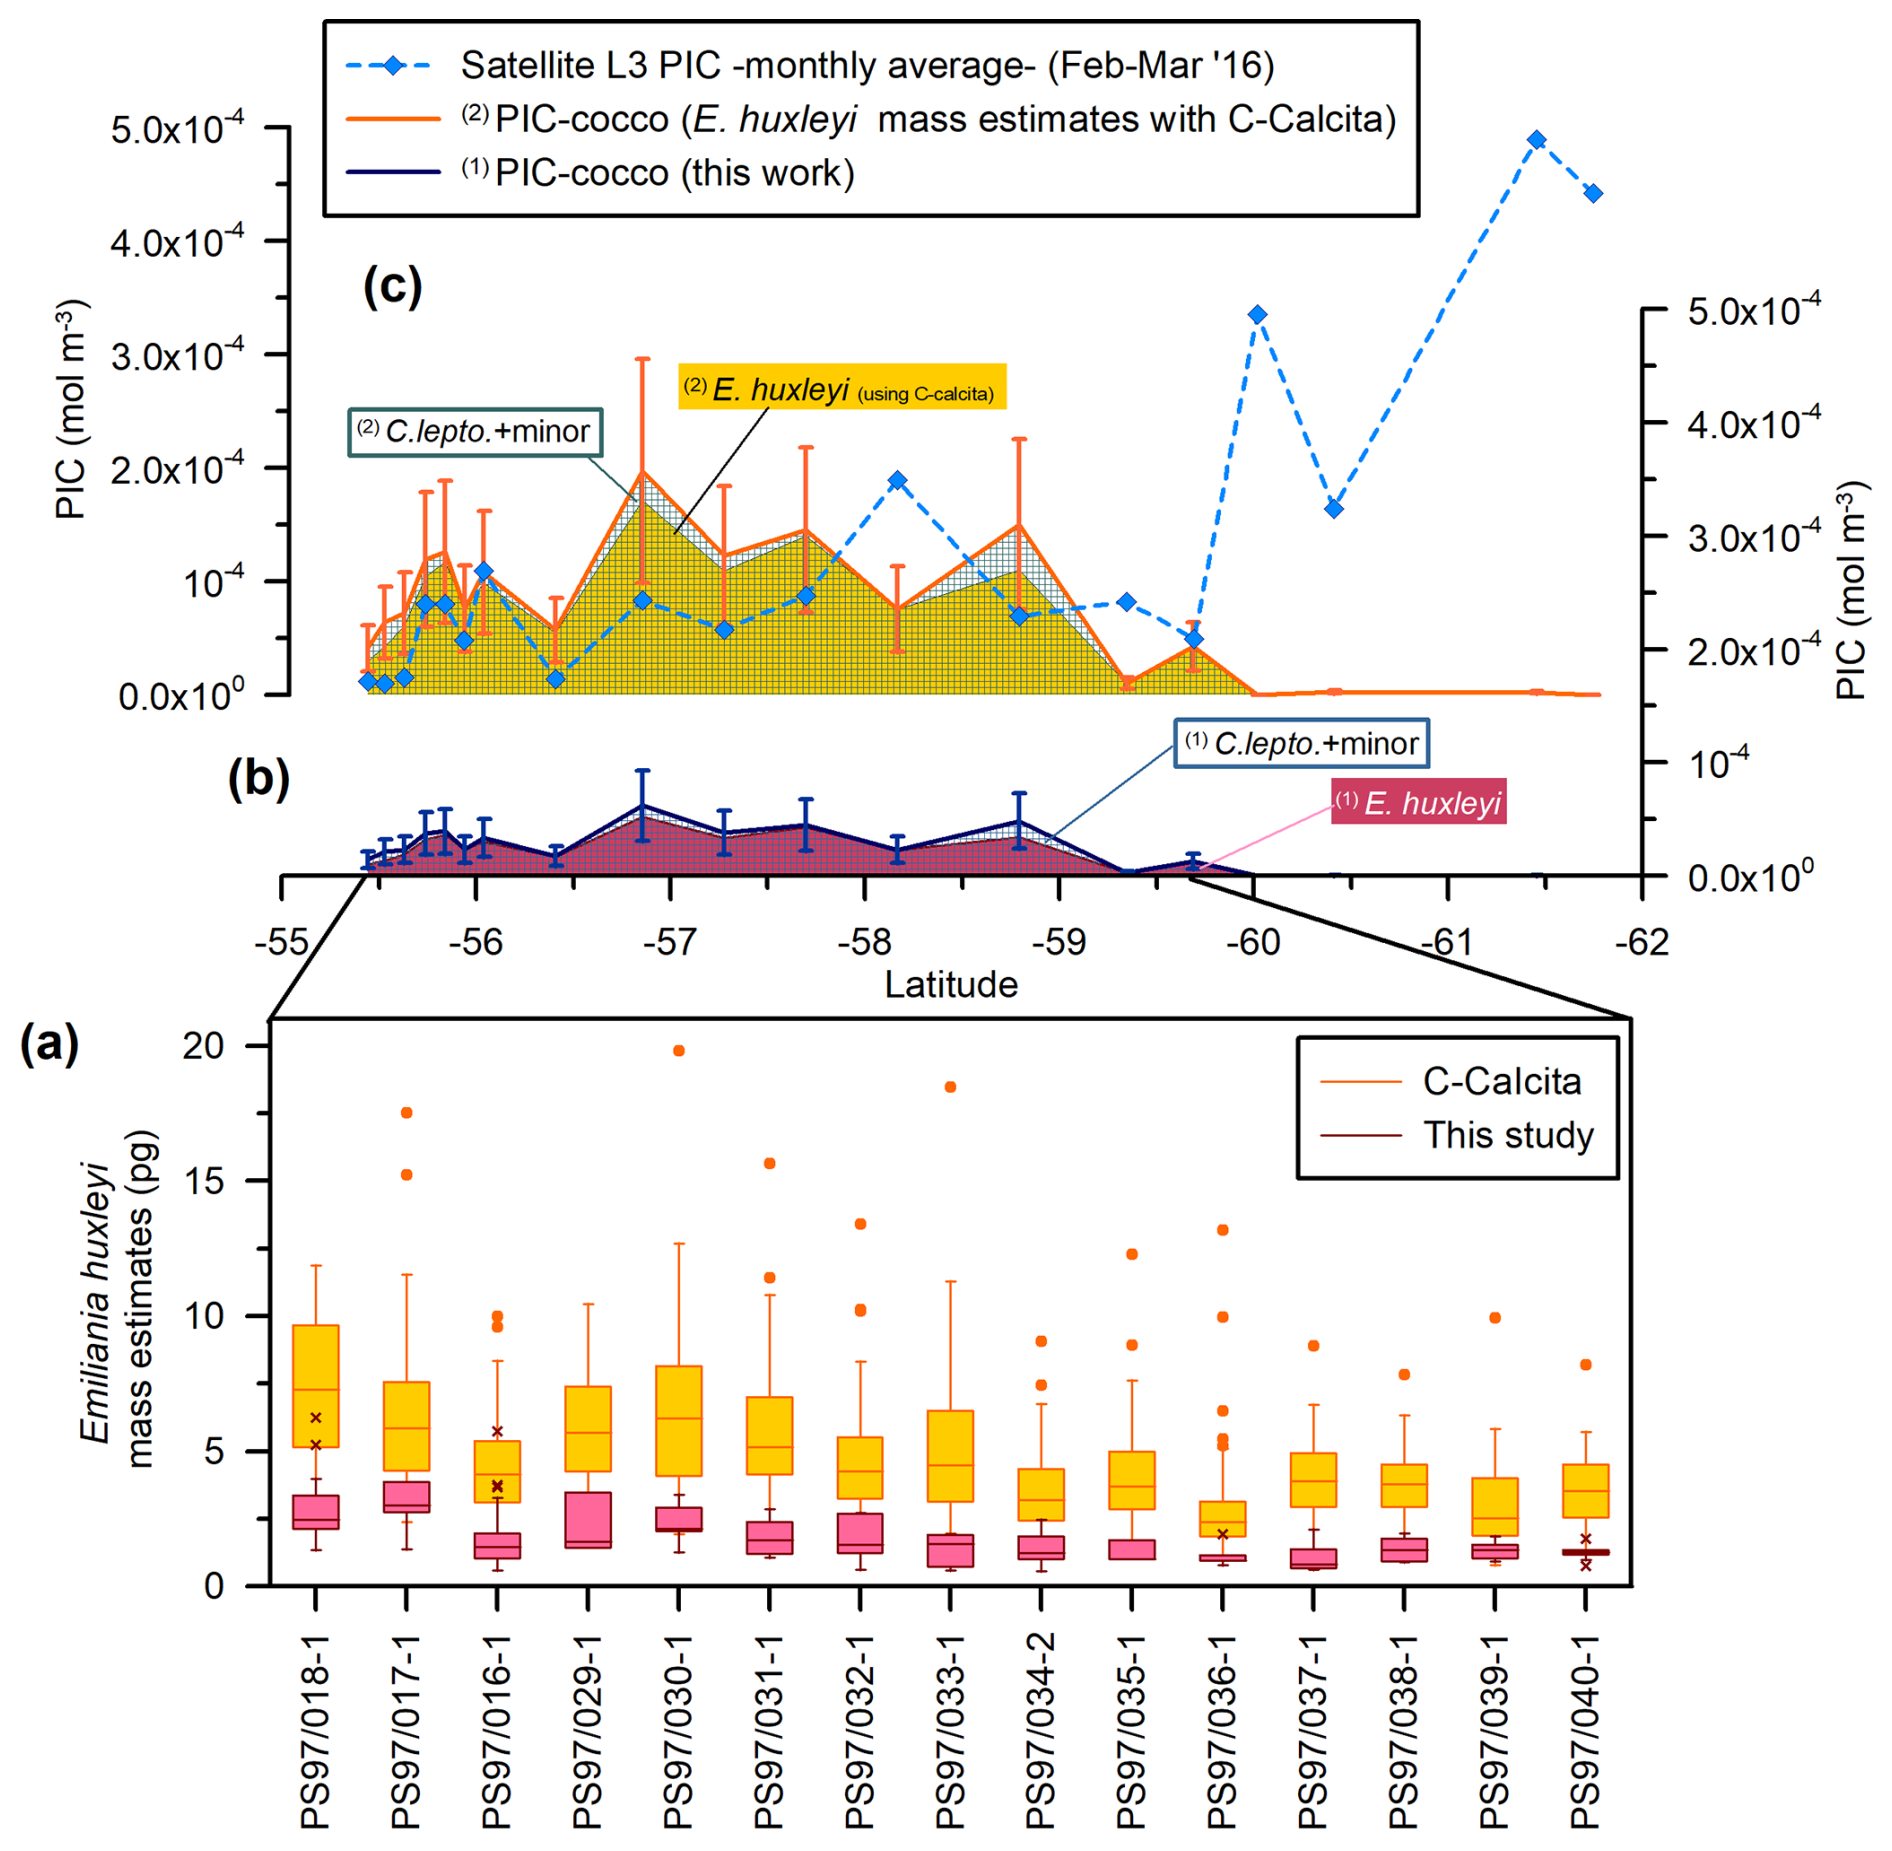
Figure 9Drake Passage latitudinal transect showing (a) coccolith mass estimate boxplots (pg): in dark red plus pink for this study (outliers are indicated with an “x”) and yellow plus orange for Saavedra-Pellitero et al. (2019) (outliers are indicated with a dot). (b) Estimated coccolithophore PIC (“PIC-cocco”) (mol m−3) (this study). (c) MODIS Aqua Level-3 monthly average satellite-derived PIC values (blue dashed line with diamonds) and PIC-cocco calculated considering the averaged Emiliania huxleyi mass estimates obtained with the C-Calcita software (Saavedra-Pellitero et al., 2019). Note that the contributions of the different coccolith taxa or groups have been indicated (C. lepto.: Calcidiscus leptoporus; minor: minor species) and that the data are stacked for each of the approaches. The vertical bars in panels (b) and (c) represent a 50 % error.
Table 5Emiliania huxleyi coccolith mass estimates (this study and other published papers). Note that all of the PIC has been converted into picomoles per coccolith and that the method used has been indicated (Morpho.: morphometrics; PLM: polarizing light microscopy; SYRACO: SYstème de Reconnaissance Automatique de COccolithes). The standard deviation has been included whenever it was available.
In the AZ (south of about 62.5° S in the New Zealand transect and about 60° S in the Drake Passage), high reflectance is detected by remote sensing but is not associated with a coccolithophore bloom (Figs. 3, 4, and 7). Concentrations of E. huxleyi, which show maximum numbers in the PFZ in the New Zealand transect and moderate values in the Drake Passage, drop southward of this location on the southern ACC Front and the PF (Malinverno et al., 2015, 2016). Satellite data show the different impacts of the ACC fronts on the distribution of E. huxleyi (Holligan et al., 2010): in the Drake Passage, where the fronts are strictly constrained by topography, E. huxleyi is bounded by the PF to the south (Saavedra-Pellitero et al., 2019), while in the eastern Scotia Sea, where the ACC fronts are broadly separated, E. huxleyi spreads out between the PF and the southern ACC Front (Holligan et al., 2010; Poulton et al., 2011, 2013). This pattern also emerges from the compilation by Malinverno et al. (2016), which shows that the southern ACC Front marks the southern boundary in the different SO sectors. Occasional occurrences of E. huxleyi south of the southern ACC Front have been documented south of Tasmania and in the Weddell Sea in certain years by conventional micropaleontology observations (e.g., Winter et al., 1999; Cubillos et al., 2007) as well as in the Australian sector of the SO and in the Scotia Sea using surface reflectance data only (Holligan et al., 2010; Winter et al., 2014). However, in our study, E. huxleyi is constrained by the southern ACC Front, corresponding to a maximum sea surface temperature of 1 °C in the New Zealand transect.
The different taxonomic considerations of E. huxleyi in different studies make it difficult to compare and combine data, especially in light of recent advances in the field. Given the dominance of this taxon in the SO, a key area for global warming and ocean acidification studies, the efforts of the scientific calcareous nannofloral community should focus on a more standardized classification of E. huxleyi morphotypes. However, differentiation and recognition of the various morphotypes are time-consuming and tedious and play only a minor role in the calculation of the total coccolithophorid PIC, as observed in other areas of the SO (e.g., Rigual Hernández et al., 2020a, b). The changes in mass within the B morphotype (which includes types B/C-C, C, and O) in the two transects are negligible in the PIC calculation, while a differentiation into morphogroups A and B still has an influence on the calculation of PIC. Specimens of E. huxleyi belonging to morphogroup A only occur in the northern areas of both transects, where they play a limited role together with the PIC input from other massive species such as C. leptoporus (Fig. 6). Overall, the changes in the total coccolithophore PIC in the study area are caused by the abundance and occurrence within the entire coccolithophore community rather than the different carbonate masses or the southward changes in morphotype composition along both SO transects. The relative contributions of the different E. huxleyi A and B morphogroups to the coccolithophore PIC in the SO deserve further exploration in light of the rapid development of remote sensing and the recent evolution of machine learning approaches for PIC estimates.
5.2 Assessing potential biases in PIC estimates for the AZ
The generally higher satellite-derived PIC numbers compared to the coccolith-estimated PIC values in the SAZ and PFZ (Figs. 3, 4, and 7) could also be due to the presence of other carbonate-forming organisms (and/or their fragments). For example, foraminifera can contribute a significant fraction of the total PIC in the SO south of Australia, especially between 55 and 60° S (Trull et al., 2018). We do not have data for the Drake Passage, but planktonic foraminifera were observed in the filter samples across the New Zealand transect, showing increased abundance (together with the tintinnid species Codonellopsis pusilla) in the PFZ (see Malinverno et al., 2016, for further details). Although foraminifera and other hard-shelled microzooplankton PIC particles provide negligible backscatter per unit mass (Balch et al., 1996), they can be a source of error in the PIC volume calculation when considering only coccolithophores. Assessing the significance of carbonate-forming organisms relative to other taxa in the SO is an important topic but goes beyond the scope of this paper.
In addition to the described challenges in calculating species-specific coccolith PICs, the observed discrepancies between satellite-derived PIC values and coccolith-estimated PIC values may result from a combination of several other factors related to the sensitivities and limitations of the PIC algorithm (Mitchell et al., 2017; Balch and Mitchell, 2023; NASA Ocean Biology Processing Group, 2023), differences in spatial and temporal resolution (Table 4), and environmental factors (e.g., turbidity or other particulate matter that can affect the accuracy of satellite-derived PIC estimates). MODIS-derived Level-2 PIC data were limited due to the cloudy skies of the SO during the sampling period (see Figs. S1 and S2). To mitigate the impact of these data gaps on our analysis, we extended the time window for data extraction to several days and computed the mean for each location whilst also using Level-3 products. This approach could obscure potential variability at shorter temporal scales and create discrepancies when comparing it with sample measurements taken on specific days. The fact that the overall trends are comparable in the New Zealand and Drake Passage transects (Fig. 7) could also suggest a satellite bias linked to the algorithm. We are aware that MODIS Aqua Ocean Color was reprocessed in 2022 to incorporate updates into instrument calibration, new ancillary sources, and algorithm improvements (NASA Ocean Biology Processing Group, 2023), but the validation of the PIC measurements was based on a low number of in situ measurements compared to other products (e.g., 1347 in situ measurements for chlorophyll-a and just 42 for PIC, all of them in the Atlantic Ocean; NASA Ocean Biology Processing Group, 2023). The differences in PIC could also be due to the fact that we are comparing in situ values to weekly and monthly averages and smoothing data by considering averaged values when calculating coccolith-estimated PIC (especially the length and number of coccoliths per coccosphere). In addition, sampling at slightly different times of the year may have an influence on the PIC values that are determined (Rigual Hernández et al., 2018; Rigual-Hernández et al., 2020a, b).
Considering the differences in the two SO transects studied here, which were sampled 11 years apart, we could assume that surface coccolith-estimated PIC (up to 20 m water depth) underestimates satellite-derived PIC concentrations in the SAZ and PFZ. This discrepancy is evident in our data, where coccolith-estimated PIC concentrations calculated using different methodologies, such as C-Calcita, exceed those obtained from the satellite data. This indicates that there is still a need for improved precision and accuracy in coccolith-estimated PIC concentration methods. Therefore, it is crucial to refine existing methods and develop new algorithms to enhance both precision and accuracy.
The magnitude and spectral characteristics of water-leaving radiance detected by satellites are influenced by the inherent properties of the optically active constituents. These include (1) light scattering by PIC, other biogenic particles, or lithogenic material (e.g., Bi et al., 2023) as well as (2) light absorption by phytoplankton biomass (i.e., chlorophyll-a concentration) and dissolved organic matter (e.g., Reynolds et al., 2001; Ferreira et al., 2009). The strong correlation between high values of water-leaving radiance and high E. huxleyi PIC concentrations has been proven successfully in bloom areas (e.g., Gordon et al., 1988; Balch et al., 2005, 2011, 2014; Holligan et al., 2010; Balch and Mitchell, 2023; Oliver et al., 2023). However, not all bright waters are caused by E. huxleyi blooms, as shown by Broerse et al. (2003) in the Bering Sea, Balch et al. (2007) in the Gulf of Maine, and Daniels et al. (2012) in the Bay of Biscay. Suspended particles, which include reworked coccoliths, lithogenic material, or empty diatom frustules, could be responsible for high values of water-leaving radiance, at least in nearshore regions (Broerse et al., 2003; Balch and Mitchell, 2023).
The occurrence of bright waters along the studied transects should theoretically be constrained by the positions of the PF and the southern ACC Front. Malinverno et al. (2015, 2016) showed a significant shift in the community composition from carbonate to silica-dominated microfossils in the New Zealand transect at the southern ACC Front, with diatoms being the most abundant mineralized phytoplankton group in the transect (Fig. 3k). Coccolithophores disappear south of the southern ACC Front, and the composition of the siliceous phytoplankton changes from a dominance of large diatoms (Fragilariopsis kerguelensis) in the north to a dominance of small diatoms (such as the cold-adapted Fragilariopsis cylindrus) in the south, with a notable increase in spiny silicoflagellates (e.g., Stephanocha speculum var. coronata) and small siliceous plankton (Parmales, archeomonads) (Malinverno et al., 2016) coincident with high values of chlorophyll-a in the AZ (Figs. 3l and 8). Extant diatoms have not yet been studied in the exact same water samples collected during Expedition PS97. However, the abundance of fossil diatoms in surface sediments in the Drake Passage shows an increase south of the PF along with an increase in the relative abundance of siliciclastics and biogenic opal (Cárdenas et al., 2018). This contrasts with the relatively low satellite-derived chlorophyll-a concentration in the AZ (Fig. 4k), but this is only due to the very limited number of daily Level-2 data available. Fragilariopsis kerguelensis appears to dominate up to the southern ACC Front, and F. cylindrus is found south of this front in colder waters of the Drake Passage (Cárdenas et al., 2018).
Different alternatives have been suggested for the high reflectance in the AZ of the SO, such as microbubbles (mostly during storms), floating loose ice, high concentrations of other particulate matter such as glacial flour (especially close to the Antarctic continent), or Phaeocystis blooms (Balch et al., 2011; Balch, 2018; Balch and Mitchell, 2023). Our observations do not allow us to comprehensively determine the potential causes of this high reflectance, but we note that a high abundance of small opal biogenic particles, such as small-sized diatoms, silicoflagellates, and observed siliceous plankton (as well as their fragments), would be consistent with the observed high scattering of these waters, at least in the New Zealand transect (Figs. 1, 3, 4, S3, and S4), even though opal particles have a much lower refractive index than calcite (Balch, 2009; Costello et al., 1995).
The satellite-derived and coccolith-estimated PIC discrepancies observed in this work emphasize the importance of in situ measurements and sampling. This also highlights the need for further investigation into the factors influencing water-leaving radiance and the reliability of remote sensing estimates, especially south of the PF. Future research should focus on refining methodologies and satellite algorithms to improve the accuracy of PIC estimates and better understand the dynamics of coccolithophores, as well as phytoplankton and calcifying microzooplankton communities more generally in the Pacific sector of the SO (especially compared to other sectors). Such efforts will enhance our understanding of carbon cycling and its impact on marine ecosystems at high latitudes.
The comparison between particulate inorganic carbon (PIC) derived from satellite data and coccolithophore morphometric-based estimates in two transects of the Pacific sector of the Southern Ocean (separated in time and space) demonstrates the limited availability of high-quality satellite-derived data (mostly due to atmospheric conditions) and the need to refine methodologies to accurately produce coccolith-estimated PIC. Based on our data, the following conclusions can be drawn:
-
Emiliania huxleyi is the predominant coccolithophore species contributing most to the total sea surface coccolith PIC in the New Zealand transect (mainly sampled in 2005) and in the Drake Passage (sampled in 2016). Calcidiscus leptoporus may occasionally contribute significantly to the total coccolithophore PIC at certain locations, whereas the rest of the coccolithophore taxa contribute only marginally in the studied areas.
-
Emiliania huxleyi consists of several morphotypes, which have different, partly overlapping geographical distributions. The relatively massive type-A morphogroup occurs in the northern Subantarctic Zone (SAZ) and occasionally in the Polar Frontal Zone (PFZ) of the Drake Passage, while specimens of the less calcified morphogroup B (which includes types B, B/C, C, and O) occur in the SAZ and PFZ of both transects. Neither the slightly different carbonate masses nor the southward changes in morphotype composition have a decisive influence on the coccolith-estimated PIC, which is mostly determined by the abundance of E. huxleyi in this area.
-
The drop in the abundance of E. huxleyi morphogroup B in the Antarctic Zone (AZ) marks the southernmost extent of coccolithophores, occurring at the PF in the Drake Passage and at the southern ACC Front in the New Zealand transect. This boundary is not recognizable using satellite-derived PIC values.
-
We found that satellite-derived PIC values and coccolith-estimated PIC values follow a comparable trend in the SAZ and PFZ. However, satellite-derived PIC values are generally higher than coccolith-estimated PIC values. This difference could be due to a lack of precision in the coccolith-based PIC estimates, the presence of foraminifera and/or other hard-shelled calcifying microzooplankton adding potential error when calculating the total PIC volume, or a certain bias in the algorithm due to the low number of measurements used for the validation of the satellite-derived PIC calibration.
-
There is an observed decoupling in the AZ of satellite-derived PIC and coccolith-estimated PIC south of the PF. Despite having high satellite reflectance values, no coccolithophores were observed in this area of high chlorophyll-a concentration. We are unable to determine the reason for this with our data but note that an abundance of small biogenic opal particles, such as small-sized diatoms, silicoflagellates and/or siliceous plankton (as well as their fragments), or potential biogenic particles not visible in the Scanning Electron Microscope (e.g., Phaeocystis aggregations or microbubbles) could possibly provide an explanation for this observation.
The observed discrepancies between satellite-derived and coccolith-estimated PIC south of the PF highlight the importance of in situ measurements for improving PIC estimates based on coccolith morphometrics and polarizing light microscopy. In combination with further refinements of remote sensing methods, this will allow a better understanding of the dynamics of coccolithophores, phytoplankton, and calcifying microzooplankton communities in the Pacific sector of the Southern Ocean.
The authors confirm that the data from which the findings of this study are derived are available in the Supplement and are stored in the data repository (https://doi.pangaea.de/10.1594/PANGAEA.964672, Saavedra-Pellitero et al., 2025a; https://doi.pangaea.de/10.1594/PANGAEA.964674, Saavedra-Pellitero et al., 2025b).
The supplement related to this article is available online at https://doi.org/10.5194/bg-22-3143-2025-supplement.
The study was designed by EM, MSP, and KHB. EM and NMV carried out the morphometric measurements and classified the specimens of E. huxleyi. EM and MSP calculated the coccolith PICs, plotted the data, and wrote an earlier version of the manuscript. NB-J and HL provided the remote sensing data for the study area and were actively involved in the discussion of the findings as well as the writing of the paper. All of the authors approved the submitted version.
The contact author has declared that none of the authors has any competing interests.
Publisher’s note: Copernicus Publications remains neutral with regard to jurisdictional claims made in the text, published maps, institutional affiliations, or any other geographical representation in this paper. While Copernicus Publications makes every effort to include appropriate place names, the final responsibility lies with the authors.
The satellite-derived PIC data were downloaded from the Ocean Color Level 1 & 2 browser (https://oceancolor.gsfc.nasa.gov/, last access: 12 July 2024) and Level 3 & 4 browser (https://oceancolor.gsfc.nasa.gov/l3, last access: 24 May 2023), both of them services provided by NASA's Ocean Biology Distributed Active Archive Center (OB.DAAC).
The authors made use of the JASMIN (Joint Analysis System for the Met Office, NERC, and UKRI) (https://jasmin.ac.uk/, last access: 24 May 2023) Jupyter Notebook service to process the satellite-derived PIC data. We would like to express our gratitude to the JASMIN team for their support and the valuable resources they provide to the scientific community.
The authors are grateful to two anonymous reviewers plus Peter von Dassow, and to the handling associate editor Jamie Shutler for their invaluable suggestions on a previous version of the paper. The Alfred Wegener Institute Bremerhaven provided some of the plankton samples required for this study. Frank Lamy, Hartmut Schulz, and the R/V Polarstern officers and crew are thanked for their help during Expedition PS97.
Amanda Frigola (Barcelona Supercomputing Center, Spain), Ute Merkel (University of Bremen/MARUM, Germany), and Mark Hardiman (University of Portsmouth, UK) are thanked for their help with remote sensing data collection advice. Nick Pepin (University of Portsmouth, UK) and Barney Balch (Bigelow Laboratory for Ocean Sciences, USA) are thanked for their comments and suggestions on this piece of research during the “Advances in Coccolithophore Research” meeting. Julio Saavedra (RIP) is thanked for his continuous encouragement to finish up this paper.
This research was supported by the University of Portsmouth, by the Deutsche Forschungsgemeinschaft with a grant to Karl-Heinz Baumann (BA 1648/30-1) through previous funding for Mariem Saavedra-Pellitero and Nele M. Vollmar, and by the MIUR project “Dipartimenti di Eccellenza 2018/2023” for Elisa Malinverno at the Department of Earth and Environmental Sciences, University of Milano-Bicocca. The University of Portsmouth's Research and Innovation Services and Copernicus Publications are acknowledged for their additional financial support to publish this paper open access.
This paper was edited by Jamie Shutler and reviewed by Peter von Dassow and one anonymous referee.
Babin, M., Morel, A., Fournier-Sicre, V., Fell, F., and Stramski, D.: Light scattering properties of marine particles in coastal and open ocean waters as related to the particle mass concentration, Limnol. Oceanogr., 48, 843–859, https://doi.org/10.4319/lo.2003.48.2.0843, 2003a.
Babin, M., Stramski, D., Ferrari, G. M., Claustre, H., Bricaud, A., Obolensky, G., and Hoepffner, N.: Variations in the light absorption coefficients of phytoplankton, nonalgal particles, and dissolved organic matter in coastal waters around Europe, J. Geophys. Res.-Oceans, 108, 3211, https://doi.org/10.1029/2001JC000882, 2003b.
Bailey, S. W. and Werdell, P. J.: A multi-sensor approach for the on-orbit validation of ocean color satellite data products, Rem. Sens. Environ., 102, 12–23, 2006.
Balch, W. M.: The Ecology, Biogeochemistry, and Optical Properties of Coccolithophores, Annu. Rev. Mar. Sci., 10, 71–98, https://doi.org/10.1146/annurev-marine-121916-063319, 2018.
Balch, W. M., Holligan, P. M., Ackleson, S. G., and Voss, K. J.: Biological and optical properties of mesoscale coccolithophore blooms in the Gulf of Maine, Limnol. Oceanogr., 36, 629–643, https://doi.org/10.4319/lo.1991.36.4.0629, 1991.
Balch, W. M., Kilpatrick, K. A., Holligan, P., Harbour, D., and Fernandez, E.: The 1991 coccolithophore bloom in the central North Atlantic. 2. Relating optics to coccolith concentration, Limnol. Oceanogr., 41, 1684–1696, 1996.
Balch, W. M., Drapeau, D. T., Cucci, T. L., Vaillancourt, R. D., Kilpatrick, K. A., and Fritz, J. J.: Optical backscattering by calcifying algae: Separating the contribution of particulate inorganic and organic carbon fractions, J. Geophys. Res.-Oceans, 104, 1541–1558, https://doi.org/10.1029/1998JC900035, 1999.
Balch, W. M., Gordon, H. R., Bowler, B. C., Drapeau, D. T., and Booth, E. S.: Calcium carbonate measurements in the surface global ocean based on Moderate-Resolution Imaging Spectroradiometer data, J. Geophys. Res.-Oceans, 110, C07001, https://doi.org/10.1029/2004JC002560, 2005.
Balch, W. M., Drapeau, D. T., Bowler, B. C., Booth, E. S., Windecker, L. A., and Ashe, A.: Space–time variability of carbon standing stocks and fixation rates in the Gulf of Maine, along the GNATS transect between Portland, ME, USA, and Yarmouth, Nova Scotia, Canada, J. Plankton Res., 30, 119–139, https://doi.org/10.1093/plankt/fbm097, 2007.
Balch, W. M., Drapeau, D. T., Bowler, B. C., Lyczskowski, E., Booth, E. S., and Alley, D.: The contribution of coccolithophores to the optical and inorganic carbon budgets during the Southern Ocean Gas Exchange Experiment: New evidence in support of the “Great Calcite Belt” hypothesis, J. Geophy. Res.-Oceans, 116, C00F06, https://doi.org/10.1029/2011jc006941, 2011.
Balch, W. M., Drapeau, D. T., Bowler, B. C., Lyczkowski, E. R., Lubelczyk, L. C., Painter, S. C., and Poulton, A. J.: Surface biological, chemical, and optical properties of the Patagonian Shelf coccolithophore bloom, the brightest waters of the Great Calcite Belt, Limnol. Oceanogr., 59, 1715–1732, https://doi.org/10.4319/lo.2014.59.5.1715, 2014.
Balch, W. M., Bates, N. R., Lam, P. J., Twining, B. S., Rosengard, S. Z., Bowler, B. C., Drapeau, D. T., Garley, R., Lubelczyk, L. C., Mitchell, C., and Rauschenberg, S.: Factors regulating the Great Calcite Belt in the Southern Ocean and its biogeochemical significance, Global Biogeochem. Cy., 30, 1124–1144, https://doi.org/10.1002/2016gb005414, 2016.
Balch, W. M. and Mitchell, C.: Remote sensing algorithms for particulate inorganic carbon (PIC) and the global cycle of PIC, Earth-Sci. Rev., 239, 104363, https://doi.org/10.1016/j.earscirev.2023.104363, 2023.
Balch, W. M. and Utgoff, P. E.: Potential interactions among ocean acidification, coccolithophores, and the optical properties of seawater, Oceanogr. Mar. Biol. Annu. Rev., 22, 146–159, https://doi.org/10.5670/oceanog.2009.104, 2009.
Baumann, K.-H.: Importance of coccolith size measurements for carbonate estimations, Micropaleontology, 50, 35–43, 2004.
Beaufort, L.: Weight estimates of coccoliths using the optical properties (birefringence) of calcite, Micropaleontology, 51, 289–298, 2005.
Beaufort, L., Probert, I., de Garidel-Thoron, T., Bendif, E. M., Ruiz-Pino, D., Metzl, N., Goyet, C., Buchet, N., Coupel, P., Grelaud, M., Rost, B., Rickaby, R. E. M., and de Vargas, C.: Sensitivity of coccolithophores to carbonate chemistry and ocean acidification, Nature, 476, 80–83, https://doi.org/10.1038/nature10295, 2011.
Bendif, E. M., Probert, I., Archontikis, O. A., Young, J. R., Beaufort, L., Rickaby, R. E., and Filatov, D.: Rapid diversification underlying the global dominance of a cosmopolitan phytoplankton, The ISME J., 17, 630–640, https://doi.org/10.1038/s41396-023-01365-5, 2023.
Beuvier, T., Probert, I., Beaufort, L., Suchéras-Marx, B., Chushkin, Y., Zontone, F., and Gibaud, A.: X-ray nanotomography of coccolithophores reveals that coccolith mass and segment number correlate with grid size, Nat. Commun., 10, 751, https://doi.org/10.1038/s41467-019-08635-x, 2019.
Bevington, P. R.: Data Reduction and Error Analysis for the Physical Sciences, 336 pp., McGraw-Hill, ISBN 0-07-247227, 1969
Bi, S., Hieronymi, M., and Röttgers, R.: Bio-geo-optical modelling of natural waters, Front. Mar. Sci., 10, 1–25, https://doi.org/10.3389/fmars.2023.1196352, 2023.
Bollmann, J.: Technical Note: Weight approximation of coccoliths using a circular polarizer and interference colour derived retardation estimates – (The CPR Method), Biogeosciences, 11, 1899–1910, https://doi.org/10.5194/bg-11-1899-2014, 2014.
Broerse, A. T. C., Tyrrell, T., Young, J. R., Poulton, A. J., Merico, A., Balch, W. M., and Miller, P. I.: The cause of bright waters in the Bering Sea in winter, Conti. Shelf Res., 23, 1579–1596, https://doi.org/10.1016/j.csr.2003.07.001, 2003.
Cárdenas, P., Lange, C. B., Vernet, M., Esper, O., Srain, B., Vorrath, M.-E., Ehrhardt, S., Müller, J., Kuhn, G., Arz, H. W., Lembke-Jene, L., and Lamy, F.: Biogeochemical proxies and diatoms in surface sediments across the Drake Passage reflect oceanic domains and frontal systems in the region, Prog. Oceanogr., 72–88, https://doi.org/10.1016/j.pocean.2018.10.004, 2018.
Charalampopoulou, A., Poulton, A. J., Bakker, D. C. E., Lucas, M. I., Stinchcombe, M. C., and Tyrrell, T.: Environmental drivers of coccolithophore abundance and calcification across Drake Passage (Southern Ocean), Biogeosciences, 13, 5917–5935, https://doi.org/10.5194/bg-13-5917-2016, 2016.
Costello, D. K., Carder, K. L., and Hou, W.: Aggregation of diatom bloom in a mesocosm: Bulk and individual particle optical measurements, Deep Sea Res. II, 42, 29–45, https://doi.org/10.1016/0967-0645(95)00003-9, 1995.
Cubillos, J. C., Wright, S. W., Nash, G., de Salas, M. F., Griffiths, B., Tilbrook, B., Poisson, A., and Hallegraeff, G. M.: Calcification morphotypes of the coccolithophorid Emiliania huxleyi in the Southern Ocean: changes in 2001 to 2006 compared to historical data, Mar. Ecol. Prog. Ser., 348, 47–54, https://doi.org/10.3354/meps07058, 2007.
Daniels, C. J., Tyrrell, T., Poulton, A. J., and Pettit, L.: The influence of lithogenic material on particulate inorganic carbon measurements of coccolithophores in the Bay of Biscay, Limnol. Oceanogr., 57, 145–153, https://doi.org/10.4319/lo.2012.57.1.0145, 2012.
de Baar, H. J. W., de Jong, J. T. M., Bakker, D. C. E., Loscher, B. M., Veth, C., Bathmann, U., and Smetacek, V.: Importance of iron for plankton blooms and carbon dioxide drawdown in the Southern Ocean, Nature, 373, 412–415, https://doi.org/10.1038/373412a0, 1995.
Devred, E., Sathyendranath, S., Stuart, V., Maass, H., Ulloa, O., and Platt, T.: A two-component model of phytoplankton absorption in the open ocean: Theory and applications, J. Geophys. Res.-Oceans, 111, C03011, https://doi.org/10.1029/2005JC002880, 2006.
European Space Agency: ESA Sentinel Application Platform (SNAP) 9.0.0. https://step.esa.int/main/snap-9-0-released/ (last access: 12 July 2024), 2022.
Ferreira, A., Garcia, V. M. T., and Garcia, C. A. E.: Light absorption by phytoplankton, non-algal particles and dissolved organic matter at the Patagonia shelf-break in spring and summer, Deep Sea Res. Part I, 56, 2162–2174, https://doi.org/10.1016/j.dsr.2009.08.002, 2009.
Fuertes, M.-Á., Flores, J.-A., and Sierro, F. J.: The use of circularly polarized light for biometry, identification and estimation of mass of coccoliths, Mar. Micropaleontol., 113, 44–55, https://doi.org/10.1016/j.marmicro.2014.08.007, 2014.
GEBCO Compilation Group: GEBCO_2022 Grid. Data set available online from the British Oceanographic Data Centre, Liverpool, UK, https://doi.org/10.5285/e0f0bb80-ab44-2739-e053-6c86abc0289c, 2022.
Gordon, A. L., Molinelli, E., and Baker, T.: Large-scale relative dynamic topography of the Southern Ocean, J. Geophys. Res.-Oceans, 83, 3023–3032, https://doi.org/10.1029/JC083iC06p03023, 1978.
Gordon, H. R., Brown, O. B., Evans, R. H., Brown, J. W., Smith, R. C., Baker, K. S., and Clark, D. K.: A semianalytic radiance model of ocean color, J. Geophys. Res.-Atmos., 93, 10909–10924, https://doi.org/10.1029/JD093iD09p10909, 1988.
Gordon, H. R., Boynton, G. C., Balch, W. M., Groom, S. B., Harbour, D. S., and Smyth, T. J.: Retrieval of coccolithophore calcite concentration from SeaWiFS Imagery, Geophys. Res. Lett., 28, 1587–1590, https://doi.org/10.1029/2000GL012025, 2001.
Gravalosa, J. M., Flores, J.-A., Sierro, F. J., and Gersonde, R.: Sea surface distribution of coccolithophores in the eastern Pacific sector of the Southern Ocean (Bellingshausen and Amundsen Seas) during the late austral summer of 2001, Mar. Micropaleontol., 69, 16–25, https://doi.org/10.1016/j.marmicro.2007.11.006, 2008.
Guitián, J., Fuertes, M. Á., Flores, J.-A., Hernández-Almeida, I., and Stoll, H.: Variation in calcification of Reticulofenestra coccoliths over the Oligocene–Early Miocene, Biogeosciences, 19, 5007–5019, https://doi.org/10.5194/bg-19-5007-2022, 2022.
Harlay, J., Borges, A. V., Van Der Zee, C., Delille, B., Godoi, R. H. M., Schiettecatte, L. S., Roevros, N., Aerts, K., Lapernat, P. E., Rebreanu, L., Groom, S., Daro, M. H., Van Grieken, R., and Chou, L.: Biogeochemical study of a coccolithophore bloom in the northern Bay of Biscay (NE Atlantic Ocean) in June 2004, Prog. Oceanogr., 86, 317–336, https://doi.org/10.1016/j.pocean.2010.04.029, 2010.
Holligan, P. M., Viollier, M., Harbour, D. S., Camus, P., and Champagne-Philippe, M.: Satellite and ship studies of coccolithophore production along a continental shelf edge, Nature, 304, 339–342, https://doi.org/10.1038/304339a0, 1983.
Holligan, P. M., Fernández, E., Aiken, J., Balch, W. M., Boyd, P., Burkill, P. H., Finch, M., Groom, S. B., Malin, G., Muller, K., Purdie, D. A., Robinson, C., Trees, C. C., Turner, S. M., and van der Wal, P.: A biogeochemical study of the coccolithophore, Emiliania huxleyi, in the North Atlantic, Global Biogeochem. Cy., 7, 879–900, https://doi.org/10.1029/93gb01731, 1993.
Holligan, P. M., Charalampopoulou, A., and Hutson, R.: Seasonal distributions of the coccolithophore, Emiliania huxleyi, and of particulate inorganic carbon in surface waters of the Scotia Sea, J. Mar.Syst., 82, 195–205, https://doi.org/10.1016/j.jmarsys.2010.05.007, 2010.
Klaas, C. and Archer, D. E.: Association of sinking organic matter with various types of mineral ballast in the deep sea: Implications for the rain ratio, Global Biogeochem. Cy., 16, 1116, https://doi.org/10.1029/2001GB001765, 2002.
Kleijne, A.: Morphology, taxonomy and distribution of extant coccolithophores (calcareous nannoplankton), Ph.D., Vrije Universiteit, Amsterdam, 321 pp., ISBN 9789090061610, 1993.
Klinck, J. and Nowlin, W. D.: Antarctic Circumpolar Current, in: Encyclopedia of Ocean Sciences, edited by: Steele, J. H., Academic Press, Oxford, 151–159, https://doi.org/10.1006/rwos.2001.0370, 2001.
Lamy, F.: The Expedition PS97 of the Research Vessel POLARSTERN to the Drake Passage in 2016, edited by: Lamy, F., Berichte zur Polar- und Meeresforschung, Reports on Polar and Marine Research, 167 pp., https://doi.org/10.2312/BzPM_0701_2016, 2016.
Malinverno, E., Triantaphyllou, M. V., and Dimiza, M. D.: Coccolithophore assemblage distribution along a temperate to polar gradient in theWest Pacific sector of the Southern Ocean (January 2005) Micropaleontology, 61, 489–506, 2015.
Malinverno, E., Maffioli, P., and Gariboldi, K.: Latitudinal distribution of extant fossilizable phytoplankton in the Southern Ocean: Planktonic provinces, hydrographic fronts and palaeoecological perspectives, Mar. Micropaleontol., 123, 41–58, https://doi.org/10.1016/j.marmicro.2016.01.001, 2016.
Mitchell, C., Hu, C., Bowler, B., Drapeau, D., and Balch, W. M.: Estimating Particulate Inorganic Carbon Concentrations of the Global Ocean From Ocean Color Measurements Using a Reflectance Difference Approach, J. Geophys. Res.-Oceans, 122, 8707–8720, https://doi.org/10.1002/2017JC013146, 2017.
Mohan, R., Mergulhao, L. P., Guptha, M. V. S., Rajakumar, A., Thamban, M., AnilKumar, N., Sudhakar, M., and Ravindra, R.: Ecology of coccolithophores in the Indian sector of the Southern Ocean, Mar. Micropaleontol., 67, 30–45, https://doi.org/10.1016/j.marmicro.2007.08.005, 2008.
NASA Goddard Space Flight Center: Ocean Ecology Laboratory, Ocean Biology Processing Group, Moderate-resolution Imaging Spectroradiometer (MODIS) Aqua Level-3 Binned Particulate Inorganic Carbon, Version 2022.0 Data; NASA OB.DAAC, Greenbelt, MD, USA, https://doi.org/10.5067/AQUA/MODIS/L3B/PIC/2022.0, 2023.
NASA Goddard Space Flight Center: Ocean Ecology Laboratory, Ocean Biology Processing Group, Moderate-resolution Imaging Spectroradiometer (MODIS) Aqua Level-2 Ocean Color, Version 2022.0 Data; NASA OB.DAAC, Greenbelt, MD, USA, https://doi.org/10.5067/AQUA/MODIS/L2/OC/2022.0, 2024.
NASA Ocean Biology Processing Group: Particulate Inorganic Carbon (PIC), https://oceancolor.gsfc.nasa.gov/resources/atbd/pic/ (last access: 14 June 2023), 2023.
Neukermans, G., Oziel, L., and Babin, M.: Increased intrusion of warming Atlantic water leads to rapid expansion of temperate phytoplankton in the Arctic, Global Change Biol., 24, 2545–2553, https://doi.org/10.1111/gcb.14075, 2018.
Okada, H. and McIntyre, A.: Modern coccolithophores of the Pacific and North Atlantic oceans, Micropaleontology, 23, 1–54, https://doi.org/10.2307/1485309 1977.
Oliver, H., McGillicuddy Jr., D. J., Krumhardt, K. M., Long, M. C., Bates, N. R., Bowler, B. C., Drapeau, D. T., and Balch, W. M.: Environmental drivers of coccolithophore growth in the Pacific sector of the Southern Ocean, Global Biogeochem. Cy., 37, 1–20, https://doi.org/10.1029/2023GB007751, 2023.
Orsi, A. H. and Harris, U.: Fronts of the Antarctic Circumpolar Current - GIS data, Ver. 1, Australian Antarctic Data Centre, https://data.aad.gov.au/metadata/records/antarctic_circumpolar_current_fronts (last access: 26 May 2023), 2019.
Orsi, A. H., Whitworth III, T., and Nowlin Jr, W. D.: On the meridional extent and fronts of the Antarctic Circumpolar Current, Deep Sea Res. I, 42, 641–673, https://doi.org/10.1016/0967-0637(95)00021-w, 1995.
Poulton, A. J., Young, J. R., Bates, N. R., and Balch, W. M.: Biometry of detached Emiliania huxleyi coccoliths along the Patagonian Shelf, Mar. Ecol.Prog. Series, 443, 1–17, https://doi.org/10.3354/meps09445, 2011.
Poulton, A. J., Painter, S. C., Young, J. R., Bates, N. R., Bowler, B., Drapeau, D., Lyczsckowski, E., and Balch, W. M.: The 2008 Emiliania huxleyi bloom along the Patagonian Shelf: Ecology, biogeochemistry, and cellular calcification, Global Biogeochem. Cy., 27, 1023–1033, https://doi.org/10.1002/2013GB004641, 2013.
Reynolds, R. A., Stramski, D., and Mitchell, B. G.: A chlorophyll-dependent semianalytical reflectance model derived from field measurements of absorption and backscattering coefficients within the Southern Ocean, J. Geophys. Res.-Oceans, 106, 7125–7138, https://doi.org/10.1029/1999JC000311, 2001.
Rigual Hernández, A. S., Flores, J. A., Sierro, F. J., Fuertes, M. A., Cros, L., and Trull, T. W.: Coccolithophore populations and their contribution to carbonate export during an annual cycle in the Australian sector of the Antarctic zone, Biogeosciences, 15, 1843–1862, https://doi.org/10.5194/bg-15-1843-2018, 2018.
Rigual Hernández, A. S., Trull, T. W., Nodder, S. D., Flores, J. A., Bostock, H., Abrantes, F., Eriksen, R. S., Sierro, F. J., Davies, D. M., Ballegeer, A.-M., Fuertes, M. A., and Northcote, L. C.: Coccolithophore biodiversity controls carbonate export in the Southern Ocean, Biogeosciences, 17, 245–263, https://doi.org/10.5194/bg-17-245-2020, 2020a.
Rigual-Hernández, A. S., Trull, T. W., Flores, J. A., Nodder, S. D., Eriksen, R., Davies, D. M., Hallegraeff, G. M., Sierro, F. J., Patil, S. M., Cortina, A., Ballegeer, A. M., Northcote, L. C., Abrantes, F., and Rufino, M. M.: Full annual monitoring of Subantarctic Emiliania huxleyi populations reveals highly calcified morphotypes in high-CO2 winter conditions, Sci. Rep., 10, 2594, https://doi.org/10.1038/s41598-020-59375-8, 2020b.
Rivero-Calle, S., Gnanadesikan, A., Del Castillo, C. E., Balch, W. M., and Guikema, S. D.: Multidecadal increase in North Atlantic coccolithophores and the potential role of rising CO2, Science, 350, 1533–1537, https://doi.org/10.1126/science.aaa8026, 2015.
Robertson, J. E., Robinson, C., Turner, D. R., Holligan, P., Watson, A. J., Boyd, P., Fernandez, E., and Finch, M., The impact of a coccolithophore bloom on oceanic carbon uptake in the northeast Atlantic during summer 1991, Deep-Sea Res. I, 41, 297–314, https://doi.org/10.1016/0967-0637(94)90005-1, 1994.
Rost, B. and Riebesell, U.: Coccolithophore calcification and the biological pump: response to environmental changes, in: Coccolithophores: from molecular processes to global impact, edited by: Thierstein, H. R. and Young, J. R., Springer, Berlin-Heidelberg, Germany, 99–125 pp., https://doi.org/10.1007/978-3-662-06278-4_5, 2004.
Saavedra-Pellitero, M., Baumann, K.-H., Flores, J.-A., and Gersonde, R.: Biogeographic distribution of living coccolithophores in the Pacific sector of the Southern Ocean, Mar. Micropaleontol., 109, 1–20, https://doi.org/10.1016/j.marmicro.2014.03.003, 2014.
Saavedra-Pellitero, M., Baumann, K.-H., Fuertes, M. Á., Schulz, H., Marcon, Y., Vollmar, N. M., Flores, J.-A., and Lamy, F.: Calcification and latitudinal distribution of extant coccolithophores across the Drake Passage during late austral summer 2016, Biogeosciences, 16, 3679–3702, https://doi.org/10.5194/bg-16-3679-2019, 2019.
Saavedra-Pellitero, M., Baumann, K.-H., Bachiller-Jareno, N., Lovell, H., Vollmar, N. M., and Malinverno, E.: Morphometries of Emiliania huxleyi in the Pacific sector of the XX Italian Expedition from New Zealand to Antarctic, Pangaea [data set], https://doi.pangaea.de/10.1594/PANGAEA.964672, 2025a.
Saavedra-Pellitero, M., Baumann, K.-H., Bachiller-Jareno, N., Lovell, H., Vollmar, N. M., and Malinverno, E.: Morphometries of Emiliania huxleyi in the Pacific sector of the POLARSTERN cruise PS97 (ANT-XXXI/3), Pangaea [data set], https://doi.pangaea.de/10.1594/PANGAEA.964674, 2025b.
Salter, I., Schiebel, R., Ziveri, P., Movellan, A., Lampitt, R., and Wolff, G. A.: Carbonate counter pump stimulated by natural iron fertilization in the Polar Frontal Zone, Nat. Geosci., 7, 885–889, https://doi.org/10.1038/ngeo2285, 2014.
Samtleben, C. and Schröder, A.: Living coccolithophore communities in the Norwegian-Greenland Sea and their record in sediments, Mar. Micropaleontol., 19, 333–354, 1992.
Schindelin, J., Arganda-Carreras, I., Frise, E., Kaynig, V., Longair, M., Pietzsch, T., Preibisch, S., Rueden, C., Saalfeld, S., Schmid, B., Tinevez, J.-Y., White, D. J., Hartenstein, V., Eliceiri, K., Tomancak, P., and Cardona, A.: Fiji: an open-source platform for biological-image analysis, Nat. Methods, 9, 676–682, https://doi.org/10.1038/nmeth.2019, 2012.
Schneider, C. A., Rasband, W. S., and Eliceiri, K. W.: NIH Image to ImageJ: 25 years of image analysis, Nat. Methods, 9, 671–675, https://doi.org/10.1038/nmeth.2089, 2012.
Shutler, J. D., Land, P. E., Brown, C. W., Findlay, H. S., Donlon, C. J., Medland, M., Snooke, R., and Blackford, J. C.: Coccolithophore surface distributions in the North Atlantic and their modulation of the air-sea flux of CO2 from 10 years of satellite Earth observation data, Biogeosciences, 10, 2699–2709, https://doi.org/10.5194/bg-10-2699-2013, 2013.
Smyth, T. J., Moore, G. F., Groom, S. B., Land, P. E., and Tyrrell, T.: Optical modeling and measurements of a coccolithophore bloom, Appl. Opt., 41, 7679–7688, https://doi.org/10.1364/AO.41.007679, 2002.
Trull, T. W., Passmore, A., Davies, D. M., Smit, T., Berry, K., and Tilbrook, B.: Distribution of planktonic biogenic carbonate organisms in the Southern Ocean south of Australia: a baseline for ocean acidification impact assessment, Biogeosciences, 15, 31–49, https://doi.org/10.5194/bg-15-31-2018, 2018.
Tyrrell, T. and Taylor, A. H.: A modelling study of Emiliania huxleyi in the NE atlantic, J. Mari. Syst., 9, 83–112, https://doi.org/10.1016/0924-7963(96)00019-X, 1996.
Valença, C. R., Beaufort, L., Hallegraeff, G. M., and Müller, M. N.: Technical note: A comparison of methods for estimating coccolith mass, Biogeosciences, 21, 1601–1611, https://doi.org/10.5194/bg-21-1601-2024, 2024.
Vollmar, N. M., Baumann, K.-H., Saavedra-Pellitero, M., and Hernández-Almeida, I.: Distribution of coccoliths in surface sediments across the Drake Passage and calcification of Emiliania huxleyi morphotypes, Biogeosciences, 19, 585–612, https://doi.org/10.5194/bg-19-585-2022, 2022.
Werdell, J., O'Reilly, J., Hu, C., Feng, L., Lee, Z., Franz, B., Bailey, S., Proctor, C., and Wang, G.: Chlorophyll a. NASA Algorithm Publication Tool, 2023-11-06, v1.1, https://doi.org/10.5067/JCQB8QALDOYD, 2023.
Whitworth, T. I.: Zonation and geostrophic flow of the Antarctic circumpolar current at Drake Passage, Deep Sea Res. A, 27, 497–507, https://doi.org/10.1016/0198-0149(80)90036-9, 1980.
Winter, A., Elbrächter, M., and Krause, G.: Subtropical coccolithophores in the Weddell Sea, Deep Sea Res.t I, 46, 439–449, https://doi.org/10.1016/S0967-0637(98)00076-4, 1999.
Winter, A., Henderiks, J., Beaufort, L., Rickaby, R. E. M., and Brown, C. W.: Poleward expansion of the coccolithophore Emiliania huxleyi, J. Plankton Res., 36, 316–325, https://doi.org/10.1093/plankt/fbt110, 2014.
Yang, T. N. and Wei, K. Y.: How many coccoliths are there in a coccosphere of the extant coccolithophorids? A compilation, J. Nannoplankt. Res., 25, 7–15, 2003.
Young, J.: Coccobiom2 Macros, http://ina.tmsoc.org/nannos/coccobiom/Usernotes.html (last access: 23 August 2017), 2015.
Young, J. R. and Ziveri, P.: Calculation of coccolith volume and it use in calibration of carbonate flux estimates, Deep Sea Res. II, 47, 1679–1700, https://doi.org/10.1016/S0967-0645(00)00003-5, 2000.
Young, J., Bown, P., and Lees, J.: Nannotax3 Website, International Nannoplankton Association, http://www.mikrotax.org/Nannotax3/ (last access: 5 July 2023), 2023.
Young, J., Geisen, M., Cros, L., Kleijne, A., Sprengel, C., Probert, I., and Ostergaard, J.: A guide to extant coccolithophore taxonomy, J. Nannoplankt. Res. Special Issue, 1, 1–125, ISSN 1210-8049, 2003.
Young, J. R., Poulton, A. J., and Tyrrell, T.: Morphology of Emiliania huxleyi coccoliths on the northwestern European shelf – is there an influence of carbonate chemistry?, Biogeosciences, 11, 4771–4782, https://doi.org/10.5194/bg-11-4771-2014, 2014.