the Creative Commons Attribution 4.0 License.
the Creative Commons Attribution 4.0 License.
 | 15 Jul 2025
Distribution of alkylamines in surface waters around the Antarctic Peninsula and Weddell Sea
Mark F. Fitzsimons
Preston Akenga
Ana Sotomayor
Elisabet L. Sà
Queralt Güell-Bujons
Magda Vila
Yaiza M. Castillo
Manuel Dall'Osto
Dolors Vaqué
Charel Wohl
Rafel Simó
Alkylamines, volatile organic nitrogen compounds with low molecular weight, are present in the surface ocean and participate in the marine biogeochemical nitrogen cycle, atmospheric chemistry and cloud formation. Alkylamines have been detected in polar regions, suggesting that these areas constitute emission hotspots of these compounds. However, knowledge of the sea surface distribution patterns and factors modulating alkylamines remain limited due to their high reactivity and low concentrations, which hamper accurate measurements. We investigated the presence and distribution of alkylamines in seawaters around the Antarctic Peninsula and the northern Weddell Sea during the late austral summer and explored their potential links to marine microbiota. Alkylamines were ubiquitous in all analysed samples, accounting for ∼ 2 % of the dissolved and particulate organic nitrogen pool. The only particulate form found was trimethylamine (TMA), detected for the first time in Antarctic waters at concentrations of 9.7 ± 4.6 nM. We efficiently measured dissolved trimethylamine (TMA, 20.9 ± 15.2 nM), dimethylamine (DMA, 32.3 ± 32.7 nM) and diethylamine (DEA, 7.2 ± 1.7 nM) across the surveyed area, while dissolved monomethylamine (MMA, 12.7 ± 0.1 nM) remained below the detection limit in most samples. Variations in alkylamine concentrations did not align with the overall phytoplankton biomass but with specific biological components. TMA was predominantly associated with, and released from, nanophytoplankton. DMA was likely produced by the degradation of TMA or trimethylamine oxide by nanophytoplankton cells or associated heterotrophic bacteria. The sources of DEA remain unclear but were suggestive of a distinct biogeochemical pathway from those of TMA and DMA. MMA is thought to primarily originate from bacterial degradation of nitrogen-based osmolytes or amino acids, but detection in too few samples precluded any robust association with microbiota. This study reveals that volatile alkylamines are widespread in Antarctic surface waters, where they are primarily sourced from nanophytoplankton cells and associated heterotrophic bacteria and protists.
- Article
(2802 KB) - Full-text XML
-
Supplement
(1130 KB) - BibTeX
- EndNote


The marine organic nitrogen (ON) pool is an important natural reservoir of reactive molecules, containing biologically relevant compounds which contribute to biogeochemical cycles in the surface ocean and ocean–atmosphere–climate interactions. Among them, alkylamines are low-molecular-weight (< 100 Da) polar molecules that exhibit high solubility in seawater and high vapour pressure. Alkylamines are emitted from the ocean to the atmosphere (1) via sea spray, contributing to a highly variable nitrogen-containing fraction of primary aerosols (Dall'Osto et al., 2017; Liu et al., 2022), and (2) through gas exchange, where they are efficiently incorporated into secondary marine aerosols and contribute to very fast new particle formation events (Brean et al., 2021; Corral et al., 2022; Ning et al., 2022; Zu et al., 2024). Additionally, Antarctic sea-ice microbiota and sea-ice-influenced ocean systems are significant sources of dissolved organic nitrogen (DON), including alkylamines, to both the ocean and the atmosphere, with notable release during sea-ice melt (Dall'Osto et al., 2017, 2019; Rinaldi et al., 2020).
Despite recent efforts, the quantification of these species in seawater remains a considerable challenge due to their low concentrations and reactivity (Fitzsimons et al., 2023), which hampers understanding of their concentrations in both dissolved and particulate forms. In the ocean, the main alkylamines reported are the class of methylamines (MAs) which exists in primary (monomethylamine, MMA: CH3NH2), secondary (dimethylamine, DMA: (CH3)2NH) and tertiary (trimethylamine, TMA: (CH3)3N) forms, plus diethylamine (DEA: (CH3CH2)2NH), a secondary amine with two ethyl groups bound to the amino nitrogen (N) (Goldwhite, 1964). Amine concentrations in seawater are determined by biogeochemical processes, including production and consumption by marine microorganisms (Gibb et al., 1999). Phytoplankton, other protists and bacteria release N-containing compounds such as proteins, amino acids and several forms of amines (Poste et al., 2014) via organism excretion, cell death or lysis. Some of these compounds are directly synthesised by phytoplankton and used as osmolytes for regulating cellular homeostasis in response to salinity variations (Burg and Ferraris, 2008) and as cryoprotectants (Fitzsimons et al., 2024). The precursors for alkylamines are glycine betaine, choline, trimethylamine N-oxide (TMAO) and quaternary amines (R4N+). These N-containing (and carbon, C) molecules are progressively degraded to TMA by bacteria, followed by further degradation into the less methylated compounds, DMA and MMA (Lidbury et al., 2015a, b; Mausz and Chen, 2019; Sun et al., 2019). This displays similarities to the ocean sulfur cycle of dimethylsulfoniopropionate and dimethylsulfide (DMSP and DMS, respectively) (Stefels, 2000). Marine bacteria and archaea can use alkylamines as a source of energy and remineralise the organic N to ammonium (Landa et al., 2017; Lidbury et al., 2015a; Mausz and Chen, 2019).
The few available studies showed that alkylamines represent a small and highly variable percentage of marine ON compounds in the ocean (Fitzsimons et al., 2023, 2024, and references therein). The presence of alkylamines in seawater can have ecological implications, serving as nutrients (C and N sources) for marine microbiota, thereby influencing primary production and ecosystem dynamics (Chistoserdova et al., 2009; Palenik and Morel, 1991; Taubert et al., 2017). For instance, in tropical waters van Pinxteren et al. (2019) found an association between alkylamines and biological tracers such as chlorophyll a and fucoxanthin, suggesting that they were produced by marine diatoms. Furthermore, Koester et al. (2022) hypothesised that the broad array of N metabolites plays a significant role in the interactions between the diatom Pseudo-nitzschia and its bacterial microbiome (particularly Polaribacter), thus contributing fundamentally to the ecophysiology of the diatom. Also, Suleiman et al. (2016) showed that interactions between diatoms and heterotrophic bacteria may be important for marine amine cycling. Investigations into the co-occurrence and abundance of proteobacteria, diatoms and MAs in the marine water column have uncovered interkingdom cross-feeding, underscoring the previously underestimated significance of MAs in the marine N and C cycles (Stein, 2017). Moreover, MAs share a bacterial oxidation pathway with the climate-relevant sulfur gas DMS into dimethylsulfoxide (DMSO) (Lidbury et al., 2016). DEA has been previously found in seawater (Poste et al., 2014; Van Pinxteren et al., 2012, 2019; Fitzsimons et al., 2024) and marine aerosols (Facchini et al., 2008; Dall'Osto et al., 2019). However, no information exists on production pathways, potential biological precursors or transformation processes in seawater. In summary, the amine cycle in the ocean is related to several microbial processes, which this study sought to explore further.
Here we aimed to investigate the presence, distribution and potential sources of alkylamines in Antarctic waters and to enhance our understanding of how these compounds are linked to polar microbial ecology. To achieve this, we visited the Southern Ocean near the Antarctic coasts, one of the most pristine environments on Earth, which is a source of ON (Dall'Osto et al., 2017) and serves as a proxy for preindustrial marine conditions. Surface waters around the Antarctic Peninsula were analysed using a sensitive and robust method specifically designed for detecting low-molecular-weight aliphatic amines. We characterised in detail the biogeochemical properties and microbial composition of the same waters to explore the drivers of alkylamine distribution.
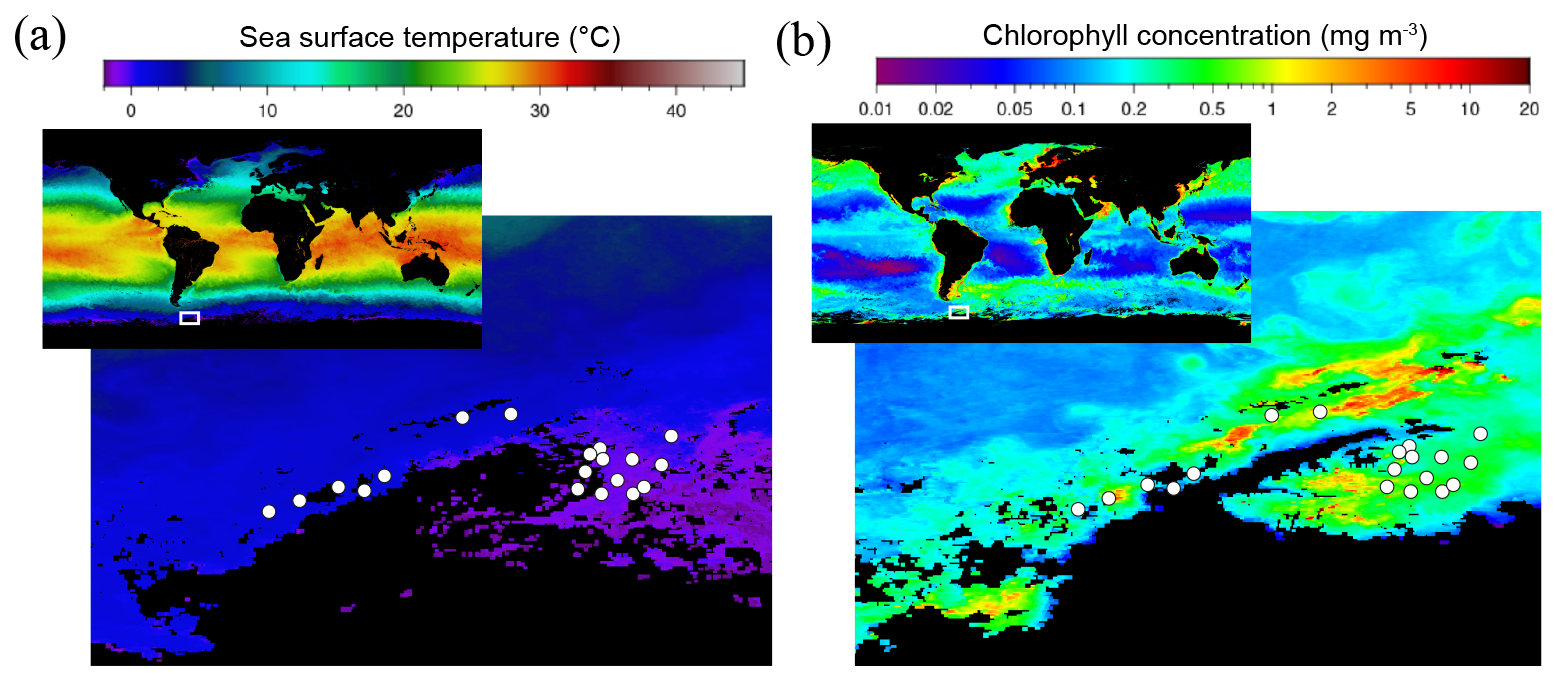
Figure 1Satellite images of (a) the sea surface temperature and (b) the chlorophyll distribution in the ocean (small upper insert) with a zoom-in of the Southern Ocean around the Antarctic Peninsula and the Weddell Sea in March 2023 during the period of the PolarChange cruise when most amine samples were collected. White circles indicate the location of the 19 stations where all samples analysed in this study were collected (the first 7 stations are located in the Western Antarctic Peninsula, while the remaining 12 stations are situated in the Weddell Sea; see station list in Table S1). Chlorophyll concentration is estimated from the Ocean Color Index (OCI) algorithm and the sea surface temperature from SNPP VIIRS satellite, https://oceancolor.gsfc.nasa.gov/l3/, last access: 11 July 2025.
2.1 Study area and sampling strategy
The PolarChange (Aerosol Emissions in Changing Polar Environments) expedition was conducted on board the RV Hesperides in the Southern Ocean around the Antarctic Peninsula during late austral summer from 14 February to 17 March 2023. During this cruise, we collected surface seawater samples from the underway water inlet (∼ 4 m deep) to analyse for amines (dissolved and particulate forms) and accompanying microbiota and biogeochemical parameters. A total of 7 stations were located on the western side of the Antarctic Peninsula and 12 on the eastern side within the Weddell Sea area (Fig. 1, Table S1 in the Supplement). Seawater was obtained at 18:00 LT, except for samples #2 and #18, which were collected at 12:00 mid-day. Sea surface water temperature (°C) (SST), salinity and density (sigmaT) were measured by the probe SeaBird SB21 connected to the continuous system, and surface solar radiation was measured by a radiometer located on the upper deck (model PRR-800) (PAR; W m−2).
2.2 Alkylamine sampling and analysis protocol
Seawater was collected into 50 mL propylene tubes (Falcon type), which were completely filled. For dissolved amine analysis, seawater was filtered through a 47 mm GF/F filter (0.7 µm pore size) by gravity (ca. 60 min, filtration timing depending on the microbial biomass and particulate matter contained in the sampled water) and directly collected into a new 50 mL propylene tube until completely filled. This procedure minimised headspace as indicated by Akenga and Fitzsimons (2024). This filtered water was preserved with concentrated 37 % HCl (analytical grade) at 1 % () final concentration. The tube was tightly closed and stored in the dark at 4 °C until analysis. In turn, after filtration, the GF/F filter was stored in a 2 mL Eppendorf tube at −80 °C for particulate amine analysis.
2.2.1 Analysis of alkylamines in seawater by headspace-based solid-phase microextraction and gas chromatography with nitrogen–phosphorus detection
Dissolved and particulate amines in seawater were analysed following Akenga and Fitzsimons (2024). Briefly, the method comprises an online, automated headspace solid-phase microextraction step coupled with gas chromatography and nitrogen–phosphorus detection (HS-SPME-GC-NPD), optimising the method reported by Cree et al. (2018). The new protocol has improved precision, throughput and confidence with advantages in sample collection, storage and transport, particularly from remote environments (Fitzsimons et al., 2023). A sample chromatogram is shown in Fig. S1 in the Supplement.
2.2.2 Reagents and labware
Methylamine standards, monomethylamine (MMA, 99 %), dimethylamine (DMA, 99 %), trimethylamine (TMA, 98 %) and diethylamine (DEA, 99 %), in hydrochloride form were purchased from Thermo Fisher, UK. Cyclopropylamine (CPA, 99 %), analytical grade HCl (37 %), 10 M NaOH and analytical grade NaCl were from Thermo Fisher, UK. All glassware was soaked for 24 h in Decon solution (2 %, ) and rinsed with high-purity water (HPW; 18.2 MΩcm), then soaked in HCl (10 %, ) for 24 h, rinsed again with HPW, and allowed to dry at room temperature (RT).
2.2.3 Analysis of dissolved alkylamines
Dissolved amines, i.e. dMMA, dDMA, dTMA and dDEA stock standard solutions, were prepared at 94.8, 59.4, 63.7 and 100 nM, respectively, after an accurate dissolution of their chloride salts in HPW. Stock solutions and working standards were acidified with concentrated HCl at a ratio of 1:1000 (acid:solution). Calibration solutions for dMMA, dDMA and dTMA analyses were prepared in the ranges 9.48–94.8, 5.94–59.4 and 6.37–63.7 nM, respectively and at 10–100 nM for dDEA. Aliquots (10 mL) of the solutions were pipetted into 20 mL autosampler glass vials (cleaned as indicated above) and then saturated with NaCl (33 %). CPA was used as an internal standard and was added to each vial at a final concentration of 20 nM. The pH of each standard solution was adjusted to > 13.0 through the addition of 10 M NaOH solution (250 µL), and the vials were immediately sealed. At this point, alkylamines were converted to gaseous form and diffused into the headspace, where they were adsorbed into the SPME fibre. Blank samples were prepared with HPW and treated with NaCl and NaOH as described. Sample analyses were conducted ∼ 6 months after collection. From each stored sample, three 10 mL aliquots were distributed in glass vials and treated analogously to the standards.
2.2.4 Analysis of particulate alkylamines
We also measured amines in particulates retained on GF/F filters after seawater filtration (Sect. 2.2). Analyses were conducted ∼ 6 months after sample collection. Prior to extraction, each filter was placed in a 20 mL autosampler glass vial and allowed to thaw inside the vial (one filter per vial). Subsequently, we added 250 µL of CPA (20 nM final concentration) as internal standard and 500 µL of 10 M NaOH to liberate gaseous amines, and the vial was tightly sealed. This treatment was assumed to volatilise the target analytes into the vial headspace in a manner analogous to dissolved samples. Particulate amine concentrations were quantified using standard amine solutions, as described previously.
2.2.5 SPME and gas chromatography
Details of the automated method are provided in Akenga and Fitzsimons (2024). Briefly, the process involved extracting analytes onto an SPME fibre after equilibration in an integrated oven (60 °C), followed by injection of the SPME fibre into the GC (gas chromatography) system. Thermal desorption of the analytes occurred in the injector port (250 °C), followed by their separation and detection on a 60 m CP-Volamine column. Once separated, the analytes were detected by a nitrogen–phosphorus detector at 300 °C. The total run time lasted 25 min. Peak area data acquisition and processing were performed by Thermo Chromeleon version 7.3 software. The three MAs and DEA were baseline resolved on the column and separated from CPA. The retention times of MMA, DMA, TMA, DEA and CPA were 7.2, 8.1, 8.6, 12.0 and 11.3 min, respectively (Fig. S1). An R2 value > 0.90 was achieved for the calibration of the four alkylamines. The limits of detection for MMA, DMA, TMA and DEA were 9.5, 5.9, 1.1 and 4.3 nM, respectively. Additionally, the calibration curve for dissolved TMA was used to detect particulate TMA values.
2.3 Biological parameters
2.3.1 Chlorophyll a
Between 200 and 750 mL of seawater were filtered through 25 mm Whatman GF/F glass fibre filters to estimate the total chlorophyll a concentration. All filters were stored at −20 °C until analyses conducted on board the RV Hesperides. Chlorophyll a (Chl a) concentrations were estimated fluorometrically after extraction in 90 % acetone at 4 °C for 24 h (Yentsch and Menzel, 1963). Readings were conducted on a Turner 10AU fluorimeter calibrated with pure chlorophyll extract from spinach (Sigma C5357) using a Beckton–Dickinson spectrophotometer. A carbon:chlorophyll ratio of 50 (Jakobsen and Markager, 2016) was applied to estimate the phytoplankton biomass in terms of carbon.
2.3.2 Viral and bacterial abundance and biomass
Subsamples (2 mL) were fixed with glutaraldehyde (0.5 % final concentration) for viruses and with 1 % paraformaldehyde and 0.05 % glutaraldehyde for bacteria estimations by flow cytometry (FCM). After 15–30 min in the dark at 4 °C, the fixed samples were flash-frozen in liquid nitrogen and subsequently stored at −80 °C until analysis. Viral (Brussaard, 2004) and bacterial (Gasol and Del Giorgio, 2000) abundances were measured in a Cytoflex flow cytometer at the ICM-CSIC laboratory (up to 5 months after sampling). Samples for viral abundance were thawed and diluted with TE buffer (10:1 mM Tris: EDTA), stained with 50x SYBR Green I to a final concentration of 1 %, heated in an 80 °C bath for 10 min, and run at a constant flow rate of 60 µL min−1 according to Brussaard (2004). Viruses were determined in bivariate scatter plots of the green fluorescence of stained nucleic acids versus side scatter. Based on their green fluorescent and side scatter signals, four distinct virus populations (V1–V4) were identified (Fig. S2 in the Supplement). Presumably, V1 and V2 populations are dominated by bacteriophages (Biggs et al., 2021) and the V3–V4 fractions by eukaryotic algal viruses (Evans et al., 2009), and the V4 fraction corresponds primarily to Haptophyceae (e.g. Phaeocystis spp.) viruses (Brussaard et al., 1999, 2005; Rocchi et al., 2022). Virus biomass was calculated using the carbon virus content factor of 0.2 fgC per virus (Suttle, 2005). Thawed samples for bacterial abundance were stained with 50x SYBR Green I at a final 1 % concentration and incubated for 5 min in the dark. Based on the flow cytometer side scatter versus green fluorescence (FL1) signatures, high nucleic acid (HNA) from low nucleic acid (LNA) content bacteria were identified (Gasol and Del Giorgio, 2000) (Fig. S3 in the Supplement). Bacterial biomass was obtained from the carbon-to-volume relationship (Norland, 1993), namely pg C cell−1 = 0.12 × (V)0.7, where V is the bacteria volume cells in cubic micrometres (µm3). Here, an average cell volume of 0.066 µm3 per bacteria reported for Antarctic waters (Vaqué et al., 2004) was used.
2.3.3 Pico- and nanophytoplankton abundance and biomass
Samples for photosynthetic pico- and nanophytoplankton abundances were collected on 5 mL cryovials, fixed with glutaraldehyde (1 % final concentration) and frozen in liquid nitrogen following Vaulot et al. (1989). Cells were counted by a CyFlow Cube 8 flow cytometer (Sysmex) at the ICM-CSIC. Phytoplankton cells were detected with a 488 nm laser beam from their signatures in a plot of side scatter (SSC) versus red fluorescence (FL3), separating the picophytoplankton size class of 1–2 µm (sphere-equivalent diameter, SED) and the nanophytoplankton size classes with SEDs of 2–7, 7–15 and 15–20 µm (Fig. S4 in the Supplement). Within the nanophytoplankton, Cryptophytes (Cryptomonas spp.) were identified by their phycoerythrin signal in the FL3 versus orange fluorescence (FL2) plots (Marie et al., 2014). Biomasses (µg C L−1) of these cell sizes were measured using the formula pg C cell−1 = 0.216 × (V)0.939 (V, cell volume; Menden-Deuer and Lessard, 2000). The phytoplankton cell volume varied between 1.8 and 63 µm3 cell−1.
2.3.4 Nanoflagellate abundance and biomass
Abundances of heterotrophic and phototrophic nanoflagellates, including Phaeocystis, in the size fraction 2–20 µm (SED) were determined by epifluorescence microscopy. 30 mL seawater samples were fixed with glutaraldehyde (1 % final concentration), filtered through 0.6 µm black (25 mm diameter) polycarbonate filters and stained with 4,6-diamidino-2-phenylindole (DAPI) at a final concentration of 5 µg mL−1 (Sieracki et al., 1985). Filters were placed on slides and kept frozen (−20 °C). Microscope cell counts of heterotrophic (HNFs) and phototrophic nanoflagellates (PNFs) were estimated by the fluorescence response of the cells after blue light illumination using an Olympus BX40-102/E at 1000X epifluorescence microscope. PNFs were distinguished by red fluorescence emitted by photosynthetic plastid structures, while HNFs were identified from the yellow fluorescence of DAPI-stained nuclei. At least 50 HNFs and 50 PNFs were counted per sample (3 transects of 5 mm in each filter) and classified into ≤ 2, 2–5, 5–10 and 10–20 µm size (SED) classes. The nanoflagellate carbon cell content was estimated from the corresponding carbon-to-volume ratio, e.g. pg C cell−1 = 0.216 × (V)0.939 (Menden-Deuer and Lessard, 2000), where the cell volume (V) was calculated from the average length of each nanoflagellate cell size class and transformed into spherical or ellipsoidal volume. The nanoflagellate cell volume varied between 1.8 and 57.6 µm3 cell−1.
2.3.5 Microplankton assemblages
The microplankton community was characterised using the Utermöhl method on 125 mL neutral Lugol fixed seawater samples. 50 mL aliquots samples were settled in sedimentation chambers for 24 h and observed in a Leica MDi1 inverted microscope (Edler and Elbrächter, 2010). The identified taxa and size classes included dinoflagellates (resting cysts, vegetative dinoflagellates 10–20, 20–40 and > 40 µm), diatoms (10–20, 20–40 and > 40 µm) and ciliates. When possible, taxa were identified at the genus and species level. The relative biomasses (in µg C L−1) were measured from cell volumes using the carbon-to-volume relationships estimated by Menden-Deuer and Lessard (2000) on diatoms and dinoflagellates. Namely, the equation pg C cell−1 = 0.760 × (µm3 cell−1)0.819 was used for dinoflagellates and pg C cell−1 = 0.288 × (µm3 cell−1)0.811 for diatoms. The biovolume was estimated considering an ovoid, cylinder or prism shape for dinoflagellates, centric diatoms and pennate diatoms, respectively, and an empty sphere for empty dinoflagellate cysts. Cell dimension measurements (excluding chaetae and other cell expansions) were conducted using a digital camera and specific calibration of the used Leica DMi1 microscope. Empty diatom frustules were assumed to have a null contribution to C.
2.3.6 Photosynthetic efficiency
The relative efficiency of excitation energy captured by the photosystem II (PSII), calculated as , is used as a proxy for phytoplankton stress and fitness (Gorbunov et al., 2020; Gorbunov and Falkowski, 2022). The metric is measured by a multi-colour fluorescence induction and relaxation instrument (mini-FIRe system) (Gorbunov et al., 2020). The instrument records two parameters: , the minimal yield of fluorescence before fast light flashes, and , the maximum yield of fluorescence due to the reradiation of the maximum number of photons. The difference between and is called variable fluorescence (). The quotient of represents the effective photosynthetic efficiency of the community measured under light conditions (Gorbunov and Falkowski, 2022). has no units, so it is independent of the phytoplankton abundance and allows comparisons between environments. Aliquots of 10 mL were sampled from the underway system and rapidly placed in the chamber of the mini-FIRe to apply the induction and relaxation protocol for dilute samples. No dark acclimation period was used.
2.4 Chemical parameters
2.4.1 Particulate organic carbon and nitrogen
Particulate organic carbon (POC) and nitrogen (PON) content in the seawater was determined by filtration of 390 to 1000 mL through pre-combusted (450 °C, 4 h) 25 mm GF/F glass fibre filters (Whatman) at low pressure (< 20 mm Hg) and kept frozen (−80 °C) until analysis. Filters were thawed and dried at RT, exposed to 37 % (pure) HCl atmosphere in a hermetic beaker to eliminate carbonate salts, and subsequently analysed with an Elemental Analyser (Perkin-Elmer 2400 CHN) at the Scientific and Technical Service of the University of Barcelona. In the following, the term POC and PON will refer to the C and N estimated biochemically as described here as a proxy for particulate organic matter, consisting of living and non-living cells, extracellular material, and detritus containing C or N.
2.4.2 Dissolved carbon and nitrogen
For total organic carbon (TOC) and nitrogen (TN: organic and inorganic nitrogen) analyses, 30 mL of seawater was filtered through a HCl-cleaned 200 µm mesh by gravity and collected in polycarbonate bottles. The sample was fixed with 100 µL of 25 % H3PO4 and stored frozen (−20 °C) until analysis in the laboratory. Following the elimination of inorganic C (i.e. carbonates) by the acidification of the sample, the determination of TOC and TN in seawater was conducted by high-temperature catalytic oxidation (680 and 720 °C, respectively) as described in Álvarez-Salgado and Miller (1998). Measurements were conducted with the TOC-L Shimadzu autoanalyser, with deep Sargasso Sea water used as control (Hansell Laboratory, University of Miami, RSMAS). Concentrations are expressed as micromolar (µM; µmol C L−1 or µmol N L−1). Dissolved organic carbon (DOC) and nitrogen (DON) were calculated by the subtraction of POC from TOC and nitrate, nitrite, ammonium and PON concentrations from TN, respectively.
2.4.3 Dissolved inorganic nutrient analysis and total phosphorus
For measurements of nutrient concentrations, seawater samples were collected in two different 50 mL polypropylene plastic tubes: one tube was used for the determination of inorganic nutrients (nitrate, nitrite, ammonium, phosphate and silicate) and the other one for total phosphorus (TP, organic and inorganic forms). Samples were immediately frozen and stored at −20 °C until analysis. Concentrations of inorganic nutrients were determined with an AA3 HR autoanalyser (Seal Analytical) and TP with an AA3 autoanalyser after previous digestion, following Grasshoff et al. (1983).
2.4.4 Total dimethylsulfoniopropionate (DMSP) concentrations
Samples for total DMSP (DMSPt) analysis were collected directly from the underway system in ∼ 30 mL borosilicate serum vials and processed following Kinsey and Kieber (2016). The vials were uncapped and individually heated by microwave until they began to boil. After the first bubble formed, the microwave was stopped and the vial was left to cool. Subsequently, 30 µL of 37 % HCl was added to all the vials to remove the DMS present and preserve the DMSP. Acidified samples were stored at RT in the dark. Within 6 months of the cruise, DMSP was converted to DMS by alkaline hydrolysis with NaOH for at least 24 h. The resulting DMS was quantified with a cryogenic purge-and-trap system coupled to a Thermo Fisher TRACE 1300 gas chromatograph with flame photometric detection following Masdeu-Navarro et al. (2022).
2.4.5 DMS measurements by proton transfer reaction time-of-flight mass spectrometry (PTR-ToF-MS)
A Vocus PTR-ToF-MS coupled to a segmented flow coil equilibrator was used to continuously measure seawater-dissolved DMS (Wohl et al., 2019). An overview on operation and calibrations is provided in Wohl et al. (2024).
2.5 Statistical analyses
All analyses were conducted in the RStudio integrated development environment (RStudio Team, 2025) to ensure reproducibility and clarity. Multivariate statistical analyses were performed using R version 4.3.2 (R Core Team, 2025) to explore relationships among variables. The data were normalised by centring and scaling to ensure the equal contribution of all variables to the principal component analysis (PCA). The PCA was conducted to reduce dimensionality and examine the relationships among variables. The analysis employed the princomp() function from the stats package (Bolar, 2019), using the correlation matrix of normalised data as input to focus on inter-variable relationships. Visualisations were generated using the factoextra package version 1.0.7 (Kassambara and Mundt, 2020). The ggcorrplot package (Kassambara, 2021) was used to create a heatmap of variable correlations, while the gridExtra package (Auguie, 2017) facilitated side-by-side comparisons of variable contributions to principal components. Factor analysis was performed to uncover latent structures within the dataset using the psych package version 2.3.6 (Revelle, 2023). Factor extraction employed principal axis factoring with varimax rotation to achieve interpretability, complemented by maximum likelihood estimation for comparison. Factor loadings were visualised using ggplot2 version 3.4.4 (Wickham, 2023). The Mantel test was used to assess the correlation between two distance matrices using the vegan package version 2.6-4 (Oksanen, 2022). For each pair of variables, Euclidean distance matrices were computed and tested for significant Pearson correlations. Results with p values < 0.05 were considered significant. The Wilcoxon test and ggplot2 were used to analyse and visualise statistical differences between the Antarctic Peninsula and Weddell Sea groups, with a logarithmic y axis improving data interpretation.
3.1 Cruise setting
The regional satellite images of SST and chlorophyll concentration during the cruise period (Fig. 1) indicate two distinct areas where the PolarChange cruise was conducted: the Western Antarctic Peninsula and the northern Weddell Sea. For this reason, in the following we will explore potential differences between these two areas concerning biological and biochemical parameters (Fig. S5 in the Supplement). Sea surface temperature (SST) ranged between −0.7 and 2.4 °C (Table S1) with statistical differences within the two studied marine areas of (average ± SD values) 1.9 ± 0.6 °C (n = 7) in the western part of the Antarctic Peninsula compared to the colder waters of the Weddell Sea at 0.2 ± 0.7 °C (n = 12; p = 0.0072) (Table S1 and Fig. S5). Salinity (Table S1) remained relatively constant throughout the expedition, averaging 33.9 ± 0.3. Concerning solar irradiance (Table S1), higher but not significantly different values were observed near the Antarctic Peninsula, 355 ± 257 W m−2, compared to the 226 ± 194 W m−2 observed in the Weddell Sea.
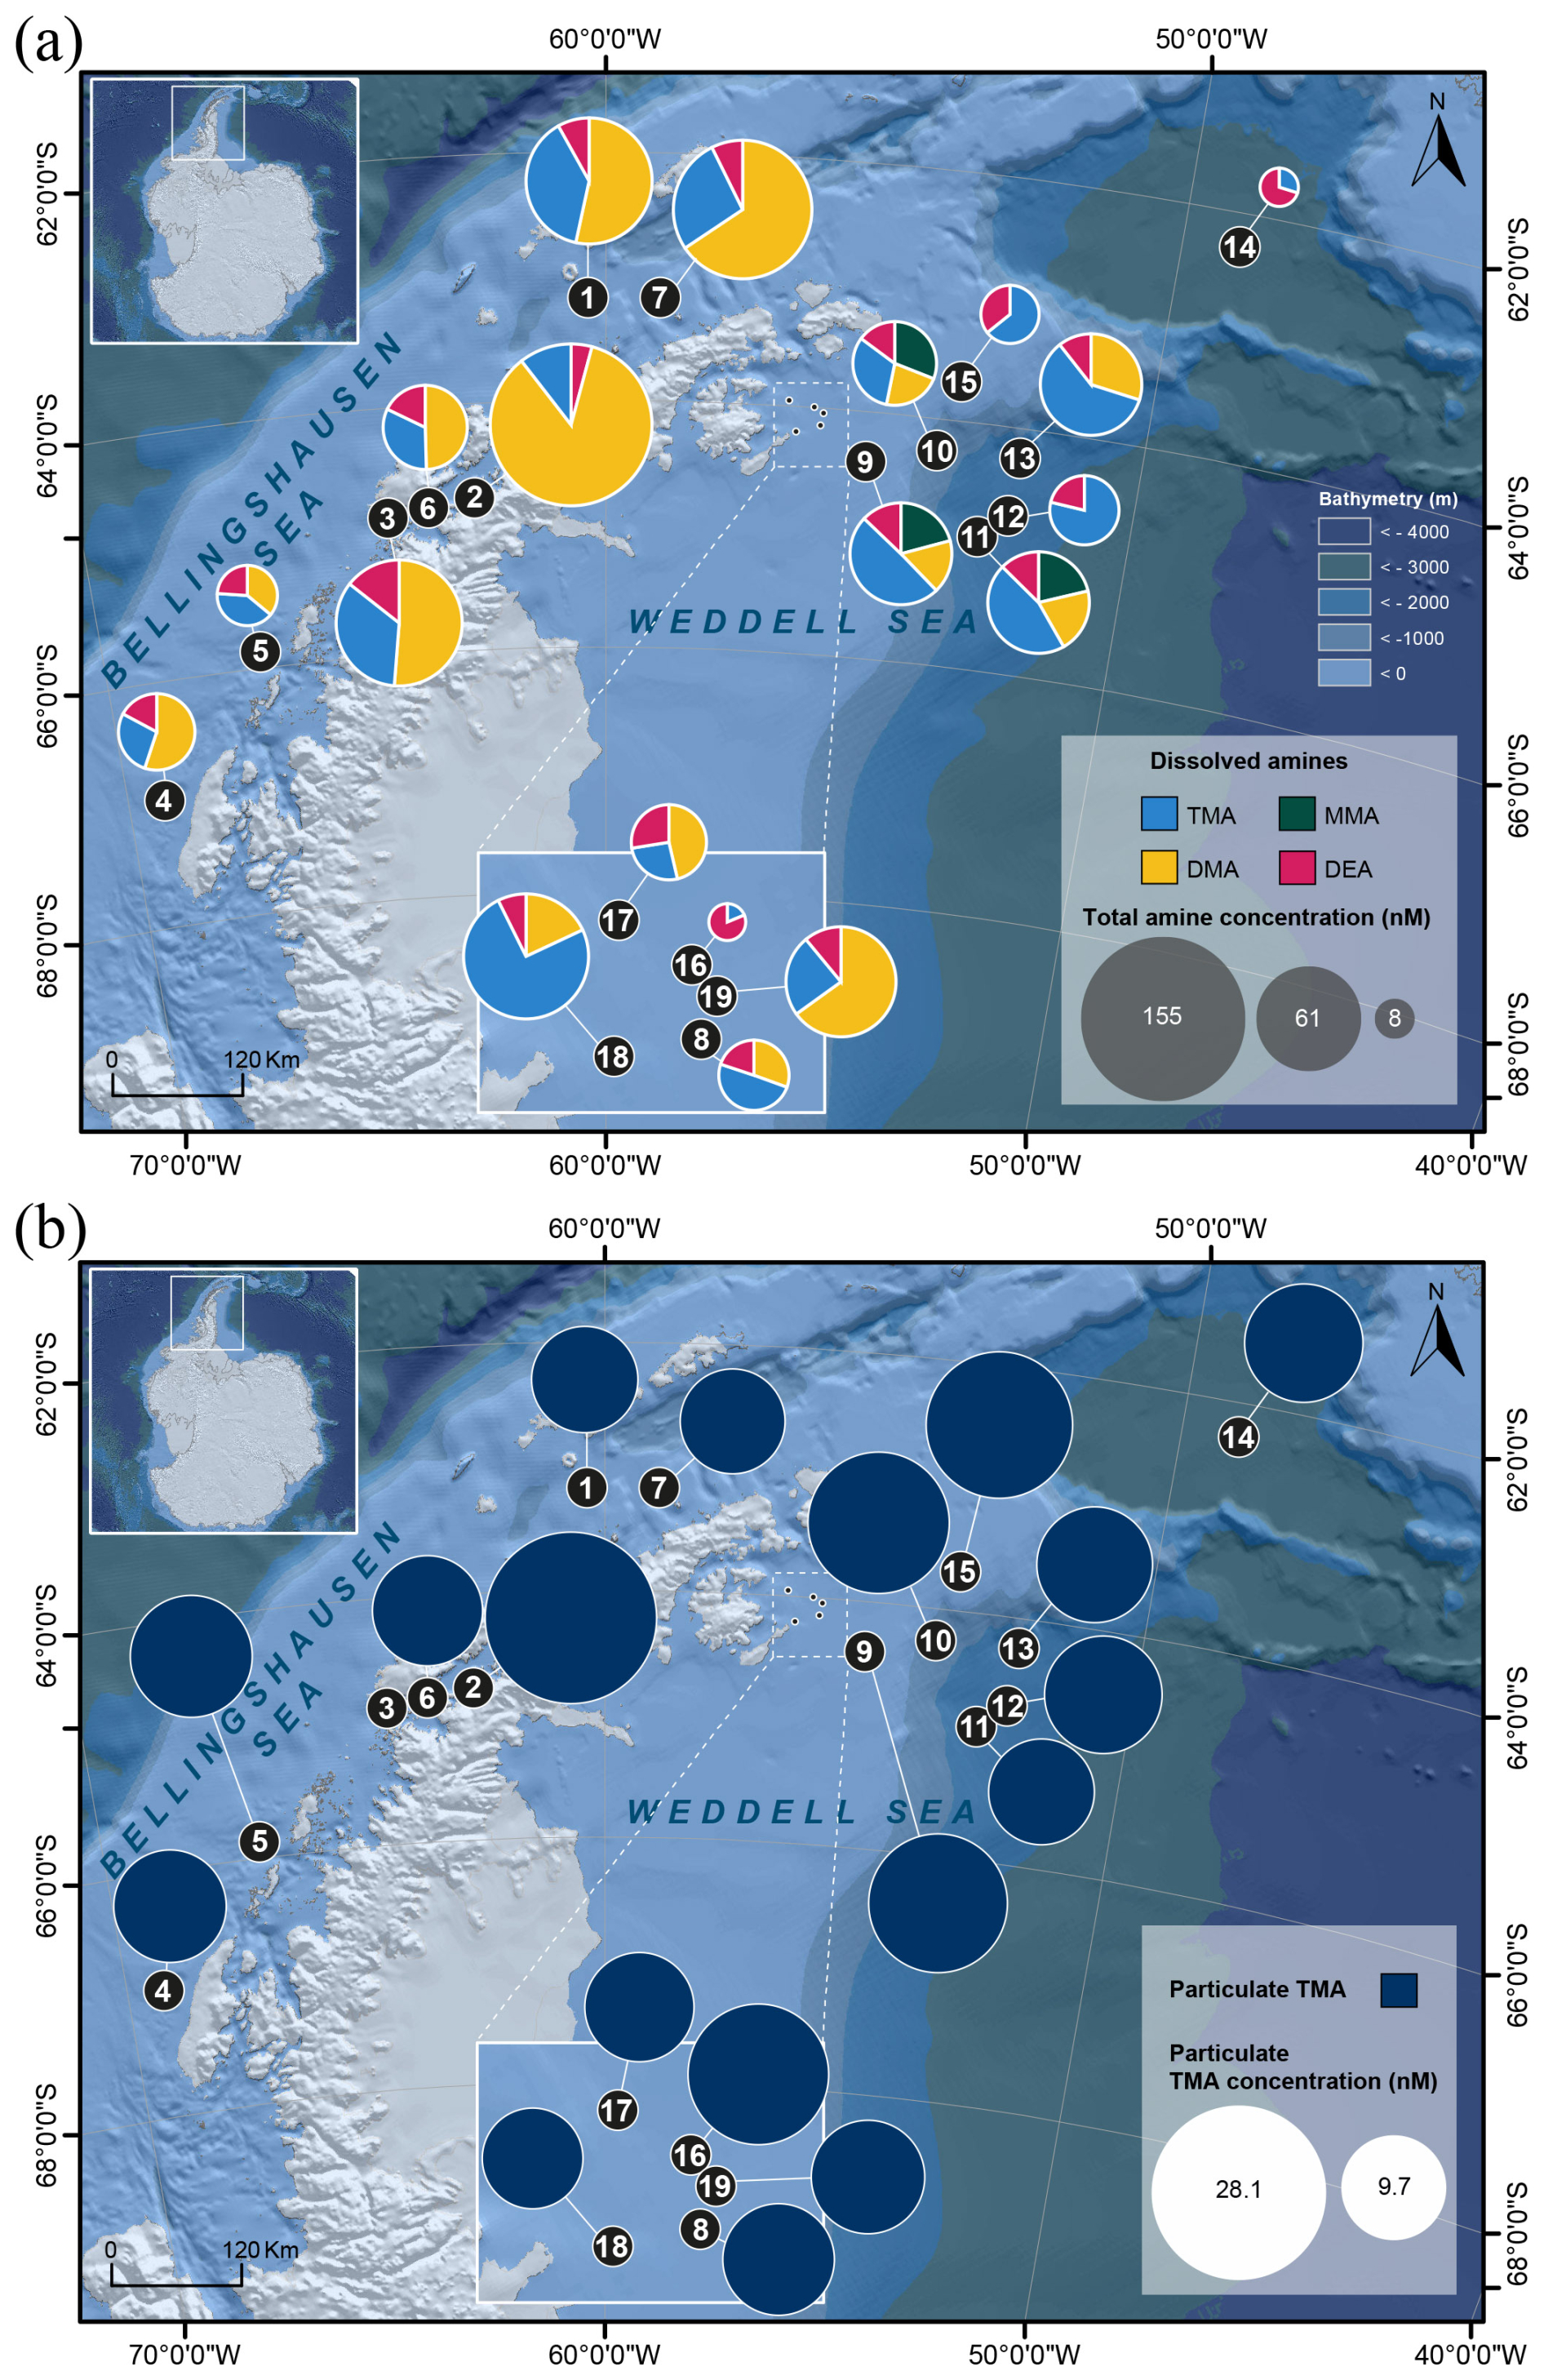
Figure 2Distribution of the concentrations (using pie charts) of (a) the four dissolved alkylamines (MMA, DMA, TMA and DEA) and (b) particulate TMA (∗ note that particulate sample #3 was lost) in the studied area.
3.2 Alkylamine concentrations
3.2.1 Dissolved alkylamines
We detected dissolved MAs and DEA at ∼ 4 m of depth over the cruise (Fig. 2a and Table S1). Dissolved MMA (dMMA) was quantitatively identified only in samples #9–#11 in the Weddell Sea with an overall concentration average of 12.7 ± 0.1 nM (n = 3). With this method we could detect dDMA in most of the samples, ranging from 7.6 to 132.3 nM with an average of 32.3 ± 32.7 nM (n = 15); it was below detection limits in samples #12 and #14–#16. The concentration of dDMA was statistically higher near the Antarctic Peninsula compared to the Weddell Sea (respectively, 49.9 ± 39.6 nM, n = 7, and 17.0 ± 11.4 nM, n = 8; p = 0.04) (Fig. S5). dTMA was measured in all the samples varying from 1.5 to 67.9 nM with an average of 20.9 ± 15.2 nM (n = 19) (20.8 ± 10.6 nM, n = 7, for the Western Antarctic Peninsula and 21.0 ± 17.3 nM, n = 12, for the Weddell Sea; p = 0.77). dDEA was identified in all the samples but with lower concentrations than the dissolved MAs along the studied area (Table S1). dDEA concentrations ranged between 5.1 and 13.3 nM, with an average of 7.2 ± 1.7 nM (n = 19) (7.7 ± 2.5 nM, n = 7, for the Western Antarctic Peninsula and 6.9 ± 1.0 nM, n = 12, for the Weddell Sea; p = 0.77). In this study, dDEA had the most even distribution of all alkylamines (excluding dMMA), with a coefficient of variation of 23 %, compared to 101 % for dDMA and 73 % for dTMA.
3.2.2 Particulate alkylamines
Only particulate TMA (pTMA) was detected and identified (Fig. 2b and Table S1) in 18 filter samples (sample #3 was lost), i.e. associated with particles. pTMA showed concentrations ranging between 9.7 and 28.1 nM with an average of 14.4 ± 4.6 nM (14.5 ± 6.2 nM, n = 6, for the Western Antarctic Peninsula and 14.4 ± 3.6 nM, n = 12, for the Weddell Sea; p = 0.62).
3.3 Biological variables
3.3.1 Chlorophyll a concentrations
The Chl a concentrations varied along the oceanographic cruise, from 0.2 to 9.6 µg L−1, throughout the area (Fig. 1), with an average of 1.2 ± 2.0 µg L−1 (n = 19) (Table S2 in the Supplement). More productive waters were found on the western side of the Antarctic Peninsula, with an average of 2.5 ± 2.9 µg L−1 (n = 7) being significantly higher than the values observed in the Weddell Sea samples (0.5 ± 0.3 µg L−1, n = 12; p = 0.0077) (Fig. S5).
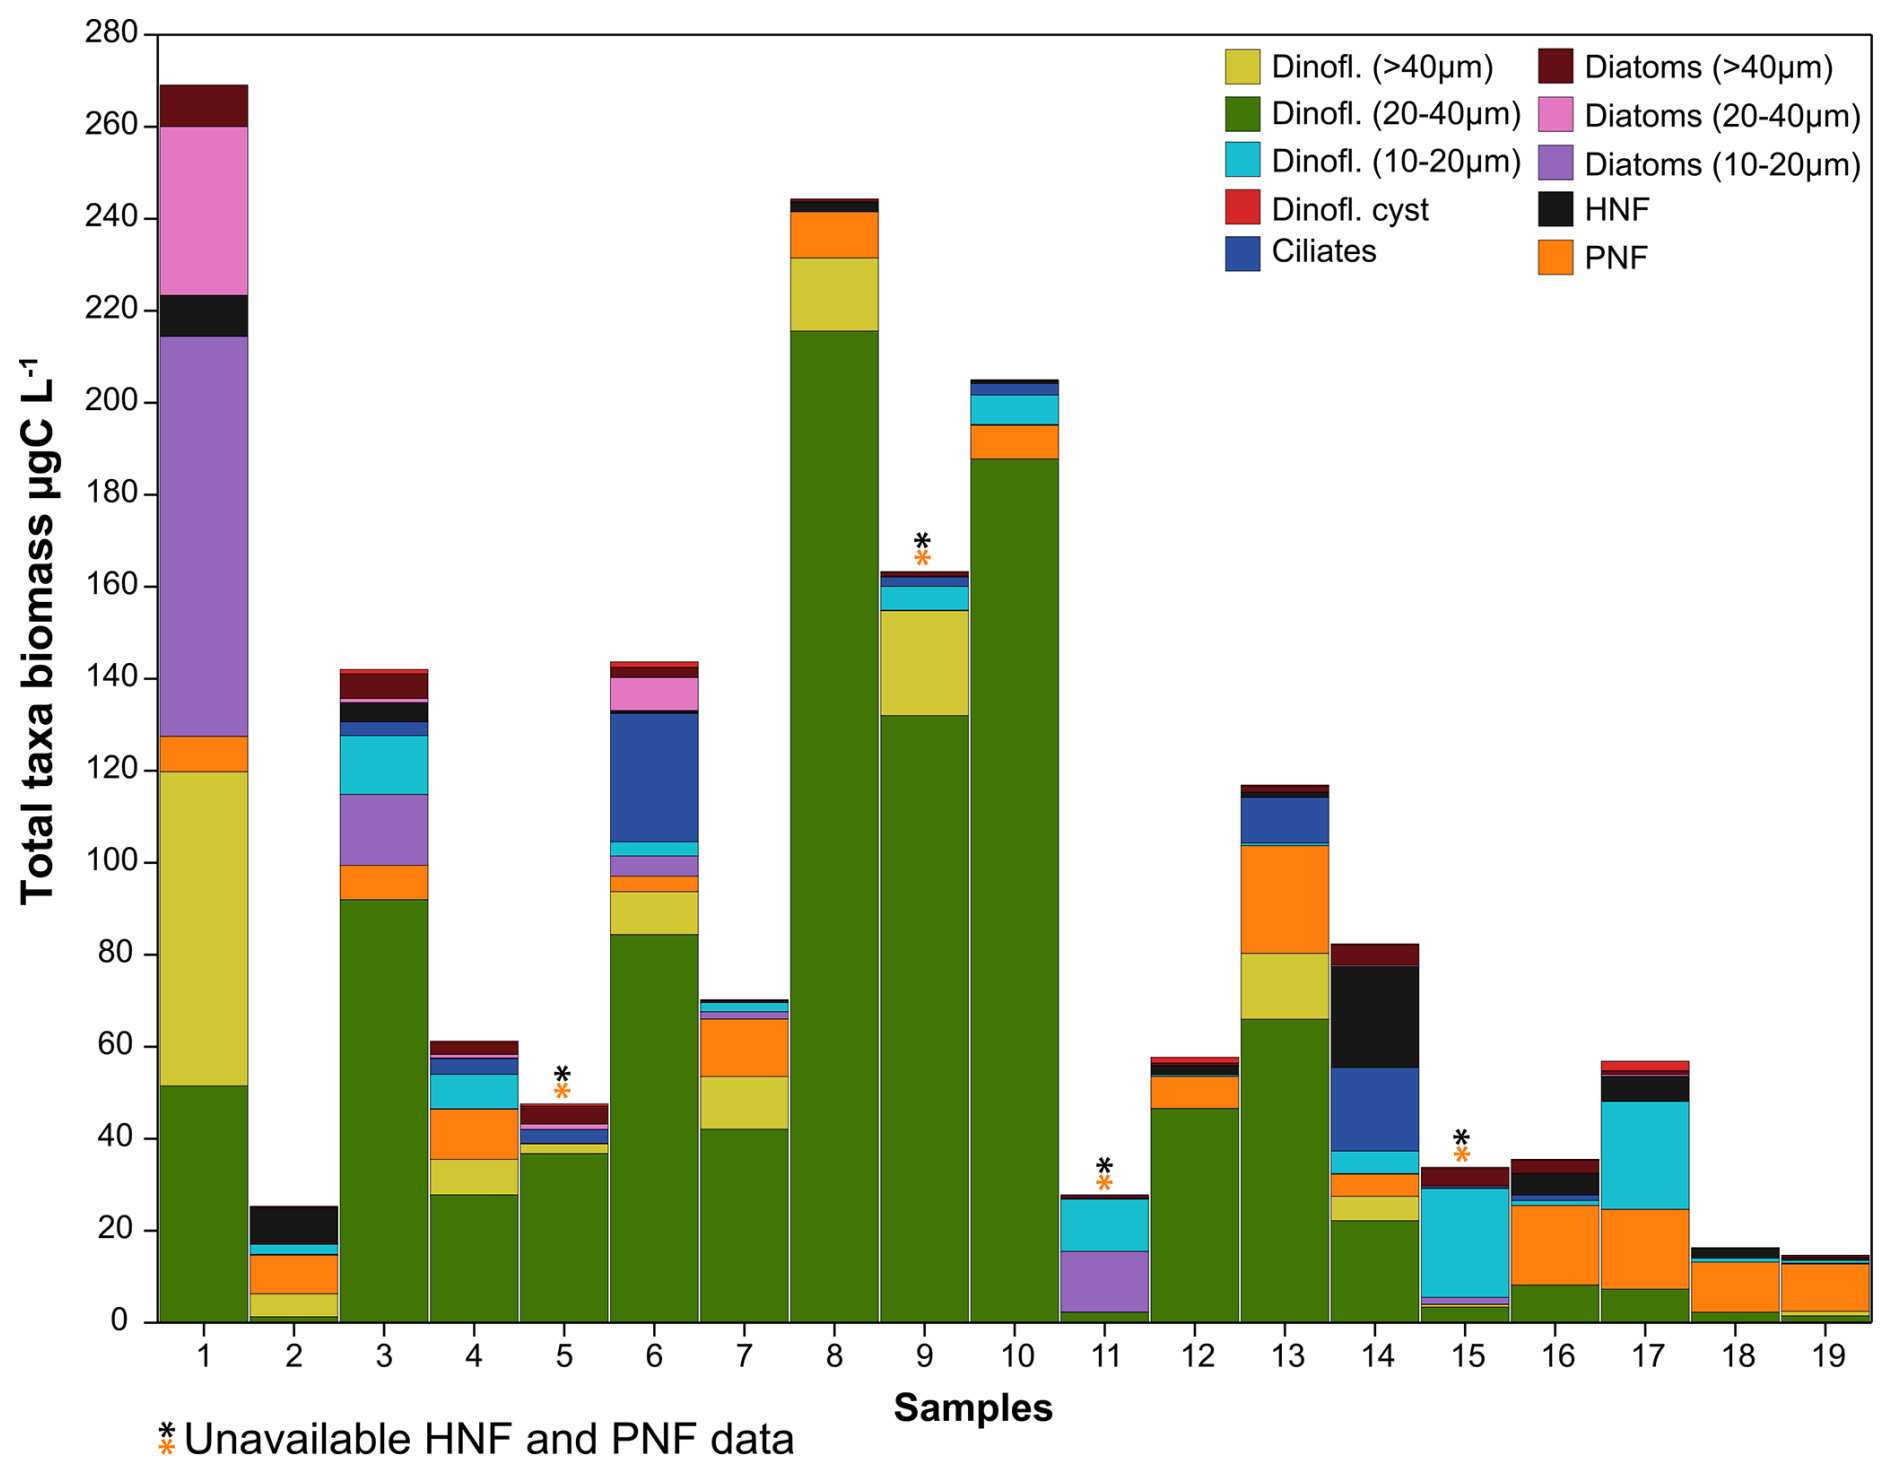
Figure 3Biomass (µg C L−1) and proportions (represented by the barplots) of the main phytoplankton groups, protist and microzooplankton in the 19 samples obtained in the studied area (∗ note that samples #5, #9, #11 and #15 of HNFs and PNFs were lost).
3.3.2 Viral and bacterial abundances
Viral abundances (VAs) (Table S2) averaged 8.2 ± 3.8 × 10⁶ viruses mL−1 (n = 19) and the V1, V2 and V3 populations accounted for, on average and respectively, 80 %, 16.5 % and 3.5 % of total VA. V4 was only present in sample #15 with an abundance of 1.8 × 10⁵ viruses mL−1. On average, total VA was significantly higher near the Antarctic Peninsula (11.5 ± 3.8 × 10⁶ viruses mL−1, n = 7) than in the Weddell Sea (6.2 ± 1.9 × 10⁶ viruses mL−1, n = 12; p = 0.013) (Table S2 and Fig. S5). V1 abundance was also significantly higher in the Antarctic Peninsula (9.4 ± 3.1 × 10⁶ viruses mL−1, n = 7) than in the Weddell Sea (4.9 ± 1.7 × 10⁶ viruses mL−1, n = 12; p = 0.0098) (Table S2 and Fig. S5). Concerning bacterial abundances (BA), the total average was 6.4 ± 2.5 × 10⁵ cells mL−1 (n = 19) with slightly (but not significantly different) higher numbers in the waters near the Antarctic Peninsula (7.0 ± 1.6 × 10⁵ cells mL−1, n = 7) compared to Weddell Sea (6.0 ± 2.8 × 10⁵ cells mL−1, n = 12). However, the highest value was estimated in sample #16 (11.7 × 10⁵ cells mL−1) (Table S2) collected in the Weddell Sea. Generally, most bacteria had a high nucleic acid content, indicating that more than half of the total bacteria numbers were active cells (Table S2). Note that here, we are referring to cell abundances and not to biomass; C concentration values calculated from cell numbers followed the same patterns as cell abundances for each microorganism described (data not shown in the text; see the Supplement).
3.3.3 Pico- and nanophytoplankton abundances
Regarding phytoplankton measured by FCM, the abundances of the five identified groups (1–2, 2–7, 7–15 and 15–20 µm and Cryptophytes) were 1.6 ± 1.7 × 10³, 1.8 ± 0.6 × 10³, 5.7 ± 7.5 × 10², 1.3 ± 2.5 × 10² and 1.5 ± 2.5 × 10² cells mL−1, respectively (average ± SD values, n = 19; Table S2). Picophytoplankton cells, ranging from 1 to 2 µm in size, exhibited significantly higher abundances around the Antarctic Peninsula, with an average of 3.3 ± 1.8 × 10³ cells mL−1 (n = 7), compared to the Weddell Sea (6.1 ± 4.1 × 10² cells mL−1, n = 12; p < 0.001) (Fig. S5). Conversely, the average abundance of the larger cells, nanophytoplankton, ranging from 2 to 20 µm, appeared marginally higher in the Weddell Sea (2.7 ± 0.9 × 10³ cells mL−1, n = 12) than in the western part of the Antarctic Peninsula (2.2 ± 1.5 × 10³ cells mL−1, n = 7). Specifically, the abundance of nanophytoplankton cells 2–7 µm in size was significantly greater in the Weddell Sea compared to the Antarctic Peninsula coasts (2.1 ± 0.5 and 1.3 ± 0.5 × 10³ cells mL−1, n = 19; p = 0.0072) (Fig. S5). Similarly, cryptophytes (Cryptomonas spp.) presented abundances of 112 ± 143 cells mL−1 (n = 7) in the Western Antarctic Peninsula in contrast to 146 ± 121 cells mL−1 (n = 12) in the Weddell Sea.
3.3.4 Nanoflagellate abundances
Abundances of HNFs and PNFs measured by epifluorescence microscopy were, on average, of 986 ± 951 cells mL−1 and 5046 ± 2538 cells mL−1 (n = 15; samples #5, #9, #11 and #15 were lost), respectively (Fig. 3 and Table S3 in the Supplement). In the Western Antarctic Peninsula, the abundances were 1234 ± 1195 cells mL−1 for HNFs and 4240 ± 1688 cells mL−1 for PNFs (n = 6). In comparison, in the Weddell Sea, the abundances were 820 ± 698 cells mL−1 for HNFs and 5583 ± 2849 cells mL−1 (n = 9) for PNFs. Concerning size, in the case of HNFs, the 2 to 5 µm group constitutes the largest proportion of total abundance followed by the smallest size category (≤ 2 µm), the 5 to 10 µm group, and finally the largest category ranging from 10 to 20 µm. Similarly, for PNFs, the smallest size categories (≤ 2 and 2–5 µm) were the most abundant, followed by the 5–10 µm category and lastly the largest category spanning 10 to 20 µm (Table S3). PNF 5–10 µm showed a statistical difference between the two Antarctic areas with barely higher concentrations in the Weddell Sea (117.3 ± 88.3 and 193.6 ± 74.4 cells mL−1, n = 15; p = 0.045) (Fig. S5). Total PNF exhibited slightly greater abundances in the Weddell Sea. Additionally, Phaeocystis presented slightly lower abundances west of the Antarctic peninsula of 208 ± 169 cells mL−1 (n = 6) in contrast to 352 ± 383 cells mL−1 (n = 9) in the Weddell Sea (Table S3).
3.3.5 Composition and abundance of microplankton assemblages
A diverse range of phytoplankton taxa was found in the studied period in the Antarctic marine environments (Fig. 3 and Table S4 in the Supplement). In the smallest size of the dinoflagellate group (10–20 µm), the identified taxa were Gymnodinium spp., Kareniaceae, Oxytoxum spp. and Prorocentrum cordatum (= P. minimum). The intermediate size group (20–40 µm) included larger taxa such as Gymnodinium spp., Protoperidinium bipes, Gyrodinium spp., Kareniaceae cells and Lebouridinium glaucum (= Katodinium glaucum). In the > 40 µm category, only Gyrodinium spp. and Gymnodinium spp. heterotrophs were present. Among diatoms, in the 10–20 µm size group, we identified a variety of genera, including centric and pennate chains, Thalassiosira, Porosira, Coscinodiscus, Fragilaria, Chaetoceros and Amphora. In the 20–40 µm size range, larger cells of Coscinodiscus, Corethron criophilum and its spores, pennate chains like Pseudo-nitzschia, Proboscia alata, Licmophora, Achnanthes, Navicula, Leptocylindrus, and Actinocyclus were observed. Among the larger diatoms (> 40 µm), we identified Coscinodiscus, Corethron criophilum, Chaetoceros spp., Proboscia alata, Lioloma chains, Rhizosolenia curvata, Actinocyclus and pennate diatoms. Non-photosynthetic taxa included mainly tintinnid ciliates.
Dinoflagellates were particularly dominant, though in general, they were distributed close to the Antarctic Peninsula. Specifically, dinoflagellate cysts accounted for ca. 1.2 ± 1.1 × 10³ cells L−1 (n = 7), compared to 0.8 ± 1.6 × 10³ cells L−1 in the samples from the Weddell Sea (n = 12). Dinoflagellates 10–20 µm were found at concentrations of 6.9 ± 5.8 × 10³ cells L−1 (n = 7) near the Antarctic Peninsula, compared to 1.3 ± 1.2 × 10⁴ cells L−1 (n = 12) in the Weddell Sea. Intermediate-sized dinoflagellates (20–40 µm) had similar abundances in both seas, with 9.7 ± 5.1 × 10³ cells L−1 in the Antarctic Peninsula waters (n = 7) and 1.7 ± 2.3 × 10⁴ cells L−1 in the Weddell Sea (n = 12). Larger dinoflagellates (> 40 µm) were more concentrated in the Antarctic Peninsula waters, with 1.2 ± 1.4 × 10³ cells L−1 (n = 7) compared to 3.2 ± 4.9 × 10² cells L−1 (n = 12) in the Weddell Sea. Similarly, diatoms were more abundant near the Antarctic Peninsula waters: smaller diatom cells (10–20 µm) were significantly more prevalent in this area (2.0 ± 3.7 × 10⁵ cells L−1, n = 7) compared to the Weddell Sea (4.7 ± 9.1 × 10⁵ cells L−1, n = 12; p = 0.0087) (Fig. S5). Furthermore, sample #1 exhibited the highest abundance of diatoms within the 10–40 µm size range compared to all other samples (Fig. 3). Intermediate-sized diatoms followed a similar pattern, with 1.2 ± 2.9 × 10⁵ cells L−1 (n = 7) near the Antarctic Peninsula waters and 6.7 ± 8.5 × 10² cells L−1 (n = 12) in the Weddell Sea. Larger diatoms (> 40 µm) presented significantly higher concentrations (3.5 ± 2.9 × 10³ cells L−1, n = 7) in the Antarctic Peninsula area than in the Weddell Sea (8.0 ± 5.8 × 10² cells L−1, n = 12; p = 0.028) (Fig. S5). In contrast, ciliates showed slightly higher abundances in the Weddell Sea, averaging 4.5 ± 8.2 × 10² cells L−1 (n = 12) compared to 4.1 ± 3.5 × 101 cells L−1 (n = 7) in the Western Antarctic Peninsula.
3.3.6 Photosynthetic efficiency ()
The ecophysiological state and fitness of phytoplankton () ranged between 0.21 and 0.54, with an average of 0.38 ± 0.10 (n = 19). Values were slightly yet not significantly higher in the samples near the Antarctic Peninsula (0.41 ± 0.06, n = 7) compared to the samples collected in the Weddell Sea (0.36 ± 0.11, n = 12; p = 0.36).
3.4 Chemical variables
3.4.1 Organic carbon and nitrogen
DOC and DON averaged 62.5 ± 32.5 µM (n = 19) and 6.1 ± 3.1 µM (n = 15), respectively, during this expedition (Table S5 in the Supplement). Note that DON was below the detection limit in four samples. Differences were observed between the two polar regions. Near the Antarctic Peninsula, DOC exhibited a lower concentration, 57.6 ± 7.4 µM (n = 7), in contrast to the Weddell Sea, with slightly higher DOC levels (77.4 ± 36.8 µM, n = 12) (Table S5). Similarly, TN and DON concentrations were slightly higher in the Weddell Sea, measuring 29.1 ± 5.8 µM (n = 12) and 6.3 ± 4.1 µM (n = 10), respectively, compared to the Western Antarctic Peninsula, where concentrations of 27.4 ± 2.4 µM (n = 7) and 5.3 ± 2.9 µM (n = 5) were measured. The average contribution of dissolved amines (dMMA, dDMA, dTMA and dDEA) to DOC and DON was determined to be 0.3 ± 0.2 % (n = 19) and 1.8 ± 2.8 % (n = 15), respectively.
POC and PON were measured in all samples, with averages of 7.6 ± 5.3 µM (n = 19) and 1.2 ± 0.9 µM (n = 19), respectively (Table S5). Statistical analysis revealed significantly higher POC and PON concentrations in the Western Antarctic Peninsula (POC: 10.7 ± 7.3 µM; PON: 1.8 ± 1.2 µM, n = 7) than in the Weddell Sea (POC: 5.7 ± 1.7 µM; PON: 0.9 ± 0.2 µM, n = 12) (p = 0.036 for POC and p = 0.028 for PON) (Fig. S5). The C:N ratio of particulate organic matter closely approximated the canonical Redfield ratio of 6.6, with an observed mean of 6.4 ± 0.6 (n = 19) (Table S5). The contribution of particulate TMA to POC and PON averaged 0.7 ± 0.3 % and 1.5 ± 0.6 % (n = 18 for both), respectively.
3.4.2 Sulfur compounds
DMSP concentrations averaged 35.1 ± 16.6 nM considering all samples (n = 19) (Table S5). A disparity in the concentration of this sulfur compound was observed between the western region of the Antarctic Peninsula and the Weddell Sea, where concentrations averaged 44.8 ± 20.9 nM (n = 7) and 29.4 ± 9.8 nM (n = 12), respectively. Similarly, DMS, the breakdown product of DMSP, showed statistically significant differences between samples, with higher values at the Western Antarctic Peninsula (1.7 ± 0.4 nM, n = 7) and lower values in the Weddell Sea (1.0 ± 0.4 nM, n = 12; p = 0.011) (Table S5 and Fig. S5).
3.4.3 Nutrients
Nutrient levels remained relatively stable throughout the duration of the cruise, with average concentrations of 21.0 ± 2.5 and 0.2 ± 0.0 µM for nitrate and nitrite, respectively, and 54.9 ± 6.1 µM for silicate (n = 19) (Table S5). Contrastingly, ammonium, phosphate and TP showed statistically significant differences within the two marine areas with higher values for Weddell Sea, 1.6 ± 0.4 µM for ammonium, 2.3 ± 0.2 µM for phosphate and 17.5 ± 9.0 µM for TP, compared to the Western Antarctic Peninsula area, 0.8 ± 0.2 (n = 19; p < 0.001), 1.9 ± 0.3 (n = 19; p = 0.0098) and 4.9 ± 1.9 µM (n = 19; p = 0.0018).
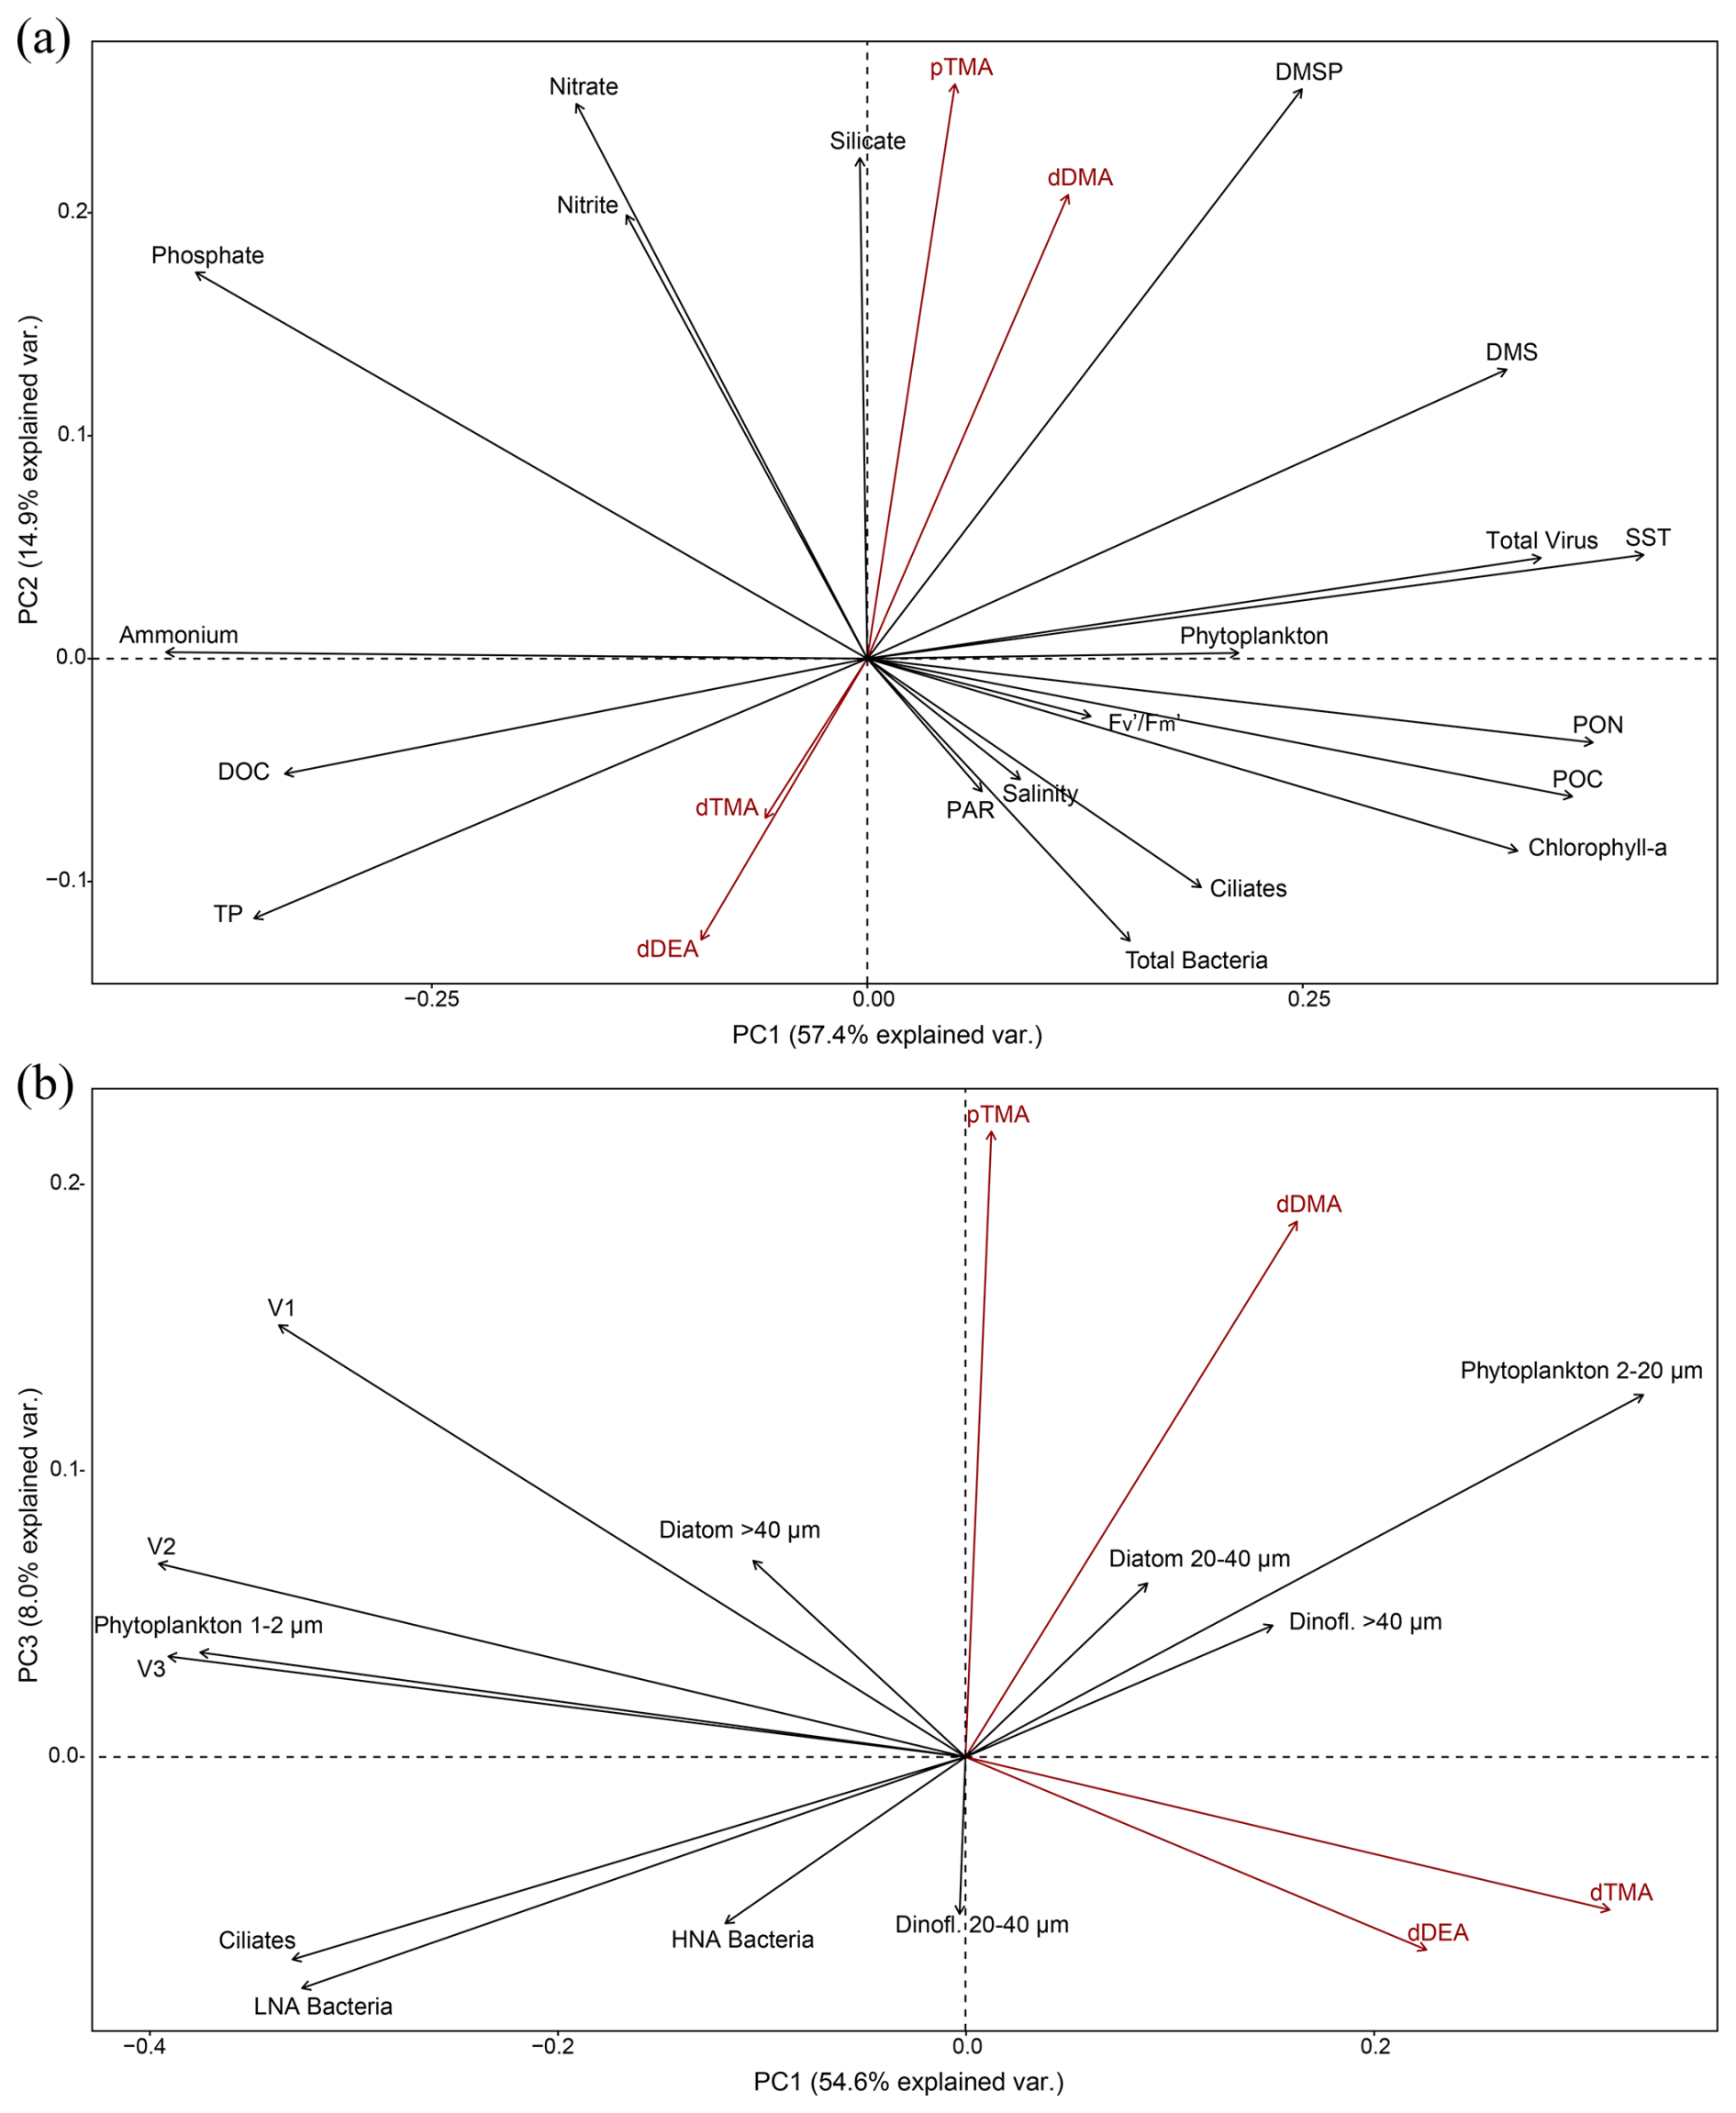
Figure 4Principal component analyses of the highest explanatory biogeochemical parameters in the 18 seawater samples collected (see text). (a) PC2 versus PC1 of all physical and biogeochemical data from the water samples and the biomass of the main phytoplankton groups and viral, bacterial and ciliate biomasses and (b) PC3 versus PC1 of the more specific PCA run considering the biomasses of size-resolved phytoplankton types and ciliates, active and non-active bacterial cells, and the virus fractions. The percentage of explained variance is given on each principal component axis. Amine forms are in red to facilitate visualisation.
3.5 Multivariate statistical analysis of the distributions of alkylamines, microbiota, and chemical and environmental variables
We investigated how seawater biogeochemistry influences amine concentrations to address the largely unexplored role of microbiology and ecology in marine alkylamine cycles. Principal component analyses were conducted to examine correlations among a suite of physical and biogeochemical (including amine forms) variables and biomass data for microbial and viral populations of the 18 sampled stations (sample #3 was excluded because pTMA was missing) (Fig. 4). Variables like dMMA, DON, V4 and nanoflagellate biomasses were excluded from the PCA analyses because they were not detected in all samples, and dinoflagellates and diatoms with 10–20 µm biomass, TN, TOC, and total organic nitrogen (TON) were excluded because they overlapped with included variables. Overall, the distribution of variable vectors within the multidimensional space of the PCA should help us understand how environmental and biological variables influence the variability in marine alkylamines.
The first PCA, PCA (a) (Fig. 4a), provided an integrative perspective on the microbial community structure, encompassing the biomass of total bacteria, virus, phytoplankton biomasses (phytoplankton > 1 µm, including cryptophytes quantified by flow cytometry, and dinoflagellates cysts, dinoflagellates and diatoms > 20 µm biomass, determined by optical microscopy) and biomass estimates for ciliates, assessed via optical microscopy. Additionally, it included physical (SST, salinity, PAR) and biogeochemical (DMSP, DMS, chlorophyll a, , POC, PON, DOC, TP and nutrients) variables. The first two principal components (PC1 and PC2) accounted for 57.4 % and 14.9 % of the total variance, respectively. In PCA (a), while abiotic factors (SST, ammonium, phosphate), particulate organic matter (POC, PON) and total virus biomass were the most significant contributors to PC1, pTMA, dDMA, DMSP, nitrate and silicate contributed predominantly in a positive direction to the PC2 axis (Fig. 4a). The observed methylamines were aligned neither with physical parameters nor with phytoplankton biomass or chlorophyll a, which may be regulated by e.g. iron (Fe) availability (not measured in this study). However, they more strongly covaried with nutrient concentrations, particularly silicate, and DMSP. Note that the expedition took place during a transitional period, after the peak of the ice melt and associated diatom blooms, alongside the initial stages of sea-ice formation.
Figure 4b further delves into a second analysis, PCA (b), focusing on specific biomass categories, including phytoplankton 1–2 µm, phytoplankton 2–20 µm (containing cryptophytes), diatoms 20–40 and > 40 µm, dinoflagellates 20–40 and > 40 µm, V1, V2 and V3 viral fractions, and HNA and LNA bacteria, each of them characterised by optical microscopy or FCM. This detailed analysis provides nuanced insights into the interplay between microbial community dynamics and seawater biogeochemistry. The first and third principal components (PC1 and PC3, which were the components that explained the largest variance of the amines) account for 54.6 % and 8.0 % of the total variance, respectively. In summary, in PCA (b), pTMA and dDMA were aligned with nanophytoplankton (2–20 µm) which included cryptophytes (Cryptomonas spp.) and not with the biomass of larger phytoplankton (Fig. 4b).
Table 1Factor analysis loadings corresponding to the PCAs shown in Fig. 4 after varimax rotation. The upper part of the table, Variables (a), refers to PCA (a) (Fig. 4a), while the bottom part refers to PCA (b) (Fig. 4b). Loadings above 0.2 (or below −0.2) (significant loadings) are shown in italics and above 0.6 (or below −0.6) in bold italics. The last two lines of each table refer to the total variance explained by one factor in the data (SS loadings) and to the proportion of the total variance in the dataset (Proportion var.).
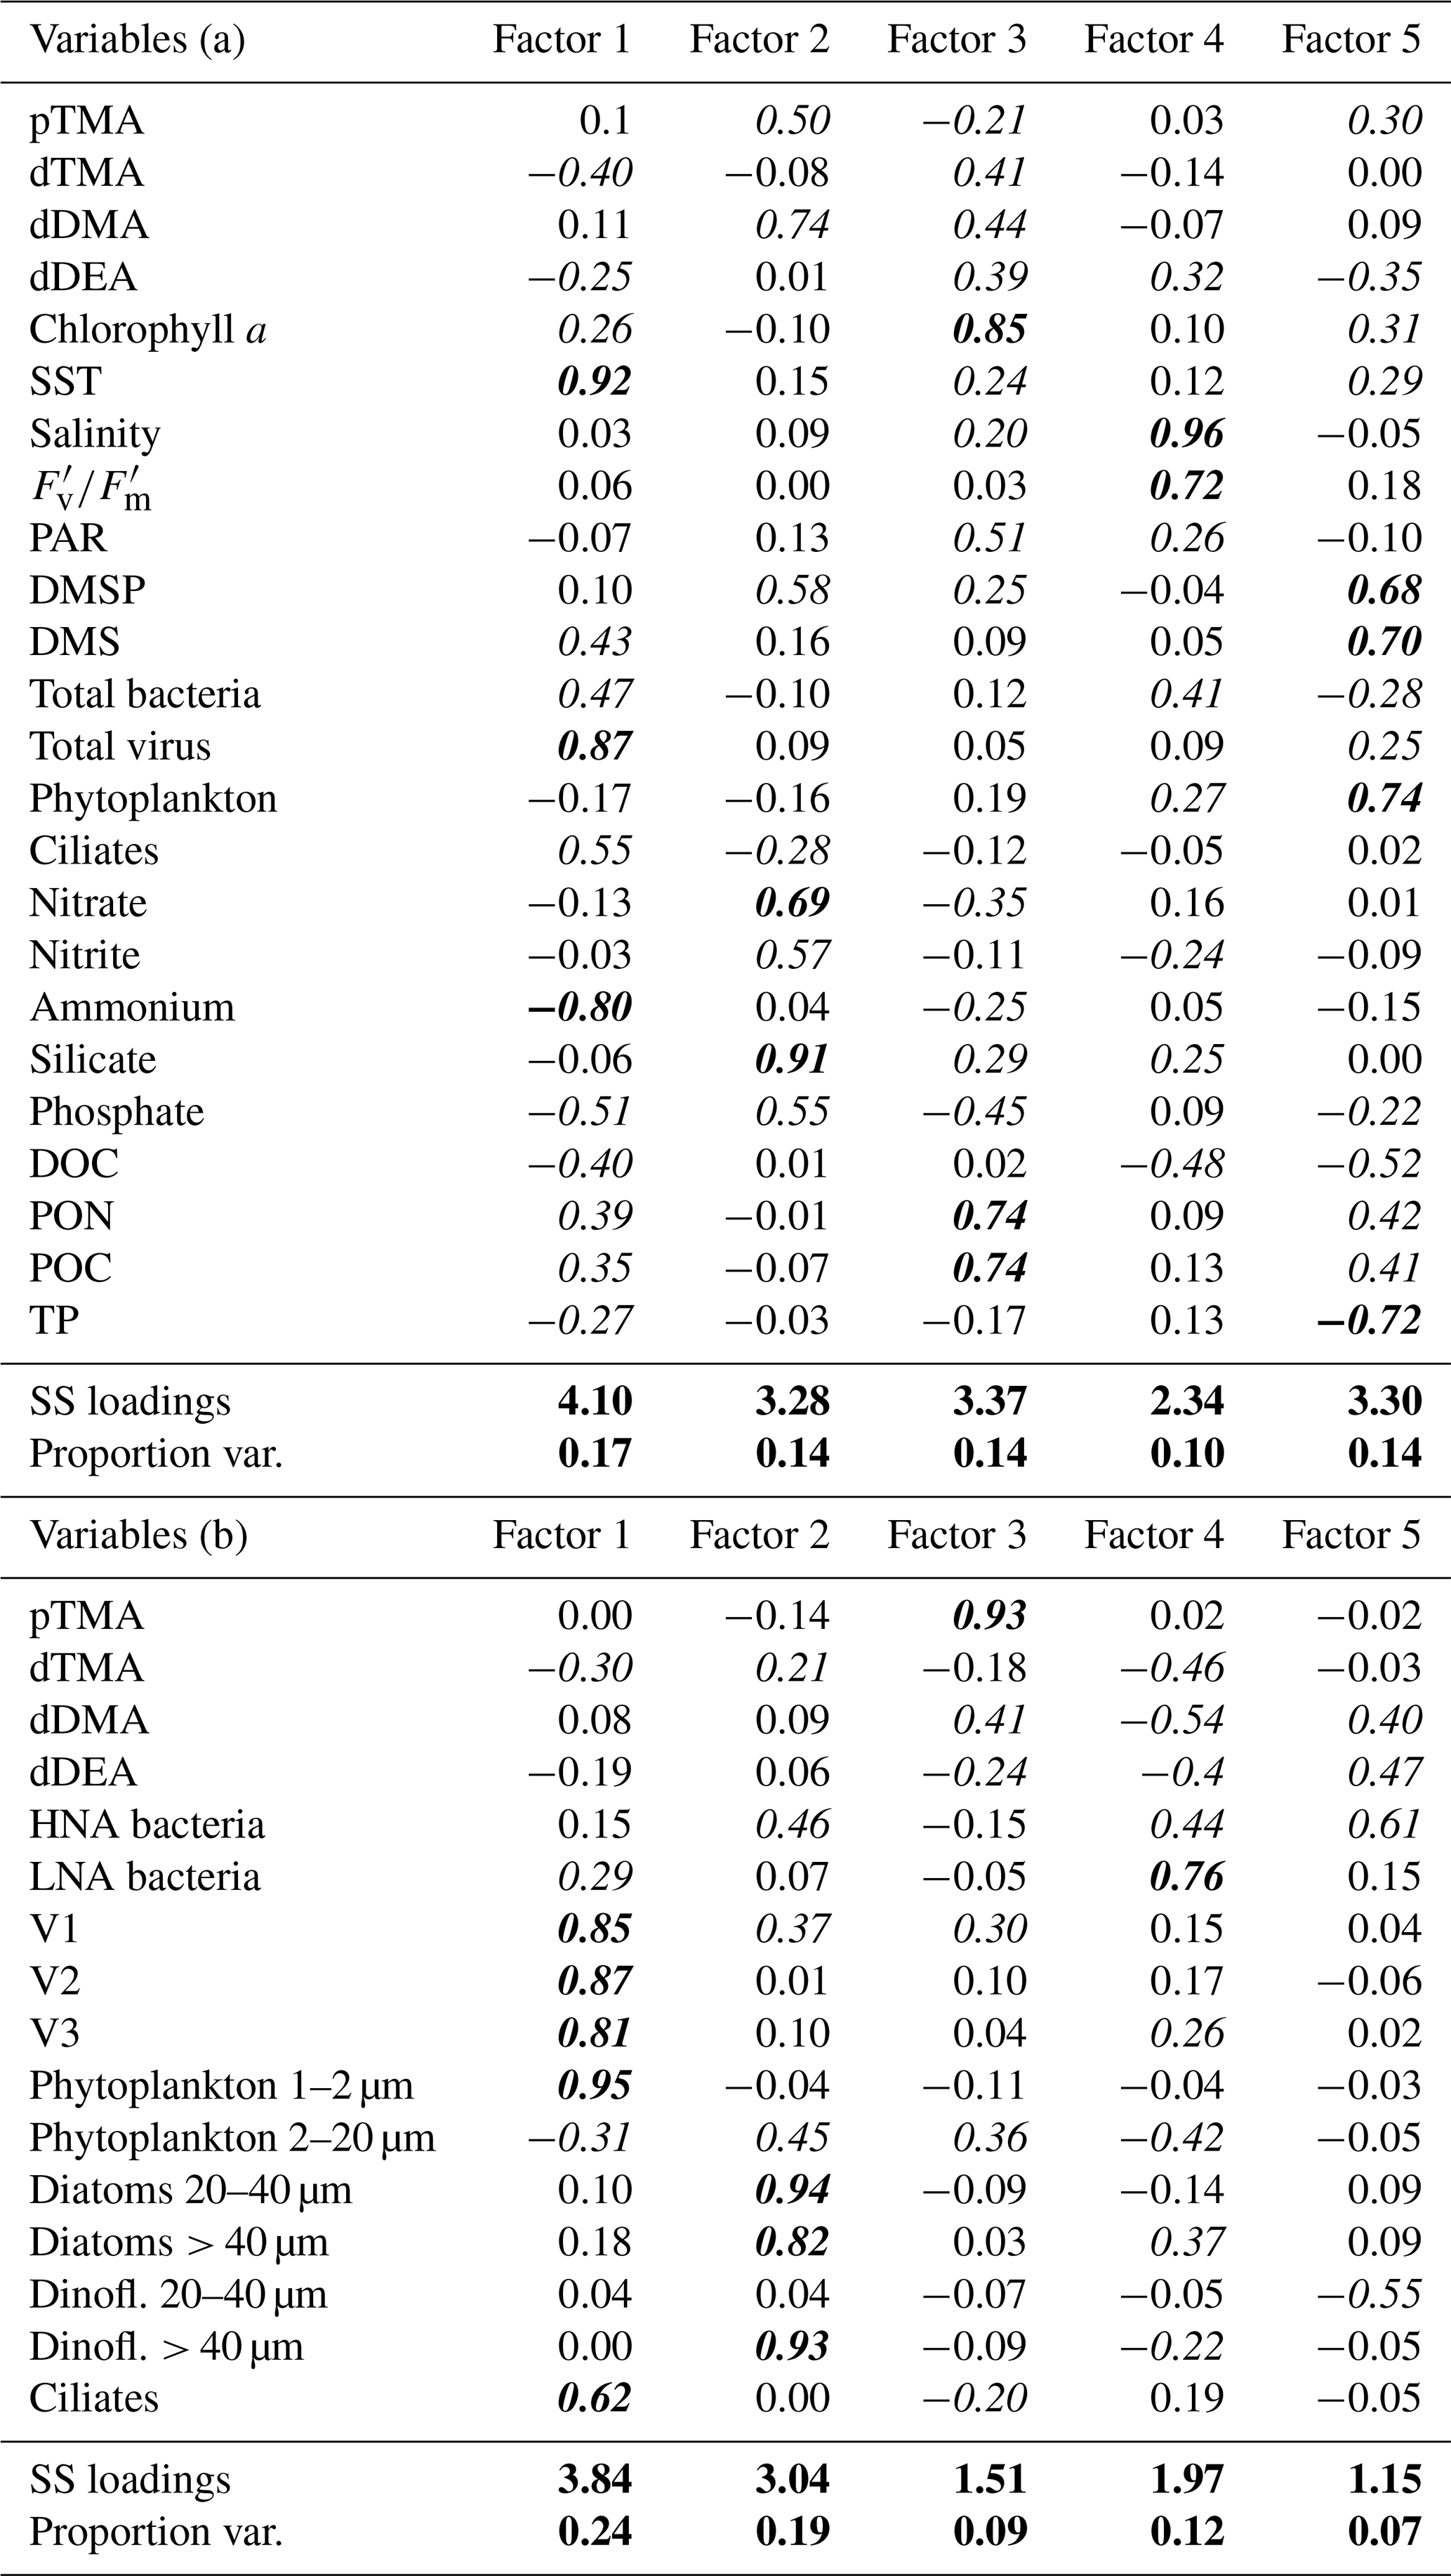
Varimax rotation was applied to the factors extracted via principal axis factoring to enhance interpretability by maximising the variance of factor loadings, resulting in more distinct and interpretable patterns (Jolliffe, 2002) using the same variables as those applied in the PCAs. All key parameters, detailed in Table 1, were included in the analyses to support a robust interpretation of the principal components. Five factors were selected from the scree analysis, in sum explaining 69 % (Table 1a) and 71 % (Table 1b) of the total data variance. Table 1 presents the loadings of the variables on the five rotated factors, indicating the strength of correlation of each variable and its respective factor. Loadings (positive or negative) above 0.2 (or below −0.2) were considered significant. Finally, Pearson correlations for all pairs of variables are presented in Fig. S6 in the Supplement. Overall, the factor analysis reinforced the exploration of the combined contribution of alkylamines and other variables to the total variance observed in the previous PCA analyses. pTMA showed larger positive loadings in Factor 2 of Table 1a (along with nutrients and DMSP) and Factor 3 of Table 1b (with nanophytoplankton and Cryptomonas spp. and slightly with the V1 virus population). This suggests that pTMA mostly occurred in the nanophytoplankton size fraction (< 20 µm) that typically harbours most of the DMSP (Stefels et al., 2007). Also in the pairwise correlation analysis (Fig. S6), pTMA was most positively correlated with phytoplankton cells between 2 and 7 µm, Cryptomonas spp. (Mantel statistical test r and p value of 0.71 and 0.007, respectively) and silicate (Mantel statistical test r and p value of 0.63 and 0.01, respectively), as well as with DMSP (Mantel statistical test r and p value of 0.51 and 0.034, respectively), PNF 10–20 µm (Mantel statistical test r and p value of 0.37 and 0.037, respectively), HNF and particularly HNF 2–5 µm (Mantel statistical test r and p value of 0.49 and 0.03, respectively). Conversely, it was negatively correlated with big diatoms (> 40 µm) (p < 0.1). Dissolved TMA showed its largest negative and positive loadings in Factors 1 and 3 of Table 1a, together with chlorophyll a and particulate organic matter, and Factors 1 and 4 of Table 1b, where it was essentially correlated with nanophytoplankton. Indeed, in the correlation matrix (Fig. S6) dTMA correlated with phytoplankton cells between 7 and 15 µm (Mantel statistical test r and p value of 0.53 and 0.025, respectively) and more generally with phytoplankton cells ranging from 2 to 20 µm (Mantel statistical test r and p value of 0.45 and 0.004, respectively).
Dissolved DMA contributed significantly to Factor 2 in Table 1a and similarly in several factors in Table 1b, concurring with pTMA, DMSP, photosynthetic cells in the 2–20 µm size range, HNA bacteria and nutrients (particularly silicate). In the correlation matrix (Fig. S6), dDMA was positively correlated with particulate TMA (Mantel statistical test r and p value of 0.60 and 0.029, respectively), Cryptomonas spp. (Mantel statistical test r and p value of 0.65 and 0.043, respectively), DMSP (Mantel statistical test r and p value of 0.61 and 0.017, respectively), silicate (Mantel statistical test r and p value of 0.72 and 0.004, respectively), nanoflagellate abundances, PNFs (10–20 µm), HNFs and small HNFs (2–5 µm) (Mantel statistical test r and p value of 0.52 and 0.02, respectively).
Dissolved DEA has several similar positive and negative loadings in Table 1a, which was also contributed by bacteria and general phytoplankton biomasses, and . Additionally, dDEA contributed principally to Factor 5 in Table 1b together with HNA bacteria. In pairwise correlations (Fig. S6), dDEA showed positive correlations with (also indicated by the Mantel statistical test with r and p value, 0.24 and, 0.038, respectively) and DMS (Mantel statistical test with r and p value, 0.45, 0.046, respectively) and with dinoflagellate cysts, small dinoflagellates (10–20 µm) and big diatoms (> 40 µm) (p < 0.1).
Finally, dMMA, which was excluded from the PCA and factor analysis as it was below the detection limit in most cases, is known to originate primarily from the bacterial degradation of N-containing osmolytes and amino acids (Lidbury et al., 2015b; Mausz and Chen, 2019). dMMA exhibited a significant positive correlation with DOC (Mantel statistical test r and p value of 0.49 and 0.016, respectively) and TOC (Mantel statistical test r and p value of 0.48 and 0.02, respectively,) and a negative correlation with total and HNA bacteria biomass (Mantel statistical test r and p value of −0.28 and 0.04, respectively), salinity (Mantel statistical test r and p value of −0.43 and 0.012, respectively), and SST (Fig. S6).
4.1 Alkylamine distributions
The almost exclusive detection of TMA in particles suggests that this may be the predominant form of methylated amines within cells. Release from cells explains that dissolved TMA is consistently present in all our seawater samples, together with the fact that TMA has the lowest Henry's constant, indicating it is the most soluble amine. This tertiary amine is known to be the primary compound released during the decomposition of marine algae and microorganisms, marsh grasses, and fish, mainly as a breakdown product of quaternary amine precursors (Mausz and Chen, 2019; Sun et al., 2019). Three other alkylamines were detected dissolved in seawater. Their distributions varied across regions around the Antarctic Peninsula: the samples off the Western Antarctic Peninsula harboured different total dissolved amine concentrations (78.3 ± 44.7 nM; n = 7) from those from the northern Weddell Sea (42.4 ± 24.9 nM; n = 12) (Fig. 2a). This coincided with higher Chl a levels west of the Antarctic Peninsula (Fig. 1, Table S2 and Fig. S5). Also, values were slightly higher in samples from the Antarctic Peninsula, indicating greater photosynthetic efficiency and suggesting that in this area phytoplankton were in better physiological condition than in the Weddell Sea. Given the similarities in phytoplankton abundances and composition of the two areas, this difference can likely be attributed to the potential effect of light stress, since waters of the Weddell Sea were clearer and more stratified (data not shown) and hence more exposed to excess damaging sunlight. Most samples were collected at 18:00 LT, which corresponds to daylight hours during the Austral summer. Potential diel variations in amine concentrations should be taken into account in future studies.
Amines have been measured in seawater in polar regions primarily by Gibb and Hatton (2004), who used a flow-diffusion gas chromatography method with selective nitrogen detection in Marguerite Bay, Antarctica, and by Dall'Osto et al. (2017, 2019), with subsequent methodological improvements introduced by Akenga and Fitzsimons (2024). Gibb and Hatton (2004) reported maximum dMMA concentrations of 36 nM, while Dall'Osto et al. (2017, 2019) observed concentrations of total methylated amines (3–10 nM) that were significantly lower than those measured in the present study. Here, we found regional differences in the composition of the alkylamine mixture. In the proximity to the Western Antarctic Peninsula, dMMA was absent, with dDMA dominating, contributing up to 64 % of the total dissolved amines, followed by dTMA with a 27 % contribution and dDEA with 9 % (Fig. 2a). Conversely, samples collected within the Weddell Sea exhibited a distinct composition, with TMA comprising the highest proportion at 50 %, followed by dDMA at 27 %, dDEA at 16 % and dMMA at 7 %. In this study, dDEA concentrations are similar to the range reported by van Pinxteren et al. (2019) for the sea surface microlayer (SML) and seawater in tropical waters (9 to 23 nM). Overall, alkylamines can be released through various processes, including excretion by primary producers and bacterial activity, protist egestion, sloppy feeding by predators, and viral lysis (Bronk, 2002). This agrees with the fact that phytoplankton and bacteria function as DON producers (Antia et al., 1991; Bronk, 2002; Wheeler et al., 1974; Wheeler and Kirchman, 1986).
Phytoplankton release DON actively through mechanisms such as osmotic adjustments, reduced N excretion in response to changes in light and autolysis. Phytoplanktonic passive release can occur due to physiological stress induced by factors such as ultraviolet radiation, temperature fluctuations and light variations, as well as interactions with microzooplankton grazing and viral infections leading to lysis (Bronk, 2002). Viruses further contribute to DON production by inducing host cell lysis during the final stages of infection, releasing the cellular contents into the environment (Bronk, 2002). Similar processes are expected to occur with methylated amines (Sun et al., 2019). Releasing N-rich dissolved organic matter (DOM) demands considerable energy from healthy phytoplankton cells (Ward and Bronk, 2001). In the Southern Ocean, N is generally not limiting because its use is limited by Fe and light; however, in the Western Antarctic Peninsula, where primary production can likely be supplied with Fe and other micronutrients from land, inorganic N may become depleted in phytoplankton blooms reaching limiting levels, as observed in Dittrich et al. (2022). Under these specific conditions, phytoplankton can also act as DON consumers, and the recycling of phytoplankton-released DON may provide an essential, bioavailable N source for sustaining phytoplankton growth. Notably, it has been reported that phytoplankton like the chlorophyte Platymonas (phototrophic nanoflagellate) incorporate primary amines from natural seawater efficiently, potentially supporting robust growth (North, 1975). Similarly, diatoms have demonstrated the efficient uptake of alkylamines (Wheeler and Hellebust, 1981).
Bacteria are identified as the primary consumers and transformers of organic matter, as evidenced by the relationships between bacterial abundance and DON and DOC concentrations (Fig. S6). Furthermore, methylamine-degrading bacteria play a crucial role in releasing bioavailable N from alkylamines, which supports diatom growth, while diatoms provide organic C to bacteria in a mutualistic exchange (Stein, 2017; Suleiman et al., 2016). Moreover, marine bacteria metabolise methylamines as an N source via different pathways, facilitating direct assimilation of N into biomass (Lidbury et al., 2015b; Sun et al., 2019; Taubert et al., 2017). This recycling of amines may explain their nanomolar concentrations in seawater, suggesting they may serve as valuable organic N sources for both phytoplankton and bacteria. Given their volatile nature, alkylamines are also expected to be lost to the atmosphere. The cycle of methylated amines shares several similarities with the cycles of methylated sulfur compounds, such as DMSP and DMS, in the marine environment. Both methylated amines and sulfur compounds originate from marine phytoplankton and participate in atmospheric processes. Recent studies have shown that TMA monooxygenase, an enzyme in marine bacteria, can oxidise both TMA and dimethylsulfide (Chen et al., 2011; Lidbury et al., 2016). Thus, parallelisms between marine methylated amines and DMS metabolism underscores the importance of studying these molecules in tandem.
4.2 Correlations between alkylamines, chemical and environmental variables, and the microbial community
Using PCA, factor analysis, pairwise correlation analyses and the statistical Mantel test, we found that TMA appears to be predominantly produced intracellularly by nanophytoplankton. Subsequently, it is released into the environment through cellular stress, mortality or even mechanical processes like filtration during sampling. This could explain the observed pairwise opposite correlation between particulate and dissolved TMA. The production of TMA is likely linked to the enzymatic activity of TMAO reductase (Mausz and Chen, 2019), an enzyme which, like dimethyl sulfoxide reductase (Spiese et al., 2009), occurs in marine bacteria but is potentially common in phytoplankton cells too. This enzyme reduces TMAO, a prevalent osmolyte like glycine betaine in phytoplankton (Gibb and Hatton, 2004). Dissolved DMA appears to exhibit a causal relationship with particulate TMA, suggesting a shared phenomenology or a common origin. The statistical associations suggest that dDMA is linked to nanophytoplankton, potentially originating from the degradation of TMA or TMAO by bacteria or phytoplankton themselves. In aerobic conditions, DMA is produced from TMAO via TMAO demethylase (Barrett and Kwan, 1985; Lidbury et al., 2014). Although TMAO demethylase activity has not yet been reported in phytoplankton, its presence in fish tissues (Kimura et al., 2000) and the direct evidence of TMAO occurrence in polar diatoms (Dawson et al., 2020; Fitzsimons et al., 2024) suggest that this enzyme may also occur in eukaryotic microalgae. Although the involvement of a TMAO demethylation or any other enzyme requires genomic confirmation, our findings suggest that phytoplankton could directly release DMA or indirectly through bacteria attached to the outer membrane or residing in the phycosphere. In tropical waters, van Pinxteren et al. (2019) reported a positive correlation between amines and pigments (fucoxanthin and chlorophyll a), suggesting that amine production was fuelled by algal metabolism, most likely diatoms. In our study in polar waters, we found that TMA and dissolved DMA were closely related to nanosized phytoplankton.
Overall, dDEA exhibited an inverse correlation with particulate TMA. Notably, dDEA did not display a strong distributional alignment with any specific microbial variables, although a weak association with active bacteria was observed. Additionally, dDEA showed a moderate positive correlation with the photosynthetic efficiency of phytoplankton cells () and with different phytoplankton groups compared to MAs. As expected, displayed an inverse relationship to nutrient availability. In the Southern Ocean, declines when iron availability limits primary productivity despite the presence of elevated macronutrient concentrations (Wu et al., 2019). Although the precise source of dDEA remains unclear, these findings demonstrate that DEA is widespread in Antarctic waters and follows distinct biological and biogeochemical pathways compared to MAs. We speculate that DEA may be formed by the degradation of an amino acid precursor, potentially proline, considered an important N-bearing osmolyte (Fitzsimons et al., 2024). However, further research is needed to identify its specific origins and the processes governing its distribution. Finally, regarding dMMA, the labile and volatile nature of this compound suggests that bacteria efficiently remineralise dMMA into ammonium (Lidbury et al., 2015b) and that MMA volatilises quickly to the atmosphere, both processes contributing to the rapid depletion of MMA in surface waters. Zhang et al. (2023) demonstrated that elevated salinity enhances the tendency of amines to volatilise from surface seawater by suppressing amine ionisation, thereby increasing exchange fluxes.
Altogether, the multivariate and pairwise correlation analyses make us concur with previous works in that phytoplankton are the primary producers of amines or amine precursors (Fitzsimons et al., 2023; van Pinxteren et al., 2019; Poste et al., 2014). However, we identify nanophytoplankton and Cryptomonas spp. populations, instead of diatoms, as being mainly responsible for TMA and DMA production in Antarctic waters in late summer. Smaller phytoplankton, likely those that are better adapted to thrive under iron-limited conditions (Schoffman et al., 2016), would synthesise and harbour most of the intracellular TMA. Part of it would be released likely through processes such as cell mortality or through physiologically driven DOM excretion. Likewise, DMA was statistically associated with small phytoplankton cells and heterotrophic nanoflagellates (PNFs and HNFs, respectively) as well as DMSP, exhibiting a distribution similar to the sulfur osmolyte. DMA was more closely associated with phytoplankton than with bacteria, which are expected to be responsible for TMA demethylation into DMA. This suggests that DMA is largely produced from phytoplankton TMA or TMAO by the algal cells themselves or closely associated bacteria. Finally, the distribution of DEA suggests distinct biogeochemical pathways compared to methylamines, potentially involving larger phytoplankton and bacterial communities. Notably, the factor most strongly linked to mortality, viruses, did not appear to influence alkylamine pathways. However, incorporating viral lysis as a key phenomenon in Antarctic phytoplankton dynamics is essential for advancing the understanding of microbial interactions and improving the accuracy of organic matter flux estimations in this climate-sensitive region (Biggs et al., 2021).
Our findings indicate that alkylamine distributions are linked to microplankton trophic webs, in particular to certain phytoplankton cell size groups and ecophysiological conditions rather than to total biomass. Our approach does not allow us to quantify how much of the amines are produced directly by phytoplankton or through bacterial reworking of phytoplankton metabolites, yet we provide indications that both processes occur. Dissolved and particulate alkylamines accounted for non-negligible proportions of DON (ca. 1.8 %, with a maximum of 8.7 %) and of PON (ca. 1.5 %, with a maximum of 3.1 %). These proportions are reported here for the first time, providing a novel insight into the quantitative contribution of alkylamines to marine organic N pools.
This study contributes to the necessity of increasing alkylamine determinations to be incorporated into future biogeochemical and climate models, given the pivotal role of alkylamines in both marine and atmospheric systems. In the Southern Ocean, biogenic emissions influence aerosol numbers through primary and secondary pathways, potentially enhancing CCN concentrations and modulating cloud albedo, thereby impacting regional radiative forcing (McCoy et al., 2015). Low-molecular-weight alkylamines contribute to both new particle formation (Brean et al., 2021) and aerosol growth, particularly in air masses passing over melting sea ice (Dall'Osto et al., 2017). Incorporating alkylamines in climate models for this climate-sensitive region requires gaining understanding of their distribution and drivers. The present study represents a step forward towards this aim.
Alkylamines are seawater compounds whose role as precious organic nutrients in N transfer among trophic levels is starting to emerge. Despite their increasingly recognised importance, the distribution, biological sources, formation mechanisms and emission strength of marine amines remain poorly known. This study provides several significant advances in the knowledge of the drivers of marine alkylamine concentrations and speciation. Overall, our results emphasise that alkylamines are embedded within marine microbial food webs, where phytoplankton, bacteria and viruses are interconnected, thereby influencing nutrient cycling, microbial dynamics and the overall health of marine ecosystems. Our study, conducted under varying biogeochemical conditions, reveals that trimethylamine and dimethylamine present in Antarctic surface waters were primarily sourced from nanophytoplankton cells and the associated bacteria and heterotrophic nanoflagellates, as well as diethylamine from hitherto unknown processes. Describing the distribution and behaviour of alkylamines in the surface ocean is pivotal for understanding their roles in marine biogeochemical cycles, atmospheric chemistry and climate.
All data are provided in the Supplement.
The supplement related to this article is available online at https://doi.org/10.5194/bg-22-3429-2025-supplement.
AR, MD'O, RS and EB conceptualised and designed the study. AR and AS collected seawater and amine samples during the PolarChange Expedition. AR, under the supervision of MFF and PA, processed and analysed the amine samples, generating the amine dataset. MFF provided essential resources for the amine analysis. ELS, QG, MV, DV, CW, RS and EB participated in the expedition, collected samples, and conducted biogeochemical and biological analyses. YMC and AR processed and analysed flow cytometry samples at ICM. AR performed the statistical analyses, prepared the figures and drafted the manuscript's first version. AR, MFF, PA, CW, RS and EB contributed to data interpretation and manuscript writing. All authors reviewed, revised and approved the final version of the manuscript.
The contact author has declared that none of the authors has any competing interests.
Publisher's note: Copernicus Publications remains neutral with regard to jurisdictional claims made in the text, published maps, institutional affiliations, or any other geographical representation in this paper. While Copernicus Publications makes every effort to include appropriate place names, the final responsibility lies with the authors.
We would like to thank the crew of the RV Hesperides for the logistic support, making possible the data collection of this study. Special thanks go to Mara Abad and Núria González Fernández for TOC, TN and nutrient analyses at the Chemistry Service of the ICM-CSIC. We thank Jair Antonio Arévalo Lirio and Sofía Ibáñez Homedes for assistance counting flagellates and bacteria.
Arianna Rocchi was supported by the FPI grant (PRE2020-092994) from the Spanish Ministerio de Ciencia e Innovación (MICIN) and European Social Fund (ESF) “Investing in your Future”. The PolarChange project (PID2019-110288RB-I00) also received funding from the Spanish Ministerio de Ciencia e Innovación (MICIN). Further support was provided through an advanced grant from the European Research Council (ERC-2018-AdG #834162). This study is part of the POLARCSIC platform activities and had the institutional support of the “Severo Ochoa Centre of Excellence” accreditation (Grant CEX2024-001494-S funded by AEI 10.13039/501100011033) to the ICM CSIC.
The article processing charges for this open-access publication were covered by the CSIC Open Access Publication Support Initiative through its Unit of Information Resources for Research (URICI).
This paper was edited by Sebastian Naeher and reviewed by two anonymous referees.
Akenga, P. C. and Fitzsimons, M. F.: Automated method for the sensitive analysis of volatile amines in seawater, ACS ES T. Water, 4, 2504–2510, https://doi.org/10.1021/acsestwater.4c00007, 2024.
Álvarez-Salgado, X. A. and Miller, A. E. J.: Simultaneous determination of dissolved organic carbon and total dissolved nitrogen in seawater by high temperature catalytic oxidation: conditions for precise shipboard measurements, Mar. Chem., 62, 325–333, https://doi.org/10.1016/s0304-4203(98)00037-1, 1998.
Antia, N. J., Harrison, P. J., and Oliveira, L.: The role of dissolved organic nitrogen in phytoplankton nutrition, cell biology and ecology, Phycologia, 30, 1–89, https://doi.org/10.2216/i0031-8884-30-1-1.1, 1991.
Auguie, B.: gridExtra: Miscellaneous Functions for “Grid” Graphics, Comprehensive R Archive Network (CRAN), 2017.
Barrett, E. L. and Kwan, H. S.: Bacterial reduction of trimethylamine oxide, Annu. Rev. Microbiol., 39, 131–149, https://doi.org/10.1146/annurev.mi.39.100185.001023, 1985.
Biggs, T. E. G., Huisman, J., and Brussaard, C. P. D.: Viral lysis modifies seasonal phytoplankton dynamics and carbon flow in the Southern Ocean, ISME J., 15, 3615–3622, https://doi.org/10.1038/s41396-021-01033-6, 2021.
Bolar, K.: STAT: Interactive Document for Working with Basic Statistical Analysis, Comprehensive R Archive Network (CRAN), 2019.
Brean, J., Dall'Osto, M., Simó, R., Shi, Z., Beddows, D. C. S., and Harrison, R. M.: Open ocean and coastal new particle formation from sulfuric acid and amines around the Antarctic Peninsula, Nat. Geosci., 14, 383–388, https://doi.org/10.1038/s41561-021-00751-y, 2021.
Bronk, D. A.: Dynamics of DON, in: Biogeochemistry of Marine Dissolved Organic Matter, edited by: Hansell, D. A. and Carlson, C. A., Elsevier, https://doi.org/10.1016/b978-012323841-2/50007-5, 153–247, 2002.
Brussaard, C. P. D.: Optimization of procedures for counting viruses by flow cytometry, Appl. Environ. Microb., 70, 1506–1513, https://doi.org/10.1128/AEM.70.3.1506-1513.2004, 2004.
Brussaard, C. P. D., Thyrhaug, R., Marie, D., and Bratbak, G.: Flow cytometric analyses of viral infection in two marine phytoplankton species, Micromonas pusilla (prasinophyceae) and Phaeocystis pouchetii (prymnesiophyceae), J. Phycol., 35, 941–948, https://doi.org/10.1046/j.1529-8817.1999.3550941.x, 1999.
Brussaard, C. P. D., Mari, X., Van Bleijswijk, J. D. L., and Veldhuis, M. J. W.: A mesocosm study of Phaeocystis globosa (Prymnesiophyceae) population dynamics, Harmful Algae, 4, 875–893, https://doi.org/10.1016/j.hal.2004.12.012, 2005.
Burg, M. B. and Ferraris, J. D.: Intracellular organic osmolytes: function and regulation, J. Biol. Chem., 283, 7309–7313, https://doi.org/10.1074/jbc.R700042200, 2008.
Chen, Y., Patel, N. A., Crombie, A., Scrivens, J. H., and Murrell, J. C.: Bacterial flavin-containing monooxygenase is trimethylamine monooxygenase, P. Natl. Acad. Sci. USA, 108, 17791–17796, https://doi.org/10.1073/pnas.1112928108, 2011.
Chistoserdova, L., Kalyuzhnaya, M. G., and Lidstrom, M. E.: The expanding world of methylotrophic metabolism, Annu. Rev. Microbiol., 63, 477–499, https://doi.org/10.1146/annurev.micro.091208.073600, 2009.
Corral, A. F., Choi, Y., Collister, B. L., Crosbie, E., Dadashazar, H., Digangi, J. P., Diskin, G., Fenn, M. A., Kirschler, S., Moore, R., Nowak, J. B., Shook, M., Stahl, C., Shingler, T. J., Thornhill, K., Voigt, C., Ziemba, L., and Sorooshian, A.: Alkyl amines in cloud water: A case study over the northwest Atlantic ocean, Environ. Sci. Atmos., 2, 1534–1550, https://doi.org/10.1039/d2ea00117a, 2022.
Cree, C. H. L., Airs, R., Archer, S. D., and Fitzsimons, M. F.: Measurement of methylamines in seawater using solid phase microextraction and gas chromatography, Limnol. Oceanogr.-Meth., 16, 411–420, https://doi.org/10.1002/lom3.10255, 2018.
Dall'Osto, M., Ovadnevaite, J., Paglione, M., Beddows, D. C. S., Ceburnis, D., Cree, C., Cortés, P., Zamanillo, M., Nunes, S. O., Pérez, G. L., Ortega-Retuerta, E., Emelianov, M., Vaqué, D., Marrasé, C., Estrada, M., Sala, M. M., Vidal, M., Fitzsimons, M. F., Beale, R., Airs, R., Rinaldi, M., Decesari, S., Cristina Facchini, M., Harrison, R. M., O'Dowd, C., and Simó, R.: Antarctic sea ice region as a source of biogenic organic nitrogen in aerosols, Sci. Rep.-UK, 7, 6047, https://doi.org/10.1038/s41598-017-06188-x, 2017.
Dall'Osto, M., Airs, R. L., Beale, R., Cree, C., Fitzsimons, M. F., Beddows, D., Harrison, R. M., Ceburnis, D., O'Dowd, C., Rinaldi, M., Paglione, M., Nenes, A., Decesari, S., and Simó, R.: Simultaneous Detection of Alkylamines in the Surface Ocean and Atmosphere of the Antarctic Sympagic Environment, ACS Earth Space Chem., 3, 854–862, https://doi.org/10.1021/acsearthspacechem.9b00028, 2019.
Dawson, H. M., Heal, K. R., Torstensson, A., Carlson, L. T., Ingalls, A. E., and Young, J. N.: Large diversity in nitrogen- and sulfur-containing compatible solute profiles in polar and temperate diatoms, Integr. Comp. Biol., 60, 1401–1413, https://doi.org/10.1093/icb/icaa133, 2020.
Dittrich, R., Henley, S. F., Ducklow, H. W., and Meredith, M. P.: Dissolved organic carbon and nitrogen cycling along the west Antarctic Peninsula during summer, Prog. Oceanogr., 206, 102854, https://doi.org/10.1016/j.pocean.2022.102854, 2022.
Edler, L. and Elbrächter, M.: The Utermöhl method for quantitative phytoplankton analysis, in: Microscopic and Molecular Methods for Quantitative Phytoplankton Analysis, edited by: Karlson, B., Cusack, C., and Bresnan, E., IOC Manuals and Guides No. 55, UNESCO Publishing, Paris, 110 pp., https://doi.org/10.25607/OBP-1371, 2010.
Evans, C., Pearce, I., and Brussaard, C. P. D.: Viral-mediated lysis of microbes and carbon release in the sub-Antarctic and Polar Frontal zones of the Australian Southern Ocean, Environ. Microbiol., 11, 2924–2934, https://doi.org/10.1111/j.1462-2920.2009.02050.x, 2009.
Facchini, M. C., Decesari, S., Rinaldi, M., Carbone, C., Finessi, E., Mircea, M., Fuzzi, S., and O'Dowd, C. D.: Important source of marine secondary organic aerosol from biogenic amines, Environ. Sci. Technol., 42, 9116–9121, https://doi.org/10.1021/es8018385, 2008.
Fitzsimons, M. F., Tilley, M., and Cree, C. H. L.: The determination of volatile amines in aquatic marine systems: A review, Anal. Chim. Acta, 1241, 340707, https://doi.org/10.1016/j.aca.2022.340707, 2023.
Fitzsimons, M. F., Airs, R., and Chen, Y.: The occurrence and biogeochemical cycling of quaternary, ternary and volatile amines in marine systems, Front. Mar. Sci., 11, 1466221, https://doi.org/10.3389/fmars.2024.1466221, 2024.
Gasol, J. M. and Del Giorgio, P. A.: Using flow cytometry for counting natural planktonic bacteria and understanding the structure of planktonic bacterial communities, Sci. Mar., 64, 197–224, https://doi.org/10.3989/scimar.2000.64n2197, 2000.
Gibb, S. W. and Hatton, A. D.: The occurrence and distribution of trimethylamine-N-oxide in Antarctic coastal waters, Mar. Chem., 91, 65–75, https://doi.org/10.1016/j.marchem.2004.04.005, 2004.
Gibb, S. W., Mantoura, R. F. C., and Liss, P. S.: Ocean-atmosphere exchange and atmospheric speciation of ammonia and methylamines in the region of the NW Arabian Sea, Global Biogeochem. Cy., 13, 161–178, https://doi.org/10.1029/98gb00743, 1999.
Goldwhite, H.: Nitrogen derivatives of the aliphatic hydrocarbons, in: Rodd's Chemistry of Carbon Compounds, edited by: Coffey, S., Elsevier, https://doi.org/10.1016/b978-044453345-6.50475-2, 93–164, 1964.
Gorbunov, M. Y. and Falkowski, P. G.: Using chlorophyll fluorescence to determine the fate of photons absorbed by phytoplankton in the world's oceans, Annu. Rev. Mar. Sci., 14, 213–238, https://doi.org/10.1146/annurev-marine-032621-122346, 2022.
Gorbunov, M. Y., Shirsin, E., Nikonova, E., Fadeev, V. V., and Falkowski, P. G.: A multi-spectral fluorescence induction and relaxation (FIRe) technique for physiological and taxonomic analysis of phytoplankton communities, Mar. Ecol. Prog. Ser., 644, 1–13, https://doi.org/10.3354/meps13358, 2020.
Grasshoff, K., Ehrhardt, M., and Kremling, K.: Methods of Seawater Analysis, 3rd revised and extended edition, Wiley & Sons, ISBN 3-527-25998-8, 1983.
Jakobsen, H. H. and Markager, S.: Carbon-to-chlorophyll ratio for phytoplankton in temperate coastal waters: Seasonal patterns and relationship to nutrients, Limnol. Oceanogr., 61, 1853–1868, https://doi.org/10.1002/lno.10338, 2016.
Jolliffe, I. T.: Principal component analysis for special types of data, in: Principal Component Analysis, Springer, New York, NY, https://doi.org/10.1007/0-387-22440-8_13, 338–372, 2002.
Kassambara, A.: ggcorrplot: Visualization of a Correlation Matrix Using “ggplot2”, Comprehensive R Archive Network (CRAN), 2021.
Kassambara, A. and Mundt, F.: factoextra: Extract and Visualize the Results of Multivariate Data Analyses, Comprehensive R Archive Network (CRAN), 2020.
Kimura, M., Seki, N., and Kimura, I.: Occurrence and some properties of trimethylamine-N-oxide demethylase in myofibrillar fraction from walleye pollack muscle, Fisheries Sci., 66, 725–729, https://doi.org/10.1046/j.1444-2906.2000.00118.x, 2000.
Kinsey, J. D. and Kieber, D. J.: Microwave preservation method for DMSP, DMSO, and acrylate in unfiltered seawater and phytoplankton culture samples: Microwave Sample Preservation Method, Limnol. Oceanogr.-Meth., 14, 196–209, https://doi.org/10.1002/lom3.10081, 2016.
Koester, I., Quinlan, Z. A., Nothias, L.-F., White, M. E., Rabines, A., Petras, D., Brunson, J. K., Dührkop, K., Ludwig, M., Böcker, S., Azam, F., Allen, A. E., Dorrestein, P. C., and Aluwihare, L. I.: Illuminating the dark metabolome of Pseudo-nitzschia-microbiome associations, Environ. Microbiol., 24, 5408–5424, https://doi.org/10.1111/1462-2920.16242, 2022.
Landa, M., Burns, A. S., Roth, S. J., and Moran, M. A.: Bacterial transcriptome remodeling during sequential co-culture with a marine dinoflagellate and diatom, ISME J., 11, 2677–2690, https://doi.org/10.1038/ismej.2017.117, 2017.
Lidbury, I., Murrell, J. C., and Chen, Y.: Trimethylamine N-oxide metabolism by abundant marine heterotrophic bacteria, P. Natl. Acad. Sci. USA, 111, 2710–2715, https://doi.org/10.1073/pnas.1317834111, 2014.
Lidbury, I., Kimberley, G., Scanlan, D. J., Murrell, J. C., and Chen, Y.: Comparative genomics and mutagenesis analyses of choline metabolism in the marine Roseobacter clade, Environ. Microbiol., 17, 5048–5062, https://doi.org/10.1111/1462-2920.12943, 2015a.
Lidbury, I., Kröber, E., Zhang, Z., Zhu, Y., Murrell, J. C., Chen, Y., and Schäfer, H.: A mechanism for bacterial transformation of dimethylsulfide to dimethylsulfoxide: a missing link in the marine organic sulfur cycle, Environ. Microbiol., 18, 2754–2766, https://doi.org/10.1111/1462-2920.13354, 2016.
Lidbury, I. D. E. A., Murrell, J. C., and Chen, Y.: Trimethylamine and trimethylamine N-oxide are supplementary energy sources for a marine heterotrophic bacterium: implications for marine carbon and nitrogen cycling, ISME J., 9, 760–769, https://doi.org/10.1038/ismej.2014.149, 2015b.
Liu, C., Li, H., Zheng, H., Wang, G., Qin, X., Chen, J., Zhou, S., Lu, D., Liang, G., Song, X., Duan, Y., Liu, J., Huang, K., and Deng, C.: Ocean emission pathway and secondary formation mechanism of aminiums over the Chinese marginal sea, J. Geophys. Res., 127, e2022JD037805, https://doi.org/10.1029/2022jd037805, 2022.
Marie, D., Rigaut-Jalabert, F., and Vaulot, D.: An improved protocol for flow cytometry analysis of phytoplankton cultures and natural samples: AnImproved Protocol for Flow Cytometry Analysis, Cytom. Part A, 85, 962–968, https://doi.org/10.1002/cyto.a.22517, 2014.
Masdeu-Navarro, M., Mangot, J.-F., Xue, L., Cabrera-Brufau, M., Gardner, S. G., Kieber, D. J., González, J. M., and Simó, R.: Spatial and diel patterns of volatile organic compounds, DMSP-derived compounds, and planktonic microorganisms around a tropical scleractinian coral colony, Front. Mar. Sci., 9, 944141, https://doi.org/10.3389/fmars.2022.944141, 2022.
Mausz, M. A. and Chen, Y.: Microbiology and ecology of methylated Amine metabolism in marine ecosystems, Curr. Issues Mol. Biol., 33, 133–148, https://doi.org/10.21775/cimb.033.133, 2019.
McCoy, D. T., Burrows, S. M., Wood, R., Grosvenor, D. P., Elliott, S. M., Ma, P.-L., Rasch, P. J., and Hartmann, D. L.: Natural aerosols explain seasonal and spatial patterns of Southern Ocean cloud albedo, Sci. Adv., 1, e1500157, https://doi.org/10.1126/sciadv.1500157, 2015.
Menden-Deuer, S. and Lessard, E. J.: Carbon to volume relationships for dinoflagellates, diatoms, and other protist plankton, Limnol. Oceanogr., 45, 569–579, https://doi.org/10.4319/lo.2000.45.3.0569, 2000.
Ning, A., Liu, L., Zhang, S., Yu, F., Du, L., Ge, M., and Zhang, X.: The critical role of dimethylamine in the rapid formation of iodic acid particles in marine areas, Npj Clim. Atmos. Sci., 5, 92, https://doi.org/10.1038/s41612-022-00316-9, 2022.
Norland, S.: The relationship between biomass and volume of bacteria, in: Handbook of Methods in Aquatic Microbial Ecology, edited by: Kemp, P. F., Cole, J. J., Sherr, B. F., and Sherr, E. B., Lewis Publishers (CRC Press), Boca Raton, FL, 1993, 303–309, ISBN 0-87371-564-0, 1993.
North, B. B.: Primary amines in California coastal waters: Utilization by phytoplankton, Limnol. Oceanogr., 20, 20–27, 1975.
Oksanen, J.: vegan: Community Ecology Package, Comprehensive R Archive Network (CRAN), 2022.
Palenik, B. and Morel, F. M.: Amine oxidases of marine phytoplankton, Appl. Environ. Microb., 57, 2440–2443, https://doi.org/10.1128/aem.57.8.2440-2443.1991, 1991.
Poste, A. E., Grung, M., and Wright, R. F.: Amines and amine-related compounds in surface waters: a review of sources, concentrations and aquatic toxicity, Sci. Total Environ., 481, 274–279, https://doi.org/10.1016/j.scitotenv.2014.02.066, 2014.
R Core Team: R: A language and environment for statistical computing, R Foundation for Statistical Computing, Vienna, Austria, https://www.R-project.org/, last access: 11 July 2025.
Revelle, W.: psych: Procedures for Psychological, Psychometric, and Personality Research, Comprehensive R Archive Network (CRAN), 2023.
Rinaldi, M., Paglione, M., Decesari, S., Harrison, R. M., Beddows, D. C. S., Ovadnevaite, J., Ceburnis, D., O'Dowd, C. D., Simó, R., and Dall'Osto, M.: Contribution of Water-Soluble Organic Matter from Multiple Marine Geographic Eco-Regions to Aerosols around Antarctica, Environ. Sci. Technol., 54, 7807–7817, https://doi.org/10.1021/acs.est.0c00695, 2020.
Rocchi, A., Sotomayor-Garcia, A., Cabrera-Brufau, M., Berdalet, E., Dall'Osto, M., and Vaqué, D.: Abundance and activity of sympagic viruses near the Western Antarctic Peninsula, Polar Biol., 45, 1363–1378, https://doi.org/10.1007/s00300-022-03073-w, 2022.
RStudio Team: RStudio: Integrated Development Environment for R, RStudio, PBC, Boston, MA, https://posit.co/download/rstudio-desktop/, last access: 11 July 2025.
Schoffman, H., Lis, H., Shaked, Y., and Keren, N.: Iron-nutrient interactions within phytoplankton, Front. Plant Sci., 7, 1223, https://doi.org/10.3389/fpls.2016.01223, 2016.
Sieracki, M. E., Johnson, P. W., and Sieburth, J. M.: Detection, enumeration, and sizing of planktonic bacteria by image-analyzed epifluorescence microscopy, Appl. Environ. Microb., 49, 799–810, https://doi.org/10.1128/aem.49.4.799-810.1985, 1985.
Spiese, C. E., Kieber, D. J., Nomura, C. T., and Kiene, R. P.: Reduction of dimethylsulfoxide to dimethylsulfide by marine phytoplankton, Limnol. Oceanogr., 54, 560–570, https://doi.org/10.4319/lo.2009.54.2.0560, 2009.
Stefels, J.: Physiological aspects of the production and conversion of DMSP in marine algae and higher plants, J. Sea Res., 43, 183–197, https://doi.org/10.1016/s1385-1101(00)00030-7, 2000.
Stefels, J., Steinke, M., Turner, S., Malin, G., and Belviso, S.: Environmental constraints on the production and removal of the climatically active gas dimethylsulphide (DMS) and implications for ecosystem modelling, Biogeochemistry, 83, 245–275, https://doi.org/10.1007/s10533-007-9091-5, 2007.
Stein, L. Y.: Methylamine: a vital nitrogen (and carbon) source for marine microbes, Environ. Microbiol., 19, 2117–2118, https://doi.org/10.1111/1462-2920.13716, 2017.
Suleiman, M., Zecher, K., Yücel, O., Jagmann, N., and Philipp, B.: Interkingdom cross-feeding of ammonium from marine methylamine-degrading bacteria to the diatom Phaeodactylum tricornutum, Appl. Environ. Microb., 82, 7113–7122, https://doi.org/10.1128/aem.01642-16, 2016.
Sun, J., Mausz, M. A., Chen, Y., and Giovannoni, S. J.: Microbial trimethylamine metabolism in marine environments, Environ. Microbiol., 21, 513–520, https://doi.org/10.1111/1462-2920.14461, 2019.
Suttle, C. A.: Viruses in the sea, Nature, 437, 356–361, https://doi.org/10.1038/nature04160, 2005.
Taubert, M., Grob, C., Howat, A. M., Burns, O. J., Pratscher, J., Jehmlich, N., von Bergen, M., Richnow, H. H., Chen, Y., and Murrell, J. C.: Methylamine as a nitrogen source for microorganisms from a coastal marine environment, Environ. Microbiol., 19, 2246–2257, https://doi.org/10.1111/1462-2920.13709, 2017.
van Pinxteren, M., Müller, C., Iinuma, Y., Stolle, C., and Herrmann, H.: Chemical characterization of dissolved organic compounds from coastal sea surface microlayers (Baltic Sea, Germany), Environ. Sci. Technol., 46, 10455–10462, https://doi.org/10.1021/es204492b, 2012.
van Pinxteren, M., Fomba, K. W., van Pinxteren, D., Triesch, N., Hoffmann, E. H., Cree, C. H. L., Fitzsimons, M. F., von Tümpling, W., and Herrmann, H.: Aliphatic amines at the Cape Verde Atmospheric Observatory: Abundance, origins and sea-air fluxes, Atmos. Environ. (1994), 203, 183–195, https://doi.org/10.1016/j.atmosenv.2019.02.011, 2019.
Vaqué, D., Agustí, S., and Duarte, C. M.: Response of bacterial grazing rates to experimental manipulation of an Antarctic coastal nanoflagellate community, Aquat. Microb. Ecol., 36, 41–52, https://doi.org/10.3354/ame036041, 2004.
Vaulot, D., Courties, C., and Partensky, F.: A simple method to preserve oceanic phytoplankton for flow cytometric analyses, Cytometry, 10, 629–635, https://doi.org/10.1002/cyto.990100519, 1989.
Ward, B. B. and Bronk, D. A.: Net nitrogen uptake and DON release in surface waters: importance of trophic interactions implied from size fractionation experiments, Mar. Ecol. Prog. Ser., 219, 11–24, https://doi.org/10.3354/meps219011, 2001.
Wheeler, P. A. and Hellebust, J. A.: Uptake and concentration of alkylamines by a marine diatom: effects of H+ and K+ and implications for the transport and accumulation of weak bases, Plant Physiol., 67, 367–372, 1981.
Wheeler, P. A. and Kirchman, D. L.: Utilization of inorganic and organic nitrogen by bacteria in marine systems 1, Limnol. Oceanogr., 31, 998–1009, 1986.
Wheeler, P. A., North, B. B., and Stephens, G. C.: Amino acid uptake by marine phytoplankters 1, 2, Limnol. Oceanogr., 19, 249–259, 1974.
Wickham, H.: ggplot2: Create Elegant Data Visualisations Using Grammar of Graphics, Comprehensive R Archive Network (CRAN), 2023.
Wohl, C., Capelle, D., Jones, A., Sturges, W. T., Nightingale, P. D., Else, B. G. T., and Yang, M.: Segmented flow coil equilibrator coupled to a proton-transfer-reaction mass spectrometer for measurements of a broad range of volatile organic compounds in seawater, Ocean Sci., 15, 925–940, https://doi.org/10.5194/os-15-925-2019, 2019.
Wohl, C., Villamayor, J., Galí, M., Mahajan, A. S., Fernández, R. P., Cuevas, C. A., Bossolasco, A., Li, Q., Kettle, A. J., Williams, T., Sarda-Esteve, R., Gros, V., Simó, R., and Saiz-Lopez, A.: Marine emissions of methanethiol increase aerosol cooling in the Southern Ocean, Sci. Adv., 10, eadq2465, https://doi.org/10.1126/sciadv.adq2465, 2024.
Wu, M., McCain, J. S. P., Rowland, E., Middag, R., Sandgren, M., Allen, A. E., and Bertrand, E. M.: Manganese and iron deficiency in Southern Ocean Phaeocystis antarctica populations revealed through taxon-specific protein indicators, Nat. Commun., 10, 3582, https://doi.org/10.1038/s41467-019-11426-z, 2019.
Yentsch, C. S. and Menzel, D. W.: A method for the determination of phytoplankton chlorophyll and phaeophytin by fluorescence, Deep Sea Res. Oceanogr. Abstr., 10, 221–231, https://doi.org/10.1016/0011-7471(63)90358-9, 1963.
Zhang, Q., Jia, S., Chen, W., Mao, J., Yang, L., Krishnan, P., Sarkar, S., Shao, M., and Wang, X.: Contribution of marine biological emissions to gaseous methylamines in the atmosphere: An emission inventory based on multi-source data sets, Sci. Total Environ., 898, 165285, https://doi.org/10.1016/j.scitotenv.2023.165285, 2023.
Zu, H., Chu, B., Lu, Y., Liu, L., and Zhang, X.: Rapid iodine oxoacid nucleation enhanced by dimethylamine in broad marine regions, Atmos. Chem. Phys., 24, 5823–5835, https://doi.org/10.5194/acp-24-5823-2024, 2024.