the Creative Commons Attribution 4.0 License.
the Creative Commons Attribution 4.0 License.
 | 16 Jul 2025
Quantifying the soil sink of atmospheric hydrogen: a full year of field measurements from grassland and forest soils in the UK
Nicholas Cowan
Toby Roberts
Mark Hanlon
Aurelia Bezanger
Galina Toteva
Alex Tweedie
Karen Yeung
Ajinkya Deshpande
Peter Levy
Ute Skiba
Eiko Nemitz
Julia Drewer
Emissions of hydrogen (H2) gas from human activities are associated with indirect climate warming effects. As the hydrogen economy expands globally (e.g. the use of H2 gas as a fuel), the anthropogenic release of H2 into the atmosphere is expected to rise rapidly as a result of increased leakage. The dominant H2 removal process is uptake into soils; however, removal mechanisms are poorly understood, and the fate and impact of increased H2 emissions remain highly uncertain. Fluxes of H2 within soils are rarely measured, and data to inform global models are based on few studies. This study presents soil H2 fluxes from two field sites in central Scotland, a managed grassland and a planted deciduous woodland, with flux measurements of H2 covering full seasonal cycles. A bespoke flux chamber measurement protocol was developed to deal with the fast decline in headspace concentrations associated with rapid H2 uptake, in which exponential regression models could be fitted to concentration data over a 7 min enclosure time. We estimate annual H2 uptake of and kg H2 ha−1 yr−1 and mean deposition velocities of 0.012±0.002 and 0.088±0.005 cm s−1 for the grassland and woodland sites, respectively. Soil moisture was found to be the primary driver of H2 uptake at the grassland site, where the high silt/clay content of the soil resulted in anaerobic conditions (near zero H2 flux) during wet periods of the year. Uptake of H2 at the forest site was highly variable and did not correlate well with any localised soil properties (soil moisture, temperature, total carbon and nitrogen content). It is likely that the high silt/clay content of the grassland site (55 % silt, 20 % clay) decreased aeration when soils were wet, resulting in poor aeration and low H2 uptake. The well-drained forest site (60 % sand) was not as restricted by exchange of H2 between the atmosphere and the soil, showing instead a large variability in H2 flux that is more likely to be related to heterogeneous factors in the soil that control microbial activity (e.g. labile carbon and microbial densities). The results of this study highlight that there is still much that we do not understand regarding the drivers of H2 uptake in soils and that further field measurements are required to improve global models.
- Article
(2243 KB) - Full-text XML
-
Supplement
(935 KB) - BibTeX
- EndNote


Prior to the industrial revolution in the 18th century, the atmospheric concentration of Hydrogen gas (H2) was relatively stable at approximately 330 ppb (Patterson et al., 2021). Human activity over the past two centuries has resulted in increasing atmospheric H2 concentrations (546 ppb in 2021, Pétron et al., 2024), partly as a result of increasing industrial leaks (Hitchcock et al., 2019; Cooper et al., 2022), partly due to increases in emissions and concentrations of precursor gases such as methane (CH4) and volatile organic compounds (VOCs), and partly due to increasing concentrations of other gases in the atmosphere which extend the natural lifetime of H2 (Patterson et al., 2021). In the atmosphere, H2 competes for hydroxyl (OH) radicals with gases such as methane (CH4) and carbon monoxide (CO); thus an increase in concentrations of these gases due to human activities has resulted in increasing competition for OH and extended the lifetimes for each species (Khalil and Rasmussen, 1990; Bertagni et al., 2022). Concentrations of atmospheric H2 gas are indirectly associated with climate warming effects as a result of extending the atmospheric lifetime of the powerful greenhouse gas CH4 as well as increasing tropospheric ozone and stratospheric water vapour, which also have a warming potential (Warwick et al., 2004; Ocko and Hamburg, 2022). The associated indirect global warming potential (GWP) had been estimated to be in the range of 3.3 to 5 over a 100-year time horizon (Derwent et al., 2020, Field and Derwent, 2021), though recent estimates have been made of up to 11.6±2.8 times that of an equivalent mass of carbon dioxide (Sand et al., 2023). The effective GWP and the atmospheric accumulation of H2 are highly sensitive to its atmospheric lifetime, which is estimated to be approximately 2 years (Novelli et al., 1999).
The dominant process for H2 removal from the atmosphere is uptake by soils, which is estimated to be 3 times larger than the sink due to atmospheric reaction with OH (Warwick et al., 2004; Derwent et al., 2020; Field and Derwent, 2021; Paulot et al., 2021; Ocko and Hamburg, 2022). Whilst both removal mechanisms are highly uncertain (especially the soil sink), the fate and impact of increased H2 emissions depend largely on the soil sink strength (Ehhalt and Rohrer, 2009). The microbial uptake of H2 can occur under both aerobic and anaerobic conditions, but the global atmospheric H2 sink is dominated by processes that occur in aerobic soils at the atmosphere–biosphere interface (soil surface), where atmospheric H2 availability is not as limited (Piché-Choquette and Constant, 2019). A large spectrum of bacteria and archaea can utilise H2 as an energy source, via the hydrogenase enzyme. Whilst some investigations have highlighted the importance of high-affinity H2-oxidising bacteria (Saavedra-Lavoie et al., 2020), most studies suggest that this enzyme is widespread across many bacterial and archaeal phyla and that H2 consumption is the norm rather than the exception (Islam et al., 2020; Greening and Grinter, 2022). Studies investigating specific H2 uptake rates for different soil types and conditions have been carried out but are sparse and limited to a small number of geographies (primarily North America, Europe and Japan, e.g. Yonemura et al., 1999, 2000; Smith-Downey et al., 2008; Lallo et al., 2009; Hammer and Levin, 2009; Khdhiri et al., 2015). In addition to microbial activity, diffusion into the soil is a further important rate limiting step (Bertagni et al., 2022). Gases penetrate the soil by passive diffusion, and diffusion rates are mainly influenced by porosity, which is affected by soil structure, texture, organic matter contents, vegetation types (roots) and moisture content. Thus, for the same microbial activity, porous soils can be expected to be much larger H2 sinks than compacted and/or waterlogged soils due to increased gas exchange rates with the atmosphere. At the larger scale, diffusion rates will depend on the changing climate: a wetter climate may lower the H2 diffusion rates (Paulot et al., 2021). Temperature is another important factor as it determines the rate of microbial enzyme reactions, and in addition a carbon source is also required for heterotrophic microbial activity (Islam et al., 2020; Meredith et al., 2016; Baril et al., 2022). The biological sink of atmospheric H2 has been suggested to be more sensitive to spatial variations of drivers (specifically microbial diversity) compared to the fluxes of other gases with high variability such as nitrous oxide (N2O) (e.g. Baril et al., 2022); however, studies reporting the spatial variability of H2 fluxes in soils are limited.
Historically, the processes that control H2 uptake in soils have been severely understudied due to the logistical difficulties and technical constraints on measuring H2 fluxes. This study presents measurements of H2 fluxes between the soil and the atmosphere at two field sites in central Scotland, a managed grassland and a planted deciduous woodland. These are the first reported flux measurements of H2 covering a full annual cycle in the UK. It has previously been reported that forest ecosystems exhibit higher H2 uptake rates than agroecosystems (Ehhalt and Rohrer, 2009); however, the generality of this and the exact mechanisms are still unclear. This study aims to investigate the response of microbial H2 uptake at a grassland and a forest site to environmental drivers and to identify differences between the sites. We also describe a dedicated flux chamber methodology, which has been developed to best address the challenges of measuring H2 flux using gas chromatography (GC) analysers.
2.1 Field sites
Measurements of trace gas fluxes and environmental variables were made at two field sites within the Midlothian region in central Scotland (UK, approximately 10 km south of Edinburgh; Table 1). The first of these was the long-term environmental monitoring site at Easter Bush Farm (grassland). The grassland site (55.8653° N, 3.206° W) is an intensively managed, improved grassland (South field in Cowan et al., 2020 and Drewer et al., 2016) that since 2001 has been used predominantly to graze sheep, with a species composition of >99 % perennial ryegrass (Lolium perenne). The soil type is an imperfectly drained Eutric Cambisol with silt loam soil. The field management is typical for this region, with predominately ammonium nitrate (AN) fertilisation via tractor-mounted broadcast spreading, with liming every 3–5 years to maintain the pH between 5.5 and 6.0 and occasional ploughing and reseeding. The sheep were absent from the fields in the winter months (November to February), with sporadic movement between local fields throughout the growing season (March to September) as management required. During the period of 1 October 2023 to 1 October 2024, the cumulative rainfall at the grassland site was 1133 mm, and the mean temperature was 8.6 °C, which is fairly typical of the site (Table 1).
Table 1Field site environmental properties as reported in previous studies and ongoing research. Mean annual values taken from 10+ years of site data. Rainfall represents throughfall (e.g. rain that reaches the soil).
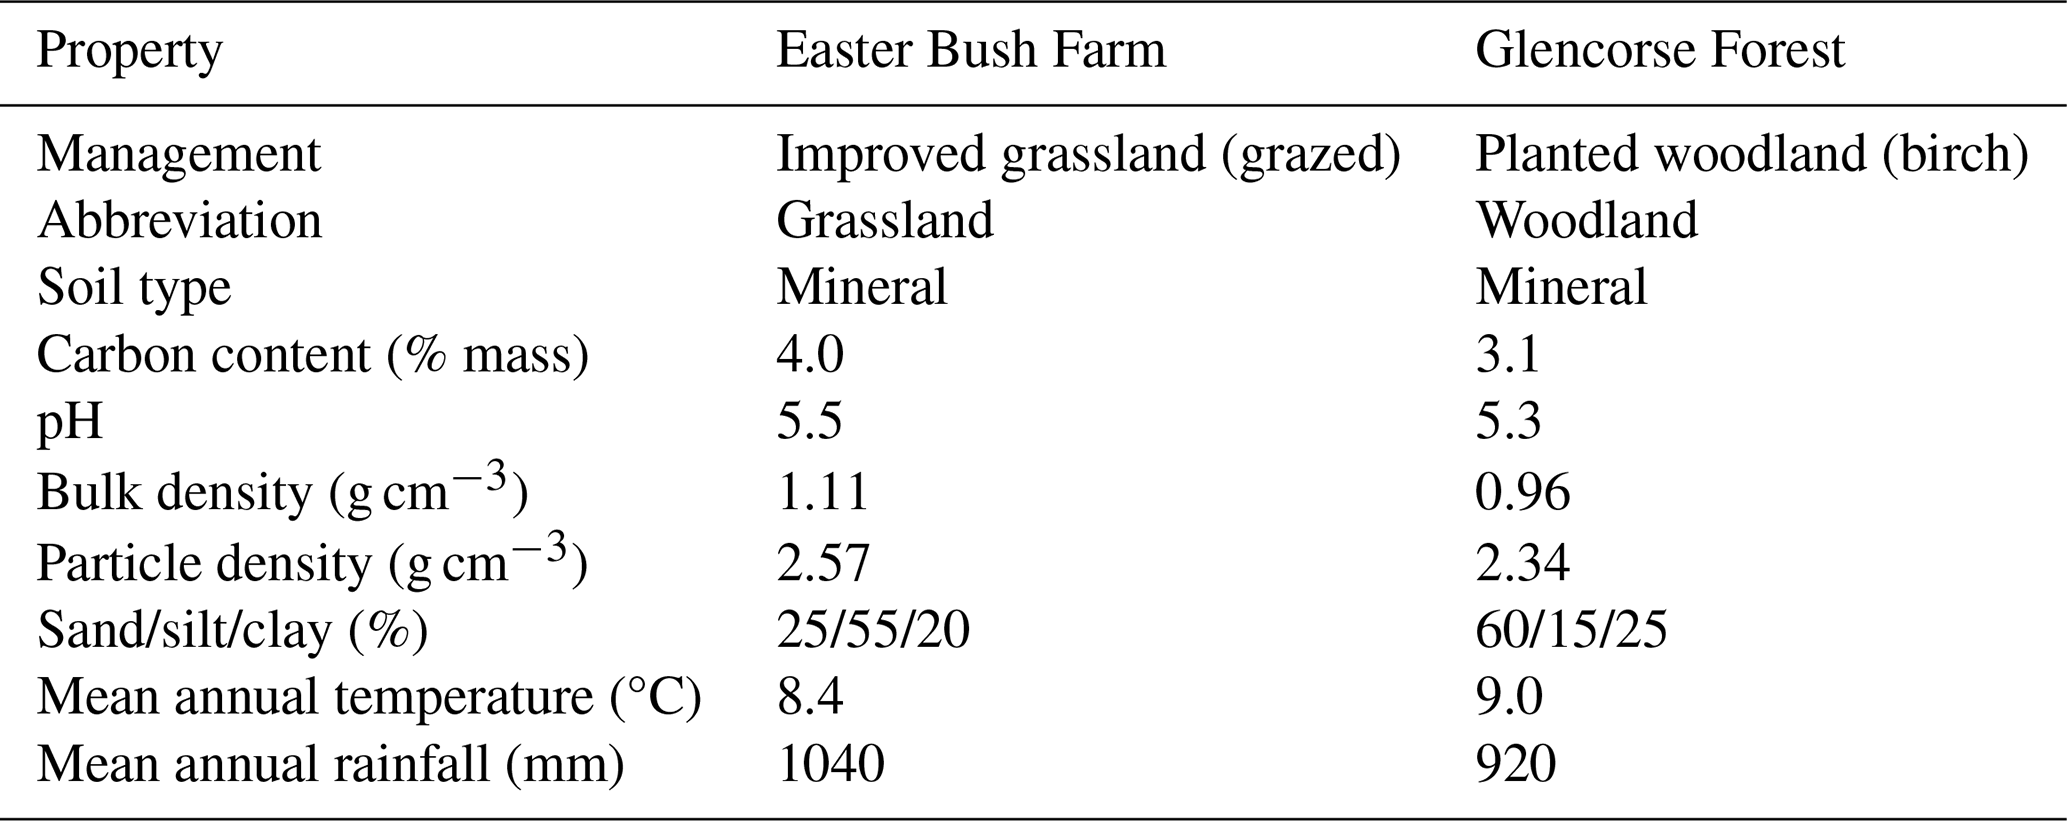
The second field site was a temporary experimental area setup in Glencorse Forest (woodland). Glencorse Forest (55.8540° N, 3.215° W) was converted to a planted deciduous forest from a pasture approximately 40 years prior to measurements (Billington and Pelham, 1991). The study plot is situated in a plantation of silver birch (Betula pendula) and downy birch (Betula pubescens), with a ground flora consisting mostly of grasses. The soil is classified as a sandy loam which lies under a thin layer (5–10 mm) of organic debris. The field site had been subject to enhanced nitrogen deposition with ammonia for approximately 2 years before H2 flux measurements were carried out (Deshpande et al., 2024). During the period of 1 October 2023 to 1 October 2024, the cumulative rainfall at the woodland site was 1047 mm, and the mean temperature was 9.6 °C, which was slightly wetter and warmer than historical mean data (Table 1).
2.2 Meteorological and soil measurements
Continuous environmental measurements were made at both field sites. Air temperature, soil temperature and soil volumetric water content (VWC) at three depths (5, 10 and 20 cm at the grassland site; 5, 10 and 15 cm at the woodland site) and relative humidity (RH) and rainfall were measured at both sites throughout the flux measurement campaign (Table S1 in the Supplement). For each flux chamber measurement, soil temperature and soil VWC were also measured next to the chamber (<0.5 m distance) at the time of the flux measurement. Soil temperature was measured at 10 cm depth using a handheld probe (ETI Ltd., Worthing, UK), and soil VWC was measured at 12 cm depth using an HS2 HydroSense II handheld soil moisture sensor (Campbell Scientific, Utah, USA), with four replicates for each chamber. Soil samples were collected for total carbon (C) and total nitrogen (N) analysis from the top 10 cm of soil at the woodland site in March 2021, September 2021, May 2022, August 2022, November 2022 and March 2023. Subsamples were dried at 105 °C until constant weight, milled using a ball mill (MM200 ball mill, Retsch, Haan, Germany) and analysed using an elemental analyser (Flash SMART, Thermo Fisher Scientific, MA, USA).
2.3 Flux measurements
Fluxes of hydrogen (H2), methane (CH4) and nitrous oxide (N2O) were measured using the static chamber method (e.g. Drewer et al., 2016). Chambers (diameter = 40 cm, height = 30 cm) consisting of opaque polypropylene open-ended cylinders were installed at each field site: 20 at Easter Bush (grassland) and 20 at Glencorse (woodland). The chambers were inserted into the ground to a depth of approximately 10 cm for the entire study period (chamber air volume of approximately 0.025 m3). The depth to the surface in each chamber was measured at 5 points on the sides of the chamber base using a ruler, from which the average was used to calculate the volume of air within. During measurement periods, aluminium lids were fastened onto the bases using four strong clips; a strip of draft excluder glued onto the lid provided a gas tight seal between chamber and lid. A three-way tap was used for gas sample removal using a 100 mL syringe. 20 mL glass vials were filled with a double-needle system to flush the vials with 5 times their volume. Storage tests using gas standards revealed that gases stored in the vials were stable for up to 24 h, after which H2 leakage could be observed in the data. Hence all analyses of H2 gas samples from the chambers were carried out within 24 h of measurement in the field (typically within 6 h). Measurements of H2 and GHGs were made approximately monthly.
Two separate measurement protocols were employed to measure greenhouse gases (GHGs) and H2 fluxes, due to the differences in how the gases behaved within the chamber over a given time span. For GHG measurements, the standard practice of extracting four gas samples (100 mL) at regular intervals over 1 h (0, 20, 40, 60 min) was used (Drewer et al., 2017). However, due to the rapid uptake of H2 observed in trial measurements (H2 in the chamber headspace could reach zero ppb in under 10 min), the time evolution of H2 in the chamber was non-linear, and therefore a separate measurement protocol was developed for H2 fluxes. Fluxes of H2 were measured during entirely separate enclosure periods to the GHGs (albeit on the same day) using an enclosure period, with six samples taken over 7 min (0, 1, 2, 3, 5 and 7 min). Chambers used to measure H2 were fitted with a small 5 cm diameter PC fan, which ran from a 9 V battery during chamber enclosure times to ensure rapid air mixing over the shorter measurement period.
Concentrations of H2 were measured using an Agilent 8890 gas chromatograph fitted with a pulsed discharge helium ionisation detector (GC-PDHID) equipped with a 7697A headspace autosampler, with capacity for 108 vials (Agilent, Santa Clara, California, USA). Concentrations of CH4 and N2O were measured using a gas chromatograph (Agilent 7890B with headspace autosampler 7697A with capacity for 108 vials; Agilent, Santa Clara, California, USA) with a micro-electron capture detector (µECD) for N2O analysis and flame ionisation detector (FID) for CH4 analysis run in parallel. Each analytical run of H2 and GHG samples included at least three sets of four certified standard concentrations for calibration purposes (certified to ±5 %). The instrumental noise (σ) of the instruments was 40, 5 and 15 ppb for CH4, N2O and H2, respectively. Based on the methods used, the analytical uncertainty in flux estimates was 0.55, 0.07 and 1.0 nmol m−2 s−1 for CH4, N2O and H2, respectively, based on the method of Cowan et al. (2025).
Fluxes were calculated using linear and non-linear regression methods using the HMR package for the statistical software R (Pedersen et al., 2010). By convention, positive fluxes represent emission from the soil, and negative fluxes indicate that the soil acts as a sink (i.e. uptake). Fluxes of GHGs were all calculated using linear regression, where is calculated using the standard line of best fit through the concentration data. As concentrations of H2 fall exponentially during chamber measurements when soil uptake of H2 is high, linear regression is not always appropriate. To account for this, fluxes of H2 were calculated using both linear regression and the HMR model, depending on the magnitude of the rate of change observed in each chamber measurement. The HMR model is a commonly used non-linear model derived by Hutchinson and Mosier (1981) with a negative exponential form of curvature which calculates the rate of change of a gas concentration at t=0. The concentration C at time t is given by Eq. (1), where C0 is the initial concentration, Ceq is the value at equilibrium and k is a constant. is the initial rate of change in concentration at t=0 in nmol mol−1 s−1, calculated using Eq. (2).
The at t=0 is used to calculate the flux using Eq. (3), where F is gas flux from the soil (nmol m−2 s−1), ρ is the density of air in mol m−3, V is the volume of the chamber in m3 and A is the ground area enclosed by the chamber in m2.
Where soil flux is near the analytical uncertainty of the method (e.g. concentration change within the chamber is difficult to detect with our instrument), a clear exponential decline was hard to discern from the measurement noise and could give rise to spurious fits to Eq. (1). (Examples 1 and 2 in Fig. 1 and Table 2). The criteria for using the HMR model for each individual flux calculation were based on the following: (i) k is not unrealistically large in Eq. (2) (as defined and limited by the HMR package in R), (ii) the flux estimated by linear regression is larger than the analytical uncertainty of the method (1.0 nmol m−2 s−1 for H2) and (iii) the 95 % confidence interval (95 % C.I.) of the HMR model fit is less than 5 times the magnitude of the flux estimated using linear regression (removes poor-fitting outliers). In Fig. 1 and Table 3, six examples are given in which three selections of linear regression fitting and three selections of the HMR model fitting are used to determine flux. For large uptake fluxes (Examples 4, 5 and 6) the HMR model provides a more suitable fit to the non-linearity in , which linear regression does not accurately represent. Deposition velocity of H2 was calculated by dividing the calculated flux by the ambient concentration at the site (mean of t=0 measurements on day of measurement in mol m−3).
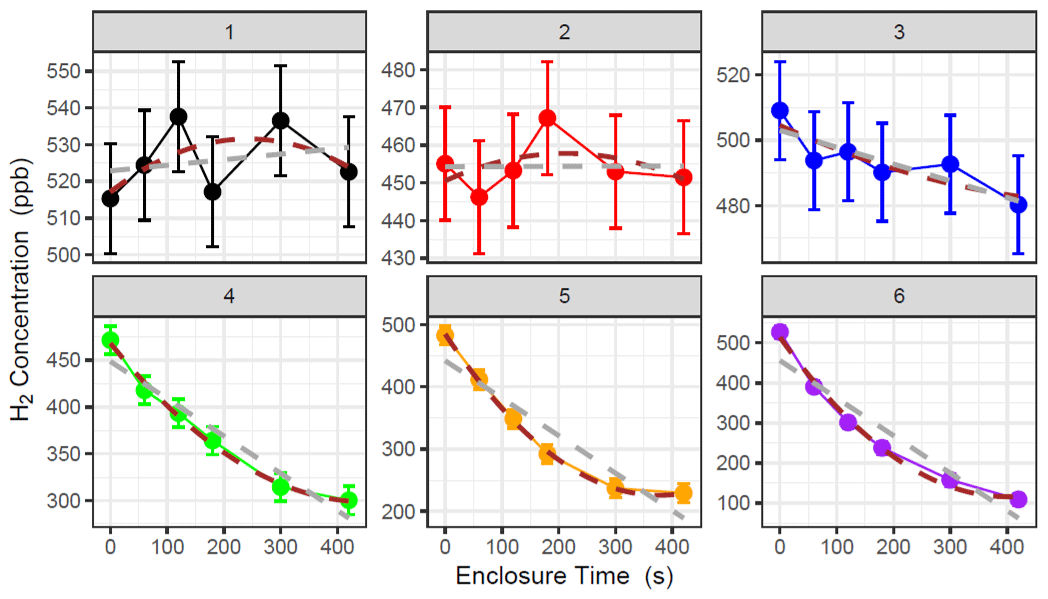
Figure 1Examples of concentration data collected during H2 flux chamber sampling. Linear regression (grey) and HM model (brown) are used to determine for each chamber measurement. Error bars represent the instrumental noise of H2 measurements in GC analysis (15 ppb in this study). Comparisons of flux data presented in Table 2.
Table 2Further information on the example data provided in Fig. 1. Six examples of chamber H2 flux measurements are provided from the Easter Bush (grassland) and Glencorse (woodland) field sites. The initial and final concentrations of H2 within the chamber are provided, as well as the flux and 95 % C.I. calculated using linear and HM model (Eq. 2) fitting methods (not applicable (n/a) when k is too large). The method selected to represent the flux in this study based on the described protocols is included.
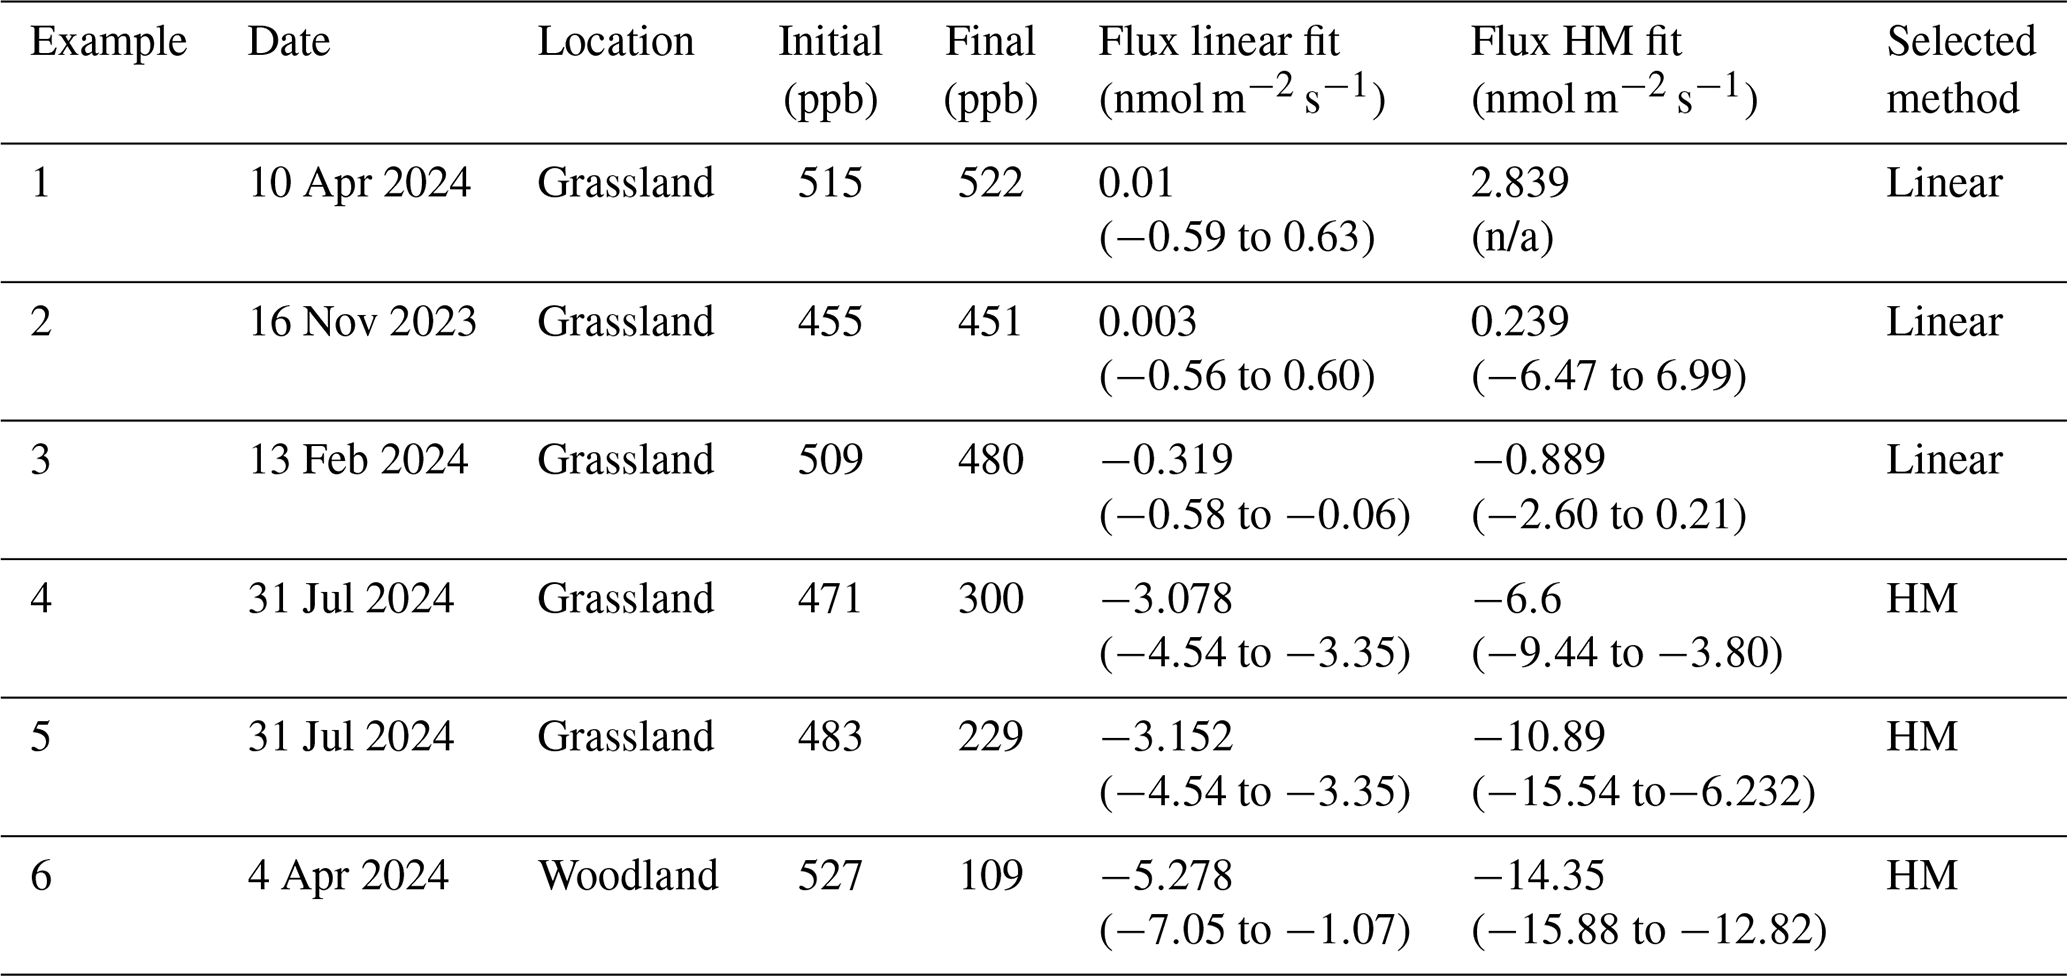
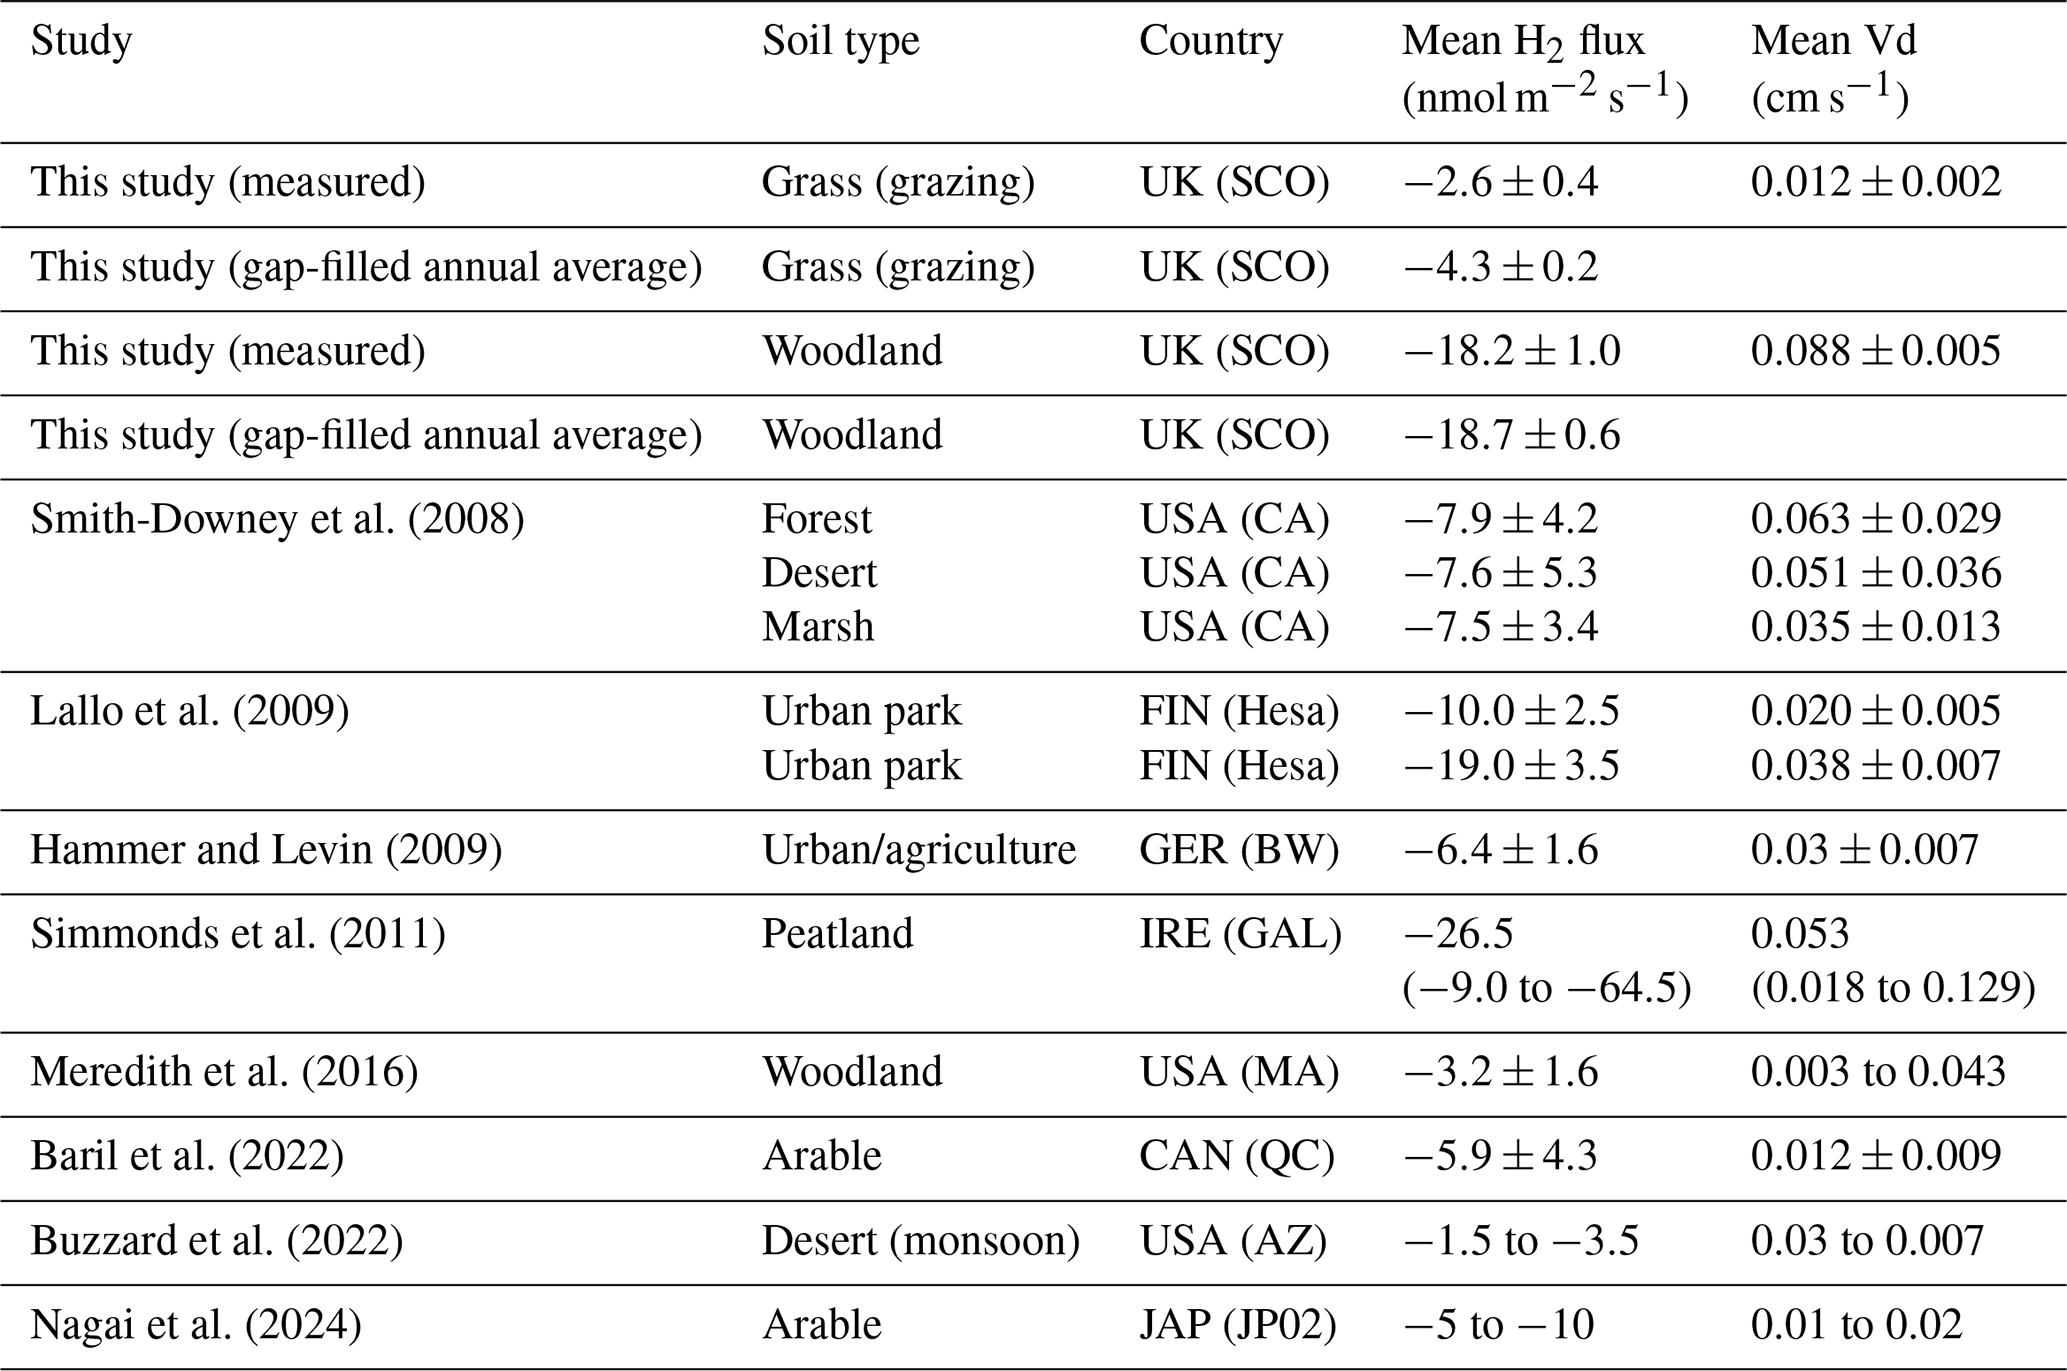
Table 3A summary of H2 net fluxes and deposition velocity (Vd) measurements reported in the literature, compared with measured and modelled values in this study. Mean values and reported uncertainties. Where only flux or Vd is reported, missing values are estimated using an ambient H2 concentration of 500 ppb.
3.1 Hydrogen flux measurements
Fluxes of H2 measured from the grassland site ranged from −15.5 to +5.3 nmol m−2 s−1 (Figs. 2 and S1 in the Supplement) over the period of September 2023 to September 2024. More than 90 % of the H2 fluxes measured at the grassland site were negative (soil uptake), and only 2 of 251 chamber measurements showed emissions from the soil which exceed the analytical uncertainty of the method. Fluxes of H2 at the grassland site changed seasonally, with greater uptake in the spring and summer compared with winter, where the flux was close to zero. Fluxes at the grassland site had a median of −1.2 nmol m−2 s−1 and 95 % percentiles of −9.9 to 0.2 nmol m−2 s−1. Fluxes measured from the woodland site ranged from −40.7 to −1.1 nmol m−2 s−1 (Figs. 2 and S1). All fluxes measured at the woodland site showed H2 uptake in the soil. Spatial variability of H2 flux at the woodland site was an order of magnitude larger than that observed at the grassland site. Fluxes at the woodland site had a median of −18.7 nmol m−2 s−1 and 95 % percentiles of −32.4 to −4.3 nmol m−2 s−1. Ambient concentrations of H2 at the sites ranged from 424.8 to 566.5 ppb. Mean ambient concentrations at the woodland site (484.4 ppb) were on average 21.7 ppb (4.3 %) lower than the grassland site (506.5 ppb), which could be considered statistically insignificant (t test, p>0.1), but differences were fairly consistent throughout the year (summary statistics presented in Table S2).
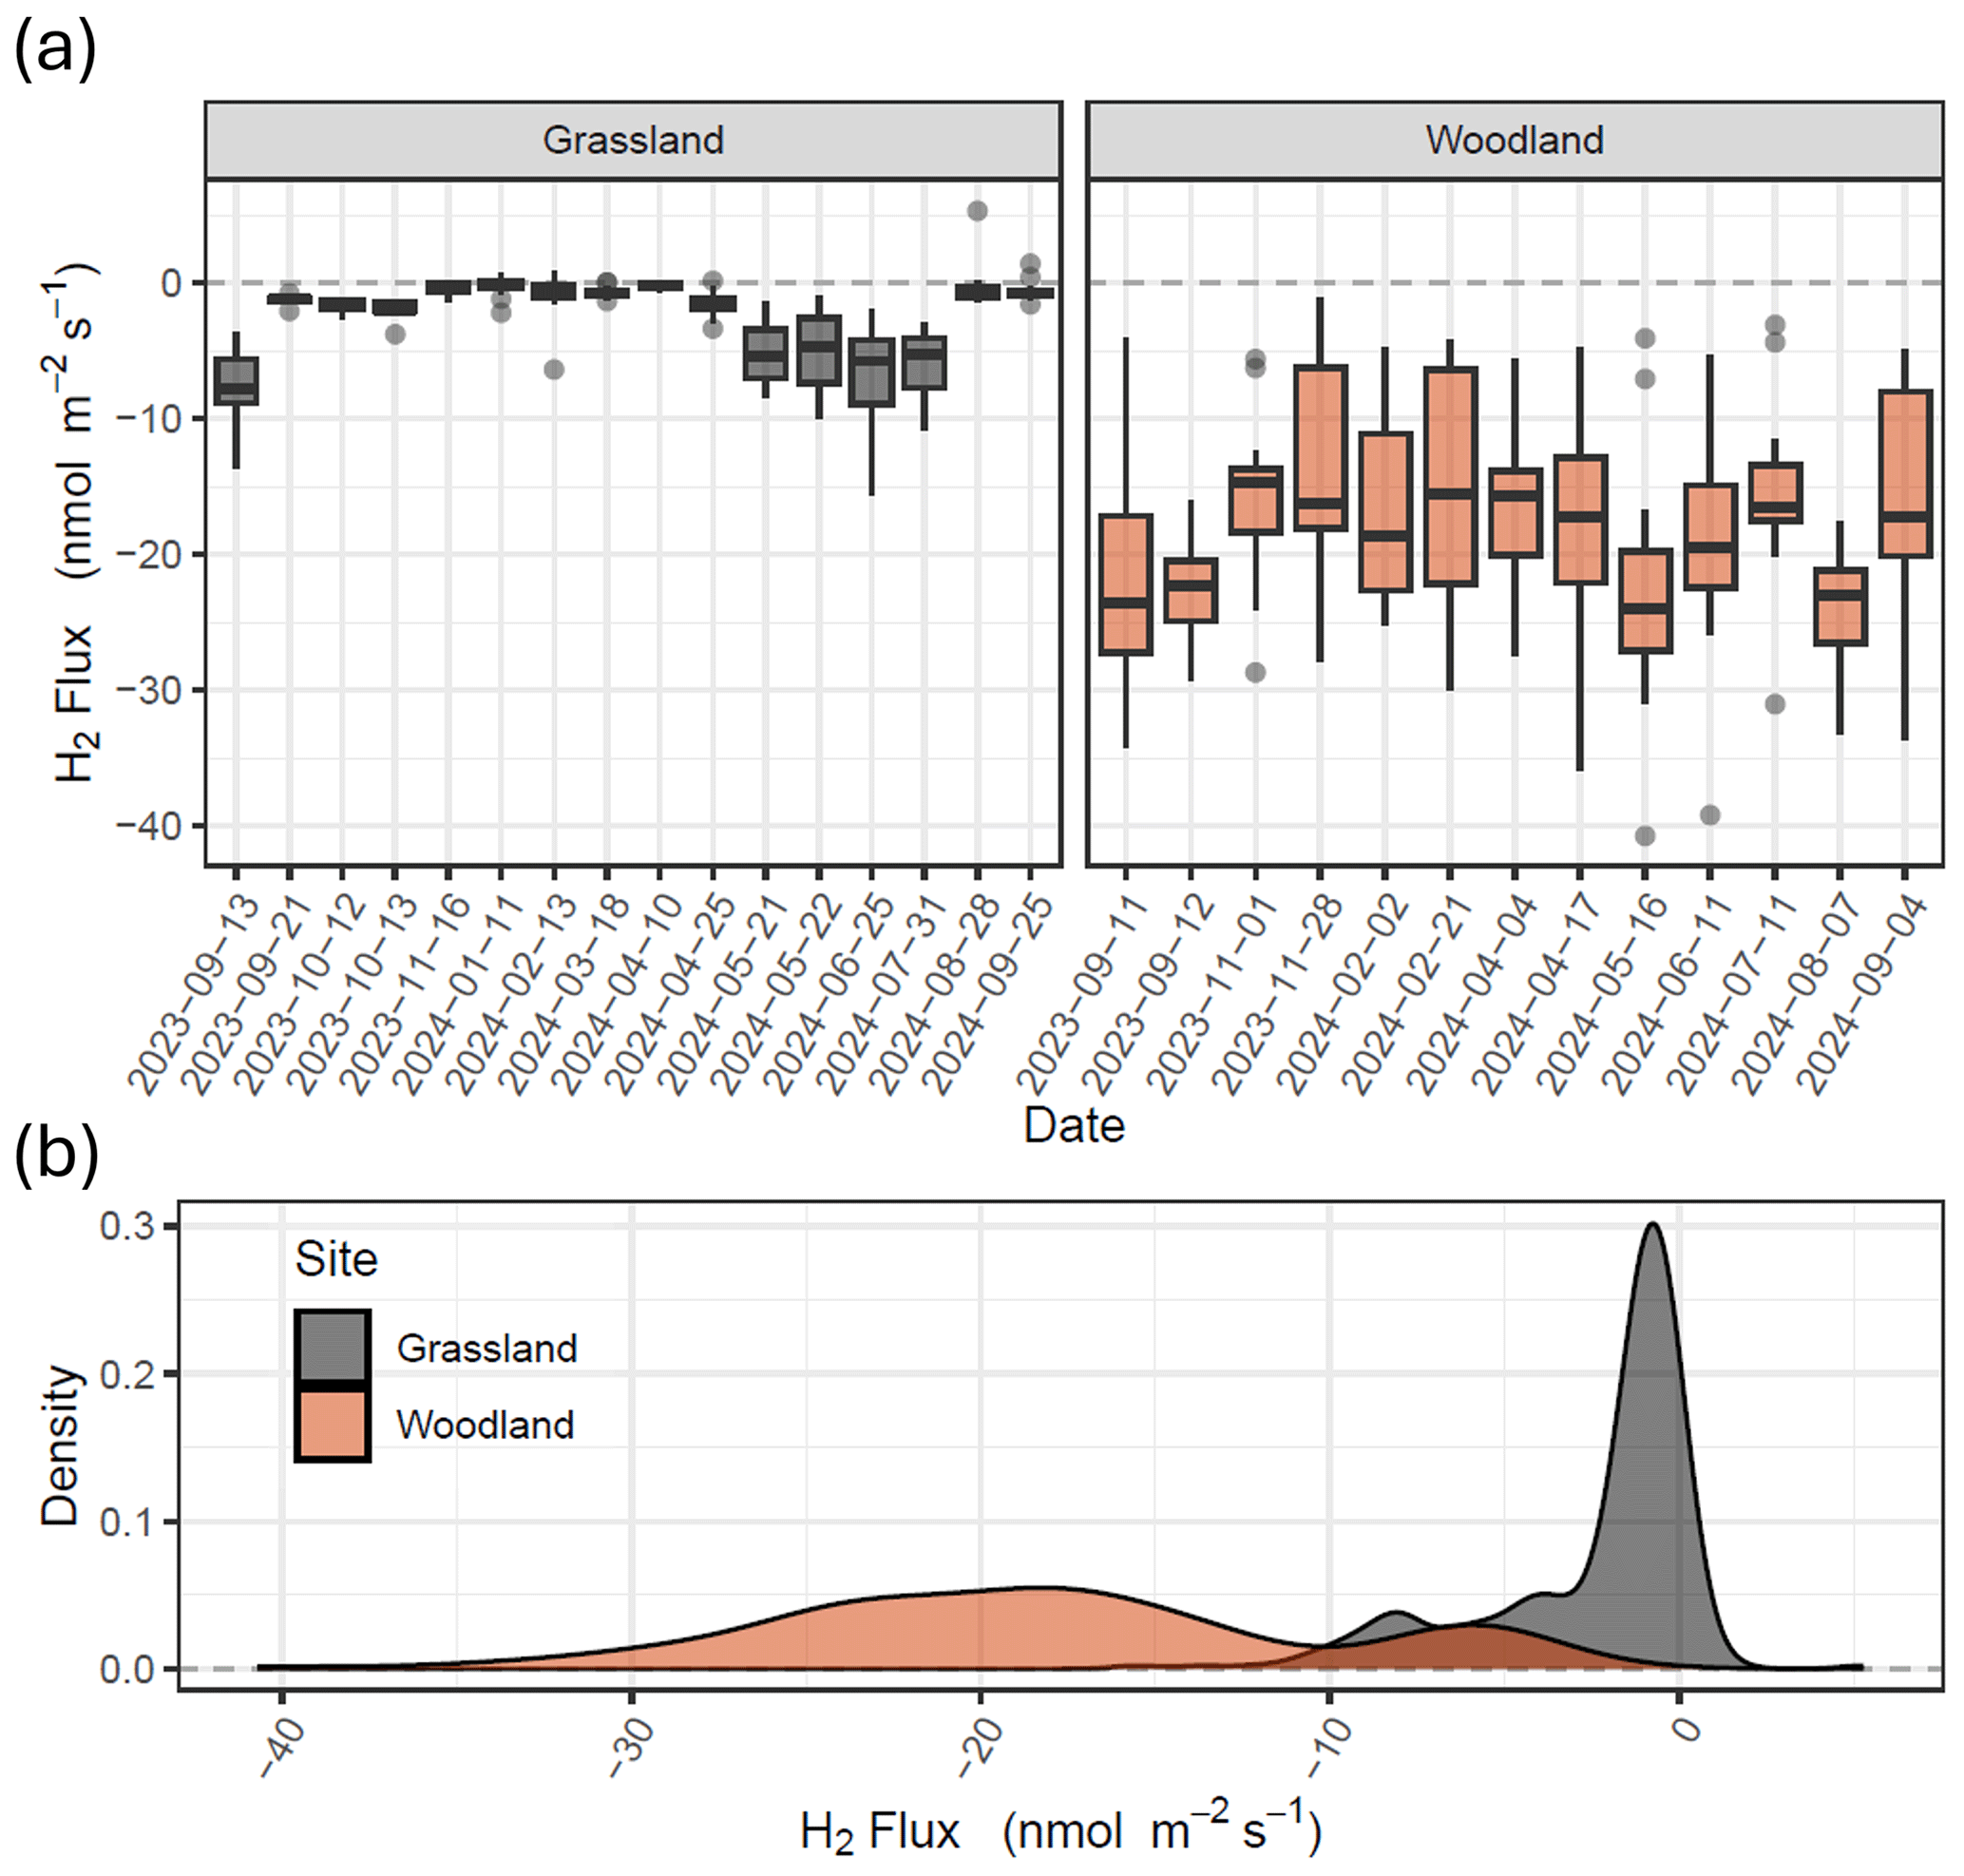
Figure 2Fluxes of H2 measured using the flux chamber method at grassland (Easter Bush, grassland; grey) and forest (Glencorse Forest, woodland; red) sites in Midlothian, Scotland. Box plots (a) represent the median and 25th and 75th percentiles of flux data of 20 chambers, respectively (whiskers represent the 95th percentiles). (b) Frequency distributions of the flux data for both sites (figure replicated for Vd in Fig. S1).
3.2 Greenhouse gas fluxes
Fluxes of CH4 at both sites were close to zero, with mostly small negative fluxes observed at both sites (Fig. S3). Soil uptake of CH4 was observed during the summer months at both sites, but during colder months, only the woodland site continued to observe consistent negative CH4 fluxes. Fluxes of CH4 measured from the grassland site ranged from −1.2 to 1.0 nmol m−2 s−1 with a median of −0.14 nmol m−2 s−1. Fluxes of CH4 measured from the woodland site ranged from −1.3 to 2.3 nmol m−2 s−1 with a median of −0.32 nmol m−2 s−1. Only 40 % of all CH4 flux measurements exceeded the analytical uncertainty of the chamber method deployed, highlighting the fact that the magnitude of observed fluxes was near the limit of detection of the methodology. Fluxes of N2O measured at both sites were relatively low for all measurement dates (58 % of all data below the analytical uncertainty) with the exception of measurements made in April at the grassland site. Nitrogen fertiliser was applied to the field on 28 March, resulting in increased N2O emissions for several weeks (Fig. S3).
3.3 Drivers of H2 flux
Correlations of H2 flux with soil moisture and soil temperature can be observed at both sites (Figs. 3a, b and S4); however, each site responds differently. Fluxes of H2 at the grassland site were close to zero when water-filled pore space (WFPS) was high (>45 %) and then tended towards uptake as WFPS decreased. The correlation between H2 flux and WFPS is weaker at the woodland site, and flux data are widely scattered. Fluxes of H2 at both the grassland and woodland site tended towards higher uptake as temperature increased, though scatter increased toward higher uptake at both sites (>12 °C). A simplistic multiple regression fit between H2 flux (y) with soil moisture (x) and soil temperature (z) () accounts for more than half of the variance in the observed fluxes at the grassland site (R2=0.60), with a significant contribution from soil moisture, but the same approach does not adequately represent the large flux variability at the woodland site (R2=0.14) for which neither soil moisture or soil temperature was found to correlate significantly (Table S3). Fluxes of CH4 at the sites followed the same trends as H2 flux in terms of emission/uptake and follow similar correlations with soil moisture and soil temperature as H2 flux (Fig. 3c and d). Fluxes of CH4 at both sites were close to zero (or emission) when soils were wet (>45 % WFPS) and cold (<6 °C). Uptake of CH4 was greatest when soils were drier and warm.
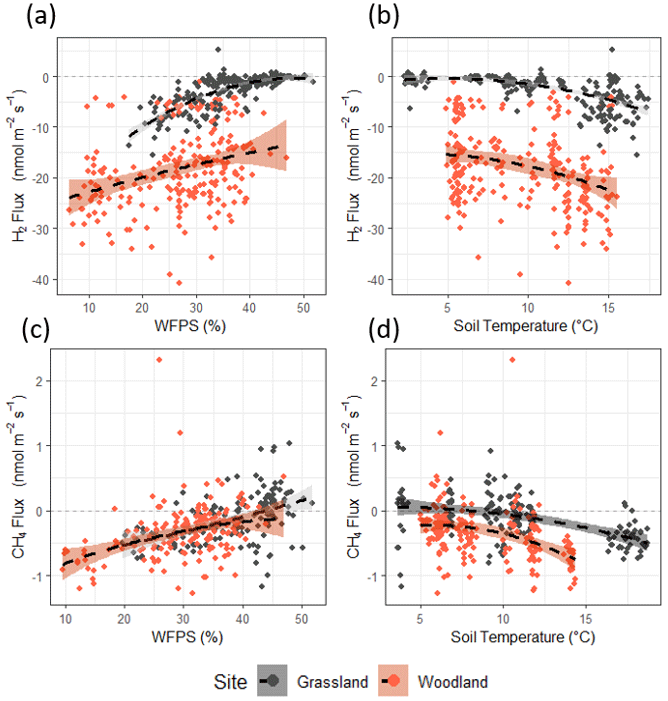
Figure 3Correlations between H2 flux and (a) water-filled pore space (WFPS) and (b) soil temperature. Correlations between CH4 flux and (c) water-filled pore space (WFPS) and (d) soil temperature. WFPS and soil temperature measured at 10 cm depth via sampling probe. A second-order polynomial fit (black dashed line) is included as a visual aid () (figure replicated for Vd in Fig. S2).
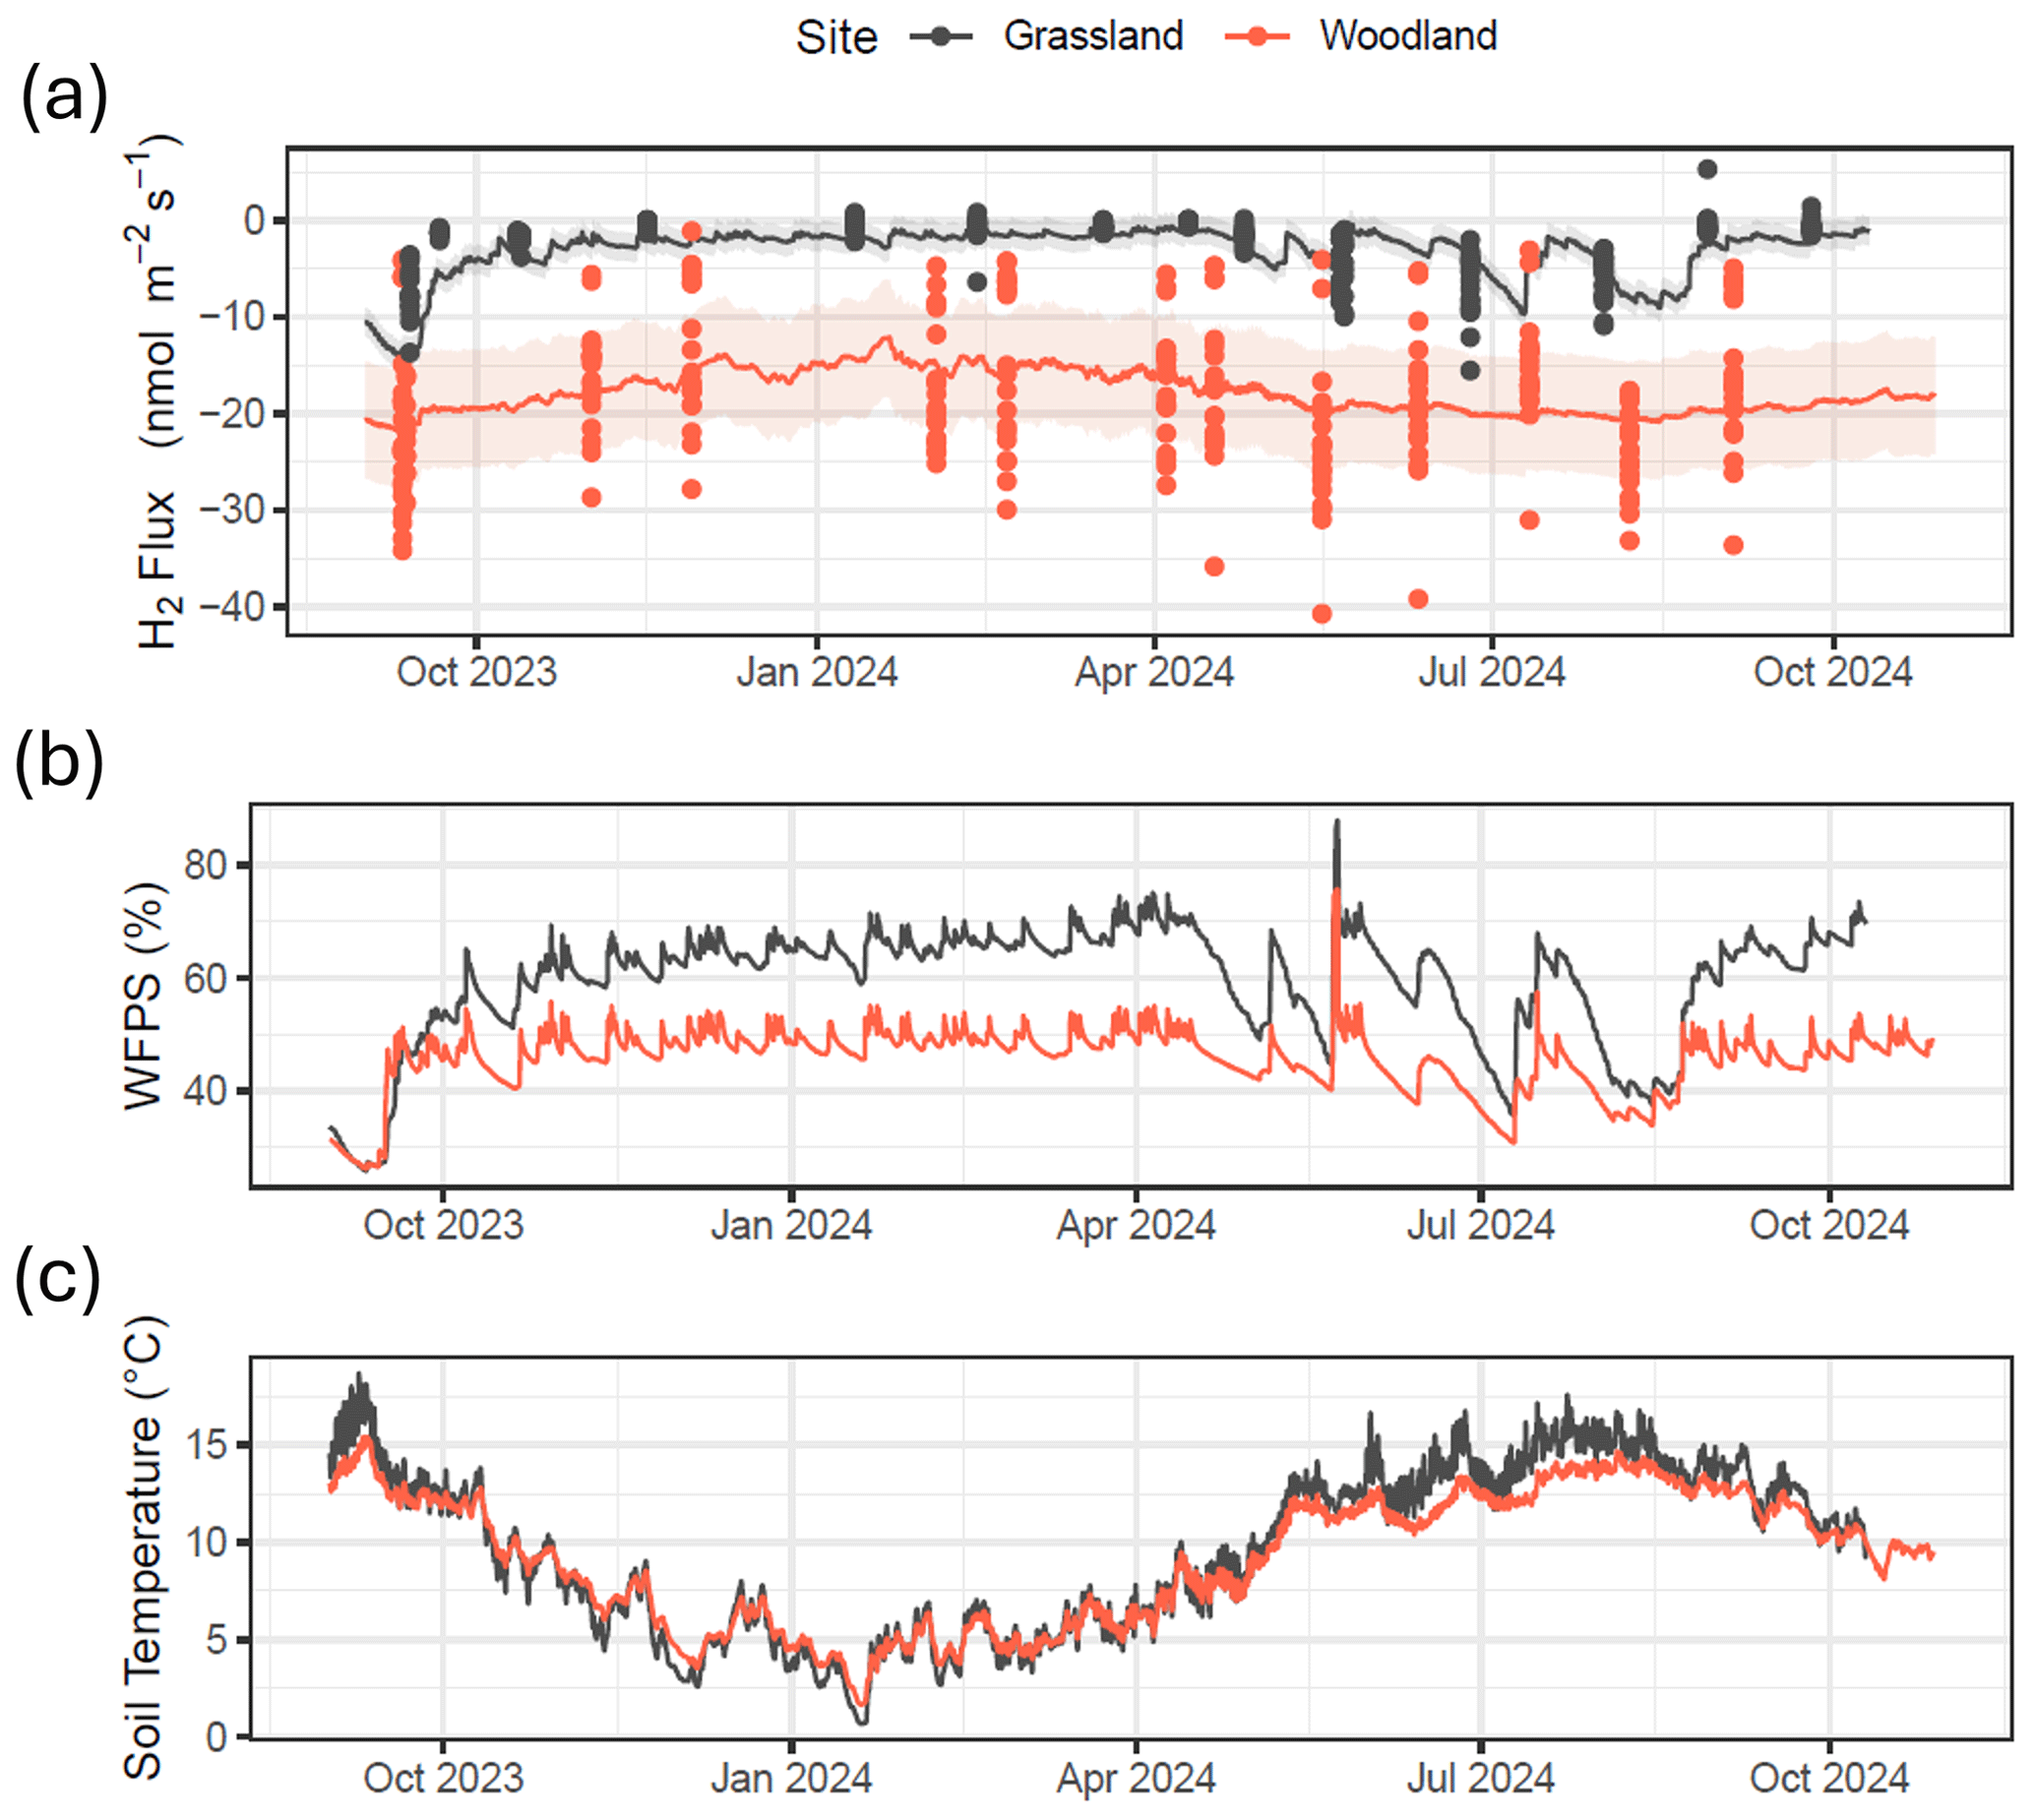
Figure 4(a) H2 flux measurements and model predictions for both field sites using a multiple regression fit with soil moisture (x) and soil temperature (z) (). (b) Continuous water-filled pore space (WFPS) at measurements made at 10 cm depth (average of 60 min). (c) Continuous soil temperature at measurements made at 10 cm depth (average of 60 min).
No correlation between H2 flux with measured total soil C or N in the top 10 cm was found at the woodland site (R2<0.01 for each) (Fig. S5). Variability in C and N in the replicated cores in the soils in the vicinity of each chamber (<1 m2 distance) was similar to the magnitude of spatial variability observed at the entire plot scale. This suggested a relatively large variability in the soil C and N content at small scales, which may obfuscate correlation between soils and fluxes at the individual chamber scale (destructive sampling could not be carried out on soil within the chambers without invalidating flux measurements).
By combining continuous soil measurement data collected at each site (soil moisture and temperature at 10 cm depth) with the multiple regression model with soil moisture and soil temperature (Fig. 4b and c) as described in Table S1, continuous H2 flux predictions were made for a full year (Fig. 4a). This model predicts that H2 flux at the grassland site remains close to zero for most of the time, except when soil moisture drops (e.g. warm months in spring and summer). The model predicts that H2 flux at the grassland site is strongly dependent on the soil moisture content, with relatively strong periods of H2 uptake during drier periods (warm periods between rainfall events). H2 flux estimates at the woodland site are more variable and less susceptible to changes in meteorology or soil conditions. The model predicts a slowdown in H2 uptake in the forest soils during the colder months in winter but is not significantly impacted by changing soil moisture. Total annual estimates of H2 flux predicted by the model are and kg H2 ha−1 yr−1 for the grassland and woodland sites, respectively. By comparison, a straight average of the measurements, without using models to gap-fill the data, suggests mean fluxes (with 95 % C.I.s) of and nmol m−2 s−1, which would translate to annual cumulative fluxes of approximately and kg H2 ha−1 yr−1 for the grassland and GC sites, respectively. The two estimates agree well at the woodland site, but the gap filling increases the estimated annual H2 uptake at the grassland site by 56 %.
4.1 Quantification of H2 flux
Fluxes of H2 measured in this study range from −40.7 to 5.3 nmol m−2 s−1, with mean fluxes of and nmol m−2 s−1 for the grassland and woodland sites, respectively. Using regression to model (gap-fill) flux data, we estimate annual H2 uptake of 3.1±0.1 and 12.0±0.4 kg H2 ha−1 yr−1 for the grassland and woodland sites, respectively, which increases the modelled mean uptake at the grassland site to 4.3±0.2 nmol m−2 s−1 (in comparison to a measured mean uptake of 2.6±0.4 nmol m−2 s−1), while the expected mean uptake at the woodland site remains near 18 nmol m−2 s−1 (Table 3). Predicted uptake is higher at the grassland site due to the expectation in the model that uptake will increase during periods of drier soils that were not measured directly. Predicted uptake estimated by the model and the extrapolation of the mean flux are not significantly different at the woodland site due to the lack of correlation with soil drivers in the model. However, the model does predict that uptake will slow down during the coldest months when fewer measurements were made at the site.
Mean measured uptake of H2 at the grassland site is at the lower end of uptake reported in other studies that directly measured H2 flux from soils, which range from −1.5 to >20 nmol m−2 s−1 (Table 3). The mean soil uptake of H2 at the woodland site is at the higher end in terms of uptake magnitude, close in magnitude to high deposition velocities reported for peatlands in Simmonds et al. (2011). While uptake at this site seems high, we are confident that the flux measurements are accurate based on the consistency of flux observations and the quality controls put in place. Concentrations of H2 in the chambers consistently fell exponentially, reaching near zero within 5 min (often within 3 min) of enclosure. At the time of chamber closure (t0), a volume of 0.025 m3 of ambient air at the woodland site contains approximately 400–500 nmol of H2 gas. To reach zero within 5 min would require fluxes approximately 10–12 nmol m−2 s−1 in magnitude. While dealing with the exponential non-linearity of the rate of change of the concentration () does introduce an element of uncertainty in the flux calculations, we are confident the method used in this study (HMR fitting) accurately captures the flux at t0 and thus a realistic magnitude of soil H2 uptake.
Only two of the measured H2 fluxes were both positive and larger than the analytical noise of the measurement method. However, these measurements from separate chambers on separate dates (from the grassland site) both showed seven consecutive concentration measurements, all clearly increasing with time, highlighting that it is possible for H2 emissions to occur in soils, even where uptake is the predominant direction of flux. It has been observed that legumes produce H2 during the nitrogen fixation process (e.g. Schubert and Evans, 1976; Flynn et al., 2014); however, no legume plants were present in any of the chamber locations during the study. The source of these H2 emissions remains unknown, and at no point did either of the field sites become a source of H2, but our observations do highlight that there remain unknown microbial and geological processes at the sub-field scale.
4.2 Drivers of H2 flux
This study provides evidence of large variability in H2 flux behaviour across two different soil types and the importance of environmental factors such as soil temperature and moisture content. At the grassland site, soil moisture (WFPS) dominated the net H2 flux behaviour in the soils. The relationship between H2 uptake and soil moisture was statistically significant (p<0.001) and explained 60 % of the variance observed in the grassland H2 fluxes observed. While H2 flux does appear to correlate with soil temperature at the grassland site when compared directly, this is almost entirely due to the strong correlation between soil moisture and soil temperature (R2=0.68). Multiple regression finds soil temperature to be an insignificant variable once the effect of soil moisture is accounted for at the grassland site. Spatial variability in H2 fluxes at the woodland site was an order of magnitude higher than at the grassland site. This spatial variability could not be explained by soil moisture, temperature or the total carbon content of the soil. While there do appear to be weak relationships between the flux data and soil moisture and soil temperature, neither is found to be statistically significant (maximum p value of 0.15 for soil temperature).
Meteorological conditions were almost identical at the local scale (sites are less than 3 km apart), and soil at both sites was of a similar pH and had similar total carbon and nitrogen contents. A small difference in ambient H2 concentrations was observed between the sites, which may be caused by the large soil uptake and poorer circulation of air at the woodland site, resulting in lower near surface H2 concentrations. The reason for the large difference in flux of H2 measured between the two sites is not entirely clear from the measured data, but it is likely that the physical properties of the soils played a role. While rooting systems and carbon structure within the surface layers of the soils will be different at the sites, one large and obvious disparity is the silt/clay content of the soils, which is approximately 75 % and 40 % at the grassland and woodland sites, respectively. While both soils have similar particle density, the difference in silt/clay content implies variations in pore size distribution and connectivity, which will likely lead to different sensitivities to moisture changes. We hypothesise from this assessment that the high fraction of silt/clay soil at the grassland site results in the soil becoming highly anaerobic when moisture levels increase, as can be seen in the switching from CH4 uptake to CH4 emission when WFPS exceeded 40 %. At the woodland site, a thin layer of organic materials (forest litter that could provide a source of labile carbon) lies on top of a sandy, well-drained soil, which may provide ideal conditions for H2 uptake. Uptake of CH4 is generally greater than at the grassland site, and WFPS remains lower throughout the year, showing that drainage is significantly faster at the site and suggests that the soils are more aerobic than at the grassland site (e.g. better penetration of H2 to active regions within the soil). While the differences in soil texture may partly explain the large magnitude of difference in H2 uptake between the sites, it does not account for the large spatial variability of H2 flux at the woodland site. We observe that the flux at the grassland site is largely dependent on physical factors at the field scale such as the moisture content (aeration) of the soil, but the woodland site showed large variations between plots. This variation may be due to microbial factors that are highly spatial in a forest floor, such as available nutrients (labile carbon from rotting plant litter), canopy shading and varying microbial densities.
4.3 Considerations for future research
Chamber flux methods are commonplace in the field of GHG flux measurements, but there are several important factors that need to be considered when carrying out H2 flux measurements in the field. One of the most important – when using gas chromatography analysis – is the lifetime of samples stored in vials due to leakage rates from the rubber septum materials used to cap vials. While it is possible to keep GHG samples in these vials for weeks or even months without significant storage loss, H2 concentrations were found to change relatively quickly and should be analysed as soon as is possible (within 24 h of measurement). This severely limits the reach of a particular field experiment to within travel distances of a working H2 gas chromatography instrument (e.g. not suitable for international shipment of samples). Almost all published H2 flux measurements to date are within the temperate region of the Northern Hemisphere (USA and Europe), which limits the available data for models to predict soil–atmosphere interactions at the global scale. Building H2 flux datasets at a global level would require either investment in localised infrastructure that allows for samples to be analysed in-country or the deployment of temporary roving measurement methodology which travels between sites. We emphasise that unless particular care and attention is applied to the transportation of gas samples (e.g. tests and quality control checks), the H2 flux cannot be analysed over a large distance due to leakage of samples.
Field measurements of H2 are beneficial due to realistic environmental conditions. However, the manual aspects of chamber sampling create logistical issues (extensive fieldwork) and the overlap of many environmental and soil variables can make it difficult to identify the driving forces behind H2 flux (e.g. the soil moisture–temperature comparison). With this setup, the GC-PDHID is limited to one gas sample every 4 min; thus auto-chambers (chambers that open/close and measure gas samples automatically) are limited in capability. New faster instruments able to measure H2 gas via infrared spectroscopy (by converting H2 to H2O) are becoming more commercially available (see https://aerodyne.com/laser-analyzers/, last access: 14 July 2025), but there are no studies using these analysers to date. Previously, gas chromatography instrumentation has been used to measure H2 flux via the aerodynamic gradient method (Meredith et al., 2016), which allows half-hourly fluxes to be measured at the field scale. While micrometeorological methods such as the aerodynamic gradient method allow for a greater temporal and spatial coverage of soil fluxes, they also require certain field conditions, such as flat open terrain and large (mains) power supply. In the case of the woodland site in this study, micrometeorological methods are not feasible. With current available H2 measurement methods, care must be given when planning measurement activities to ensure efficiency in data collection.
Lab-based incubation studies of H2 flux in literature are similar in number to those measured in the field. Incubation studies allow for better control of soil conditions such as moisture, temperature and nutrient content and of environmental conditions (air temperature) and also for consistency in microbial populations (via replicates of well mixed/homogenised soils). For example, in this study, it was difficult to determine the impact of soil temperature due to the correlation with soil moisture. Due to the climate in the region, there were no periods when the soils were cold and also dry, preventing observations of different extremes of the driving forces behind H2 flux (see Fig. S4). Incubation studies would be able to provide more information on these drivers which may help modelling efforts; however, field measurements are still required to validate flux models as incubation studies inevitably come with the caveat that flux measurements are not representative of true soil conditions due to soil cores being repacked and creating therefore artificial conditions.
This study reports that the soil sink (uptake) of H2 for a grassland and a forest site in close proximity is and kg H2 ha−1 yr−1, respectively (with mean Vds of 0.012±0.002 and 0.088±0.005 cm s−1 for grassland and forest soils, respectively). Soil moisture was found to be the primary driver of H2 uptake at the grassland site, where the high silt/clay content of the soil resulted in anaerobic conditions (near zero H2 flux) during wet periods of the year. Uptake of H2 at the forest site was highly variable and did not correlate well with any localised soil properties. Both sites were exposed to similar meteorological conditions (3 km apart) and had similar basic soil properties (such as pH and carbon content); thus we conclude that the large difference in uptake between the soils was dependent on soil aeration and diffusivity of H2. It is likely that the high silt/clay content of the grassland site (55 %) resulted in a lack of aeration when soils were wet, while the well-drained forest site (25 % clay) was not restricted by exchange of H2 between the atmosphere and the soil, showing instead a large variability in H2 flux that could be related to heterogeneous factors that control microbial activity (e.g. labile carbon and microbial densities). In order to account for the large magnitude of site-scale differences like those observed in this study, further field sites should be studied over a range of soil and land cover types and management activities to improve global models of the soil H2 sink. In addition, laboratory incubations are needed to measure H2 fluxes under controlled environmental conditions to refine the main driving parameters of H2 fluxes further.
Data are currently undergoing preparation for submission to the Environmental Information Data Centre (EIDC; https://eidc.ac.uk/, EIDC, 2025).
The supplement related to this article is available online at https://doi.org/10.5194/bg-22-3449-2025-supplement.
NC was the primary author of the manuscript and carried out all data analysis presented. The field team that developed measurement methodology protocols, carried out measurements, maintained field instrumentation and performed lab analysis consisted of TR, MH, AB, GT, AT, KY and AD. The project management and significant contributors to the manuscript text consisted of PL, US, EN and JD. All coauthors contributed to the writing of the manuscript before submission.
The contact author has declared that none of the authors has any competing interests.
Publisher's note: Copernicus Publications remains neutral with regard to jurisdictional claims made in the text, published maps, institutional affiliations, or any other geographical representation in this paper. While Copernicus Publications makes every effort to include appropriate place names, the final responsibility lies with the authors.
This research has been supported by the Natural Environment Research Council (grant nos. NE/X013456/1, NE/S009019/1 and NE/Y006208/1).
This paper was edited by Robert Rhew and reviewed by two anonymous referees.
Baril, X., Durand, A.-A., Srei, N., Lamothe, S., Provost, C., Martineau, C., Dunfield, K., and Constant, P.: The biological sink of atmospheric H2 is more sensitive to spatial variation of microbial diversity than N2O and CO2 emissions in a winter cover crop field trial, Sci. Total Environ., 821, 153420, https://doi.org/10.1016/j.scitotenv.2022.153420, 2022.
Bertagni, M. B., Pacala, S. W., Paulot, F., and Porporato, A.: Risk of the hydrogen economy for atmospheric methane, Nat. Commun., 13, 7706, https://doi.org/10.1038/s41467-022-35419-7, 2022.
Billington, H. L. and Pelham, J.: Genetic Variation in the Date of Budburst in Scottish Birch Populations: Implications for Climate Change, Funct. Ecol., 5, 403–409, https://doi.org/10.2307/2389812, 1991.
Buzzard, V., Thorne, D., Gil-Loaiza, J., Cueva, A., and Meredith, L. K.: Sensitivity of soil hydrogen uptake to natural and managed moisture dynamics in a semiarid urban ecosystem, Peer J., 10, e12966, https://doi.org/10.7717/peerj.12966, 2022.
Cooper, J., Dubey, L., Bakkaloglu, S., and Hawkes, A.: Hydrogen emissions from the hydrogen value chain-emissions profile and impact to global warming, Sci. Total Environ., 830, 154624, https://doi.org/10.1016/j.scitotenv.2022.154624, 2022.
Cowan, N., Levy, P., Maire, J., Coyle, M., Leeson, S. R., Famulari, D., Carozzi, M., Nemitz, E., and Skiba, U.: An evaluation of four years of nitrous oxide fluxes after application of ammonium nitrate and urea fertilisers measured using the eddy covariance method, Agr. Forest Meteorol., 280, 107812, https://doi.org/10.1016/j.agrformet.2019.107812, 2020.
Cowan, N., Levy, P., Tigli, M., Toteva, G., and Drewer, J.: Characterisation of Analytical Uncertainty in Chamber Soil Flux Measurements, Eur. J Soil Sci., 76, e70104, https://doi.org/10.1111/ejss.70104, 2025.
Derwent, R. G., Stevenson, D. S., Utembe, S. R., Jenkin, M. E., Khan, A. H., and Shallcross, D. E.: Global modelling studies of hydrogen and its isotopomers using STOCHEM-CRI: Likely radiative forcing consequences of a future hydrogen economy, Int. J. Hydrog. Energ., 45, 9211–9221, https://doi.org/10.1016/j.ijhydene.2020.01.125, 2020.
Deshpande, A. G., Jones, M. R., van Dijk, N., Mullinger, N. J., Harvey, D., Nicoll, R., Toteva, G., Weerakoon, G., Nissanka, S., Weerakoon, B., Grenier, M., Iwanicka, A., Duarte, F., Stephens, A., Ellis, C. J., Vieno, M., Drewer, J., Wolseley, P. A., Nanayakkara, S., Prabhashwara, T., Bealey, W. J., Nemitz, E., and Sutton, M. A.: Estimation of ammonia deposition to forest ecosystems in Scotland and Sri Lanka using wind-controlled NH3 enhancement experiments, Atmos. Environ., 320, 120325, https://doi.org/10.1016/j.atmosenv.2023.120325, 2024.
Drewer, J., Anderson, M., Levy, P. E., Scholtes, B., Helfter, C., Parker, J., Rees, R. M., and Skiba, U. M.: The impact of ploughing intensively managed temperate grasslands on N2O, CH4 and CO2 fluxes, Plant Soil, 411, 193–208, https://doi.org/10.1007/s11104-016-3023-x, 2016.
Drewer, J., Yamulki, S., Leeson, S. R., Anderson, M., Perks, M. P., Skiba, U. M., and McNamara, N. P.: Difference in Soil Methane (CH4) and Nitrous Oxide (N2O) Fluxes from Bioenergy Crops SRC Willow and SRF Scots Pine Compared with Adjacent Arable and Fallow in a Temperate Climate, Bioenerg. Res., 10, 575–582, https://doi.org/10.1007/s12155-017-9824-9, 2017.
Ehhalt, D. H. and Rohrer, F.: The tropospheric cycle of H2: a critical review, Tellus B, 61, 500–535, https://doi.org/10.1111/j.1600-0889.2009.00416.x, 2009.
EIDC – Environmental Information Data Centre: https://eidc.ac.uk/ (last access: 14 July 2025), 2025.
Field, R. A. and Derwent, R. G.: Global warming consequences of replacing natural gas with hydrogen in the domestic energy sectors of future low-carbon economies in the United Kingdom and the United States of America, Int. J. Hydrog. Energ., 46, 30190–30203, https://doi.org/10.1016/j.ijhydene.2021.06.120, 2021.
Flynn, B., Graham, A., Scott, N., Layzell, D. B., and Dong, Z.: Nitrogen fixation, hydrogen production and N2O emissions, Can. J. Plant Sci., 94, 1037–1041, https://doi.org/10.4141/cjps2013-210, 2014.
Greening, C. and Grinter, R.: Microbial oxidation of atmospheric trace gases, Nat. Rev. Microbiol., 20, 513–528, https://doi.org/10.1038/s41579-022-00724-x, 2022.
Hammer, S. and Levin, I.: Seasonal variation of the molecular hydrogen uptake by soils inferred from continuous atmospheric observations in Heidelberg, southwest Germany, Tellus B, 61, 556–565, https://doi.org/10.1111/j.1600-0889.2009.00417.x, 2009.
Hitchcock, W. K., Beamish, B. B. and Cliff D.: A Study of the Formation of Hydrogen Produced During the Oxidation of Bulk Coal Under Laboratory Conditions, in: Proceedings of the 2008 Coal Operators' Conference, Mining Engineering, edited by: Aziz, N. and Kininmonth, B., University of Wollongong, https://ro.uow.edu.au/coal/17 (last access: 14 July 2025), 2019.
Hutchinson, G. L. and Mosier, A. R.: Improved Soil Cover Method for Field Measurement of Nitrous Oxide Fluxes, Soil Sci. Soc. Am. J., 45, 311–316, https://doi.org/10.2136/sssaj1981.03615995004500020017x, 1981.
Islam, Z. F., Welsh, C., Bayly, K., Grinter, R., Southam, G., Gagen, E. J., and Greening, C.: A widely distributed hydrogenase oxidises atmospheric H2 during bacterial growth, ISME J., 14, 2649–2658, https://doi.org/10.1038/s41396-020-0713-4, 2020.
Khalil, M. A. K. and Rasmussen, R. A.: The global cycle of carbon monoxide: Trends and mass balance, Chemosphere, 20, 227–242, https://doi.org/10.1016/0045-6535(90)90098-e, 1990.
Khdhiri, M., Hesse, L., Popa, M. E., Quiza, L., Lalonde, I., Meredith, L. K., Röckmann, T., and Constant, P.: Soil carbon content and relative abundance of high affinity H2-oxidizing bacteria predict atmospheric H2 soil uptake activity better than soil microbial community composition, Soil Biol. Biochem., 85, 1–9, https://doi.org/10.1016/j.soilbio.2015.02.030, 2015.
Lallo, M., Aalto, T., Hatakka, J., and Laurila, T.: Hydrogen soil deposition at an urban site in Finland, Atmos. Chem. Phys., 9, 8559–8571, https://doi.org/10.5194/acp-9-8559-2009, 2009.
Meredith, L. K., Commane, R., Keenan, T. F., Klosterman, S. T., Munger, J. W., Templer, P. H., Tang, J., Wofsy, S. C., and Prinn, R. G.: Ecosystem fluxes of hydrogen in a mid-latitude forest driven by soil microorganisms and plants, Global Change Biol., 23, 906–919, https://doi.org/10.1111/gcb.13463, 2016.
Nagai, M., Kakiuchi, H., and Masuda, T.: Measurements of hydrogen deposition velocities by farmland soil using D2 gas, Radiat. Protect. Dosimet., 200, 1763–1766, https://doi.org/10.1093/rpd/ncae055, 2024.
Novelli, P. C., Lang, P. M., Masarie, K. A., Hurst, D. F., Myers, R., and Elkins, J. W.: Molecular hydrogen in the troposphere: Global distribution and budget, J. Geophys. Res., 104, 30427–30444, https://doi.org/10.1029/1999jd900788, 1999.
Ocko, I. B. and Hamburg, S. P.: Climate consequences of hydrogen emissions, Atmos. Chem. Phys., 22, 9349–9368, https://doi.org/10.5194/acp-22-9349-2022, 2022.
Patterson, J. D., Aydin, M., Crotwell, A. M., Pétron, G., Severinghaus, J. P., Krummel, P. B., Langenfelds, R. L., and Saltzman, E. S.: H 2 in Antarctic firn air: Atmospheric reconstructions and implications for anthropogenic emissions, P. Natl. Acad. Sci. USA, 118, e2103335118, https://doi.org/10.1073/pnas.2103335118, 2021.
Paulot, F., Paynter, D., Naik, V., Malyshev, S., Menzel, R., and Horowitz, L. W.: Global modeling of hydrogen using GFDL-AM4.1: Sensitivity of soil removal and radiative forcing, Int. J. Hydrog. Energ., 46, 13446–13460, https://doi.org/10.1016/j.ijhydene.2021.01.088, 2021.
Pedersen, A. R., Petersen, S. O., and Schelde, K.: A comprehensive approach to soil-atmosphere trace-gas flux estimation with static chambers, Eur. J. Soil Sci., 61, 888–902, https://doi.org/10.1111/j.1365-2389.2010.01291.x, 2010.
Pétron, G., Crotwell, A. M., Mund, J., Crotwell, M., Mefford, T., Thoning, K., Hall, B., Kitzis, D., Madronich, M., Moglia, E., Neff, D., Wolter, S., Jordan, A., Krummel, P., Langenfelds, R., and Patterson, J.: Atmospheric H2 observations from the NOAA Cooperative Global Air Sampling Network, Atmos. Meas. Tech., 17, 4803–4823, https://doi.org/10.5194/amt-17-4803-2024, 2024.
Piché-Choquette, S. and Constant, P.: Molecular Hydrogen, a Neglected Key Driver of Soil Biogeochemical Processes, Appl. Environ. Microbiol., 85, e02418-18, https://doi.org/10.1128/aem.02418-18, 2019.
Saavedra-Lavoie, J., de la Porte, A., Piché-Choquette, S., Guertin, C., and Constant, P.: Biological H2 and CO oxidation activities are sensitive to compositional change of soil microbial communities, Can. J. Microbiol., 66, 263–273, https://doi.org/10.1139/cjm-2019-0412, 2020.
Sand, M., Skeie, R. B., Sandstad, M., Krishnan, S., Myhre, G., Bryant, H., Derwent, R., Hauglustaine, D., Paulot, F., Prather, M., and Stevenson, D.: A multi-model assessment of the Global Warming Potential of hydrogen, Commun. Earth Environ., 4, 203, https://doi.org/10.1038/s43247-023-00857-8, 2023.
Schubert, K. R. and Evans, H. J.: Hydrogen evolution: A major factor affecting the efficiency of nitrogen fixation in nodulated symbionts, P. Natl. Acad. Sci. USA, 73, 1207–1211, https://doi.org/10.1073/pnas.73.4.1207, 1976.
Simmonds, P. G., Derwent, R. G., Manning, A. J., Grant, A., O'doherty, S., and Spain, T. G.: Estimation of hydrogen deposition velocities from 1995–2008 at Mace Head, Ireland using a simple box model and concurrent ozone depositions, Tellus B, 63, 40–51, https://doi.org/10.1111/j.1600-0889.2010.00518.x, 2011.
Smith-Downey, N. V., Randerson, J. T., and Eiler, J. M.: Molecular hydrogen uptake by soils in forest, desert, and marsh ecosystems in California, J. Geophys. Res., 113, G03037, https://doi.org/10.1029/2008jg000701, 2008.
Warwick, N. J., Bekki, S., Nisbet, E. G., and Pyle, J. A.: Impact of a hydrogen economy on the stratosphere and troposphere studied in a 2-D model, Geophys. Res. Lett., 31, L05107, https://doi.org/10.1029/2003gl019224, 2004.
Yonemura, S., Kawashima, S., and Tsuruta, H.: Continuous measurements of CO and H2; deposition velocities onto an andisol: uptake control by soil moisture, Tellus B, 51, 688, https://doi.org/10.3402/tellusb.v51i3.16465, 1999.
Yonemura, S., Kawashima, S., and Tsuruta, H.: Carbon monoxide, hydrogen, and methane uptake by soils in a temperate arable field and a forest, J. Geophys. Res., 105, 14347–14362, https://doi.org/10.1029/1999jd901156, 2000.