the Creative Commons Attribution 4.0 License.
the Creative Commons Attribution 4.0 License.
 | 25 Jul 2025
Ozone causes substantial reductions in the carbon sequestration of managed European forests
Per Erik Karlsson
Patrick Büker
Sam Bland
David Simpson
Katrina Sharps
Felicity Hayes
Lisa D. Emberson
The annual, accumulated stomatal ozone uptake during the vegetation season, i.e. the species-specific phytotoxic ozone dose above a threshold of 1.0 nmol m−2 s−1 (POD1SPEC), was estimated for European forest tree plant functional types for the years 2008–2012. These POD1SPEC estimates were based on ozone concentrations simulated with the EMEP CTM model in combination with stomatal ozone uptake estimated with the DO3SE (Deposition of Ozone for Stomatal Exchange) model. To consider the impacts of ozone on forest growth rates, POD1SPEC-based dose–response relationships were constructed based on results from multi-year experiments with young trees generated within the framework of the UNECE LRTAP Convention. Official information on forest gross growth rates and on natural and harvest removals for different European countries for the years 2008–2012 was used to estimate annual changes in forest living biomass carbon (C) stocks due to ozone. This was achieved using two different scenarios: with and without the negative impacts of ozone on forest gross growth rates, estimated using the POD1SPEC-based dose–response relationships as they relate to impacts. Results provided an estimate of the annual gap between forest gross growth and the total removals, i.e. the annual forest stock changes, both for current levels of ozone and their associated impacts and in the absence of ozone. Estimates were made by collating species-specific information into broad European coniferous and deciduous forest types for consistency with forest statistics. The default IPCC methodology was used to convert estimates of the impacts of ozone on the annual changes in forest living-biomass C stocks. The results showed that the critical level for negative ozone impacts on forests as suggested by the UNECE LRTAP Convention, based on POD1SPEC, was exceeded in large parts of Europe during 2008–2012, except in inland areas in the Mediterranean and in small parts of continental Europe and the Fennoscandian mountain range. The highest POD1SPEC was estimated for the coastal regions of mid-latitude Europe, including the UK and extending northwards to the middle of Sweden, the south of Norway, and Finland. To the south, lower values for POD1SPEC were estimated for most of the Iberian Peninsula and parts of the Mediterranean coastal regions. It was estimated that reduced ozone exposure, similarly to pre-industrial conditions, would increase European forest stem volume growth rates by 9 %, but this would increase European forest annual net changes in standing stocks by 28 %. The difference in gross forest stem volume growth with and without ozone impacts was relatively similar in, for example, Germany and France. However, since the gap between gross growth and total removals was much smaller for Germany, the enhanced growth in the absence of ozone had a much larger relative impact on the forest standing stock changes in Germany compared to in France. Summarized for all European forests, the C sequestration to the living-biomass C stock was estimated to increase by 31 % in the absence of ozone exposure. A thorough review of the literature resulted in the conclusion that mature trees under field conditions cannot be assumed to be less sensitive to ozone exposure compared to young trees under experimental conditions, strongly suggesting that these results are credible for European forest stands of different age classes.
- Article
(4747 KB) - Full-text XML
-
Supplement
(1816 KB) - BibTeX
- EndNote


Forests are important for cost-effective, land-based climate mitigation (Griscom et al., 2017; Roe et al., 2021), including carbon (C) sequestration by the increases in the forest ecosystem C stocks (Pan et al., 2011). Furthermore, long-lived biogenic raw materials produced by forests can store C in harvested wood products and substitute for the use of fossil-based materials (Sathre and Gustavsson, 2009; Jasinevičius et al., 2015; Gustavsson et al., 2017). The yearly net C sink in global forest ecosystems has been estimated to be 4000 Mt CO (Pan et al., 2011), of which approximately 80 % is stored in the living-biomass C stocks. In this capacity, the importance of European forests has been clearly demonstrated (Hyyrynen et al., 2023; Korosuo et al., 2023). European forests are likely to absorb ∼ 10 % of all European anthropogenic CO2 emissions (Janssens et al., 2003). The C stocks in European forests' aboveground and belowground biomass are on the order of 48 000 Mt CO, and this has been estimated to have increased annually over the time period of 2010–2020 by 560 Mt CO, i.e. by 1.4 % annually (Forest Europe, 2020).
Forest growth rates in many European countries are primarily determined by forest management (Etzold et al., 2020). In general, forests that are actively managed sequester C in the forest ecosystem carbon stocks at higher rates than non-managed forests (Nabuurs et al., 1997). To a large extent, the C sequestration of managed forests depends on the balance between forest growth and removals, including harvests and natural losses (Soimakallio et al., 2021). Any measures that increase the productivity of temperate or boreal forest are likely to increase the forest C sequestration.
Forest growth rates are also affected by environmental conditions such as meteorological variables and air pollutants. Tropospheric ozone (O3) is an air pollutant that has been found to cause losses to tree biomass (Emberson, 2020). O3 impacts on vegetation are estimated based on the accumulated amounts of O3 that is taken up to the leaf interior through the stomata during the vegetation season, i.e. the phytotoxic ozone dose (POD) (Mills et al., 2011). Experimental studies fumigating young trees with O3 for up to 10 years have been conducted across Europe for different tree species (Karlsson et al., 2007; Wittig et al., 2009). These experimental studies have been used within the UNECE Convention on Long-Range Transboundary Air Pollution (LRTAP) to develop POD-based dose–response relationships that can be used to identify areas across Europe where losses in whole-tree biomass may occur due to elevated O3 concentrations (LRTAP, 2017). Critical levels for forest trees were set to prevent an annual biomass loss under experimental conditions exceeding between 2 % (coniferous forests) and 4 % (deciduous forests), based on aboveground or whole-tree biomass. Maps of ozone uptake and exceedance of POD critical levels (Simpson et al., 2007, 2022; Franz et al., 2017) show where forests might be at risk of damage due to O3 pollution. Identifying areas of such critical-level exceedance can been used within LRTAP to apply an effect-based emission reduction policy (Emberson, 2020).
It is important to estimate actual O3 impacts on forest trees under ambient O3 pollution concentrations since this would allow for the assessment of O3 impacts on forest health (Marzuoli et al., 2019), productivity (Karlsson et al., 2005), and C sequestration rates, with the latter becoming increasingly more important as nature-based solutions are promoted across Europe to increase climate resilience (Calliari et al., 2022). Due to the multi-year lifetime of forest trees, O3 impact studies involve a time component over which effect estimates are integrated. Many O3 impact studies for trees report only the percent reduction in biomass caused by O3 at the end of the experiment, and information on the biomass at the start of the experimental fumigation with O3 is often not provided. As a result, impacts on tree growth rates cannot be calculated directly. The significance of this problem increases at low growth rates in relation to the size of the O3 effect (Karlsson, 2012). Information about O3 impacts on forest growth rates is necessary for relevant assessments of long-term impacts of O3 on forest growth and C sequestration (Korosuo et al., 2023). The use of the whole-tree biomass POD-based dose–response relationship can then be applied for assessments of long-term impacts of O3 on forest C sequestration in combination with methods (such as forest growth models) that are able to simulate O3 effects on growth rates in a complex forest environment (Sitch et al., 2007; Franz et al., 2018; Subramanian et al., 2015; Otu-Larbi et al., 2020).
The first phase of the Tropospheric Ozone Assessment Report (TOAR; https://igacproject.org/activities/TOAR/TOAR-I, last access: 15 May 2025) built the world's largest database of O3 metrics to identify the global distribution of the pollutant and trends in O3 concentrations over time. The second phase of TOAR (https://igacproject.org/activities/TOAR/TOAR-II, last access: 15 May 2025), to which this paper contributes, has a broader scope, with the aim being to investigate the impact of tropospheric O3 on human health and vegetation. The present work will address these goals by assessing the effects of ozone on C sequestration in forest living biomass. Hence, in this study, we re-analyse existing whole-tree biomass POD-based dose–response relationships based on multi-year experiments with young trees to provide estimates of O3 impacts on the tree growth rates and changes in the forest living-biomass C stocks. Consequently, O3 impacts on European forest gross growth rates can be estimated using the LRTAP experimental information (LRTAP, 2017) in combination with readily available forest statistic information describing annual increments in forest stocks (Forest Europe, 2020; UNECE, 2020).
The overall aim of this study was to apply LRTAP air quality guidelines to estimate the impacts of the present O3 exposure, based on POD, on the C sequestration to the living-biomass C stocks of Europe's managed forests. This aim was achieved by addressing the following research questions:
-
How does POD vary spatially for key coniferous and deciduous forest tree species and functional types across Europe?
-
How can O3 dose–response relationships for biomass reduction be converted into growth rate relationships for key European forest tree species and forest plant functional types?
-
How can impacts of O3 exposure on the C sequestration of living-biomass C stocks of forests be estimated based on the difference between forest gross growth rates and total removals, with the latter including both harvests and natural losses?
-
What is the magnitude of the negative impacts of present O3 exposure on the C sequestration of the living-biomass C stocks in forests, aggregated at both the European and national levels?
2.1 Overview of methods
In Fig. 1, it is shown how datasets and models are integrated and used to quantify the effect of O3 on changes in annual living-biomass C stock increments (Mt CO yr−1) of managed forests across Europe. Gridded surface meteorological data and O3 concentration data at ca. 50 m height (assumed to be the top of the atmospheric surface or the constant flux layer; cf. Stull ,1988) for Europe were provided by the EMEP MSC-W chemical transport model (CTM) (Simpson et al., 2007, 2012). Version rv4.35 of the EMEP model (Simpson et al., 2022), as used here, is driven by 3-hourly meteorological data from the European Centre for Medium Range Weather Forecasts Integrated Forecasting System (ECMWF-IFS, https://www.ecmwf.int/en/research/modelling-and-prediction). These meteorological data are interpolated to an hourly resolution inside the EMEP model, and variables such as cloud cover and vapour pressure deficit (VPD) are calculated. Anthropogenic emission data for the EMEP model are predominantly derived from official national estimates (Matthews et al., 2020), and biogenic emissions (isoprene, terpenes, etc.) are calculated as in Simpson et al. (2012). These calculations used 20 vertical layers, and O3 data from the lowest vertical layer (which approximates to an average height of 50 m above the surface) were used in this study. For consistency with the land cover mapping data used in this project (Cinderby et al., 2007), all data were provided at a horizontal resolution of ∼ 50 × 50 km2 on the polar stereographic, which was used until 2016 by EMEP (https://www.emep.int/mscw/emep_grid.html, last access: 15 May 2025).
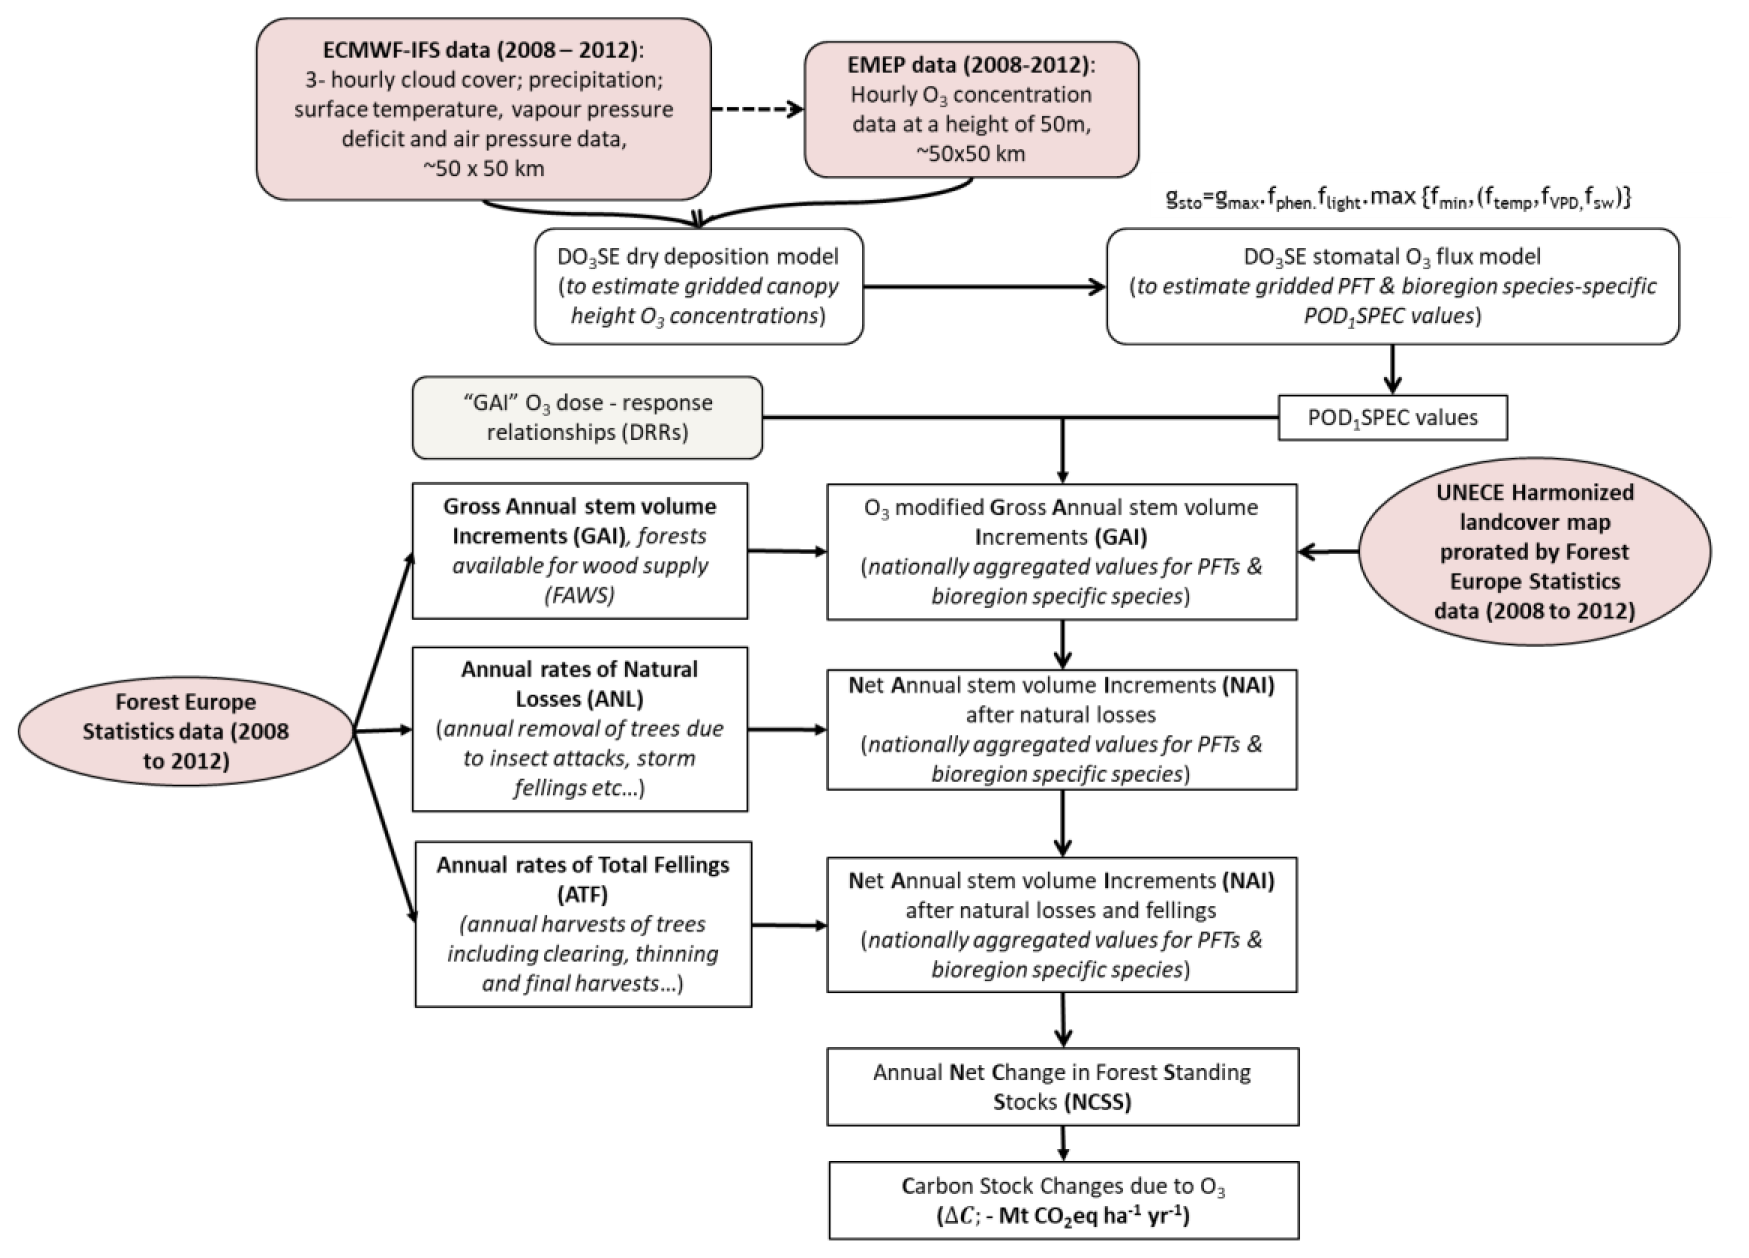
Figure 1Overview of the datasets and methods used to estimate the influence of O3 on forest annual living-biomass C stock increments (Mt CO yr−1) for the time period 2008–2012. A negative sign was used for the removal of CO2 from the atmosphere into the living-biomass carbon stocks.
The DO3SE (Deposition of Ozone for Stomatal Exchange; Emberson et al., 2000, 2007; Büker et al., 2012, 2015) dry deposition model estimates gridded O3 concentrations down to the forest canopy height. From this, the stomatal O3 flux values, i.e. the POD1SPEC (phytotoxic ozone dose above a threshold of 1 nmol m−2 projected leaf area s−1 for specific tree species) metric recommended to assess O3 risk to forests by the UNECE Mapping Manual (LRTAP, 2017), are calculated using the multiplicative stomatal conductance module, parameterized for bioregion-specific species (determined according to the biogeographic regions of Europe (EEA, 2016) and plant functional types (PFTs)). POD1SPEC values are used with gross annual stem volume increment (GAI) dose–response relationships (DRRs) to estimate the effect of O3 on GAI. These grid-level estimates are aggregated to the national level using forest coverage data from the UNECE harmonized land cover map (Cinderby et al., 2007), scaled according to the mean 2008 to 2012 estimates of the total forest cover (Forest Europe, 2020; UNECE, 2020). This results in country-level estimates of GAI with and without O3 pollution. Country-level GAI values are converted to net annual stem volume increment (NAI) values by allowing for forest removals by both natural causes and fellings. Country values for annual net change in forest standing stocks (NCSSs), both with and without O3 pollution, are converted into changes in living-biomass C stocks using the default methodologies of the IPCC (Penman et al., 2003), which include both aboveground and belowground living biomass. This allows the effect of O3 on annual C sequestration in the living biomass of managed European forests to be estimated.
2.2 Calculating POD1SPEC
The DO3SE deposition model was used in an offline mode to calculate total deposition of O3. This allows the O3 concentration at the top of the forest canopy (i.e. at the interface between the atmosphere and the canopy-influenced boundary layer) to be estimated for the different forest types across Europe. This offline calculation uses the DO3SE stomatal flux model parameterizations provided in Table S1 in the Supplement to estimate the stomatal and non-stomatal deposition sink for O3 from which the canopy height O3 concentration c(z1) (in nmol m−3) at height z1(m) can be calculated as described in Eq. (1):
where c(zRef) is the concentration of O3 at ca. 50 m, assumed to represent the top of the surface layer in the EMEP model; Ra(zRef, z1) is the atmospheric resistance to O3 transfer between zRef and z1; and VgRef is the deposition velocity of the tree canopy. It is important to note that this “big-leaf” calculation of c(z1) makes use of big-leaf resistance and conductance terms, which differ from the leaf-level values used below (see Tuovinen and Simpson, 2008, for further discussion with regard to these distinctions).
We define stomatal O3 flux model parameterizations by species, bioregions, and PFTs since we know that stomatal O3 uptake by forest trees is dependent upon tree physiology, which varies by species and bioregion, with the latter often causing different physiology in the same species (LRTAP, 2017). We define nine bioregions across Europe using the map of biogeographic regions of Europe (EEA, 2016; see Table S2) and apply the appropriate stomatal conductance (gsto) model parameterization (Table S1) in the estimation of gsto following the components of Eq. (2) that are required for forest tree species as described in the UNECE Mapping Manual (LRTAP, 2017).
In the above, gsto is the actual stomatal conductance (mmol O3 m−2 PLA s−1, with PLA denoting projected leaf area), and gmax is the species-specific maximum gsto (mmol O3 m−2 PLA s−1); the parameters fphen, flight, ftemp, fVPD, fPAW, and fmin are all expressed in relative terms. fphen allows for the variation in gsto during the growing season, fmin defines a daytime minimum gsto, and the remaining factors represent the modifying influence of environmental variables (irradiance, temperature, atmospheric water vapour pressure deficit, and plant available soil water, respectively.
Stomatal conductance model parameterizations only exist for a limited number of forest tree species or PFTs, namely birch (Betula pendula), beech (Fagus sylvatica), Norway spruce (Picea abies), Scots pine (Pinus sylvatica), Aleppo pine (Pinus halepensis), temperate deciduous oak (Quercus robur), Mediterranean deciduous oak (Quercus faginea, Quercus pyrenaica and Quercus robur), and Mediterranean evergreen oak (Holm oak, Quercus ilex). Table S2 describes the combination of stomatal O3 flux parameterizations (to estimate the POD1SPEC values) and GAI DRRs (to estimate the damage caused by POD1SPEC that is used in each bioregion, along with the number of EMEP grids these bioregions cover). Table S2 shows that, for those bioregions that comprise > 100 EMEP grids, between 29 % and 85 % of forest area is represented by these specific species, with the remainder being classified as other deciduous, other coniferous, or mixed and represented by an appropriate species of that bioregion and forest type.
The stomatal O3 flux (Fst) of sunlit leaves or needles of the upper canopy can then be calculated for forests across Europe using Eq. (3):
where gsto is in m s−1, rb is the leaf quasi-laminar resistance, and rc is the leaf surface resistance; both rb and rc are given in s m−1. For further details on the resistance scheme, see the UNECE Mapping Manual (LRTAP, 2017).
The accumulated species-specific POD1SPEC (mmol O3 m2 PLA) was calculated according to Eq. (4) by summing modelled hourly Fst values (Fsti) over the smaller of either a 6-month period (1 April to 30 September) or a species-specific period defined by the forest latitude model (LRTAP, 2017).
In the above, Fsti is the hourly mean O3 flux in nmol O3 m−2 PLA s−1, and n is the number of hours within the accumulation period. The threshold of 1 nmol O3 m−2 PLA s−1 (Mills et al., 2011; LRTAP, 2017) represents the ability of plants to detoxify a certain amount of O3. POD1SPEC was calculated separately for coniferous and deciduous tree species and separately for scenarios with (fPAW) and without (NSW) the influence of the estimated soil water deficit (Büker et al., 2012).
2.3 Deriving POD1SPEC dose–response relationships for gross annual stem volume increment
POD1SPEC DRRs exist for a number of species and species groups and have been previously defined in Büker et al. (2015). The response parameter for these DRRs is a percentage reduction in total living biomass at the end of the experimental period, corrected for the number of experimental years. As described in the Introduction, this is not a suitable metric for us to estimate the impact on long-term forest growth rates. To overcome this issue, we re-analysed the existing DRRs, converting the response variable from the percentage reduction in total biomass to the percentage reduction in GAI. This was achieved by defining a standard sigmoidal growth function for tree biomass based on the Richards equation (Eq. 5) (Richards, 1959):
where y0, y1, and y2 are set to 1, 0.03, and 0.65 based on data collected for key European tree species from sites across Europe (Fellner and Rechberger, 2009; shown in Fig. S1 in the Supplement). This allows for the calculation of the tree biomass at the beginning of each O3 fumigation period (which usually starts when the tree is a few years old) and the GAI that would be expected each year until the end of the fumigation period. For each experiment, the O3 effect is estimated as the average percentage reduction in the annual growth rate of each O3 treatment vs. the control, assuming that the relative O3 effect on growth rate is constant, irrespective of the age of the tree or GAI.
The GAI DRR is estimated by combining the results of fumigation experiments conducted on a particular species or species group following the method of Fuhrer (1994). This estimates a regression for each individual experiment to define the biomass at zero O3 exposure. This is then used to scale the different treatment effects so that zero exposure is always associated with no effect at the individual experiment level. The percentage reductions in GAI for each experiment and treatment are pooled, and a linear regression is drawn through the data to give a species- or PFT-specific DRR.
The UNECE harmonized land cover map (Cinderby et al., 2007), which describes the coverage of individual forest tree species at a spatial scale of 1×1 km, is aggregated to the ∼ 50×50 km EMEP grid to provide an area weighting for each species and PFT across the EMEP modelling domain. This area weighting is scaled according to the national forest area coverage data from the Forest Europe statistics (Forest Europe, 2020; UNECE, 2020) to ensure that national total forest cover is consistent with the GAI data.
2.4 Estimating the influence of O3 on gross annual stem volume increments
The species- and PFT-specific DRRs are used to estimate the GAI under pre-industrial O3 concentrations (assumed to be constant at 10 ppb across the whole of Europe, after Volz and Kley (1988)) for each species and PFT in each grid. This allows for an estimate of the reduction in GAI due to the occurrence of O3 pollution for each grid, which is then scaled to provide a country-area-weighted value for coniferous and deciduous (broadleaf) PFTs scaled according to land cover.
2.5 Estimates of O3 impacts on European forest carbon sequestration
Forest statistics for European countries are available at the national level from the Forest Europe statistics (https://fra-data.fao.org/assessments/panEuropean/2020/FE/home/overview (last access: 15 May 2025), section “Increment and fellings, in forest available for wood supply”, indicator 3.1.). At the commencement of this study, information was available for forests at the national level for 5-year periods until the year 2010, which is based on mean values for the period 2008–2012. In most cases, information is presented separately for coniferous and broadleaf tree species. Hence, calculations of O3 impact on European forest C sequestration were made separately for each country and separately for coniferous and broadleaf tree species. The assessment thus considers the annual values for the time period of 2008–2012. Calculations were restricted to forests available for wood supply (FAWS). For most countries, the ratio of the area of total forest land to the area of FAWS did not exceed 1.3 (data not shown).
Annual net changes in forest standing stocks, i.e. the summed stem volumes of living trees, were calculated according to the scheme outlined in Fig. 2.
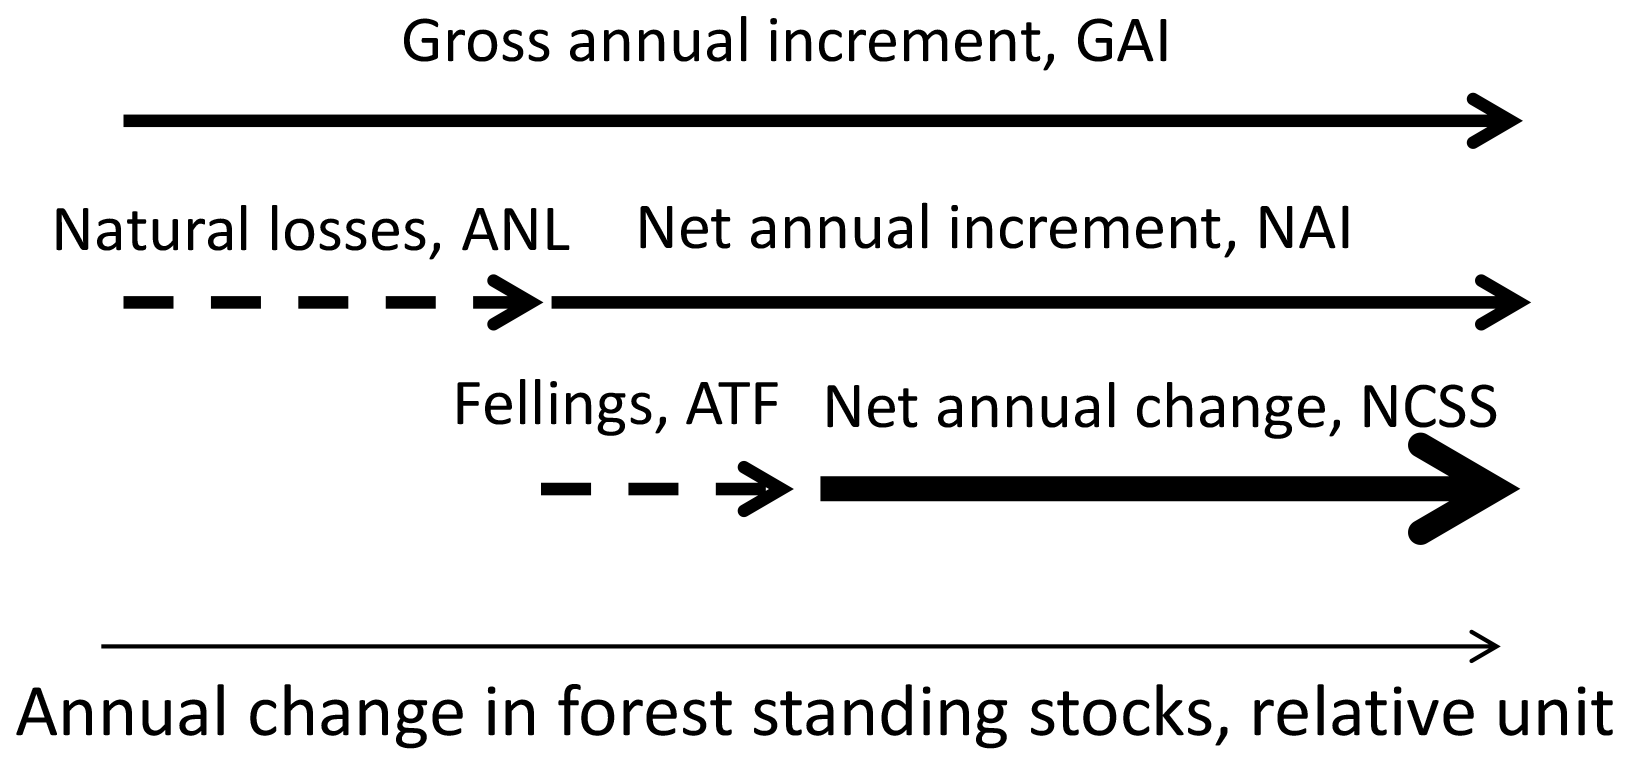
Figure 2An illustration of the scheme used to calculate the net changes in the forest standing stocks. Modified from Forest Europe (2020) and Korosuo et al. (2023). The arrow with the thickest line represents the final value calculated as the net forest standing stock change (NCSS).
The dependent variable for O3 impacts on net changes in forest C stocks was the GAI in FAWS. The annual rates of natural losses (ANLs) are subtracted from the GAI to give the net annual stem volume increment (NAI). It was assumed that O3 exposure does not have an impact on the ANL, mainly since there are, as far as we are aware, no published studies on O3 impacts on tree mortality. NAI is then subtracted from the annual rates of total fellings (ATFs), including fellings of both living and dead trees and also including harvest residues, i.e. all biomass that is removed from the FAWS. The resulting values will be the annual net change in forest standing stocks (NCSSs) in FAWS. Information was not available for all of the parameters listed above for all countries. Missing values were replaced based on the relations between the relevant parameters for nearby countries positioned within the same European forest region. The regions used were those used by Forest Europe (2020), i.e. northern Europe; central-western Europe; central-eastern Europe; southwestern Europe; southeastern Europe; and, finally, Russia, with neighbouring countries.
The forest statistics for different European countries only provide information on the GAI and natural and harvest removals of the total forests, together with information on the different areas of coniferous and broadleaf forests. Hence, the share of the GAI and natural and harvest removals between coniferous and broadleaf forests had to be assumed based on the differences in the forest areas. This assumption was tested and found to be relatively correct for Sweden, a country for which the relevant forest statistics were available separately for coniferous and broadleaf forests (data not shown).
The NCSS was converted into C stock changes as described in the IPCC's “Good Practice Guidance for Land Use, Land-Use Change and Forestry” (Penman et al., 2003).
In the above, ΔC represents C sequestration to tree living biomass (t C ha−1 yr−1; a negative sign is used for the removal of CO2 from the atmosphere to the living-biomass carbon stocks); Iv denotes yearly increment of timber volume (m3 ha−1 yr−1)); D denotes the density stem (t dry weight m−3); CF denotes the carbon fraction of dry matter (t t−1); BEF denotes the biomass expansion factor, which is converted between stem biomass and total living biomass aboveground; and R denotes the shoot root ratio. The value of ΔC was then converted into CO2 equivalents (CO) by multiplying with 3.67. The constants used in the present study are shown in Table 1.
Table 1Constants used for the conversion from changes in forest standing stock to changes in forest C stock based on the IPCC (Penman et al., 2003; Ågren et al., 2021).
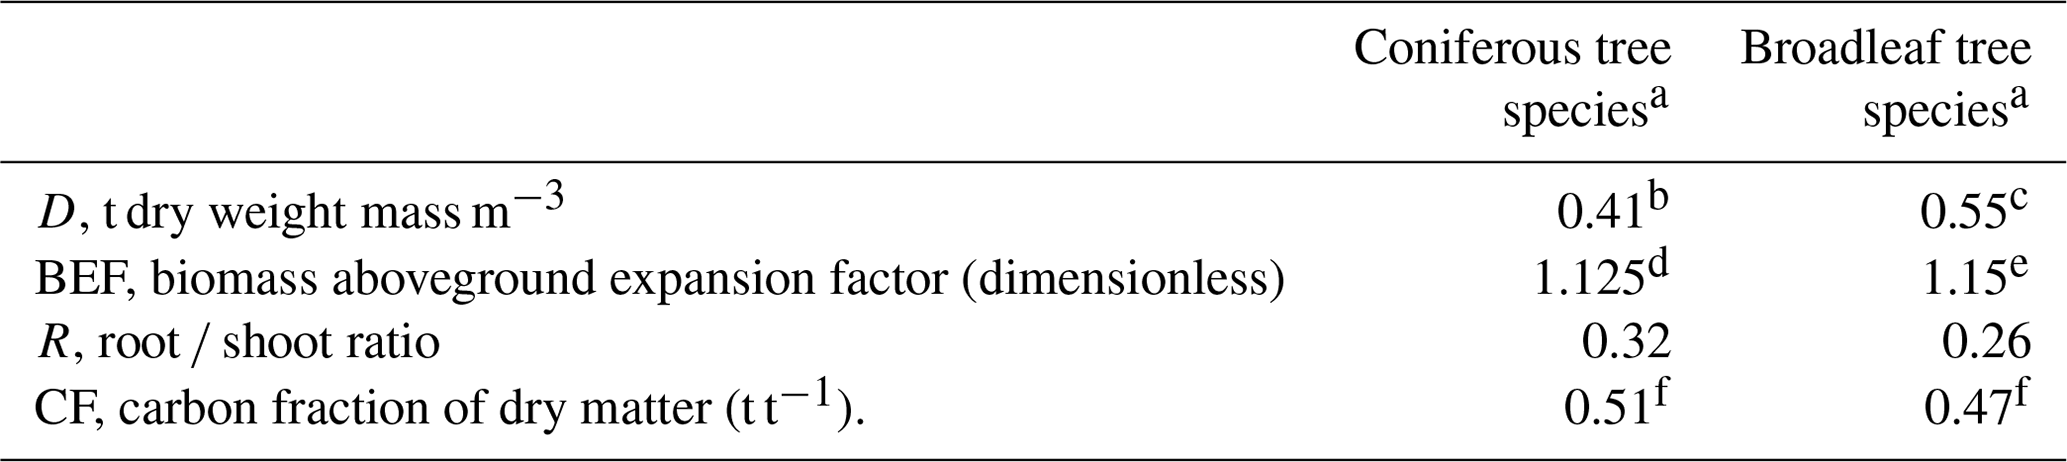
a Valid for forest stands with standing biomass of 50–150 t ha−1 for coniferous species and 75–150 t ha−1 for broadleaf species. b Mean value for Picea abies and Pinus sylvestris. c Mean value for Betula sp. and Fagus sylvatica. d Mean value for Picea abies and Pinus sylvestris in boreal and temperate forests. e Mean for broadleaf forests in boreal and temperate regions. f Ågren et al. (2021).
The spatial distribution of the estimated POD1SPEC (mmol O3 m−2 PLA) across Europe is shown in Fig. 3, separately for coniferous and deciduous tree species, as an average value for the years 2008 to 2012. To give an indication of the variation in POD1SPEC between years, the differences between the minimum and maximum POD1SPEC values across 2008 to 2012 for conifers and deciduous species are also shown.
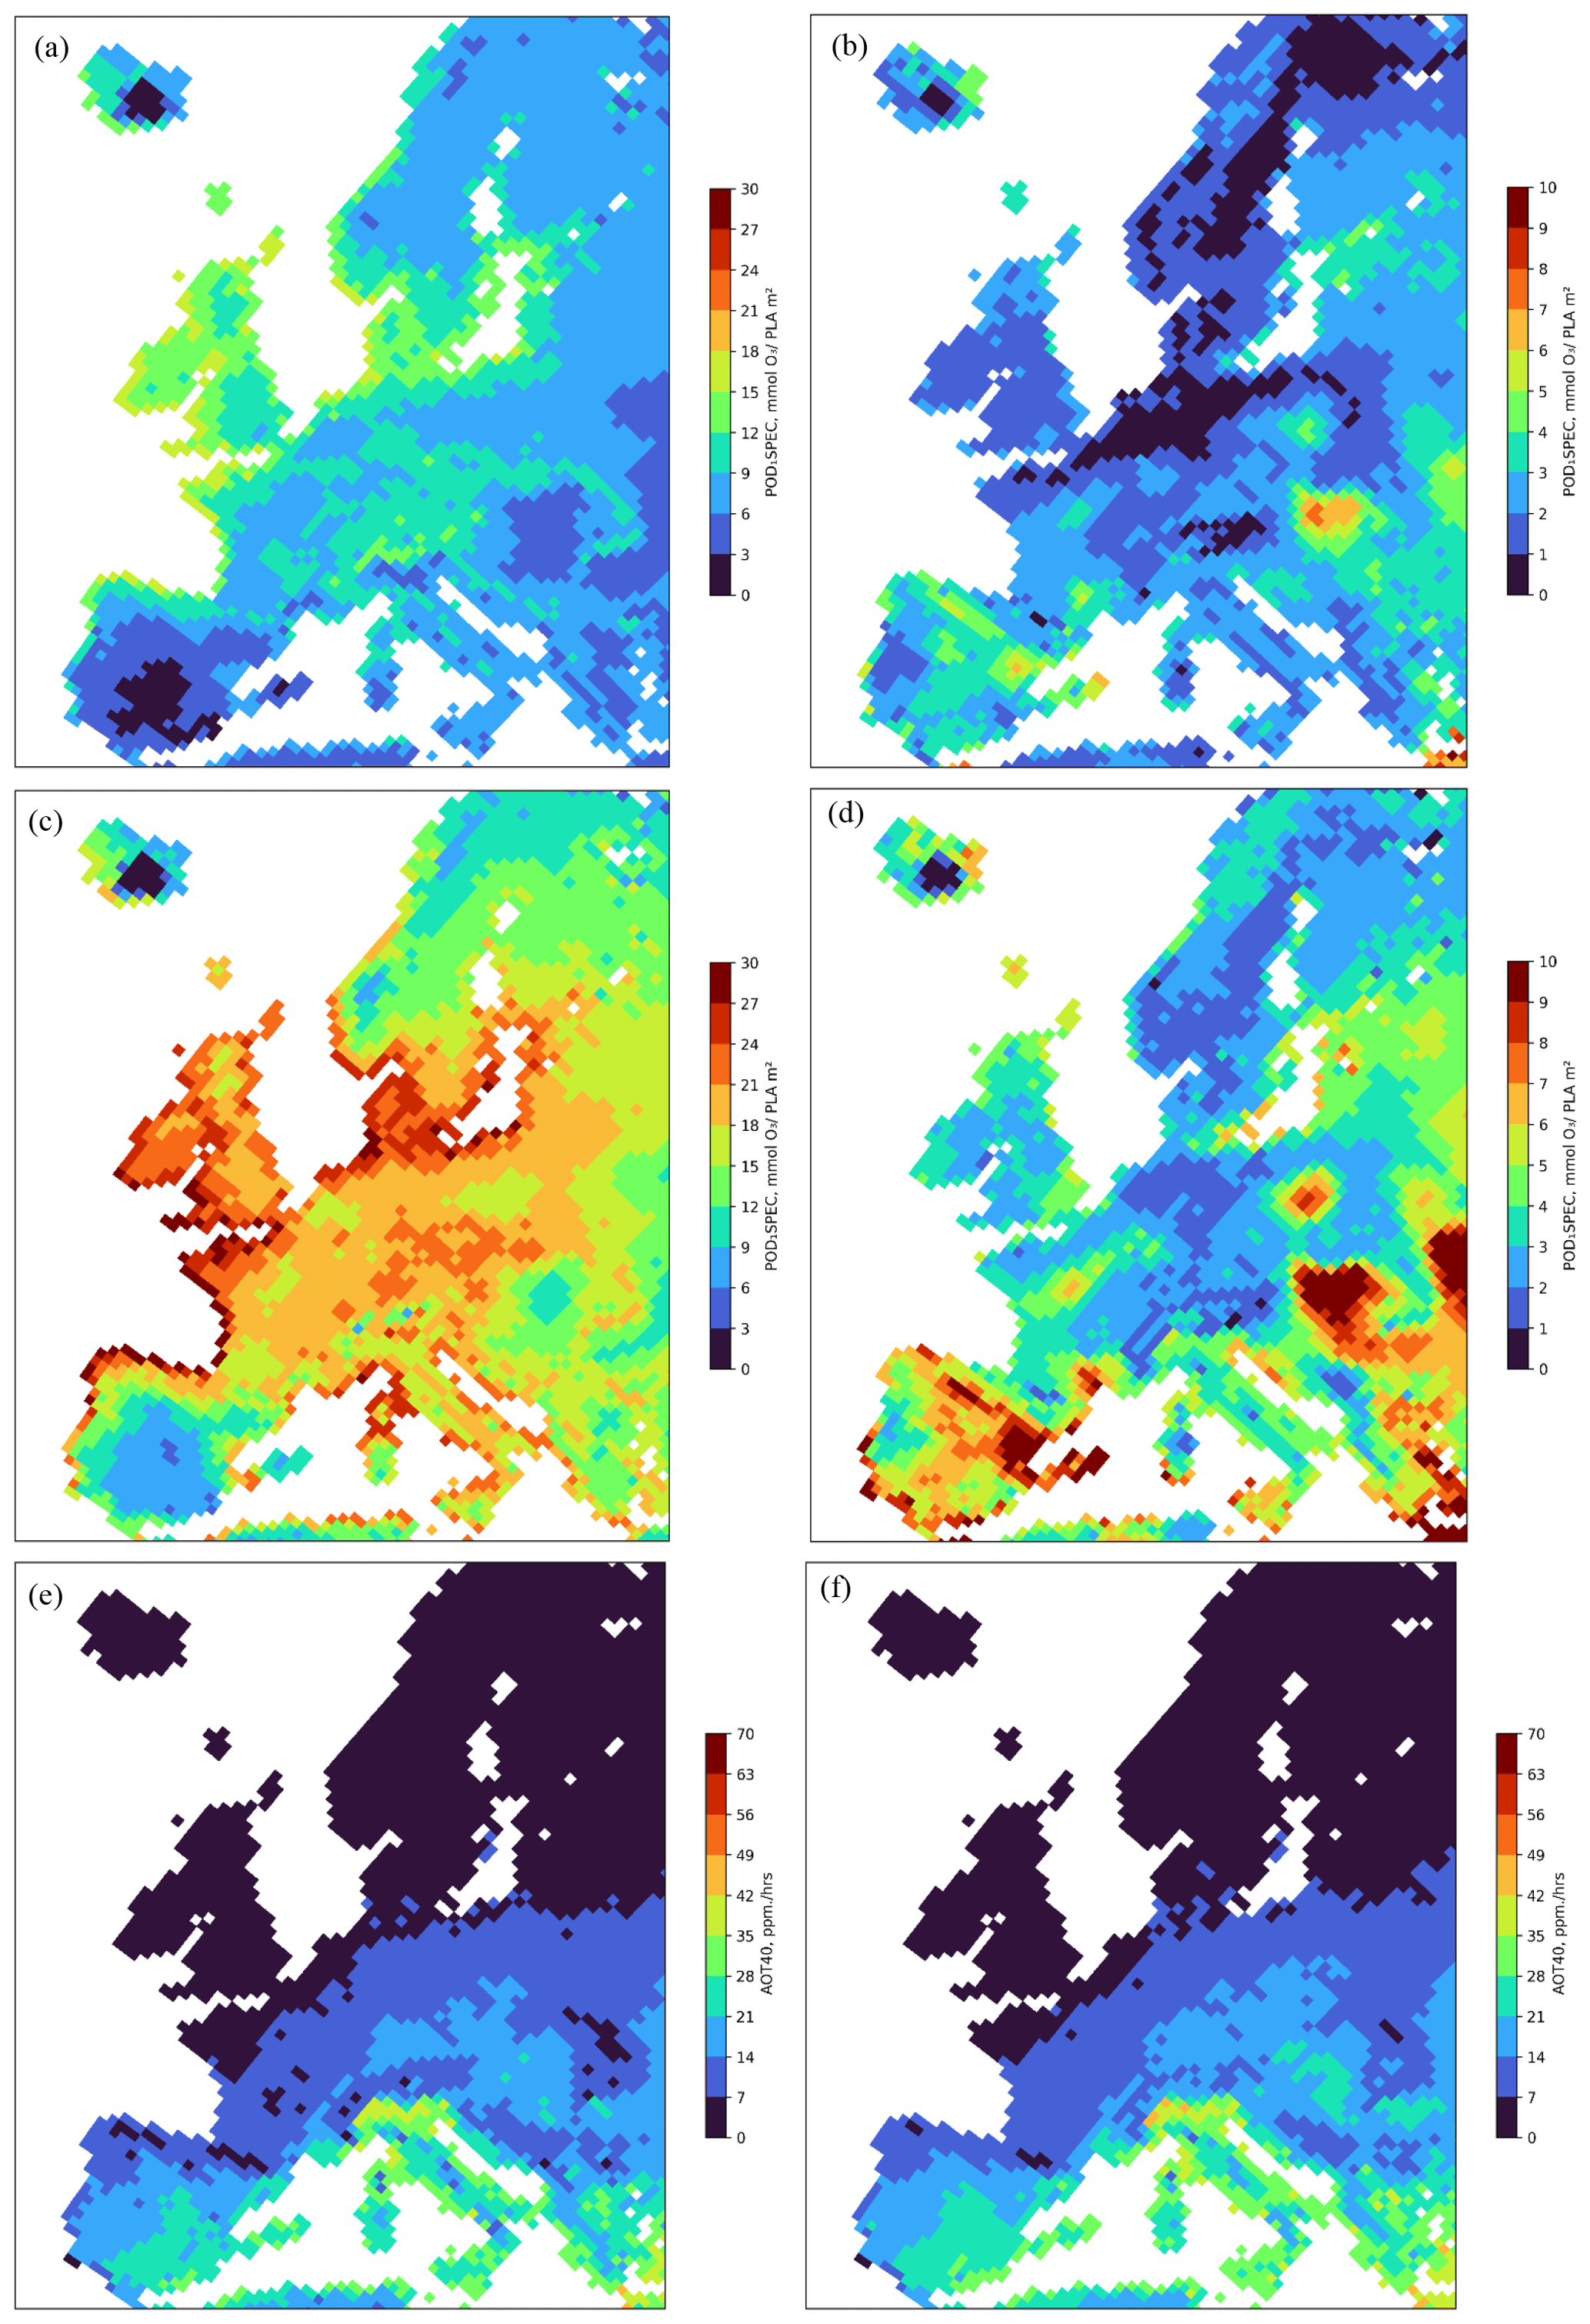
Figure 3The spatial distribution of the estimated POD1SPEC (mmol O3 m−2 PLA) across Europe accumulated during the growing season using the fPAW scenario, shown separately for coniferous (a) and broadleaf (c) tree species as annual mean values for the period 2008–2012 and as the difference in maximum and minimum POD1SPEC values across the years 2008–2012 (coniferous, b; broadleaf, d). Also shown is the mean annual value of AOT40 in ppm h for the period 2008–2012 and the continental central Europe (CCE) growing season of Norway spruce (e) and beech (f).
The highest POD1SPEC values were estimated for the coastal regions of mid-latitude Europe, including the UK, for both coniferous (12 to 18 mmol O3 (m2 PLA)−1) and broadleaf (21 to 30 mmol O3 (m2 PLA)−1) forests, extending as far as the middle of Sweden, southern Norway, and Finland. There were even high values estimated for the southern part of Iceland. To the south, lower values for POD1SPEC were estimated for most of the Iberian Peninsula and all of the Mediterranean coastal regions. There were also high values estimated for POD1SPEC in parts of the Alpine region and some surrounding regions of inland continental Europe (Fig. 3a, c). There were low values (0 to 9 mmol O3 (m2 PLA)−1) for both coniferous and broadleaf deciduous estimated, particularly for the inland of the Iberian Peninsula but also for the eastern parts of continental Europe and the Balkan region. For coniferous forests, there were also low values (around 6 to 9 mmol O3 (m2 PLA)−1) estimated for POD1SPEC for large parts of Italy. In general, POD1SPEC values were considerable higher (by almost 10 mmol O3 (m2 PLA)−1) for deciduous trees as compared to for coniferous trees (Fig. 3a, c). The interannual differences (Fig. 3b, d) are also greater for broadleaf deciduous trees (often reaching up to 10 mmol O3 (m2 PLA)−1) compared to for coniferous trees, with interannual variability over the 5 years of up to around 5 mmol O3 (m2 PLA)−1 only. These differences are not overtly driven by soil water stress as might be expected since the NSW model runs also show a similar magnitude of variability, albeit over a slightly reduced extent across Europe (see Fig. S2). Finally, it is clear from Fig. 3a, c, e, and f that the AOT40 metric has a very different spatial pattern, with a strong north to south gradient, identifying the highest values (over 28 ppm h) and, hence, the highest risk in the Mediterranean and middle to southern continental Europe.
Figure 4 gives an indication of which of growing season or key environmental variables (i.e. which of ftemp, fVPD, or fPAW) are most limiting with regard to POD1SPEC across Europe. The length of the growing season may cause a limitation in the northern latitudes when the growing-season length is below around 120 d (Fig. 4a); however, it is likely that temperature would also cause limitations outside of the growing season. This is clear since the function used to describe the temperature limitation of stomatal conductance (Fig. 4b) showed homogenously high values across most of Europe, except for the Alpine region and northern Fennoscandia, Scotland, and Iceland. The function used to describe the VPD limitation of stomatal conductance (Fig. 4c) showed a geographical variation that more closely resembled the pattern for the estimated POD1SPEC, with higher values for continental coastal regions and lower values for continental inland regions. The function used to describe the soil water deficit limitation of stomatal conductance, fPAW (Fig. 4d), showed low values only for the inland Iberian Peninsula.
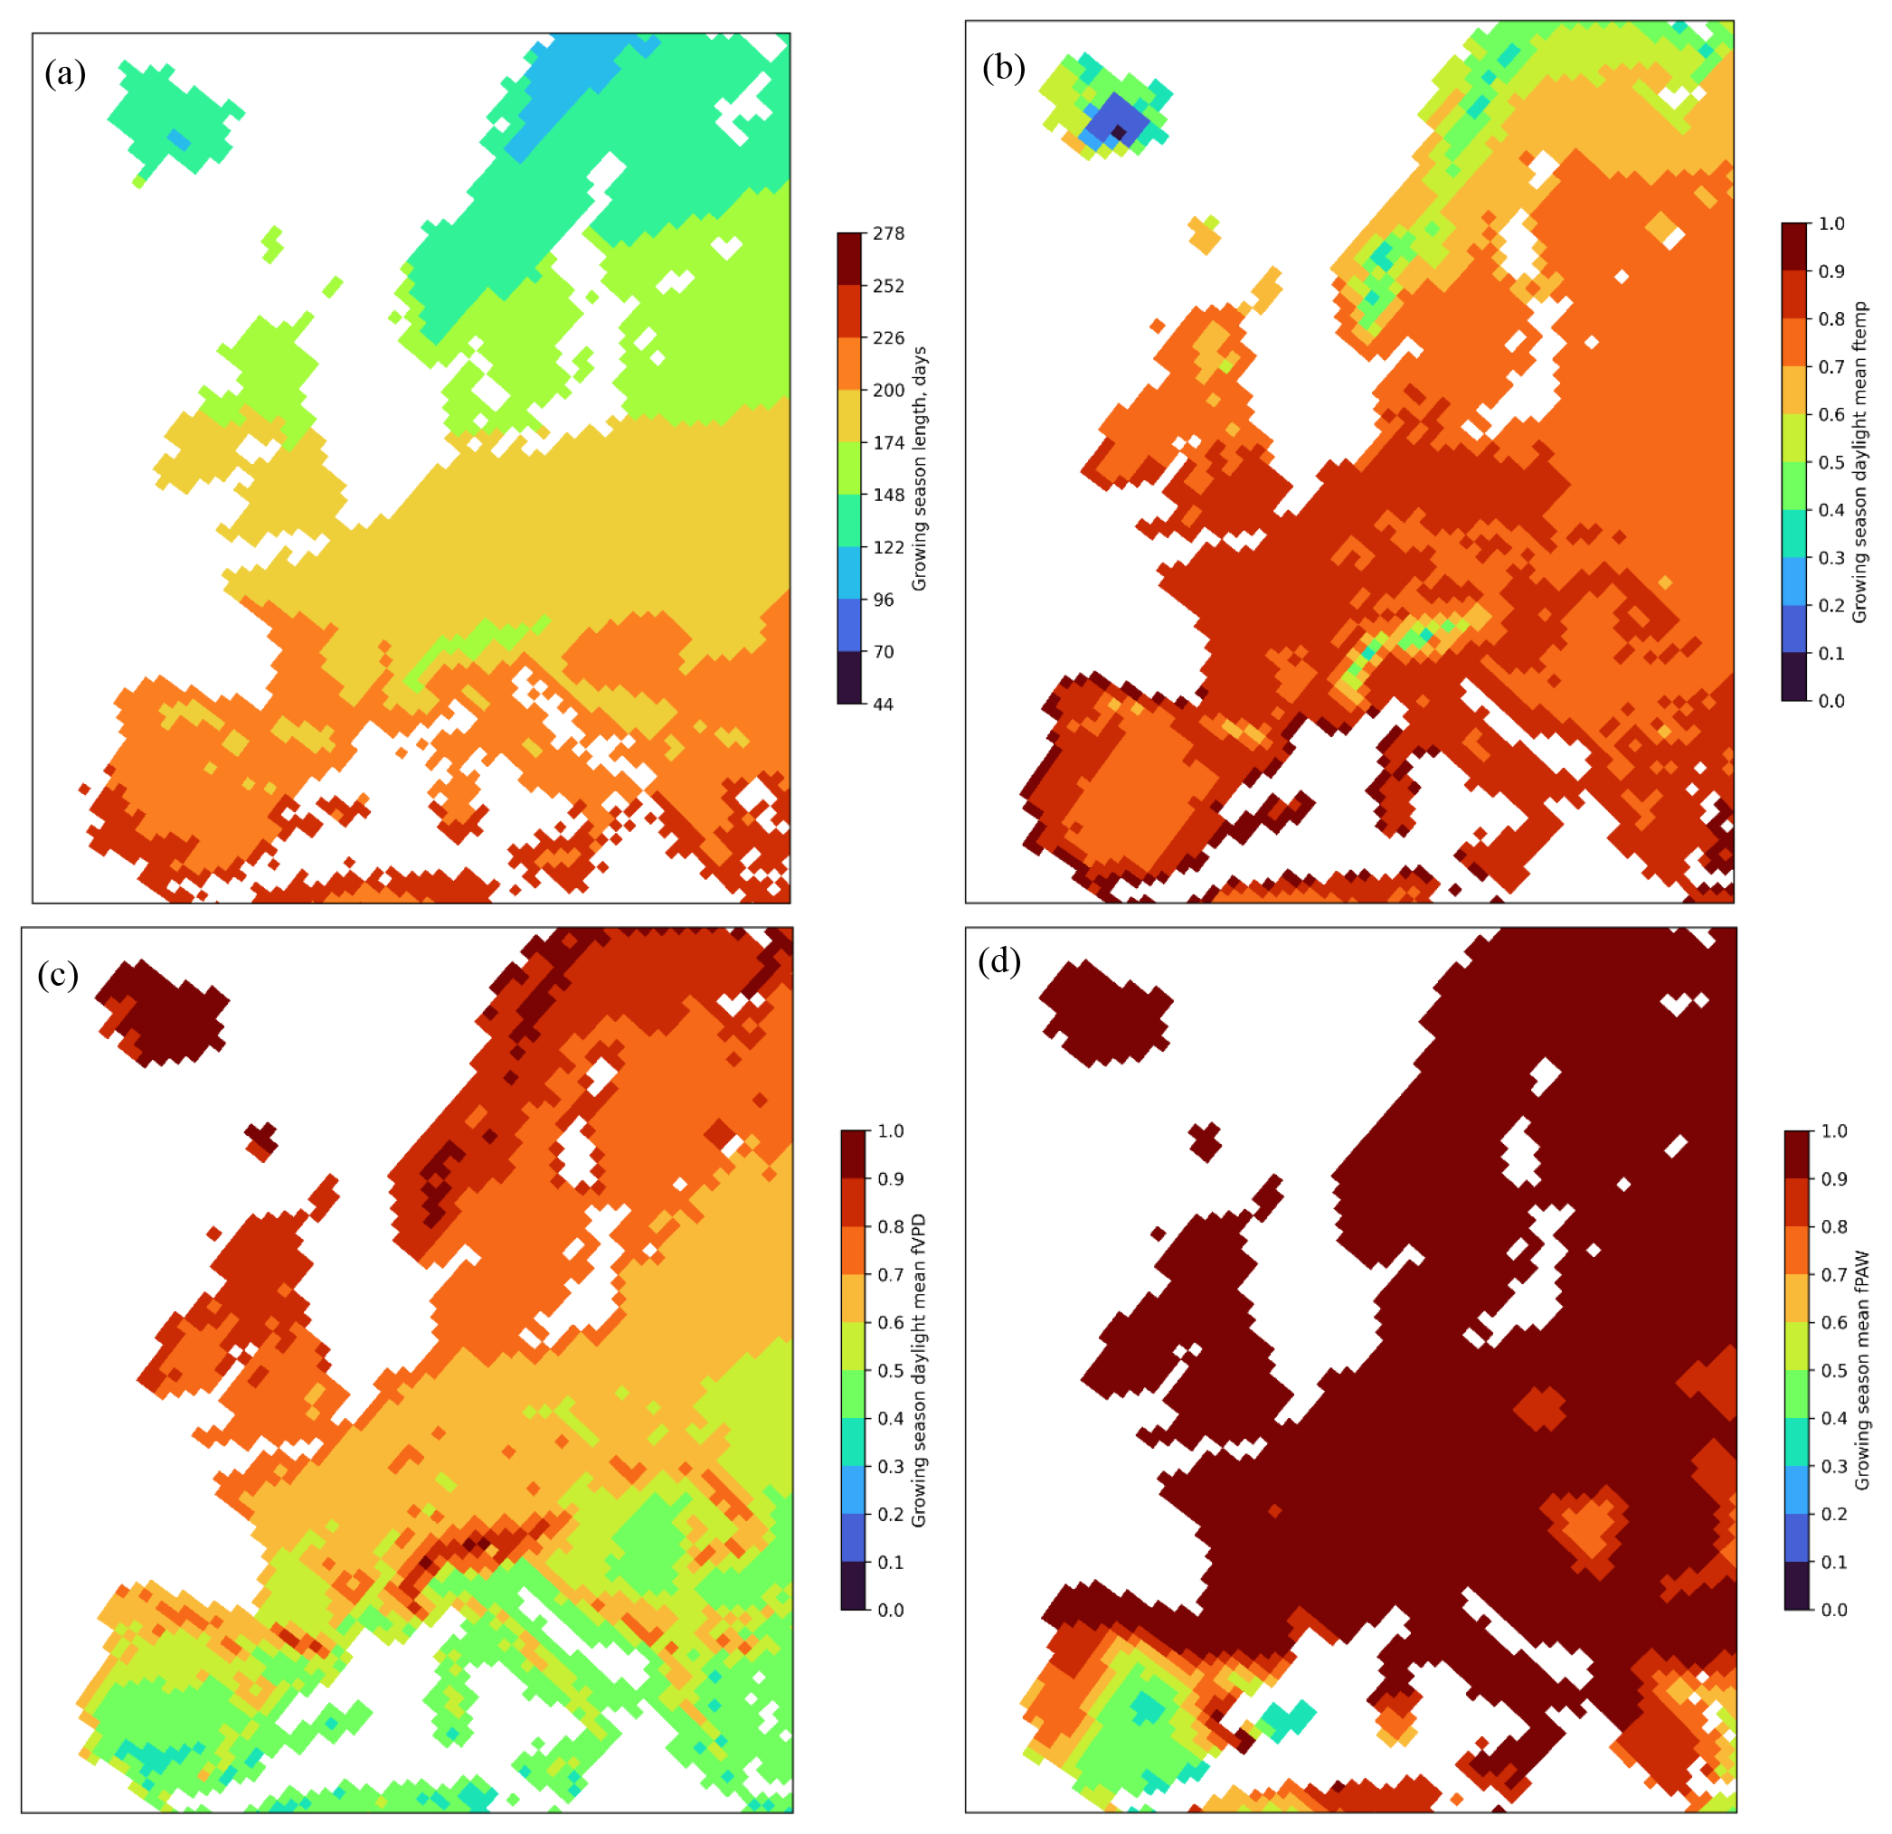
Figure 4The limits to POD1SPEC from each of the three key environmental variables of (a) growing-season length (in days) for broadleaf deciduous forests, (b) ftemp, (c) fVPD, and (d) fPAW), averaged over the growing season for all species and all years (2008–2012) across Europe. Grid values are mean values across all plant functional types for the growing season and for daylight hours only. Plots for individual species are given in the Supplement (Figs. S4–S6).
The GAI DRRs developed from the reanalysis of the experimental fumigation data are shown in Fig. 5b for coniferous species and in Fig. 5d for broadleaf deciduous species. The percentage reductions in whole-tree living biomass (taken from Büker et al. (2015)) are also shown (Fig. 5a for coniferous and Fig. 5c for broadleaf deciduous) for comparison. The GAI DRR regressions are given in Table S3. The GAI DRRs show small improvements in the statistical relationship of the regression between relative GAI and POD1SPEC, with R2 values of 0.69 and 0.47 for coniferous and broadleaf deciduous trees, respectively. The difference in the intercept at POD1SPEC is negligible between relative biomass and relative GAI, but the slope for the negative impacts was slightly more negative for the DRRs based on GAI growth rate reductions. These results suggest that the relative GAI DRRs are as robust as the relative biomass DRRs and, hence, are suitable for use in risk assessment.
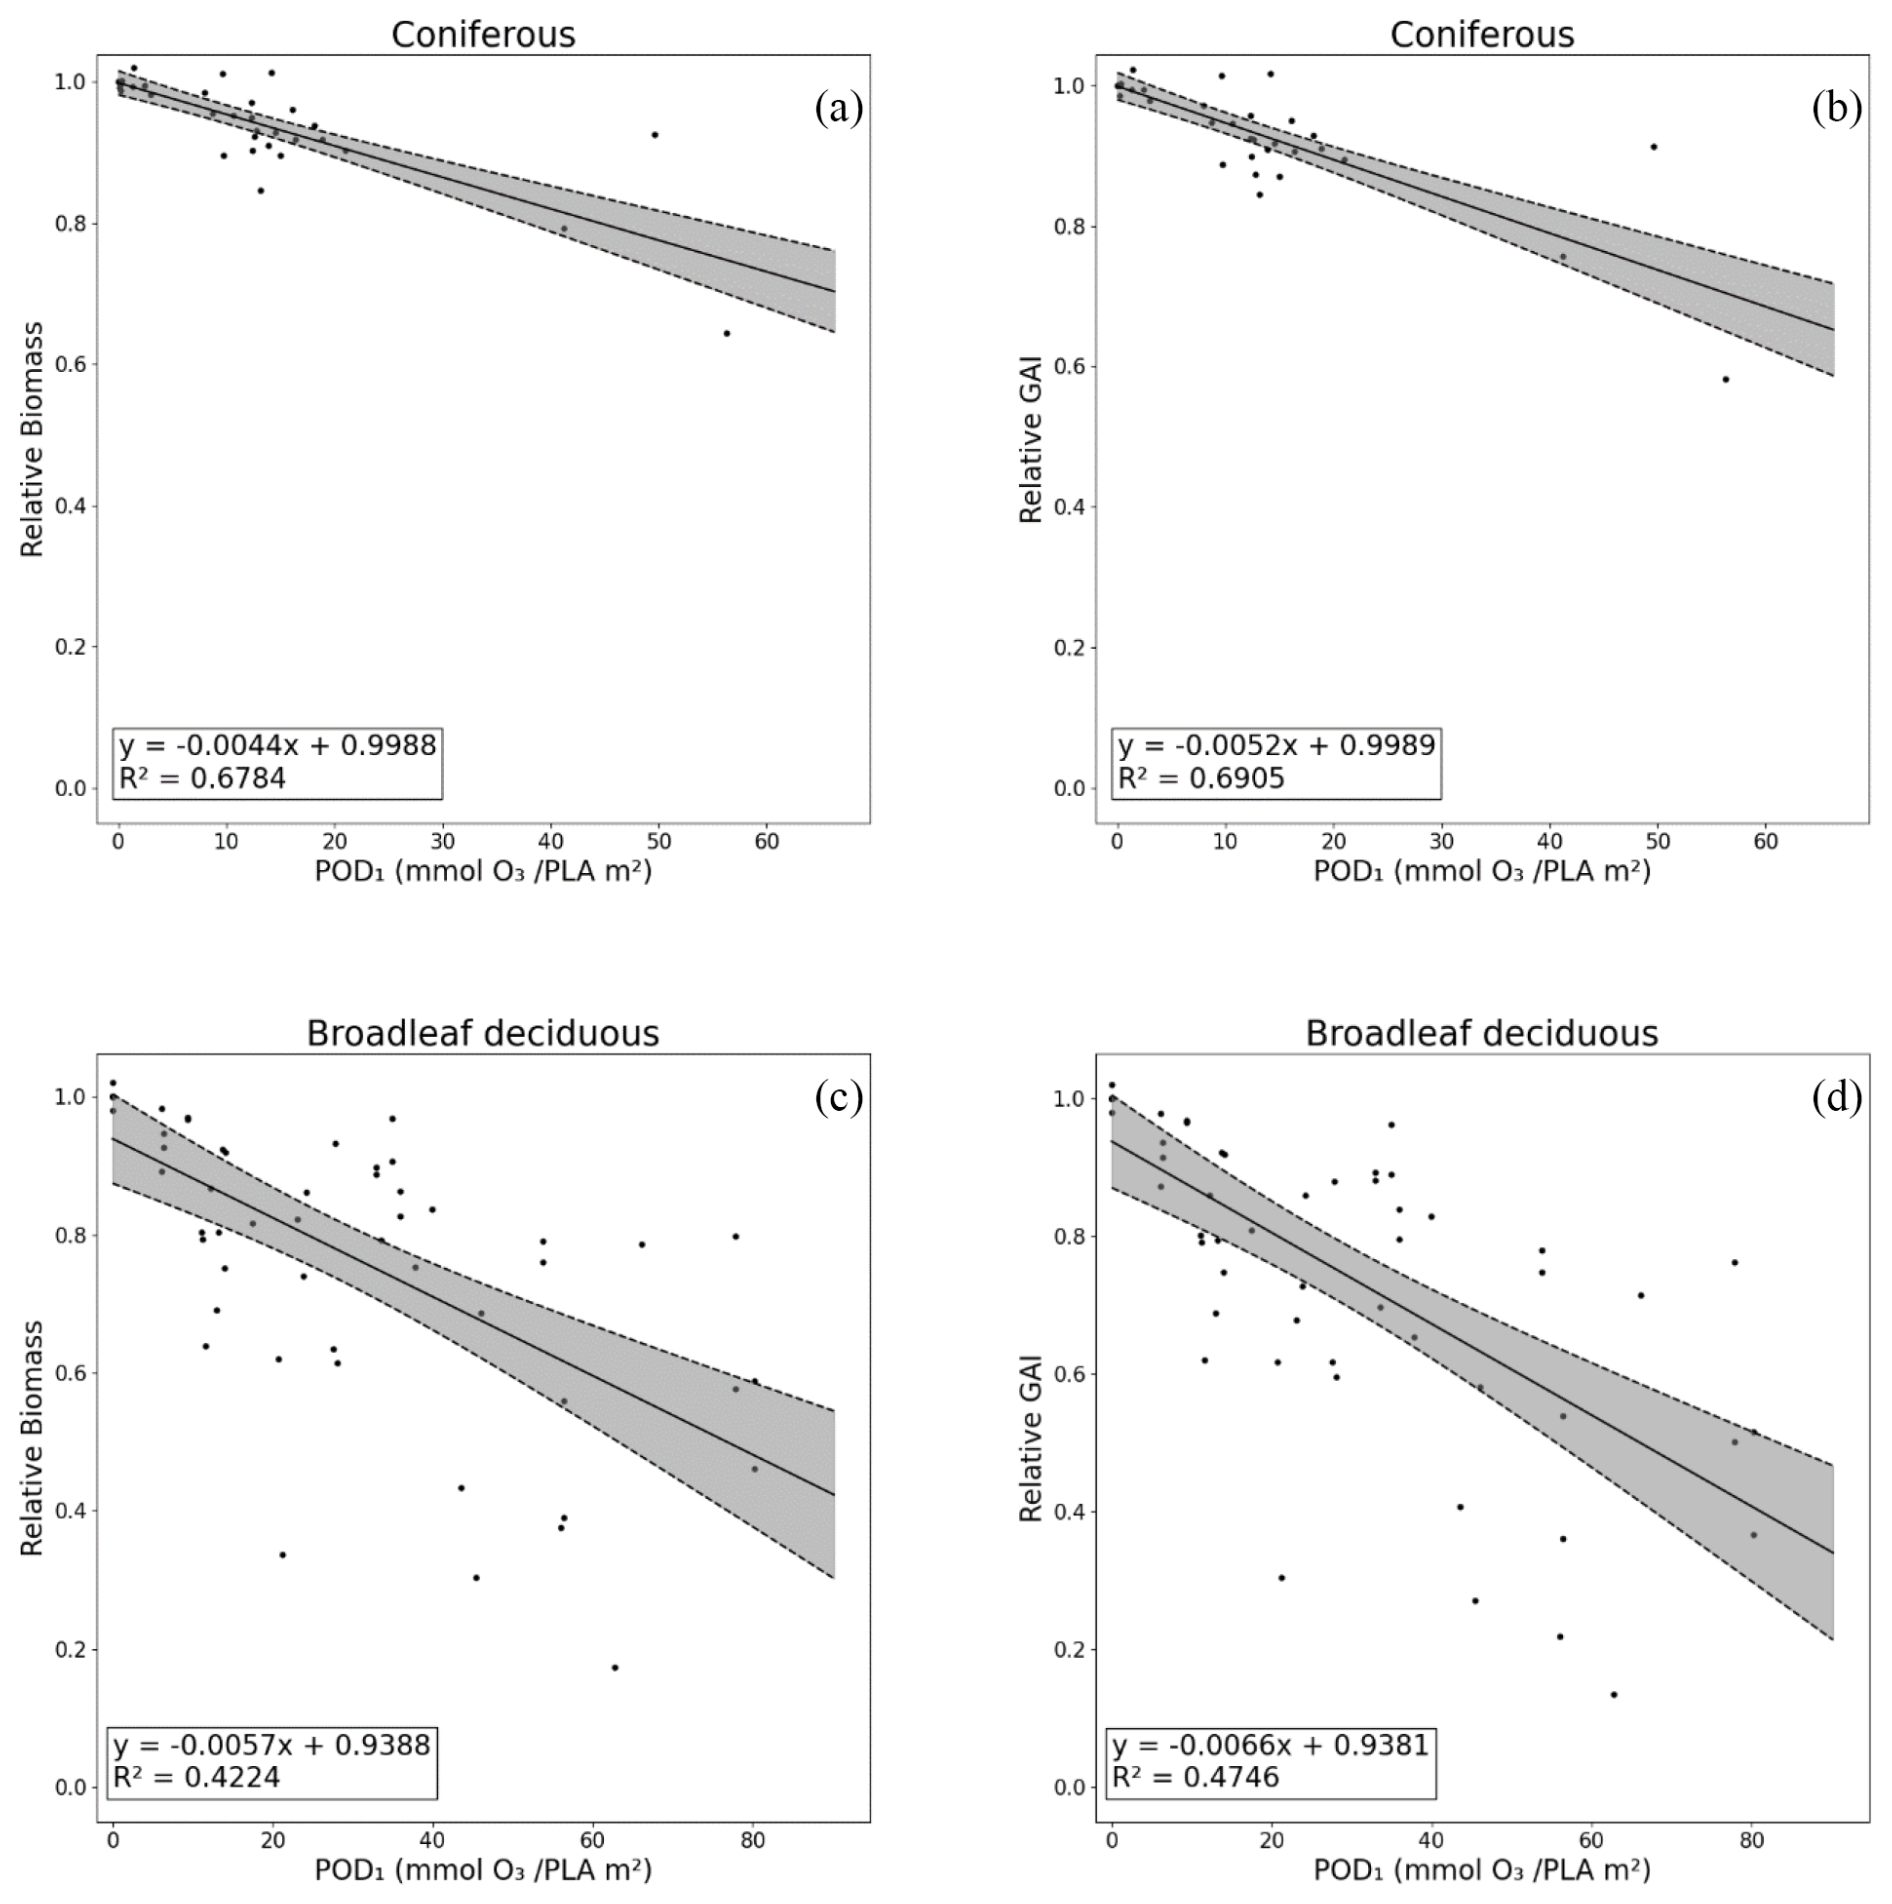
Figure 5Dose–response relationships (DRRs) based on POD1SPEC for assessments based on impacts on the percent annual biomass loss (relative biomass) (a, c) and the estimated impacts on gross annual increment (relative GAI) (b, d), shown separately for coniferous (a, b) and deciduous tree species (c, d). Other species and PFT dose–response relationships are given in the Supplement (Table S3 and Fig. S3).
The estimated values for the percent change in GAI, caused by the present O3 compared to the absence of O3 exposure, are shown in Table 2, calculated as mean values for the period of 2008–2012 and as mean values for different European countries. The reductions in GAI were calculated separately for coniferous and broadleaf deciduous tree species and separately for scenarios with (fPAW) and without (NSW) soil water deficits. The differences in reductions by O3 exposure estimated by the two different O3 scenarios – NSW and fPAW – were very small (Table 2). Hence, only results based on the scenario fPAW will be used in the following.
Table 2Percent reductions in gross annual increments (GAIs) caused by the present O3 exposure, calculated as mean values for POD1SPEC for the period of 2008–2012 and as mean values for the area of the different European countries. The estimated reduction in GAI was estimated based on O3 dose–response relationships relating to impacts on growth rates (GAI DRRs) based on country-wide mean values for POD1SPEC calculated separately for coniferous and deciduous tree species and separately for scenarios with (fPAW) and without (NSW) the functions for soil water deficit included.
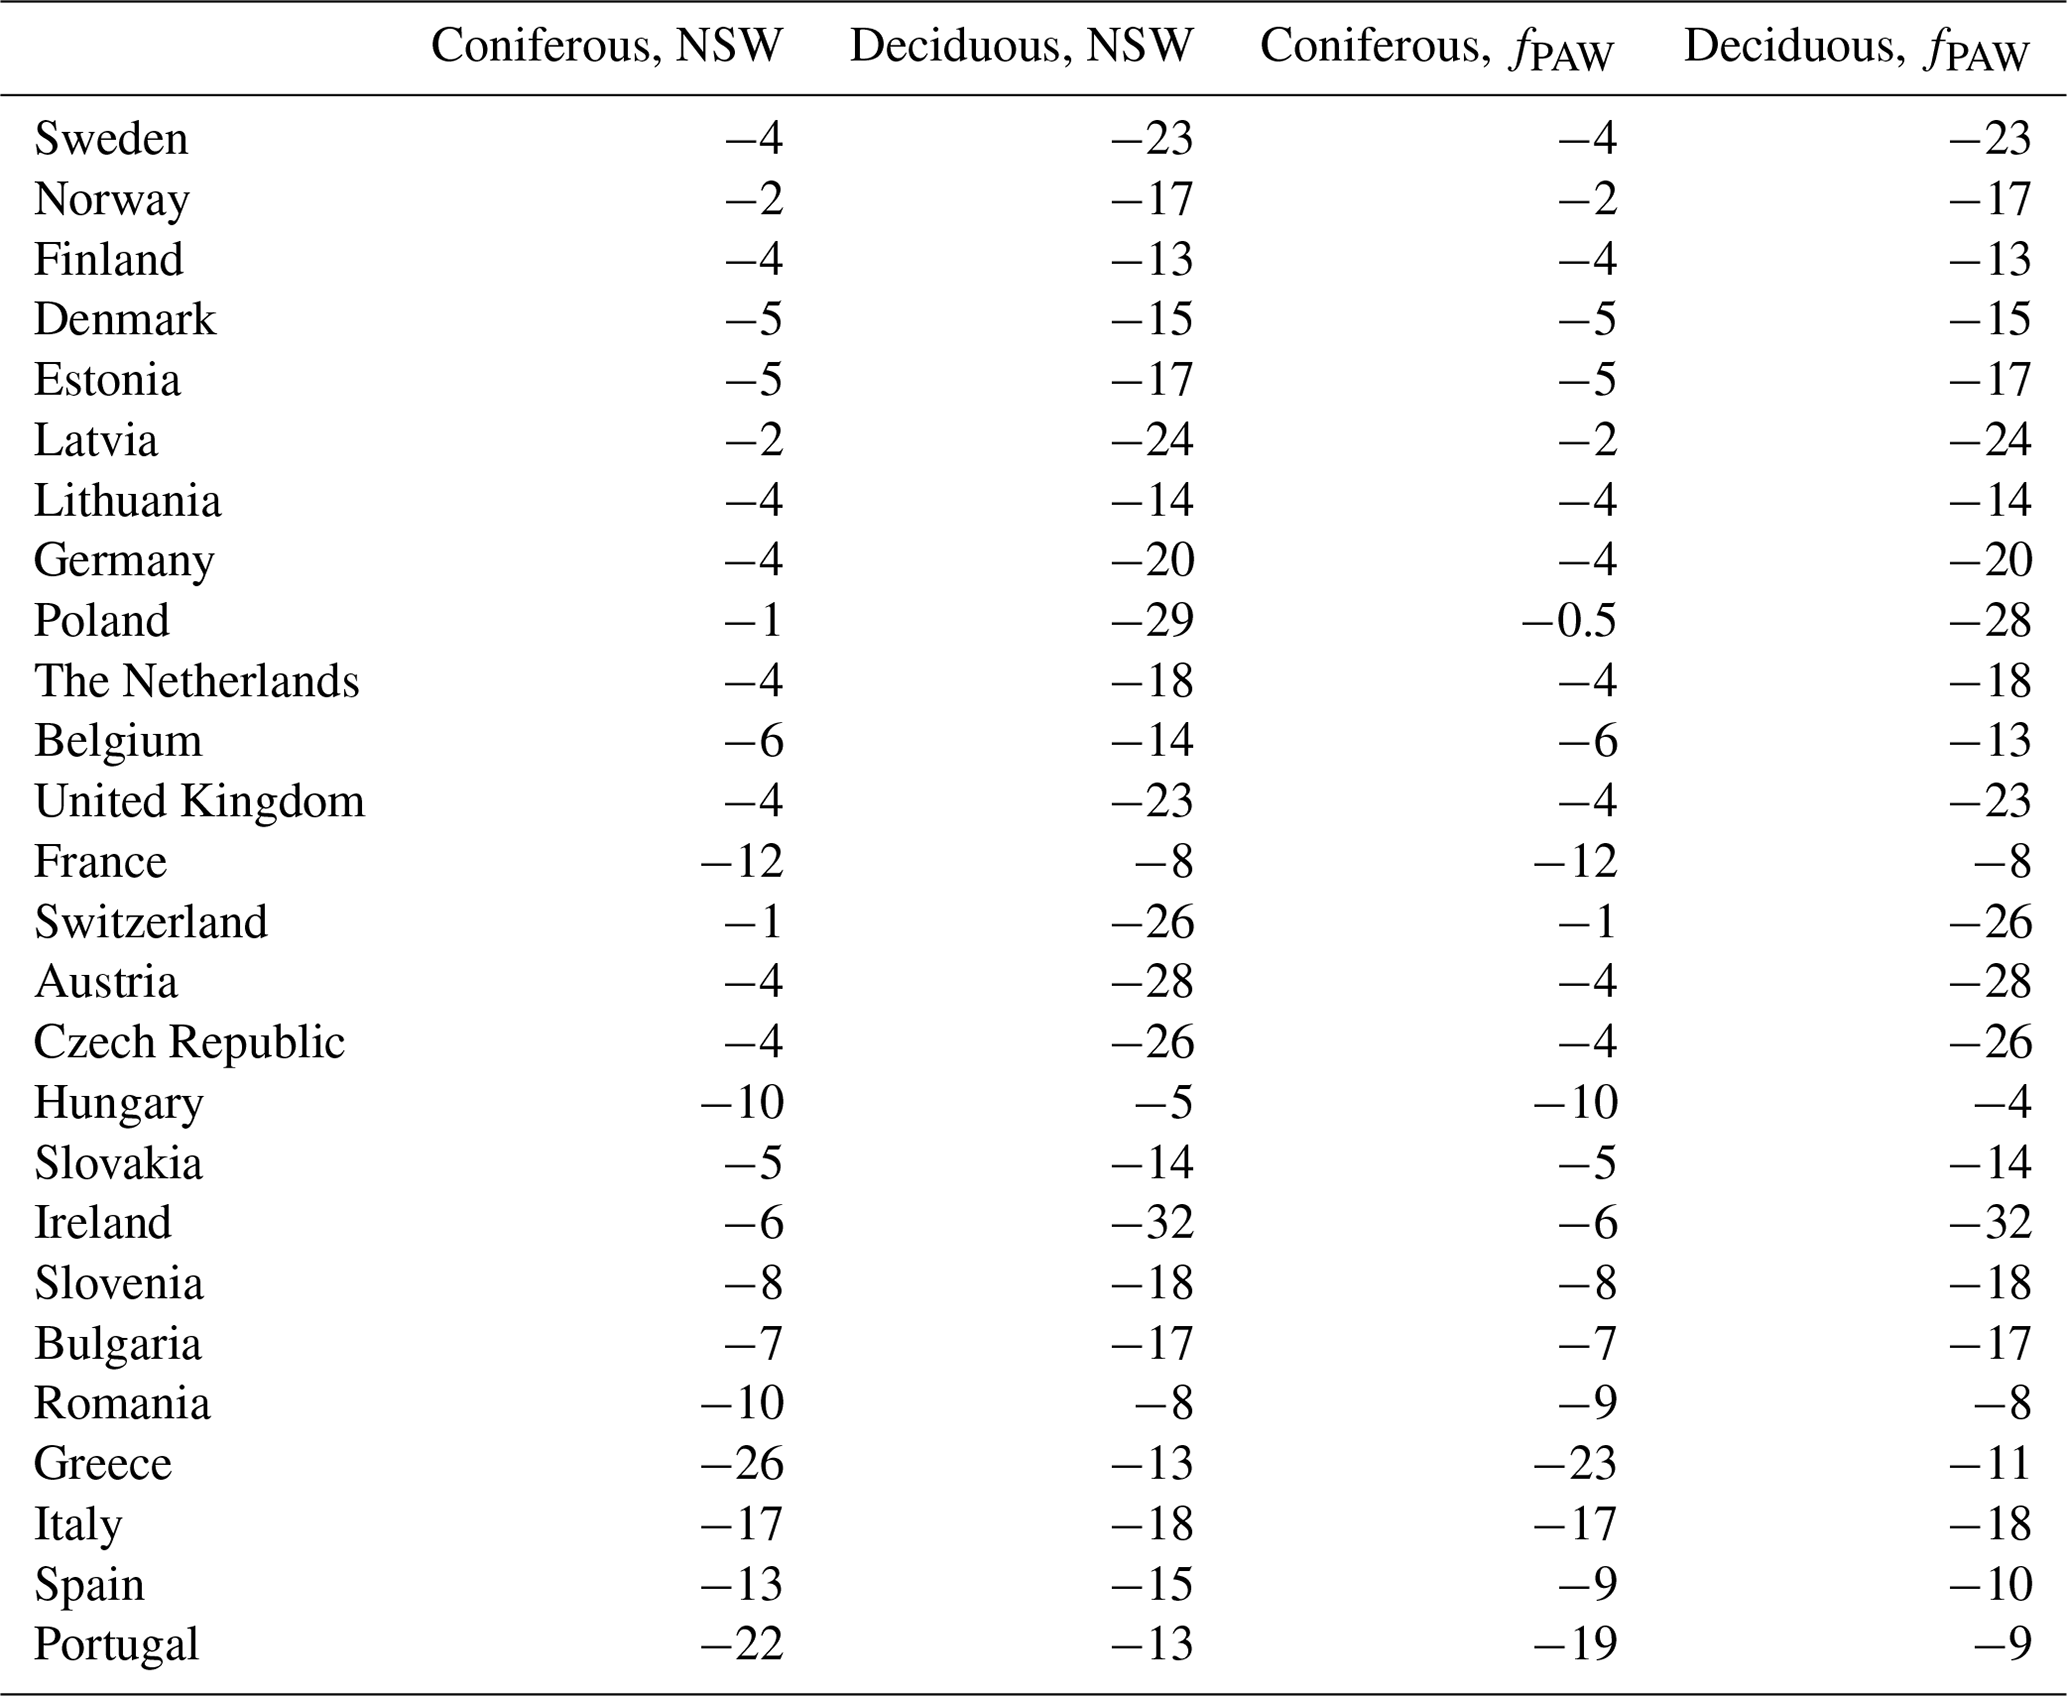
The estimated reductions in GAI as a result of O3 exposure were substantial. The largest growth reductions, estimated by including fPAW, were found for deciduous tree species in Ireland (−32 %), Poland (−28 %), and Austria (−28 %) (Table 2). The mean reductions in GAI by O3 for deciduous tree species across all countries was −17 %. For coniferous tree species, the most negative values were estimated for Greece (−23 %), Portugal (−19 %), and Italy (−17 %). The mean reductions in GAI by O3 for coniferous tree species was −7 %.
The estimated gross annual stem volume stock changes for all forests in Europe are shown in Fig. 6, with and without the exposure to present O3 doses, calculated as POD1SPEC. Also shown are the estimated total removals of forest stem volumes, including both natural and harvest removals. The rates of removals are assumed to be independent of O3 regimes. Furthermore, in Fig. 6, the differences between the gross annual stock increments and the removals are indicated, shown separately for the results in presence of O3 impacts (continuous-line arrow) and those in the absence of O3 impacts (dashed-line arrow).
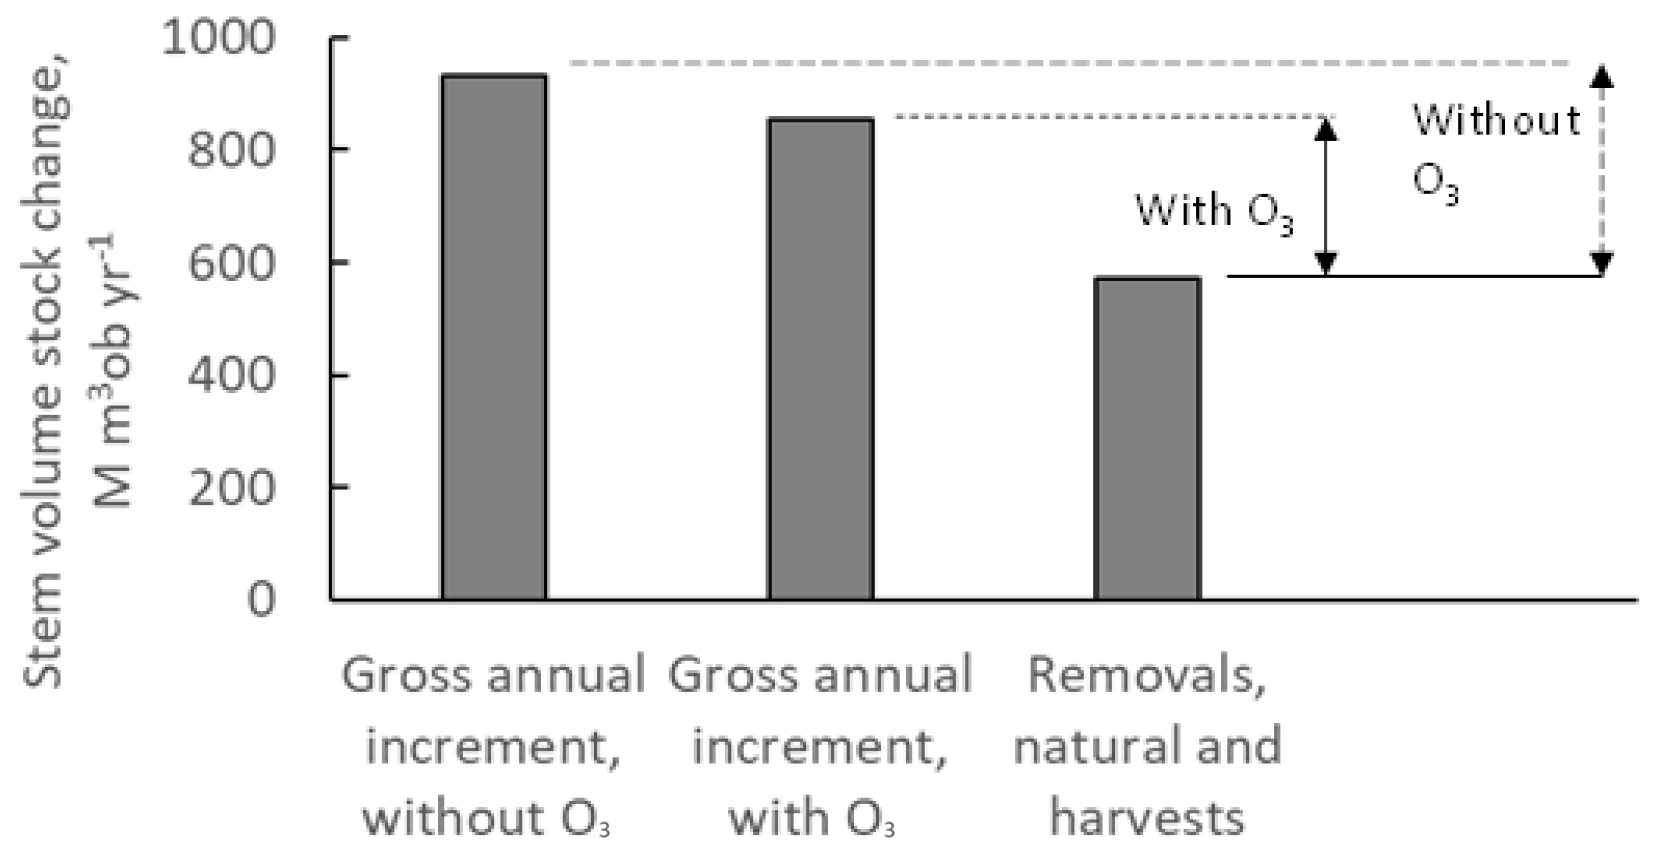
Figure 6The rates of annual gross stem volume increment growth for forests in Europe as mean annual values for the time period of 2008–2012, including the sum of coniferous and deciduous tree species, with and without the exposure to present O3 doses, calculated as POD1SPEC, with the scenario fPAW. Also shown are the estimated total removals of forest stem volumes, including both natural and harvest removals. The rates of removals are assumed to be independent of O3 regimes. Furthermore, the differences between the gross annual stock increments and the removals are indicated with vertical arrows, shown separately for the presence of O3 impacts (continuous-line arrow) and without the presence of O3 impacts (dashed-line arrow). Note that “ob” denotes over bark.
The rates of annual gross stem volume increments for all European forests were 854 M m3 over bark (ob) yr−1 with the presence of O3 and 933 M m3 ob yr−1 in the absence of O3 (Fig. 6). This is an increase of 9 % in the absence of O3. However, the annual net changes in forest standing stocks (NCSSs) were 283 M m3 ob yr−1 in the presence of O3 (continuous-line arrow in Fig. 6) and 363 M m3 ob yr−1 in the absence of O3 (dashed-line arrow in Fig. 6). This is an increase of 28 % in the absence of O3. Hence, the removal of O3 exposure would increase European forest stem volume growth rates by 9 %, but it would increase European forest annual net changes in standing stocks by 28 %. The results from this study, with modelling of negative ozone impacts on forest growth in combination with the application of forest statistics, illustrates the importance of not only considering O3 impacts on forest gross growth rates but also considering the impacts on the gap between gross growth and the removals, i.e. net changes in forest standing stocks.
The annual gross stem volume increments for forests in the different European countries are shown in Fig. 7, with and without the exposure to present O3 doses. Also shown are the natural and harvest removals, which are assumed to be independent of the scenarios for O3 exposure. The gap between the current rates of gross growth and the total removals differs considerably in terms of magnitude between different countries. For instance, Germany has a relatively small gap between GAI and the total (natural and harvest) removals, while France has a much larger gap. The absolute difference in GAI with and without O3 exposure is relatively similar between these countries. However, this O3 difference in GAI will have a much larger relative impact on the percent change in NCSS for Germany compared to France since the gap between current GAI and removals is smaller.
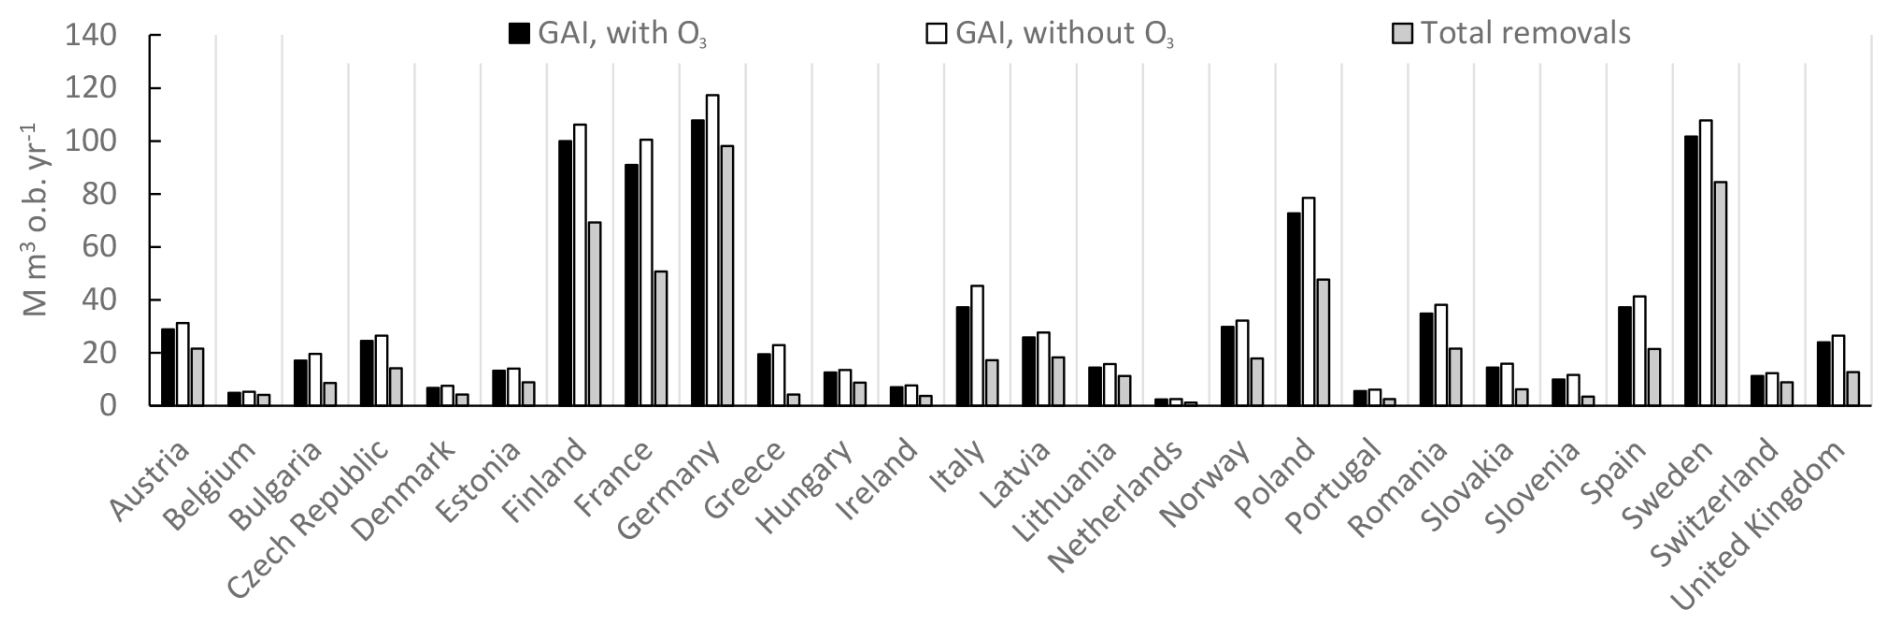
Figure 7The rates of annual gross stem volume increment growth for forests in different European countries as annual values for the time period of 2008–2012, including the sum of coniferous and deciduous tree species, with and without the exposure to present O3 doses, calculated as POD1SPEC, with the scenario fPAW. Also shown are the sum of the natural and harvest removals of forest stem volumes, i.e. the total removals. The rates of natural and harvest removals are assumed to be independent of ozone regimes. The countries are sorted from left to right in alphabetical order.
The change in the annual C sequestration in the forest living-biomass C stock in the absence of O3 exposure compared to the presence of O3 exposure is presented in Fig. 8. Results are presented for the individual Europeans countries as absolute values (Fig. 8a) and as differences between scenarios without and with O3 (Fig. 8b), shown separately for coniferous and deciduous forests and for total forests. The absence of O3 exposure would increase the C sequestration to the living biomass, in absolute values, the most in Germany, France, Italy, and Poland. Summarized for all European forests, the C sequestration to the living-biomass C stock was estimated to be 343 M t CO yr−1 in the presence of O3 and 449 M t CO yr−1 in the absence of O3, i.e. an increase of 31 %.
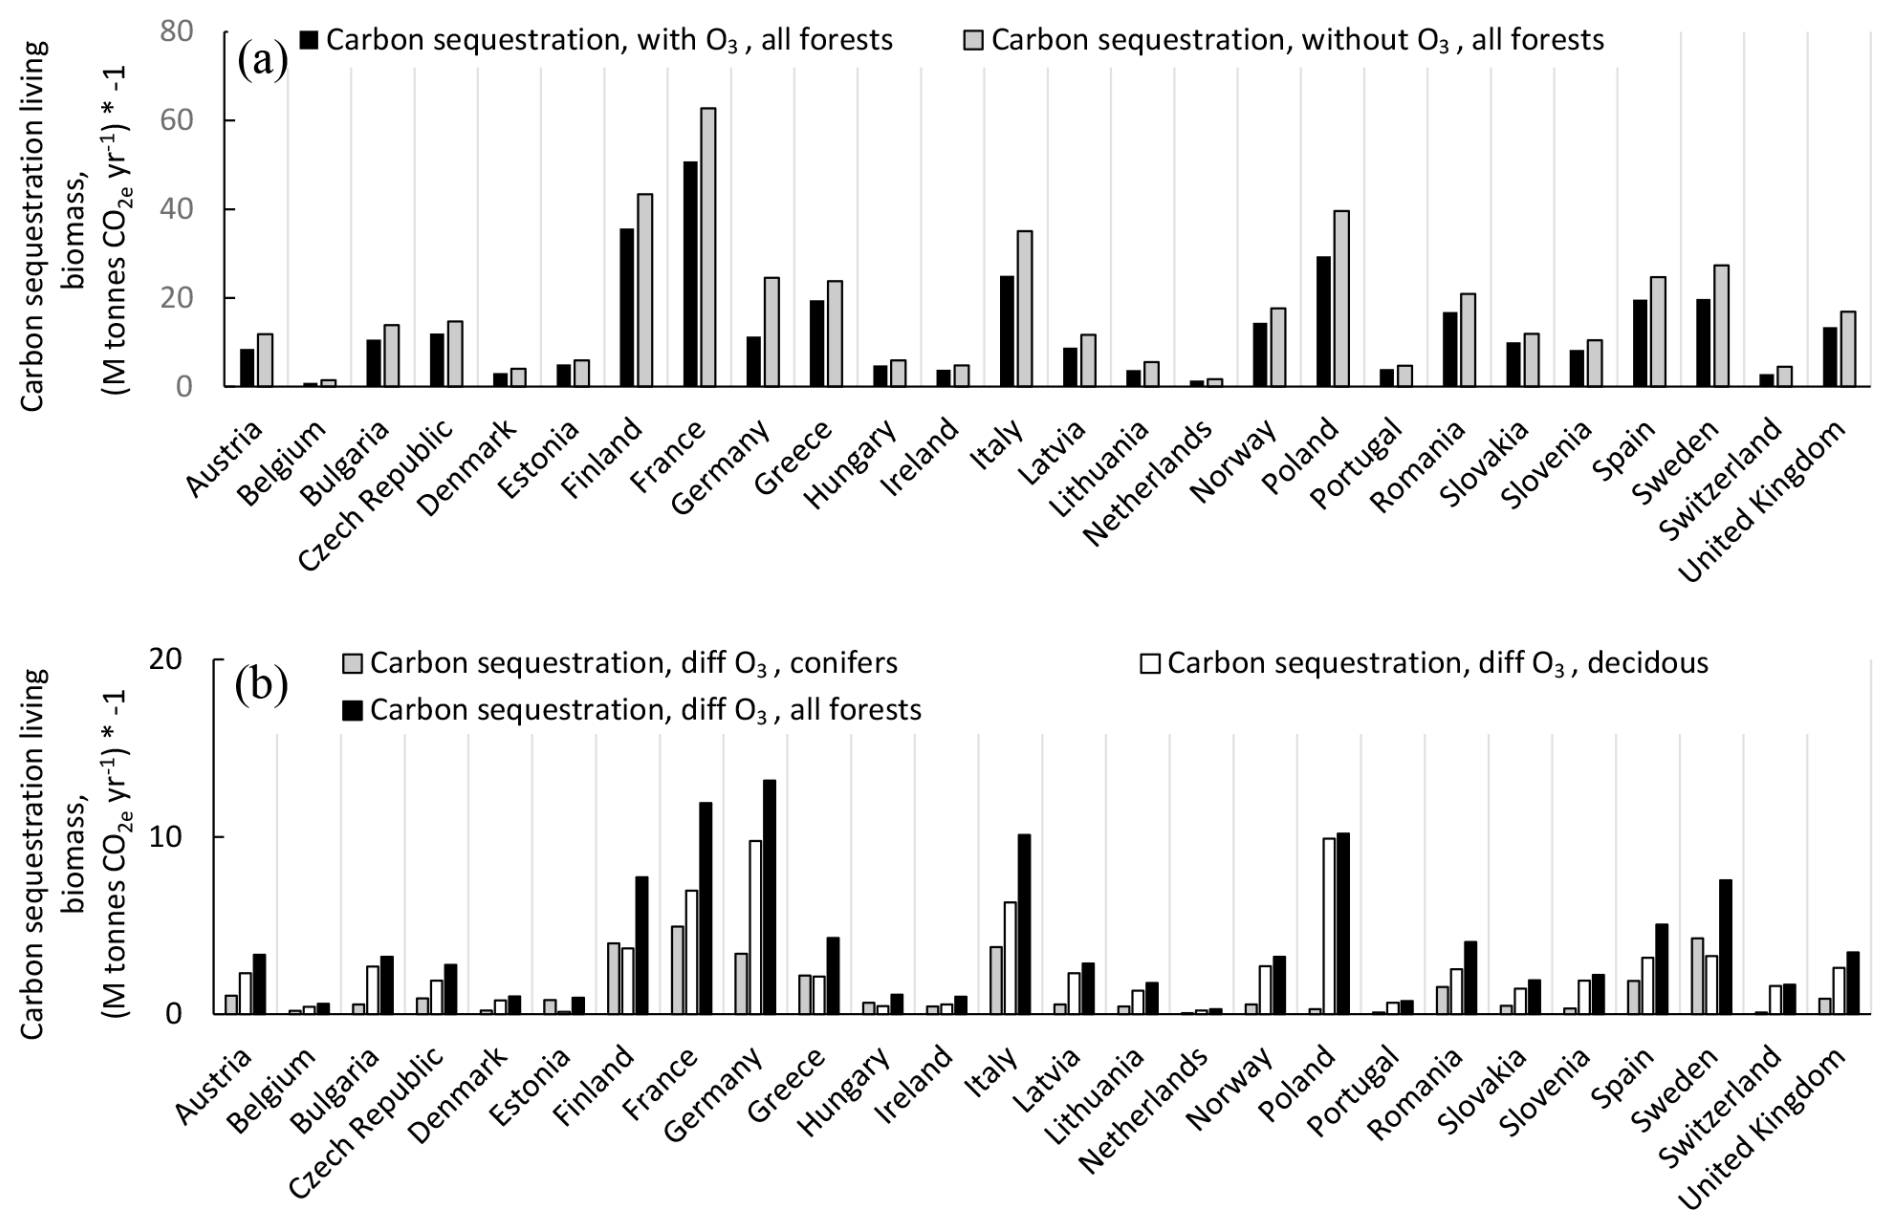
Figure 8The changes in the annual C sequestration in the living-biomass C stocks, with and without the exposure to present O3 doses, calculated as POD1SPEC, with the scenario fPAW. (a) Absolute values for total forests and (b) differences between scenarios without versus with ozone, shown separately for coniferous, deciduous, and total forests. Results are presented for the individual Europeans countries, shown separately for coniferous and deciduous forests and for total forests. The countries are sorted from left to right in alphabetical order. Removal of CO2 from the atmosphere to the living-biomass carbon stocks is shown with a negative sign.
The percent changes in the annual C sequestration of forests in the different European countries without the present O3 exposure compared to with O3 exposure are shown in Fig. 9. Changes are shown separately for coniferous and deciduous forests and for total forests. As an example, the percent increase in the annual C sequestration of forests in the absence of O3 is much larger for Germany compared to France. As mentioned above, this is because the annual C sequestration of forests in Germany in the presence of O3 was so low that the increase due to the removal of the O3 exposure will be relatively large.
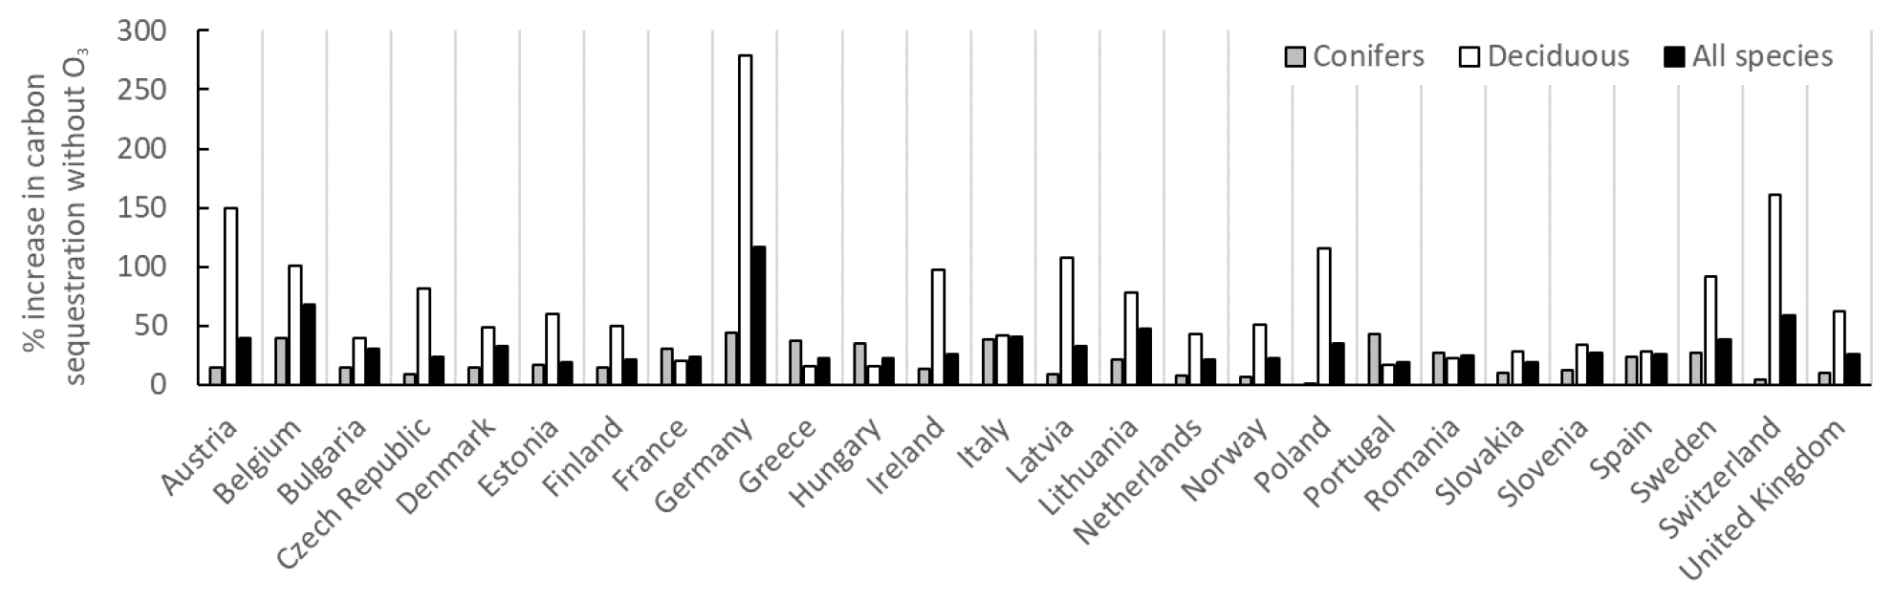
Figure 9The percent changes in the annual C sequestration of forests in the different European countries without the present O3 exposure compared to with O3 exposure. Changes are shown separately for coniferous and deciduous forests and for total forests.
As already mentioned above, the percent increase in the C sequestration to the forest living-biomass C stock of all European forests in the absence of O3 is 31 %. In general, the impact of the absence of O3 is larger for deciduous forests compared to coniferous forests. This is because, in the O3 GAI DRRs, deciduous forests are considered to be more sensitive to O3 impacts compared to conifers. However, the estimates of the GAI of different tree functional types are somewhat uncertain since the forest statistics for different European countries only provide information on the GAI and natural and harvest removals of the total forests, together with information for the different areas of coniferous and deciduous forests.
4.1 Spatial variation in POD1SPEC
The UNECE Mapping Manual (LRTAP, 2017) sets the critical levels for O3 impacts on trees in Europe, based on POD1SPEC, to 9.2 mmol m−2 for Norway spruce, related to a 2 % annual biomass reduction, and to 5.2 mmol m−2 for beech and birch, related to a 4 % annual biomass reduction. The results shown in this study (Fig. 3a and c) suggest that the critical level for deciduous forests was exceeded in large parts of Europe during the period of 2008–2012, except for dry areas in the Iberian Peninsula and for small parts of continental Europe and the Fennoscandian mountain range. The exceedance of the critical levels for coniferous forests was somewhat less. This geographical distribution is very different from the exceedance of the critical levels based on the ozone exposure index AOT40 applied by the European Union (10 ppm h), which shows a strong latitudinal gradient, with the highest values in the Mediterranean (Fig. 3e and f).
The estimates of POD1SPEC are the result of the combination of estimated O3 concentrations and meteorological factors (f functions) describing the limitation of the stomatal conductance (Emberson et al., 2000). The maps for the f functions provide some explanations for the patterns of POD1SPEC across Europe (Fig. 4). The function used to describe the temperature limitation of stomatal conductance (Fig. 4b) showed, in general, homogenously high values across most of Europe. The function used to describe the VPD limitation of stomatal conductance (Fig. 4c) showed a geographical variation that more closely resembled the pattern for the estimated POD1SPEC, with higher values for continental coastal regions and lower values for continental inland regions. Hence, this indicates that fVPD was an important factor for the estimates of POD1SPEC across Europe. The function used to describe the soil water deficit limitation of stomatal conductance, fPAW (Fig. 4d), showed low values only for the inland Iberian Peninsula, explaining the low values of POD1SPEC estimated for this region. The reduced geographical extent of the fPAW limitation is likely to be due to the use of a rather insensitive fPAW relationship (with limitation starting only once soil water has been reduced to a level where only 25 % remains available to the plant). This rather insensitive response was selected to ensure that the protective effect of soil water stress in limiting POD1SPEC was not overestimated. Future studies could explore the effect of species-specific fPAW in more detail especially since this was found to be an important variable determining POD1SPEC, crown defoliation, and visible foliar injury at specific study sites in France, Italy, and Romania (Sicard et al., 2020). To give an indication of the effect of a more sensitive fPAW, Fig. S6 shows fPAW values for each species for the year 2012 using an fPAW relationship that reduces gsto once 50 % of available soil water is exceeded. This extends the limiting effect of soil water on POD1SPEC further north to some parts of eastern continental Europe.
Southern Europe shows the highest variation in POD1SPEC during the 5 years, most likely highlighting the influence of more pronounced changes in weather and, hence, ozone uptake conditions during those 5 years as compared to the rest of Europe. However, it should be noted that none of the 5 years targeted in this study were perceived to be meteorologically extreme, with none of the extreme European heatwaves that characterized, for example, 2003 (Solberg et al., 2008; Lin et al., 2020).
The POD1SPEC results in the present study are consistent with those of Anav et al. (2022), who found that ∼ 40 % of the forested area in the Northern Hemisphere exceeded the POD1SPEC values of critical levels used in their study (5.2 mmol m−2 yr−1 for boreal and continental deciduous forests, 9.2 mmol m−2 yr−1 for boreal and continental evergreen forests, 14 mmol m−2 yr−1 for temperate deciduous forests, and 47.3 mmol m−2 yr−1 for temperate evergreen forests). Sicard et al. (2020) found broad ranges of POD1SPEC between 3 to > 20 mmol O3 m−2 for 15 locations in France, Italy, and Romania during 2018 and 2019. A study at 30 rural sites in Switzerland found POD1SPEC ranges of 12 to 25 mmol O3 m−2 for beech (Braun et al., 2022), whilst our estimates are between 22 and 28 mmol O3 m−2. For Europe-wide studies, Simpson et al. (2022) calculated POD1_IAM_DF (the integrated assessment model recommendation of UNECE (LRTAP, 2017), which is largely derived from the parameterization for beech) with a more recent and higher-resolution (version rv4.45, 0.2° lat × 0.3° long) version of the EMEP CTM. They also found the highest POD values (of around 12–40 mmol O3 m−2) in central Europe, Sweden, and the UK and lower values (0–6 mmol O3 m−2) in many parts of Spain, rather similarly to the results presented here. Finally, a recent study by Vlasáková et al. (2022) estimated POD1SPEC for beech and Norway spruce according to the UNECE Mapping Manual functions and the CAMS ensemble forecast modelling, which provided hourly O3 data. These results are consistent with our study findings, with POD1SPEC for beech commonly ranging from 5 to 30 mmol m−2, with a similar spatial pattern to that described by our broadleaf deciduous results in Fig. 3c, and with that for Norway spruce commonly ranging from 7 to 25 mmol m−2 compared to our slightly lower values for coniferous forests of 5 to 18 mmol m−2.
4.2 The GAI dose–response relationships
We have developed GAI DRRs so that the impacts of O3 exposure on forest stand growth rates can be estimated annually and used with commonly available forest statistics to estimate annual changes in forest standing stocks and, ultimately, living-biomass C stocks. A number of assumptions have been made in the derivation of these GAI DRRs. Firstly, we assume that O3 effects on young forest trees will be equivalent to the effects on mature trees, at least in terms of the O3 effect on growth rates. This is further discussed in Sect. 4.4. Secondly, we assume that we can reliably estimate the growth rate for different tree species using the Richards equation (Eq. 5) (Richards, 1959). Given that the Richards equation is used to interpolate growth rates between very young trees (when biomass will be close to zero) and the known biomass of trees at the end of a 2-to-10-year growth cycle, the uncertainties in this assumption are very small.
4.3 Impacts of ozone exposure on the forest living-biomass C stock changes
Estimates of O3 impacts on forest C sequestration for the different European countries and for Europe in total were, in general, much larger when based on the difference between GAI and total removals compared with estimates based on ozone impacts on GAI itself. The removal of O3 exposure was estimated to increase European forest stem volume growth rates by 9 %, but this was also estimated to increase European forest living-biomass C stock changes by 31 %, i.e. more than 3 times as much. This illustrated the importance of not only considering ozone impacts on forest growth rates but also considering the impacts on the gap between gross growth rates and forest removals, i.e. the net changes in the forest standing stocks. Previous studies of the impacts of O3 on vegetation C sequestration have, in most cases, focussed on the impacts of O3 on photosynthesis (Felzer et al., 2005; Felzer et al., 2009; Sitch et al., 2007; Ren et al., 2007). However, direct impacts of environmental changes on C sinks involved in the growth process have been shown to be more important for tree growth than indirect control via impacts on C sources, such as photosynthesis (Millard et al., 2007; Fatichi et al., 2014; Körner, 2015; Eckes-Shephard et al., 2021; Kannenberg et al., 2022). This would suggest that approaches that estimate the negative impacts of O3 on vegetation C sequestration only via impacts on instantaneous photosynthesis may not be correct, and, hence, care should be taken when making estimates of ozone effects on forest growth using damage functions that only have an influence via photosynthetic-based carbon assimilation (e.g. Sorrentino et al., 2025). The dose–response relationships used in our study were based on O3 exposure experiments with the long-term biomass growth as the response parameter, thus mainly reflecting O3 impacts on the C sinks.
4.4 The applications for forest stands
The phytotoxicity of O3 for young trees under experimental conditions is well documented (Karlsson et al., 2007; Wittig et al., 2009), but negative impacts of ozone on mature trees under field conditions have been more difficult to establish (Kolb and Matyssek, 2001; Marzuoli et al., 2019). The most evident and well-described case of negative ozone impacts on forest ecosystems is the ozone-induced decline in the San Bernardino Forest in California (Miller and McBride, 1999). Negative impacts on forest growth were analysed mainly based on gradient studies (Miller et al., 1997; Arbaugh et al., 1999). It was estimated that the basal area increment growth rates of the Douglas fir forest were reduced by approximately 30 % when comparing the areas with daylight mean O3 concentrations of 64–67 and 76–83 ppb. These are high concentration values compared to the corresponding values that can be estimated in Europe today (Gaudel et al., 2018). On the other hand, the climate in San Bernardino Forest is a Mediterranean dry climate, which might be expected to limit O3 uptake.
The impacts of O3 on the growth and vitality of different tree species have been studied extensively in Switzerland (Braun et al., 2014, 2017, 2022). These studies include both experimental exposure studies with young trees and epidemiological field studies where the stem growth and other vitality parameters have been correlated with environmental factors, including O3 exposure. The agreement of the dose–response curve from the epidemiological studies with the experimental data of young beech and Norway spruce trees suggests that the current dose–response curves for O3 used within the LRTAP convention are also valid for mature forests (Braun et al., 2022). In a unique case study, a free-air ozone fumigation experiment was conducted at “Kranzberger Forst” (Freising, southern Germany) over 8 years on adult trees of European beech and Norway spruce. Pretzsch and Schütze (2018) concluded that, under conditions of twice ambient O3 exposure, the annual basal area growth of European beech and Norway spruce decreased by 32 % and 24 %, respectively. Free-air fumigation of different deciduous tree species in the Aspen FACE project (Karnosky et al., 2005; Talhelm et al., 2014) demonstrated a negative impact of O3 on the ecosystem C content that did, however, experience a transient development over time. Experimental studies in China (Feng et al., 2019) with poplar tree species demonstrated a consistent negative relationship between biomass accumulation and O3 exposure both in small trees in open-top chambers and in larger trees under chamber-less exposure. Oksanen et al. (2009) summarized the results from Finnish experiments on O3 exposure of several different clones of birch and concluded that an O3 exposure of 15 ppm h of AOT40 may reduce the stem diameter growth of birch by approximately 15 %. This is of the same magnitude as the estimates of AOT40 described for large parts of Europe (Fig. 3f). Thus, based on the literature results described above, mature trees under field conditions cannot be assumed to be less sensitive to ozone exposure compared to young trees under experimental conditions (Karlsson et al., 2024). Consequently, we suggest that our estimates of the negative impacts of O3 on forest growth rates and C stock changes, using DRRs from 2- to 10-year-old forest trees under experimental conditions, may provide reliable results for the different forests of variable age that exist across Europe.
4.5 Assumptions
The estimates of the impacts of O3 exposure on the C sequestration of managed forests were based on some additional assumptions. The first assumption was that the presence of O3 did not affect the natural losses caused by storm fellings, drought, insect attacks, etc. Free-air fumigation to elevated concentrations of O3 were shown to increase aphid infestations in trembling aspen, Populus tremuloides (Percy et al., 2003). If the absence of O3 exposure were to reduce the risk of insect attacks or other diseases in trees, that would contribute to the increase the C sequestration in European managed forests even further since the gap between gross growth and removals would increase. Ozone has been shown to reduce the relative growth of belowground biomass (Gu et al., 2023). Reduced root growth can be expected to make trees more vulnerable to drought. Hence, the absence of O3 exposure would also have the potential to increase the C sequestration from this perspective.
The second assumption was that harvest rates would not be affected by the changes in gross growth rates, i.e. that harvest rates are mainly dependent on the demand for forest raw materials. In countries that are heavily dependent on the supply of forest raw material to the forest industry, such as Sweden and Finland, the rates of harvests are carefully monitored by national forest inventories. For example, the Swedish Forest Agency regularly makes recommendations about the rates of harvest in relation to the rates of forest gross growth to make sure that harvest rates do not exceed growth rates. Levers et al. (2014) concluded that the harvest intensities of European forests were mainly explained by the share of plantation species, by terrain ruggedness, and by different country-specific characteristics. Forest growth rates were not considered to be important for explaining forest harvest intensities in that study. Another important factor regulating the harvest rates is the forest age structure, i.e. when forests reach the economically optimal age for harvesting (Korosuo et al., 2023). An alternative consideration for the calculations would have been to keep harvest rates as a certain fraction of the growth rates. In this case, increased growth rates in the absence of O3 exposure would have been accompanied by a certain increase in harvest rates that, in absolute terms, would have been lower than the increase in growth. Hence, in this case, the absence of O3 exposure would also have resulted in increased C sequestration in European managed forests, but this would have been smaller than what has been presented in the current calculations in our study.
4.6 Comparisons with other estimates of and policies for European forest carbon (C) sequestration
In the present study, the yearly C sequestration to the European forest living-biomass C stocks, as a mean value for 2008–2012, was estimated to be −343 M t CO yr−1 in the presence of O3. Regarding the uncertainties and simplifications of the calculations, this value is of the same order of magnitude as the value estimated in the Forest Europe assessment (Forest Europe, 2020), in which the average annual sequestration of C in European forest biomass between 2010 and 2020 was around −560 M t CO yr−1. Pan et al. (2011) estimated the yearly C sequestration to European forests, excluding in Russia, to be −570 M t CO for the period of 2002–2007.
The European Union European Commission has issued an action plan to develop sustainable solutions to increase C sequestration by forests. The EU target is to increase the yearly uptake of CO2 in the entire AFOLU sector (agriculture, forestry, and other land use) to −310 M t CO yr−1 (Korosuo et al., 2023). It was estimated in the Forest Europe assessment (Forest Europe, 2020) that living woody biomass represents around 36 % of the total C stocks in forests. Hence, the increase in the yearly C sequestration to the European forest living-biomass C stocks (from −343 to −449 M t CO yr−1) estimated in this study by eliminating the negative impacts of O3 on forest gross growth rates clearly has the potential to contribute substantially to the European Commission's action plan. The yearly C sequestration to the European forests is expected to be short of the so called “forest reference levels”, i.e. the forest C sequestration levels agreed upon by the EU member states during 2021–2025 (Hyyrynen et al., 2023; Korosuo et al., 2023).
The estimates made in this study included only the influence of O3 in relation to changes in the forest living-biomass C stocks. However, there may be additional climate change abatement benefits caused by mitigating ozone concentrations, such as enhancing C held in the dead biomass and soil C stocks (Liski et al., 2002; Mäkipää et al., 2023). Both of these C stock changes may be promoted by the increase in litter production due to the increase in forest gross growth rates. Furthermore, C can be stored for some time in harvested wood products (HWPs, Hyyrynen et al., 2023), increasing C stocks. Finally, the forest raw materials produced may act as a substitute for the use of fossil-based raw materials (Leskinen et al., 2018; Korosuo et al., 2023).
The annual, species-specific phytotoxic ozone dose above a threshold of 1.0 nmol m−2 s−1, POD1SPEC, was estimated for European forest plant functional types for the years 2008–2012.
The critical level for negative impacts on forests suggested by the UN Air Convention, based on POD1SPEC, was exceeded in large parts of Europe.
The highest POD1SPEC was estimated for the coastal regions of mid-latitude Europe, including the UK, for both coniferous and broadleaf forests.
The annual forest standing stock changes were estimated based on POD1SPEC-based dose–response relationships as they relate to the negative impacts of ozone on forest growth rates in combination with the estimated values for POD1SPEC and official forest statistics for forest growth and total removals. With the use of the default IPCC methodology, this could be converted into estimates of changes in the forest living-biomass C stocks.
The absence of ozone exposure would increase European forest stem volume growth rates by 9 %, but it would increase European forest living-biomass C stock increment rates by 31 %.
Mature trees under field conditions cannot be assumed to be less sensitive to ozone exposure compared to young trees under experimental conditions.
An open version of the DO3SE model, version 3.6.48, as used in the present study, can be found at https://doi.org/10.5281/zenodo.16084373 (sbland, 2025).
Data will be made available upon request.
The supplement related to this article is available online at https://doi.org/10.5194/bg-22-3563-2025-supplement.
PEK, PB, and LE designed the study. DS and SB performed the simulations. KS and FH provided important information. PEK, PB, and LE prepared the paper with contributions from all of the co-authors.
The contact author has declared that none of the authors has any competing interests.
Publisher’s note: Copernicus Publications remains neutral with regard to jurisdictional claims made in the text, published maps, institutional affiliations, or any other geographical representation in this paper. While Copernicus Publications makes every effort to include appropriate place names, the final responsibility lies with the authors.
This article is part of the special issue “Tropospheric Ozone Assessment Report Phase II (TOAR-II) Community Special Issue (ACP/AMT/BG/GMD inter-journal SI). It is a result of the Tropospheric Ozone Assessment Report, Phase II (TOAR-II, 2020–2024).
The authors wish to thank Gina Mills, Harry Harmens, and David Norris (formerly of UKCEH Bangor), for their support with respect to developing the original idea for the study, and Sabine Braun (Institute for Applied Plant Biology AG, Witterswil, Switzerland), for valuable discussions. We would also like to acknowledge support from Steve Cinderby and Howard Cambridge (SEIY), with respect to the application of the SEI land cover map, and from Connie O'Neill (SEIY) and Nathan Booth (Department of Environment and Geography of the University of York), with respect to the data analysis.
The contribution by Per Erik Karlsson to this study was supported by the Swedish Environmental Protection Agency. Lisa Emberson and Sam Bland were partly supported by a grant from the Future of UK Treescapes research programme (grant no. NE/V02020X/1), funded by the UKRI. The work of David Simpson with the EMEP model was funded by the EMEP Trust Fund. IT infrastructure in general was available through the Norwegian Meteorological Institute (MET Norway), with EMEP computations performed on resources provided by UNINETT Sigma2 – the national infrastructure for high-performance computing and data storage in Norway (grant nos. NN2890k and NS9005k).
This paper was edited by Paul Stoy and reviewed by two anonymous referees.
Ågren, K., Högbom, L., Johansson, M., and Wilhelmsson, L.: Datainsamling till underlag för livscykelanalyser (LCA) av det svenska skogsbruket, Skogforsk ARBETSRAPPORT 1086–2021, 2021 (in Swedish).
Anav, A., De Marco, A., Collalti, A., Emberson, L., Feng, Z., Lombardozzi, D., Sicard, P., Verbeke, T., Viovy, N., Vitale, M., and Paoletti, E.: Legislative and functional aspects of different metrics used for ozone risk assessment to forests, Environ. Pollut., 295, 118690, https://doi.org/10.1016/j.envpol.2021.118690, 2022.
Arbaugh, M. J., Peterson, D. L., and Miller, P. J.: Air pollution effects on growth of Ponderosa pine, Jeffrey pine and Bigcone Doughlas-Fir, in: Ecological Studies 134, edited by: Miller, P. R. and McBride, J. R., Springer, ISBN 0-387-94493-3, 1999.
Büker, P., Morrissey, T., Briolat, A., Falk, R., Simpson, D., Tuovinen, J.-P., Alonso, R., Barth, S., Baumgarten, M., Grulke, N., Karlsson, P. E., King, J., Lagergren, F., Matyssek, R., Nunn, A., Ogaya, R., Peñuelas, J., Rhea, L., Schaub, M., Uddling, J., Werner, W., and Emberson, L. D.: DO3SE modelling of soil moisture to determine ozone flux to forest trees, Atmos. Chem. Phys., 12, 5537–5562, https://doi.org/10.5194/acp-12-5537-2012, 2012.
Büker, P., Feng, Z., Uddling, J., Briolat, A., Alonso, R., Braun, S., Elvira, S., Gerosa, G., Karlsson, P. E., Le Thiec, D., Marzuoli, R., Mills, G., Oksanen, E., Wieser, G., Wilkinson, M., and Emberson, L. D.: New flux based dose–response relationships for ozone for European forest tree species, Environ. Pollut., 206, 163–174, https://doi.org/10.1016/j.envpol.2015.06.033, 2015.
Braun, S., Schindler, C., and Rihm, B.: Growth losses in Swiss forests caused by ozone: Epidemiological data analysis of stem increment of Fagus sylvatica L. and Picea abies Karst, Environ. Pollut., 192, 129–138, https://doi.org/10.1016/j.envpol.2014.05.016, 2014.
Braun, S., Rihm, B., and Schindler, C. : Growth trends of beech and Norway spruce in Switzerland: The role of nitrogen deposition, ozone, mineral nutrition and climate, Sci. Total Environ., 599–600, 637–646, https://doi.org/10.1016/j.scitotenv.2017.04.230, 2017.
Braun, S., Rihm, B., and Schindler, C.: Epidemiological Estimate of Growth Reduction by Ozone in Fagus sylvatica L. and Picea abies Karst.: Sensitivity Analysis and Comparison with Experimental Results, Plants, 11, 777, https://doi.org/10.3390/plants11060777, 2022.
Calliari, E., Castellari, S., Davis, M., Linnerooth-Bayer, J., Martin, J., Mysiak, J., Pastor, T., Ramieri, E., Scolobig, A., Sterk, M., and Veerkamp, C.: Building climate resilience through nature-based solutions in Europe: A review of enabling knowledge, finance and governance frameworks, Clim. Risk Man., 37, 100450, https://doi.org/10.1016/j.crm.2022.100450, 2022.
Cinderby, S., Emberson, L., Owen, A., and Ashmore, M.: LRTAP land cover map of Europe, CCE Progress Report, https://www.rivm.nl/bibliotheek/digitaaldepot/PBL_CCE_PR07_PartI_5.pdf (last access: 23 July 2025), 2007.
Eckes-Shephard, A. H., Tiavlovsky, E., Chen, Y., Fonti, P., and Friend, A. D.: Direct response of tree growth to soil water and its implications for terrestrial carbon cycle modelling, Glob. Change Biol., 27, 121–135, https://doi.org/10.1111/gcb.15397, 2021.
EEA: Biogeographical Regions in Europe, https://www.eea.europa.eu/en/analysis/maps-and-charts/biogeographical-regions-in-europe-2 (last access: 15 May 2025), 2016.
Emberson, L.: Effects of ozone on agriculture, forests and grasslands, Philos. T. R. Soc. A, 378, 20190327, https://doi.org/10.1098/rsta.2019.0327, 2020.
Emberson, L. D., Ashmore, M. R., Cambridge, H. M., Simpson, D., and Tuovinen, J. P.: Modelling stomatal ozone flux across Europe, Environ. Pollut., 109, 403–413, https://doi.org/10.1016/S0269-7491(00)00043-9, 2000.
Emberson, L. D., Büker, P., and Ashmore, M. R.: Assessing the risk caused by ground level ozone to European forest trees: a case study in pine, beech and oak across different climate regions, Environ. Pollut., 147, 454–466, https://doi.org/10.1016/j.envpol.2006.10.026, 2007.
Etzold, S., Ferretti, M., Reinds, G. J., Solberg, S., Gessler, A., Waldner, P., Schaub, M., Simpson, D., Benham, S., Hansen, K. Ingerslev, M., Jonard, M., Karlsson, P.E., Lindroos, A.-J., Marchetto, A., Manninger, M., Meesenburg, H., Merilä, P., Nöjd, P., Rautio, P., Sanders, T.G.M., Seidling, W., Skudnik, M., Thimonier, A., Verstraeten, A., Vesterdal, L., Vejpustkova, M., and de Vries, W.: Continental-scale forest growth in Europe is driven by management and further modulated by nitrogen deposition, Forest Ecol. Manag., 458, 117762, https://doi.org/10.1016/j.foreco.2019.117762, 2020.
Fatichi, S., Leuzinger, S., and Körner, C.: Moving beyond photosynthesis: from carbon source to sink-driven vegetation modelling, New Phyt., 201, 1086–1095, https://doi.org/10.1111/nph.12614, 2014
Fellner, J. and Rechberger, H.: Abundance of 14C in biomass fractions of wastes and solid recovered fuels, Waste Manage., 29, 1495–1503, https://doi.org/10.1016/j.wasman.2008.11.023, 2009.
Felzer, B., Reilly, J., Melillo, J., Kicklighter, D., Sarofim, M., Wang, C., Prinn, R., and Zhuang, Q.: Future Effects of Ozone on Carbon Sequestration and Climate Change Policy Using a Global Biogeochemical Model, Climatic Change, 73, 345–373, https://doi.org/10.1007/s10584-005-6776-4, 2005.
Felzer, B. S., Cronin, T. W., Melillo, J. M., Kicklighter, D. W., and Schlosser, C. A.: Importance of carbon-nitrogen interactions and ozone on ecosystem hydrology during the 21st century, J. Geophys. Res., 114, G01020, https://doi.org/10.1029/2008JG000826, 2009.
Feng, Z., Shang, B., Gao, F., and Calatayud, V.: Current ambient and elevated ozone effects on poplar: A global meta-analysis and response relationships. Sci. Total Environ., 654, 832–840, https://doi.org/10.1016/j.scitotenv.2018.11.179, 2019.
Forest Europe: State of Europe's Forests 2020. Prepared and published by: Ministerial Conference on the Protection of Forests in Europe – FOREST EUROPE, http://www.foresteurope.org (last access: 15 May 2025), 2020.
Franz, M., Simpson, D., Arneth, A., and Zaehle, S.: Development and evaluation of an ozone deposition scheme for coupling to a terrestrial biosphere model, Biogeosciences, 14, 45–71, https://doi.org/10.5194/bg-14-45-2017, 2017.
Franz, M., Alonso, R., Arneth, A., Büker, P., Elvira, S., Gerosa, G., Emberson, L., Feng, Z., Le Thiec, D., Marzuoli, R., Oksanen, E., Uddling, J., Wilkinson, M., and Zaehle, S.: Evaluation of simulated ozone effects in forest ecosystems against biomass damage estimates from fumigation experiments, Biogeosciences, 15, 6941–6957, https://doi.org/10.5194/bg-15-6941-2018, 2018.
Fuhrer, J.: The critical level for ozone to protect agricultural crops – An assessment of data from European open-top chamber experiments, in: Critical levels for ozone. A UN-ECE workshop report, edited by: Fuhrer, J. and Achermann, B., Schriftenreihe der FAC Liebefeld 16, 42–57, 1994.
Gaudel, A., Cooper, O. R., Ancellet, G., Barret, B., Boynard, A., Burrows, J. P., Clerbaux, C., Coheur, P. F., Cuesta, J., Cuevas, E., and Doniki, S.: Tropospheric Ozone Assessment Report: Present-day distribution and trends of tropospheric ozone relevant to climate and global atmospheric chemistry model evaluation, Elem. Sci. Anth., 6, 39, https://doi.org/10.1525/elementa.291, 2018.
Griscom, B. W., Adams, J., Ellis, P. W., Houghton, R. A., Lomax, G., Miteva, D. A., Schlesinger, W. H., Shoch, D., Siikamäki, J. V., Smith, P., and Woodbury, P.: Natural climate solutions, P. Natl. Acad. Sci., 114, 11645–11650, https://doi.org/10.1073/pnas.1710465114, 2017.
Gu, X., Wang, T., and Li, C.: Elevated ozone decreases the multifunctionality of belowground ecosystems, Glob. Change Biol., 29, 890–908, https://doi.org/10.1111/gcb.16507, 2023.
Gustavsson, L., Haus, S., Lundblad, M. Lundström, A., Ortiz, C.A., Sathre, R., LeTruong, N., and Wikberg, P.-E.: Climate change effects of forestry and substitution of carbon-intensive materials and fossil fuels, Ren. Sust. Energy Rev., 67, 612–624, https://doi.org/10.1016/j.rser.2016.09.056, 2017.
Hyyrynen, M., Ollikainen, M., and Seppälä, J.: European forest sinks and climate targets: past trends, main drivers, and future forecasts, Eur. J. For. Res., 142, 1207–1224, https://doi.org/10.1007/s10342-023-01587-4, 2023.
Janssens, I. A., Freibauer, A., Ciais, P., Smith, P., Nabuurs, G. J., Folberth, G., Schlamadinger, B., Hutjes, R. W., Ceulemans, R., Schulze, E. D., and Valentini, R.: Europe's terrestrial biosphere absorbs 7 to 12 % of European anthropogenic CO2 emissions, Science, 300, 1538–1542, https://doi.org/10.1126/science.1083592, 2003.
Jasinevičius, G., Lindner, M., Pingoud K., and Tykkylainen, M.: Review of models for carbon accounting in harvested wood products, Int. Wood Prod. J., 6, 198–212, https://doi.org/10.1080/20426445.2015.1104078, 2015.
Kannenberg, S. A., Cabon, A., Babst, F., Belmecheri, S., Delpierre, N., Guerrieri, R., Maxwell, J. T., Meinzer, F. C., Moore, D. J. P., Pappas, C., Ueyama, M., Ulrich, D. E. M., Voelker, S. L., Woodruff, D. R., and Anderegg, W. R. L.: Drought-induced decoupling between carbon uptake and tree growth impacts forest carbon turnover time, Agr. Forest Metereol., 322, 108996, https://doi.org/10.1016/j.agrformet.2022.108996, 2022.
Karlsson, P. E.: Ozone Impacts on Carbon Sequestration in Northern and Central European Forests. IVL Rapport B 2065, https://www.diva-portal.org/smash/get/diva2:1549872/FULLTEXT01.pdf (last access: 15 May 2025), 2012.
Karlsson, P. E., Pleijel, H., Belhaj, M., Danielsson, H., Dahlin, B., Andersson, M., Hansson, M., Munthe, J., and Grennfelt, P.: Economic assessment of the negative impacts of ozone on the crop yield and forest production. A case study of the Estate Östads Säteri in southwestern Sweden, Ambio, 34, 32–40, https://doi.org/10.1579/0044-7447-34.1.32, 2005.
Karlsson, P. E., Braun, S., Broadmeadow, M., Elvira, S., Emberson, L., Gimeno, B. S., Le Thiec, D., Novak, K., Oksanen, E., Schaub, M., Uddling, J., and Wilkinson, M.: Risk assessments for forest trees – the performance of the ozone flux versus the AOT concepts, Environ. Pollut., 146, 608–616, https://doi.org/10.1016/j.envpol.2006.06.012, 2007.
Karlsson, P. E., Danielsson, H., Pleijel, H., and Andersson, C.: Exceedance of critical levels for ozone impacts on Swedish forests – Evaluation of methodology for POD1SPEC calculations, IVL Report C 829, https://gup.ub.gu.se/publication/343037 (last access: 25 May 2025), 2024.
Karnosky, D. F., Pregitzer, K. S., Zak, D. R., Kubiske, M. E., Hendrey, G. R., Weinstein, D., Nosal, M., and Percy, K. E.: Scaling ozone responses of forest trees to the ecosystem level in a changing climate, Plant Cell Environ., 28, 965–981, https://doi.org/10.1111/j.1365-3040.2005.01362.x, 2005.
Kolb, T. E. and R. Matyssek.: Limitations and perspectives about scaling ozone impacts in trees, Environ. Pollut., 115, 373–393, https://doi.org/10.1016/S0269-7491(01)00228-7, 2001.
Korosuo, A., Pilli, R., Abad Viñas, R., Blujdea, V., Colditz, R., Fiorese, G., Rossi, S., Vizzarri, M., and Grassi, G.: The role of forests in the EU climate policy: are we on the right track?, Carbon Balance and Management, 18, 15, https://doi.org/10.1186/s13021-023-00234-0, 2023.
Körner, C.: Paradigm shift in plant growth control, Curr. Opin. Plant Biol., 25, 107–114, https://doi.org/10.1016/j.pbi.2015.05.003, 2015.
Leskinen, P., Cardellini, G., González-García, S., Hurmekoski, E., Sathre, R., Seppälä, J., and Johannes Verkerk, P.: Substitution Effects of Wood-based Products in Climate Change Mitigation, From Science to Policy 7, European Forest Institute, https://efi.int/sites/default/files/files/publication-bank/2019/efi_fstp_7_2018.pdf (last access: 25 May 2025), 2018.
Levers, C., Verkerk, P. J., Müller, D., Verburg, P. H., Butsic, V., Leitão, P. J., Lindner, M., and Kuemmerle, T.: Drivers of forest harvesting intensity patterns in Europe, Forest Ecol. Manag., 315, 160–172, https://doi.org/10.1016/j.foreco.2013.12.030, 2014.
Lin, M., Horowitz, L. W., Xie, Y., Paulot, F., Malyshev, S., Shevliakova, E., Finco, A., Gerosa, G., Kubistin, D., and Pilegaard, K.: Vegetation feedbacks during drought exacerbate ozone air pollution extremes in Europe, Nat. Clim. Change, 1758–6798, https://doi.org/10.1038/s41558-020-0743-y, 2020.
Liski, J., Perruchoudc, D., and Karjalainen, T.: Increasing carbon stocks in the forest soils of western Europe, Forest Ecol. Manag., 169, 159–175, https://doi.org/10.1016/S0378-1127(02)00306-7, 2002.
LRTAP: Manual on methodologies and criteria for modelling and mapping Critical Loads and Levels and air pollution effects, risks and trends. Chapter 3: Mapping critical levels for vegetation, https://icpvegetation.ceh.ac.uk/sites/default/files/Chapter 3 - Mapping critical levels for vegetation.pdf (last access: 15 May 2025), 2017.
Mäkipää, R., Abramoff, R., Adamczyk, B., Baldy, V., Biryol, C., Bosela, M., Casals, P., Yuste, J.C., Dondini, M., Filipek, S., Garcia-Pausas, J., Gros, R., Gomoryov, E., Hashimoto, S., Hassegawa, M., Immonen, P., Laiho, R., Li, H., Li, Q., Luyssaert, S., Menival, C., Mori, T., Naudts, K., Santonja, M., Smolander, A., Toriyama, J., Tupek, B., Ubeda, X., Verkerk, P. J., and Lehtonen, A.: How does management affect soil C sequestration and greenhouse gas fluxes in boreal and temperate forests? – A review, Forest Ecol. Manag., 529, 120637, https://doi.org/10.1016/j.foreco.2022.120637, 2023.
Marzuoli, R., Gerosa, G., Bussotti, F., and Pollastrini, M.: Assessing the impact of ozone on forest trees in an integrative perspective: Are foliar visible symptoms suitable predictors for growth reduction? A critical review, Forests, 10, 1144, https://doi.org/10.3390/f10121144, 2019.
Matthews, B., Mareckova, K., Schindlbacher, S., Ullrich, B., and Wankmüller, R.: Emissions for 2018, in: Transboundary particulate matter, photo-oxidants, acidifying and eutrophying components. EMEP Status Report 1/2020, The Norwegian Meteorological Institute, Oslo, Norway, 37–57, http://www.emep.int (last access: 15 May 2025), 2020.
Millard, P., Sommerkorn, M., and Grelet, G.-A.: Environmental change and carbon limitation in trees: a biochemical, ecophysiological and ecosystem appraisal, New Phytol., 175, 11–28, https://doi.org/10.1111/j.1469-8137.2007.02079.x, 2007.
Miller, P. J., Arbaugh, M. J., and Temple, P. J.: Ozone and its known potential effects on forests in western United States, in: Ecological Studies 127, edited by: Sandermann, H., Wellburn, A. R., and Heath, R. L., Springer, ISBN 3-540-61321-8, 1997.
Miller, P. J. and McBride, J. R.: Introduction, in: Oxidant air pollution impacts in the montane forests of southern California, in: Ecological Studies 134, edited by: Miller, P. R. and McBride, J. R., Springer, ISBN 0-387-94493-3, 1999.
Mills, G., Pleijel, H., Braun, S., Büker, P., Bermejo, V., Calvo, E., Danielsson, H., Emberson, L., Grünhage, L., González Fernández, I., Harmens, H., Hayes, F., Karlsson, P. E., and Simpson, D.: New stomatal flux based critical levels for ozone effects on vegetation, Atmos. Environ., 45, 5064–5068, https://doi.org/10.1016/j.atmosenv.2011.06.009, 2011.
Nabuurs, G. J., Paivinen, R., Sikkema, R., and Mohren, G. M.: The role of European forests in the global carbon cycle – a review, Biomass and Bioenergy, 13, 345–358, https://doi.org/10.1016/S0961-9534(97)00036-6, 1997.
Oksanen, E., Manninen, S., Vapaavuori, E., and Holopainen, T.: Near-ambient ozone concentrations reduce the vigor of Betula and Populus species in Finland, Ambio, 38, 413–417, https://doi.org/10.1579/0044-7447-38.8.413, 2009.
Otu-Larbi, F., Conte, A., Fares, S., Wild, O., and Ashworth, K.: Current and future impacts of drought and ozone stress on Northern Hemisphere forests. Glob. Change Biol., 26, 6218–6234, https://doi.org/10.1111/gcb.15339, 2020.
Pan, Y., Birdsey, R., Fang, J., Houghton, R., Kauppi, P. E., Kurz, W., and Hayes, D.: A large and persistent carbon sink in the world's forests, Science, 333, 988–93, https://doi.org/10.1126/science.1201609, 2011.
Penman, J., Gytarsky, M., Hiraishi, T., Kryg, T., Kruger, D., Pipatti, R., Buendia, L., Miwa, K., Ngara, T., Tanabe, K., and Wagner, F.: Good Practice Guidance for Land Use, Land-Use Change and Forestry, Institute for Global Environmental Strategies (IGES) for the IPCC, ISBN 4-88788-003-0, 2003.
Percy, K. E., Caroline, S., Awmack, R. L., Kubiske, M. E., Kopper, B. J., Isebrands, J. G., Pregitzer, K. S., Hendrey, G. R., Dickson, R. E., Zak, D. R., Oksanen, E., Sober, J., Harrington, R., and Karnosky, D. F.: Altered performance of forest pests under atmospheres enriched by CO2 and O3, Nature, 420, 403–407, https://doi.org/10.1038/nature01028, 2003.
Pretzsch, H. and Schütze, G.: Growth recovery of mature Norway spruce and European beech from chronic O3 stress, Eur. J. For. Res., 137, 251–263, https://doi.org/10.1007/s10342-018-1106-3, 2018.
Ren, W., Tian, H., Chen, G., Liu, M., Zhang, C., Chappelka, A. H., and Pan, S.: Influence of ozone pollution and climate variability on net primary productivity and carbon storage in China's grassland ecosystems from 1961 to 2000, Environ. Pollut., 149, 327–335, https://doi.org/10.1016/j.envpol.2007.05.029, 2007.
Richards, F. J.: A flexible growth constant for forests, J. Exp. Bot., 10, 290–300. 1959.
Roe, S., Streck, C., Beach, R., Busch, J., Chapman, M., Daioglou, V., Deppermann, A., Doelman, J., Emmet-Booth, J., Engelmann, J., Fricko, O., Frischmann, C., Funk, J., Grassi, G., Griscom, B., Havlik, P., Hanssen, S., Humpenöder, F., Landholm, D., Lomax, G., Lehmann, J., Mesnildrey, L., Nabuurs, G.-J., Popp, A., Rivard, R., Sanderman, J., and Sohngen, B.: Land-based measures to mitigate climate change: Potential and feasibility by country, Glob. Change Biol., 27, 6025–6058, https://doi.org/10.1111/gcb.15873, 2021.
Sathre, R. and Gustavsson, L.: Using wood products to mitigate climate change: External costs and structural change, Appl. Energ., 86, 251–257, https://doi.org/10.1016/j.apenergy.2008.04.007, 2009.
sbland: DO3SE/do3se-project-carbon-sequestration: v1.0.1 (v1.0.1), Zenodo [code], https://doi.org/10.5281/zenodo.16084373, 2025.
Simpson, D., Ashmore, M. R., Emberson, L., and Tuovinen, J. P.: A comparison of two different approaches for mapping potential ozone damage to vegetation. A model study, Environ. Pollut., 146, 715–725, https://doi.org/10.1016/j.envpol.2006.04.013, 2007.
Simpson, D., Benedictow, A., Berge, H., Bergström, R., Emberson, L. D., Fagerli, H., Flechard, C. R., Hayman, G. D., Gauss, M., Jonson, J. E., Jenkin, M. E., Nyíri, A., Richter, C., Semeena, V. S., Tsyro, S., Tuovinen, J.-P., Valdebenito, Á., and Wind, P.: The EMEP MSC-W chemical transport model – technical description, Atmos. Chem. Phys., 12, 7825–7865, https://doi.org/10.5194/acp-12-7825-2012, 2012.
Simpson, D., Gonzalez Fernandez, I. A., Segers, A., Tsyro, S., Valdebento, A., and Wind, P.: Updates to the EMEP/MSC-W model, 2021–2022, in: Transboundary particulate matter, photo-oxidants, acidifying and eutrophying components. EMEP Status Report 1/2022, The Norwegian Meteorological Institute, Oslo, Norway, 133–146, https://emep.int/mscw/mscw_publications.html (last access: 15 May 2025), 2022.
Sicard, P., De Marco, A., Carrari, E., Dalstein-Richier, L., Hoshika, Y., Badea, O., Pitar, D., Fares, S., Conte, A., Popa, I., and Paoletti, E.: Epidemiological derivation of flux-based critical levels for visible ozone injury in European forests, J. Forest Res., 31, 1509–1519, https://doi.org/10.1007/s11676-020-01191-x, 2020.
Sitch, S., Cox, P. M., Collins, W. J., and Huntingford, C.: Indirect radiative forcing of climate change through ozone effects on the land-carbon sink, Nature, 448, 791–794, https://doi.org/10.1038/nature06059, 2007.
Soimakallio, S., Kalliokoski, T., Lehtonen, A., and Salminen, O.: On the trade-offs and synergies between forest carbon, Mitig. Adapt. Strat. Gl., 26, 4, https://doi.org/10.1007/s11027-021-09942-9, 2021.
Solberg, S., Hov, O., Sovde, A., Isaksen, I. S. A., Coddeville, P., De Backer, H., Forster, C., Orsolini, Y., and Uhse, K.: European surface ozone in the extreme summer 2003, J. Geophys. Res., 113, D07307, https://doi.org/10.1029/2007JD009098, 2008.
Sorrentino, B., Anav, A., Calatayud, V., Collalti, A., Sicard, P., Leca, S., Fornasier, F., Paoletti, E., and De Marco, A.: Inconsistency between process-based model and dose-response function in estimating Biomass losses in Northern Hemisphere due to elevated O3, Environ. Pollut., 125379, https://doi.org/10.1016/j.envpol.2024.125379, 2025.
Stull, R. B.: An introduction to Atmospheric Boundary Layer Meteorology, Kluwer Academic Publishers, Dordrecht, https://doi.org/10.1007/978-94-009-3027-8, 1988.
Subramanian, N., Karlsson, P. E., Bergh, J., and Nilsson, U., Impact of ozone on sequestration of carbon by Swedish Forests under a changing climate: a modeling study, Forest Sci., 61, 445–457, https://doi.org/10.5849/forsci.14-026, 2015.
Talhelm, A. F., Pregitzer, K. S., Kubiske, M. E., Zak, D. R., Campany, C. E., Burton, A. J., Dickson, R. E., Hendrey, G. R., Isebrands, J. G., Lewin, K. F., and Nagy, J.: Elevated carbon dioxide and ozone alter productivity and ecosystem carbon content in northern temperate forests, Glob. Change Biol., 20, 2492–2504, https://doi.org/10.1111/gcb.12564, 2014.
Tuovinen, J. P. and Simpson, D.: An aerodynamic correction for the European ozone risk assessment methodology, Atmos. Environ., 42, 8371–8381, https://doi.org/10.1016/j.atmosenv.2008.08.008, 2008.
UNECE: Global Forest Resources Assessment, https://fra-data.fao.org/assessments/fra/2020 (last access: 15 May 2025), 2020.
Vlasáková, L., Marková, J., Tognet, F., Horálek, J., and Colette, A.: Evaluation of European-wide map creation of flux-based ozone indicator POD for selected tree species (Eionet Report – ETC HE 2022/23), European Topic Centre on Human Health and the Environment, ISBN 978-82-93970-40-8, 2022.
Volz, A. and Kley, D.: Evaluation of the Montsouris series of ozone measurements made in the nineteenth century, Nature, 332, 240–242, https://doi.org/10.1038/332240a0, 1988.
Wittig, V. E., Ainsworth, E. A., Naidu, S. L., Karnosky, D. F., and Long, S. P.: Quantifying the impact of current and future tropospheric ozone on tree biomass, growth, physiology and biochemistry: a quantitative meta-analysis, Glob. Change Biol., 15, 396–424, https//doi.org/10.1111/j.1365-2486.2008.01774.x, 2009.