the Creative Commons Attribution 4.0 License.
the Creative Commons Attribution 4.0 License.
 | 14 Aug 2025
Covariation of redox potential profiles and the water table level at peatland sites representing different drainage regimes: implications for ecological modelling
Markku Koskinen
Jani Anttila
Valerie Vranová
Ladislav Holík
Kevin Roche
Michel Vorenhout
Mari Pihlatie
Raija Laiho
Reduction–oxidation (redox) reactions are ubiquitous in nature and are responsible for the energy acquisition of all organisms. Redox reactions are electron transfer reactions that necessarily involve two participants: one being oxidised (electron donor) and one being reduced (electron acceptor).
The availability of terminal electron acceptors (TEAs) is a major determinant of the extent to which carbon in organic matter can be oxidised in an ecosystem. This is most important under waterlogged conditions, such as in peatlands, where the diffusion of O2, the most effective common TEA, into soil is blocked by water. Under these conditions, alternative TEAs can be used by microbiota to continue organic matter oxidation.
Decomposition processes in soil can be characterised by its redox state, i.e. which TEA is responsible for organic matter oxidation at a given time. This can, in principle, be measured as a voltage between the soil solution and a known reference electrode, known as the redox potential.
Current soil ecosystem models do not depict the use of alternative TEAs well. This limits their applicability for predicting soil carbon loss under different drainage regimes and, thus, their usefulness for assessing the best management practices for soil carbon preservation and water course protection. The most common determinant of the mode of decomposition presently used in ecosystem models is the water table level (WTL), which relies on the assumption that the redox state of a peatland ecosystem responds predictably to changes in the WTL.
We conducted a 2-year redox monitoring experiment in a boreal mesotrophic peatland under three drainage regimes: undrained, short-term drainage, and long-term drainage. In addition, an ombrotrophic plot that had undergone long-term drainage was monitored. Snapshot assessments of the activity of three major metabolic enzymes – arginine deaminase, protease, and urease – were also undertaken at the mesotrophic plots as an indicator of differences in microbial activity between drainage regimes.
We found that the WTL was a poor temporal predictor of redox potential but that (1) the position of major transition zones between oxic and anoxic states and (2) enzymatic activities within the peat profile were somewhat determined by the dominant WTL depth. In the undrained plots especially, redox potential values reflecting oxic or suboxic conditions were often found below the WTL, whereas anoxia was present above the WTL at the drained plots. Preceding redox potential was found to affect the activities of protease and urease but not arginine in all plots.
- Article
(11912 KB) - Full-text XML
-
Supplement
(3314 KB) - BibTeX
- EndNote


Reduction–oxidation (redox) reactions are central to the energy acquisition processes of all life. All redox reactions consist of an atom donating an electron (being oxidised) and an atom accepting an electron (being reduced). In soils, there is usually no shortage of electron donors, with the most usual source being organic matter; thus, energetically feasible redox reactions are generally limited by which electron acceptors are available (Green and Paget, 2004).
Many elements found in soils alter their behaviour according to their redox state. As an important example, iron (Fe) is mainly found in non-water-soluble compounds in its oxidised ferric Fe3+ (Fe(III)) state, whereas it is soluble in its reduced ferrous Fe2+ (Fe(II)) state. This has implications for the movement of elements in soil solution. For example, phosphorus (P) forms complexes with Fe(III) compounds that may then “unravel” when Fe is reduced, making the P available to soil solution (e.g. Zak et al., 2004).
The strongest common oxidising element in soil systems is oxygen (O2). This is consumed whenever available, and such reactions release the most energy. When the availability of O2 is limited, e.g. under waterlogged conditions, other terminal electron acceptors (TEAs) will be used. Common TEAs in soils include, in descending order of available energy, nitrate (), manganese(III) (Mn3+), Fe(III), sulfate (), and carbon dioxide (CO2), each of which require increasing electron activity (pe) in the soil solution to be energetically feasible. This can be measured against a redox pair of known activity to provide the redox potential (Eh, V).
Redox processes in soils, whether mineral or organic, are an interplay between microbes, their enzymes, and purely chemical reactions (i.e. both biotic and abiotic drivers). Which process is dominant will depend on the relative availability of oxidants and the activity of H+, i.e. the environment's pH. For example, Fe(III) may be reduced to Fe(II) either biotically, by microbes oxidising organic carbon (C), or chemically, by reduced (i.e. electron-rich) humic substances (Melton et al., 2014). Under more extreme circumstances, Fe(III) may also be reduced by archaea in the anoxic oxidation of CH4 (Ettwig et al., 2016). As microbe activity is often the dominant factor affecting the redox status, it is conceivable that changes in Eh could be more rapid under conditions where microbes are more active, reflected by microbial enzyme activity in the soil.
In peatlands, the activity of oxidative and hydrolytic enzymes produced by microorganisms will be regulated by the site's vegetation cover, soil water regime, temperature, and nutrient availability, along with interactions between physicochemical factors, such as changing pH or redox Eh (Freeman et al., 1996; Bonnett et al., 2006). Interactions between redox conditions, extracellular enzyme activity, and the persistence of phenolic substances are complex. For example, Freeman et al. (2001) hypothesised that a process termed “enzymatic capture” occurs due to the accumulation of phenolic substances (phenolic dissolved organic matter, or phenolic DOM) and their persistence in the soil. This condition occurs when phenoloxidase activity is suppressed under anoxic conditions. The accumulation of these phenolic substances leads to the inhibition of hydrolytic enzyme activity, e.g. of protease or urease (Kane et al., 2019), and has been suggested as one mechanism leading to the stabilisation of peat C (Freeman et al., 2004).
Humic substances, prevalent in organic soils such as peat, have been found to act as both TEAs and donors, potentially reducing CH4 emissions from boreal peatlands by a large factor (Klüpfel et al., 2014). The Eh of humic acid reduction reactions, for example, has been shown to range between +150 and −300 mV, thus overlapping with several non-organic electron acceptors (Aeschbacher et al., 2011). Furthermore, the electron-accepting capacity of organic matter has been found to be greater in ombrotrophic than minerotrophic peats (Keller and Takagi, 2013). Finally, other non-O2 electron acceptors have been found to inhibit the production and/or promote the oxidation of CH4 (Kumaraswamy et al., 2001).
Generally speaking, current ecological models used for predicting ecosystem C and nutrient fluxes (1) only include an oxic–anoxic state controlled by the soil permeability and water table level (WTL) (Palviainen et al., 2024); (2) ignore redox altogether and base their estimates on the WTL and/or soil moisture and temperature only (e.g. Gong et al., 2013); or (3) use only one electron acceptor other than O2, e.g. (Wriedt and Rode, 2006) or Fe(III) (Tang et al., 2016). To improve such models, reactions of TEAs other than O2 need to be modelled. A first step in this direction would be to model the redox state of a peatland empirically, using easily measurable (and computationally cheap) variables and site properties to predict the momentary Eh.
Northern peatland ecosystems generally have a high WTL, which has encouraged the sequestration of huge amounts of C under anoxic conditions (e.g. Yu et al., 2010). At such sites, any variation in soil redox Eh due to changes in the WTL could unlock the stored C into non-water-soluble and microbially degradable forms (Freeman et al., 2001). Indeed, the ecological characteristics of such wet and relatively nutrient-rich fens and of the C stored in the peat have been shown to be particularly sensitive to any decrease in the WTL (Straková et al., 2012; Jaatinen et al., 2007; Gong et al., 2013; Kokkonen et al., 2019).
It is generally believed that redox conditions in peatlands are regulated by the WTL through its effect on soil O2 concentrations; i.e. in water-logged soil, the water blocks gas movement between the atmosphere and the soil matrix (e.g. Belyea, 1999; Blodau et al., 2004; Kiuru et al., 2022). However, covariation of the WTL and soil redox Eh at different depths in peat soils has not been examined in detail. In dense peat especially, the depth distribution of redox processes may be insensitive to WTL fluctuations (Knorr and Blodau, 2009). In freshwater tidal wetlands, for example, redox Eh has been shown to fluctuate at 20 cm depth but not at 50 cm, despite the WTL fluctuating between −40 and +18 cm (Seybold et al., 2002).
In recent years, there has been growing interest in defining the best approach for describing redox phenomena in ecosystems. For example, it has been suggested that only assessing the Eh state of an ecosystem or soil profile should be amended by examining the resistance of that system to change under redox conditions, i.e. its redox buffering capacity (Burgin and Loecke, 2023). In such cases, the following could be postulated:
-
TEAs other than O2 and CO2 may play a significant role in an ecosystem's redox palette.
-
The readings given by Eh measurement devices reflect the dominant redox pair in an ecosystem at a given time.
-
Under increasingly anoxic conditions, Eh should “pause” its descent at values reflecting the available TEAs.
-
The probability distribution of Eh values measured in such an anoxic ecosystem should express multi-modality rather than bi-modality, which would be indicative of an O2–CO2-dominated system.
From a modelling perspective, this would indicate that current peatland models that do not recognise TEAs other than O2 would work better on ombrotrophic than on minerotrophic sites, as more TEAs are present in minerotrophic peatlands.
In this study, we examine the effects of WTL fluctuation on soil solution redox Eh at different depths in a mesotrophic sedge fen site (ME) situated in a minerotrophic peatland in southern Finland. Four plots were examined, comprising three ME plots with different soil WTL (drainage) regimes, i.e. wet (undrained control), short-term water-level drawdown (15 years), and long-term drawdown (55 years), along with a bog plot that has undergone long-term drainage at an ombrotrophic site (OM) in the same peatland massif, used for comparison. In each case, WTL drawdown has had marked impacts on the local peat properties (e.g. chemical composition, density, and pH), vegetation cover, and soil microbial communities (Straková et al., 2011; Peltoniemi et al., 2012). Consequently, we hypothesise that the drainage regime and the ensuing depth range of WTL fluctuation will be reflected in the depth at which redox conditions are at their most dynamic, i.e. at ME plots, with the wet undrained plot having WTL fluctuations and redox dynamics occurring close to the peat surface, the plot that has undergone long-term drainage having fluctuations at the greatest depth, and the plot that has undergone short-term drainage lying somewhere between.
We also tested for relationships between the WTL and Eh under the different drainage regimes employing an analysis of wavelet coherence between the WTL and Eh conditions, using both Eh values from individual sensors at different depths and the depth isopotential of 0 mV Eh, indicative of Fe reduction.
Our second hypothesis is, therefore, that Eh from sensors in the most active peat layer in terms of alternating redox conditions will follow fluctuations in the WTL and that the 0 mV Eh isopotential will consistently follow the WTL.
Third, we hypothesise that the lower levels of alternative TEAs in the OM plot will cause Eh conditions to become reducing more quickly after a rise in the WTL compared with the ME plots. This will be revealed as a lower phase difference, i.e. lag time, in a wavelet coherence analysis at the OM plot compared to the ME plots and as a more extreme distribution of δEh in the plot that has undergone long-term drainage compared to the wet, undrained plot.
Fourth, we hypothesise that the lack of alternative TEAs at the OM plot will be expressed as bi-modality in the probability density distribution of Eh measurements and that the presence of alternative TEAs at the ME plots will be expressed as multi-modality.
Finally, we test whether “snapshots” of soil enzyme activity at the ME plots correlate with preceding redox conditions and drainage status. For this study, we selected hydrolytic enzymes, i.e. proteases, ureases, and arginine deaminases, knowing that their activity can be affected by phenolic substances. We did not investigate the activity of oxidative enzymes, as this issue has already been thoroughly investigated by other authors. Thus, our fifth hypothesis is that the more aerobic conditions at the drained plots will be reflected in increased enzyme activity compared to the wet, undrained plot.
2.1 Measurement sites
This study took place at the Lakkasuo mire, a raised bog complex with a large minerotrophic lag, in southern Finland (61.797° N, 24.309° E). In 1961, half of the mire complex was drained to improve forest growth, which created conditions under which the impact of persistent WTL drawdown could be studied on plots either side of a border ditch, both of which shared similar hydrological conditions, vegetation cover, and soil properties prior to drainage (e.g. Minkkinen et al., 1999). The surface layer of the undrained minerotrophic fen receives groundwater from the Vatiharju esker bordering the mire complex in the west, potentially bringing in electron acceptors such as Fe to the ME plots (Sallantaus and Kaipainen, 1996).
In 2001, several new experimental WTL drawdown plots were established that had conditions allowing the study of shorter-term impacts (e.g. Straková et al., 2012; Kokkonen et al., 2019). These measurement plots were positioned to represent three WTL regimes: an undrained plot (ME-UD), a short-term (ca. 15 years at the time of study) persistent-WTL-drawdown plot (ME-STD), and a long-term (ca. 55 years) persistent-WTL-drawdown plot (ME-LTD) (Fig. 1). Conditions at the STD plot were maintained via narrow, ca. 30 cm deep ditches that conducted surface water into the border ditch. An initially ca. 1 m deep ditch network within the LTD area had not been intensively reconditioned for some years, thus the drainage effect was less effective than would have been the case at more intensively managed forest sites. In addition, a comparative ombrotrophic (OM) plot under an LTD regime (OM-LTD) was located on the same peatland massif, ca. 500 km from the ME-LTD plot.
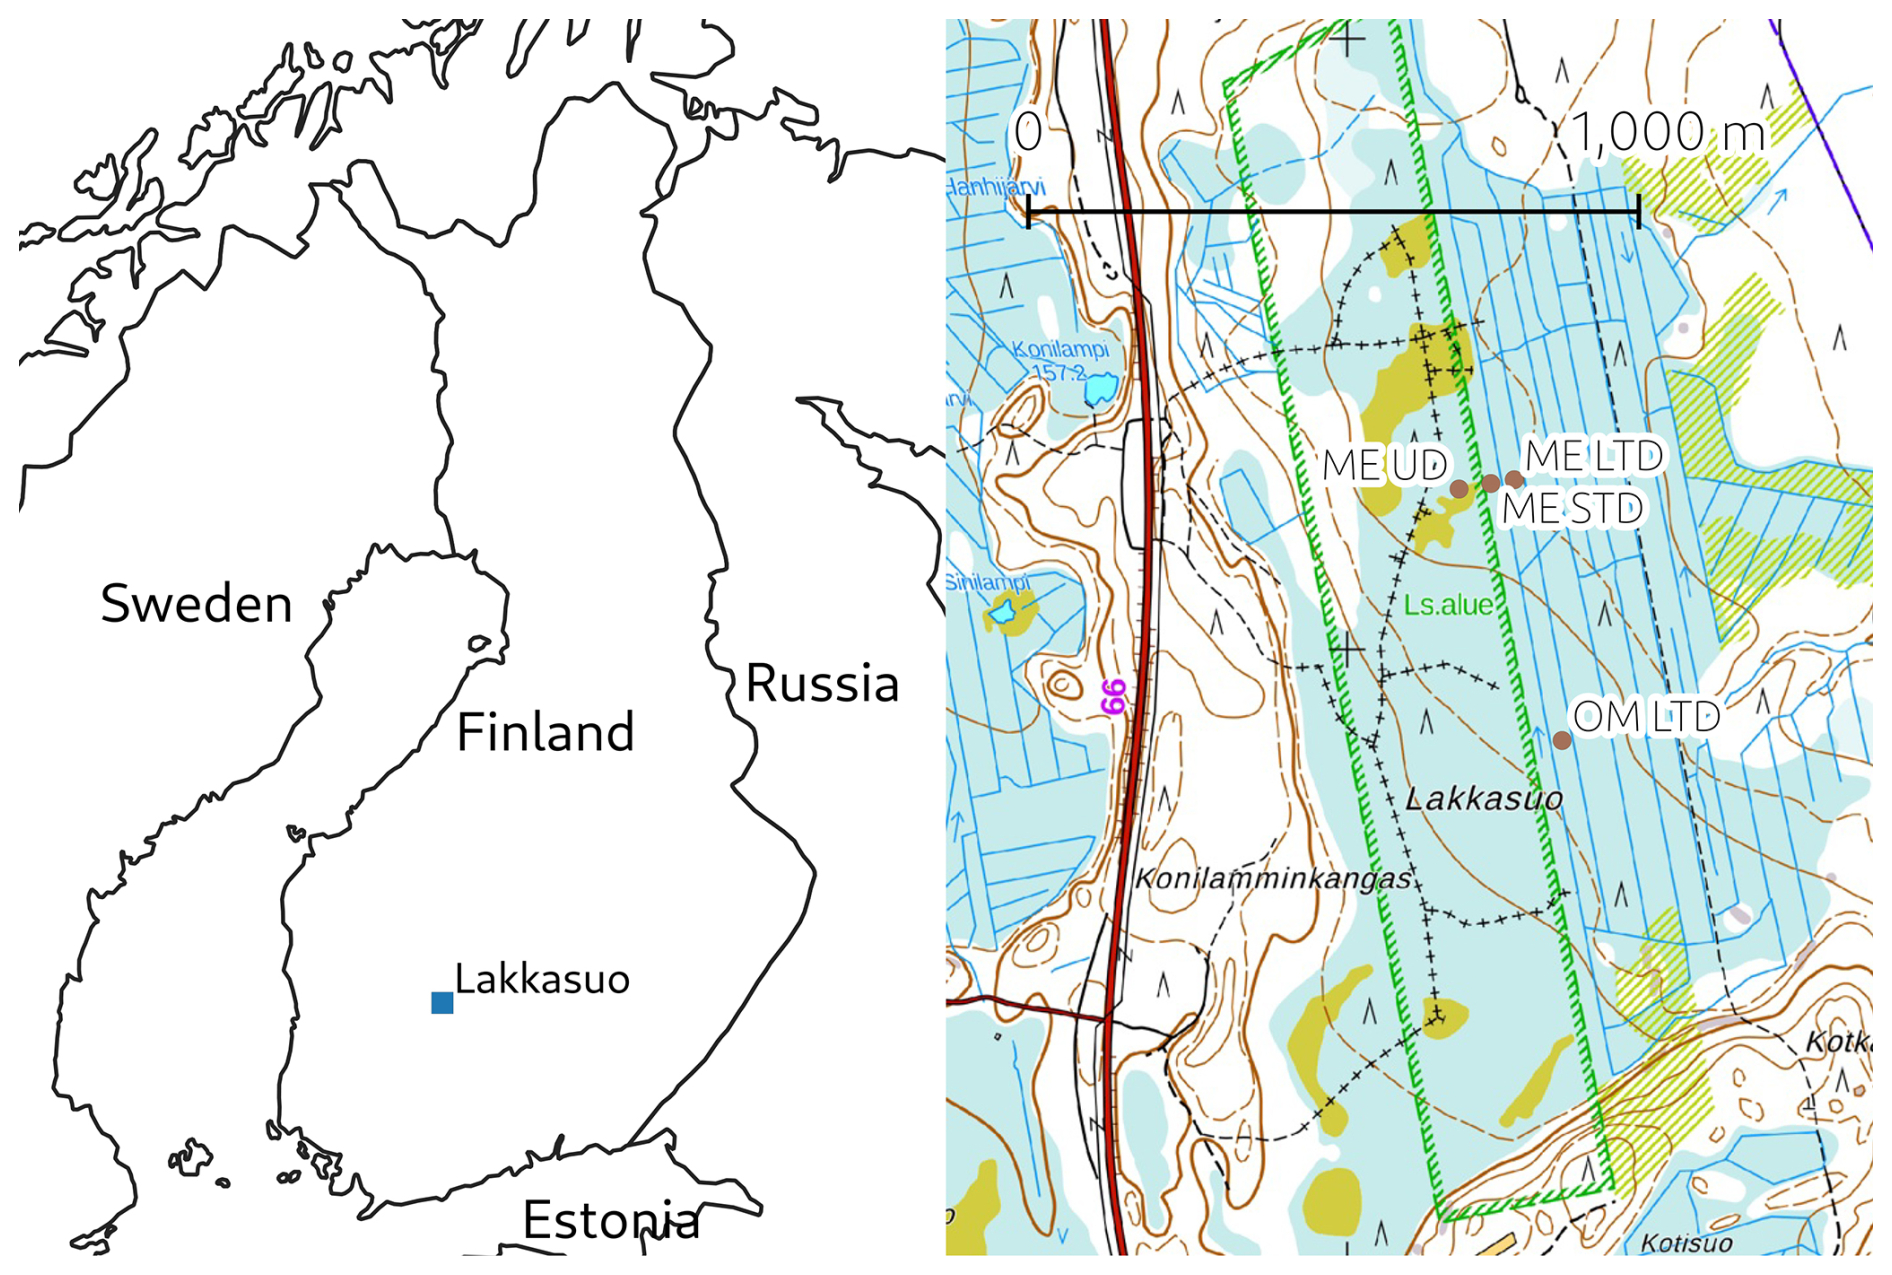
Figure 1Left: location of the measurement site (made with Natural Earth). Right: map of the Lakkasuo mire (north at top), with the measurement plots marked (background map: National Land Survey Of Finland topographic map, April 2024; the hatched green rectangle is a feature of the topographic map defining the perimeter of a nature conservation area).
The different WTL regimes being examined were reflected in the composition of plant communities on the plots. For example, the ME-UD plot supported typical boreal, mesotrophic, open-mire vegetation that was dominated by sedges, such as Carex lasiocarpa (woollyfruit sedge) and C. rostrata (beaded sedge), with some forbs, such as Menyanthes trifoliata (bog bean) and Comarum palustre (swamp cinquefoil), shrubs, such as Betula nana (dwarf birch) and Salix sp. (willows), and several moss species, the most common being the peat mosses Sphagnum fallax and S. flexuosum. On the ME-STD plot, the lowered WTL had already had a significant effect on the vegetation (Kokkonen et al., 2019), with the original sedges and forbs having largely been replaced by species tolerating drier conditions, such as C. echinata (star sedge), C. canescens (silvery sedge), Calamagrostis spp. (reed grass), Cirsium palustre (European swamp thistle), and Trientalis europaea (arctic starflower). A dense spread of Pinus sylvestris (Scots pine) and Betula pubescens (Downy birch) seedlings had started to form an overstorey layer, and although it was sparse, the moss layer included several species. The ME-LTD plot could be classified as a mesotrophic peatland forest (Vaccinium myrtillus type II in the local classification), with surface vegetation characterised by shrubs, such as Empetrum nigrum (black crowberry), V. myrtillus (bilberry), and V. vitis-idaea (lingonberry), and with Eriophorum vaginatum (cottongrass) being the most common sedge. The tree stand comprised P. sylvestris and B. pubescens, with some Picea abies (Norway spruce), while the moss layer was dominated by Pleurozium schreberi (feathermoss), with other moss species including the peat mosses S. russowii, S. medium, and some Dicranum (fork mosses) and Polytrichum (haircap moss) species. In comparison, the OM-LTD plot was classified as a nutrient-poor peatland forest, with Sphagnum mosses intermixed with forest mosses and with peatland shrubs, such as Andromeda polifolia (bog rosemary) and Vaccinium uliginosum (bog bilberry), sparsely present among E. vaginatum tillers.
Soil chemical properties (Laiho et al., 2024) at the ME plots reflected the typical effects of drainage on fen peats, i.e. a relative increase in C content and a decrease in nitrogen (N) content; a decrease in pH due to decomposition increasing the amount of organic acids in the soil; and the loss of soluble Earth metals such as magnesium (Mg) and potassium (K) (Fig. 2). From a redox perspective, the most important elements analysed were Fe and manganese (Mn), with the Fe content being significantly lower in the surface layer of LTD plots than in the STD and UD plots, whereas the Mn content showed no significant differences. While a soil chemical analysis was not available for the OM-LTD plot, concentrations of the most important elements for redox couples (i.e. Fe and Mn) on drained ombrotrophic–oligotrophic peatlands are known to be around one-fifth those present on drained mesotrophic sites (e.g. Laiho and Laine, 1995).
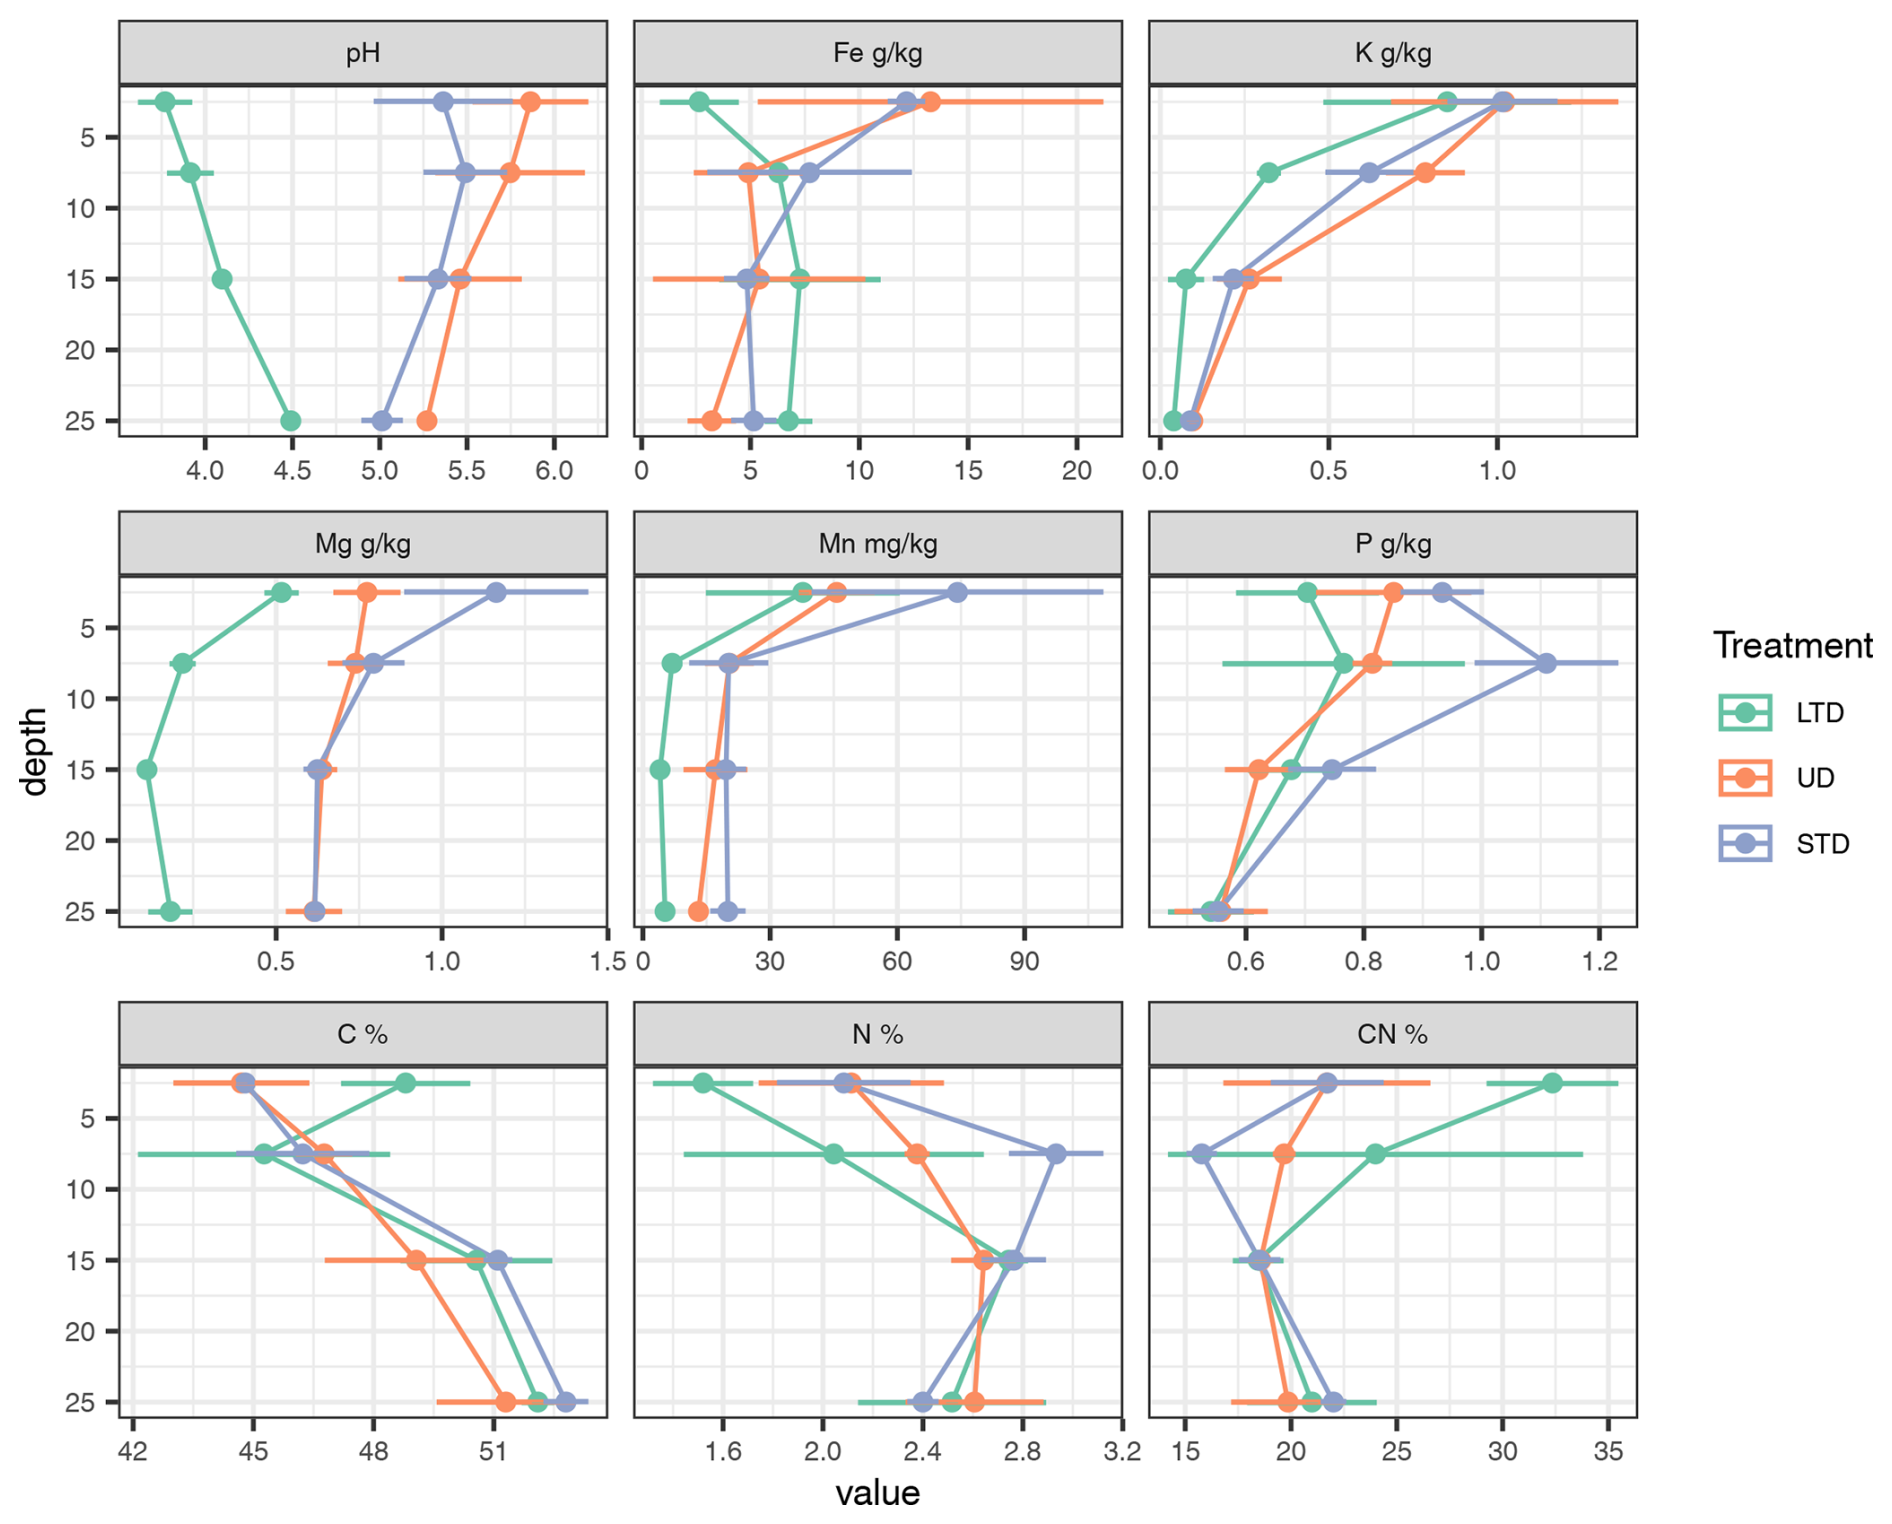
Figure 2Chemical properties of peat soils at the three mesotrophic study sites (means and standard deviation of three samples). Element concentrations are in milligrams (mg) or grams per kilogram (g kg−1) dry weight unless stated otherwise in the panel headers; depth is in centimetres (cm). Abbreviations and colour coding in the figure are as follows: LTD (green) – long-term drawdown; UD (red) – undrained; STD (blue) – short-term drawdown.
2.2 Redox sensors
Three redox probes (Vorenhout Consulting, the Netherlands) fitted with platinum (Pt) electrodes were installed at five depths (i.e. 5, 15, 25, 35, and 45 cm below the surface) at each measurement plot in early autumn 2014. A silver–silver chloride (Ag–AgCl) reference electrode was also installed in a groundwater well for each trio of probes. A Hypnos III logger system (Vorenhout Consulting, the Netherlands) (Vorenhout et al., 2011) was then used to record data from the probes at 15 min intervals continuously over 2 years, i.e. from autumn 2014 to autumn 2016. The redox measurement systems were calibrated beforehand according to Vorenhout et al. (2004) using a 220 mV (pH 7) reference solution.
2.3 Ancillary measurements
The WTL at each measurement plot was continuously monitored using TruTrack WT-HR1000 probes (Intech Instruments, New Zealand), while soil temperatures were monitored using iButton DS1921G temperature loggers (Maxim Integrated Products, USA) at the same depths as Eh (i.e. 5, 15, 25, 35, and 45 cm) at one point per treatment.
Soil pH was determined for each depth at each ME and OM plot on two occasions, October 2014 and May 2015, from peat samples obtained from the plots. The pH was measured under laboratory conditions using a slurry of one part peat to three parts water.
Activity of the enzymes arginine deaminase, protease, and urease were determined at ME plots as indicators of soil microbial activity at the same depths as redox measurements on peat samples obtained in October 2014, May 2015, and July 2015. Briefly, arginine deaminase activity was determined from soil samples incubated with arginine to produce ammonium (NH4); this was then extracted with a potassium chloride (KCl) solution, and the amount of extracted NH4 was determined colorimetrically (Alef and Kleiner, 1986). Deduction of protease activity was based on the decomposition of added casein during incubation and was determined colorimetrically by measuring the amount of L-tyrosine produced (Rejsek et al., 2008). Urease activity was determined by incubating the samples with added urea and colorimetrically determining the amount of NH4 released (Kandeler and Gerber, 1988).
Air temperature was measured continuously at 2 m above the soil surface near the measurement plots throughout the measurement campaign. Precipitation and snow depth were measured hourly at the SMEAR II measurement station, ca. 6 km from the plots (Aalto et al., 2023).
2.4 Data processing
The potential given by the Pt– pairs was converted to Eh by adding +200 mV to the reading to account for the difference in electrical potential between the Ag–AgCl reference electrode used in our set-up and the standard hydrogen electrode against which Eh values are reported. The readings were then corrected for H+ activity by applying the Nernst equation, i.e. , normalising them to pH 7. To reduce noise, the readings were averaged over an hour or over a day, depending on the analysis being undertaken. The data were further corrected for drift by fitting a linear model of Eh over time to the maximum (>400 mV) and minimum ( mV) readings, as grouped by the logger. Drift was determined at for the STD and LTD plots and at for the UD and OM-LTD sites.
Basic data processing and statistical analyses were undertaken using the R statistical package (R Core Team, 2023).
2.5 Linear and non-linear modelling
Linear and non-linear models, using hourly data, were fitted to assess differences in Eh response to the WTL between the ME measurement plots. Both the models and the results are described in more detail in the Supplement.
2.6 Wavelet analysis
The frequency spectra of hourly averaged redox potentials, soil temperatures, and WTL measurements were analysed using wavelet decomposition (Torrence and Compo, 1998) to identify patterns that would inform future directions for Eh modelling. Briefly, wavelet decomposition consists of fitting a wavelet function with different frequencies at each time point in a time series and estimating how well each of the frequencies fits the data, enabling identification of time patterns with above- and below-average values.
The coefficients were then compared against soil temperature and WTL changes via a cross-correlation spectrum, using a Mexican-hat-style wavelet function to achieve a sufficient temporal resolution (Wang, 2015). Owing to large differences between the probe Eh readings, wavelet fitting was undertaken separately for each probe and depth profile. All hourly wavelet analyses were performed using the PyWavelets package in Python (Lee et al., 2019). The full wavelet coherence figures are presented in Supplement Fig. S1.
In addition, wavelet coherence between the daily average WTL and the depth isopotential of Eh 0 mV indicative of Fe reduction was estimated based on the mean Eh of all three probes on all measurement plots using the WaveletComp package in R (Schmidbauer, 2018).
In this case, the depth isopotential was calculated by linearly interpolating daily average Eh depth profiles from 5 to 45 cm depth, using a random time series with the same Fourier transform properties as a surrogate time series to analyse the significance of coherence. Only those days on which the Eh 0 isopotential was present (i.e. the whole Eh profile was not above or below 0 mV) were included in the analysis.
Although there are differing views on how the Fe(III)/Fe(II)-related redox potential should be calculated, based on electrochemical theory and the number of protons involved in the processes (e.g. see Boonman et al., 2024), we chose 0 mV as the pH 7-normalised potential representing Fe reduction, based on the literature (e.g. Borch et al., 2010; Vorenhout et al., 2004) and our own experimental observations in the laboratory (Marttunen, 2024), where Fe addition to anaerobic peat incubations stabilised the Eh to around 0 mV. This is also supported by a study published by Pyzola et al. (2025), where Fe(II) started to appear in incubated slurries at close to 0 mV Eh.
3.1 Water table level
Differences in the WTL were significant (p<0.05) between all treatments, with the mean WTL values over the measurement campaign being −1.5, −13.8, and −26.8 cm for the ME-UD, ME-STD, and ME-LTD plots, respectively (Fig. 3). Fluctuations in the WTL were greatest for the LTD plot, while the STD and UD plots showed roughly the same magnitude of WTL fluctuation (i.e. between 0 and −15 cm).
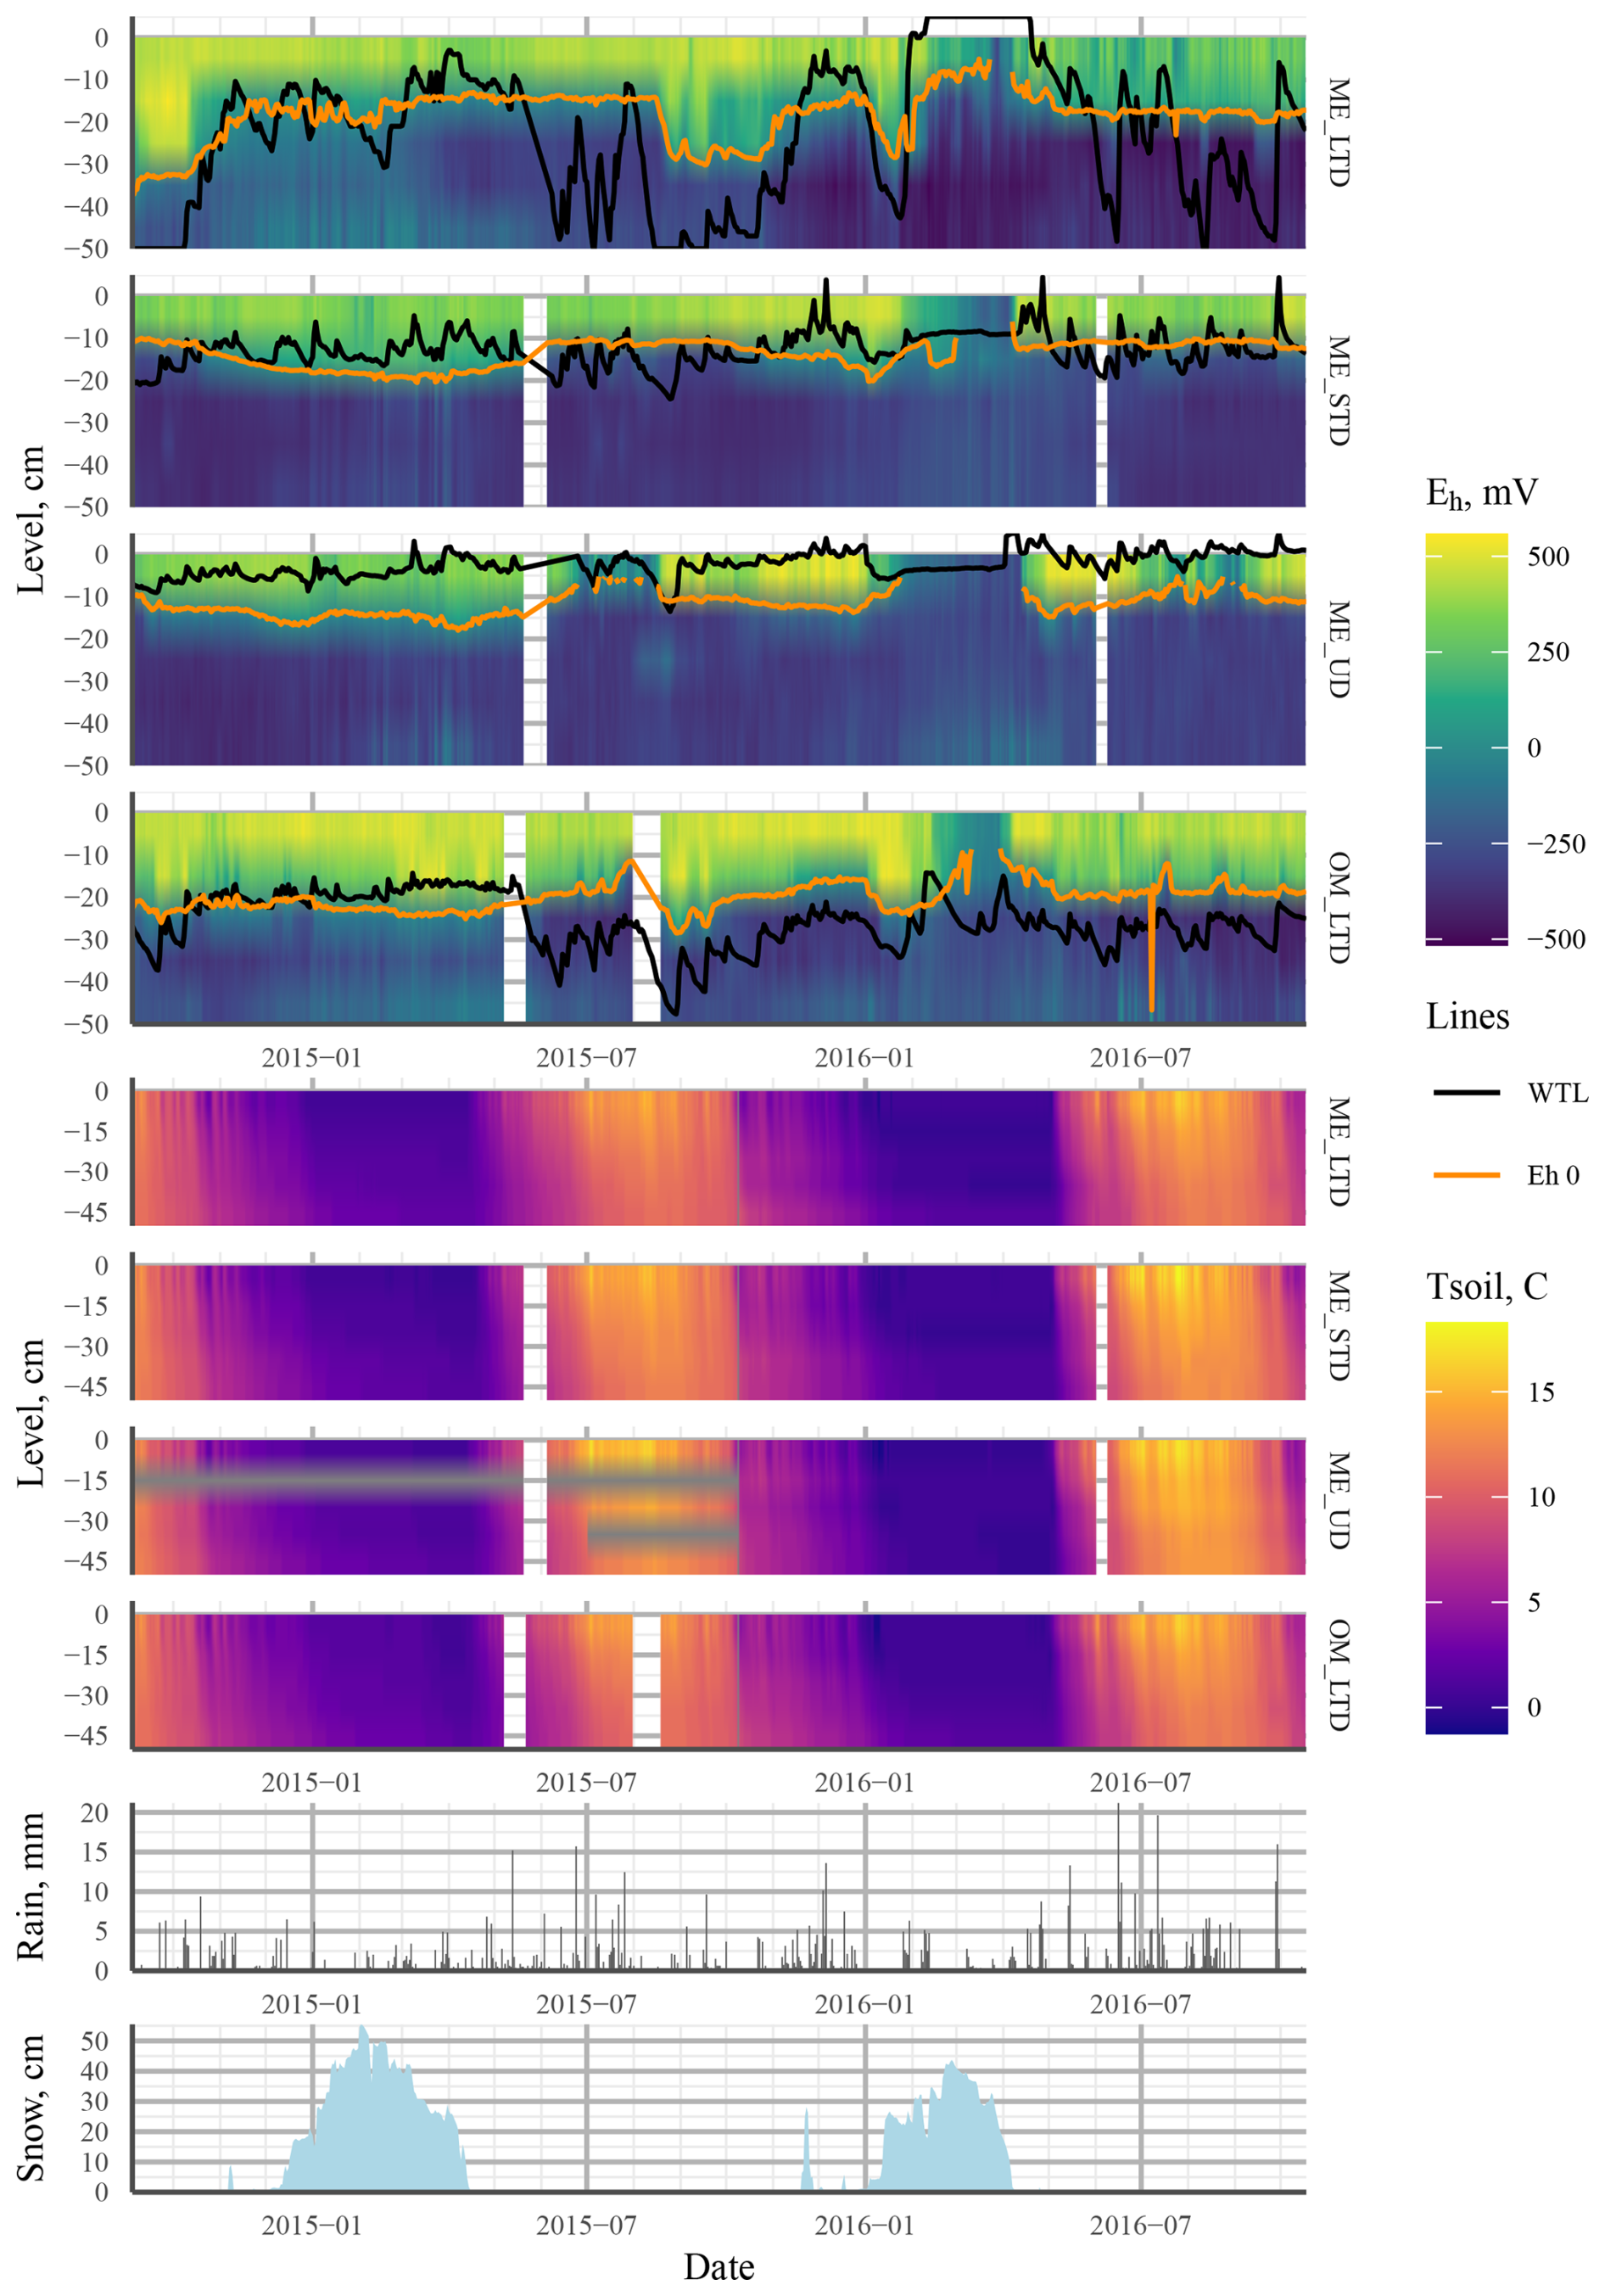
Figure 3Heat maps showing mean values (mean of three profiles per treatment) interpolated from the 5–45 cm depth profiles of Eh (four topmost plots: ME LTD, ME STD, ME UD, and OM LTD; WTL and the Eh 0 isopotential shown as solid black and orange lines, respectively) and soil temperature (four middle plots: ME LTD, ME STD, ME UD, and OM LTD). The bottom two plots present daily rainfall (mm) and snowpack thickness (cm) at the peatland over the study period. Abbreviations in the figure are as follows: ME – mesotrophic sedge fen; OM – ombrotrophic bog; UD – undrained; STD – short-term (∼15 years) drainage; LTD – long-term (∼55 years) drainage.
Wavelet analysis indicated clear seasonal patterns in the WTL fluctuation for the UD and LTD plots but not for the STD plot. This pattern was especially strong in the LTD plot, which showed below-average values from July to November and above-average values from January to May (Fig. 4). In comparison, temperature plots at all sites showed the opposite pattern. At the UD plot, the WTL fluctuated over a shorter period than at the LTD plot (UD 1000 h period vs. LTD 2000 h period) (Fig. 4).
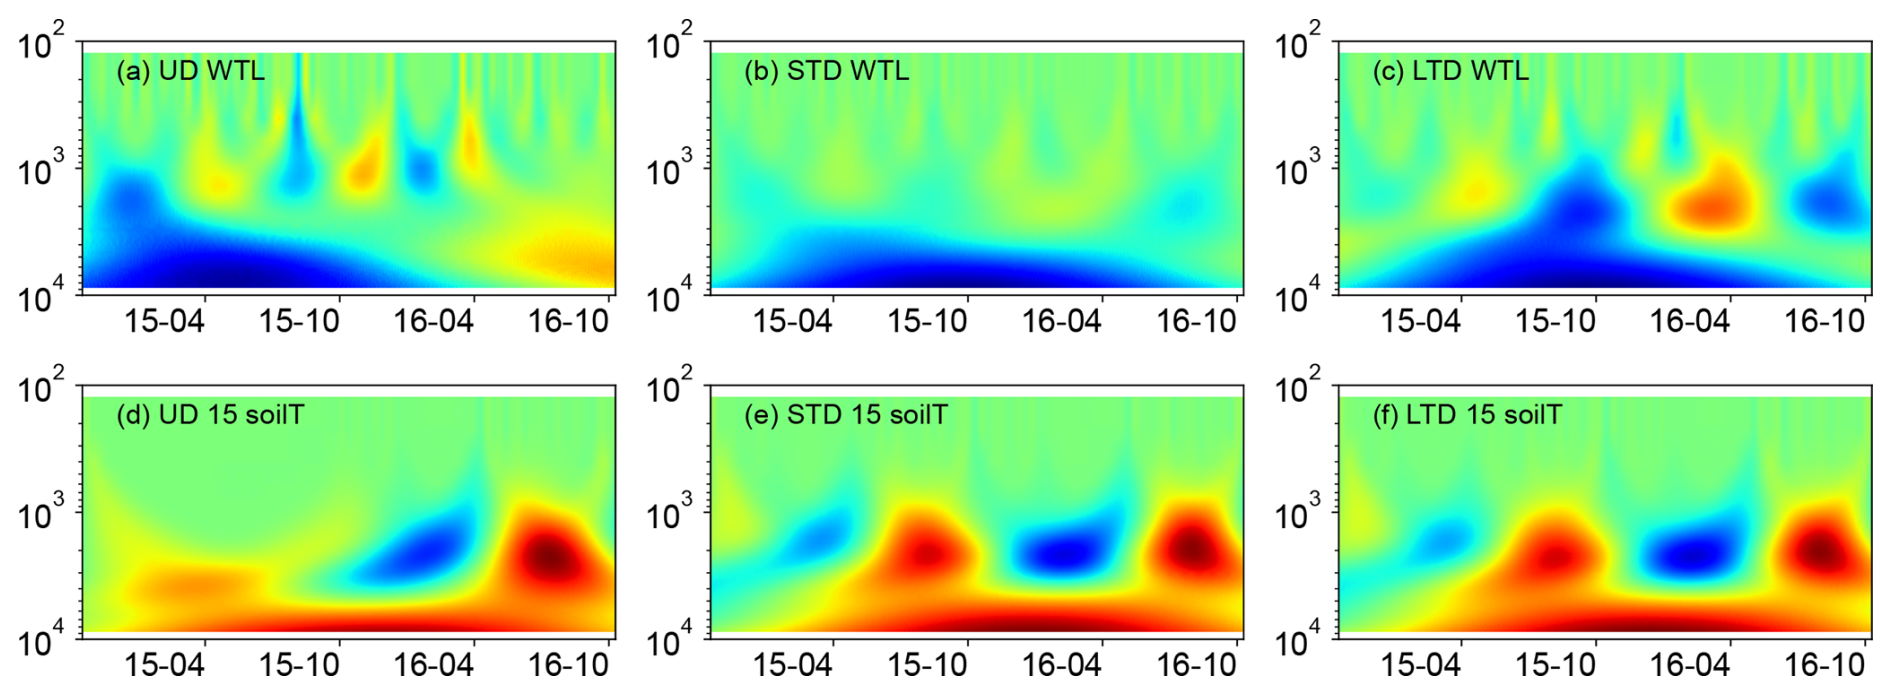
Figure 4Mexican hat wavelet coherence: WTL data from the (a) ME-UD plot, (b) ME-STD plot, and (c) ME-LTD plot; soilT data at 15 cm from the (d) ME-UD plot, (e) ME-STD plot, and (f) ME-LTD plot. Note the inverted y axes (wavelet period, h).
3.2 Redox
Generally speaking, Eh varied between oxic and completely anoxic in all profiles, with the 5 cm surface layer being over +400 mV and layers below 25 cm being <0 mV for all three treatments. The main difference between treatments was at 15 cm depth, where Eh was almost permanently below −200 mV after June 2015 at the UD plot, but it varied between +250 and −400 mV in the STD and LTD plots (Fig. 3).
While Eh values varied greatly between the three profiles for all treatments, especially at 15 cm depth (Fig. 3), sensitivity to change in the WTL differed between profiles, with some sensors showing no sensitivity to the WTL and others consistently reacting to WTL change.
Wavelet analysis revealed a periodic pattern of roughly 100 d (2000–3000 h) at differing depths for all plots. At the ME drained plots (STD and LTD), for example, the clearest patterns were observed at 15 and 25 cm depth (Figs. 5–7), whereas the strongest patterns were observed at 5 cm depth at the UD plot (Fig. 8). There were also additional shorter-period patterns at the UD plot, ranging from 200 to 500 h. At the STD plot, interactions between Eh and the WTL in the most active layers were mostly in synphase, i.e. a lowering the WTL (increasing the WTL depth) coinciding with rising Eh values, compared with an alternating counterphase and synphase interaction at the UD and LTD plots.
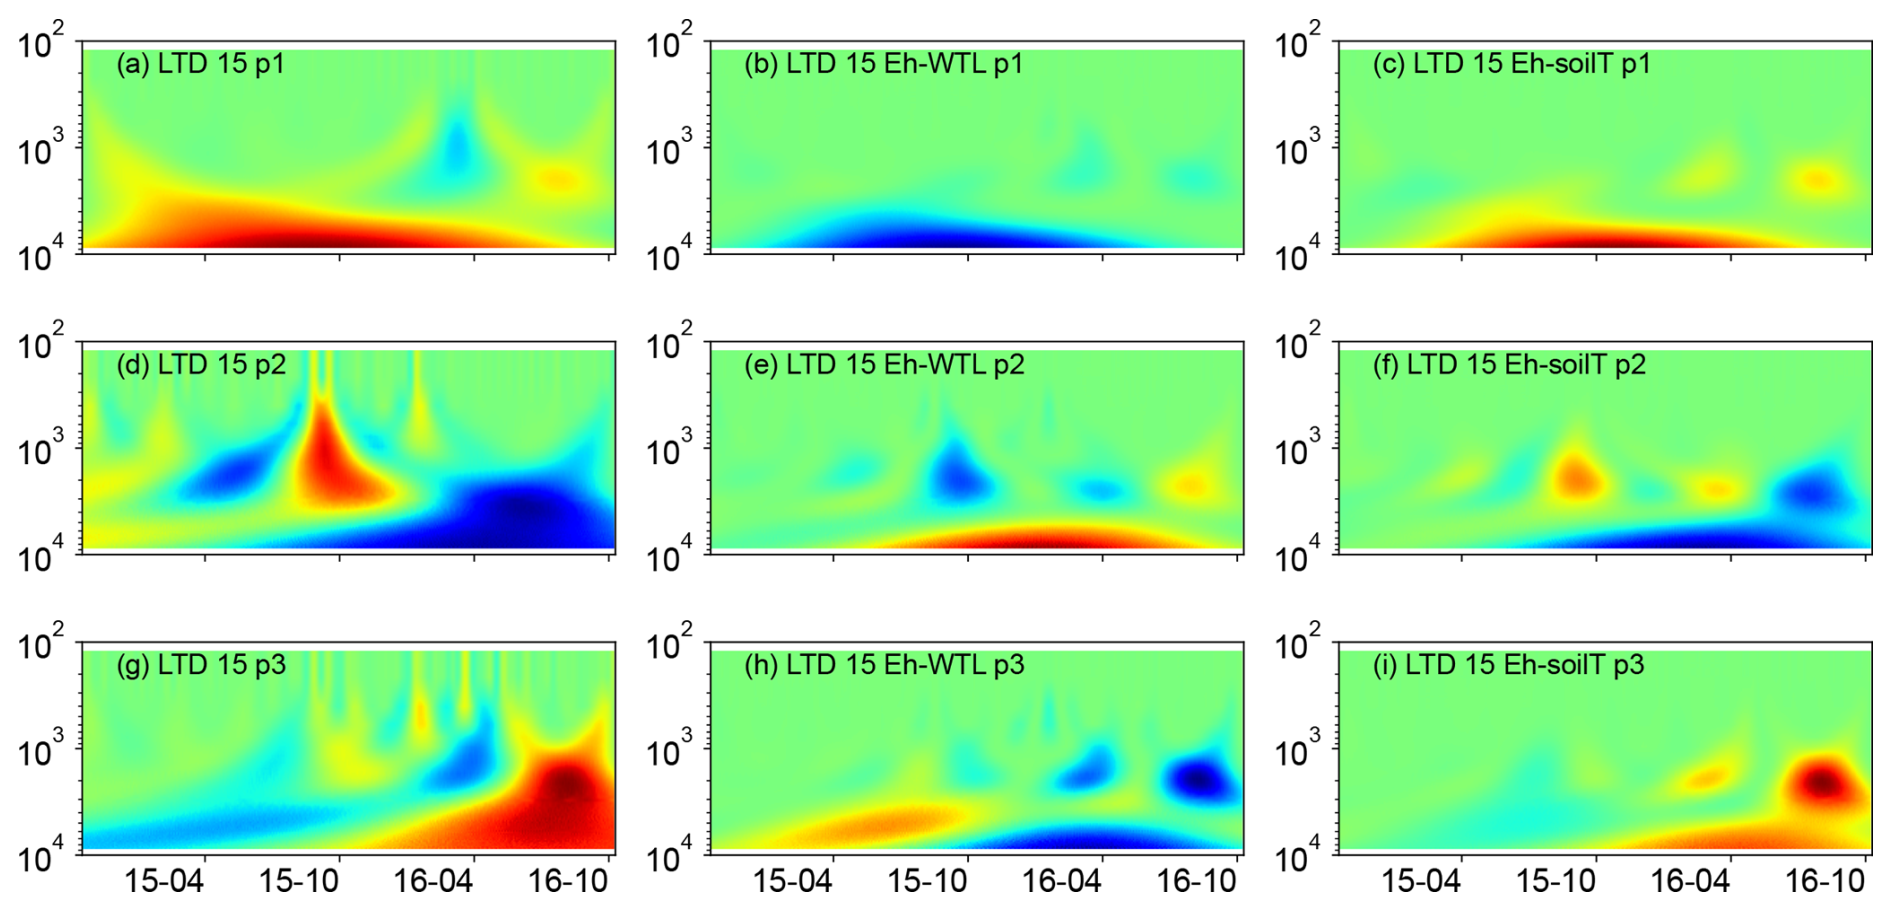
Figure 5(a, d, g) Wavelet coherence between the Mexican hat wave and Eh at the ME-LTD plot (15 cm depth). (b, e, h) Interaction between Eh and WTL wavelets. (c, f, i) Interaction between Eh and soil temperature wavelets at the LTD plot (15 cm depth). The three probes are plotted separately in the figure (labelled as p1, p2, or p3). Note the logarithmic, inverted scale (h) on the y axis. Dates are given as yy-mm on the x axis.
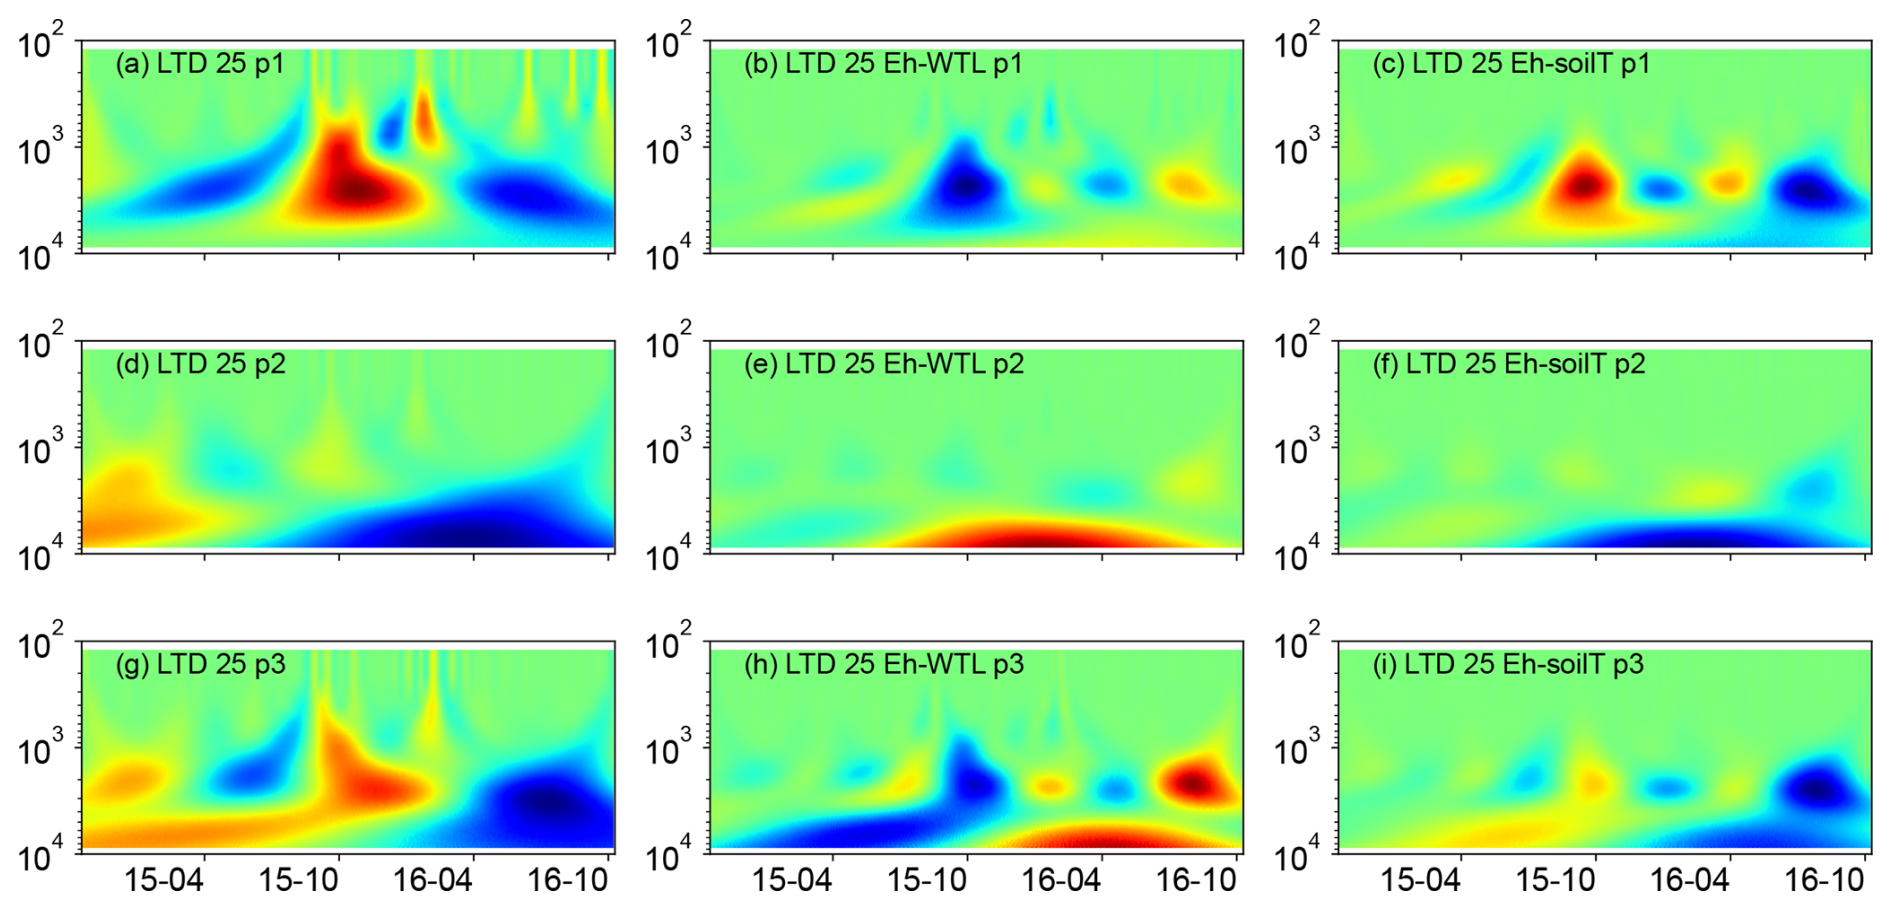
Figure 6(a, d, g) Wavelet coherence between the Mexican hat wave and Eh at the ME-LTD plot (25 cm depth), (b, e, h) Interaction between Eh and WTL wavelets. (c, f, i) Interaction between Eh and soil temperature wavelets at the ME-LTD plot (25 cm depth). The three probes are plotted separately in the figure (labelled as p1, p2, or p3). Note the logarithmic, inverted scale (h) on the y axis. Dates are given as yy-mm on the x axis.
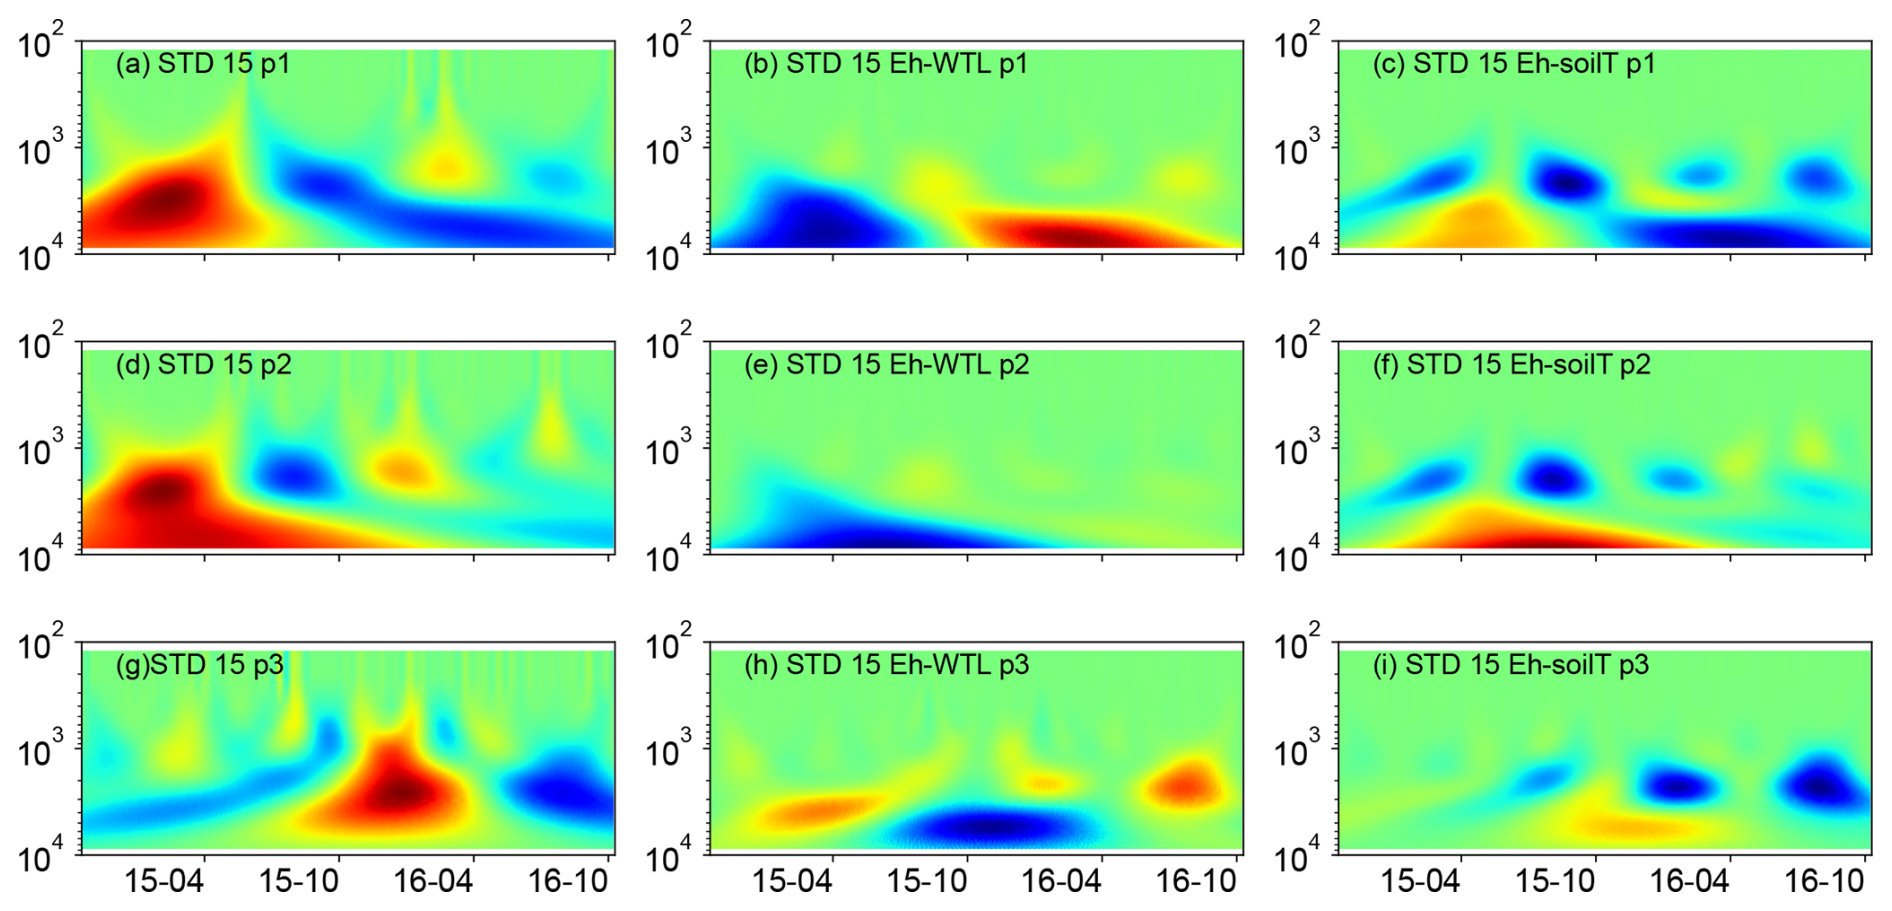
Figure 7(a, d, g) Wavelet coherence between the Mexican hat wave and Eh at the ME-STD plot (15 cm depth). (b, e, h) Interaction between Eh and WTL wavelets. (c, f, i) Interaction between Eh and soil temperature wavelets at the ME-STD plot (15 cm depth). The three probes are plotted separately in the figure (labelled as p1, p2, or p3). Note the logarithmic, inverted scale (h) on the y axis. Dates are given as yy-mm on the x axis.
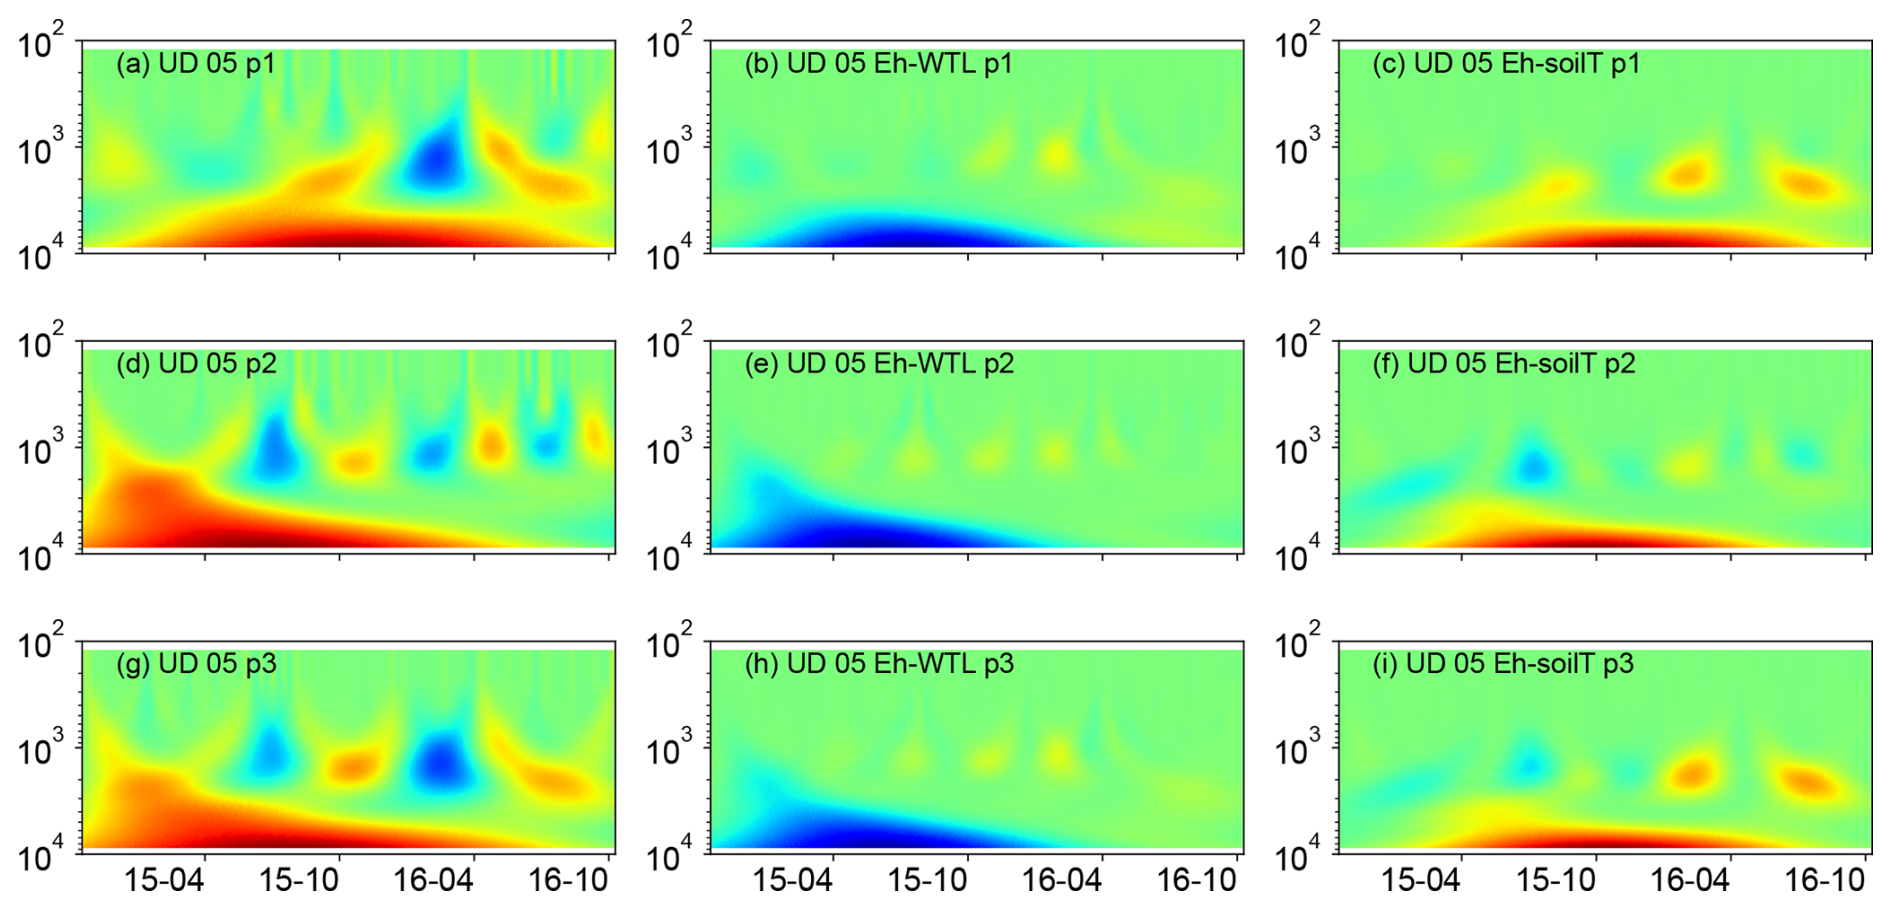
Figure 8(a, d, g) Wavelet coherence between the Mexican hat wave and Eh at the UD plot (5 cm depth). (b, e, h) Interaction between Eh and WTL wavelets. (c, f, i) Interaction between Eh and soil temperature wavelets at the ME-UD plot (5 cm depth). The three probes are plotted separately in the figure (labelled as p1, p2, or p3). Note the logarithmic, inverted scale (h) on the y axis. Dates are given as yy-mm on the x axis.
An analysis of coherence between the Fe-reducing depth isopotential (−100…+50 mV (Table 1), represented by the Eh 0 mV isopotential) and the WTL (Fig. 9) indicated 128 and 64 d periods of significant (p<0.05) coherence for all plots, but this was particularly prevalent for the LTD plot, where the WTL led the change during these periods. At the ME-STD and ME-UD plots, there were fewer periods of significant coherence, and phase differences alternated between the WTL and the Eh 0 isopotential leading.
Table 1Common redox pairs in soils and their corresponding field-observable Eh values (mV). All values are reported as pH 7normalised values, according to Borch et al. (2010) and Vorenhout et al. (2004).
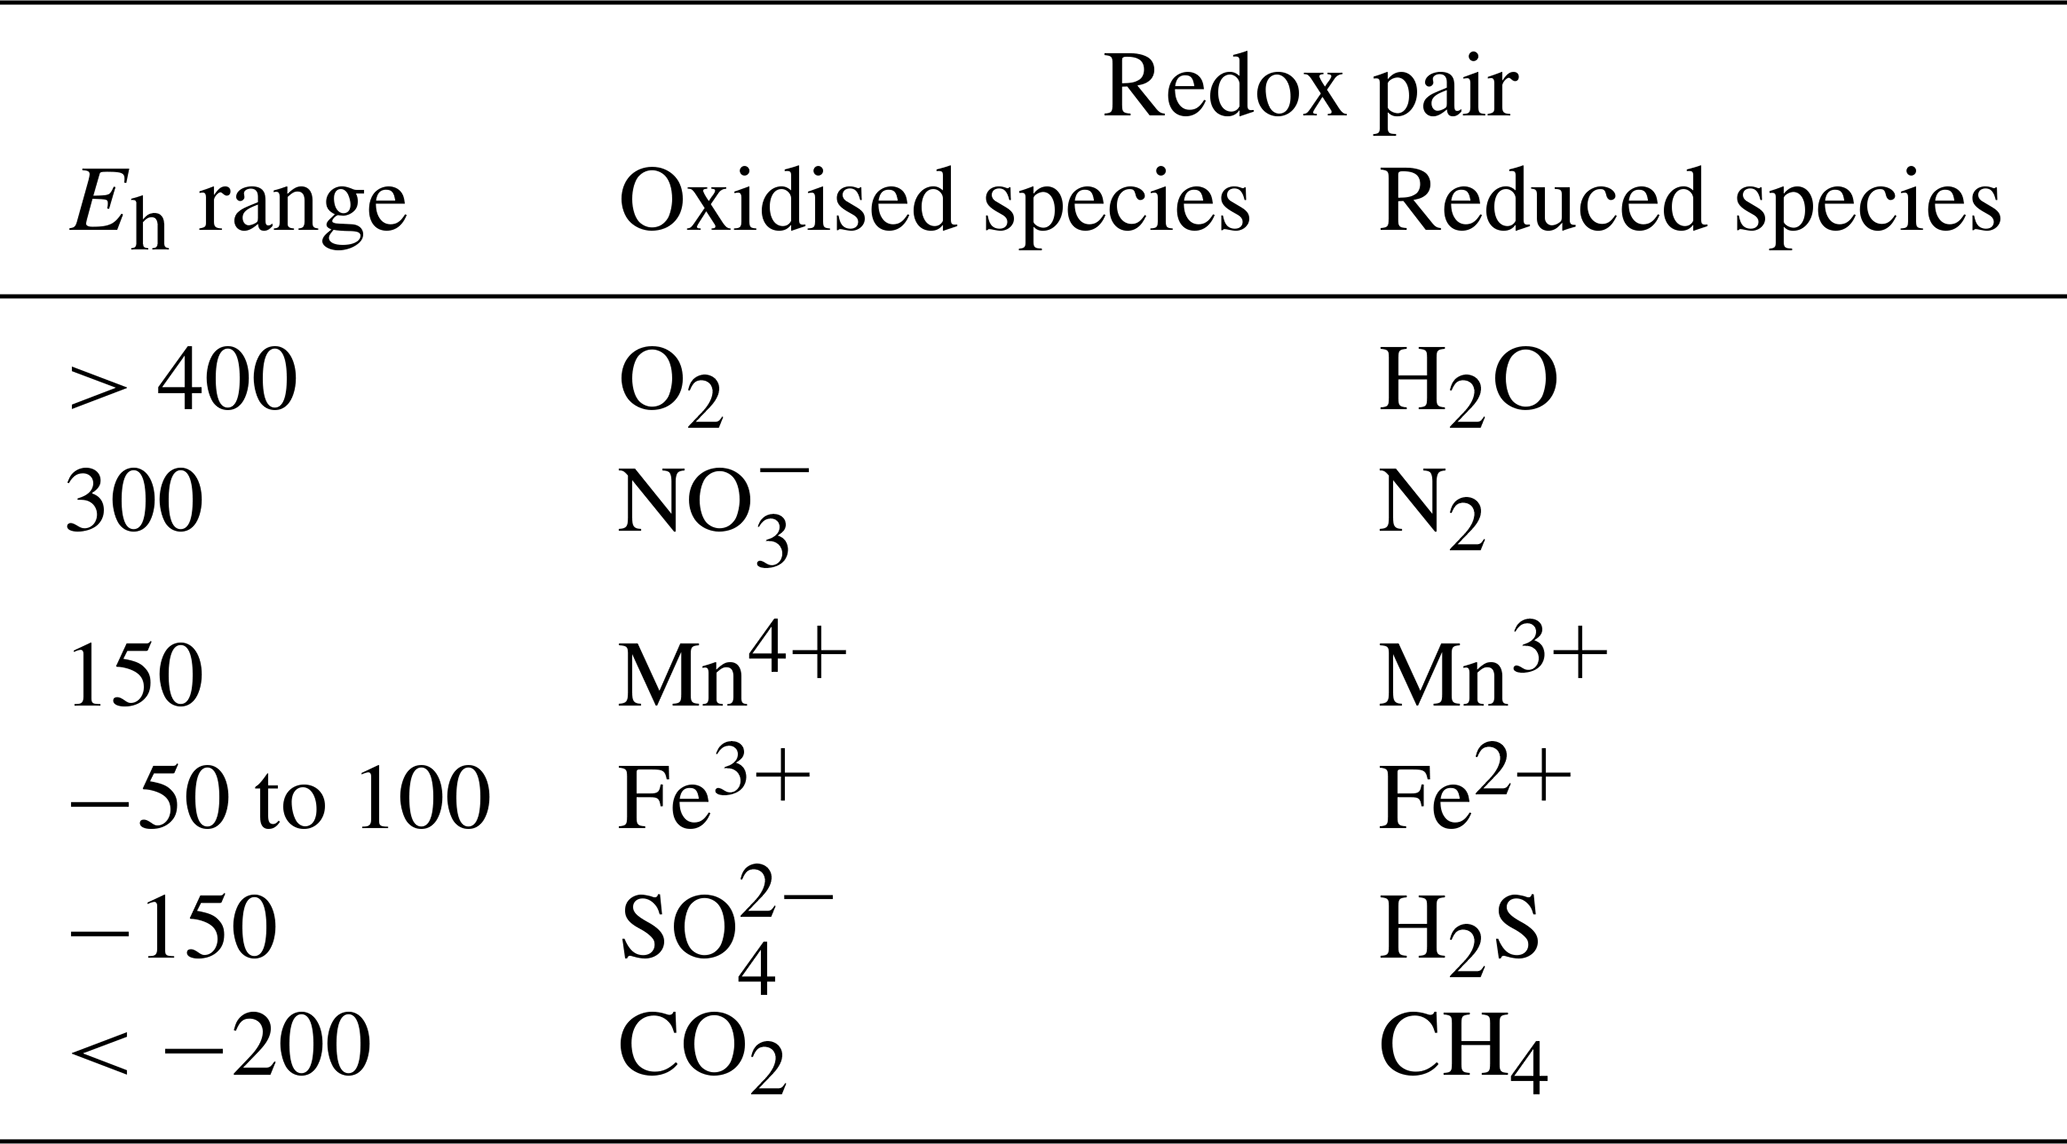
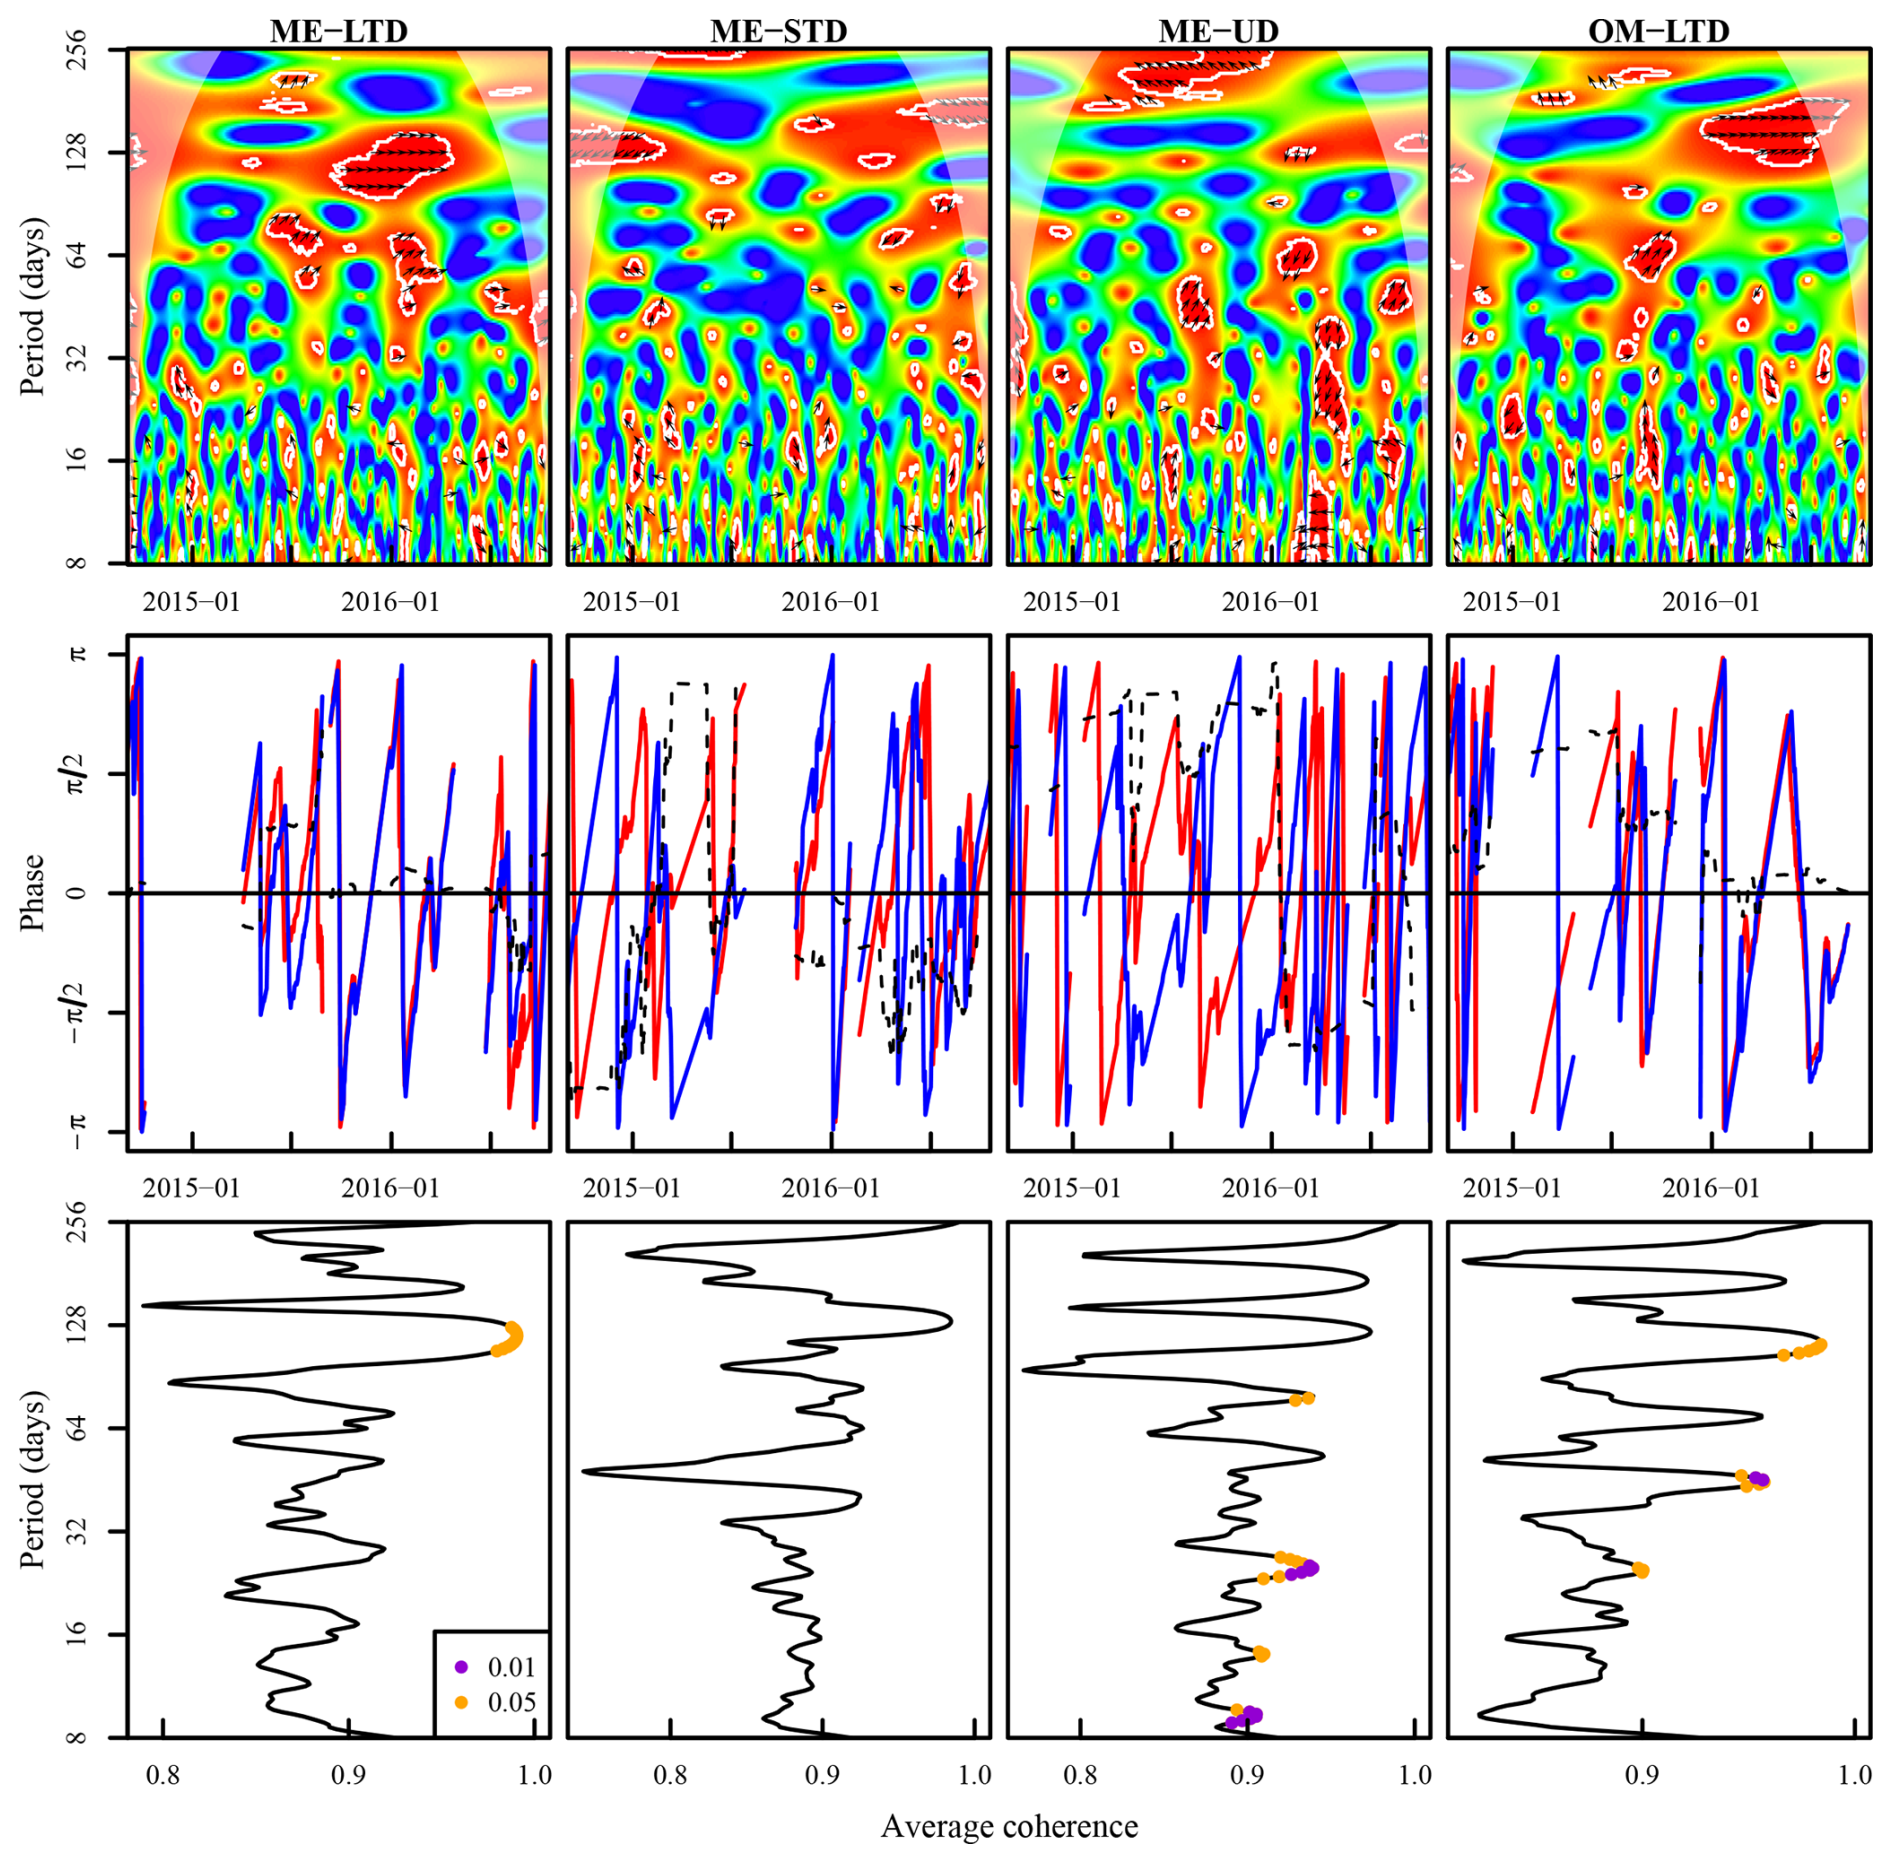
Figure 9Top row: wavelet coherence between the Eh 0 depth isopotential and the WTL. The colour code for the top row is as follows: blue areas – low coherence; red areas – high coherence; white outline – areas of significant coherence (p<0.05 vs. random time series with identical Fourier transform characteristics); black arrows – phase difference, with arrows pointing right denoting a synphase interaction, those pointing left denoting a counterphase interaction, those pointing right–up or left–down denoting that the WTL leads, and those pointing left–up or right–down denoting that the Eh 0 depth isopotential leads; areas shaded with white – cone of influence. Middle row: phases and phase differences during periods of significant coherence. The colour code for the middle row is as follows: blue line – phase of Eh 0 depth isopotential; red line – WTL phase; dashed black line – phase difference, with and denoting that the WTL leads and and denoting that the Eh0 isopotential leads. Bottom row: average coherence (x axis) per period length (y axis), with the period length of significant coherence denoted with orange and dark-violet points (p<0.05 and p<0.01, respectively). Measurement plots are indicated in the top-row panel titles. The x axes are aligned between panels in the first and second rows.
During the first winter, Eh remained above Fe-reducing levels in soil >15 cm depth at all plots, regardless of the WTL fluctuation or snowpack height. During the second winter, however, Eh values indicative of CO2 reduction were achieved at all plots, even at 5 cm depth (Fig. 3).
A comparison of Eh probability densities at 25 cm depth for the ME-LTD and OM-LTD plots (where most Eh dynamics occurred) indicated bi-modality between O2 reduction and CO2 reduction at the OM-LTD plot and multi-modality, with peaks at Eh levels corresponding to O2, Fe3+, and CO2 reduction, at the ME-LTD plot (Fig. 10). Inundation of the sensor had a more pronounced effect at the ME plot, shifting the distribution toward lower Eh values.
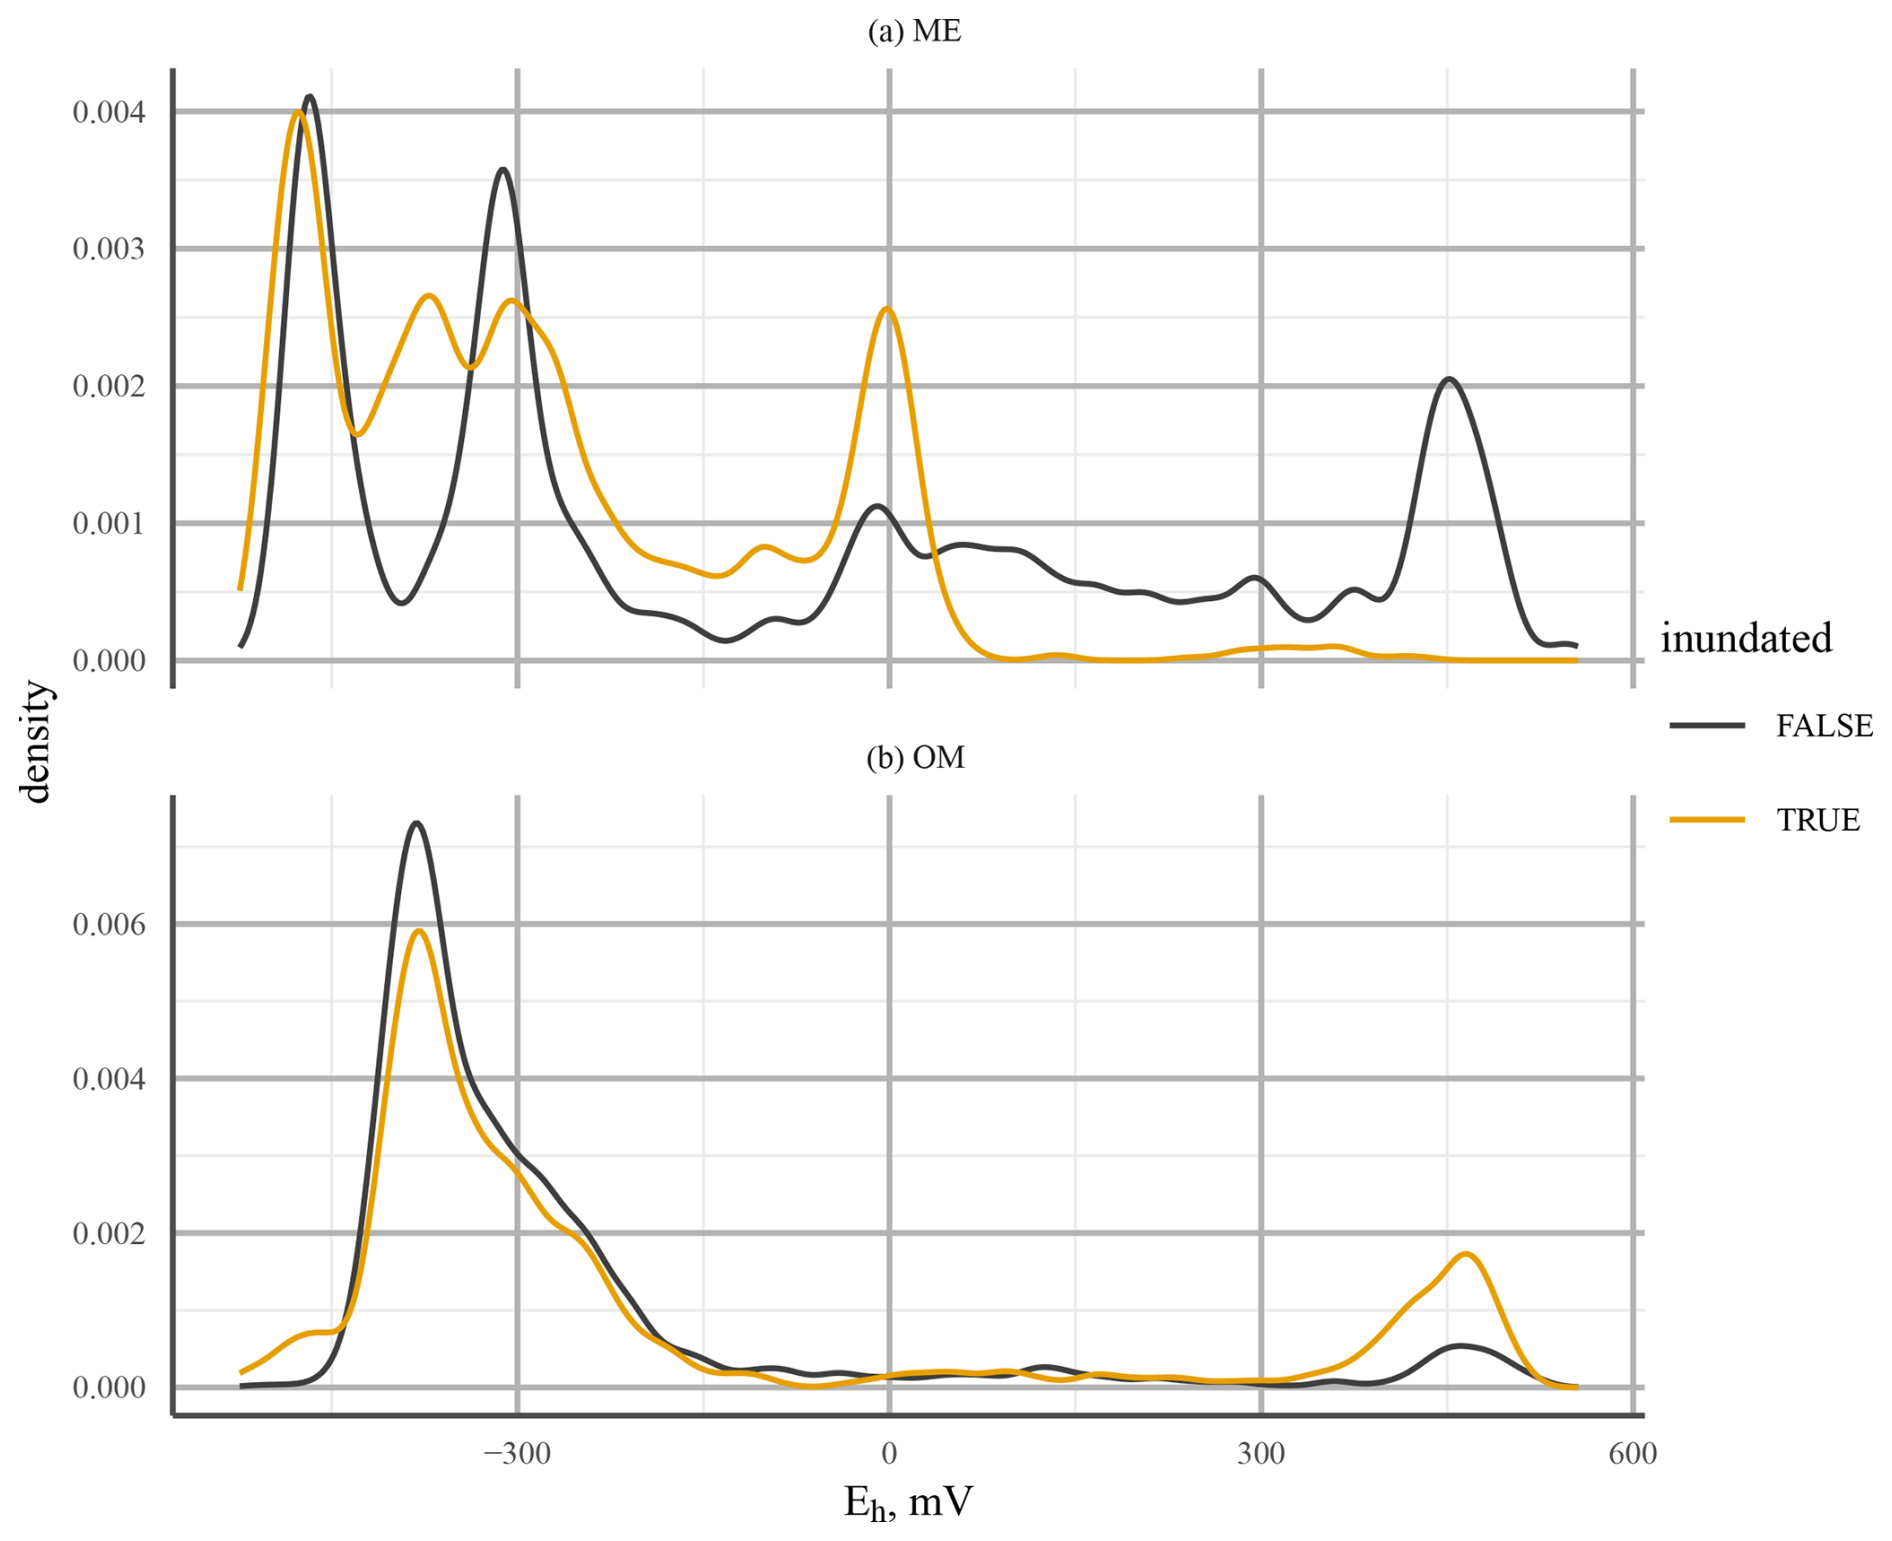
Figure 10Probability density of Eh values at 25 cm depth for mesotrophic (ME; a) and ombrotrophic (OM; b) long-term drainage (LTD) plots. The line colour indicates whether the WTL was above (orange) or below (black) the sensor. Note the different y-axis scales used due to the more continuous distribution at the ME site.
3.3 Enzyme activity
Monitoring at the ME site in autumn 2014 revealed a significant decrease in protease and urease activity with depth for all plots (LTD, STD, and UD); however, the rate at which activities decreased differed between plots (Fig. 11). At the control plot (UD), both protease and urease were found in high levels in the topsoil; they then decreased rapidly down to 20–30 cm, after which the rate of decline slowed. At the STD plot, subsoil (40–50 cm depth) protease urease levels were ca. 4 times and 6 times lower than those in the topsoil (0–10 cm depth), respectively, and the rate of decline in both cases was less steep than that at UD plot, tending to level off at around 30–40 cm. While urease levels at 40–50 cm depth were similar to those at UD plots, protease levels at the same depth were significantly lower. At the LTD plots, while urease showed a gradual but significant decline with depth, with levels around half those at UD plots at 40–50 cm, protease levels first declined but then began increasing again at around 20 cm, reaching similar levels to the topsoil at 30–40 cm. After remaining relatively stable down to 10–20 cm, levels of arginine deaminase showed increasing trends with depth for all plots, with significantly higher levels in deeper soils at the UD (30–40 cm) and STD (40–50 cm) plots but not at the LTD plot (Fig. 11). Arginine levels at the STD plot were higher than those at the UD and LTD plots at all depths, with especially high levels at 40–50 cm. Overall, the rate of increase was steepest for the UD plot, with levels at 40–50 cm being 2.5 times higher than those in topsoil, followed closely by the STD plot, with a significant increase at 40–50 cm (ca. 2.1 times higher than that in the topsoil). In comparison, the LTD plot showed a much shallower rate of increase, with levels at 40–50 cm being just ca. 0.5 times higher than those in topsoil.
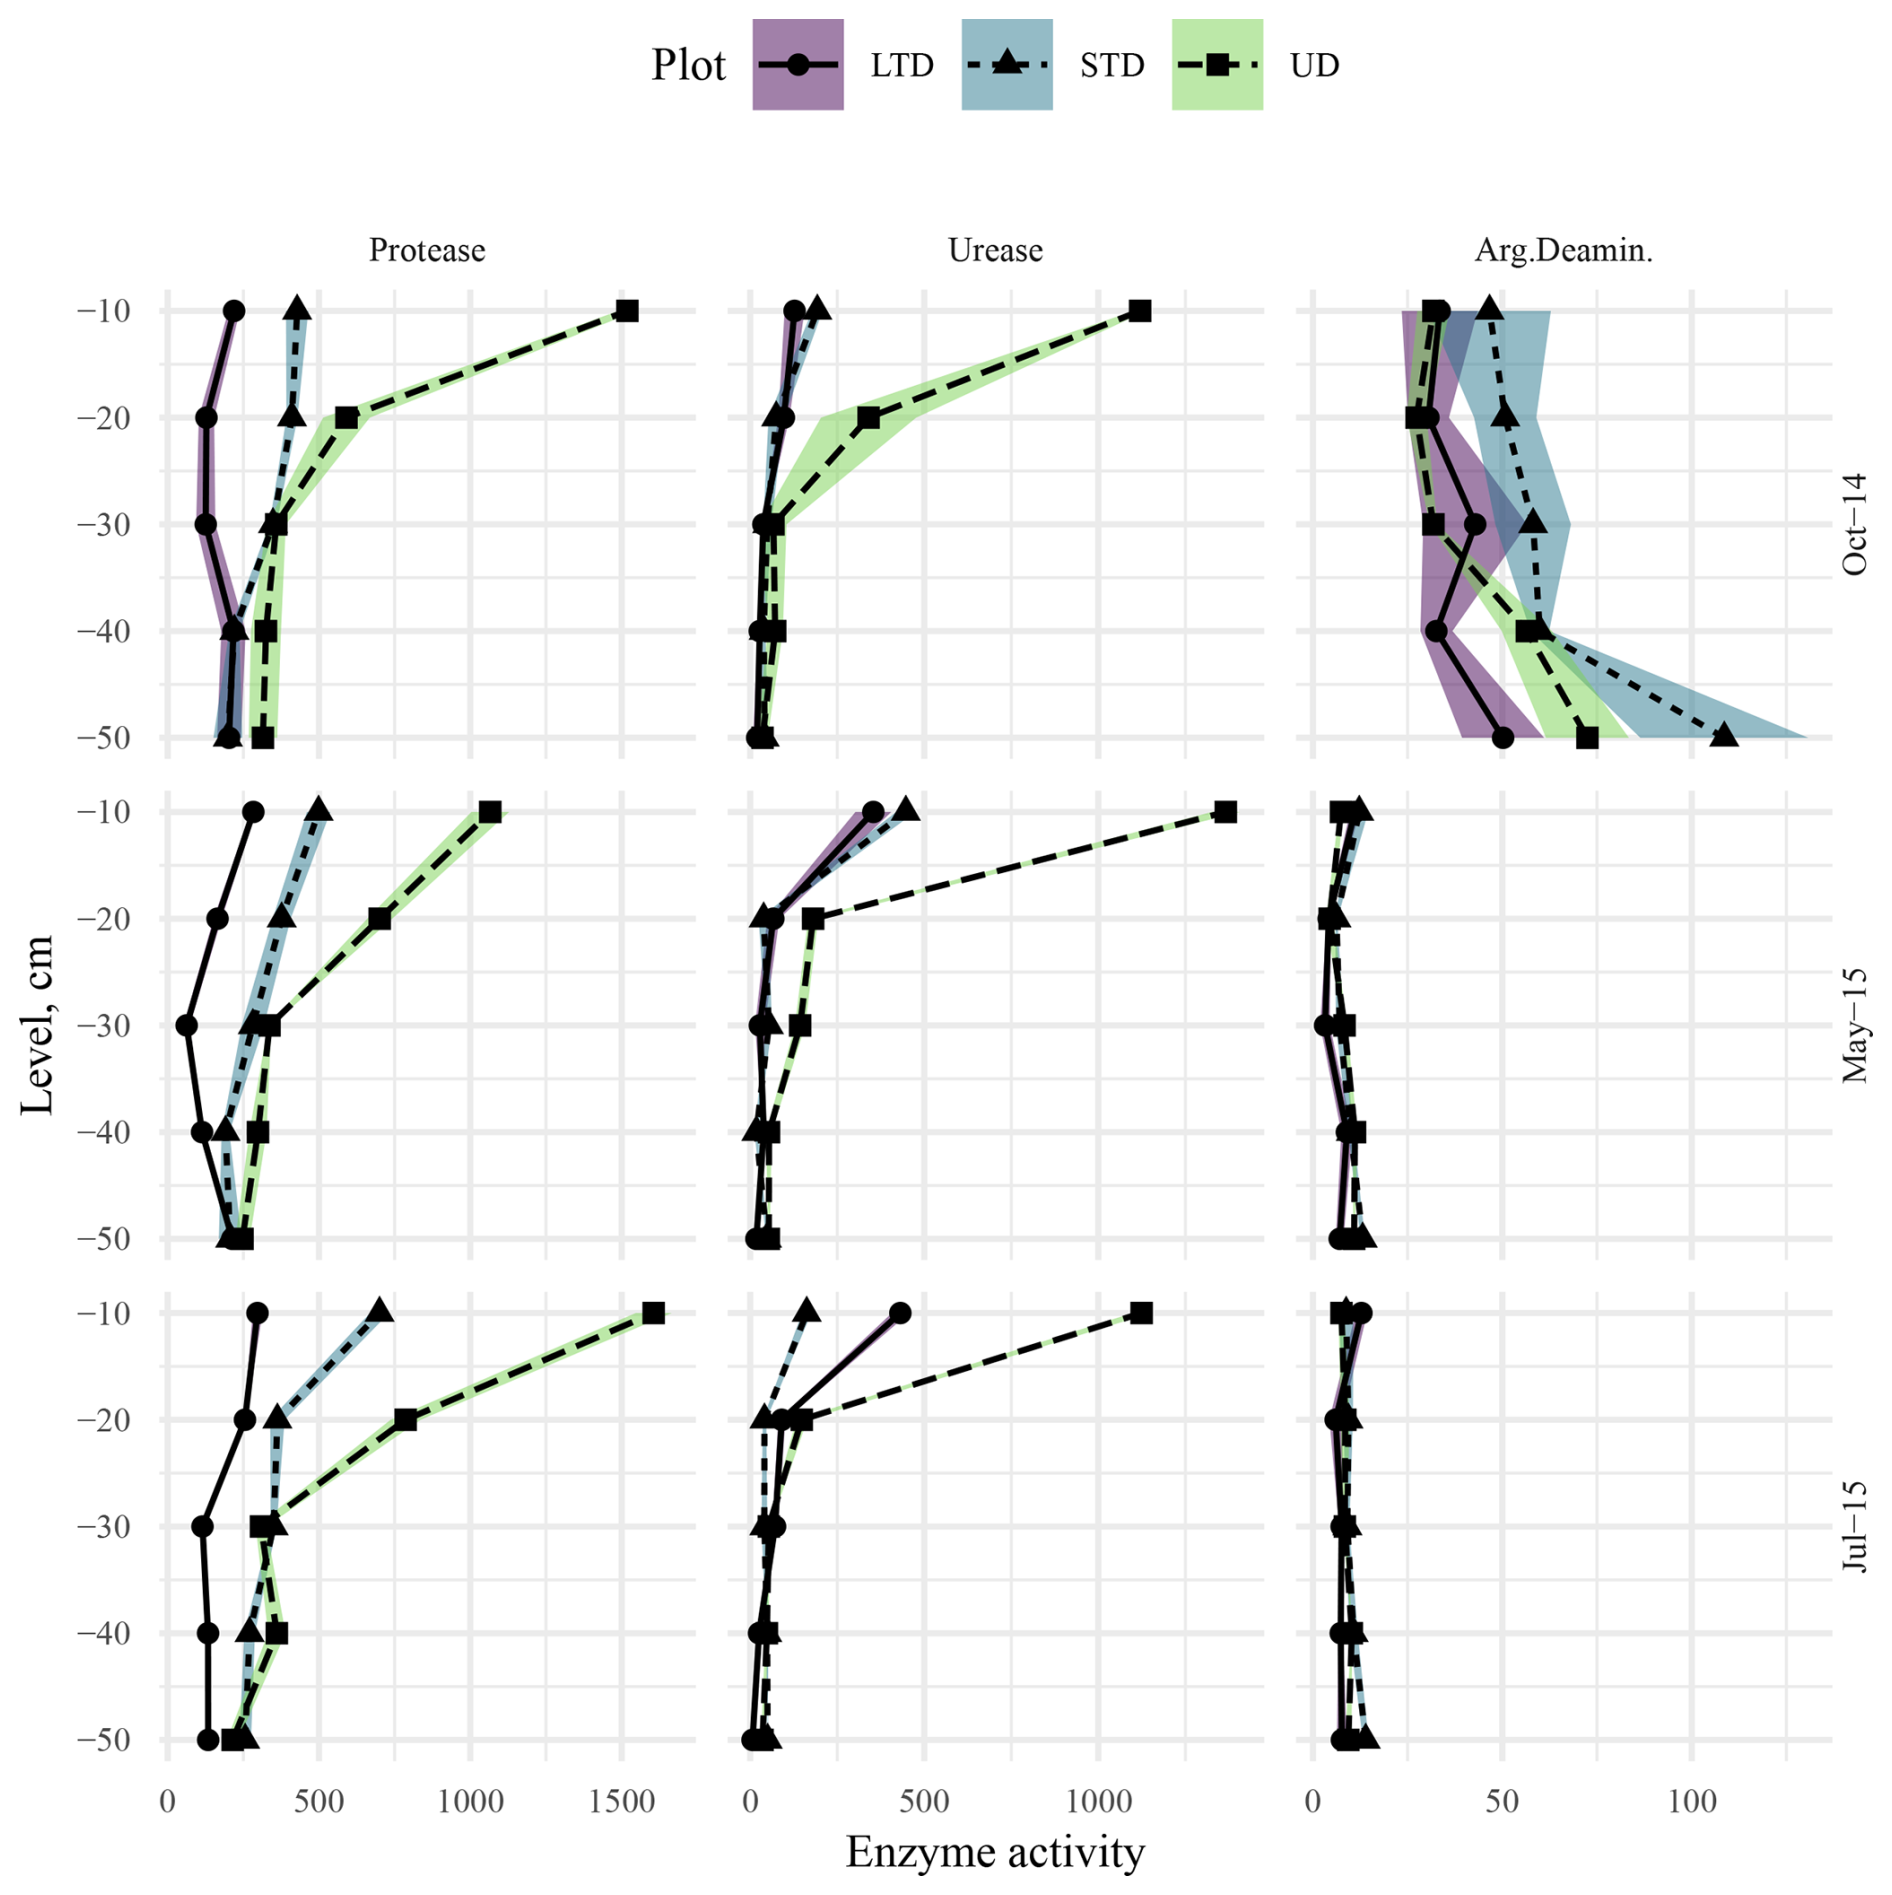
Figure 11Protease, urease, and arginine deaminase activity–depth profiles at the ME-LTD (solid line, round point, purple shaded area), ME-STD (short-dashed line, triangle point, blue shaded area), and ME-UD (long-dashed line, square point, pale-green shaded area) plots, measured in October 2014 (top row), May 2015 (middle row), and July 2015 (bottom row). Points and lines represent observed and interpolated means, respectively, while shaded areas represent standard errors of the means (N=3). Activities are presented as micrograms (µg) of L-tyrosine per hour per gram (dry weight) of soil for protease and micrograms of NH4-N per hour per gram (dry weight) of soil for urease and arginine deaminase (Arg.Deaminase). Note the different x-axis scales between columns.
In spring 2015, both the levels and activity patterns of protease were similar to those in autumn 2014 (Fig. 11). In comparison, topsoil urease levels were noticeably higher than in 2014 at all three plots, especially so at the STD (ca. 2 times 2014 values) and LTD (ca. 3 times 2014 values) plots. However, levels dropped rapidly with depth at all plots, levelling off at 30–40 cm at plot UD at higher levels than 2014; dropping but peaking significantly at 40–50 cm at the STD plot at levels slightly higher than 2014; and dropping but peaking significantly at 30–40 cm at the LTD plot, with final levels slightly lower than in 2014. The greatest change between spring 2015 and autumn 2014 was observed in the arginine deaminase levels, with levels significantly lower in 2015 at all plots (UD topsoil ca. 4.5 times lower, STD ca. 3.5 times lower, and LTD ca. 4 times lower). All three plots showed a further decline to 10–20 cm (LTD =20–30 cm) followed by a significant increase up to 40–50 cm (LTD =30–40 cm followed by a further drop). Levels at 40–50 cm were between 7 and 8 times lower than in 2014.
Overall, enzyme activity in summer 2015 was similar to that in spring (Fig. 11), with the difference being that topsoil protease levels were slightly higher at the UD and STD plots and slightly lower at the LTD plot, urease topsoil levels were slightly lower at the UD and STD plots and slightly higher at the LTD plot, and topsoil arginine levels were relatively similar at UD and LTD but slightly lower at STD (Fig. 11). In all cases, levels at 40–50 cm depth were slightly lower than spring at the UD and LTD plots and slightly higher at the STD plot. While the rates of decline were similar between years, protease showed a continuous decline with depth (levelling at 30–40 cm at LTD), rather than the U-shaped pattern typically seen in autumn 2014 and spring 2015 (Fig. 11); urease declines were similar between years at the UD and LTD plots but dropped rapidly to 10–20 cm and rose slowly from 30–50 cm at STD; and arginine levels at depth remained very similar to those in spring 2015, except for slightly lower topsoil levels and slightly higher subsoil levels (10–30 cm) at the STD plot.
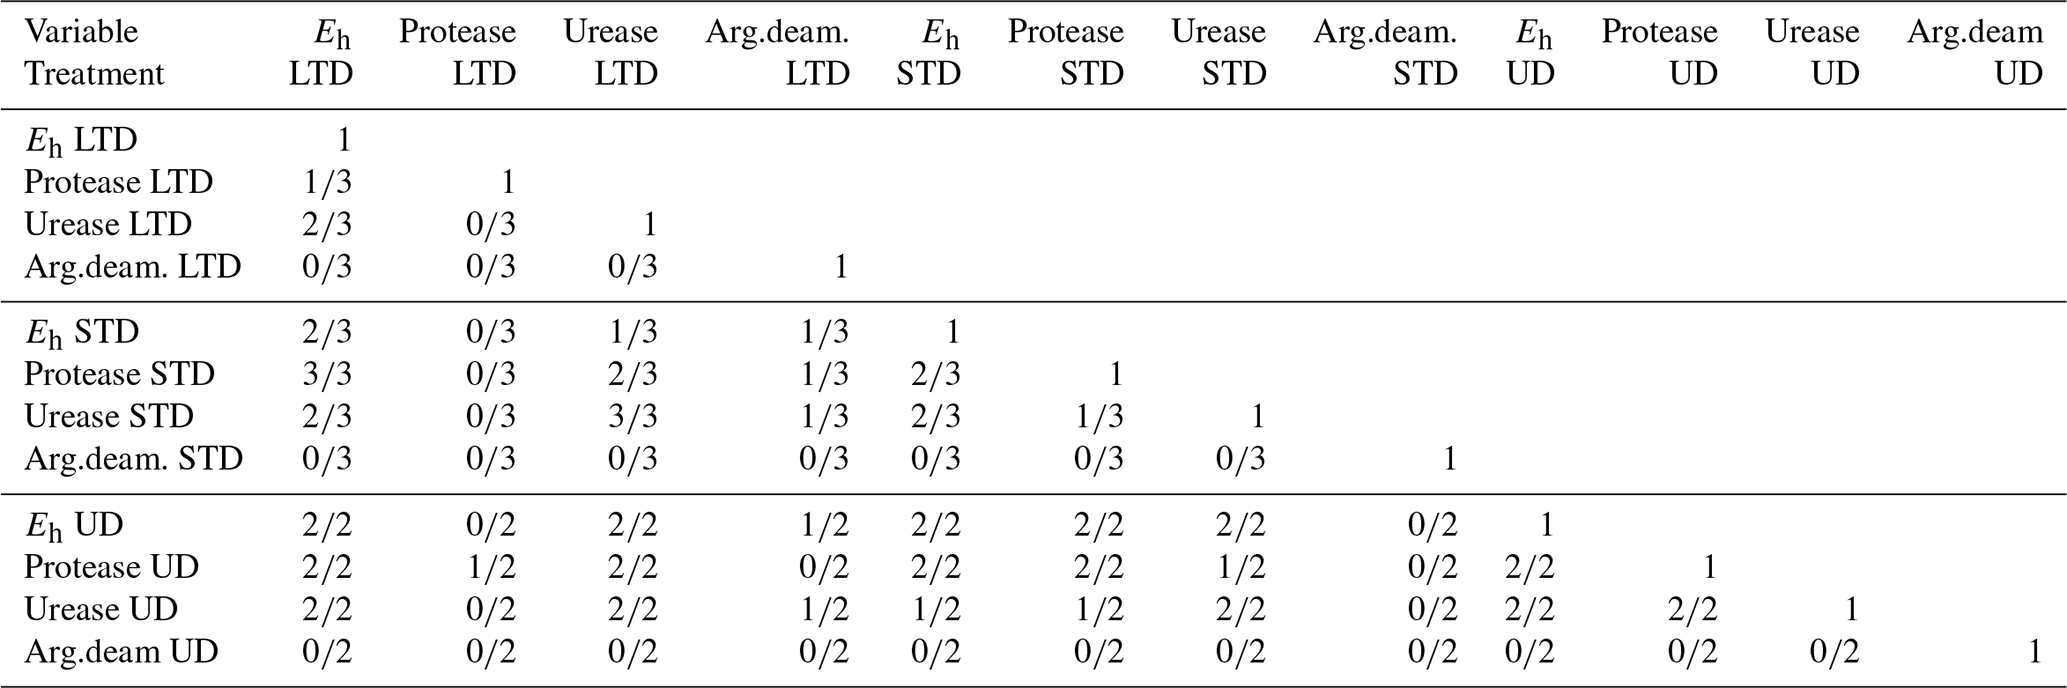
Correlations between protease and urease activity and the average Eh of the preceding 2 weeks were frequently statistically significant (Table 2), especially in samples from summer 2015. This positive correlation between Eh and enzyme activity points to higher microbial activity under less reducing conditions.
Table 2Within-profile correlation between Eh (mean of the preceding 2 weeks) and enzyme activities measured from peat samples (N=5 for each sampling) taken from Lakkasuo in autumn 2014 (LTD and STD only), spring 2015, and summer 2015. Numbers in the cells indicate how often a significant (p<0.05) correlation was observed between each variable pair. Note that the results in the table are presented in the following form: number of samples with significant correlations/available samples.
3.4 Statistical modelling of redox potential
The results of modelling proved inconclusive. It was not possible to predict the momentary Eh or even the momentary change or direction of change in Eh based on the momentary WTL, the time elapsed since the WTL had risen above a given level, or the direction of WTL change, even when combined with soil temperature and precipitation.
While it was possible to fit the non-linear model to some inundation periods, mostly on the ME-LTD plot at 25 cm depth, more often than not, Eh showed no consistent behaviour during inundation. Furthermore, the predictive power of the linear models proved extremely poor when the autocorrelation of Eh was taken into account.
For a further description of the models, please see Appendix A.
4.1 The WTL and redox
Although predicting Eh using the WTL proved impossible based on the models that we applied, our results show a clear effect of the WTL regime on Eh in terms of the depth distribution. At the ME-LTD, ME-STD, and OM-LTD plots, Eh varied widely between 5 and 15 cm depth (and also at 25 cm depth in the case of the LTD plots), while variability was mostly limited to 5 cm depth at the ME-UD plot (Fig. 3).
Generally speaking, differences between sensors were more pronounced when average Eh was between the extremes, i.e. O2-reducing and CO2-reducing conditions, and when Eh was in a state of change (Fig. 3). This emphasises the highly localised nature of redox conditions and the fact that the values at each Pt sensor only represent the conditions prevalent in a small volume of soil.
The overall Eh values at different depths could be interpreted as indicating different TEAs being used at different depths in the peat matrix. In this case, Eh values over 400mV, mostly present at 5 cm in all treatments, would be indicative of oxic conditions; values of +100 to +400 at 15 cm depth would indicate reduction; and Eh values at 25 cm depth and deeper would be more indicative of Fe3+, , or CO2 reduction (Table 1). Just such a connection between the dynamic WTL and Fe2+ and concentrations in porewater (indicating Eh values below +50 and −100 mV, respectively) has previously been observed in a degraded fen in central Europe (Estop-Aragonés et al., 2013), confirming that the WTL does indeed have an effect on Eh conditions, even if current measurements and analysis methods fail to record the connection. A more recent example of the effect of the WTL on the dominant redox pair and Eh is given in Boonman et al. (2024), where subsoil irrigation increased the average WTL in drained, nutrient-rich agricultural peatlands, which corresponded to a lower Eh closer to the surface. Moreover, the dominant redox process was affected by the WTL, with the dominant WTL corresponding to Eh values implying iron reduction. Note, however, that this connection broke down at times, mostly when the WTL was below −40 cm. Our results were more ambiguous, however, as there appeared to be no clear WTL that would make or break the connection between the WTL and apparent Fe reduction. Rather, a low WTL during summer did not cause the 0 mV isopotential to drop in June or August in 2015 or 2016 for the ME-LTD plot, whereas a drop and consequent rise in the WTL was reflected as a corresponding drop and rise in the 0 mV depth isotherm in the autumn of 2015 (Fig. 3).
The effect of the WTL on Eh was complex. One might expect a pattern in which the WTL rising over a certain level would, in all cases, cause conditions to become more reducing, as water blocks the movement of air into the soil matrix. This type of relationship was previously observed by Mchergui et al. (2014), under laboratory conditions, on silt and sandy mineral soils under both permanent and intermittent flooding, with the settling time for Eh varying between 0 and 14 d, depending on soil type. On peatlands, de Mars and Wassen (1999) reported a clear relationship between the WTL and Eh values at 15 cm depth, especially for moderately rich fens. Note, however, that measurements were taken at many sites with only two to four time points measured per site in their study; hence, variation in Eh values at a given WTL was in the range of 200–400 mV throughout the WTL range.
Our continuous measurements suggested that factors in addition to the WTL were affecting the Eh and that the relationship between the WTL and Eh was not always simple. For example, in the summer of 2015 at the LTD plot, Eh at 25 cm depth, where most changes in Eh were observed, responded directly to changes in the WTL, even though the WTL at the time was below −30 cm. At the same time, there was no change in Eh below 25 cm depth, even when the WTL dropped below −50 cm. At the UD plot, there were several occasions on which a rising WTL caused a rise in Eh, e.g. after snowmelt in spring and summer 2016 (Fig. 12). This could be an indication of incoming water bringing in new TEAs from the surrounding area. A similar trend of Eh increasing with a rising WTL was observed by Yu et al. (2008) in a swamp environment. In this case, the major difference to our site was that the WTL was, on average, much higher than the soil surface. It was assumed by the authors that the rise in Eh was caused by O2 transport to the rooting zone by plants. As the UD plot in our study was dominated by aerenchymous vegetation, such as sedges and wetland herbs (see Sect. 1), this could also be the case in the current experiment. That the effect was limited to 5 cm depth is consistent with the maximal O2 release depth observed for Carex rostrata (bottle sedge) (Mainiero and Kazda, 2005).
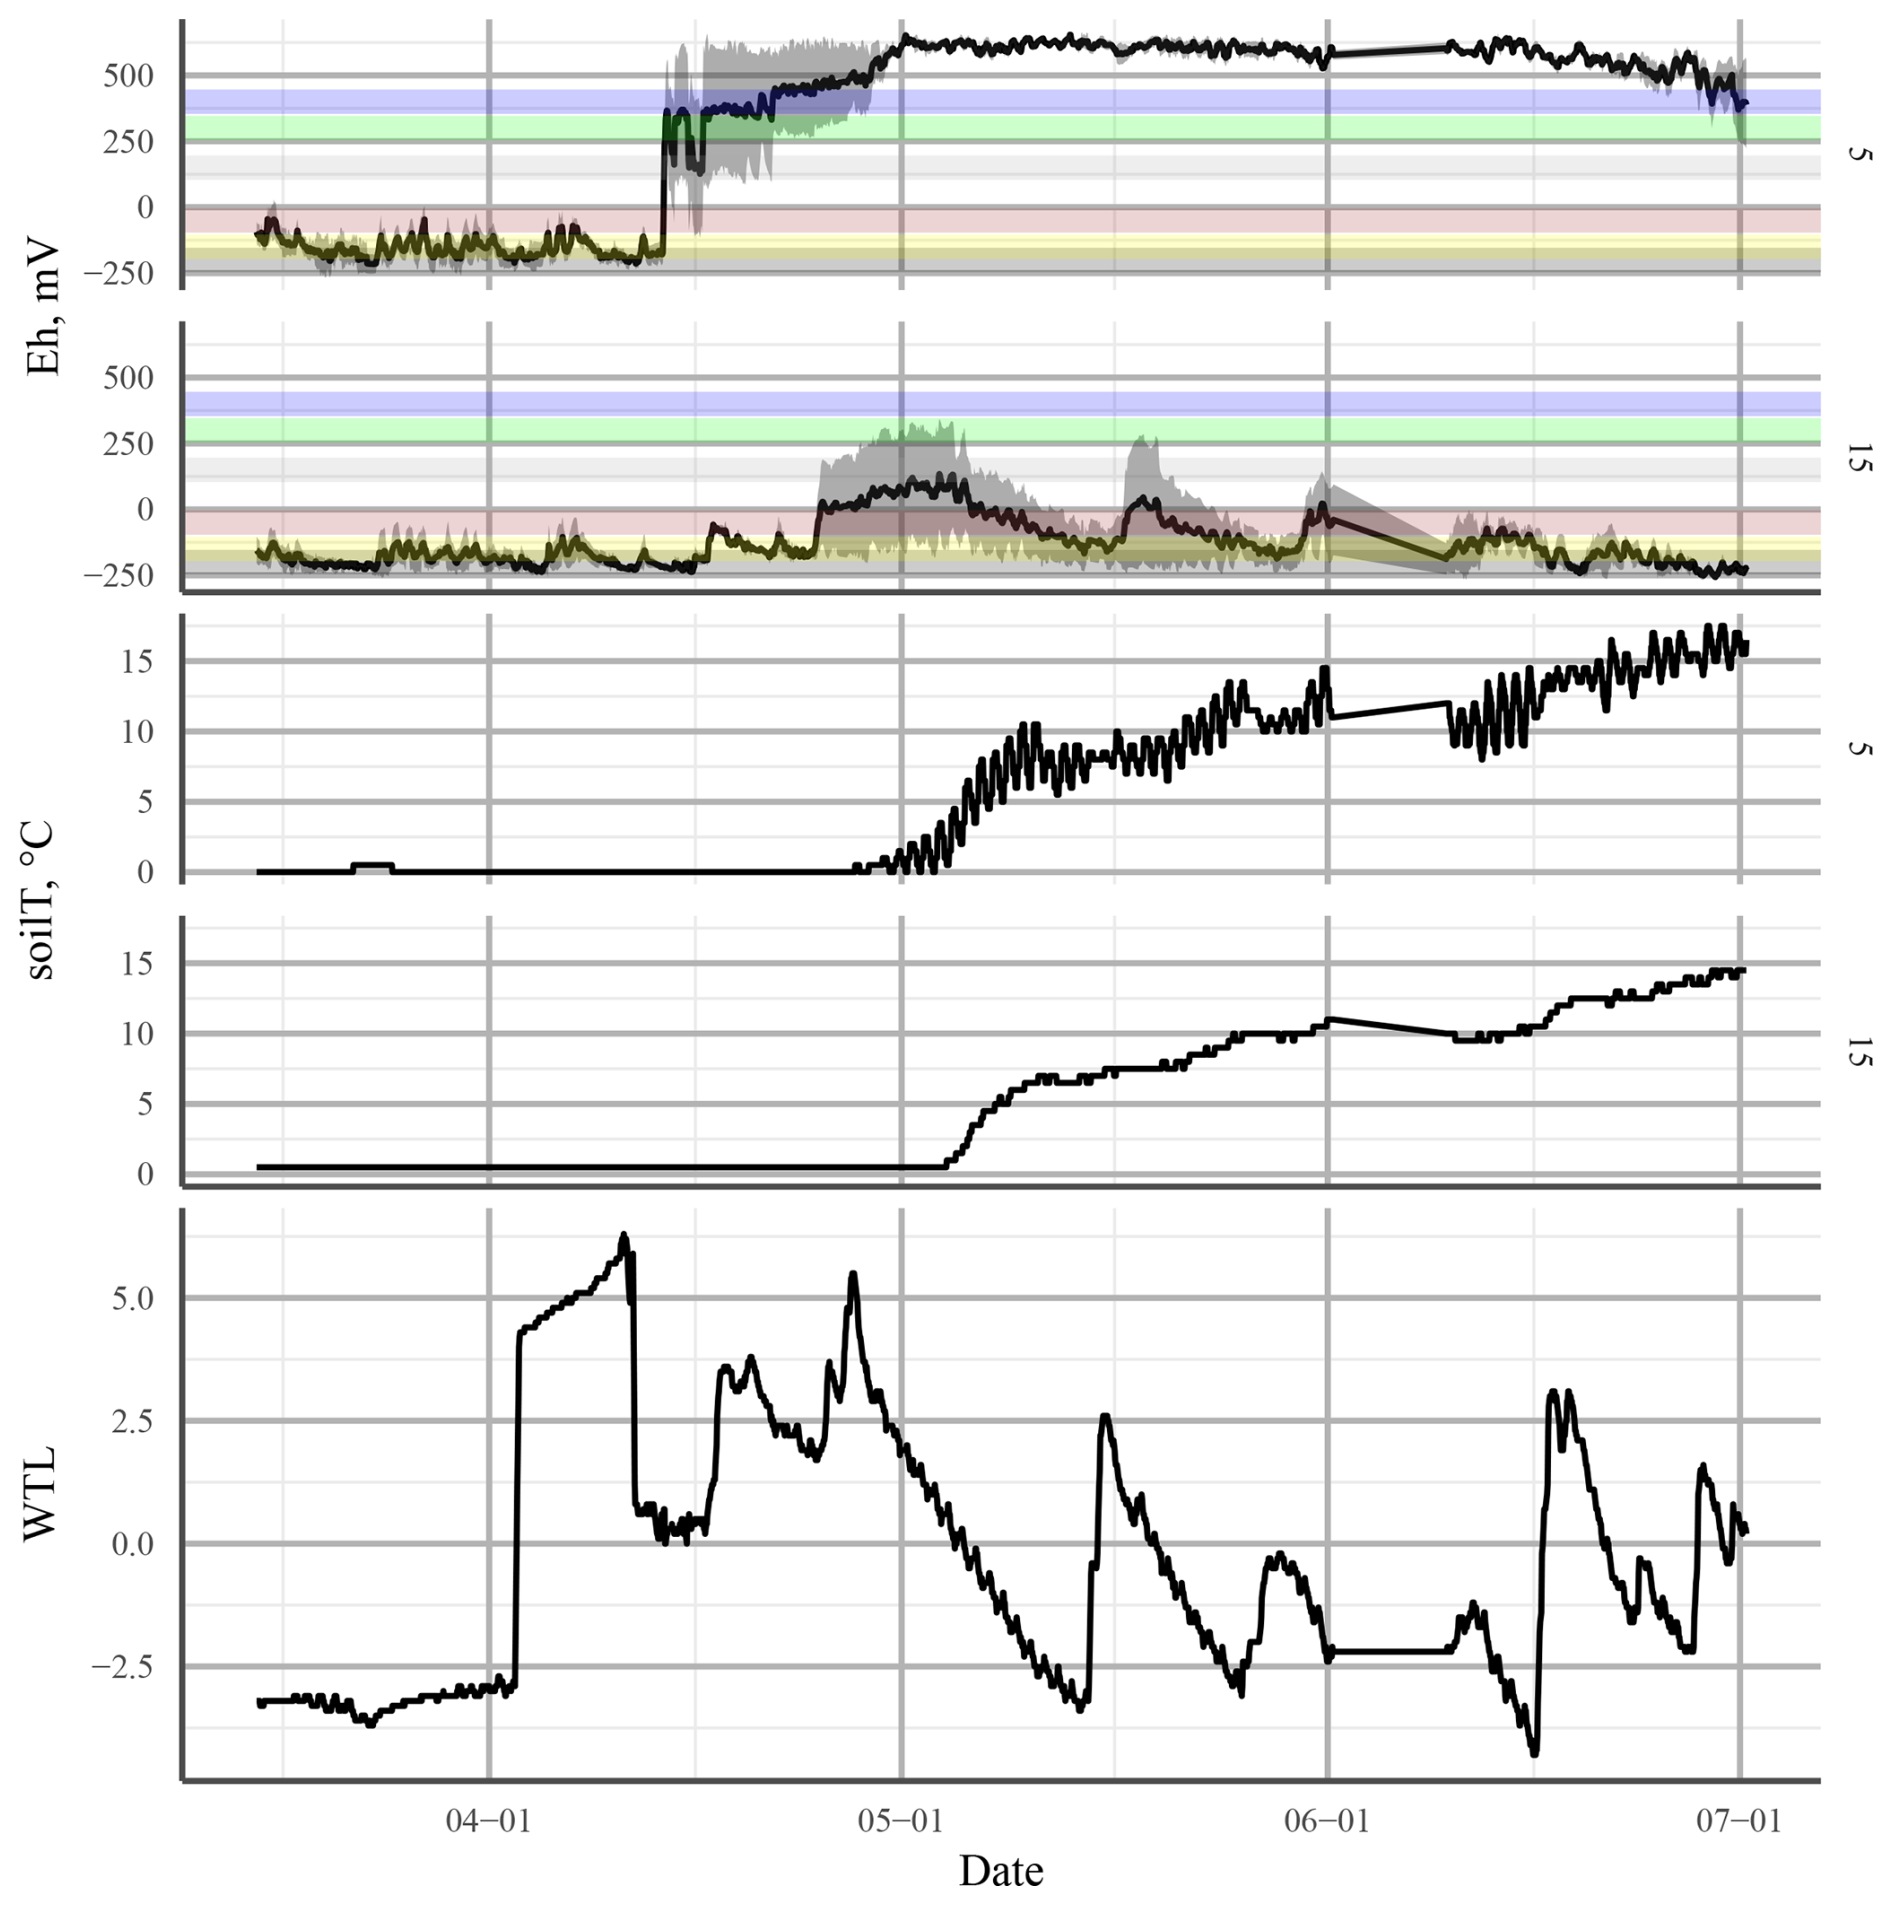
Figure 12Redox potential (Eh; top panel) and soil temperature (soilT; middle panel) at 5 and 15 cm depth and the water table level (WTL; bottom panel) at the undrained (UD) plot in spring 2016. The solid black line in Eh shows the mean of three profiles. The shaded area is the standard error. The horizontal coloured bars represent approximate theoretical Eh values of the transition between different TEAs: from top to bottom, O2, , Mn4+, Fe3+, , and CO2.
Over the same period, rain events caused a rapid drop in Eh at 15 and 25 cm depth in the ME-LTD plot, despite the WTL never rising above 40 cm. This suggests that the infiltration of rainwater down to the WTL following heavy rainfall causes enough blockage of gas transport to prevent reoxidation of the TEAs used by the microbial population.
Mitchell and Branfireun (2005) found that late-summer precipitation events of >30 mm sharply increased the Eh close to surface in an upland–peatland interface. The WTL was close to surface in their study, comparable to our ME-UD plot; they also observed the transport of , Fe(II), and (to a lesser extent) Fe(III) from the upland to the edge of the peatland under storm-flow conditions. They interpreted the Eh rise as being due to the transport of dissolved O2 in the rainwater along the flow path from the watershed to the peatland. Our observations outlined above indicate the same processes; i.e. on the undrained plot, hydrological connection to the watershed is unbroken and oxygen can be transported along the water, whereas on the drained plots, water from the uplands is diverted by the drainage network and only the oxygen delivered in the rainwater falling on the plot itself affected the Eh. Undrained ombrotrophic peatlands, which do not receive water from a mineral-soil watershed, could be expected to exhibit a similar response to precipitation events to the ME-LTD plot in this study. Season could also be expected to play a role in how precipitation affects redox conditions: during the peak growing season (late June to July), the soil is warmer than during the early and late growing season, as is (generally) the precipitation itself. This causes O2 availability after a precipitation event to drop in two ways: first, O2 solubility in water decreases along a rising temperature gradient; second, higher biological activity causes the O2 in the water to be used up more quickly. Thus, precipitation during the peak growing season could cause a drop in Eh below the soil surface, while off-season precipitation could cause a rise in Eh instead.
The difference in Eh dynamics at the ME plots between winters appeared to be related to differences in WTL dynamics (Fig. 3). During the winter of 2014–2015, for example, the WTL fluctuated between −30 and −10 cm at the LTD plot and between −20 and −5 at the STD and UD plots, whereas the WTL remained constant during the winter of 2015–2016, lying either close to the surface or above it at all sites. This may have been due to a brief period of frost early in the winter, when up to 20 cm of snow accumulated, followed by thawing over about a month, followed by freezing conditions once again. This could have formed a layer of ice on the surface of the peat, preventing the flow of O2 into the system. The fact that the deeper snowpack during the winter of 2014–2015 failed to cause reducing conditions in the top layers suggests that O2 movement into peat is not necessarily prevented by snow. As redox conditions are intrinsically linked with water chemistry (e.g. Zak et al., 2004; Kjaergaard et al., 2012; Riedel et al., 2013; Kaila et al., 2016), this suggests that there may be differences in spring melt runoff water quality and CH4 emissions between years, depending on whether gas transport between the atmosphere and soil has been blocked by ice or not. Surface, as opposed to deep, peat through-flow, indicative of frozen topsoil, has previously been associated with a higher CH4 content (Dinsmore et al., 2011), as well as lower dissolved O2 concentrations in spring runoff water (Eskelinen et al., 2016).
The behaviour of Eh on the ME-LTD and OM-LTD plots revealed bi-modality in the Eh value distribution on the OM-LTD plot and multi-modality on the ME-LTD plot (Fig. 10). This suggests that the presence of alternative TEAs at the ME plot caused the drop in Eh to “pause” at characteristic levels under inundated conditions. Both plots had peaks around +450 and below −300 mV, suggesting O2-driven respiration and CO2 reduction through methanogenesis, respectively (Table 1). The additional density peak observed at the ME-LTD plot was around 0 mV, suggesting that the Fe3+–Fe2+ redox pair was responsible. A possible complication regarding this interpretation is that the WTL at the OM-LTD plot was more stable than at the ME-LTD plot (Fig. 3). However, the sensors at 25 cm depth on the OM-LTD plot experienced more transitions between non-inundated and inundated conditions than the corresponding sensors on the ME-LTD plot (26 vs. 14 transitions, respectively). As alternative TEAs are important during transition phases, this suggests that the OM-LTD plot should be more, not less, prone to multi-modal Eh behaviour than the ME-LTD plot if alternative TEAs are present.
To the best of our knowledge, multi-year studies of spring meltwater quality and greenhouse gas emissions in relation to soil frost conditions have yet to be conducted. Nevertheless, the dynamics between soil frost and Eh observed in this study (Fig. 3) suggest that porewater chemical quality under the snowpack and its relationship to Eh measurements could be an interesting subject for future study.
The complexity of the WTL–Eh relationship revealed by wavelet analysis most likely explains why the non-dynamic linear and non-linear models failed to predict changes in Eh using the momentary WTL or the duration of inundation. Furthermore, there was no sign of Eh reacting more rapidly to changes in the WTL at the OM-LTD plot compared to the ME plot, whether using the 0 mV depth isopotential–WTL wavelet analysis or a comparison of the daily δEh value distribution. This, combined with our disappointing modelling results, raises the question of whether non-dynamic linear or non-linear models are the best way of modelling a complex phenomenon such as the redox state of a soil system.
A possible non-dynamic approach could be to use a multinomial or ordinal model (e.g. Liang et al., 2020), which could better reflect the multi-modal nature of redox conditions without the need for the extensive estimation of available electron acceptors, which a dynamic model such as the decomposition model of DNDC (Haas et al., 2013) would require. This approach would produce the probability of each electron acceptor being the dominant one at a given moment, reflected in observations by a redox potential range, rather than a specific redox potential.
Applying a dynamic approach to peat redox state modelling would require extensive laboratory, microcosm, and mesocosm studies to parameterise the links between peat physicochemical properties, such as pore size distribution, elemental and organic carbon composition, pore and runoff water quality, and the mass and species diversity of the microbiota using the TEAs.
The difficulties faced in characterising the behaviour of Eh based on the WTL could, at least in part, be understood by defining exactly what the WTL measured from a WTL well represents. It is easy to mistake the clear interface between air and the water surface in a well as representing a sudden switch from dry to wet conditions in the peat. In fact, the water level in the well represents the depth at which the water content in the peat reaches field capacity, i.e. the degree of saturation at which all pores small enough to allow capillary action to hold onto water against the force of gravity are filled. Depending on the peat's pore size distribution, there will still be varying numbers of non-saturated pores present in the peat at field capacity, and the proportion of saturated pores will decrease linearly above the water level (Zhang and Furman, 2021). Thus, not only can the actual soil water content at the WTL differ between sites and treatments, but it may actually also still increase below the WTL. As the saturation of pores with water is the main obstacle preventing O2 from penetrating the soil profile, the soil water content and pore size distribution at different depths could prove a better means of predicting Eh behaviour in peatlands (and in soils in general) than simply measuring the WTL. Indeed, Estop-Aragonés et al. (2012) reported that the concentration of dissolved oxygen in peat porewater did not reliably drop to zero when the WTL reached the peat layer; instead, significant amounts of O2 were occasionally available in the porewater even when the WTL was more than 10 cm above the monitored peat layer. Correspondingly, the air-filled pore space depth profile did not linearly follow the WTL.
Our observation of no clear-cut correlation between Eh and the WTL could, in part, explain the often poor predictive power of the WTL in momentary CH4 dynamics (e.g. Koskinen et al., 2016; Korkiakoski et al., 2017), as CH4 production and oxidation are intrinsically connected to Eh conditions.
4.2 Enzyme activity
Studies reporting hydrolytic enzyme activity in peatlands are rare. However, compared to the available research, (e.g. Wojciech and Styła, 2011; Lloyd and Sheaffe, 1973; Singh and Kumar, 2008), the activities observed at the ME plots were within an order of magnitude of previously reported values, whether they were measured in peat or mineral soil.
The variations in enzyme activity observed at the ME plots between autumn 2014 and summer 2015 were potentially the result of local differences in organic substrate quality and, more specifically, differences in the activity of hydrolytic enzymes at different points and depths at each site.
Generally speaking, in more oxidative environments, i.e. those with higher Eh, enzyme activity increased (Table 2). This was almost universally true for protease and urease activity, although not for arginine deaminase. This connection between hydrolytic enzymes and Eh indicates that the degradation of complex organic substances is inhibited under reducing conditions, which would promote carbon accumulation in the soil. Interestingly, this general increase in enzyme activity under more oxic conditions was also confirmed by Alef and Kleiner (1987a) for arginine deaminases, with the authors going on to state that aerobic and anaerobic ammonification of arginine (including their ratio) was most likely strongly influenced by the redox potential. Consequently, the lack of a correlation between arginine deaminase and redox potential observed in our study may have been due to the inhibition of arginine deaminase, perhaps by an increased amount of readily available substrate for microorganisms and a high amount of NH4 in the soil (Alef and Kleiner, 1987b; Lin and Brookes, 1999). The potential for ammonification by microorganisms could also have been limited by a higher ratio in the soil environment (Fujii et al., 2019). While we are unable to deduce the exact cause of this unexpected arginine deaminase inhibition from our results, redox potential could prove to be an indicator for this condition.
There are two other possible explanations for the differences observed, both related to the water regime. Phenol oxidases are one of the few enzyme groups capable of breaking down phenolic compounds, and any reduction in their activity, i.e. their ability to degrade phenolic compounds, may explain the reduced activity of hydrolytic enzymes (Bonnett et al., 2006). Phenol oxidases are a group of extracellular enzymes that catalyse the oxidation of lignin and phenolic compounds in soil organic matter (Sanchez-Julia and Turner, 2021). The influence of such oxidising enzymes on the activity of hydrolytic enzymes has been described by Freeman et al. (2001) using the “enzyme latch” hypothesis, which states that “under conditions of full saturation with water, there is a lack of O2 in the environment, which suppresses the activity of oxidising enzymes”. Furthermore, the low level of O2 naturally found in peat bogs and fens leads to the accumulation of polyphenolic substances, which bind to hydrolytic enzymes and thereby inhibit their functioning (Fenner and Freeman, 2011). However, Romanowicz et al. (2015) found that fluctuations in the WTL can cause changes in the accumulation of polyphenolic substances (i.e. phenol oxidase activity) in peat soils, as well as redox potential, with both redox potential and phenol oxidase activity decreasing with an increasing WTL. Up until now, however, studies on the impact of the WTL on extracellular enzymes have produced conflicting results (e.g. Xiang and Freeman, 2009; Sun et al., 2010; Fenner et al., 2011), and further research will be needed to clarify the processes involved.
A second possibility is the “iron gate” paradigm described by Wang et al. (2017), whereby the effect of phenolic substances on the oxidation (and subsequent mineralisation) of soil organic carbon (SOC) following a drop in water levels (water balance) is attributed to Fe transformation, which is a redox-induced process (Li et al., 2012). In this case, Fe(II) is oxidised to Fe(III) through abiotic or biotic reactions (Hall and Silver, 2013). As Fe(II) positively affects the oxidation of phenols (Sinsabaugh, 2010; Hall and Silver, 2013), Fe oxidation may serve to protect against C loss as the WTL drops (Wang et al., 2017). Under conditions of reduced moisture, oxidation of Fe(II) will reduce the oxidation of phenols and, thus, affect the mineralisation rate of SOC (Wang et al., 2017), thereby indirectly affecting the activity of hydrolytic enzymes. Moreover, the Fe oxidation process lowers the pH, which will also affect phenol oxidase activity, as its optimal pH is close to neutral (Sinsabaugh, 2010; Toberman et al., 2010). Furthermore, the products of Fe(II) oxidation can immobilise P and dissolved organic C, thereby reducing C and P availability and, thus, enzyme synthesis (Lalonde et al., 2012; Riedel et al., 2013). Extracellular enzymes can also bind to amorphous ferric hydroxide (Fe(OH)3) formed during Fe(II) oxidation, further limiting the catalytic activity of enzymes in peat soil (Allison, 2006; Wen et al., 2019).
To the best of our knowledge, this is the first study to undertake long-term continuous monitoring of redox conditions at multiple depths in a boreal peatland while also monitoring the soil WTL and temperature. Furthermore, the side-by-side existence of different drainage histories on plots with similar ecohydrological development before drainage makes our dataset unique.
Our results show that enzyme activity changed at different depths and in different seasons, most likely due to differences in substrate quality at the different sites, particularly in relation to water saturation. Such effects were particularly pronounced where water saturation was directly affected by the drainage regime.
Our first hypothesis, that the drainage regime via the dominant WTL would be reflected in the depth at which most Eh dynamics occur, was supported by the data, with Eh at its most dynamic at 25 cm depth at the ME-LTD plot, 15 cm depth at the ME-STD plot, and 5 cm depth at the ME-UD plot.
Our second hypothesis, that Eh and Fe reduction isopotential fluctuations would closely follow WTL fluctuations, was only partially supported by the data. The connection between the WTL and Eh was intermittently in synphase and counterphase, suggesting that different hydrological phenomena may affect redox conditions in opposite ways, even where the effect on the WTL is constant in all cases.
Our third hypothesis, that reduced levels of alternative TEAs in the OM-LTD plot would cause Eh conditions to become reducing more quickly after a rise in the WTL, was not supported by our data, which indicated that alternative TEAs were utilised in drained peatlands with more decomposed peat. It is possible that, in this case, the greater organic-matter-associated electron-accepting capacity of decomposed Sphagnum peat, as opposed to sedge peat, compensated for the lack of mineral elements.
Our fourth hypothesis, that Eh measurements at the OM drained plot would display a bi-modal distribution and that those in the ME drained plot would display a multi-modal distribution due to the greater availability of mineral TEAs, was supported. This suggests that, if the electron-accepting capacity of organic matter is slowing down the transition between oxic and CO2-reducing conditions, its Eh may not be picked up by the sensor's Pt electrodes.
Our fifth hypothesis, that the ME-LTD plot, with its generally higher Eh values, would display higher enzyme activity than the ME-UD plot, was partially supported by the data. While a higher Eh correlated with a higher enzyme activity within profiles, the opposite was true between plots.
Finally, the relationship between WTL fluctuation and redox conditions proved too complex to model with non-dynamic linear or non-linear modelling, suggesting that characterisation of redox fluctuations between treatments will require more complex models.
We suggest that future field Eh measurement campaigns should be paired with porewater chemistry and greenhouse gas monitoring and that the role of OM and changes in input water quality in the yearly redox cycle should be clarified. Smaller-scale laboratory studies and other ex situ studies should be carried out in order to tease apart the contributions of different factors affecting redox dynamics in peatlands.
A1 Methods
For the non-linear models (Eq. A1), it was assumed that different sites and depths in the peat profile would have characteristically low Eh values toward which the system would asymptotically move under inundated conditions, i.e. when movement of O2 into the peat matrix was limited or prevented. It was also assumed that Eh values would rise rapidly once inundation ended, as oxygen penetration into the soil profile oxidised the reduced TEAs. Consequently, an exponential asymptotic model was fitted separately to the mean measurements from each peat depth on all treatments using the time inundated (i.e. the time elapsed since the WTL had risen above each Pt sensor in the peat profile) as the explanatory variable. Each period of inundation was fit separately, with a lower limit of 240 h for inundation length to exclude short-term WTL fluctuations that may not be long enough for the δEh to show signs of saturation. In this way, characteristic asymptote and rate values were obtained for each depth and treatment.
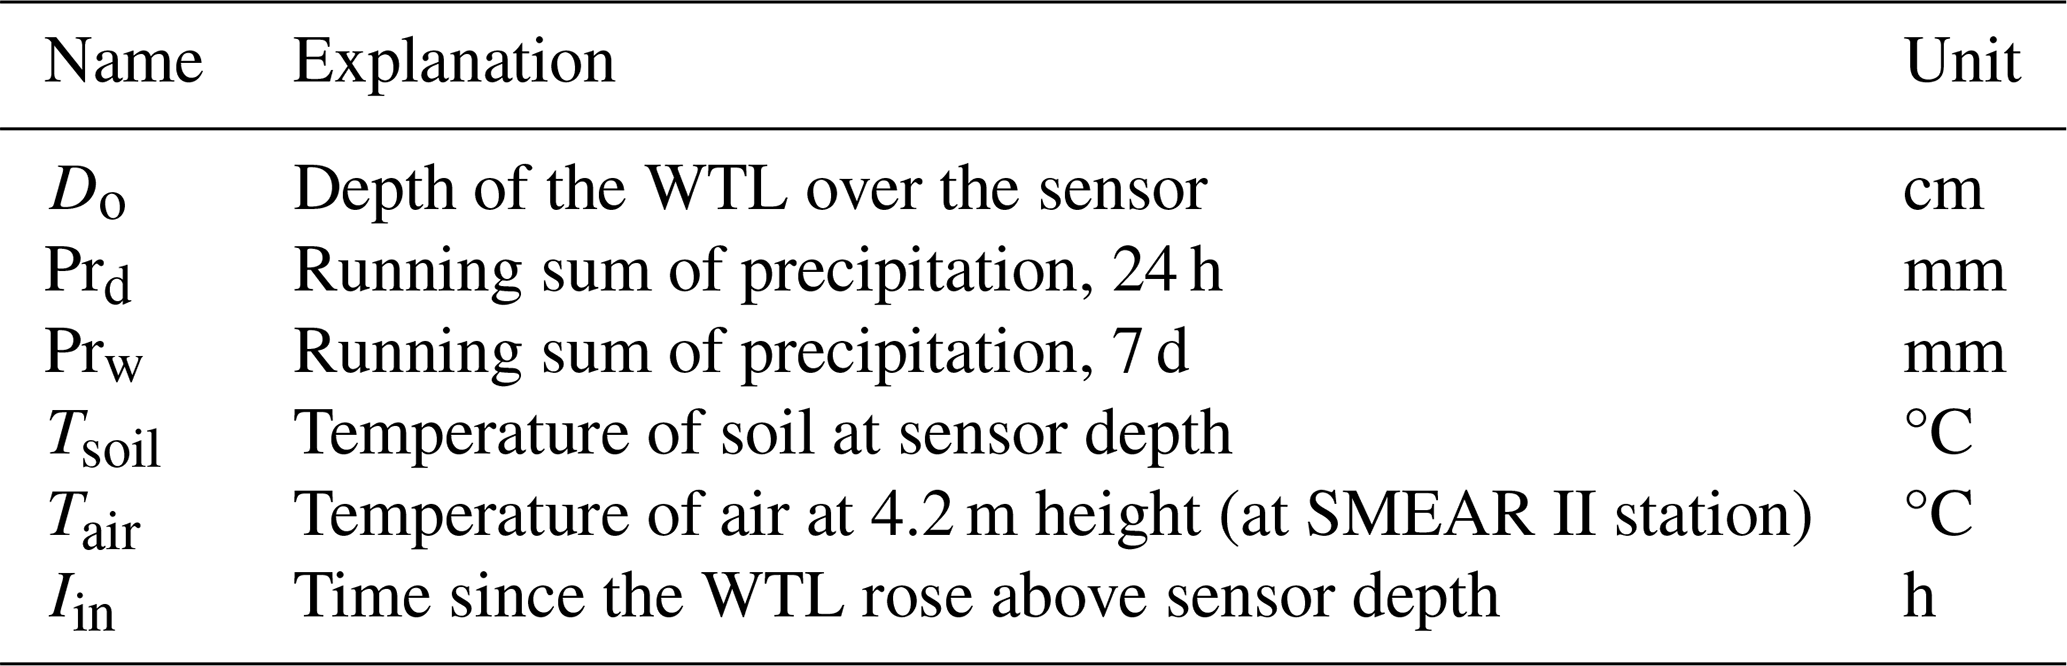
where Eh is the redox potential measured, A0 is Eh at the beginning of the inundation period, Aref is the asymptotic term of Eh, tin is the time inundated (h), and τ is the rate term. Model fitting was undertaken in the R statistical environment (R Core Team, 2023) using the Levenberg–Marquardt algorithm and the minpack.lm library (Elzhov et al., 2022).
A multiple linear model was also fit to each treatment and sensor depth using available ancillary measurements as parameters (Table A1). Autocorrelation between consecutive Eh measurements was then estimated using the ar function in R, with a lag value of 1. The autocorrelation was then entered into the linear model fitting procedure.
A2 Results
It was only possible to fit the asymptotic model to 36 % of inundation periods with a continuous duration of 240 h or more. Grouped by treatment and depth, fitting success rate varied between 0 % and 56 % of inundation periods for the groups for which the number of viable periods available was >1.
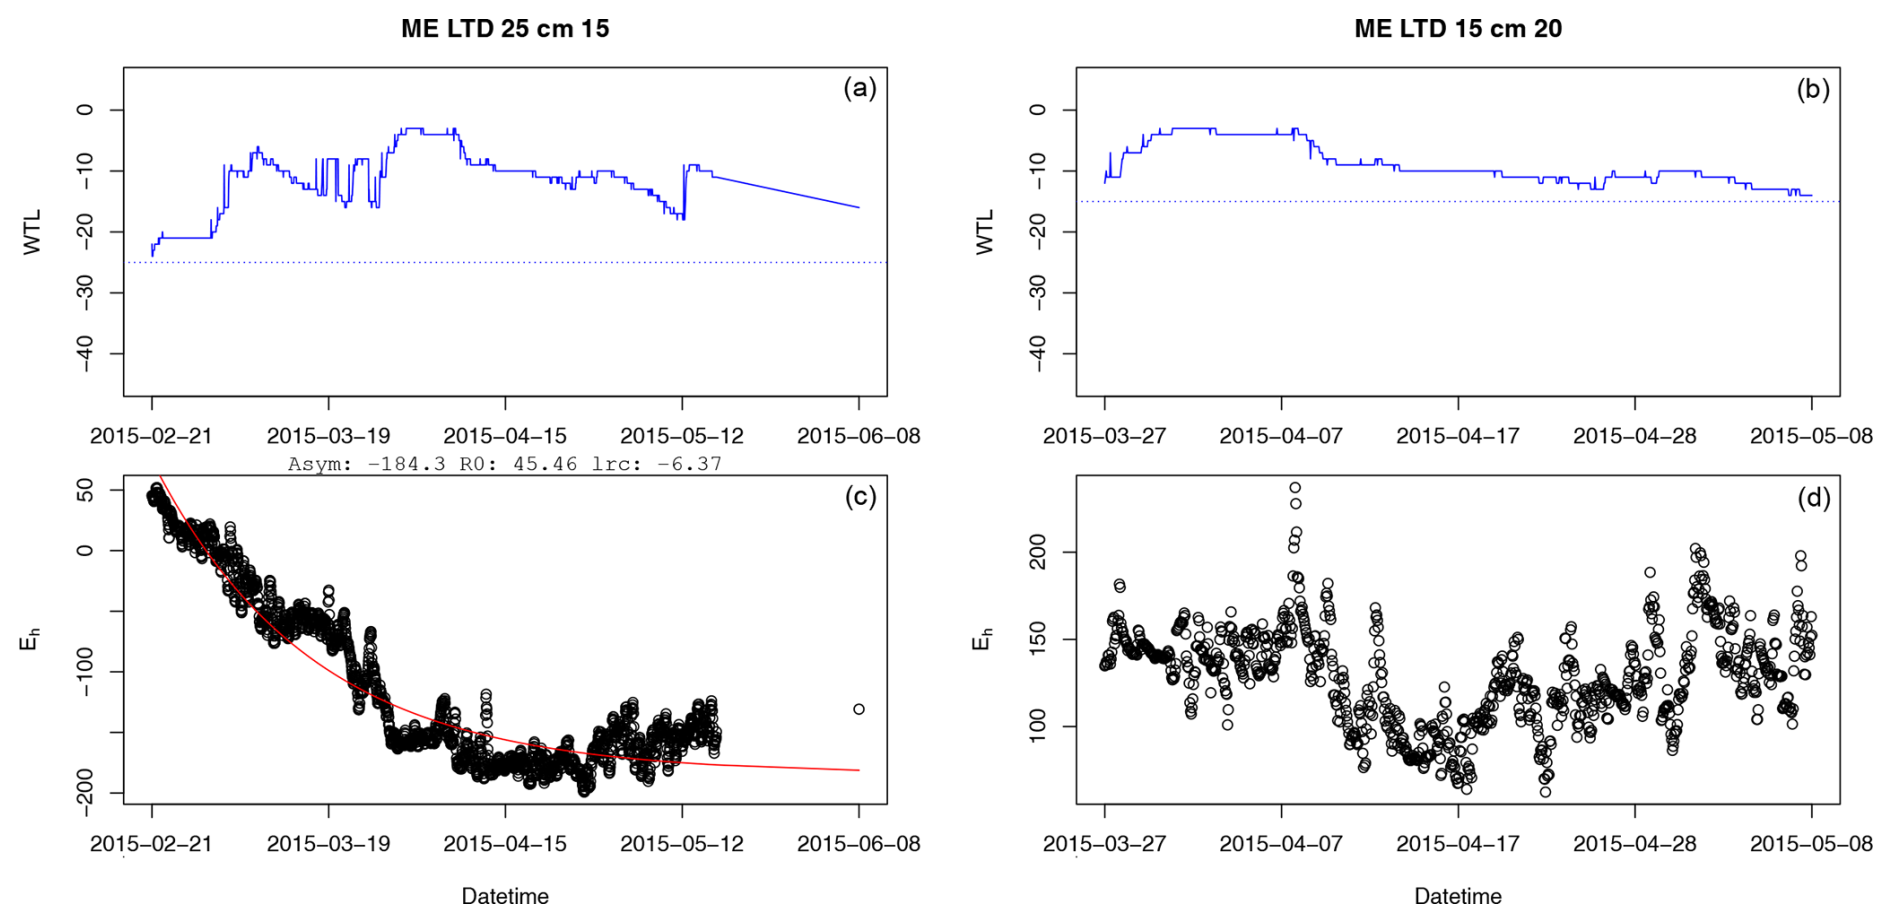
Figure A1Example of a successful (a, c) and failed (b, d) fit of the asymptotic model to Eh during periods of inundation. In panels (a) and (b), the solid blue line presents the water table level, while the dashed blue line is the position of the Eh sensor in the depth profile. In panels (a) and (c), Asym is the value of the asymptote, R0 is the Eh value when inundation began, and lrc is the natural logarithm of the rate constant (mV s−1).
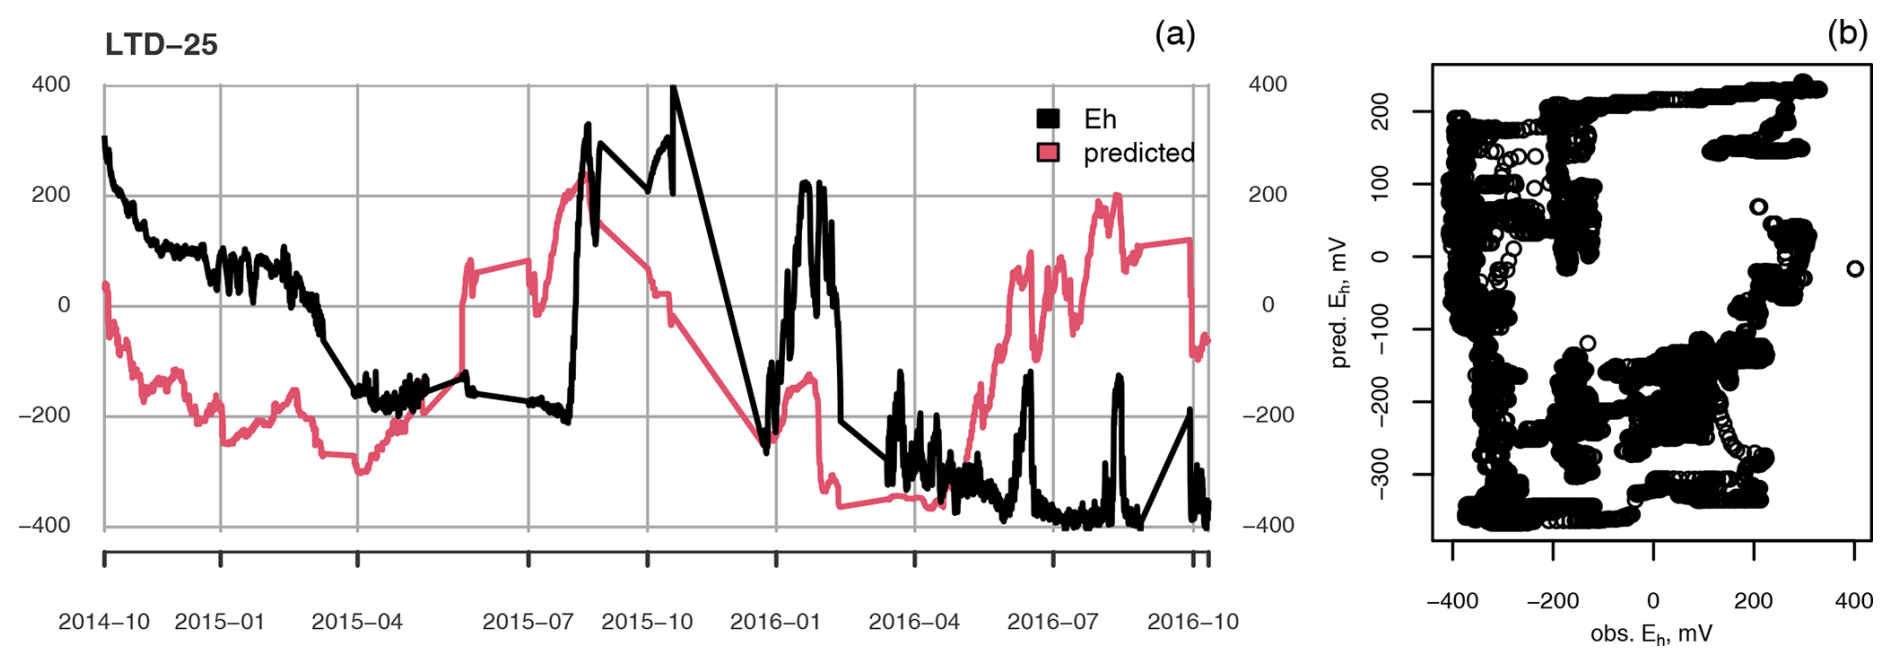
Figure A2(a) Measured (black) and predicted (red) redox potential and (b) observed vs. predicted Eh at the ME-LTD plot at 25 cm depth.
More often than not, the Eh value did not react to inundation in a monotonic fashion, which was the main assumption behind use of an asymptotic function to model the connection between time inundated and Eh. In practice, Eh values often fluctuated around the Fe reduction level or higher, reaching levels indicative of O2 reduction, even during months-long inundation periods.
Even though the linear models were fitted for each depth at each treatment separately, for the most part they completely failed to reproduce the temporal dynamics of Eh (Figs. A2 and A3). Only for the UD plot, at 35 cm depth, was the average Eh value predicted well, although even then any shorter-term temporal dynamics were completely missing (Fig. A4).
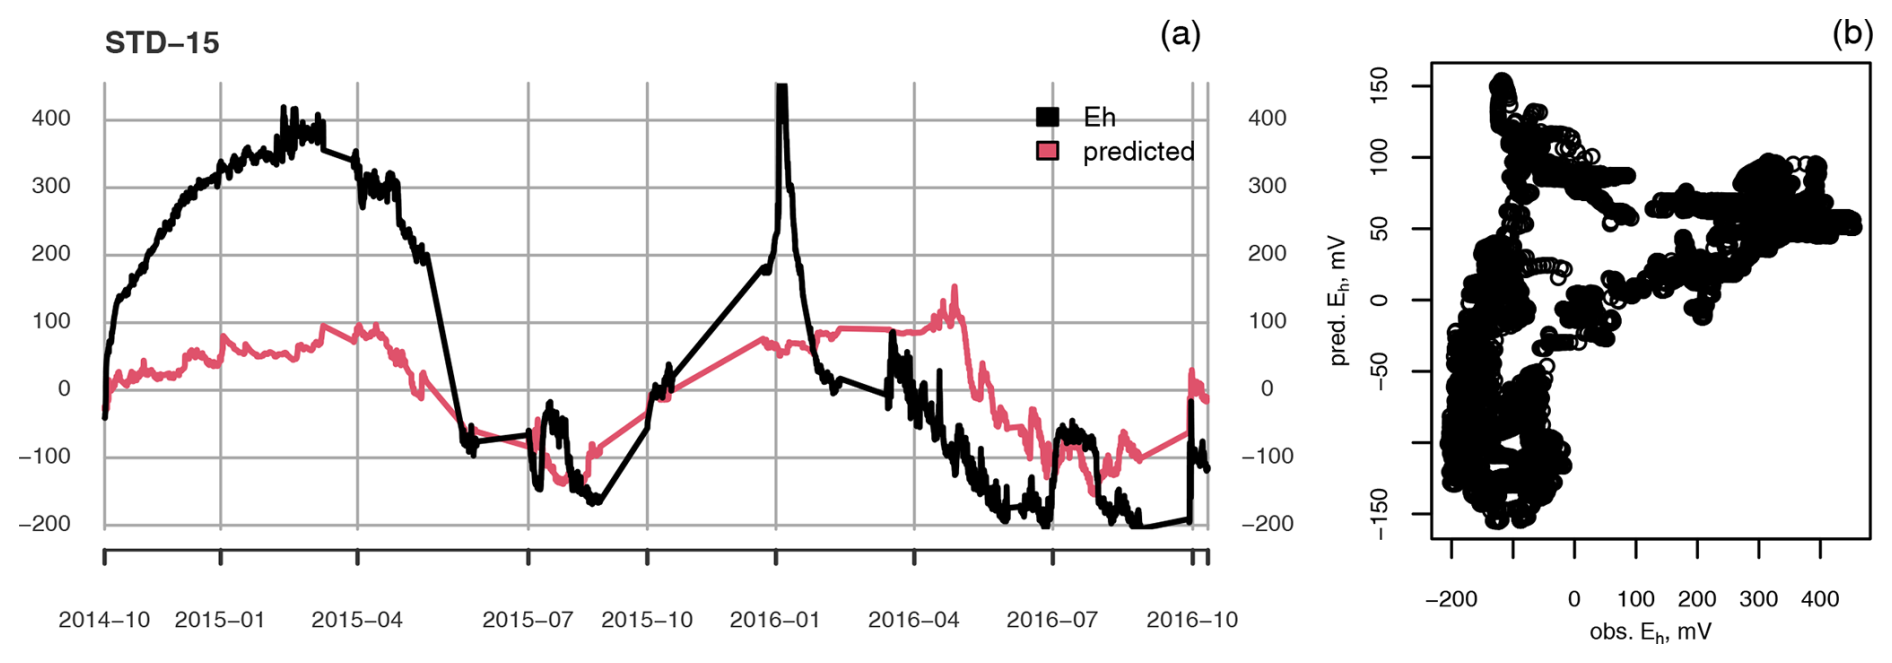
Figure A3(a) Measured (black) and predicted (red) redox potential and (b) observed vs. predicted Eh at the ME-STD plot at 15 cm depth.
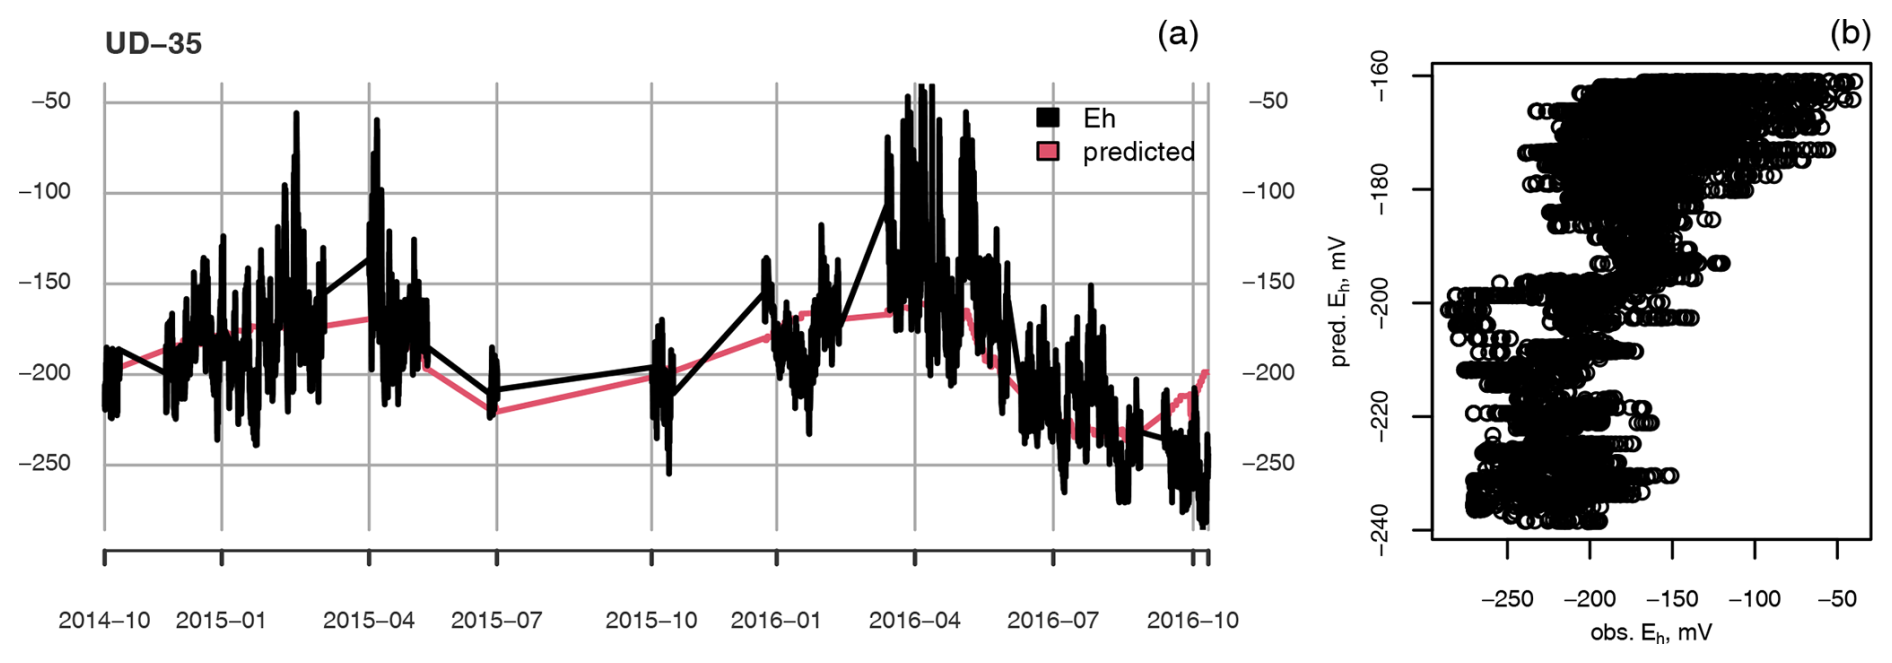
Figure A4(a) Measured (black) and predicted (red) redox potential and (b) observed vs. predicted Eh at the ME-UD plot at 35 cm depth.
A3 Suggestions regarding modelling of Eh
In the data presented here, the momentary WTL, soil and air temperature, and historical precipitation were not sufficient to reliably explain the temporal changes in Eh. Possibly some sort of dynamic model could work better with respect to predicting how Eh is affected by environmental variables over time.
The original (Eh, WTL, soilT, enzymatic activity, and pH) data are available from Zenodo: https://doi.org/10.5281/zenodo.12544806 (Koskinen et al., 2024). Other data and scripts are available from the corresponding author upon reasonable request.
The supplement related to this article is available online at https://doi.org/10.5194/bg-22-3989-2025-supplement.
MK processed and analysed the data; carried out all calculations and model fitting, unless otherwise noted; and wrote the first manuscript draft and undertook revisions, with input from all co-authors. JA carried out the wavelet analysis of hourly data. VV and LH performed the fieldwork, carried out the analysis and interpretation of the enzyme activity assessment, and wrote the subsections concerning enzymatic activity. KR performed English proofreading of the manuscript. MV designed, built, and installed the field redox potential measurement system. RL conceived the original research idea, planned the field experiment, and supervised the project.
The contact author has declared that none of the authors has any competing interests.
Publisher's note: Copernicus Publications remains neutral with regard to jurisdictional claims made in the text, published maps, institutional affiliations, or any other geographical representation in this paper. While Copernicus Publications makes every effort to include appropriate place names, the final responsibility lies with the authors.
The authors wish to thank Petra Straková for help with peat sampling and chemical analysis. This work was supported by the Finnish Research Council (grant nos. 289116 and 339489) and the Maj and Tor Nessling Foundation.
This research has been supported by the Research Council of Finland (grant nos. 339489 and 289116).
Open-access funding was provided by the Helsinki University Library.
This paper was edited by Robert Rhew and reviewed by Jim Boonman and one anonymous referee.
Aalto, J., Aalto, P., Keronen, P., Kolari, P., Rantala, P., Taipale, R., Kajos, M., Patokoski, J., Rinne, J., Ruuskanen, T., Leskinen, M., Laakso, H., Levula, J., Pohja, T., Siivola, E., Kulmala, M., and Ylivinkka, I.: SMEAR II Hyytiälä forest meteorology, greenhouse gases, air quality and soil, University of Helsinki, Institute for Atmospheric and Earth System Research [data set], https://doi.org/10.23729/23dd00b2-b9d7-467a-9cee-b4a122486039, 2023. a
Aeschbacher, M., Vergari, D., Schwarzenbach, R. P., and Sander, M.: Electrochemical analysis of proton and electron transfer equilibria of the reducible moieties in humic acids, Environ. Sci. Technol., 45, 8385–8394, https://doi.org/10.1021/es201981g, 2011. a
Alef, K. and Kleiner, D.: Arginine ammonification, a simple method to estimate microbial activity potentials in soils, Soil Biol. Biochem., 18, 233–235, https://doi.org/10.1016/0038-0717(86)90033-7, 1986. a
Alef, K. and Kleiner, D.: Applicability of arginine ammonification as indicator of microbial activity in different soils, Biol. Fert. Soils, 5, 148–151, https://doi.org/10.1007/BF00257650, 1987a. a
Alef, K. and Kleiner, D.: Estimation of anaerobic microbial activities in soils by arginine ammonification and glucose-dependent CO2-production, Soil Biol. Biochem., 19, 683–686, https://doi.org/10.1016/0038-0717(87)90048-4, 1987b. a
Allison, S. D.: Soil minerals and humic acids alter enzyme stability: implications for ecosystem processes, Biogeochemistry, 81, 361–373, https://doi.org/10.1007/s10533-006-9046-2, 2006. a
Belyea, L. R.: A novel indicator of reducing conditions and water-table depth in mires, Funct. Ecol., 13, 431–434, https://doi.org/10.1046/j.1365-2435.1999.00333.x, 1999. a
Blodau, C., Basiliko, N., and Moore, T. R.: Carbon turnover in peatland mesocosms exposed to different water table levels, Biogeochemistry, 67, 331–351, https://doi.org/10.1023/B:BIOG.0000015788.30164.e2, 2004. a
Bonnett, S. A. F., Ostle, N., and Freeman, C.: Seasonal variations in decomposition processes in a valley-bottom riparian peatland, Sci. Total Environ., 370, 561–573, https://doi.org/10.1016/j.scitotenv.2006.08.032, 2006. a, b
Boonman, J., Harpenslager, S. F., van Dijk, G., Smolders, A. J. P., Hefting, M. M., van de Riet, B., and van der Velde, Y.: Redox potential is a robust indicator for decomposition processes in drained agricultural peat soils: a valuable tool in monitoring peatland wetting efforts, Geoderma, 441, 116728, https://doi.org/10.1016/j.geoderma.2023.116728, 2024. a, b
Borch, T., Kretzschmar, R., Kappler, A., Cappellen, P. V., Ginder-Vogel, M., Voegelin, A., and Campbell, K.: Biogeochemical redox processes and their impact on contaminant dynamics, Environ. Sci. Technol., 44, 15–23, https://doi.org/10.1021/es9026248, 2010. a, b
Burgin, A. J. and Loecke, T. D.: The biogeochemical redox paradox: how can we make a foundational concept more predictive of biogeochemical state changes?, Biogeochemistry, 164, 349–370, https://doi.org/10.1007/s10533-023-01036-9, 2023. a
de Mars, H. and Wassen, M. J.: Redox potentials in relation to water levels in different mire types in the Netherlands and Poland, Plant Ecol., 140, 41–51, https://doi.org/10.1023/A:1009733113927, 1999. a
Dinsmore, K. J., Billett, M. F., Dyson, K. E., Harvey, F., Thomson, A. M., Piirainen, S., and Kortelainen, P.: Stream water hydrochemistry as an indicator of carbon flow paths in Finnish peatland catchments during a spring snowmelt event, Sci. Total Environ., 409, 4858–4867, https://doi.org/10.1016/j.scitotenv.2011.07.063, 2011. a
Elzhov, T. V., Mullen, K. M., Spiess, A.-N., and Bolker, B.: minpack.lm: R Interface to the Levenberg-Marquardt Nonlinear Least-Squares Algorithm Found in MINPACK, Plus Support for Bounds, r package version 1.2-2, https://CRAN.R-project.org/package=minpack.lm (last access: 3 October 2022), 2022. a
Eskelinen, R., Ronkanen, A.-K., Marttila, H., Isokangas, E., and Kløve, B.: Effect of soil frost on snow-melt runoff generation: stable isotope study in drained peatlands, Boreal Environ. Res., 21, 556–570, 2016. a
Estop-Aragonés, C., Knorr, K.-H., and Blodau, C.: Controls on in situ oxygen and dissolved inorganic carbon dynamics in peats of a temperate fen, J. Geophys. Res.-Biogeo., 117, G02002, https://doi.org/10.1029/2011JG001888, 2012. a
Estop-Aragonés, C., Knorr, K.-H., and Blodau, C.: Belowground in situ redox dynamics and methanogenesis recovery in a degraded fen during dry-wet cycles and flooding, Biogeosciences, 10, 421–436, https://doi.org/10.5194/bg-10-421-2013, 2013. a
Ettwig, K. F., Zhu, B., Speth, D., Keltjens, J. T., Jetten, M. S. M., and Kartal, B.: Archaea catalyze iron-dependent anaerobic oxidation of methane, P. Natl. Acad. Sci. USA, 113, 12792–12796, https://doi.org/10.1073/pnas.1609534113, 2016. a
Fenner, N. and Freeman, C.: Drought-induced carbon loss in peatlands, Nat. Geosci., 4, 895–900, https://doi.org/10.1038/ngeo1323, 2011. a
Fenner, N., Williams, R., Toberman, H., Hughes, S., Reynolds, B., and Freeman, C.: Decomposition `hotspots' in a rewetted peatland: implications for water quality and carbon cycling, Hydrobiologia, 674, 51–66, https://doi.org/10.1007/s10750-011-0733-1, 2011. a
Freeman, C., Liska, G., Ostle, N. J., Lock, M. A., Reynolds, B., and Hudson, J.: Microbial activity and enzymic decomposition processes following peatland water table drawdown, Plant Soil, 180, 121–127, https://doi.org/10.1007/BF00015418, 1996. a
Freeman, C., Ostle, N., and Kang, H.: An Enzymic “latch” on a global carbon store, Nature, 409, 149, https://doi.org/10.1038/35051650, 2001. a, b, c
Freeman, C., Ostle, N. J., Fenner, N., and Kang, H.: A regulatory role for phenol oxidase during decomposition in peatlands, Soil Biol. Biochem., 36, 1663–1667, https://doi.org/10.1016/j.soilbio.2004.07.012, 2004. a
Fujii, K., Yamada, T., Hayakawa, C., Nakanishi, A., and Funakawa, S.: Kinetics of arginine ammonification to estimate microbial activity of N mineralization in forest and cropland soils, Eur. J. Soil Biol., 92, 1–7, https://doi.org/10.1016/j.ejsobi.2019.03.001, 2019. a
Gong, J., Kellomäki, S., Wang, K., Zhang, C., Shurpali, N., and Martikainen, P. J.: Modeling CO2 and CH4 flux changes in pristine peatlands of Finland under changing climate conditions, Ecol. Model., 263, 64–80, https://doi.org/10.1016/j.ecolmodel.2013.04.018, 2013. a, b
Green, J. and Paget, M. S.: Bacterial redox sensors, Nat. Rev. Microbiol., 2, 954–966, https://doi.org/10.1038/nrmicro1022, 2004. a
Haas, E., Klatt, S., Fröhlich, A., Kraft, P., Werner, C., Kiese, R., Grote, R., Breuer, L., and Butterbach-Bahl, K.: LandscapeDNDC: a process model for simulation of biosphere–atmosphere–hydrosphere exchange processes at site and regional scale, Landscape Ecol., 28, 615–636, https://doi.org/10.1007/s10980-012-9772-x, 2013. a
Hall, S. J. and Silver, W. L.: Iron oxidation stimulates organic matter decomposition in humid tropical forest soils, Glob. Change Biol., 19, 2804–2813, https://doi.org/10.1111/gcb.12229, 2013. a, b
Jaatinen, K., Fritze, H., Laine, J., and Laiho, R.: Effects of short- and long-term water-level drawdown on the populations and activity of aerobic decomposers in a boreal peatland, Glob. Change Biol., 13, 491–510, https://doi.org/10.1111/j.1365-2486.2006.01312.x, 2007. a
Kaila, A., Asam, Z., Koskinen, M., Uusitalo, R., Smolander, A., Kiikkilä, O., Sarkkola, S., O'Driscoll, C., Kitunen, V., Fritze, H., Nousiainen, H., Tervahauta, A., Xiao, L., and Nieminen, M.: Impact of re-wetting of forestry-drained peatlands on water quality – a laboratory approach assessing the release of P, N, Fe, and dissolved organic carbon, Water Air Soil Poll., 227, 292, https://doi.org/10.1007/s11270-016-2994-9, 2016. a
Kandeler, E. and Gerber, H.: Short-term assay of soil urease activity using colorimetric determination of ammonium, Biol. Fert. Soils, 6, 68–72, https://doi.org/10.1007/BF00257924, 1988. a
Kane, E. S., Veverica, T. J., Tfaily, M. M., Lilleskov, E. A., Meingast, K. M., Kolka, R. K., Daniels, A. L., and Chimner, R. A.: Reduction-oxidation potential and dissolved organic matter composition in northern peat soil: interactive controls of water table position and plant functional groups, J. Geophys. Res.-Biogeo., 124, 3600–3617, https://doi.org/10.1029/2019JG005339, 2019. a
Keller, J. K. and Takagi, K. K.: Solid-phase organic matter reduction regulates anaerobic decomposition in bog soil, Ecosphere, 4, 54, https://doi.org/10.1890/ES12-00382.1, 2013. a
Kiuru, P., Palviainen, M., Marchionne, A., Grönholm, T., Raivonen, M., Kohl, L., and Laurén, A.: Pore network modeling as a new tool for determining gas diffusivity in peat, Biogeosciences, 19, 5041–5058, https://doi.org/10.5194/bg-19-5041-2022, 2022. a
Kjaergaard, C., Heiberg, L., Jensen, H. S., and Hansen, H. C. B.: Phosphorus mobilization in rewetted peat and sand at variable flow rate and redox regimes, Geoderma, 173–174, 311–321, https://doi.org/10.1016/j.geoderma.2011.12.029, 2012. a
Klüpfel, L., Piepenbrock, A., Kappler, A., and Sander, M.: Humic substances as fully regenerable electron acceptors in recurrently anoxic environments, Nat. Geosci., 7, 195–200, https://doi.org/10.1038/ngeo2084, 2014. a
Knorr, K. H. and Blodau, C.: Impact of experimental drought and rewetting on redox transformations and methanogenesis in mesocosms of a northern fen soil, Soil Biol. Biochem., 41, 1187–1198, https://doi.org/10.1016/j.soilbio.2009.02.030, 2009. a
Kokkonen, N. A. K., Laine, A. M., Laine, J., Vasander, H., Kurki, K., Gong, J., and Tuittila, E.-S.: Responses of peatland vegetation to 15 year water level drawdown as mediated by fertility level, J. Veg. Sci., 30, 1206–1216, https://doi.org/10.1111/jvs.12794, 2019. a, b, c
Korkiakoski, M., Tuovinen, J.-P., Aurela, M., Koskinen, M., Minkkinen, K., Ojanen, P., Penttilä, T., Rainne, J., Laurila, T., and Lohila, A.: Methane exchange at the peatland forest floor – automatic chamber system exposes the dynamics of small fluxes, Biogeosciences, 14, 1947–1967, https://doi.org/10.5194/bg-14-1947-2017, 2017. a
Koskinen, M., Maanavilja, L., Nieminen, M., Minkkinen, K., and Tuittila, E.-S.: High methane emissions from restored norway spruce swamps in Southern Finland over one growing season, Mires Peat, 17, 1–13, 2016. a
Koskinen, M. I. K., Vorenhout, M., Vranová, V., Straková, P., and Laiho, R.: Redox potential and related ancillary measurements from Lakkasuo raised mire in 2014–2016, Zenodo [data set], https://doi.org/10.5281/zenodo.12544806, 2024. a
Kumaraswamy, S., Ramakrishnan, B., and Sethunathan, N.: Methane production and oxidation in an anoxic rice soil as influenced by inorganic redox species, J. Environ. Qual., 30, 2195, https://doi.org/10.2134/jeq2001.2195, 2001. a
Laiho, R. and Laine, J.: Changes in mineral element concentrations in peat soils drained for forestry in Finland, Scand. J. Forest Res., 10, 218–224, https://doi.org/10.1080/02827589509382887, 1995. a
Laiho, R., Peltoniemi, K., and Fritze, H.: Peat characteristics, microbial PLFA, and fungal and actinobacterial sequences from Lakkasuo peatland drainage experiment, year 2004, Zenodo [code], https://doi.org/10.5281/zenodo.12566743, 2024. a
Lalonde, K., Mucci, A., Ouellet, A., and Gélinas, Y.: Preservation of organic matter in sediments promoted by iron, Nature, 483, 198–200, https://doi.org/10.1038/nature10855, 2012. a
Lee, G. R., Gommers, R., Waselewski, F., Wohlfahrt, K., and O'Leary, A.: Pywavelets: a Python package for wavelet analysis, Journal of Open Source Software, 4, 1237, https://doi.org/10.21105/joss.01237, 2019. a
Li, Y., Yu, S., Strong, J., and Wang, H.: Are the biogeochemical cycles of carbon, nitrogen, sulfur, and phosphorus driven by the “FeIII–FeII redox wheel” in dynamic redox environments?, J. Soil. Sediment., 12, 683–693, https://doi.org/10.1007/s11368-012-0507-z, 2012. a
Liang, J., Bi, G., and Zhan, C.: Multinomial and ordinal logistic regression analyses with multi-categorical variables using R, Annals of Translational Medicine, 8, 982, https://doi.org/10.21037/atm-2020-57, 2020. a
Lin, Q. and Brookes, P. C.: Arginine ammonification as a method to estimate soil microbial biomass and microbial community structure, Soil Biol. Biochem., 31, 1985–1997, https://doi.org/10.1016/S0038-0717(99)00121-2, 1999. a
Lloyd, A. B. and Sheaffe, M. J.: Urease activity in soils, Plant Soil, 39, 71–80, https://doi.org/10.1007/BF00018046, 1973. a
Mainiero, R. and Kazda, M.: Effects of Carex rostrata on soil oxygen in relation to soil moisture, Plant Soil, 270, 311–320, https://doi.org/10.1007/s11104-004-1724-z, 2005. a
Marttunen, S.: Impacts of Controlled Redox Conditions on Greenhouse Gas Dynamics from Peat, MS thesis, University of Helsinki, Faculty of Biological and Environmental Sciences, Helsinki, Finland, https://helda.helsinki.fi/server/api/core/bitstreams/e3d04603-e63a-42d8-a955-fc78cf2957a4/content (last access: 5 May 2024), 2024. a
Mchergui, C., Besaury, L., Langlois, E., Aubert, M., Akpa-Vinceslas, M., Buatois, B., Quillet, L., and Bureau, F.: A comparison of permanent and fluctuating flooding on microbial properties in an ex-situ estuarine riparian system, Appl. Soil Ecol., 78, 1–10, https://doi.org/10.1016/j.apsoil.2014.01.012, 2014. a
Melton, E. D., Swanner, E. D., Behrens, S., Schmidt, C., and Kappler, A.: The interplay of microbially mediated and abiotic reactions in the biogeochemical Fe cycle, Nat. Rev. Microbiol., 12, 797–808, https://doi.org/10.1038/nrmicro3347, 2014. a
Minkkinen, K., Vasander, H., Jauhiainen, S., Karsisto, M., and Laine, J.: Post-drainage changes in vegetation composition and carbon balance in Lakkasuo mire, Central Finland, Plant Soil, 207, 107–120, https://doi.org/10.1023/a:1004466330076, 1999. a
Mitchell, C. P. J. and Branfireun, B. A.: Hydrogeomorphic controls on reduction–oxidation conditions across boreal upland–peatland interfaces, Ecosystems, 8, 731–747, https://doi.org/10.1007/s10021-005-1792-9, 2005. a
Palviainen, M., Pumpanen, J., Mosquera, V., Hasselquist, E. M., Laudon, H., Ostonen, I., Kull, A., Wilson, F. R., Peltomaa, E., Könönen, M., Launiainen, S., Peltola, H., Ojala, A., and Laurén, A.: Extending the SUSI peatland simulator to include dissolved organic carbon formation, transport and biodegradation – proper water management reduces lateral carbon fluxes and improves carbon balance, Sci. Total Environ., 950, 175173, https://doi.org/10.1016/j.scitotenv.2024.175173, 2024. a
Peltoniemi, K., Straková, P., Fritze, H., Iráizoz, P. A., Pennanen, T., and Laiho, R.: How water-level drawdown modifies litter-decomposing fungal and actinobacterial communities in boreal peatlands, Soil Biol. Biochem., 51, 20–34, https://doi.org/10.1016/j.soilbio.2012.04.013, 2012. a
Pyzola, S. M., Dhakal, P., Coyne, M. S., Grove, J. H., Vandiviere, M. M., and Matocha, C. J.: Transformation of organic matter under anoxic conditions in soils, Sci. Total Environ., 970, 178899, https://doi.org/10.1016/j.scitotenv.2025.178899, 2025. a
R Core Team: R: A Language and Environment for Statistical Computing, R Foundation for Statistical Computing, https://www.R-project.org/ (last access: 3 March 2024), 2023. a, b
Rejsek, K., Formanek, P., and Pavelka, M.: Estimation of protease activity in soils at low temperatures by casein amendment and with substitution of buffer by demineralized water, Amino Acids, 35, 411–417, https://doi.org/10.1007/s00726-007-0601-5, 2008. a
Riedel, T., Zak, D., Biester, H., and Dittmar, T.: Iron traps terrestrially derived dissolved organic matter at redox interfaces, P. Natl. Acad. Sci. USA, 110, 10101–10105, https://doi.org/10.1073/pnas.1221487110, 2013. a, b
Romanowicz, K. J., Kane, E. S., Potvin, L. R., Daniels, A. L., Kolka, R. K., and Lilleskov, E. A.: Understanding drivers of peatland extracellular enzyme activity in the PEATcosm experiment: mixed evidence for enzymic latch hypothesis, Plant Soil, 397, 371–386, https://doi.org/10.1007/s11104-015-2746-4, 2015. a
Sallantaus, T. and Kaipainen, H.: Water-Carried Element Balances of Peatlands, Northern peatlands in global climatic change, edited by: Laiho, R., Laine, J., and Vasander, H., Publications of the Academy of Finland, Edita, Helsinki, 197–203, ISBN 951-37-1865-4, 1996. a
Sanchez-Julia, M. and Turner, B. L.: Abiotic contribution to phenol oxidaseactivity across a manganese gradient in tropical forest soils, Biogeochemistry, 153, 33–45, https://doi.org/10.1007/s10533-021-00764-0, 2021. a
Schmidbauer, A. R. a. H.: WaveletComp: Computational Wavelet Analysis, CRAN [code], https://doi.org/10.32614/CRAN.package.WaveletComp, 2018. a
Seybold, C. A., Mersie, W., Huang, J., and McNamee, C.: Soil redox, pH, temperature, and water-table patterns of a freshwater tidal wetland, Wetlands, 22, 149–158, https://doi.org/10.1672/0277-5212(2002)022[0149:SRPTAW]2.0.CO;2, 2002. a
Singh, D. K. and Kumar, S.: Nitrate reductase, arginine deaminase, urease and dehydrogenase activities in natural soil (ridges with forest) and in cotton soil after acetamiprid treatments, Chemosphere, 71, 412–418, https://doi.org/10.1016/j.chemosphere.2007.11.005, 2008. a
Sinsabaugh, R. L.: Phenol oxidase, peroxidase and organic matter dynamics of soil, Soil Biol. Biochem., 42, 391–404, https://doi.org/10.1016/j.soilbio.2009.10.014, 2010. a, b
Straková, P., Niemi, R. M., Freeman, C., Peltoniemi, K., Toberman, H., Heiskanen, I., Fritze, H., and Laiho, R.: Litter type affects the activity of aerobic decomposers in a boreal peatland more than site nutrient and water table regimes, Biogeosciences, 8, 2741–2755, https://doi.org/10.5194/bg-8-2741-2011, 2011. a
Straková, P., Penttilä, T., Laine, J., and Laiho, R.: Disentangling direct and indirect effects of water table drawdown on above- and belowground plant litter decomposition: consequences for accumulation of organic matter in boreal peatlands, Glob. Change Biol., 18, 322–335, https://doi.org/10.1111/j.1365-2486.2011.02503.x, 2012. a, b
Sun, X., Xiang, W., He, L., and Zhao, Y.: Impacts of hydrological conditions on enzyme activities and phenolic concentrations in peatland soil: an experimental simulation, Front. Earth Sci.-PRC, 4, 463–470, https://doi.org/10.1007/s11707-010-0140-3, 2010. a
Tang, G., Zheng, J., Xu, X., Yang, Z., Graham, D. E., Gu, B., Painter, S. L., and Thornton, P. E.: Biogeochemical modeling of CO2 and CH4 production in anoxic Arctic soil microcosms, Biogeosciences, 13, 5021–5041, https://doi.org/10.5194/bg-13-5021-2016, 2016. a
Toberman, H., Laiho, R., Evans, C. D., Artz, R. R. E., Fenner, N., Straková, P., and Freeman, C.: Long-term drainage for forestry inhibits extracellular phenol oxidase activity in Finnish boreal mire peat, Eur. J. Soil Sci., 61, 950–957, https://doi.org/10.1111/j.1365-2389.2010.01292.x, 2010. a
Torrence, C. and Compo, G. P.: A Practical guide to wavelet analysis, B. Am. Meteorol. Soc., 79, 61–78, https://doi.org/10.1175/1520-0477(1998)079<0061:APGTWA>2.0.CO;2, 1998. a
Vorenhout, M., van der Geest, H. G., van Marum, D., Wattel, K., Eijsackers, H. J. P., and July, P.: Automated and continuous redox potential measurements in soil, J. Environ. Qual., 33, 1562–1567, https://doi.org/10.2134/jeq2004.1562, 2004. a, b, c
Vorenhout, M., van der Geest, H. G., and Hunting, E. R.: An improved datalogger and novel probes for continuous redox measurements in wetlands, Int. J. Environ. An. Ch., 91, 801–810, https://doi.org/10.1080/03067319.2010.535123, 2011. a
Wang, Y.: Frequencies of the Ricker wavelet, Geophysics, 80, A31–A37, https://doi.org/10.1190/geo2014-0441.1, 2015. a
Wang, Y., Wang, H., He, J.-S., and Feng, X.: Iron-mediated soil carbon response to water-table decline in an Alpine wetland, Nat. Commun., 8, 15972, https://doi.org/10.1038/ncomms15972, 2017. a, b, c
Wen, Y., Zang, H., Ma, Q., Evans, C. D., Chadwick, D. R., and Jones, D. L.: Is the `enzyme latch' or `iron gate' the key to protecting soil organic carbon in peatlands?, Geoderma, 349, 107–113, https://doi.org/10.1016/j.geoderma.2019.04.023, 2019. a
Wojciech, S. L. and Styła, K.: Changes of urease activity in peat profile of peatland by Nierybno Lake in “Bory Tucholskie” National Park, Journal ProEnvironment Promedieu, 4, 436–439, 2011. a
Wriedt, G. and Rode, M.: Modelling nitrate transport and turnover in a lowland catchment system, J. Hydrol., 328, 157–176, https://doi.org/10.1016/j.jhydrol.2005.12.017, 2006. a
Xiang, W. and Freeman, C.: Annual variation of temperature sensitivity of soil organic carbon decomposition in north peatlands: implications for thermal responses of carbon cycling to global warming, Environ. Geol., 58, 499–508, https://doi.org/10.1007/s00254-008-1523-6, 2009. a
Yu, K., Faulkner, S. P., and Baldwin, M. J.: Effect of hydrological conditions on nitrous oxide, methane, and carbon dioxide dynamics in a bottomland hardwood forest and its implication for soil carbon sequestration, Glob. Change Biol., 14, 798–812, https://doi.org/10.1111/j.1365-2486.2008.01545.x, 2008. a
Yu, Z., Loisel, J., Brosseau, D. P., Beilman, D. W., and Hunt, S. J.: Global peatland dynamics since the last glacial maximum, Geophys. Res. Lett., 37, L13402, https://doi.org/10.1029/2010GL043584, 2010. a
Zak, D., Gelbrecht, J., and Steinberg, C. E. W.: Phosphorus retention at the redox interface of peatlands adjacent to surface waters in Northeast Germany, Biogeochemistry, 70, 357–368, https://doi.org/10.1007/s10533-003-0895-7, 2004. a, b
Zhang, Z. and Furman, A.: Soil redox dynamics under dynamic hydrologic regimes – a review, Sci. Total Environ., 763, 143026, https://doi.org/10.1016/j.scitotenv.2020.143026, 2021. a