the Creative Commons Attribution 4.0 License.
the Creative Commons Attribution 4.0 License.
 | 26 Aug 2025
Climate impact on mean annual cycle and interannual variability of CO2 fluxes in European deciduous broadleaf and evergreen needleleaf forests: insights from observations and state-of-the-art data-driven and process-based models
Asmat Ullah
Gaïa Michel
Olivier Mathieu
Mathieu Thevenot
Andrey Dara
Robert Granat
Zhendong Wu
Clément Bonnefoy-Claudet
Julianne Capelle
Jean Cacot
John S. Kimball
The impact of climate on the annual cycle and interannual variability of CO2 fluxes is assessed in European evergreen needleleaf forests (ENFs) and deciduous broadleaf forests (DBFs) using observations from 19 sites, alongside outputs from process-based and data-driven models. All models capture the temporal phasing of CO2 fluxes, including a shorter sequestration period in northern rather than southern Europe, a more pronounced annual cycle for DBFs than for ENFs in central Europe and strong interannual variability across sites. However, they generally underestimate both the magnitude of CO2 sequestration and its interannual variability compared to observations. Regarding the annual cycle, all datasets indicate enhanced CO2 uptake from late spring to early fall, with a stronger climate–CO2 flux coupling in northern and central Europe than in southern Europe, where seasonality is less pronounced. At the interannual timescale, the climate does not show a significant influence on observed and modelled net ecosystem exchange (NEE) when correlations are computed using monthly anomalies across all months combined. This apparent lack of relationship conceals meaningful seasonal patterns. In winter and fall, NEE tends to be positively correlated with temperature, soil moisture and vapour pressure deficit (VPD). In spring, NEE shows negative correlations with temperature and VPD but a positive correlation with soil moisture. The summer pattern is reversed compared to the spring pattern. In the observations, these relationships are noisy in both time and space, suggesting strong site-specific effects. In contrast, the models exhibit more structured and spatially coherent patterns with strong correlations, which may reflect an exaggerated response to climate forcing despite underestimated magnitude in CO2 flux interannual variability.
- Article
(14321 KB) - Full-text XML
- BibTeX
- EndNote


Forest ecosystems are the largest part of the land CO2 sink (Lindeskog et al., 2021), with up to 20 %–50 % of anthropogenic CO2 emissions (land-use changes excluded) sequestered for the 2000–2010 period (Le Quéré et al., 2018; Pugh et al., 2019; Pan et al., 2024). In Europe, recent estimations suggest a slight increase in CO2 sequestration by forest ecosystems over the 2000–2021 period mainly due to the fertilization effect of increased atmospheric CO2 concentration (Prentice et al., 2001; Piao et al., 2009; Schimel et al., 2015; Walker et al., 2021; Sitch et al., 2024). However, this trend remains weak, as the fertilization effect has almost been compensated for by a decrease in CO2 sequestration induced by climate change (Sitch et al., 2024). The extent to which climate controls CO2 flux exchanges between the atmosphere and European forest ecosystems is thus a burning question in the context of climate change.
Numerous studies have demonstrated the strong influence of climate on CO2 exchanges between the atmosphere and forest ecosystems. The annual cycle and, to a lesser extent, interannual variability of these fluxes are driven by factors such as incident shortwave radiation, temperature, atmospheric evaporative demand and the water cycle, including soil moisture dynamics (Haszpra et al., 2005; Tang et al., 2014; von Buttlar et al., 2018; Kong et al., 2022; Sharma et al., 2022; Li et al., 2023; Xu et al., 2023). The dominant climate factor influencing CO2 fluxes depends on the specific component considered. The variability in net ecosystem exchanges (NEEs) is a mixed response of its two components: gross primary production (GPP), which sequesters CO2 into the ecosystem through photosynthesis, and ecosystem respiration (RECO), which releases CO2 into the atmosphere from forest metabolism (autotroph respiration) and the decomposition of organic matter by fungi and bacteria (heterotrophic respiration). GPP is primarily driven by vapour pressure deficit (VPD), shortwave radiation, temperature and soil moisture, while RECO is mainly influenced by precipitation, soil moisture and temperature (Messori et al., 2019).
The influence of climate on CO2 fluxes also depends on several additional factors, with seasonality playing a crucial role. Severe heat waves and droughts acted to reduce CO2 sequestration in summer at the Europe-wide scale in 2003 (Ciais et al., 2005), in northern Europe in 2018 (Smith et al., 2020; Thompson et al., 2020), and in central and southeastern Europe in 2022 (van der Woude et al., 2023). On the other hand, anomalously high temperature under normal soil moisture conditions in spring set favourable growth conditions and hence increased CO2 sequestration, such as in northern Europe in 2018 (Smith et al., 2020). The climatic zone under consideration is also a key factor. For instance, GPP is mostly influenced by soil moisture in the Mediterranean region, VPD over parts of central Europe, and temperature over Scandinavia, parts of eastern and southeastern Europe, and higher elevations (Seddon et al., 2016; Madani et al., 2017). The influence of climate on CO2 flux exchanges is further shaped by various factors, including soil properties (Kurbatova et al., 2008; Besnard et al., 2018; Curtis and Gough, 2018; Martinez del Castillo et al., 2022), forest management practices (Carrara et al., 2003; Saunders et al., 2012), tree age (Kurbatova et al., 2008; Besnard et al., 2018) and tree species (Carrara et al., 2003, 2004; Welp et al., 2007; Kong et al., 2022).
Assessing the impact of climate on CO2 flux exchanges remains challenging. The main reason involves the scarcity of multi-year CO2 fluxes measured by eddy covariance above the canopy (Burba, 2021). At the European scale, the Integrated Carbon Observation System (ICOS) network provides standardized and open data from 98 ecosystem stations across 16 countries. The flux tower measurements remain limited in number and temporal depth and unevenly distributed spatially, making it difficult to assess the impact of climate on the interannual variability (and trends) in CO2 flux exchanges and to map them. Process-based and data-driven models allow us to tackle the above limitations. Process-based models, such as dynamical vegetation models, are routinely used to assess CO2 flux exchanges between the atmosphere and the biosphere (Friedlingstein et al., 2023). These are mechanistic models (Friedlingstein et al., 2006; Sitch et al., 2008) allowing for testing the response of CO2 fluxes to individual and combined forcing (Sitch et al., 2024). Data-driven models rely on the identification of statistical relationships between flux tower measures by eddy covariance and corresponding land use, vegetation properties and climate characteristics. Based on these statistical relationships, empirical models are built and used for upscaling, i.e. for assessing CO2 fluxes in regions where they are not measured (Tramontana et al., 2016; Jung et al., 2019, 2020; Zhuravlev et al., 2022). Both approaches have limitations. Estimations of CO2 flux exchanges are highly sensitive to physical parameterizations (Cai and Prentice, 2020) and atmospheric forcing (Wu et al., 2017; Hardouin et al., 2022) in process-based models. The reliability of data-driven models is limited by the sparse and uneven distribution of flux tower measurements and by the underlying statistical methods used to build them (Jung et al., 2020). While not perfect, process-based and data-driven models provide satisfactory results for capturing large-scale patterns compared to, for example, satellite estimations (Wang et al., 2023). This makes them valuable complementary tools to observational data.
Most recent studies examining the influence of climate on the temporal dynamics of European forest CO2 fluxes rely on case studies and primarily focus on spring and summer conditions (Smith et al., 2020; Thompson et al., 2020; van der Woude et al., 2023). However, a more comprehensive assessment is needed across the entire annual cycle, as CO2 release during fall and winter is expected to increase under climate change. Additionally, climate conditions vary significantly between northern and southern Europe, necessitating a broader spatial perspective. These objectives are addressed at the monthly timescale, which is considered sufficiently fine to capture both the CO2 flux annual cycle and its interannual variability.
This study addresses these gaps by investigating the impact of climate on both the annual cycle and interannual variability of CO2 fluxes in European evergreen needleleaf forests (ENFs) and deciduous broadleaf forests (DBFs). Using ICOS network observations alongside state-of-the-art data-driven and process-based model estimates, we first characterize the observed annual cycle and interannual variability of CO2 fluxes across Europe. We then evaluate model performance in capturing the temporal phasing and magnitude of these fluxes at the site scale. Finally, we assess the influence of climate on both seasonal and interannual CO2 flux variations, leveraging the extended temporal coverage provided by models.
2.1 Site description
Out of the 24 ENF and DBF sites from the ICOS network, we selected 19 sites (Fig. 1), 13 classified as ENF and 6 as DBF, for which observed CO2 fluxes are available for at least 5 years (Table 1). These sites allow us to sample the different climatic zones of Europe. Three ENF sites (FR-Bil, FR-FBn and IT-SR2) are located in the northern region of southern Europe, close to 45° N, and ranging from sea level to 400 m in elevation. They are characterized by mild, wet winters and hot, dry summers, with annual mean temperature and precipitation of 12.9–13.90 °C and 700–960 mm, respectively. Four ENF sites (FI-Hyy, FI-Let, SE-Nor and SE-Svb) are located in northern Europe (60–65° N) at an elevation below 270 m. They are characterized by subarctic climate, with annual mean temperature and precipitation of 1.8–6.5 °C and 586–711 mm, respectively. The remaining 12 sites (six DBFs and six ENFs) are situated in central Europe within the 45–60° N, 2.5–20° E domain, encompassing a wide range of elevations (40–1730 m) and spanning temperate to continental climates. As a result, they exhibit substantial variability in annual mean temperature (4.3–11.4 °C) and precipitation (563–1338 mm).
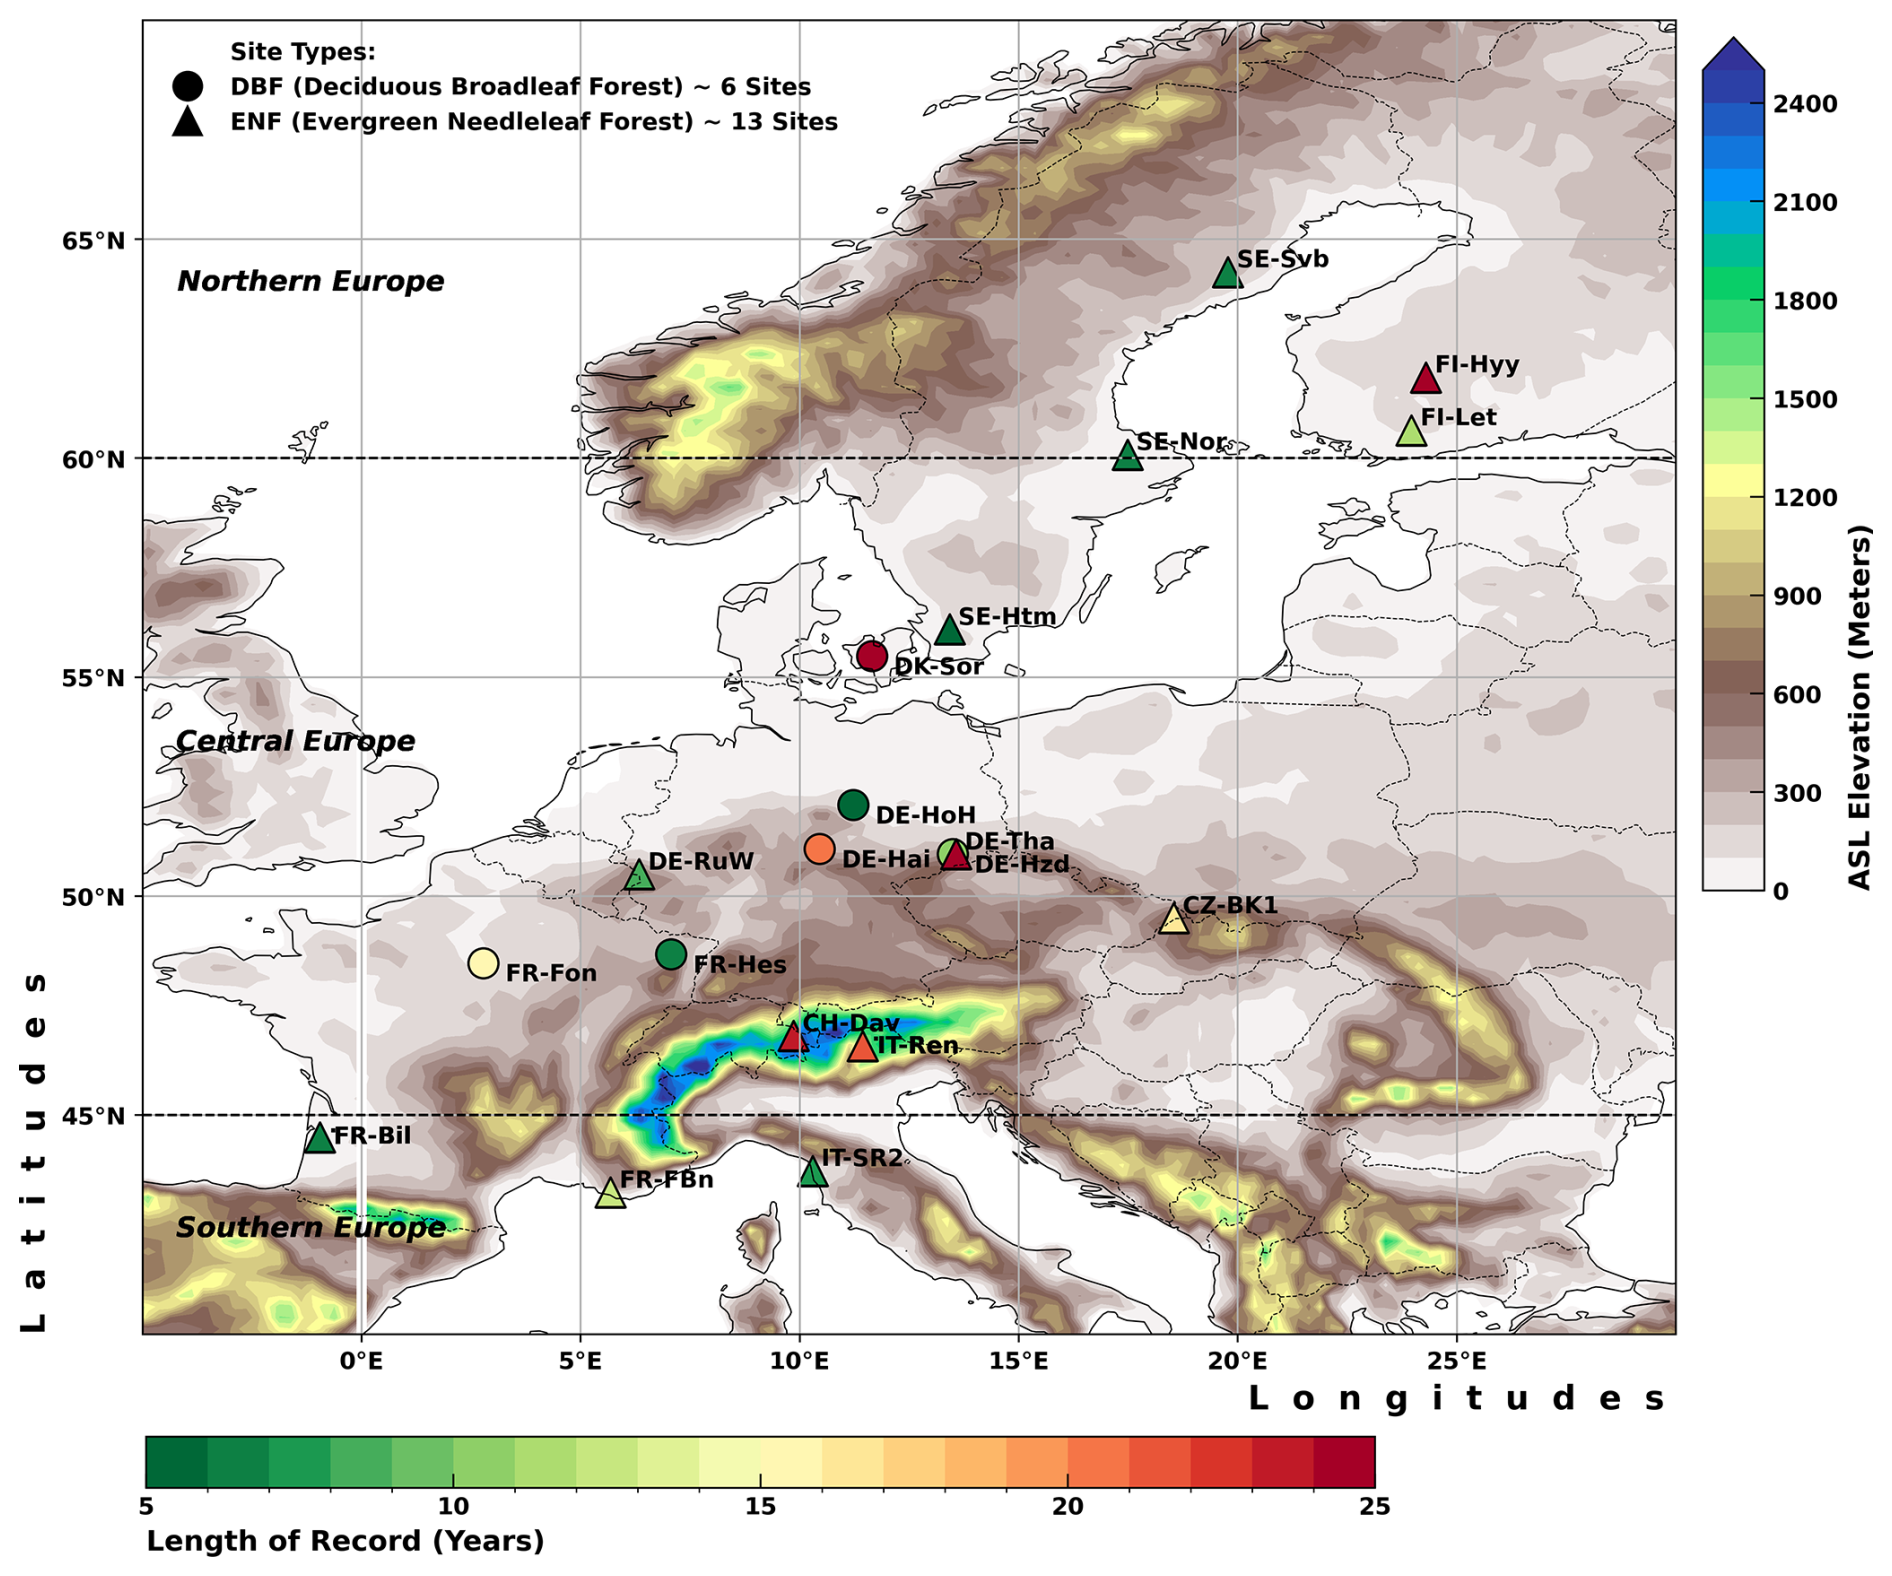
Figure 1Locations of the CO2 flux measurement sites from the FLUXNET network across Europe selected for this study. The circles correspond to the six sites located in deciduous broadleaf forests (DBFs), while the triangles indicate the 13 sites located in the evergreen needleleaf forests (ENFs). The vertical colour scale represents the terrain height (above sea level, ASL) in metres. The horizontal colour scale indicates the length of the CO2 flux record for each site. The elevation layer comes from the National Geophysical Data Center/NESDIS/NOAA/U.S. Department of Commerce (1995): TerrainBase, Global 5 Arc-minute Ocean Depth and Land Elevation from the U.S. National Geophysical Data Center (NGDC), https://doi.org/10.5065/E08M-448. Distributed under CC by 4.0. Publisher's remark: please note that the above figure contains disputed territories.
Table 1European FLUXNET sites examined in this study.
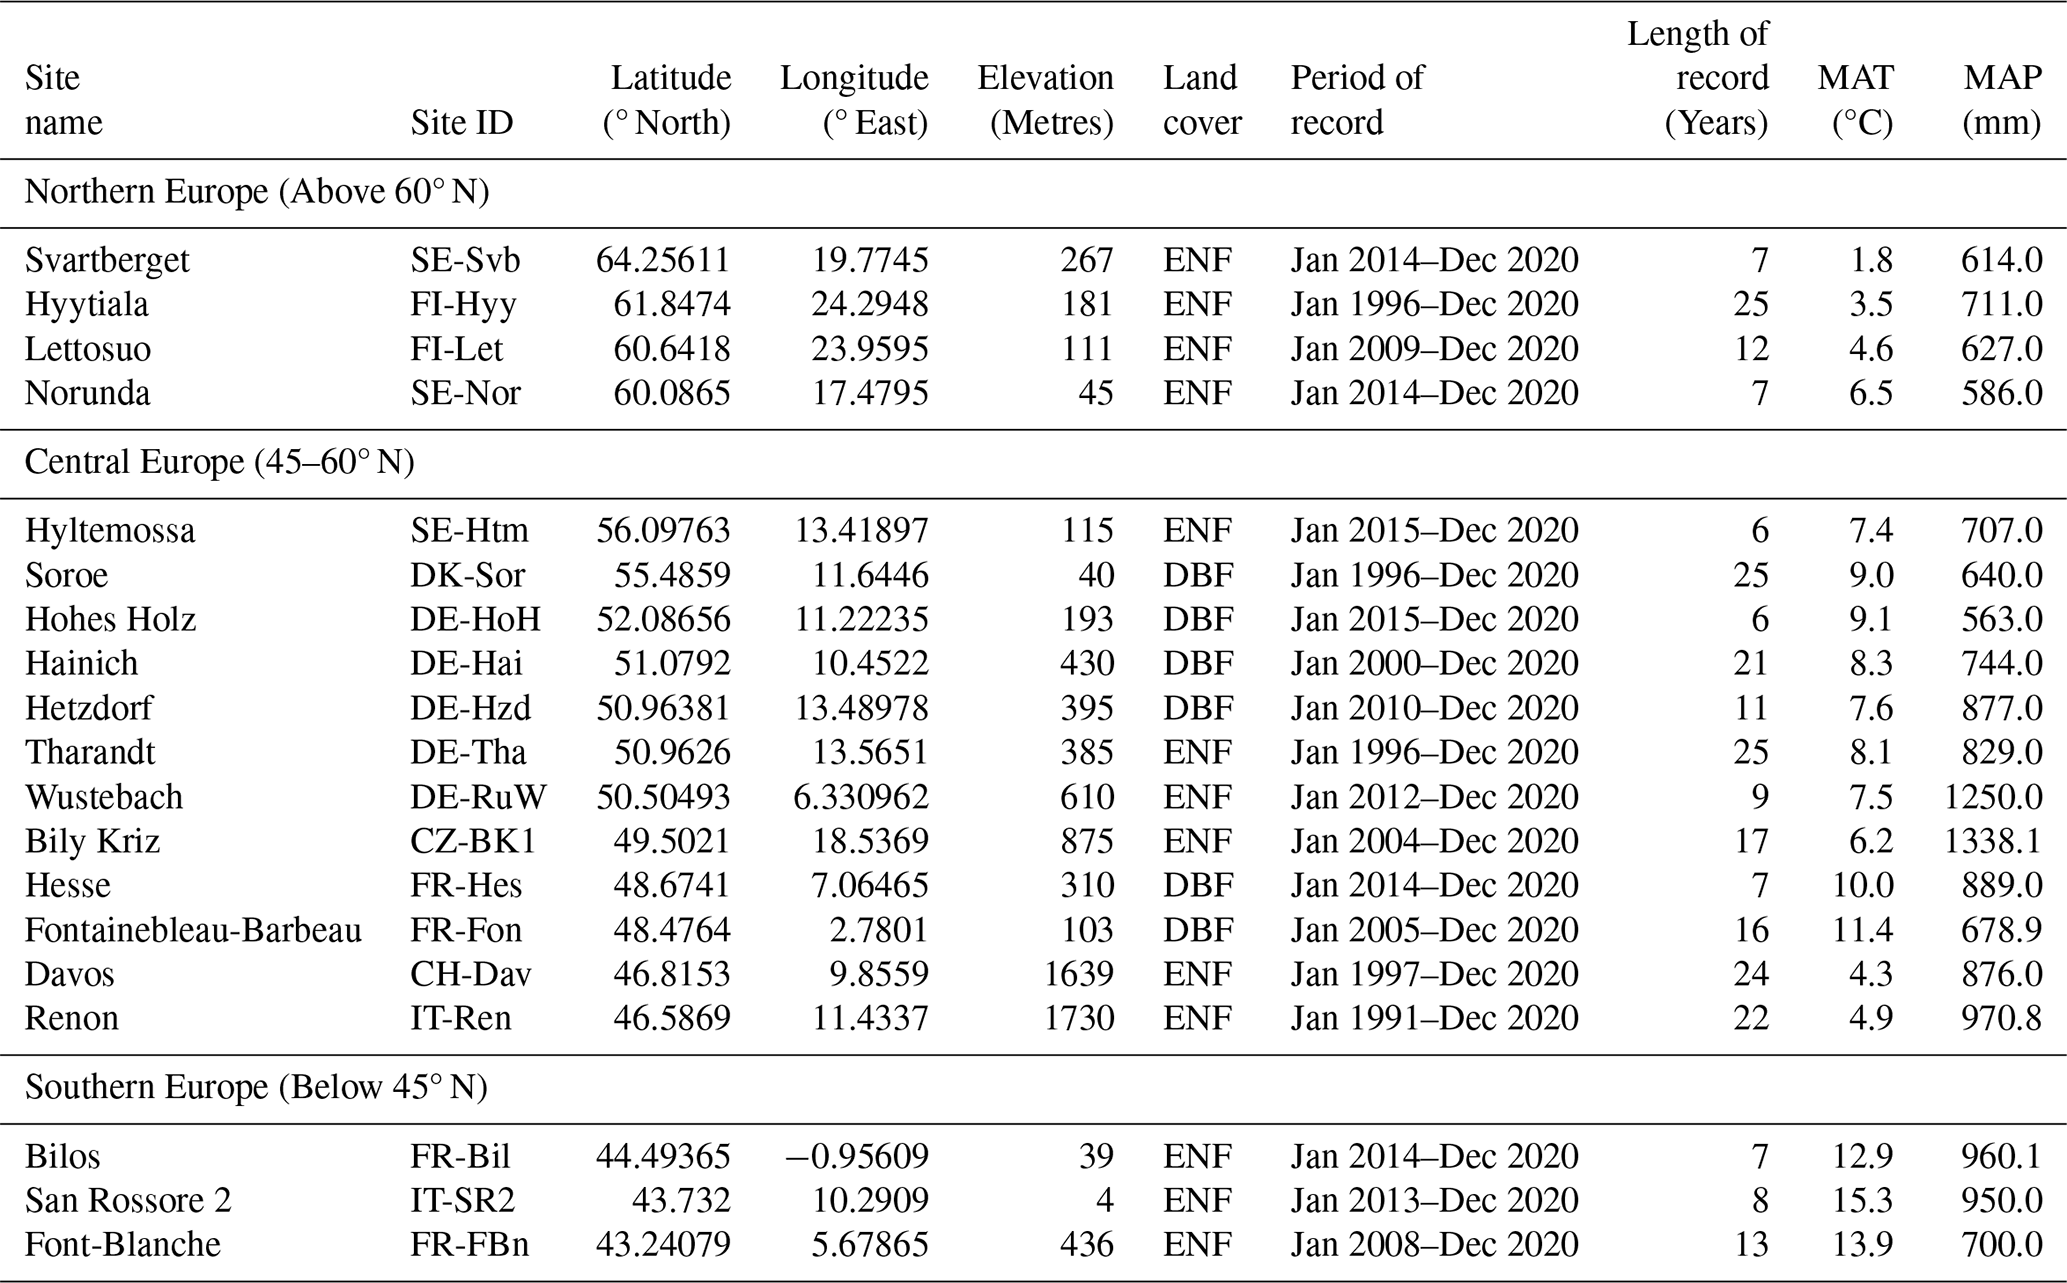
Columns 1–5 provide information on the site, including its name, ID, latitude, longitude and elevation. Columns 6–8 describe the land cover classification, the period of available records and the record length for each FLUXNET site. Columns 9–10 present the site's mean annual climatic characteristics, including temperature (MAT) and precipitation (MAP).
2.2 Carbon flux data
2.2.1 Observations
Measured CO2 fluxes come from Warm Winter 2020 (Warm Winter 2020 Team and ICOS Ecosystem Thematic Centre, 2022), an update of the FLUXNET2015 dataset (Pastorello et al., 2020) available on the ICOS platform (https://www.icos-cp.eu/data-products, last access: 6 January 2024). For each site, we selected daily time series of NEE (NEE_VUT_REF), GPP (GPP_DT_VUT_REF) and RECO (RECO_DT_VUT_REF), the latter two fluxes being derived from the daytime flux partitioning method (Lasslop et al., 2010). Preliminary analyses show the weak impact of the partitioning method (not shown).
The temporal coverage of the data varies by site (Table 1): less than 10 years for eight sites (SE-Svb, SE-Nor, SE-Htm, DE-HoH, DE-RuW, FR-Hes, FR-Bil and IT-SR2), between 10 and 20 years for five sites (FI-Let, DE-Hzd, CZ-BK1, FR-Fon and FR-FBn), and more than 20 years for six sites (FI-Hyy, DK-Sor, DE-Hai, DE-Tha, CH-Dav and IT-Ren). Given these limitations, the observational dataset likely lacks sufficient temporal depth to robustly assess the impact of climate on tower CO2 flux interannual variability, highlighting the usefulness of models as complementary tools.
2.2.2 Data-driven models
Four data-driven models are used in this study (Table 2). The first data-driven model was developed by the CarbonSpace company to quantify carbon exchange at the site scale by integrating remote sensing data, meteorological variables and eddy covariance flux measurements. A Lagrangian particle dispersion model is used for footprint gas attribution. A machine learning model is used to solve the nonlinear regression problem of estimating fluxes from remote sensing and meteorological variables (Zhuravlev et al., 2022). For this study, the learning method is updated from the kernel method used in Zhuravlev et al. (2022) to an ensemble tree method (Chen and Guestrin, 2016). The key advantages of the CarbonSpace model include its scalability, high spatial resolution, and improved prediction accuracy through robust data quality control and advanced machine learning techniques. CarbonSpace provides monthly NEE only but at a very high spatial resolution (few hectares) from January 2000 to August 2023. This allows getting as close as possible to the 19 sites (around 1.8 ha centred on each tower) and their associated CO2 flux measurement footprints.
The three other data-driven models come from the FLUXCOM initiative (Tramontana et al., 2016; Jung et al., 2019, 2020; Nelson et al., 2024). The first two are a three-member ensemble forced by both ERA5 reanalysis (Hersbach et al., 2020) and satellite data from the Moderate Resolution Imaging Spectroradiometer (MODIS) and a nine-member ensemble forced by MODIS only. The members differ by the machine learning method used to build each of the two models detailed in Jung et al. (2019). These models, named FLUXCOM-ERA5 and FLUXCOM-MODIS hereafter, provide global maps of monthly NEE, GPP and RECO derived with a daytime partitioning. The FLUXCOM-ERA5 model has a coarser resolution (0.5° × 0.5°) than FLUXCOM-MODIS (0.08° × 0.08°) but covers a longer period (1979–2018 versus 2001–2015). The last model, FLUXCOM-X, is a one-member model improving the coverage and quality of the training, as well as satellite data processing, and providing CO2 fluxes at higher spatial resolution (0.05° × 0.05°) and for a longer period (2001–2020).
The four data-driven models include most, if not all, ICOS sites mobilized in this study. They accurately capture the mean annual and seasonal cycles of CO2 fluxes (Tramontana et al., 2016; Jung et al., 2020; He et al., 2022; Zhuravlev et al., 2022) and are expected to outperform process-based models because the latter do not directly assimilate observed CO2 fluxes. The methodological framework (e.g. machine learning model, forcing data and horizontal resolution) remains different between the data-driven models.
Table 2Data-driven and process-based models used in this study.
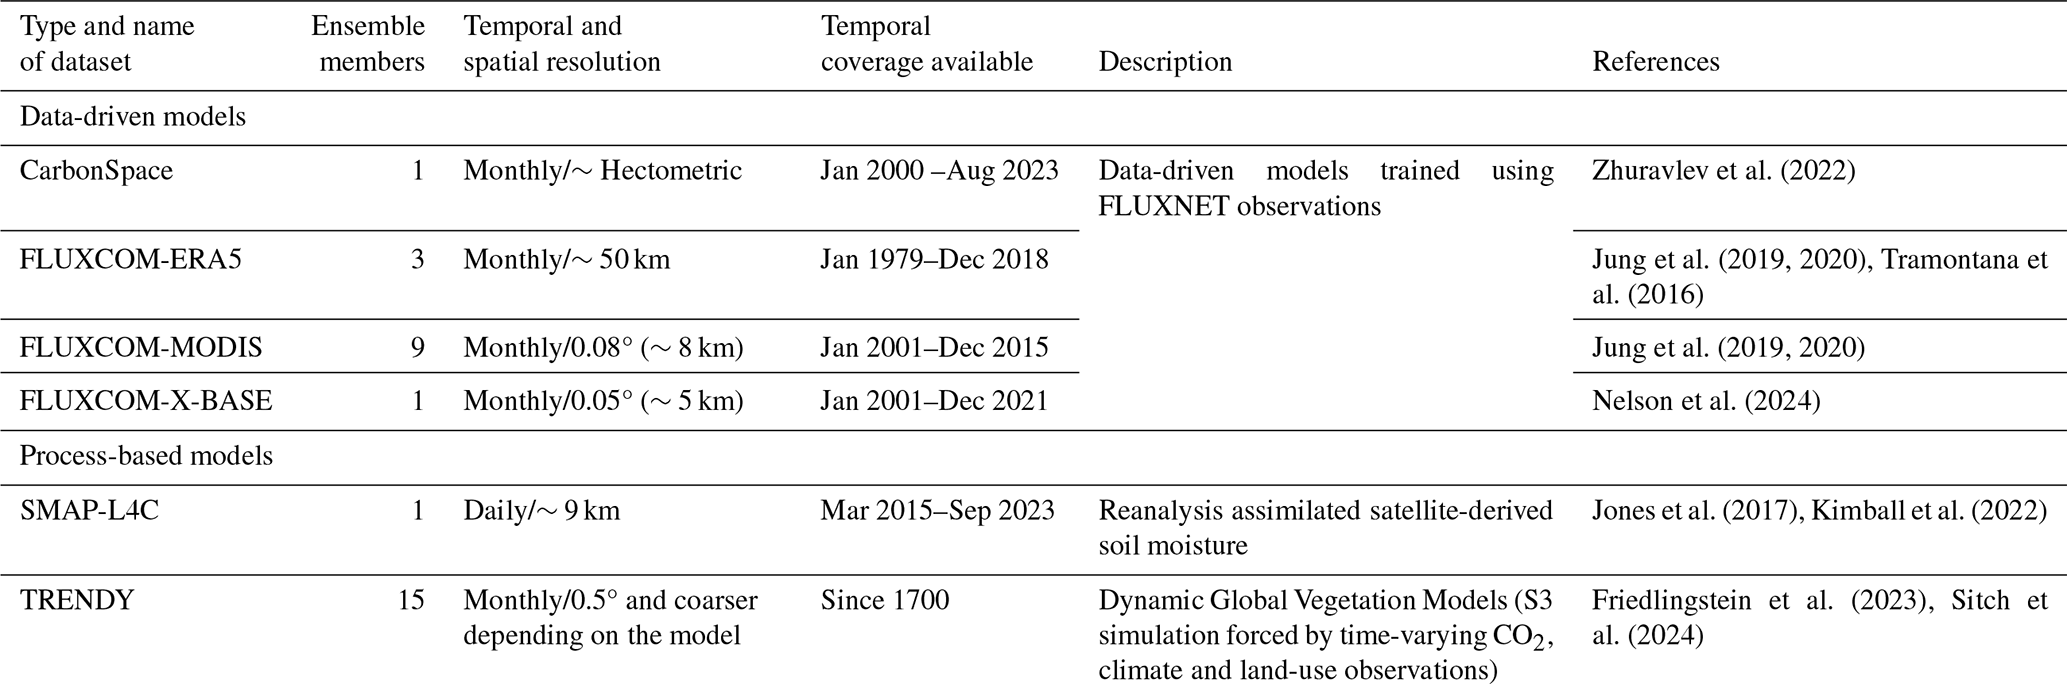
Column 1 specifies the model type and name. Columns 2–4 detail the number of members in each dataset, the space-time resolution and the period of output availability. Columns 5–6 provide a brief description of each dataset along with references.
2.2.3 Process-based models
Two process-based models are considered (Table 2): the SMAP (Soil Moisture Active Passive) Level 4 Carbon model (SMAP-L4C hereafter) and an ensemble of dynamic global vegetation models (DGVMs) from the TRENDY project (https://sites.exeter.ac.uk/trendy, last access: 12 September 2024). The SMAP-L4C product is produced operationally by the NASA SMAP mission. It can be considered as a reanalysis product because it uses the Goddard Earth Observing System version 5 (GEOS-5) land model to assimilate SMAP L-band microwave observations and is forced with observed land cover and vegetation from the Moderate Resolution Imaging Spectroradiometer (MODIS) and Visible Infrared Imaging Radiometer Suite (VIIRS). The global processing is conducted on 1 km sub-grids using spatially aggregated MODIS plant functional types (PFTs) and VIIRS fraction of photosynthetically active radiation (fPAR) inputs, making it possible to distinguish up to eight individual PFTs within each 9 km × 9 km product grid cell. However, the model processing uses coarser-spatial-resolution (9 km and 0.25°) daily inputs from the SMAP L4 soil moisture (L4_SM) and GMAO Forward Processor (FP) surface meteorology. Among other variables, the SMAP-L4C outputs provide daily NEE and GPP (RECO deduced from the difference between NEE and GPP) in a consistent global grid from March 2015 to September 2023 for each PFT, including DBFs and ENFs (Jones et al., 2017; Kimball et al., 2022). The 1 km PFT subclass distinction allows the differentiation of ENFs and DBFs. The L4C product is derived using coupled photosynthetic light-use efficiency and soil organic matter decomposition models to estimate daily NEE and its component carbon fluxes, where GPP is reduced from PFT-specific optimal rates for unfavourable daily climate conditions, including cold temperatures, low light levels, excessive atmospheric vapour pressure deficits and low root zone (0–1 m depth) soil moisture levels defined from SMAP L4_SM and GMAO FP meteorology. The associated product quality assessment report gives details of the model algorithms and the calibration, validation and performance of the L4C version 7 product used in this study (Endsley et al., 2023).
In addition to SMAP-L4C, this study also uses outputs from 15 Dynamic Global Vegetation Models (DGVMs) of the Trends and Drivers of Regional-Scale Terrestrial Sources and Sinks of Carbon Dioxide (TRENDY version 12) project. These models are routinely mobilized to assess global carbon budget trends and for attributing changes to CO2, climate and land use (Friedlingstein et al., 2023; Sitch et al., 2024). Appendix Table A1 provides a list of the 15 DGVMs used in this study. Here, we used outputs from the S3 scenario, with simulations starting in 1700 and forced by time-varying observed CO2, climate and land-use change. All simulations have a horizontal resolution of 0.5° × 0.5° and monthly outputs.
2.2.4 Climate data
To investigate the impact of climate on CO2 fluxes, we use the ERA5-Land dataset (Muñoz-Sabater et al., 2021) produced by the European Centre for Medium-Range Weather Forecasts (ECMWF). This dataset results from the ECMWF land surface model (HTESSEL) operating at 0.1° spatial resolution and forced by the ERA5 reanalysis (Hersbach et al., 2020). This product provides hourly outputs for land surface, hydrological and meteorological variables from 1950 onwards. In this study, we use incident shortwave radiation, temperature at 2 m (T2m) and averaged soil moisture (SMAVG). We use the volumetric soil water content averaged across the four available soil layers (0–7, 7–28, 28–100 and 100–289 cm). Because it accounts for both liquid water and ice, this parameter remains above zero even when temperatures drop below freezing. Results obtained with incident shortwave radiation show no clear seasonality in correlation patterns with NEE, suggesting that greater light availability generally enhances CO2 sequestration. For this reason, we do not include results for this variable in the main analysis. We also use relative humidity together with T2m to compute the air vapour pressure deficit (VPD), an integrative metric accounting for both heat and water stress effects (Carrara et al., 2004; von Buttlar et al., 2018; Kong et al., 2022; van der Woude et al., 2023). The VPD is defined as the difference between the amount of moisture that is actually in the air and the amount of moisture that air could hold at saturation. The VPD is computed using the Tetens formula (Monteith and Unsworth, 2007) following Eq. (1):
In the end, three ERA5-Land climate variables (T2m, SMAVG and VPD) are used to assess the impact of climate on the annual cycle and interannual variability of CO2 fluxes. These variables capture the influence of thermal, hydrological and atmospheric moisture demand conditions on CO2 flux dynamics.
2.3 Methodology
For the gridded datasets (ERA5-Land, FLUXCOM, TRENDY and SMAP-L4C), we extracted the nearest grid point to each flux tower site. Note that SMAP-L4C simulates spurious CO2 fluxes at the DE-Hzd site. Therefore, this site is not included in the analysis for this model. Because these datasets have varying temporal resolutions (Tables 1 and 2), all were aggregated to a monthly timescale. From these monthly values, we computed the mean annual cycle by averaging all available years in each dataset, along with interannual variability, defined by the standard deviation and coefficient of variation.
Model skill in capturing observed CO2 flux variability is evaluated over overlapping periods between each model and observation. The number of overlapping years varies significantly across model–observation pairs (Fig. 2a). Two complementary metrics are used for model evaluation: the bias (model minus observation), which assesses errors in magnitude, and the Bravais–Pearson correlation coefficient (R), which evaluates temporal co-variability. These metrics capture distinct aspects of model performance and are not necessarily correlated. For the annual cycle, we computed monthly biases for each overlapping year and present the mean bias averaged across all months and years. Model skill in reproducing the seasonal timing of CO2 fluxes is assessed by correlating the 12 monthly modelled and observed values within each overlapping year, with the multi-year mean R reported. Correlations are considered significant at the 95 % confidence level if the mean p value is below 0.05. For interannual variability, biases are calculated as the difference between modelled and observed standard deviations for each month. Co-variability between observed and modelled CO2 fluxes is assessed only for model–observation pairs with at least 10 overlapping years, ensuring robust signal detection. Correlations were deemed significant when p<0.05.
The impact of climate on CO2 fluxes is assessed for overlapping years between each CO2 flux dataset and ERA5-Land. The number of overlapping years varies widely across datasets (Fig. 2b), ranging from low coverage in observations and SMAP-L4C to over 70 years in TRENDY. The correlation coefficient (R) was used to assess climate impacts, with the mean R reported for the annual cycle and individual R values for interannual variability.
To ensure results were not driven by long-term trends, analyses have been conducted using both raw and detrended climate time series (not shown), yielding similar outcomes. Additionally, for observed CO2 fluxes, we verified ERA5-Land climate data reliability by comparing results with observed climate measurements from the FLUXNET database (not shown).
For conciseness, we primarily present results using the ensemble mean of the FLUXCOM (ERA5 and MODIS) and TRENDY models. However, uncertainties arising from machine learning methods and DGVM physical parameterizations are discussed in the model evaluation section.
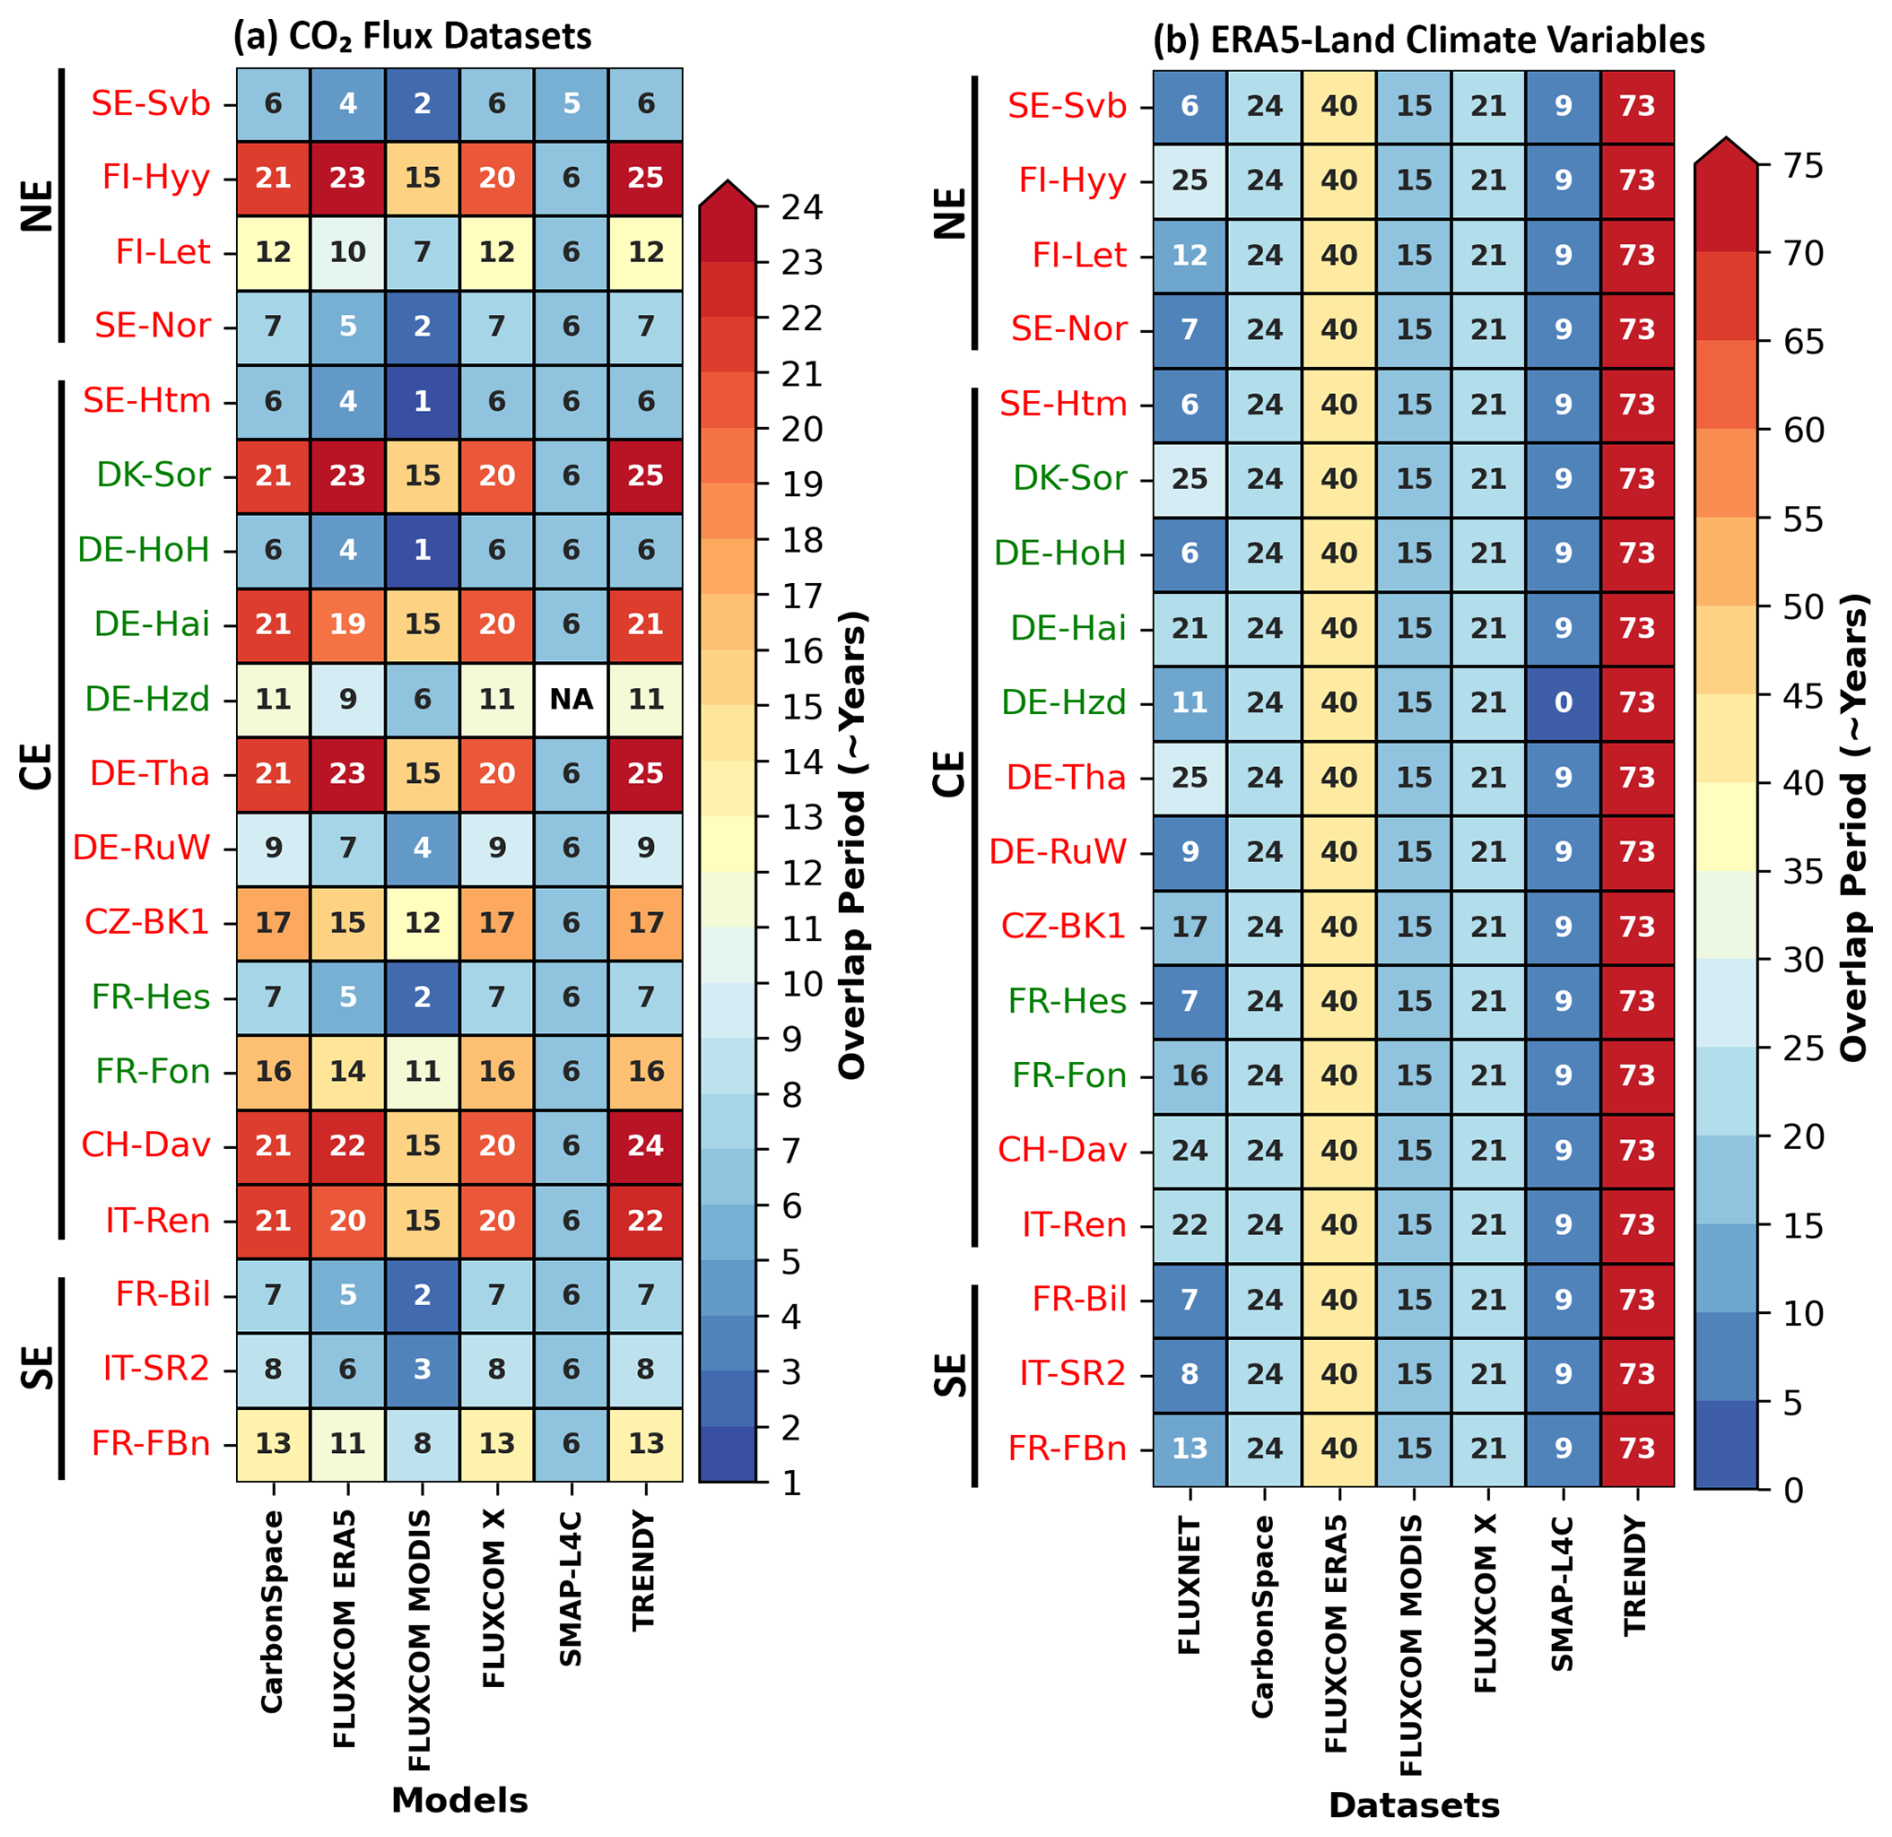
Figure 2Number of overlapping years between (a) observed and modelled CO2 fluxes and (b) ERA5-Land climate and observed and modelled CO2 fluxes. The overlapping periods in panel (a) are used to assess the model's ability to capture the annual cycle and interannual variability of CO2 fluxes. In panel (b), the overlapping periods are used to evaluate the co-variability between CO2 fluxes and the annual cycle and interannual variability of ERA5-Land climate. ENF sites are displayed in red text, while DBF sites are highlighted in green. Sites are ordered from north to south based on their latitude, with black vertical lines indicating the boundaries between northern (NE), central (CE) and southern (SE) Europe.
3.1 Observed climate and CO2 fluxes mean annual cycle and interannual variability
Figure 3 shows the mean annual cycle and interannual variability of T2m, SMAVG and VPD associated with each site. Overall, all sites depict higher T2m and VPD and lower SM in summer than in winter (Fig. 3a–c). A south-to-north gradient is evident, with more marked annual amplitude and shorter summer in northern than in southern Europe. Few sites deviate from this pattern, including, for example, the Alpine site (CH-Dav), which depicts relatively cold and wet conditions, as well as low VPD, all year long. While the interannual variability of T2m is the largest in winter regardless of the site, it increases markedly from south to north (Fig. 3d). The reverse is found for VPD, with higher interannual variability in summer than in winter, especially south of 60° N (Fig. 3f). The interannual variability in SMAVG (Fig. 3e) is low all year long in the Alpine site, relatively low in northern Europe, and high from spring to summer in the mid-latitudes and in fall and winter in the Mediterranean region (FR-FBn).
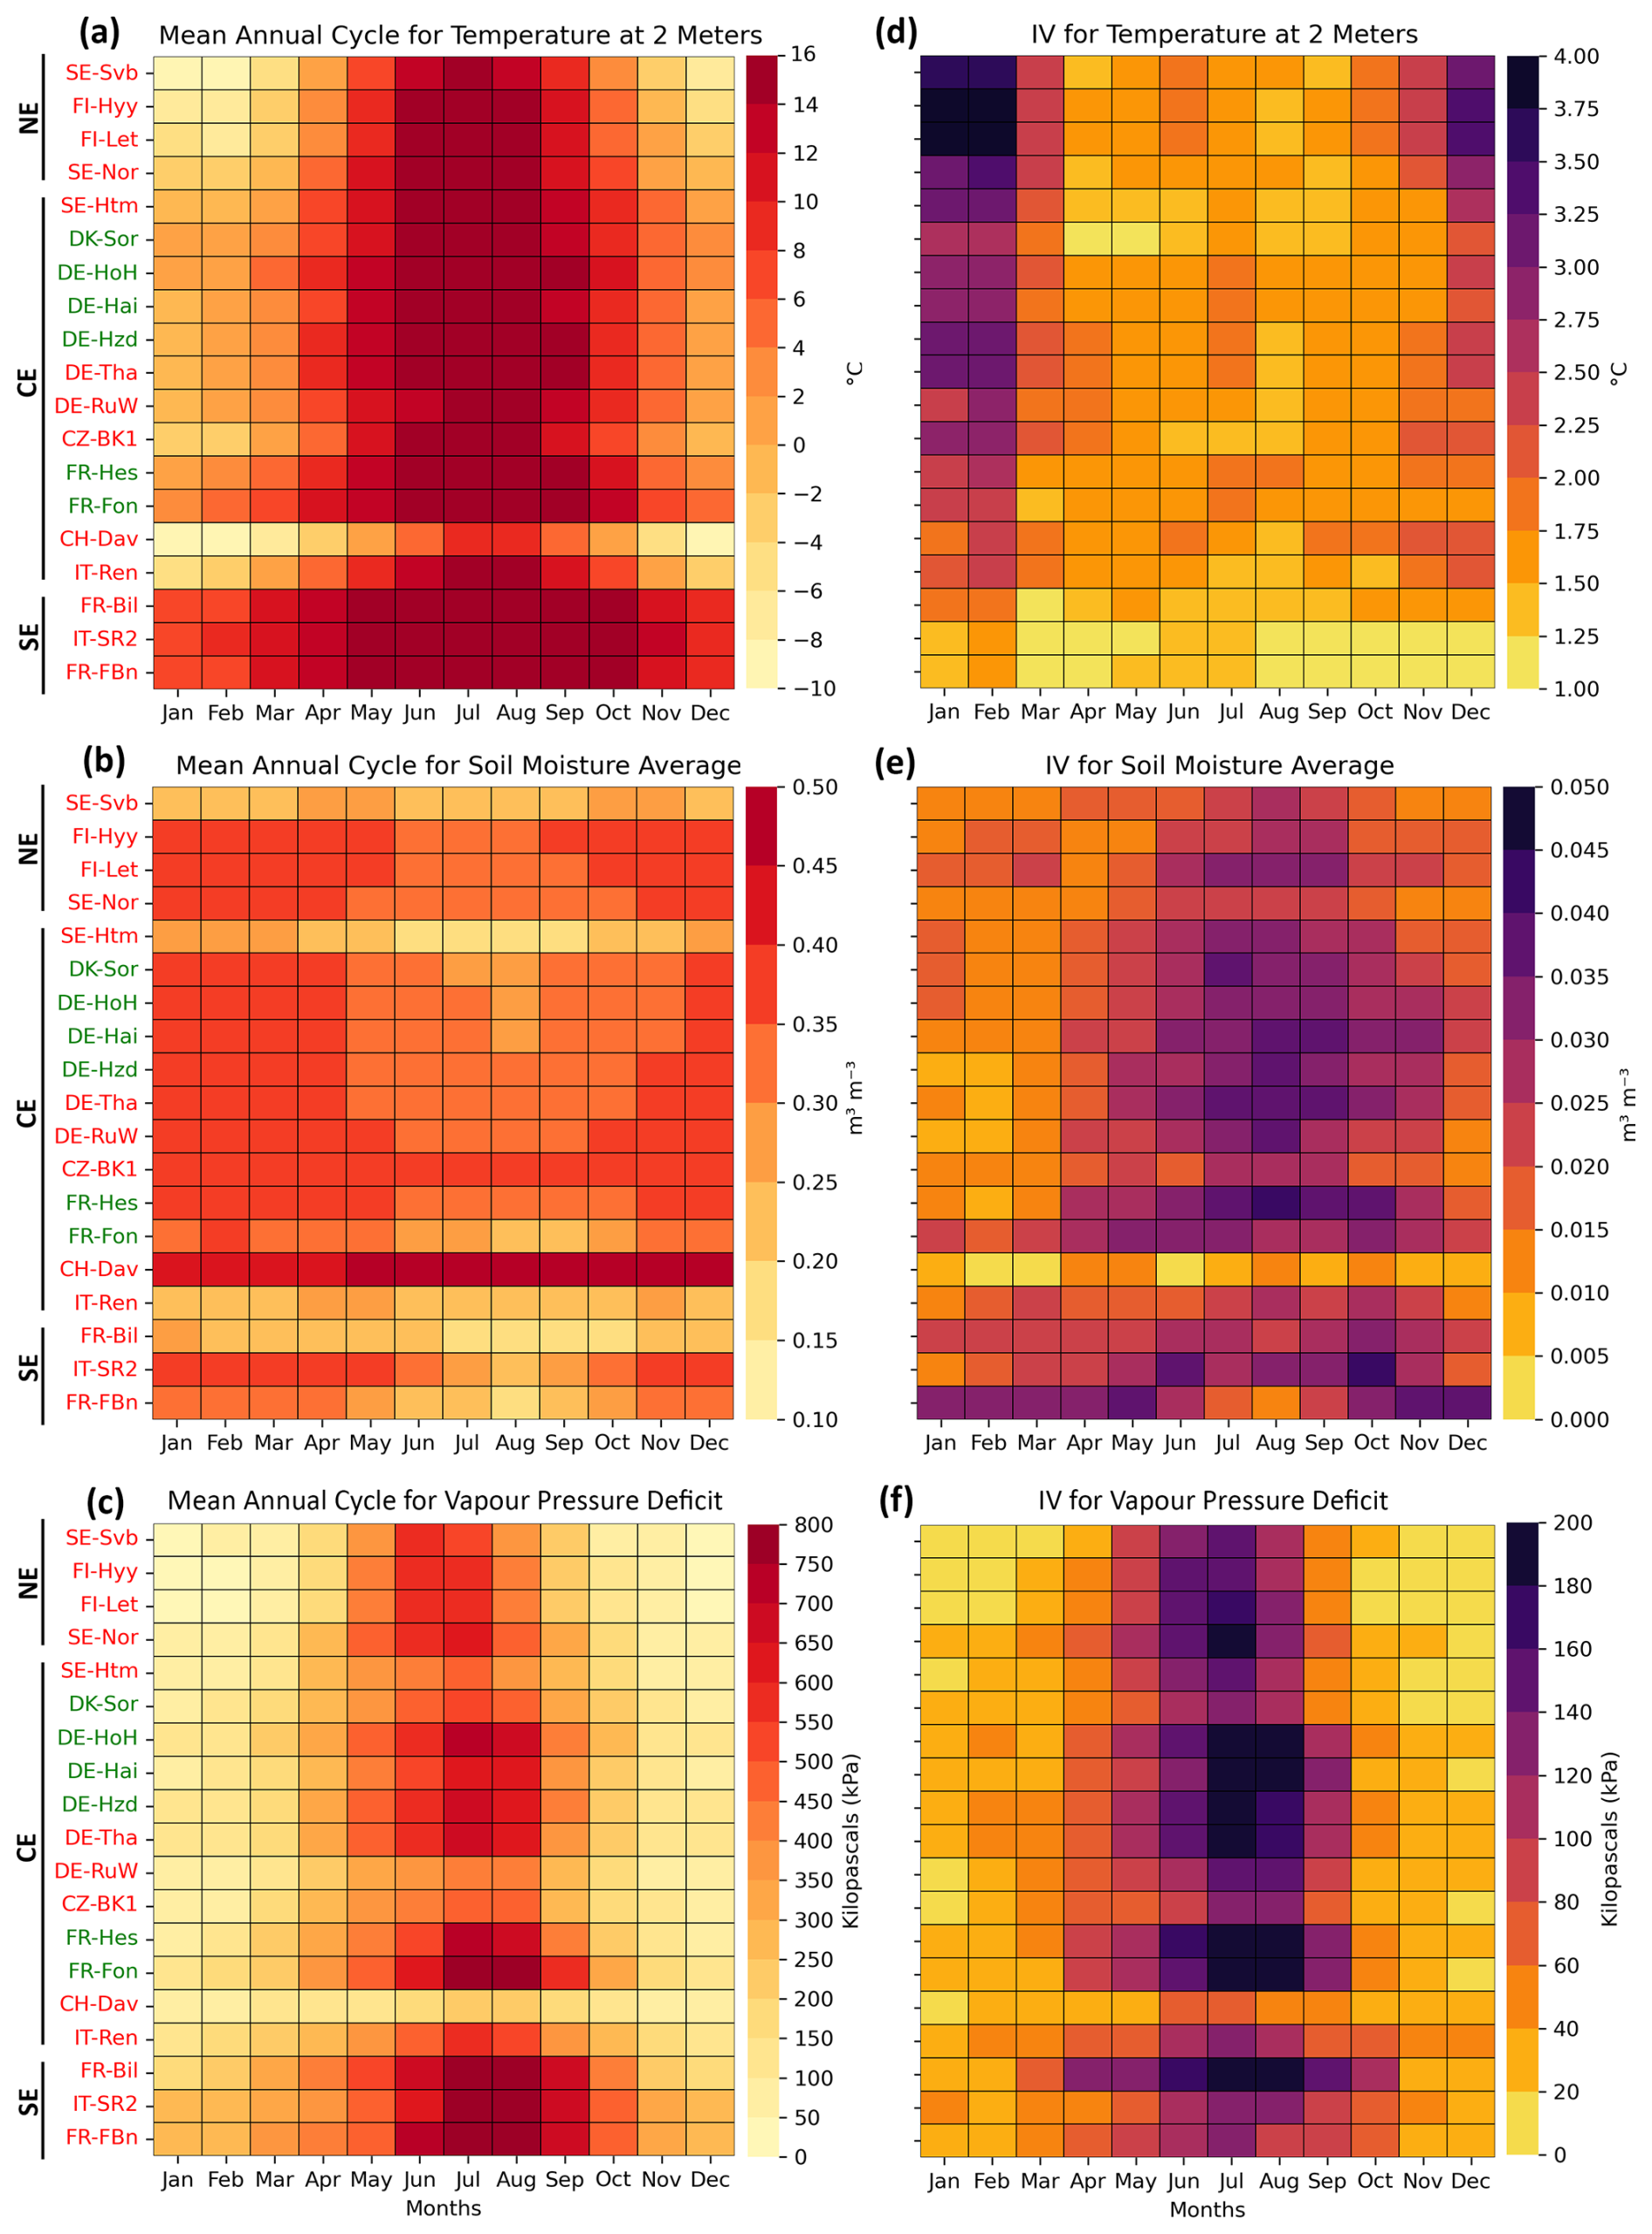
Figure 3(a–c) Mean annual cycle and (d–f) interannual variability (i.e. IV) in monthly 2 m air temperature (T2m), soil moisture (SMAVG) and vapour pressure deficit (VPD), respectively, for each study site for the 1979–2023 period. Climate conditions at each site are extracted from the nearest grid point of the 9 km × 9 km ERA5-Land product. ENF sites are displayed in red text, while DBF sites are highlighted in green. Sites are ordered from north to south based on their latitude, with black vertical lines indicating the boundaries between northern (NE), central (CE) and southern (SE) Europe.
Figure 4a displays the mean annual cycle of monthly NEE, GPP and RECO as provided by FLUXNET observations. The mean annual cycle in NEE is not necessarily phased on that of GPP and RECO, the two latter reaching their highest values from May to August in most sites. Significant differences are found between northern (SE-Nor, FI-Let, FI-Hyy and SE-Svb) and southern (FR-FBn, IT-SR2 and FR-Bil) Europe, where only ENF sites are available. The annual cycle is more marked, and the sequestration period (i.e. month associated with negative NEE values) is shorter in the former than in the latter region. Temperature conditions (and light availability) are the main drivers explaining these differences. In central Europe, where both ENF and DBF sites are available, there is a clear impact of land cover class. The DBF sites show a pronounced annual cycle with strong CO2 uptake (below −3 tCO2 ha−1) from May to August, and up to some extent in September, and strong CO2 release in the remaining months (above 2 tCO2 ha−1). Conversely, the ENF sites show a smoothed annual cycle: the summer peak of CO2 sequestration barely exceeds −3 tCO2 ha−1, and the winter peak of CO2 release rarely exceeds 1 tCO2 ha−1. Two sites deviate from the general pattern: the DE-Hzd DBF site, which acts as a CO2 source nearly year-round, and the DE-RuW ENF site, which remains a consistent CO2 sink on average.
The interannual variability of NEE, GPP and RECO, as defined by the standard deviation metric, tends to be stronger during the growing season (spring to fall) than in winter at almost all sites (Fig. 4b). The exact pattern depends on the CO2 flux, site and land cover class considered. GPP is always close to zero during winter at DBF sites because trees are not photosynthetically active. This is not the case for ENF sites, particularly those located in central Europe (DE-RuW and CZ-BK1). The interannual variability of RECO is substantial in summer only in northern Europe. However, it can be non-negligible in other seasons in central and southern Europe. There, significant differences between geographically close sites (e.g. FR-Bil and IT-SR2) suggest additional drivers such as soil properties. The interannual variability of NEE is (i) weaker than that of GPP and RECO, likely due to the strong coupling between GPP and RECO, (ii) primarily driven by RECO in winter, and (iii) a complex response of GPP and RECO in the remaining seasons. Note that the pattern of CO2 flux interannual variability depends on the metric used to assess it. When defined using the coefficient of variation, interannual variability is low in summer and high in winter for GPP and RECO, with increasing variability toward the north. For NEE, variability remains significant throughout the year, particularly from fall to winter (Fig. A1).
Overall, the mean annual cycle of observed CO2 fluxes in European forests follows a clear spatial pattern driven by climate conditions and land cover class. In contrast, the interannual variability of observed CO2 fluxes exhibits greater spatial noise across Europe and depends on the metric used. Nevertheless, it remains significant, highlighting the importance of assessing the impact of climate on it throughout the annual cycle.
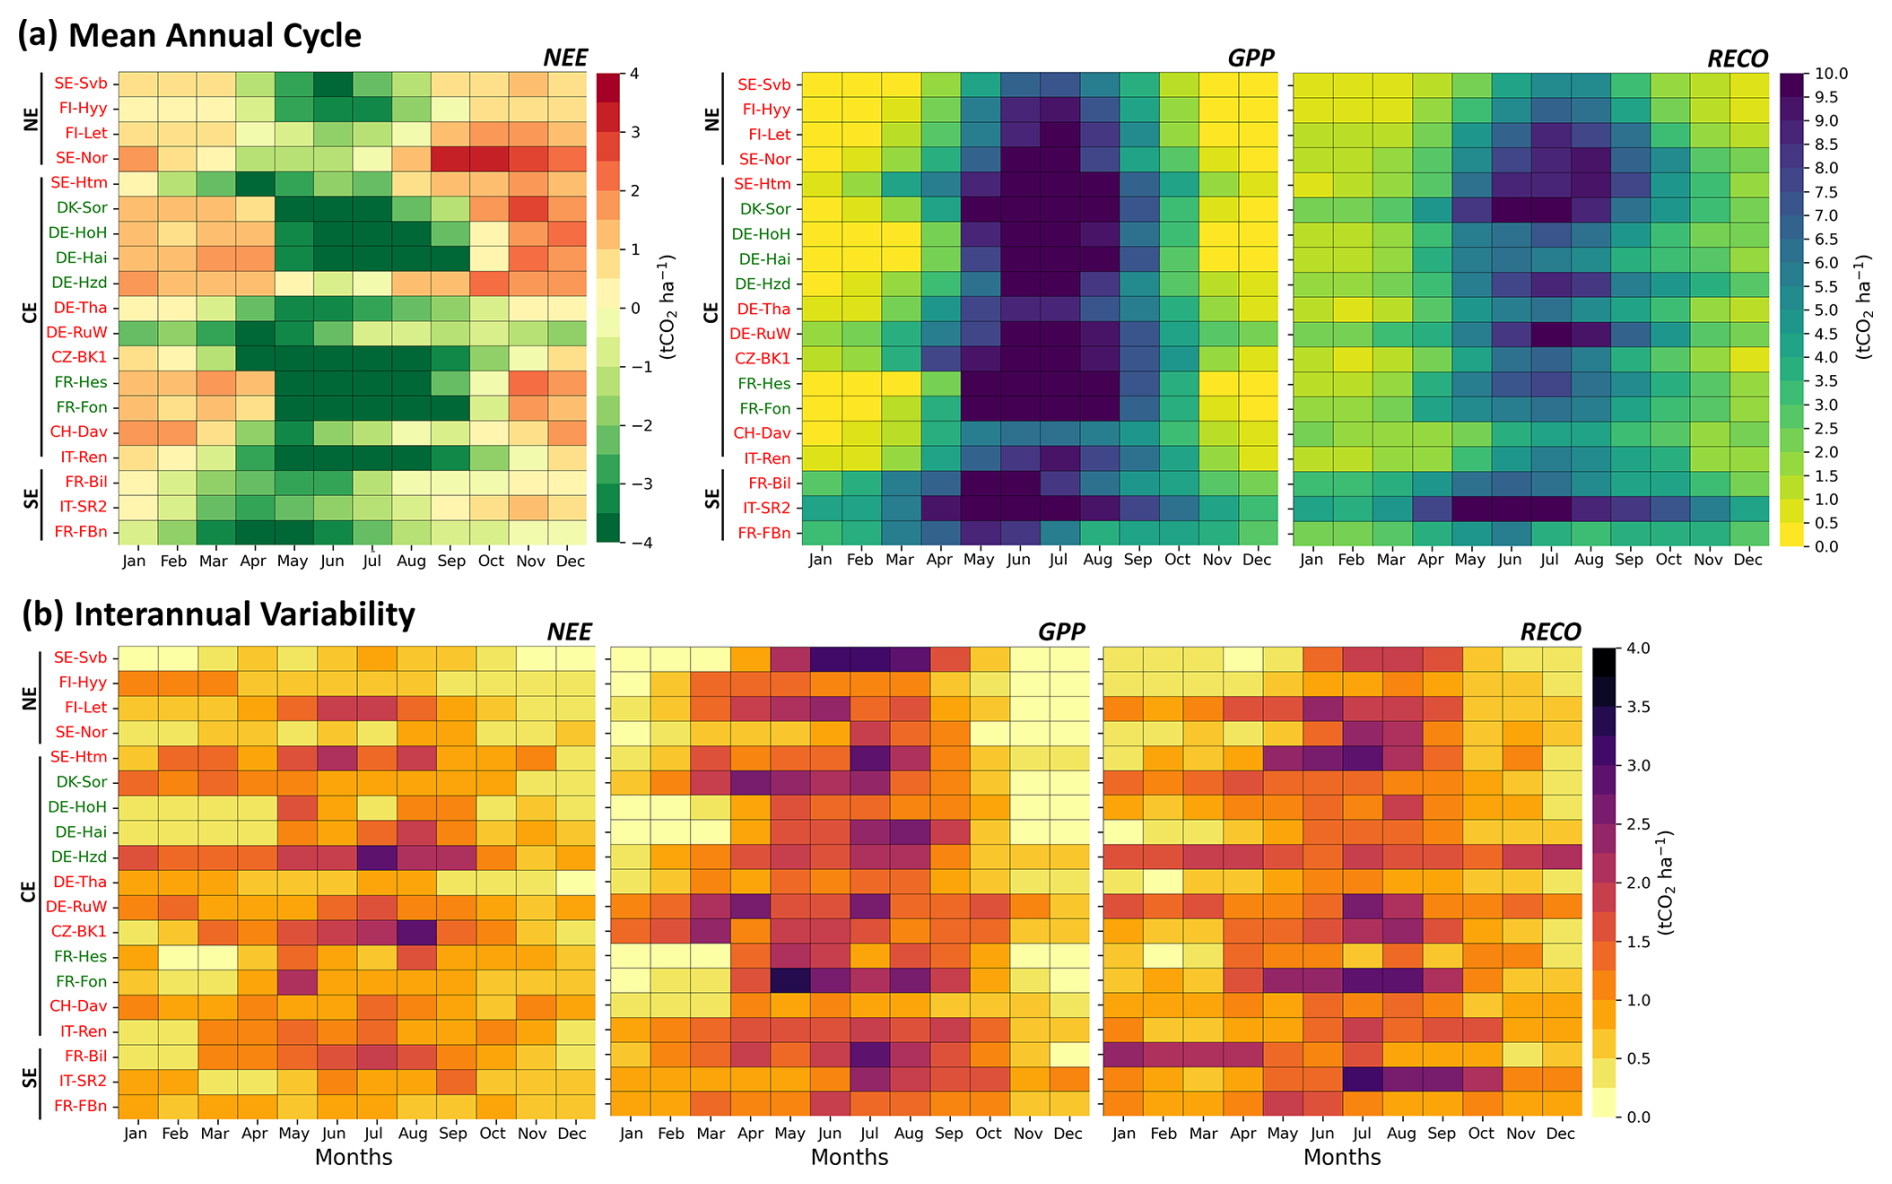
Figure 4(a) Mean annual cycle and (b) interannual variability in monthly NEE, GPP and RECO (from left to right, respectively) as measured by eddy covariance over the most extended available period for each site (see Table 1 for details). ENF sites are displayed in red text, while DBF sites are highlighted in green. Sites are ordered from north to south based on their latitude, with black vertical lines indicating the boundaries between northern (NE), central (CE) and southern (SE) Europe.
3.2 Model evaluation in capturing the mean annual cycle and interannual variability of CO2 fluxes
3.2.1 Mean annual cycle
The model skill in capturing the temporal phasing of the annual cycle and the magnitude in observed CO2 fluxes is assessed in terms of correlation and mean bias, respectively (see Sect. 2.3 for details). All models accurately capture the observed temporal phasing of GPP and RECO, with correlation values often above 0.8 (Fig. 5a). The model skill is poorer but still correct for NEE, with correlation values remaining above 0.6 for most sites and models. The weaker correlation found for NEE compared to GPP and RECO is not surprising, as accurately estimating the NEE annual cycle requires precise estimation of both the temporal phasing and magnitude of GPP and RECO.
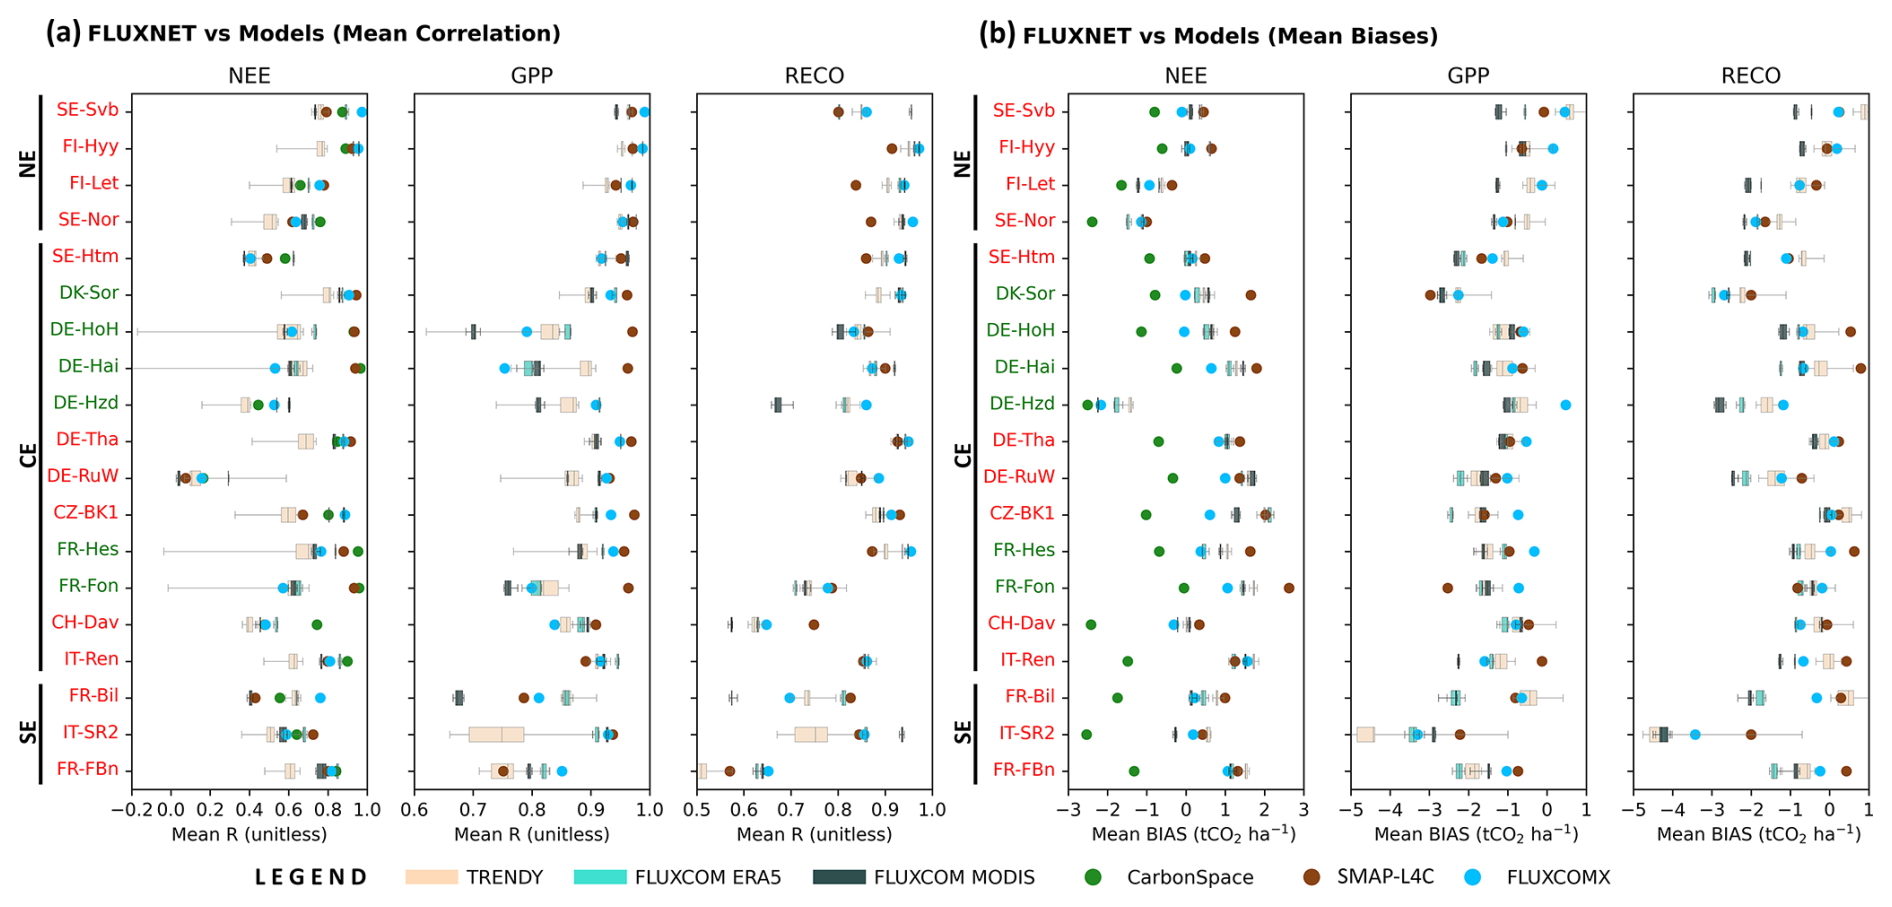
Figure 5Model skill in capturing (a) the annual cycle and (b) magnitude of observed NEE, GPP and RECO. The model skill in capturing the annual cycle is assessed through the Bravais–Pearson correlation coefficient (R) calculated between the simulated and observed annual cycle of monthly CO2 fluxes (12 values) for each year of the overlapping period. The multi-year mean R values are shown. The magnitude error is computed as the difference between simulated and observed CO2 fluxes (model minus observation) for each month of the overlapping period. The mean magnitude error is shown. Results are displayed using coloured dots for single-member models (CarbonSpace, FLUXCOM-X and SMAP-L4C) and boxplots for multi-member FLUXCOM models and the multi-model TRENDY ensemble. The boxes have lines at the lower quartile, median and upper quartile values. The whiskers are lines extending from each end of the boxes to show the extent of the full range of the data, including outliers. The colour attributed to each model is detailed in the legend. ENF sites are displayed in red text, while DBF sites are highlighted in green. Sites are ordered from north to south based on their latitude, with black vertical lines indicating the boundaries between northern (NE), central (CE) and southern (SE) Europe.
Despite reasonable annual cycles, the models struggle in capturing the observed magnitude of RECO and GPP (Fig. 5b). Three groups emerge. The first group includes the FLUXCOM (ERA5, MODIS and X) and TRENDY models, which underestimate both GPP and RECO by about similar amounts, resulting in relatively “weak” positive biases in NEE. The second group corresponds to the SMAP-L4C model, which overestimates RECO by 1 tCO2 ha−1 month−1 while underestimating GPP by the same amount, leading to a systematic underestimation of CO2 sequestration by approximately 2 tCO2 ha−1 month−1. The last group is the CarbonSpace data-driven model, which is the only model that systematically overestimates CO2 sequestration, by up to 2.5 tCO2 ha−1 month−1. However, the cause of this overestimation is unclear, as this model does not provide separate GPP and RECO estimates.
Figure 5 highlights key insights into model behaviour. First, the data-driven and SMAP-L4C models generally outperform the TRENDY models in capturing the annual cycle of CO2 fluxes but do not necessarily provide better estimates of flux magnitude. Second, models that accurately represent the annual cycle can still struggle with magnitude. This is exemplified by the CarbonSpace data-driven model, which ranks among the best for annual cycle representation but severely overestimates CO2 sequestration at many sites. Third, the machine learning methods used in the FLUXCOM-ERA and FLUXCOM-MODIS ensembles have little impact on both the annual cycle and magnitude of CO2 fluxes. The input data appear to be more important, with the FLUXCOM models accounting for both vegetation and climate (i.e. ERA5 and X) yielding more reliable results than those accounting for vegetation alone (MODIS). Additionally, FLUXCOM-X improves upon the previous model generation for most sites. Finally, the inter-model spread within the TRENDY ensemble is much smaller for CO2 flux magnitude than for temporal variability, suggesting that the primary source of uncertainty in DGVMs lies in the temporal phasing of the fluxes rather than their magnitude.
3.2.2 Interannual variability
We qualitatively evaluate how well the models capture the observed interannual variability of CO2 fluxes in terms of magnitude (monthly bias analysis) and temporal phasing (correlation analysis) over the overlapping period of each model–observation pair.
All models strongly underestimate the magnitude in NEE interannual variability all year long (Fig. 6), particularly during summer, where biases often exceed 2.5 tCO2 ha−1 month−1. This is a well-known bias of current data-driven and process-based models (e.g. Lin et al., 2023; Nelson et al., 2024). The only exception is the CarbonSpace model, which produces weak positive or negative biases at most sites. Importantly, a biased magnitude of CO2 flux interannual variability (as measured by the standard deviation) does not preclude the models to capture their temporal co-variability (as measured by correlation) with observed CO2 fluxes and climate.
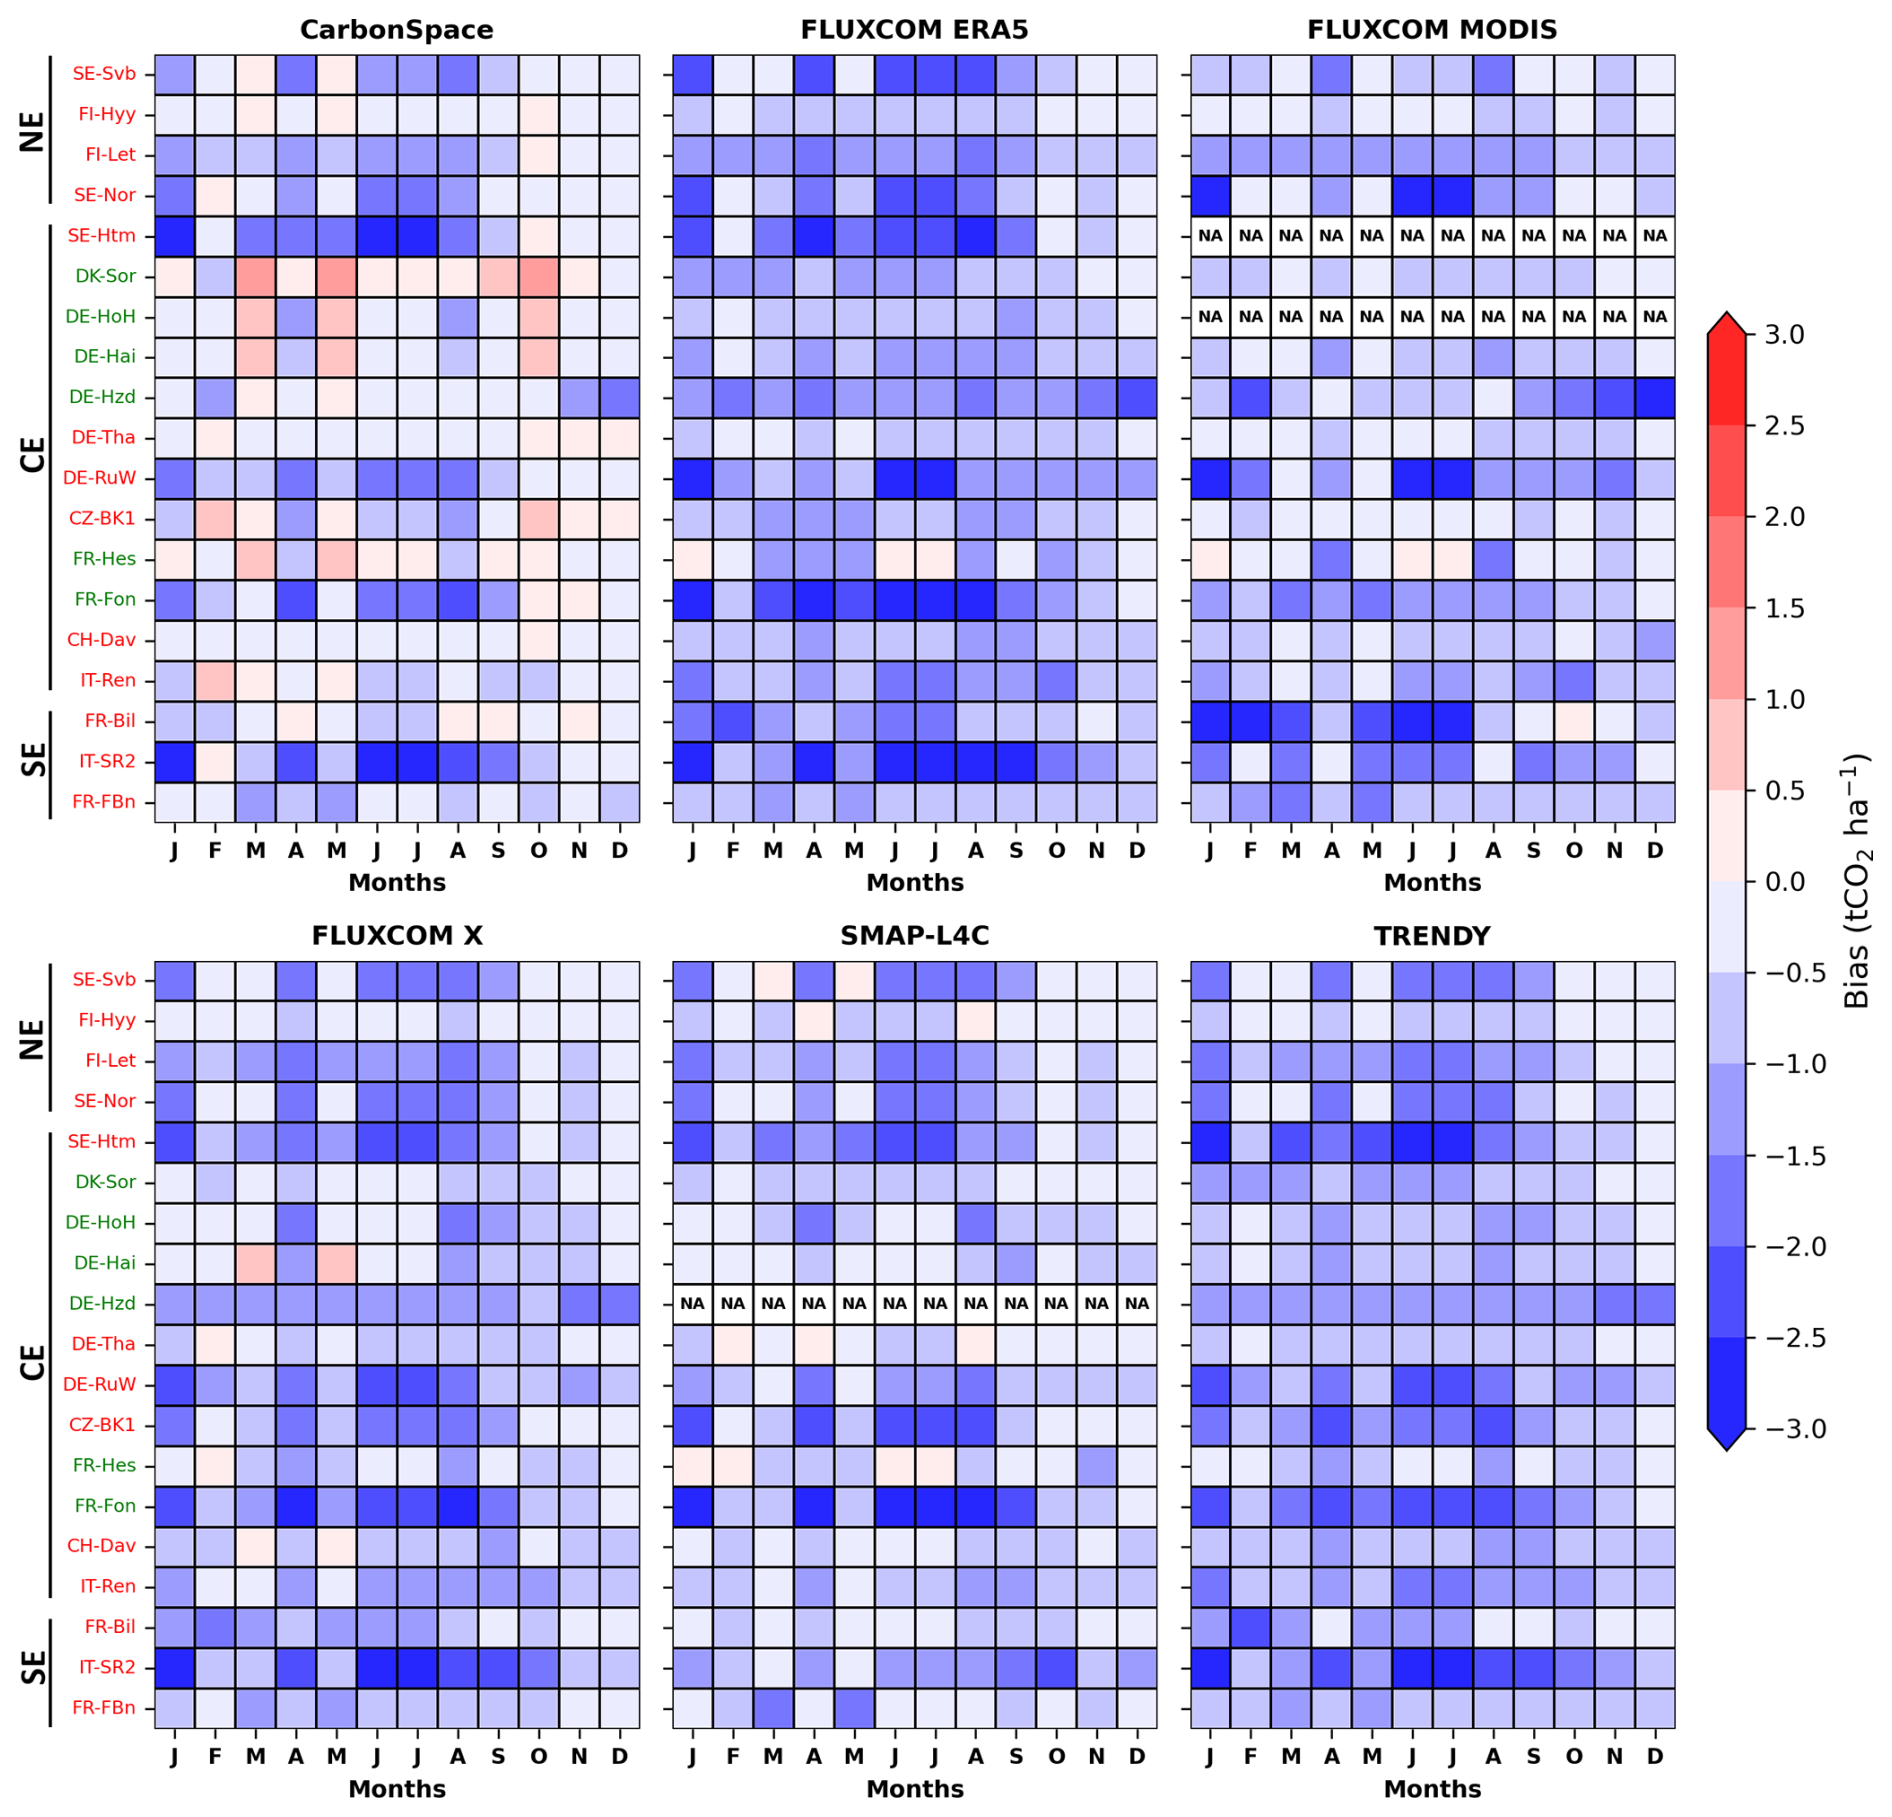
Figure 6Model skill in capturing the observed magnitude in monthly NEE interannual variability. Model skill is assessed by computing biases between modelled and observed NEE interannual variability, as defined by the standard deviation of monthly fluxes. The number of years included varies depending on the model–observation pair, as shown in Fig. 2a. Cells labelled “NA” indicate cases where the overlap criterion is not met. For conciseness, biases are computed using the ensemble mean for the FLUXCOM-ERA5, FLUXCOM-MODIS and TRENDY models. ENF sites are displayed in red text, while DBF sites are highlighted in green. Sites are ordered from north to south based on their latitude, with black vertical lines indicating the boundaries between northern (NE), central (CE) and southern (SE) Europe.
Figure 7 shows the correlations between the modelled and observed interannual variability in monthly NEE. Correlation values are predominantly positive across Europe, though they are often low and not statistically significant (p>0.05). The correlation values tend to be higher in fall for northern Europe sites and all year long in central Europe regardless of the model. The frequent lack of statistical significance in correlations can largely be attributed to the limited number of overlapping years. This is further supported by the fact that, except for Davos, correlation values tend to be higher and more likely to reach the 95 % confidence level in model–observation pairs with a greater number of overlapping years (e.g. DK-Sor, DE-Hai and DE-Tha). Another challenge in capturing the observed temporal phasing of NEE interannual variability is that it requires accurately simulating the interannual variability of both GPP and RECO. The latter is generally better represented by models than the NEE variability itself (compare Fig. 7 with A2–A3). Scale inconsistencies may also contribute to the discrepancies. While flux tower observations reflect local variability, most models represent regional-scale fluxes (and drivers). This is supported by the CarbonSpace model, the only site-scale model used in this study, which produces more satisfactory results, with positive correlation values for almost all sites and all months.

Figure 7Model skill in capturing the observed temporal phasing in monthly NEE interannual variability. Model skill is assessed using the Bravais–Pearson correlation coefficient (R), calculated for each month where at least 10 years of overlap exist between each model–observation pair. The number of years included varies depending on the model–observation pair, as shown in Fig. 2a. Correlation values marked with “×” are significant at the 95 % confidence level according to the Bravais–Pearson test. Cells labelled “NA” indicate cases where the overlap criterion is not met. For conciseness, the correlation analysis is performed using the ensemble mean for the FLUXCOM-ERA5, FLUXCOM-MODIS and TRENDY models. ENF sites are displayed in red text, while DBF sites are highlighted in green. Sites are ordered from north to south based on their latitude, with black vertical lines indicating the boundaries between northern (NE), central (CE) and southern (SE) Europe.
The spread among members of the FLUXCOM ensembles is low (not shown), regardless of whether they account for climate alone or both climate and vegetation. However, Fig. 7 reveals significant differences between the FLUXCOM products (ERA5, MODIS and X; Fig. 7b–d). These differences are not necessarily due to the type of data used in these data-driven models, as the analysis periods differ between them. In contrast, the correlations between observations and the TRENDY ensemble mean (Fig. 7e) mask substantial variability among individual TRENDY models, with no single model consistently outperforming the others (Fig. A4).
These qualitative results suggest that the interannual variability of simulated NEE is at least partially aligned with that of observed CO2 fluxes, supporting the use of models to assess the impact of climate on CO2 flux interannual variability.
3.3 Climate–CO2 flux relationship
3.3.1 Annual cycle
Figure 8 assesses the co-variability between the annual cycle of CO2 fluxes and climate variables (T2m, SMAVG and VPD) through correlation analysis. For conciseness, correlations are computed using the ensemble mean of CO2 fluxes for the FLUXCOM (ERA5 and MODIS) and TRENDY models. The inter-member dispersion in FLUXCOM and inter-model dispersion in TRENDY, shown in Fig. A5, are similar to those in Fig. 5 and are therefore not discussed here.
The annual cycle of CO2 fluxes is closely linked to climate in both observations and models, as evidenced by statistically significant correlations at the 95 % confidence level. The influence of climate on the annual cycle of CO2 fluxes is generally stronger for GPP and RECO than for NEE, particularly for T2m (Fig. 8a). Over Europe, GPP, RECO and CO2 sequestration (i.e. negative NEE) tend to be higher when T2m and VPD are high and SMAVG is low. In turn, CO2 fluxes are amplified in summer and dampened in winter. Among the climate variables, T2m and VPD exhibit stronger correlations with the CO2 flux annual cycle than SMAVG, reflecting their more pronounced seasonality (Fig. 3).
This climate–CO2 flux relationship is particularly evident in northern and central Europe, where there is strong agreement between observations and models, as well as across different models. The only exception in central Europe is the Alpine site (CH-Dav), where SMAVG is positively correlated with GPP and RECO and negatively correlated with NEE. This discrepancy arises because CH-Dav is the only site in the study where SMAVG is higher in summer than in winter (Fig. 3b). In contrast, in southern Europe, the relationship between climate and NEE does not reach the 95 % confidence level in observations. However, the models show a similar relationship to that found in northern and central Europe, albeit with weaker correlations. Whether this disagreement stems from the limited number of observational years available for these sites (7 to 13 years, see Table 1) or from an overestimation of climate impact on the CO2 flux annual cycle remains an open question.
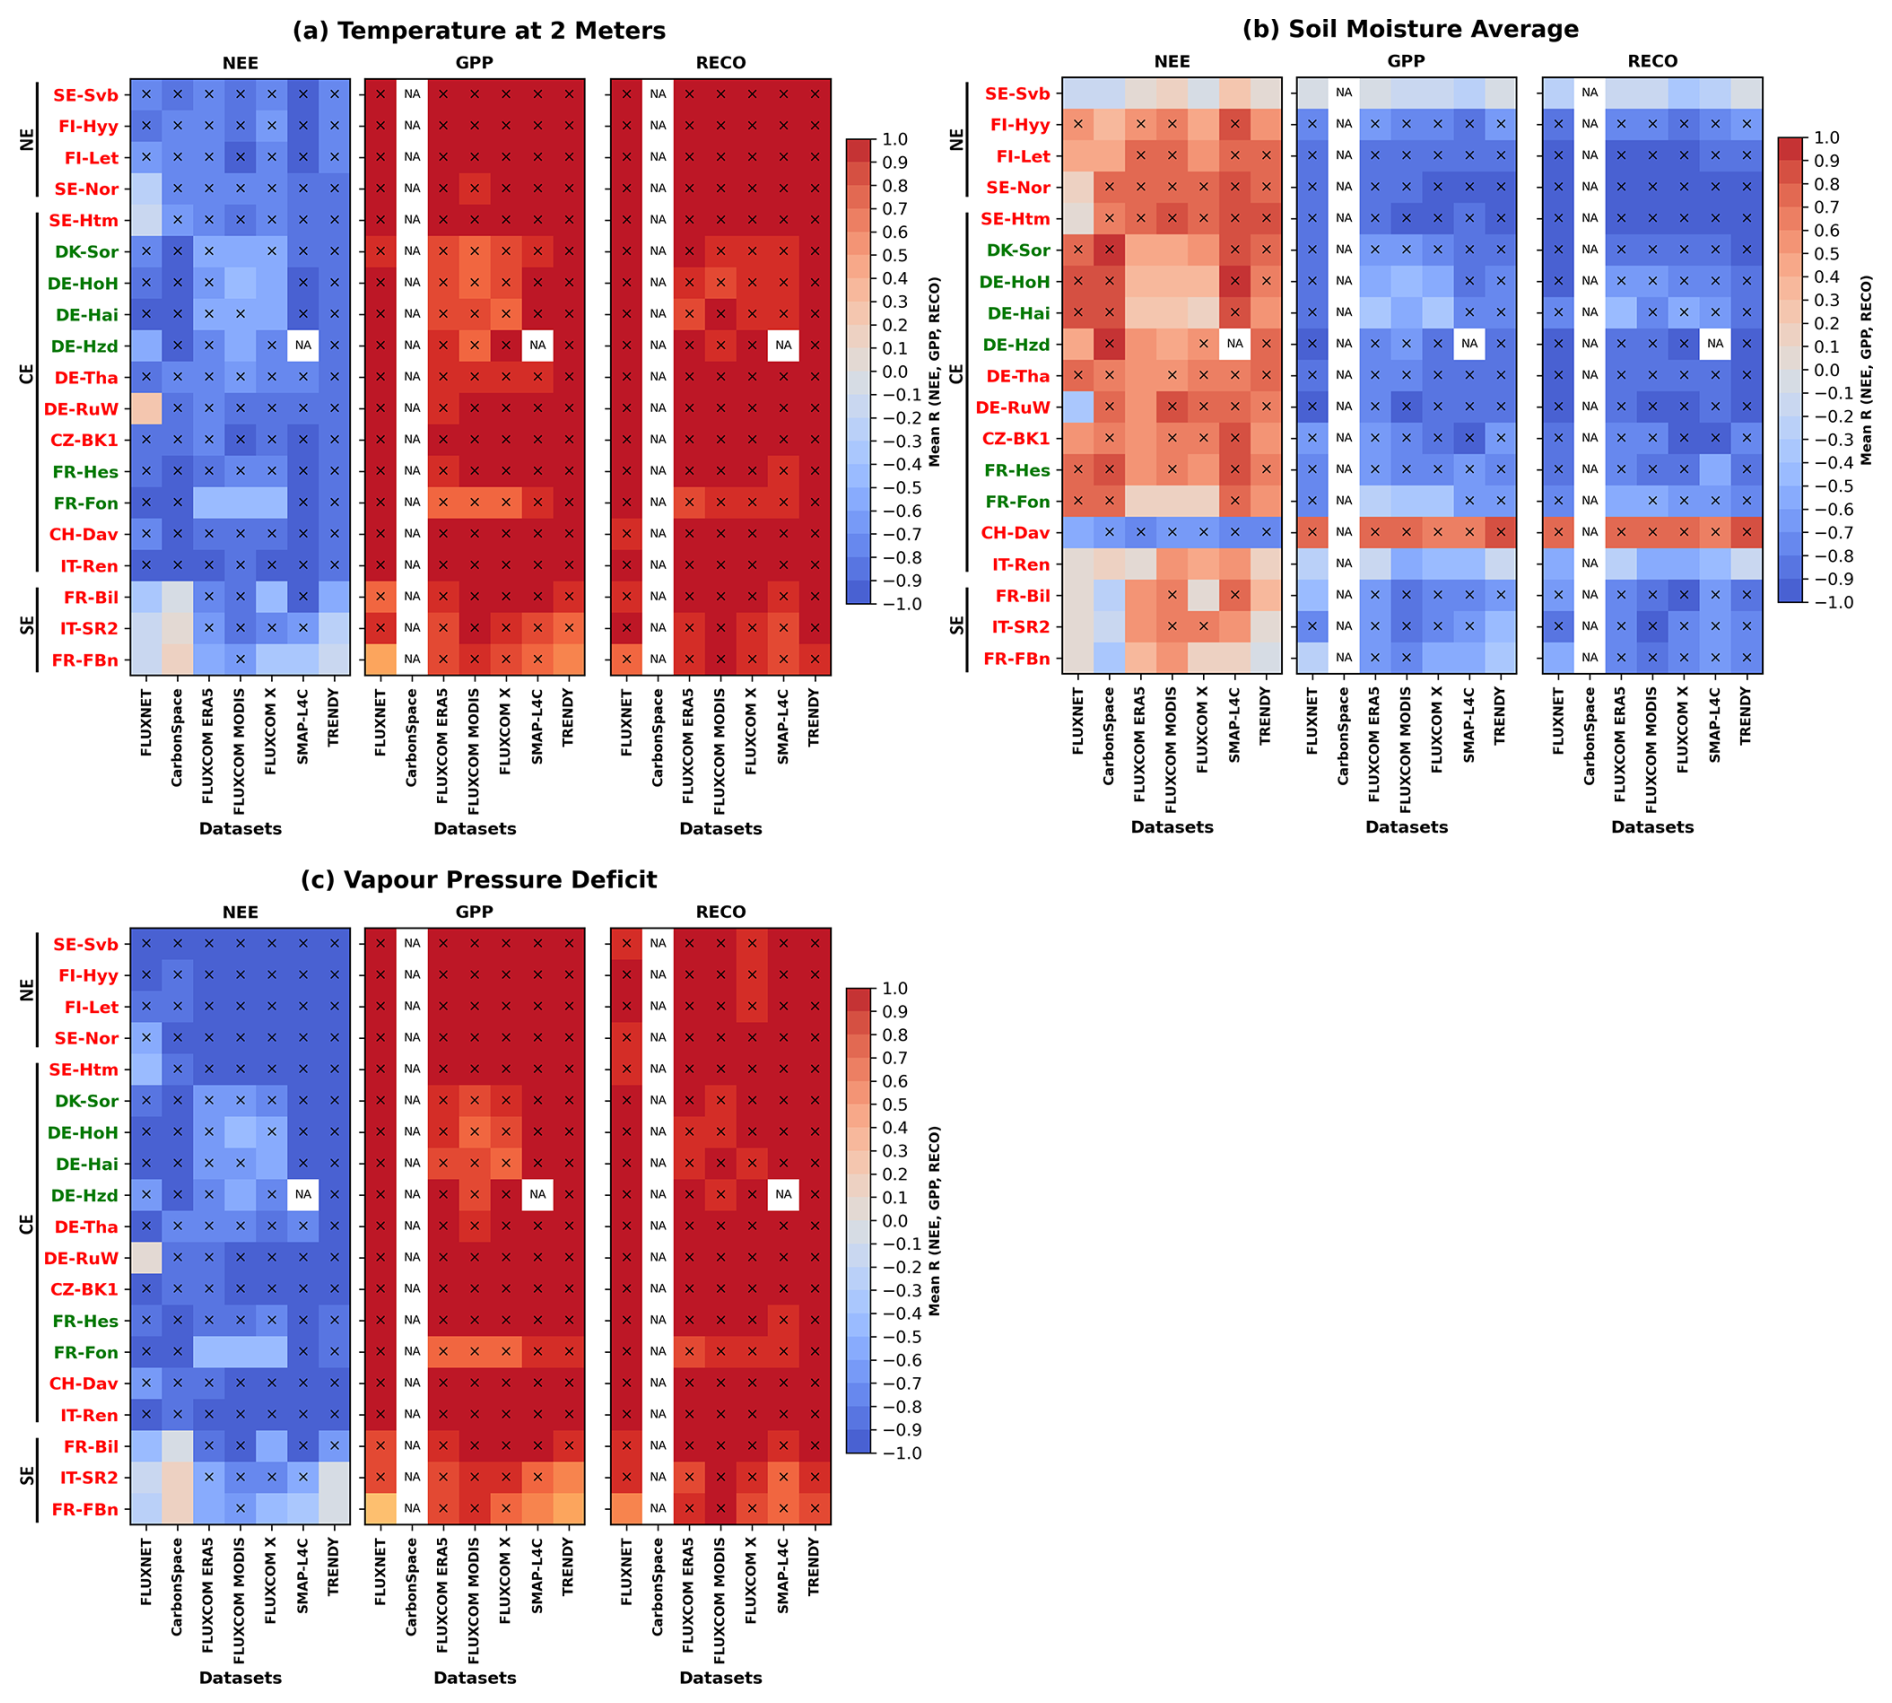
Figure 8Co-variability in the annual cycle of CO2 fluxes and (a) 2 m temperature, (b) soil moisture and (c) vapour pressure deficit across all sites and datasets. Co-variability is assessed through the Bravais–Pearson correlation, computed annually between CO2 fluxes and ERA5-Land climate data, then averaged across years. The number of years included varies depending on the data, as shown in Fig. 2d. Correlation values marked with “×” are significant at the 95 % confidence level according to the Bravais–Pearson test. Cells labelled “NA” indicate cases where GPP and RECO are unavailable (CarbonSpace) or where CO2 flux data are corrupted (SMAP-L4C). For conciseness, correlations are computed using the ensemble mean of CO2 fluxes for the FLUXCOM (ERA5 and MODIS) and TRENDY models. ENF sites are displayed in red text, while DBF sites are highlighted in green. Sites are ordered from north to south based on their latitude, with black vertical lines indicating the boundaries between northern (NE), central (CE) and southern (SE) Europe.
Figure 8 also reveals differences in model behaviour. First, the climate–CO2 flux relationship appears sensitive to the land cover class only in data-driven models. In the FLUXCOM models (ERA5, MODIS and X), this relationship is weaker for DBFs than for ENFs in central Europe, whereas the CarbonSpace model shows the opposite pattern. This sensitivity to land cover class may reflect model discrepancies, as the observed climate–CO2 flux relationship does not depict such an ENF–DBF distinction. The reason for this discrepancy may involve differences in climate forcing or model spatial resolution. Second, process-based models tend to overestimate the impact of climate on the annual cycle of CO2 fluxes across all sites. For example, the SMAP-L4C model amplifies the influence of T2m and SMAVG on NEE, particularly in northern Europe (Fig. 8a–b). Meanwhile, in the TRENDY models, VPD emerges as the dominant driver of the NEE annual cycle (Fig. 8c). These results suggest that process-based models may underestimate the role of additional factors, such as soil properties, in shaping the CO2 flux annual cycle.
3.3.2 Interannual variability
We now investigate the interannual co-variability between CO2 fluxes and climate using correlation analysis. This is done by analysing the full monthly time series of each dataset in two ways: (i) all months combined after removing the mean annual cycle and (ii) separately for each calendar month. The first approach reveals no robust relationship in the observations and weak correlations in the models (Fig. 9). In contrast, the second approach shows some consistencies in the correlation patterns across datasets, with distinct differences between northern/central Europe and southern Europe (Fig. 10). In the former region, the NEE tends to be positively correlated with T2m, SMAVG and VPD in winter and fall. This means that anomalously high T2m, VPD and SMAVG favour CO2 release during the cold seasons. These patterns are similar for GPP and RECO (Figs. A6–A7), but correlations are stronger for RECO, highlighting its significant contribution to NEE interannual variability during the cold seasons. In spring (March–May), the relationship between NEE and reverses compared to the cold season pattern, while that between NEE and SMAVG tends to remain positive in central Europe. In turn, anomalously high T2m and VPD, along with anomalously low SMAVG (at least in central Europe), tend to be favourable spring conditions for CO2 sequestration. The increase in spring CO2 sequestration under anomalously dry soil conditions is likely driven by elevated T2m and VPD, leading to enhanced evapotranspiration and drier soils. The summer pattern generally shows an opposite sign compared to spring, suggesting stronger CO2 sequestration under anomalously low T2M and VPD, and high SMAVG. In southern Europe, correlation patterns are consistent across datasets in spring and summer only, showing a similar response to that observed in summer in northern/central Europe but extended over a longer period.
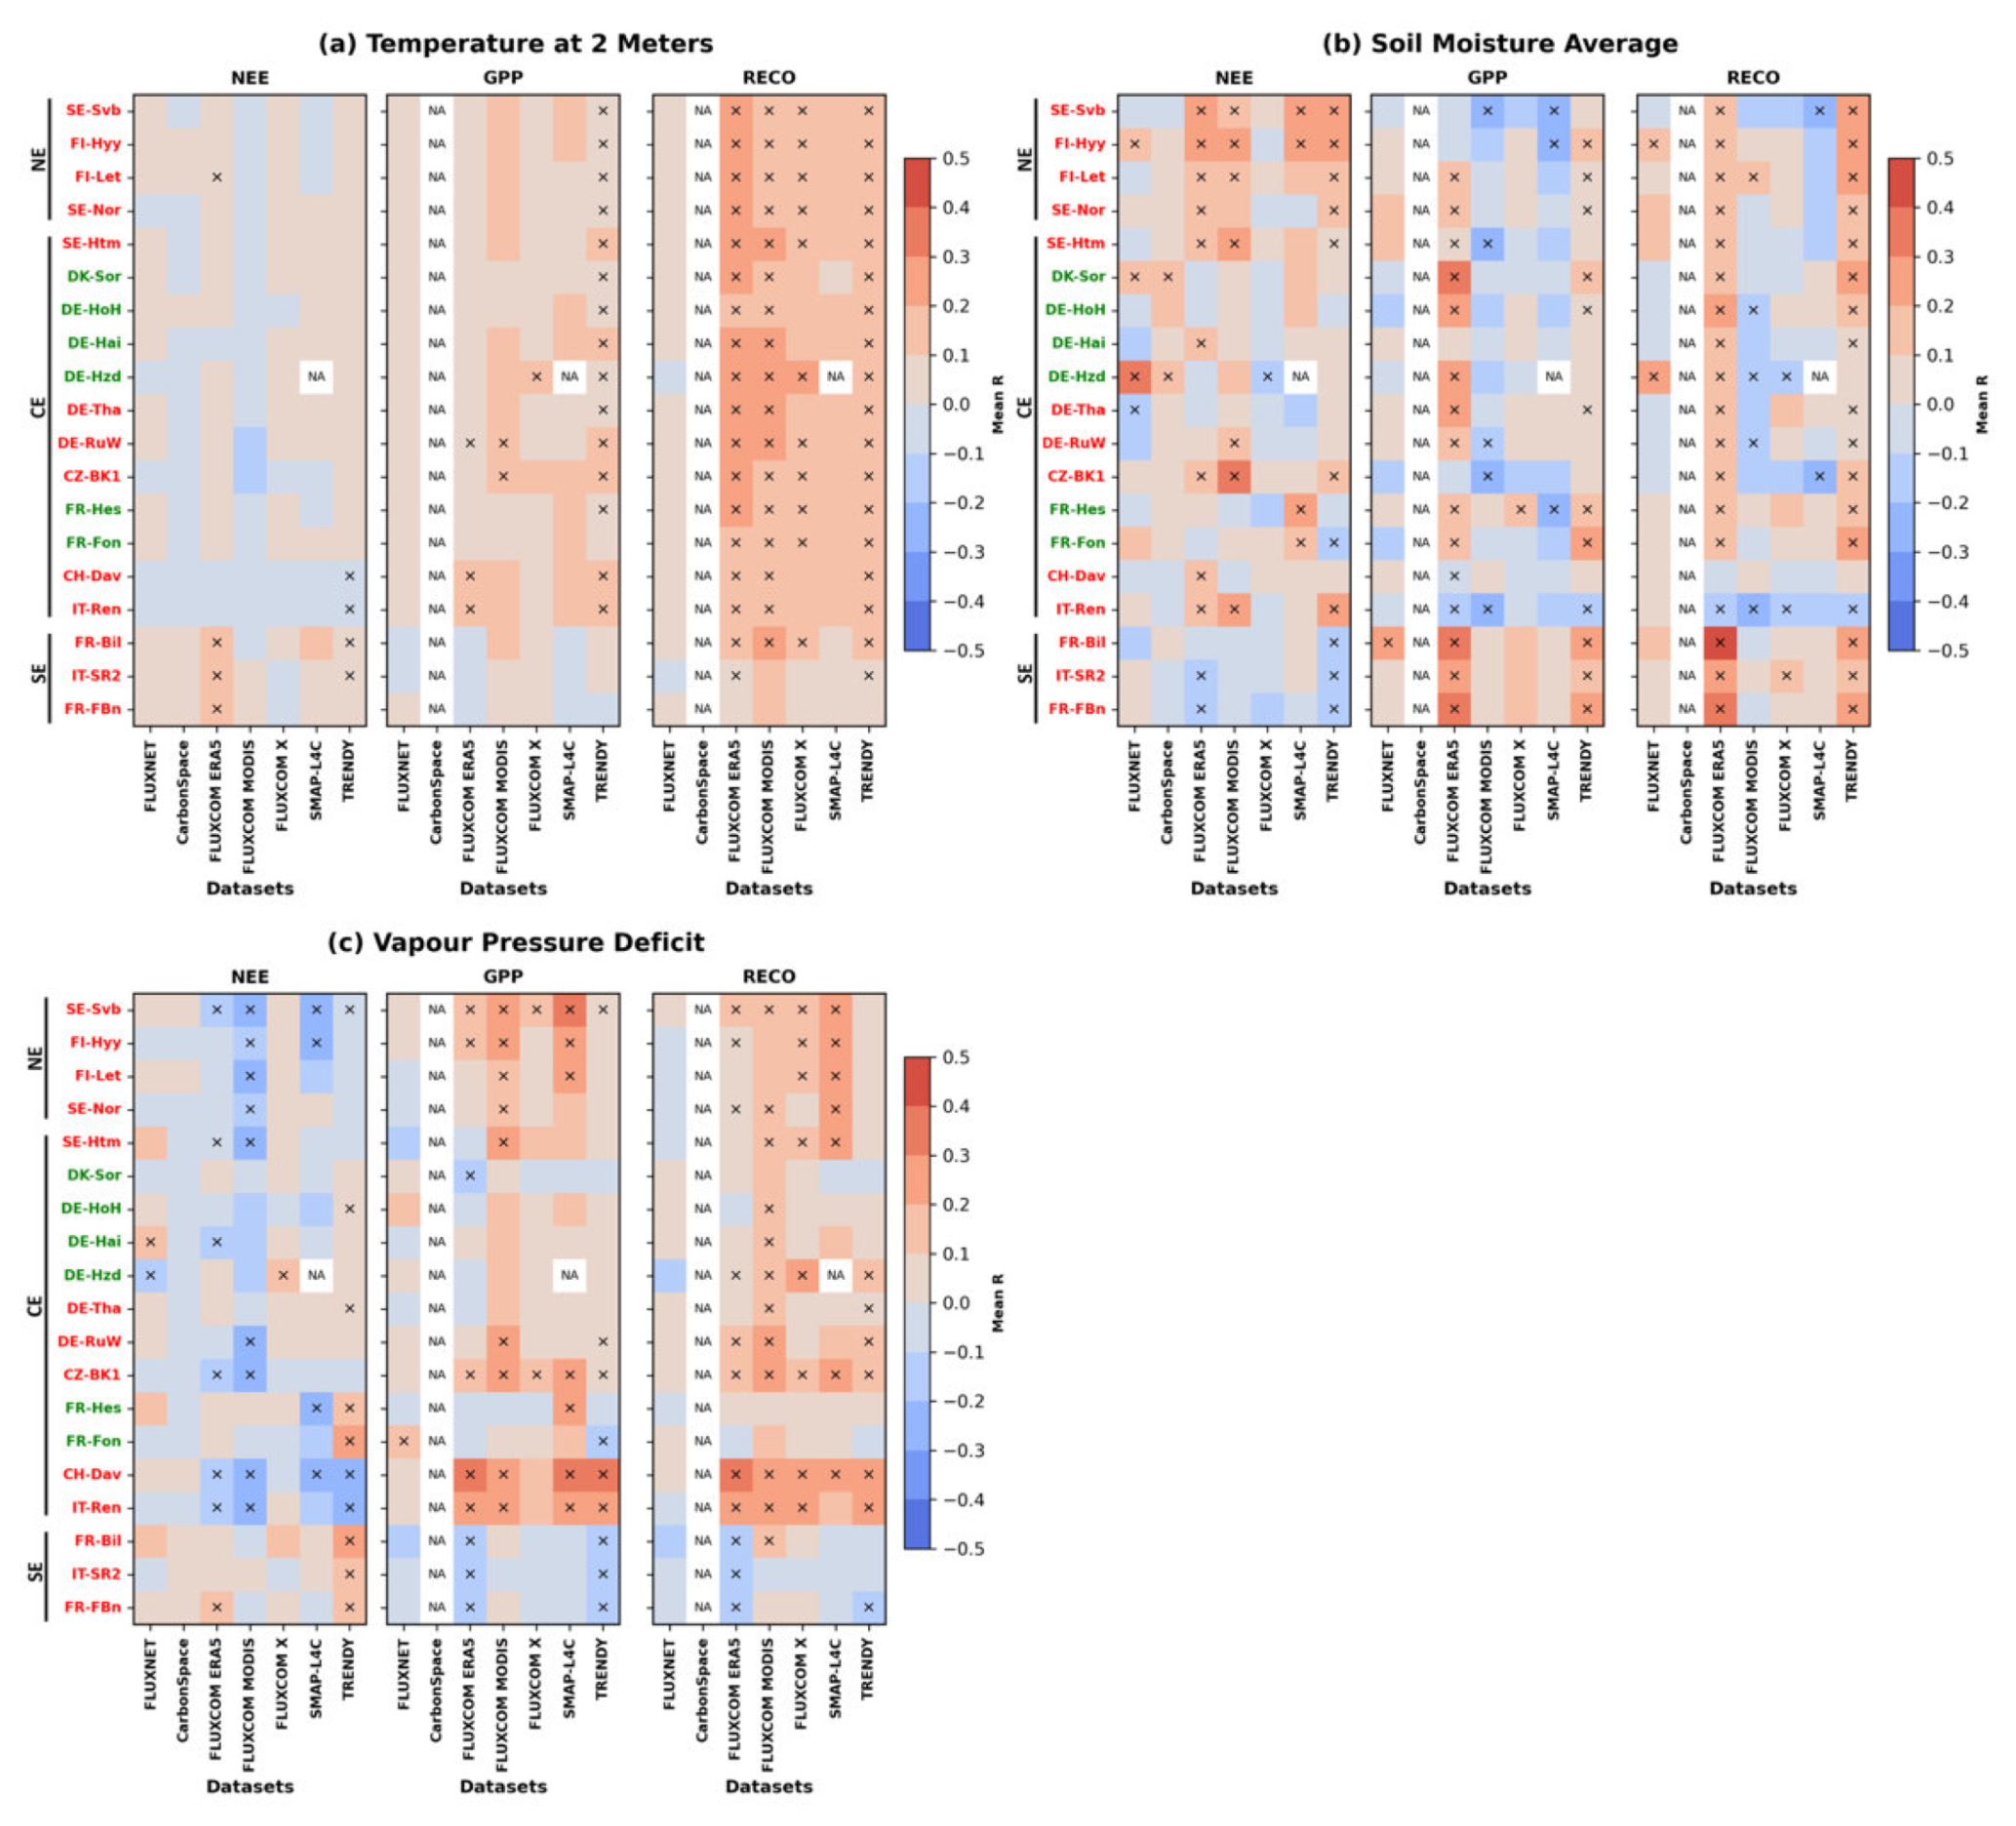
Figure 9Same as Fig. 8 but using monthly anomalies calculated after removing the mean annual cycle.
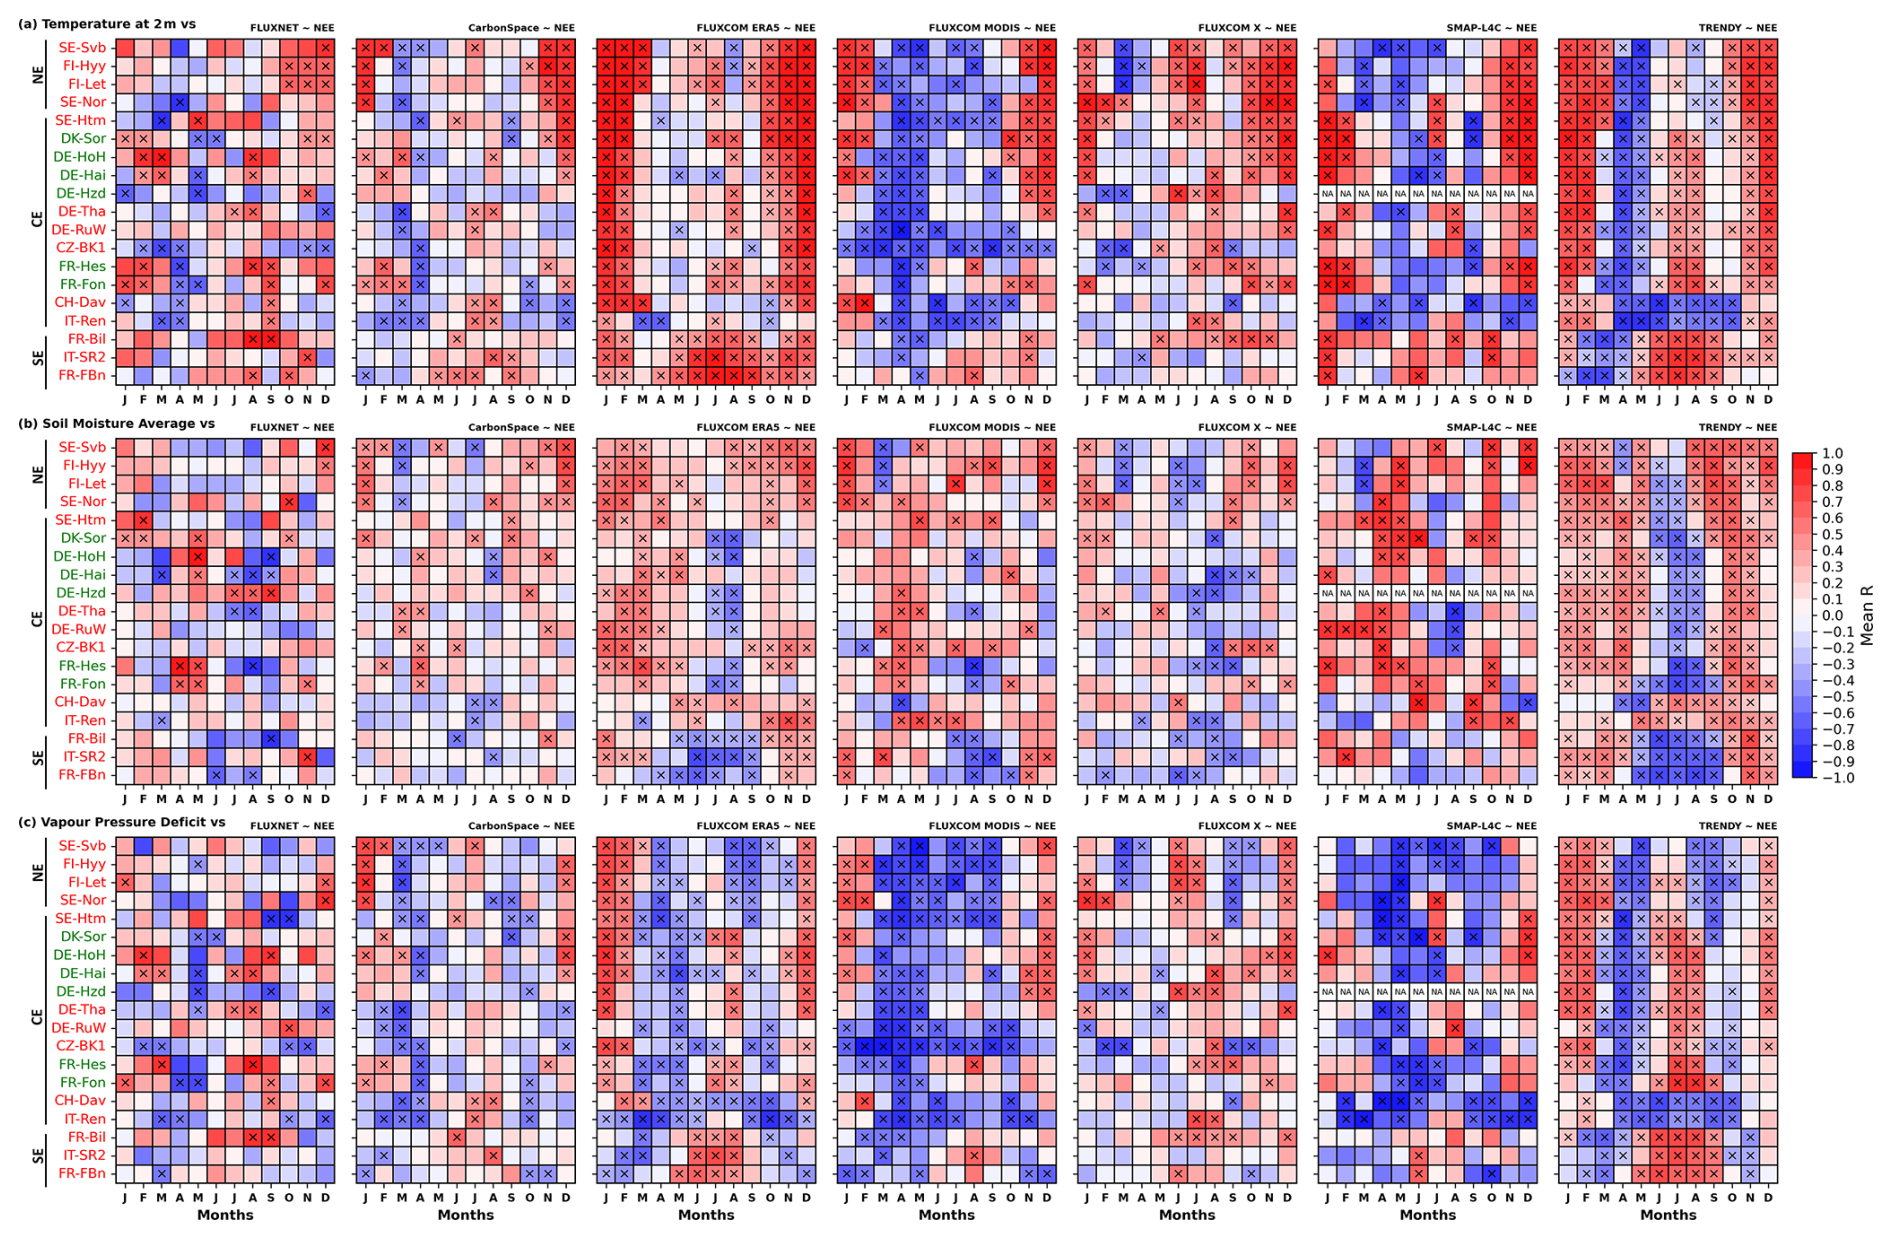
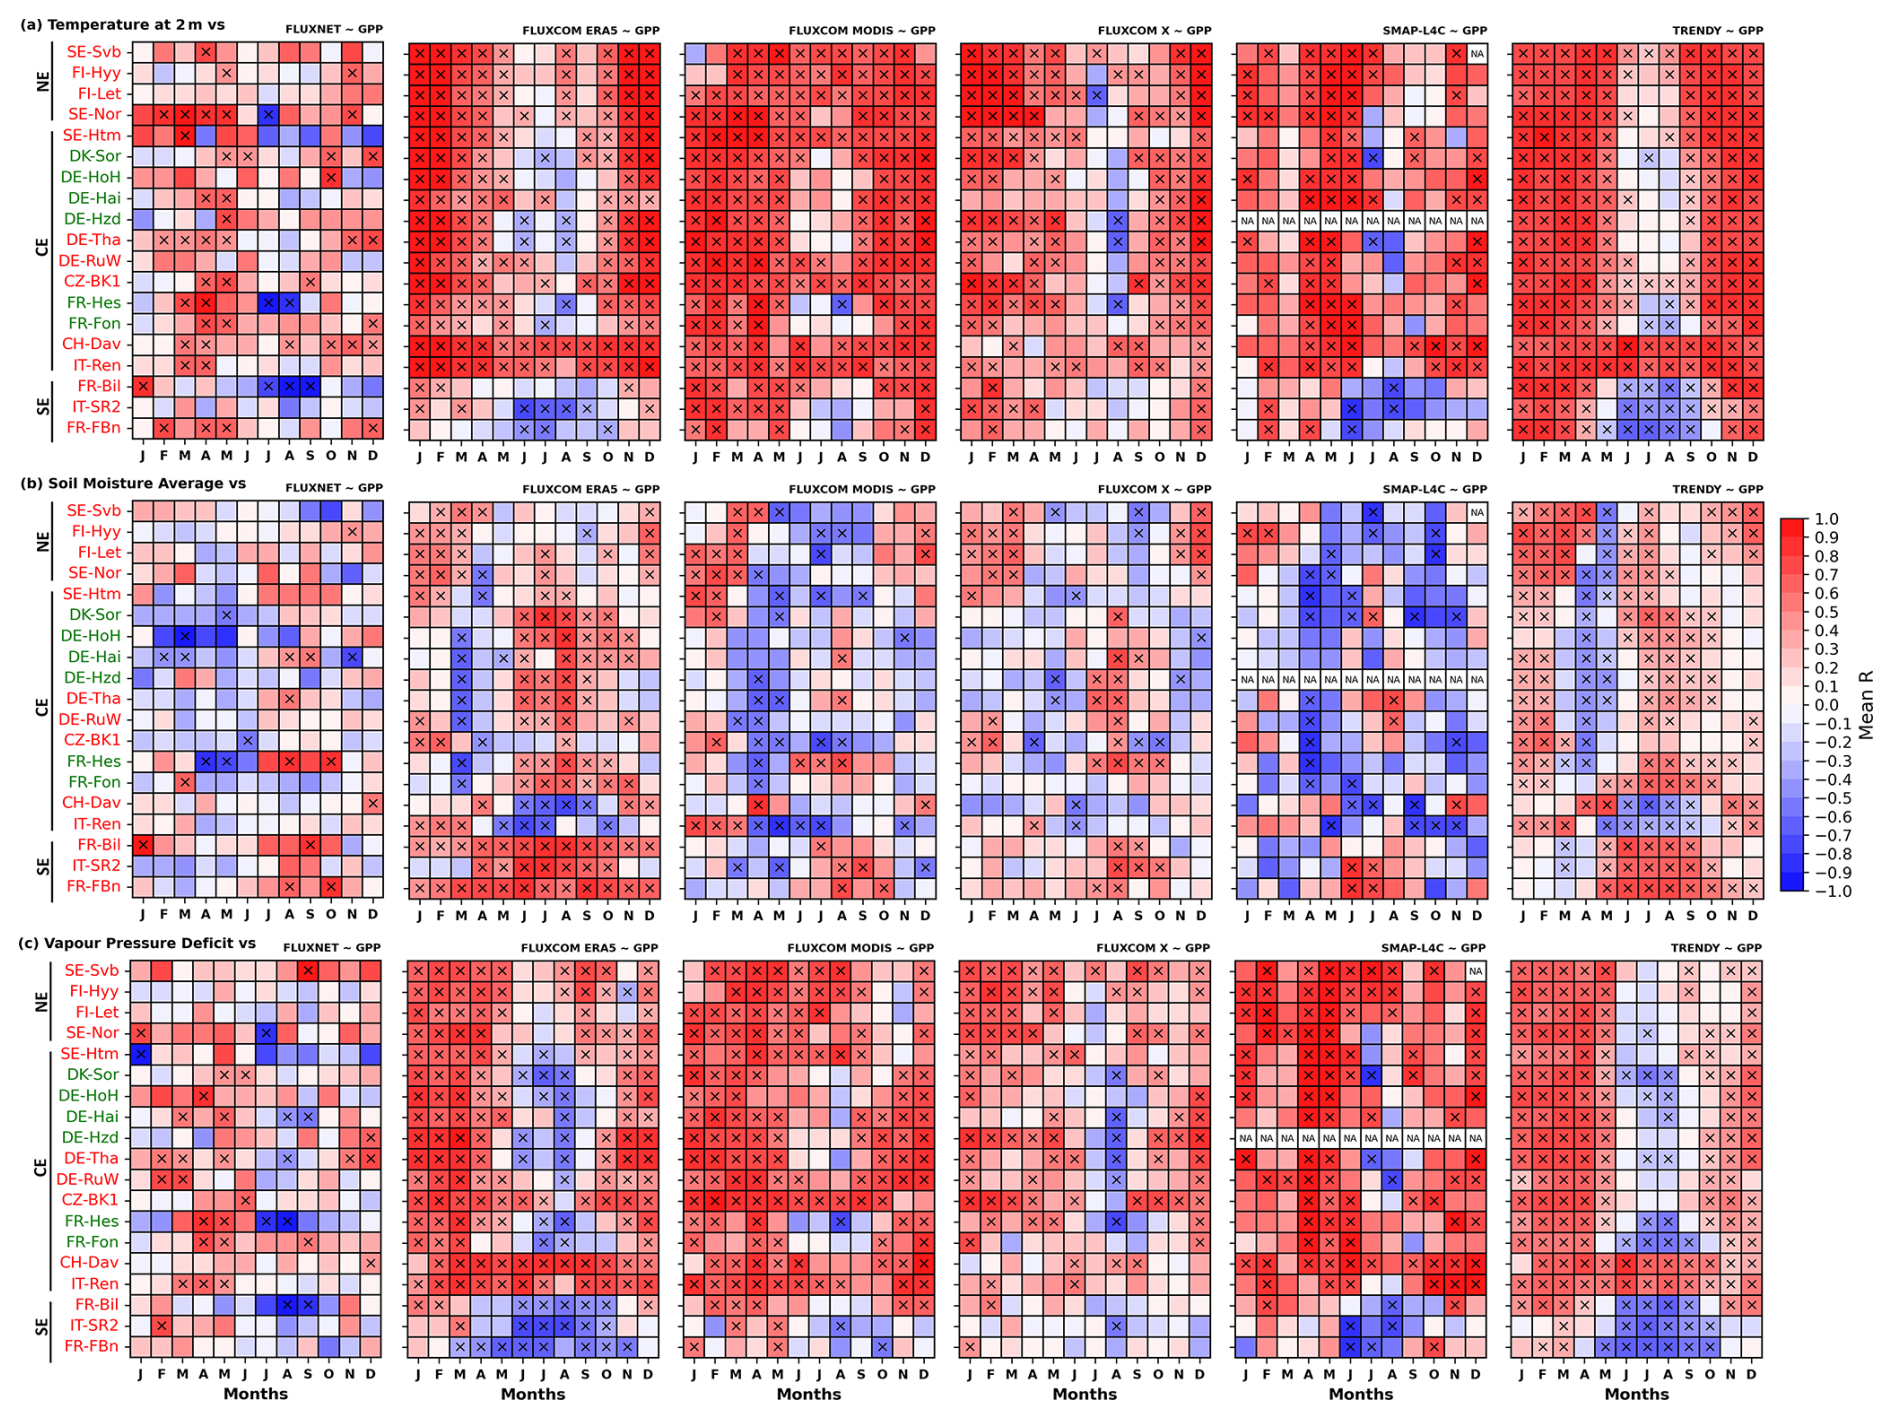
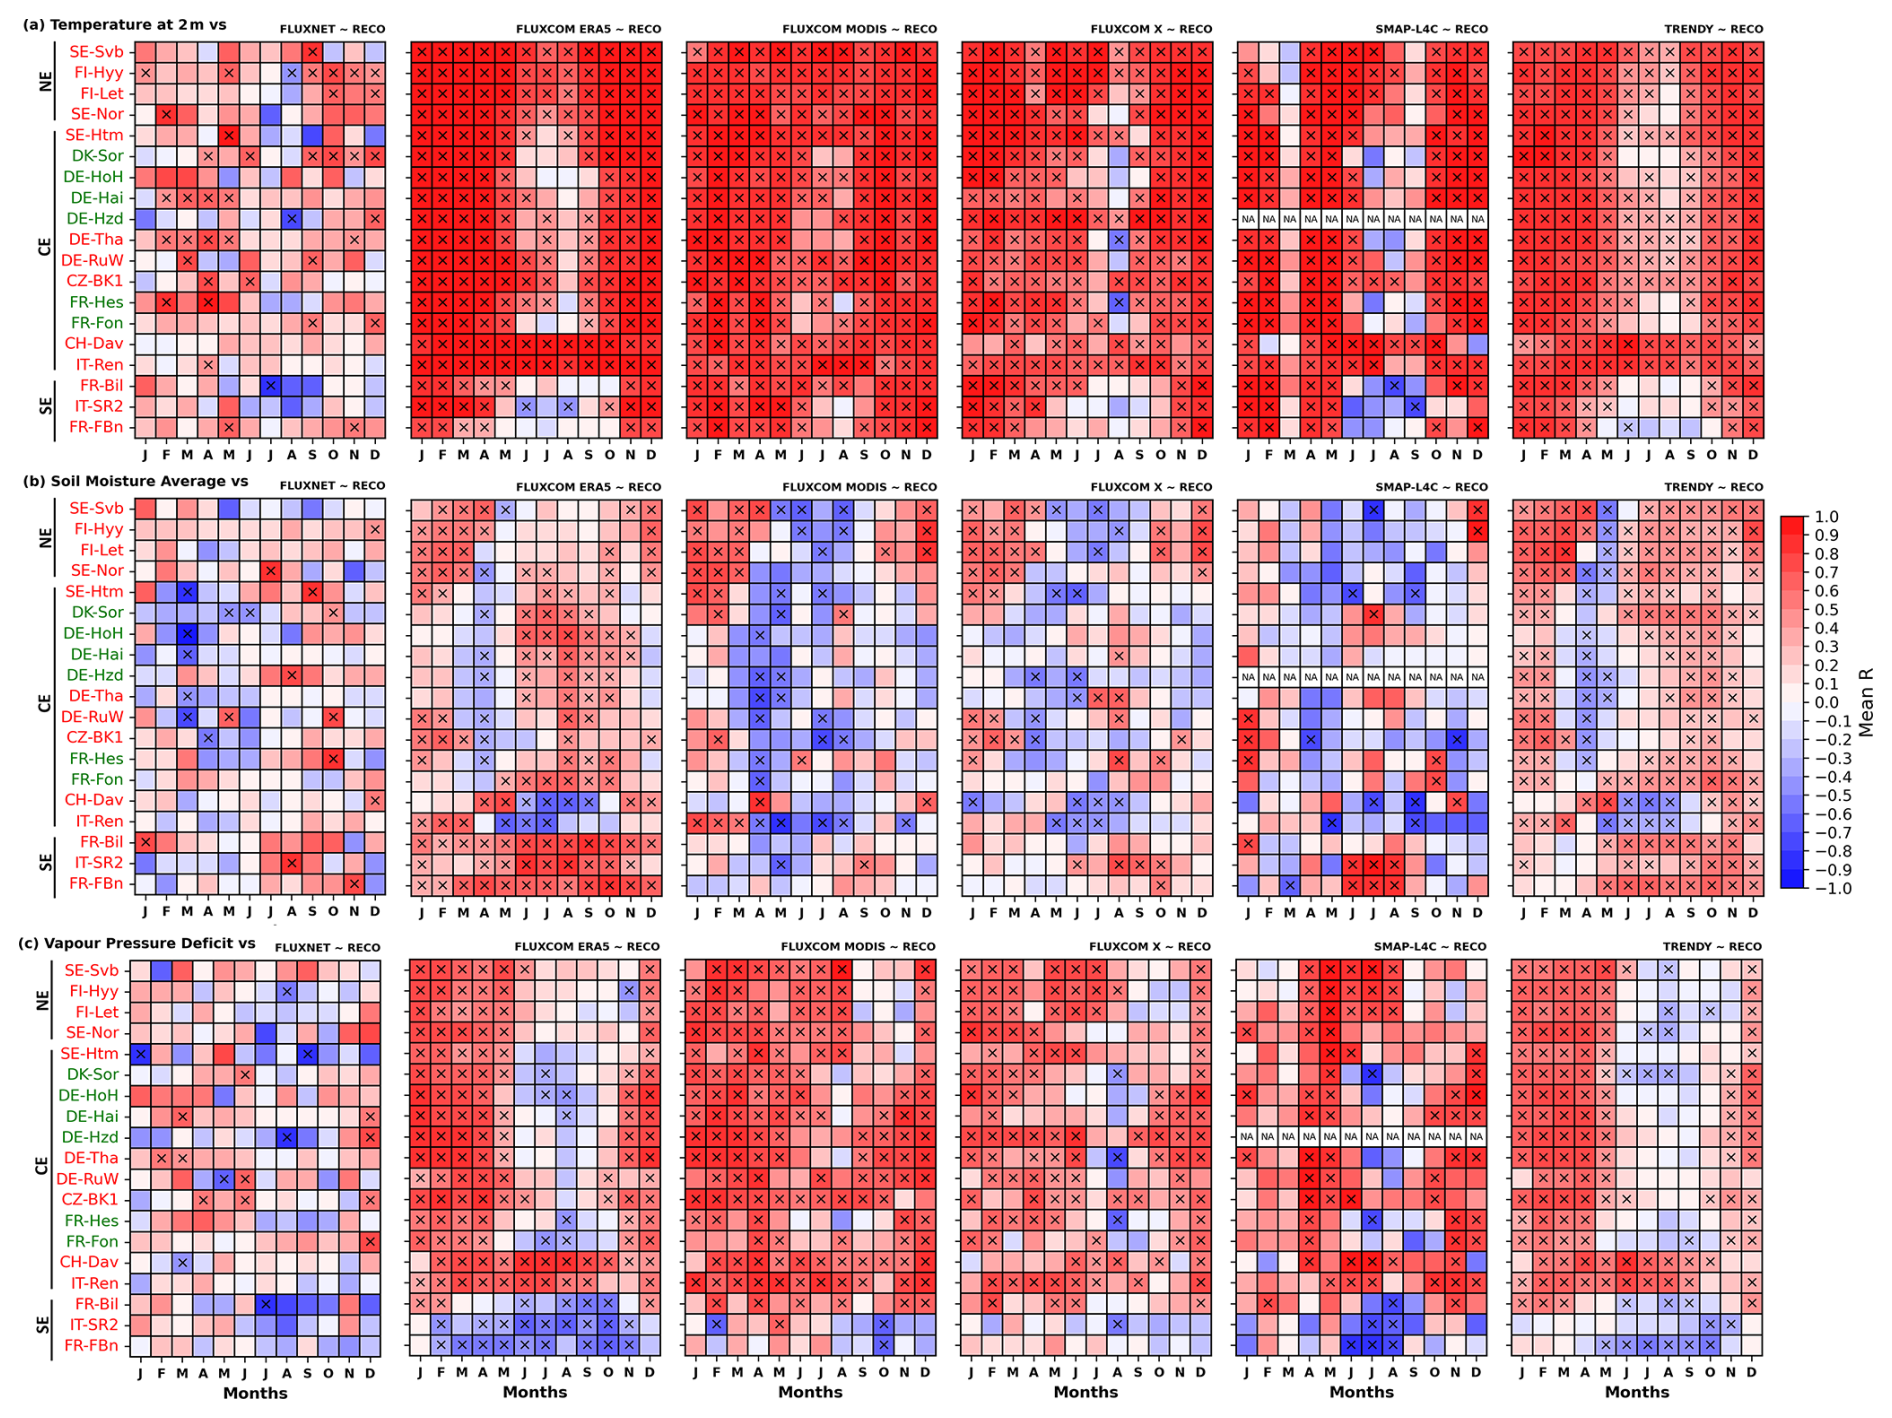
Figure 10Interannual co-variability between NEE and (a) 2 m temperature, (b) soil moisture and (c) vapour pressure deficit for each month, all sites and all datasets. The co-variability is assessed through the Bravais–Pearson correlation computed for each month between CO2 fluxes and ERA5-Land climate data. The number of years included varies depending on the data, as shown in Fig. 2d. Correlation values marked with “×” are significant at the 95 % confidence level according to the Bravais–Pearson test. Cells labelled “NA” indicate cases where the CO2 flux data are corrupted (SMAP-L4C). For conciseness, correlations are computed using the ensemble mean of CO2 fluxes for the FLUXCOM (ERA5 and MODIS) and TRENDY models. ENF sites are displayed in red text, while DBF sites are highlighted in green. Sites are ordered from north to south based on their latitude, with black vertical lines indicating the boundaries between northern (NE), central (CE) and southern (SE) Europe.
This study aims at assessing the impact of climate on the annual cycle and interannual variability of monthly CO2 fluxes in European DBFs and ENFs through conjointly analysing observations from the FLUXNET network and state-of-the-art data-driven and process-based models.
As a first step, we assess the model abilities to reproduce the observed mean annual cycle and interannual variability of CO2 fluxes. This evaluation presents two key challenges. First, the temporal coverage of observations in the FLUXNET database is often limited, making it difficult to extract robust signals, particularly for interannual variability. Site-specific characteristics may also cause a disconnect between CO2 flux variability and regional climate variability (Chu et al., 2017). Second, there is a spatial scale mismatch between site-level observations, representing fluxes from the tower footprint to several square kilometres (Göckede et al., 2008), and most models used in this study, which simulate fluxes at regional to large scales, except for the hectometric-scale CarbonSpace model. Given these constraints, our evaluation should be considered qualitative rather than strictly quantitative.
The models reasonably capture both the annual cycle and interannual variability of observed CO2 fluxes, though with some magnitude discrepancies. In particular, the models accurately capture the north-to-south gradient, with increased length in the CO2 sequestration period from northern to southern Europe, as well as the more pronounced annual cycle in DBFs than ENFs. With the exception of the CarbonSpace model, which overestimates CO2 sequestration across all European sites, most models tend to underestimate GPP and overestimate RECO, resulting in a near systematic underestimation of CO2 sequestration.
The interannual variability in the models is weaker than in the observations, consistent with previous studies (e.g. Nelson et al., 2024). However, the CarbonSpace data-driven model proved to be the only model tested that does not underestimate the NEE interannual variability. The reasons may involve its high spatial resolution (few hectares) and the use of a Lagrangian particle dispersion model, which allows it to closely align with the flux tower footprints. This results in more precise flux localization, which may improve its response to fine-scale variability. Another reason may also involve the use of an ensemble tree method for regression. This method offers greater flexibility in capturing nonlinear interactions between environmental variables and NEE. Further studies are needed to evaluate these hypotheses. The temporal co-variability between observed and simulated CO2 fluxes remains correct despite the underestimated magnitude in CO2 flux interannual variability. This agreement was expected for the data-driven models, as they incorporate FLUXNET observations in their development. However, it was less anticipated for the process-based models, which do not assimilate direct CO2 flux measurements. Their ability to capture observed interannual variability likely stems from the fact that TRENDY models are driven by observed CO2 concentrations, land-use changes and climate data, while the SMAP-L4C model benefits from the assimilation of satellite-derived soil moisture observations.
Despite uncertainties, our results highlight that state-of-the-art models are valuable tools for complementing observations, particularly in assessing the impact of climate on the interannual variability of CO2 fluxes at the European scale. The relationship between CO2 fluxes and climate is analysed for both the annual cycle and interannual variability using synchronous correlation analyses between each CO2 flux and individual climate variables, including 2 m temperature (T2m), vapour pressure deficit (VPD) and soil moisture (SMAVG).
Regarding the annual cycle, the influence of climate on CO2 fluxes is stronger in northern and central Europe than in southern Europe, where seasonal climate variations are less pronounced. In southern Europe, both the agreement between observations and models and the consistency among different data-driven and process-based models are weaker. The spread within members (FLUXCOM-ERA5 and FLUXCOM-MODIS) and DGVMs (TRENDY) is also larger. We hypothesize that part of this model uncertainty stems from the limited number of ENF sites in southern Europe, leading to weak constraints for data-driven models and fewer reference points for calibrating DGVMs. However, it is worth noting that the uncertainty associated with the machine learning methods used to develop data-driven models remains low, whereas inter-DGVM spread can be substantial.
Regarding interannual variability, the climate impact on CO2 fluxes can be summarized in three points. First, climate impacts GPP and RECO more strongly than NEE, regardless of the site and dataset. Because NEE is the difference between GPP and RECO, its interannual variability arises from various combinations of these two components. For instance, reduced CO2 sequestration can result from a greater increase in RECO compared to GPP, a larger decrease in GPP than in RECO, a decrease in GPP with no change in RECO or an increase in RECO without any change in GPP. Such complexity implies that the influence of climate on NEE is less direct and likely more intricate than its effects on GPP and RECO. Second, the impact of climate on the interannual variability of CO2 fluxes depends strongly on how it is assessed. It appears weak when monthly anomalies from all months are analysed together but becomes more pronounced when each month is examined separately, revealing seasonal shifts in the sign of the climate–NEE relationship. The timing and direction of these seasonal shifts vary across datasets and regions. In particular, CO2 sequestration is enhanced by anomalously low T2m and VPD and anomalously high SMAVG in summer, whereas the opposite pattern prevails in spring. This finding aligns with previous case studies showing that heatwaves and droughts reduce summer CO2 sequestration (Ciais et al., 2005; Smith et al., 2020; Thompson et al., 2020; van der Woude et al., 2023). It also highlights that anomalously warm and dry springs may, in some cases, enhance CO2 sequestration, likely because soil moisture levels remain sufficient during this period, in line with, for example, Delpierre et al. (2009) and Smith et al. (2020). Such a transition from spring to summer is less evident in southern Europe, which instead exhibits consistent patterns from spring to summer. The climate–NEE relationship is much noisier in both space and time in the observations than in the models, and it can vary substantially across different models. This indicates that local flux measurements may not reliably represent regional-scale dynamics, while models may exaggerate the influence of climate on CO2 flux variability (despite underestimating its magnitude). Further work is needed to disentangle site-specific effects from broader-scale signals, a critical step toward improving the calibration of regional and global models that cannot resolve local heterogeneity.
This study makes use of state-of-the-art data-driven and process-based models to complement observations for assessing the impact of climate on the annual cycle and interannual variability of monthly CO2 fluxes in European DBFs and ENFs. Outputs from different data-driven models (CarbonSpace, FLUXCOM-ERA5, FLUXCOM-MODIS and FLUXCOM-X) and process-based models forced by realistic conditions (assimilation of satellite-derived soil moisture in SMAP-L4C and time-varying CO2 concentration, land use and climate in TRENDY DGVMs) are analysed conjointly with CO2 measurements from 19 sites (6 DBFs and 13 ENFs) of the FLUXNET network. Across Europe, a clear north-to-south gradient emerges in the annual cycle of CO2 fluxes. The length of the CO2 sequestration season increases southwards in conjunction with more favourable climate conditions for photosynthesis in southern than in northern Europe. This large-scale pattern is perturbed locally by site elevation and other site factors not included in the study (e.g. soil properties and forest age). It is also perturbed by the land cover class, with a more pronounced annual cycle of DBFs than ENFs in central Europe. The interannual variability of CO2 fluxes does not exhibit such a north-to-south gradient, regardless of the metric used (standard deviation or coefficient of variation). However, it remains strong across all seasons, with spring and summer showing high variability based on standard deviation and autumn and winter showing high variability based on the coefficient of variation.
The models accurately capture the observed features despite magnitude differences. Compared to observations, the CO2 sequestration is weaker in regional-scale models and stronger in the hectometric-scale CarbonSpace data-driven model. Except for the CarbonSpace model, all models systematically underestimate the interannual variability of CO2 fluxes, as already reported (Lin et al., 2023; Nelson et al., 2024). Despite biased magnitude, the interannual variability of modelled fluxes correlates well with the observations. This supports the use of models to complement observations, whose limited temporal coverage and site specificities hinder the assessment of climate impacts on CO2 interannual variability. We show that the influence of climate on CO2 flux interannual variability is obscured when monthly anomalies are analysed together. This apparent lack of relationship masks distinct seasonal patterns, which are concealed when considering all months together. Winter and fall CO2 release increases under elevated temperature and VPD in northern and central Europe, while no clear signal emerges in southern Europe. The CO2 sequestration increases under anomalously hot and dry conditions in spring and cold and wet conditions in summer in northern/central Europe. Anomalously cold and wet conditions also favour CO2 sequestration in southern Europe from spring to summer. While these seasonal signals appear noisy in the observations, due to limited sample sizes and site-specific variability, they emerge more clearly in the models, albeit with some model-dependent differences.
These results highlight the significant space-time variability in the impact of climate on forest CO2 fluxes across Europe. This variability underscores the importance of considering regional and seasonal differences when assessing the effects of climate change on CO2 fluxes. Neglecting these variations could lead to oversimplified conclusions and hinder the development of accurate predictions and effective mitigation strategies.
Table A1List of TRENDY DGVMs used in this study.
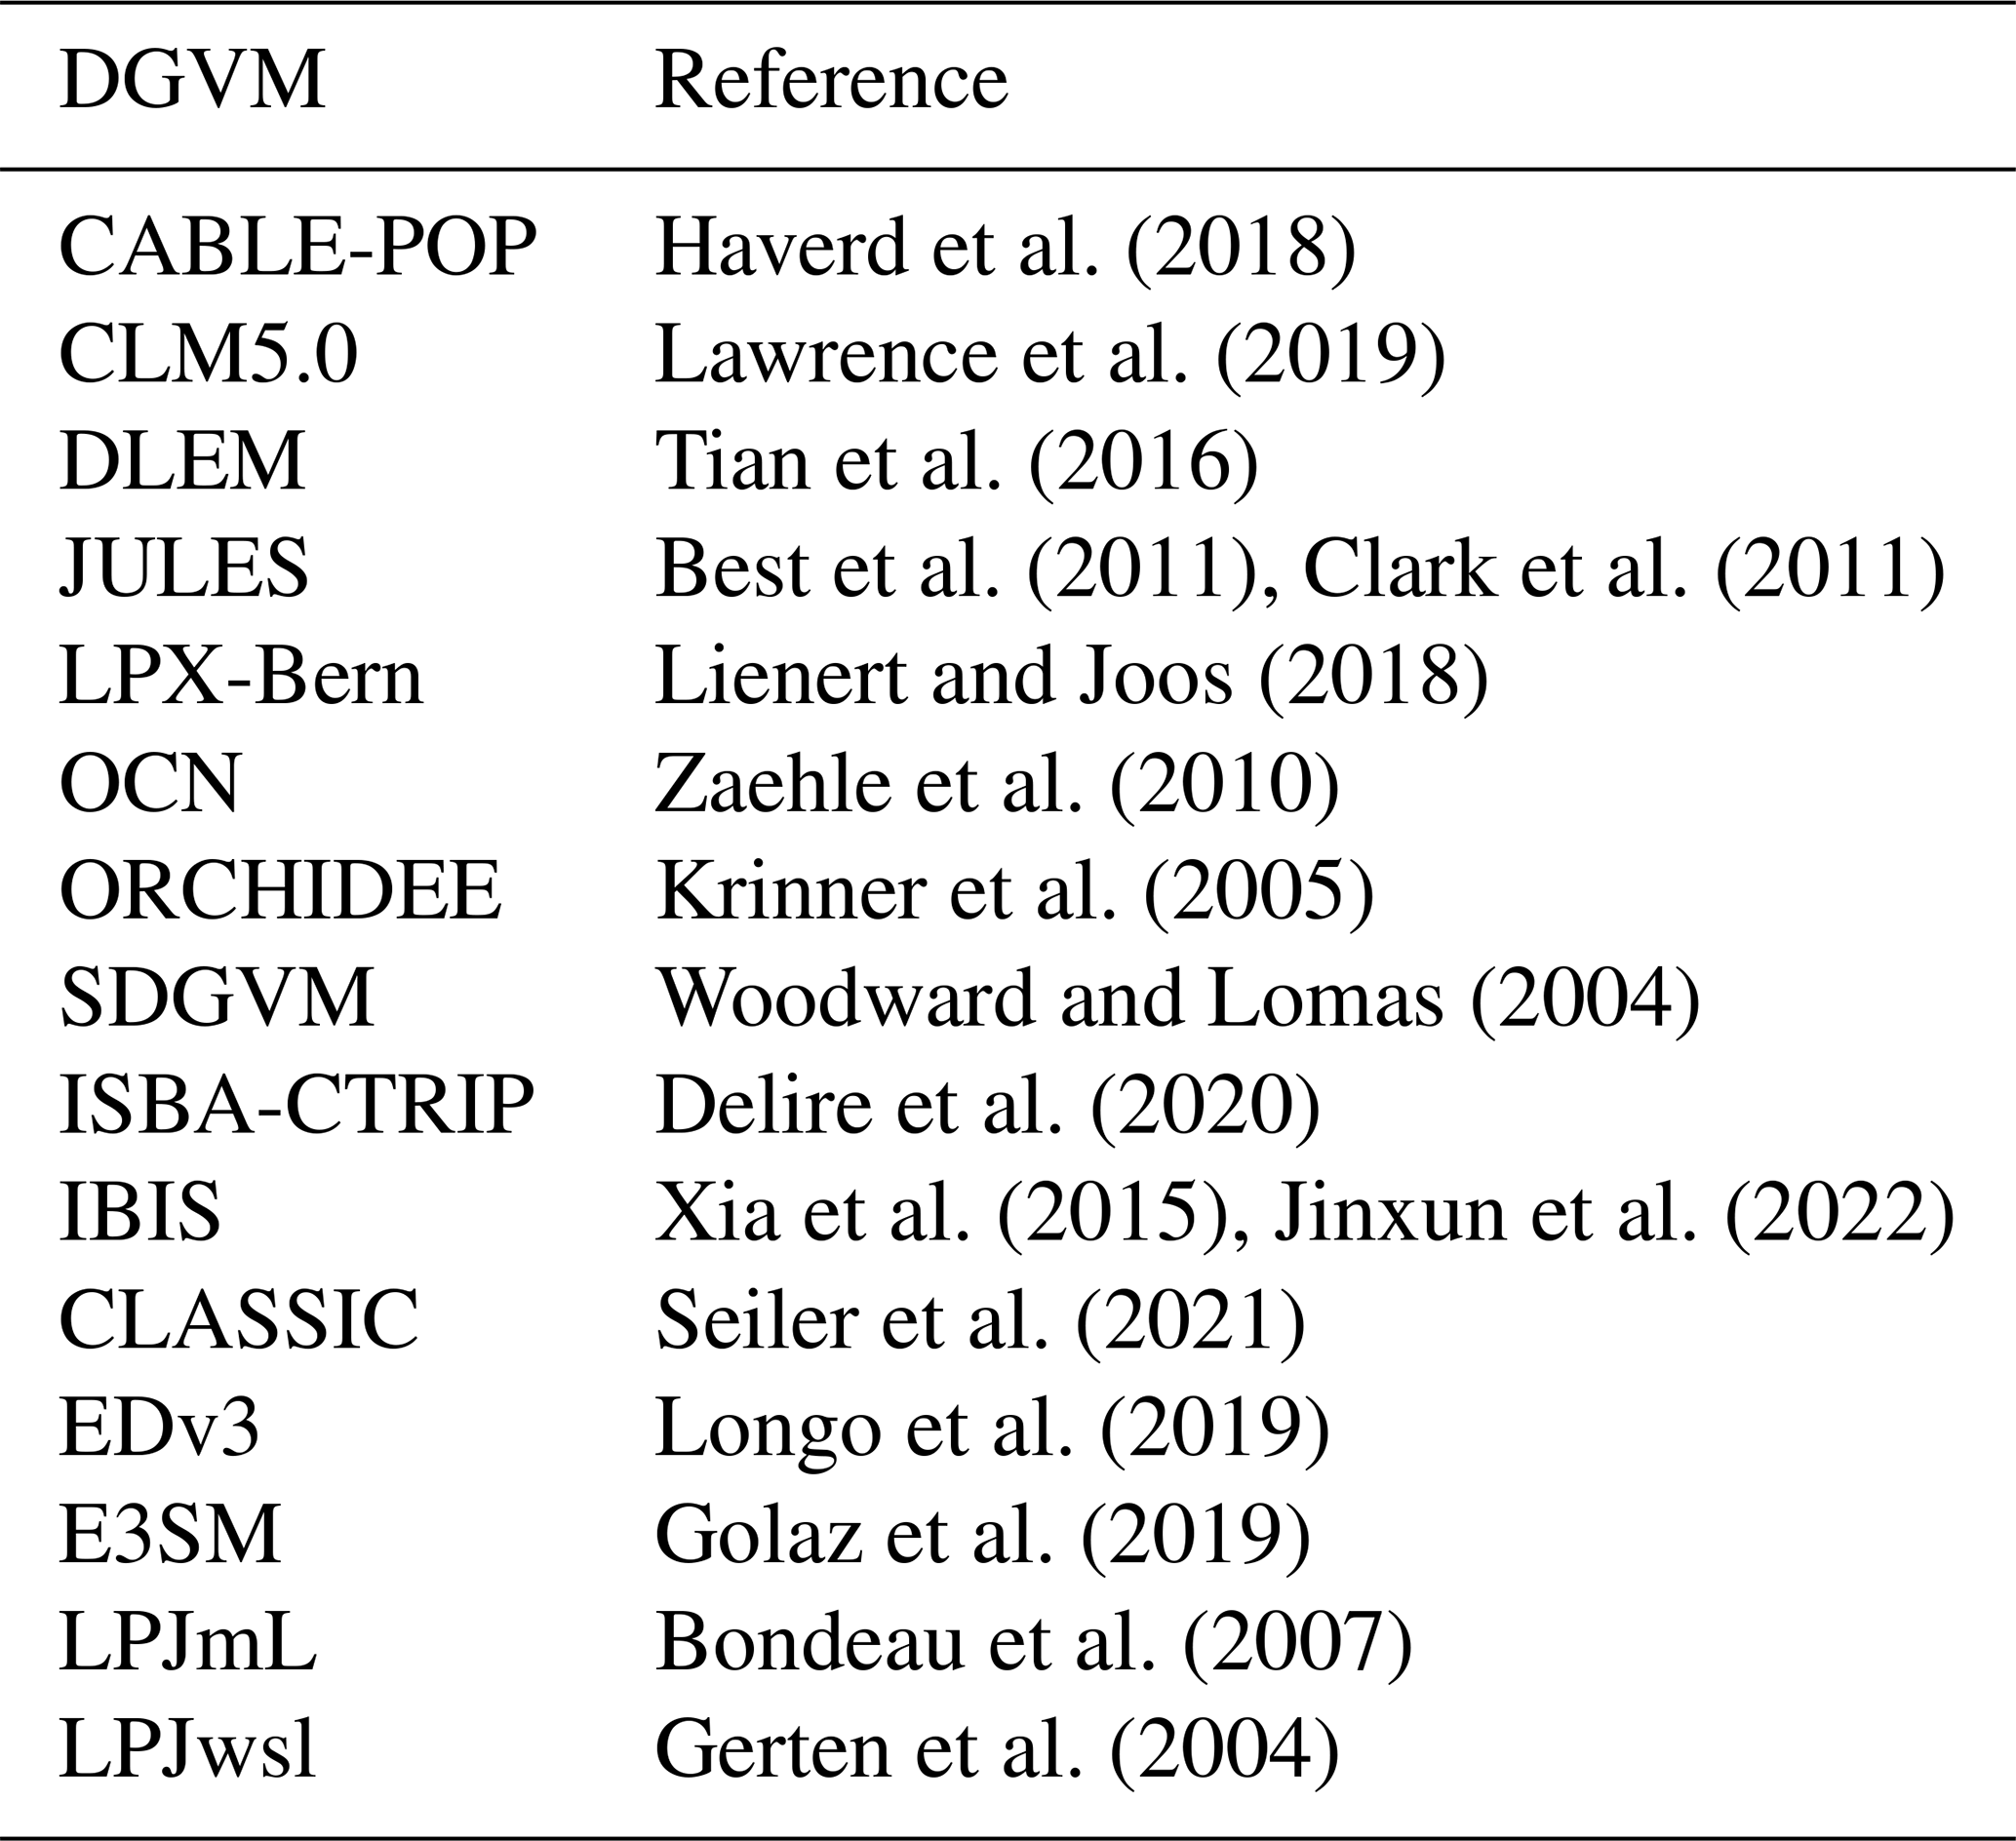
Columns 1 and 2 provide the name of the DGVM and its corresponding reference, respectively.
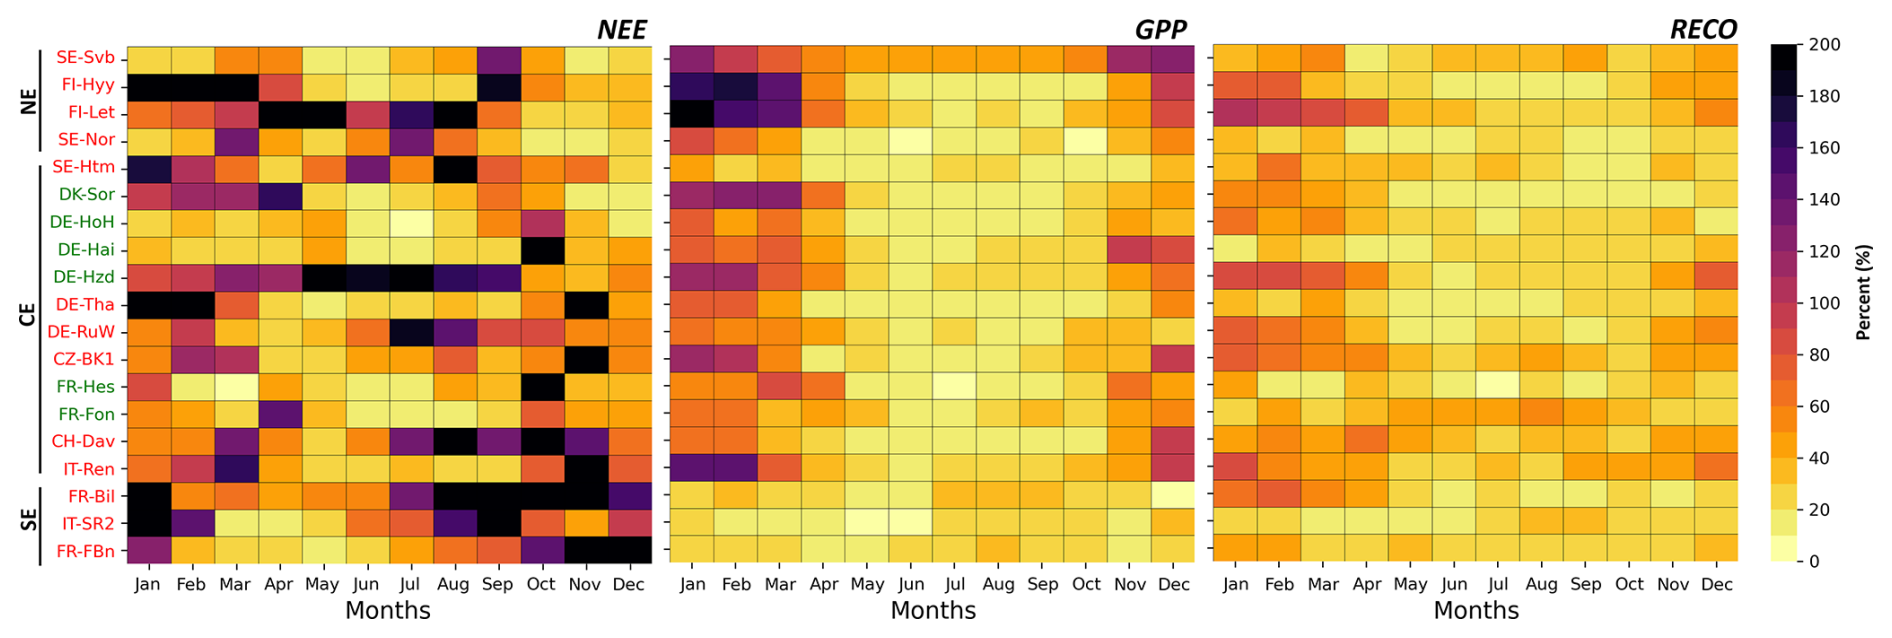
Figure A1Same as Fig. 4b but using the coefficient of variation as a metric for interannual variability.
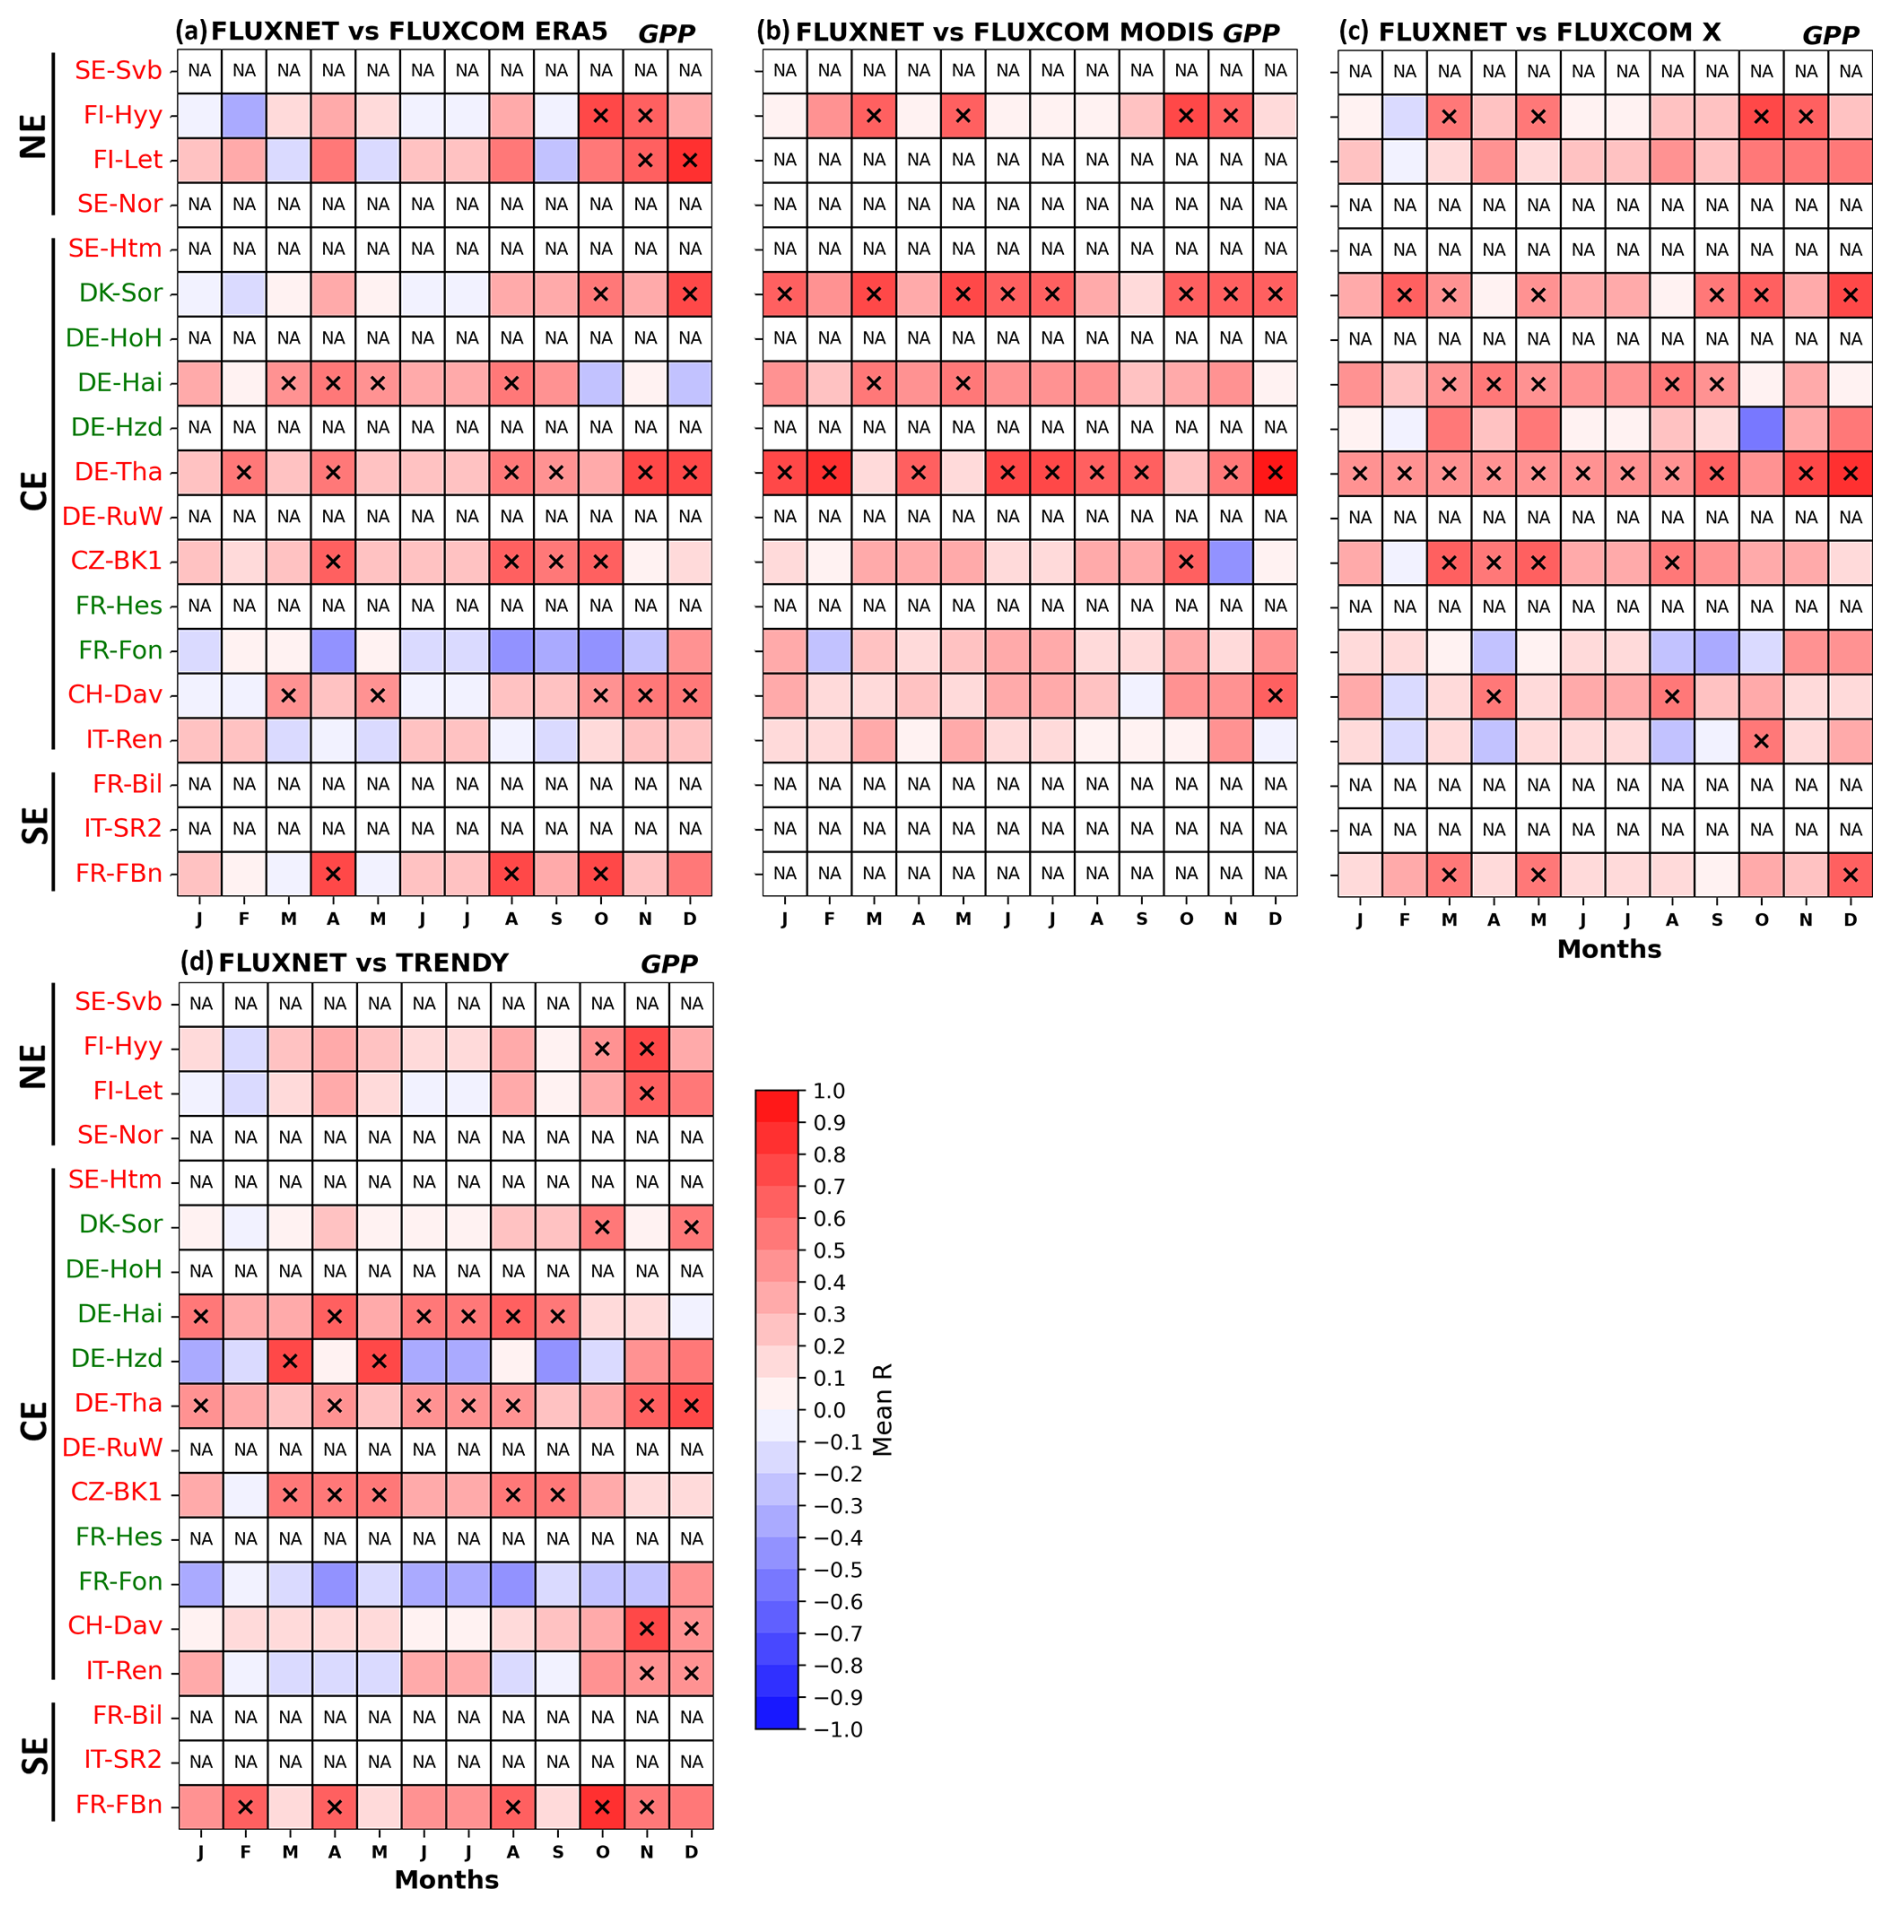
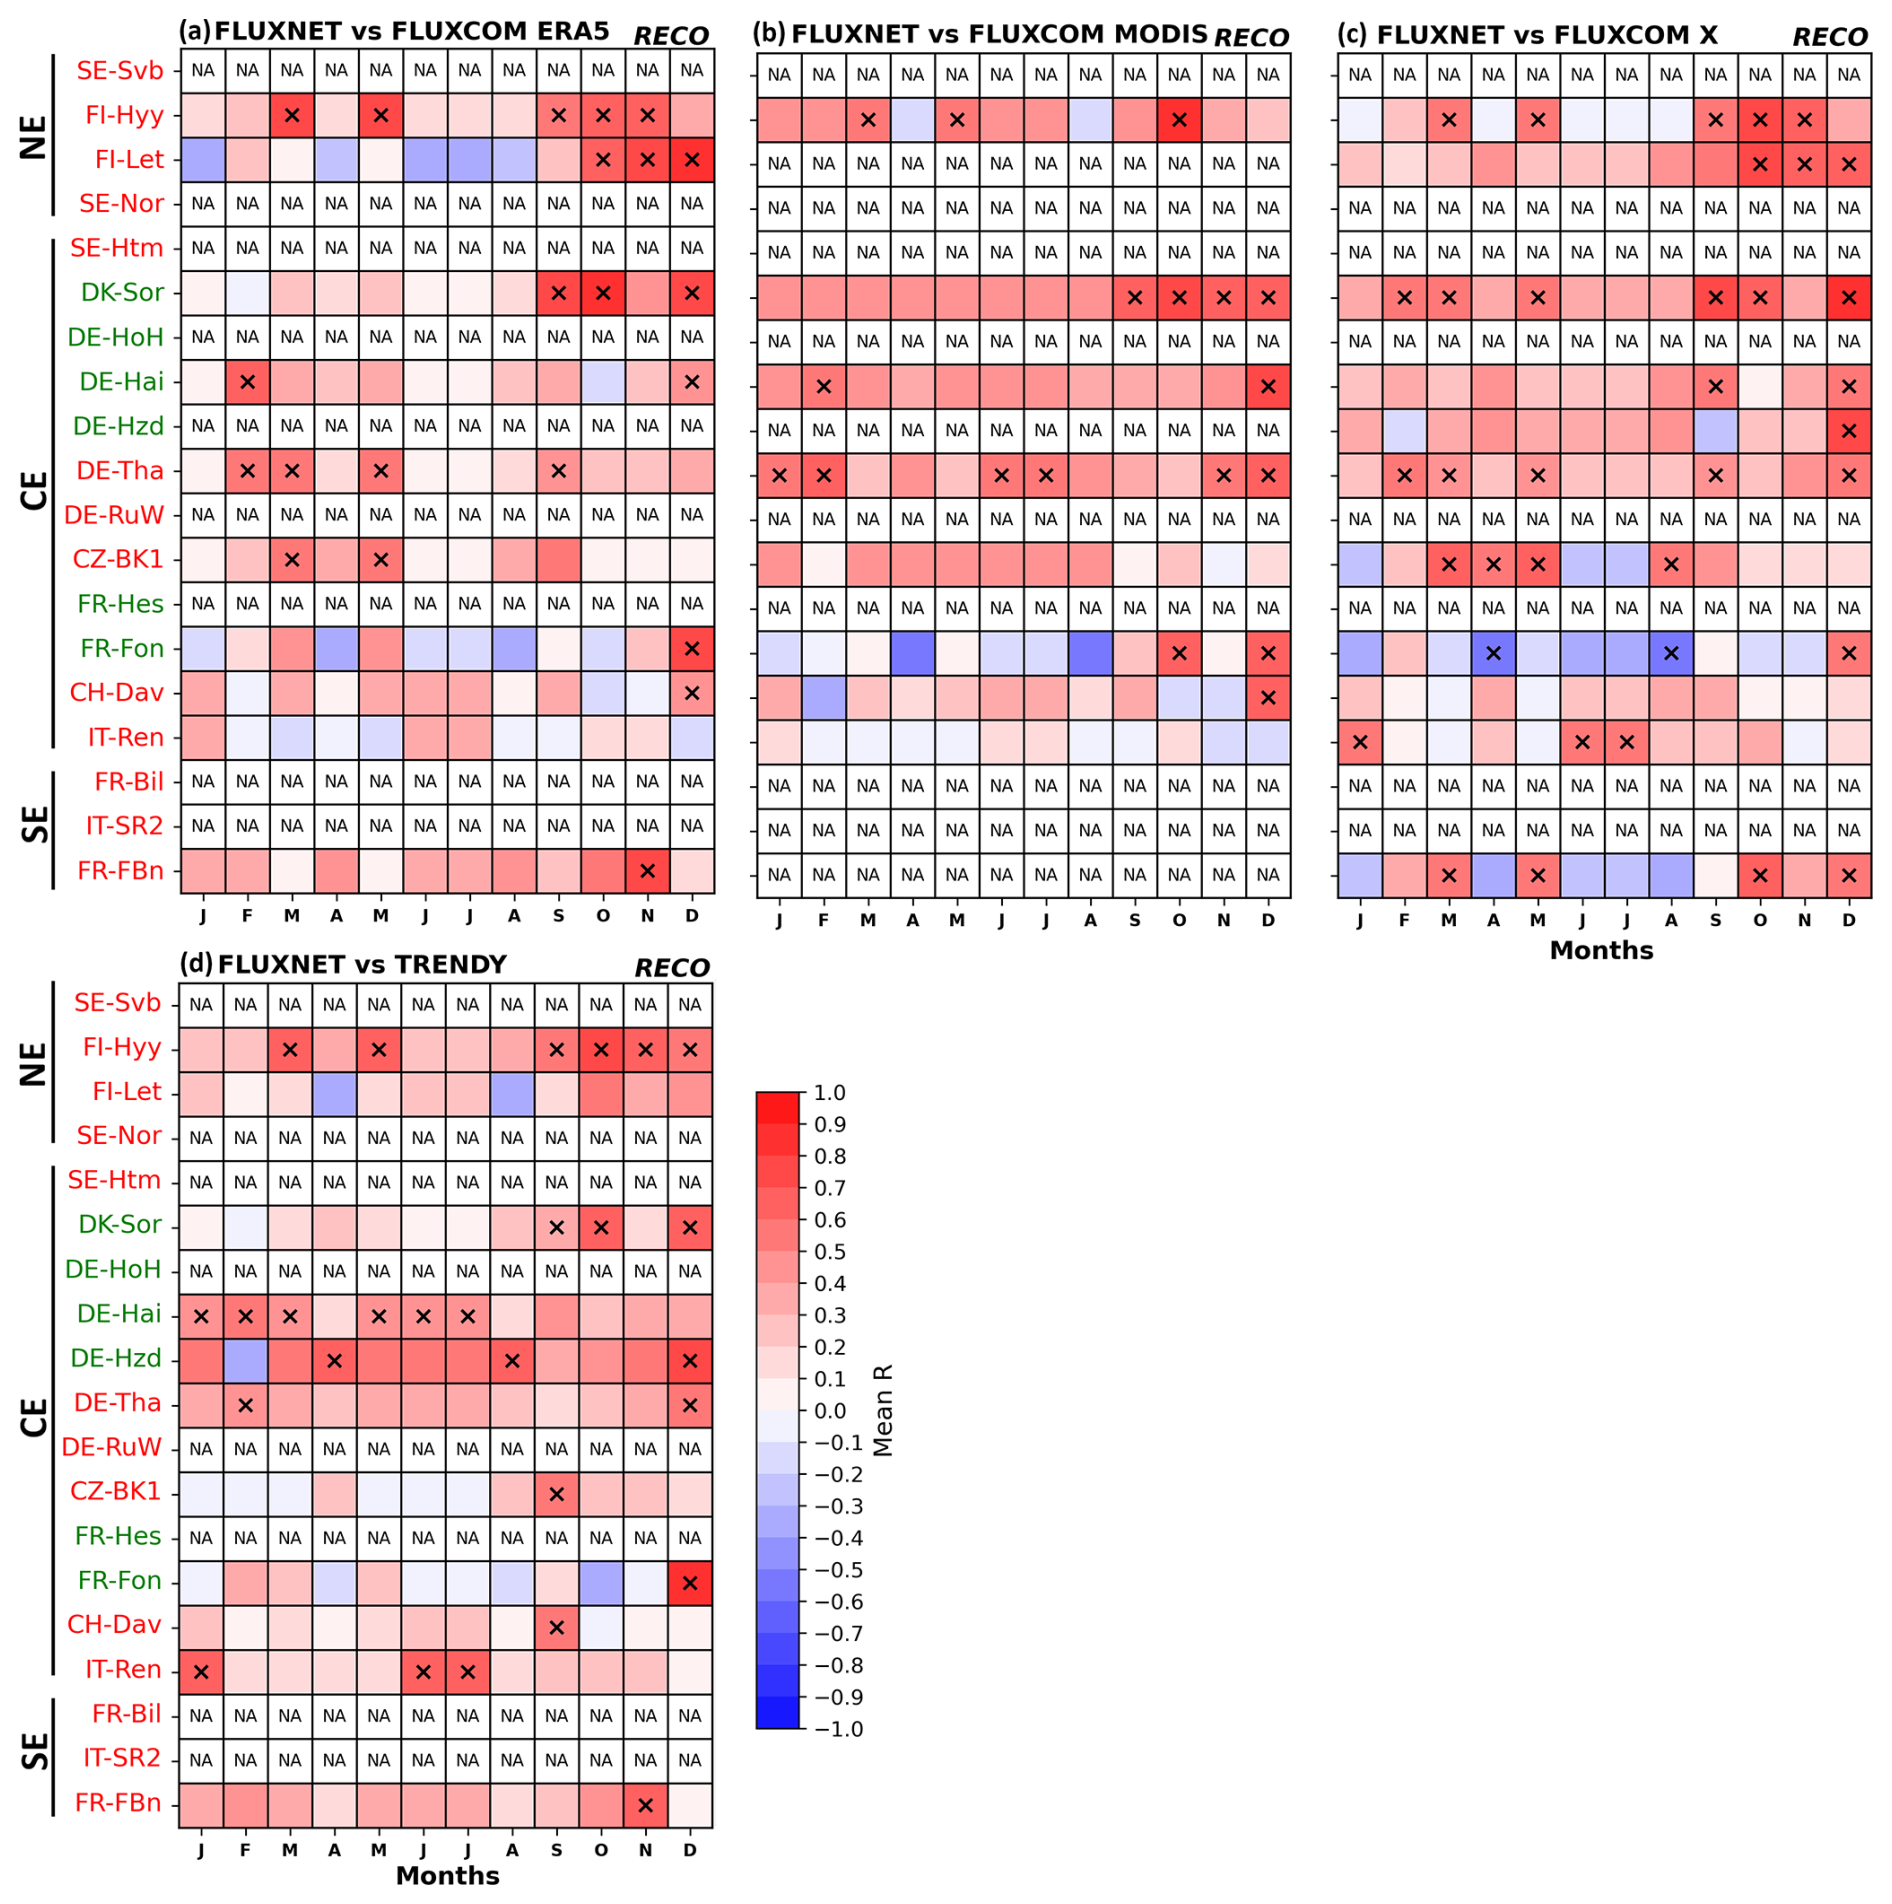
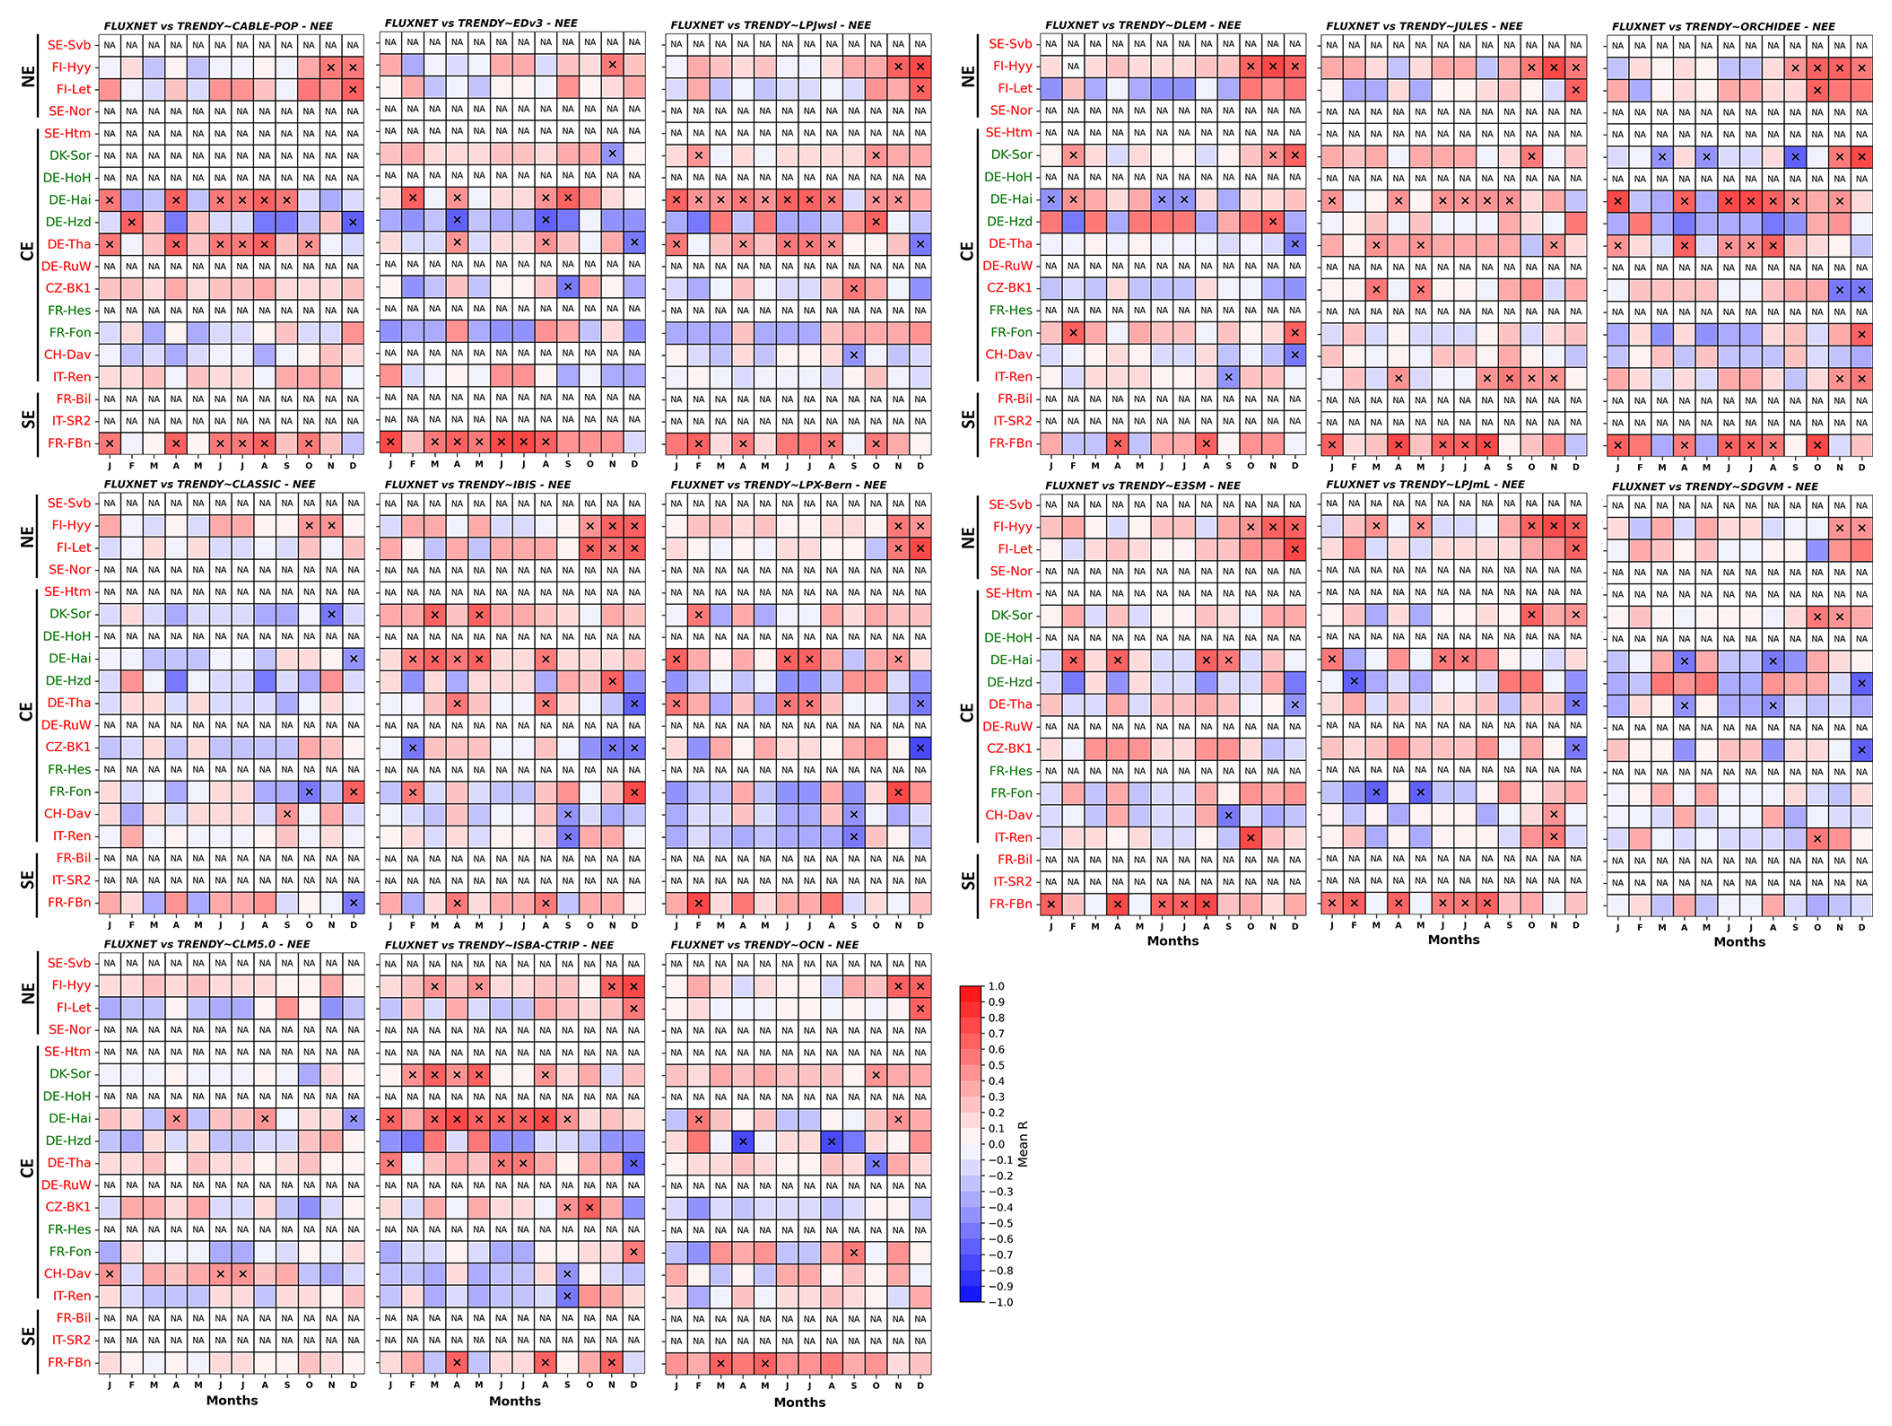
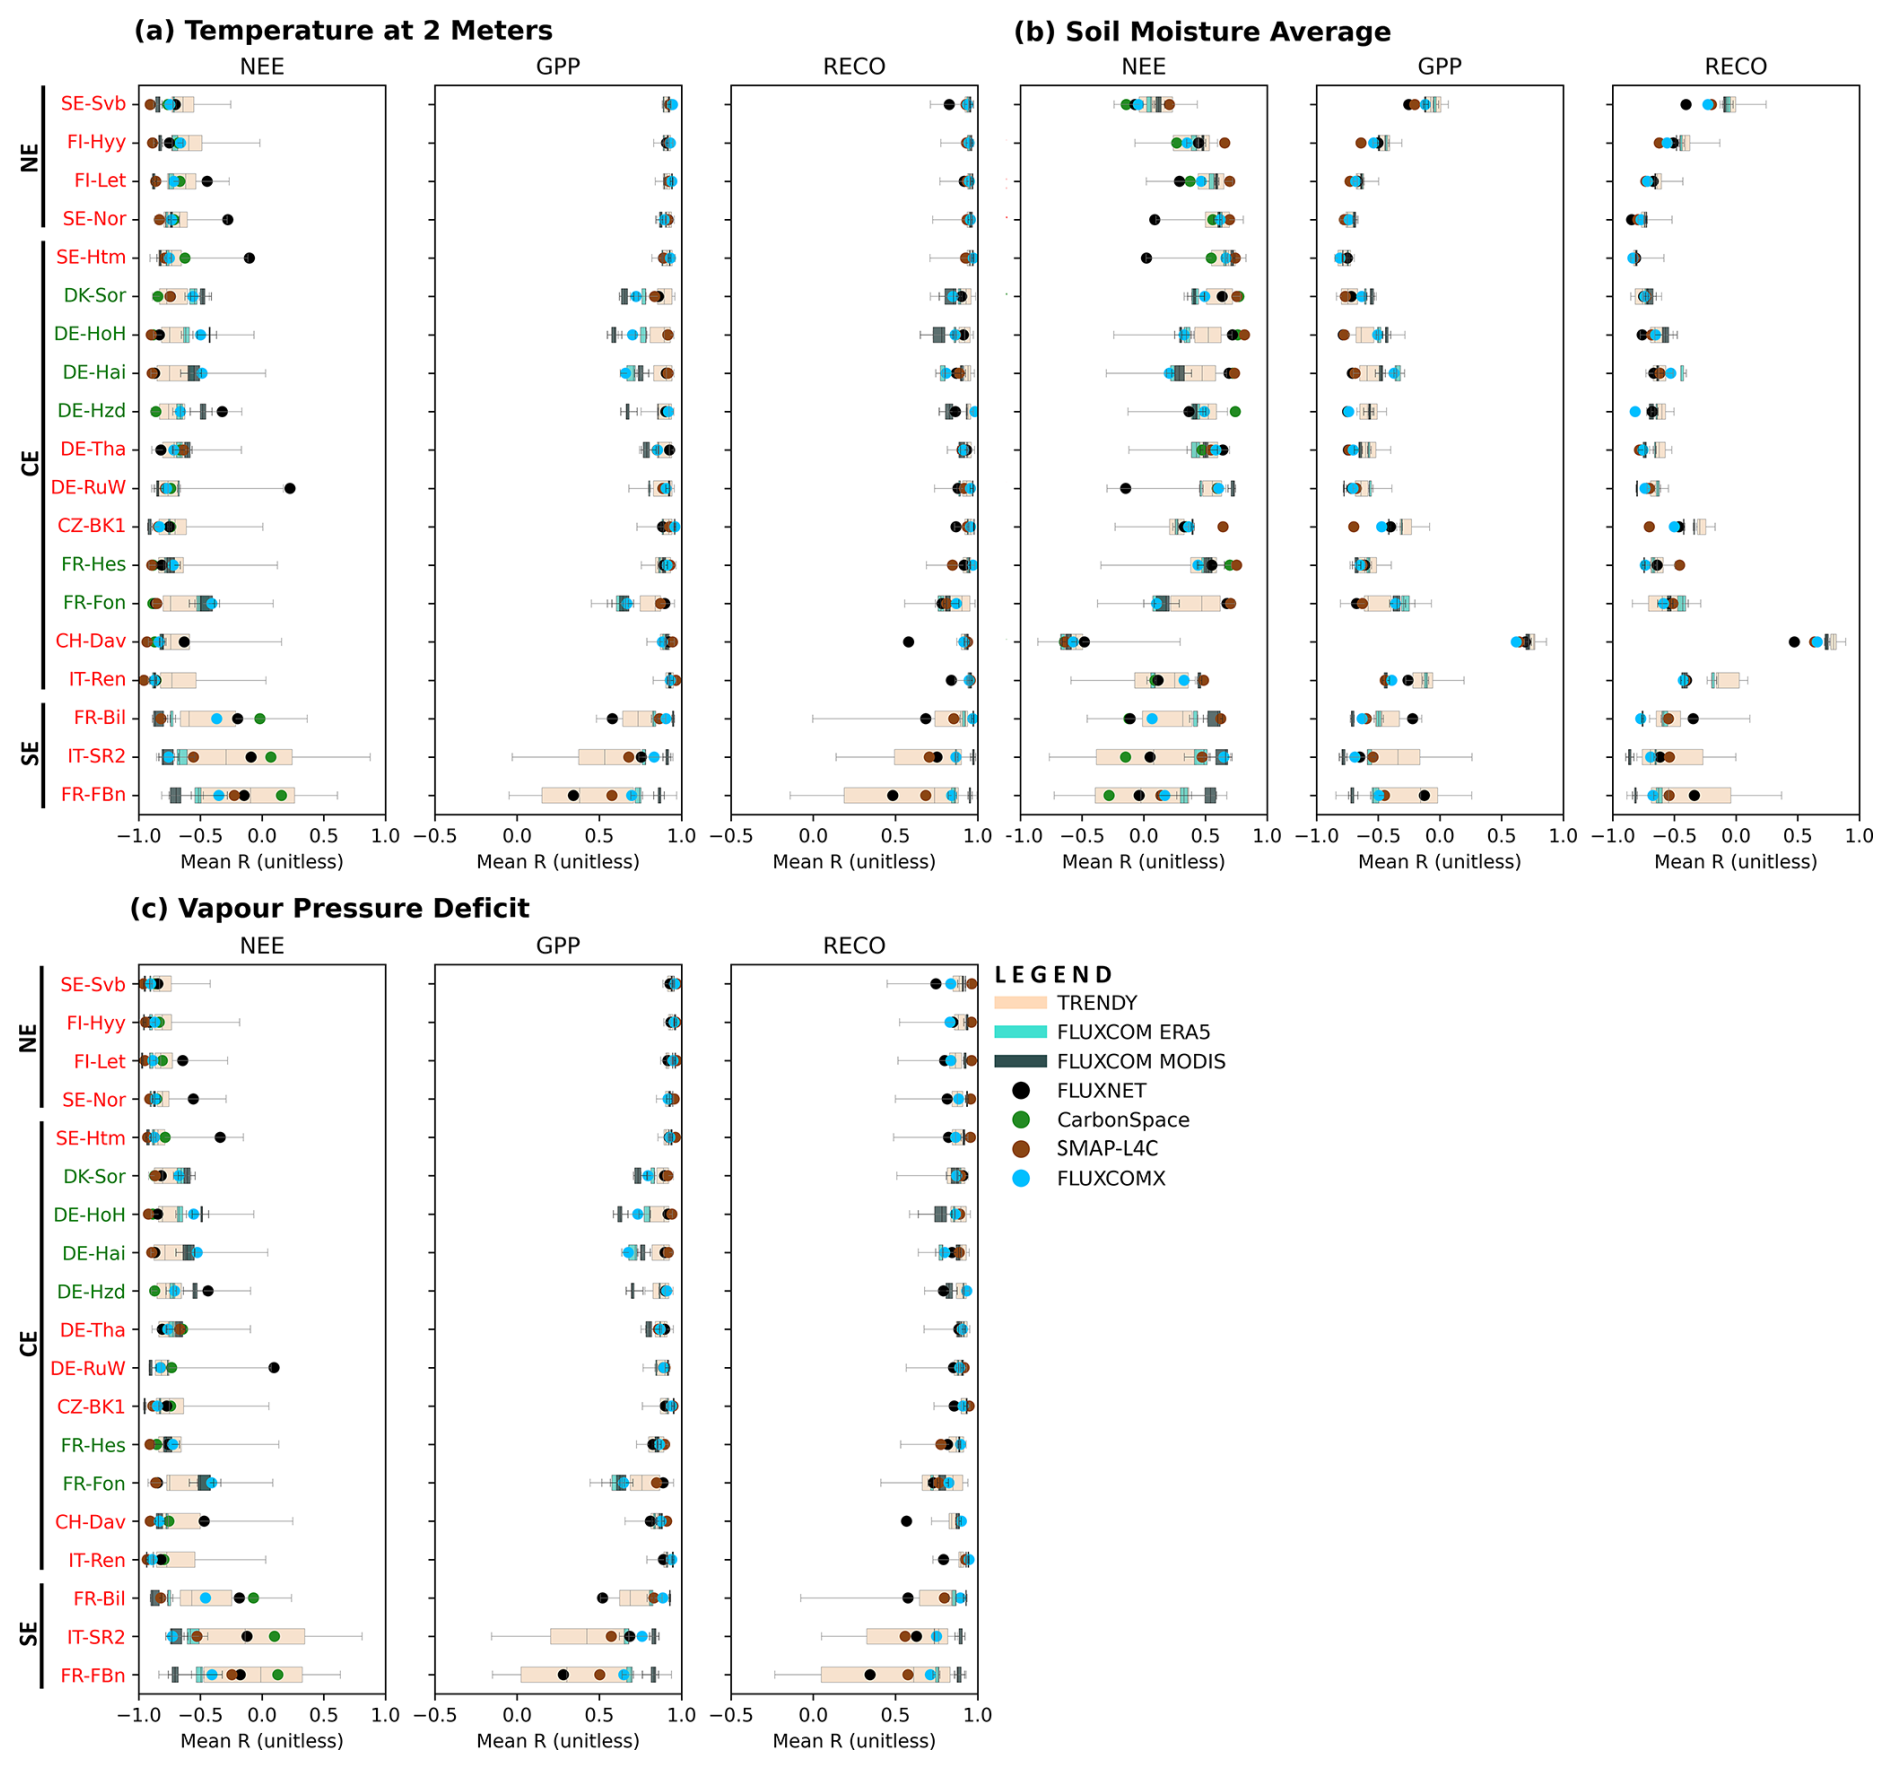
Figure A5Same as Fig. 5 but for the relationship between the annual cycle of CO2 fluxes and (a) 2 m temperature, (b) soil moisture and (c) vapour pressure deficit. This relationship is evaluated using the Bravais–Pearson correlation. For details, refer to the legend caption of Fig. 8.
Climate parameters from the ERA5-Land are available at https://doi.org/10.24381/cds.e2161bac (Muñoz-Sabater, 2019). CO2 fluxes from the FLUXCOM data-driven model are available at https://doi.org/10.18160/5NZG-JMJE (Nelson et al., 2023) and https://meta.icos-cp.eu/collections/zfwf1Ak2I7OlziGDTX8Xl6_T (Nelson et al., 2024). Those from the TRENDY and SMAP-L4C process-based models are available upon request to Stephen Sitch (s.a.sitch@exeter.ac.uk) and at https://doi.org/10.5067/3K9F0S1Q5J2U (Kimball et al., 2022), respectively.
JC conceived the study. JC, AU and GM collected the data and developed the analysis scripts. GM and JC drafted the first version of the paper. AU and JC drafted the second version. All co-authors contributed to its review.
The contact author has declared that none of the authors has any competing interests.
Publisher’s note: Copernicus Publications remains neutral with regard to jurisdictional claims made in the text, published maps, institutional affiliations, or any other geographical representation in this paper. While Copernicus Publications makes every effort to include appropriate place names, the final responsibility lies with the authors.
This work is funded by the French National Research Agency (ANR-22-CPJ2-0026-01) and is part of the “Laboratoire d'expérimentation forestière du mont Beuvray”, supported by the European Union (EAFRD) and the Région Bourgogne-Franche-Comté, as part of the agricultural European Innovation Partnership (EIP-AGRI). This research utilized data provided by the Integrated Carbon Observation System (ICOS). We gratefully acknowledge the contributions of the principal investigators of the ICOS sites used in this study: Matthias Peichl, Ivan Mammarella, Mika Korkiakoski, Natascha Kljun, Michal Heliasz, Andreas Ibrom, Anke Hildebrandt, Alexander Knohl, Matthias Mauder, Marius Schmidt, Ladislav Šigut, Matthias Cuntz, Daniel Berveiller, Iris Feigenwinter, Leonardo Montagnani, Jean-Christophe Domec, Alessandro Dell'Acqua and Guillaume Simioni. Their dedicated work in collecting long-term observations and ensuring data quality was crucial to the success of this research. We also thank Stephen Sitch and Pierre Friedlingstein for providing access to the TRENDY dataset and the three anonymous reviewers for their constructive comments.
This research has been supported by the Agence Nationale de la Recherche (grant no. ANR-22-CPJ2-0026-01).
This paper was edited by Andrew Feldman and reviewed by three anonymous referees.
Besnard, S., Carvalhais, N., Arain, M. A., Black, A., De Bruin, S., Buchmann, N., Cescatti, A., Chen, J., Clevers, J. G. P. W., Desai, A. R., Gough, C. M., Havrankova, K., Herold, M., Hörtnagl, L., Jung, M., Knohl, A., Kruijt, B., Krupkova, L., Law, B. E., Lindroth, A., Noormets, A., Roupsard, O., Steinbrecher, R., Varlagin, A., Vincke, C., and Reichstein, M.: Quantifying the effect of forest age in annual net forest carbon balance, Environ. Res. Lett., 13, 1–10, https://doi.org/10.1088/1748-9326/AAEAEB, 2018.
Best, M. J., Pryor, M., Clark, D. B., Rooney, G. G., Essery, R. L. H., Ménard, C. B., Edwards, J. M., Hendry, M. A., Porson, A., Gedney, N., Mercado, L. M., Sitch, S., Blyth, E., Boucher, O., Cox, P. M., Grimmond, C. S. B., and Harding, R. J.: The Joint UK Land Environment Simulator (JULES), model description – Part 1: Energy and water fluxes, Geosci. Model Dev., 4, 677–699, https://doi.org/10.5194/gmd-4-677-2011, 2011.
Bondeau, A., Smith, P. C., Zaehle, S., Schaphoff, S., Lucht, W., Cramer, W., Gerten, D., Lotze-campen, H., Müller, C., Reichstein, M., and Smith, B.: Modelling the role of agriculture for the 20th century global terrestrial carbon balance, Glob. Chang. Biol., 13, 679–706, https://doi.org/10.1111/J.1365-2486.2006.01305.X, 2007.
Burba, G.: Atmospheric flux measurements, Adv. Spectrosc. Monit. Atmos., 443–520, https://doi.org/10.1016/B978-0-12-815014-6.00004-X, 2021.
Cai, W. and Prentice, I. C.: Recent trends in gross primary production and their drivers: analysis and modelling at flux-site and global scales, Environ. Res. Lett., 15, 124050, https://doi.org/10.1088/1748-9326/ABC64E, 2020.
Carrara, A., Kowalski, A. S., Neirynck, J., Janssens, I. A., Yuste, J. C., and Ceulemans, R.: Net ecosystem CO2 exchange of mixed forest in Belgium over 5 years, Agr. Forest Meteorol., 119, 209–227, https://doi.org/10.1016/S0168-1923(03)00120-5, 2003.
Carrara, A., Janssens, I. A., Curiel Yuste, J., and Ceulemans, R.: Seasonal changes in photosynthesis, respiration and NEE of a mixed temperate forest, Agr. Forest Meteorol., 126, 15–31, https://doi.org/10.1016/J.AGRFORMET.2004.05.002, 2004.
Chen, T., and Guestrin C.: Xgboost: A scalable tree boosting system, in: Proceedings of the 22nd ACM SIGKDD international conference on knowledge discovery and data mining, 785–794. https://doi.org/10.1145/2939672.2939785, 2016.
Chu, H., Baldocchi, D. D., John, R., Wolf, S., and Reichstein, M.: Fluxes all of the time? A primer on the temporal representativeness of FLUXNET, J. Geophys. Res.-Biogeosci., 122, 289–307, https://doi.org/10.1002/2016JG003576, 2017.
Ciais, P., Reichstein, M., Viovy, N., Granier, A., Ogée, J., Allard, V., Aubinet, M., Buchmann, N., Bernhofer, C., Carrara, A., Chevallier, F., De Noblet, N., Friend, A. D., Friedlingstein, P., Grünwald, T., Heinesch, B., Keronen, P., Knohl, A., Krinner, G., Loustau, D., Manca, G., Matteucci, G., Miglietta, F., Ourcival, J. M., Papale, D., Pilegaard, K., Rambal, S., Seufert, G., Soussana, J. F., Sanz, M. J., Schulze, E. D., Vesala, T., and Valentini, R.: Europe-wide reduction in primary productivity caused by the heat and drought in 2003, Nature, 437, 529–533, https://doi.org/10.1038/nature03972, 2005.
Clark, D. B., Mercado, L. M., Sitch, S., Jones, C. D., Gedney, N., Best, M. J., Pryor, M., Rooney, G. G., Essery, R. L. H., Blyth, E., Boucher, O., Harding, R. J., Huntingford, C., and Cox, P. M.: The Joint UK Land Environment Simulator (JULES), model description – Part 2: Carbon fluxes and vegetation dynamics, Geosci. Model Dev., 4, 701–722, https://doi.org/10.5194/gmd-4-701-2011, 2011.
Curtis, P. S. and Gough, C. M.: Forest aging, disturbance and the carbon cycle, New Phytol., 219, 1188–1193, https://doi.org/10.1111/NPH.15227, 2018.
Delire, C., Séférian, R., Decharme, B., Alkama, R., Calvet, J. C., Carrer, D., Gibelin, A. L., Joetzjer, E., Morel, X., Rocher, M., and Tzanos, D.: The Global Land Carbon Cycle Simulated With ISBA-CTRIP: Improvements Over the Last Decade, J. Adv. Model. Earth Syst., 12, e2019MS001886, https://doi.org/10.1029/2019MS001886, 2020.
Delpierre, N., Soudani, K., François, C., Köstner, B., Pontailler, J. Y., Nikinmaa, E., Misson, L., Aubinet, M., Bernhofer, C., Granier, A., Grünwald, T., Heinesch, B., Longdoz, B., Ourcival, J. M., Rambal, S., Vesala, T., and Dufrêne, E.: Exceptional carbon uptake in European forests during the warm spring of 2007: a data–model analysis, Glob. Chang. Biol., 15, 1455–1474, https://doi.org/10.1111/J.1365-2486.2008.01835.X, 2009.
Endsley, K. A., Kimball, J. S., Kundig, T., Reichle, R. H., and Ardizzone, J. V: Validation Assessment for the Soil Moisture Active Passive (SMAP) Level 4 Carbon (L4_C) Data Product Version 7, 52 pp., https://gmao.gsfc.nasa.gov/pubs/docs/Endsley1486.pdf (last access: 24 September 2023), 2023.
Friedlingstein, P., Cox, P., Betts, R., Bopp, L., von Bloh, W., Brovkin, V., Cadule, P., Doney, S., Eby, M., Fung, I., Bala, G., John, J., Jones, C., Joos, F., Kato, T., Kawamiya, M., Knorr, W., Lindsay, K., Matthews, H. D., Raddatz, T., Rayner, P., Reick, C., Roeckner, E., Schnitzler, K. G., Schnur, R., Strassmann, K., Weaver, A. J., Yoshikawa, C., and Zeng, N.: Climate–Carbon Cycle Feedback Analysis: Results from the C4MIP Model Intercomparison, J. Climate, 19, 3337–3353, https://doi.org/10.1175/JCLI3800.1, 2006.
Friedlingstein, P., O'Sullivan, M., Jones, M. W., Andrew, R. M., Bakker, D. C. E., Hauck, J., Landschützer, P., Le Quéré, C., Luijkx, I. T., Peters, G. P., Peters, W., Pongratz, J., Schwingshackl, C., Sitch, S., Canadell, J. G., Ciais, P., Jackson, R. B., Alin, S. R., Anthoni, P., Barbero, L., Bates, N. R., Becker, M., Bellouin, N., Decharme, B., Bopp, L., Brasika, I. B. M., Cadule, P., Chamberlain, M. A., Chandra, N., Chau, T.-T.-T., Chevallier, F., Chini, L. P., Cronin, M., Dou, X., Enyo, K., Evans, W., Falk, S., Feely, R. A., Feng, L., Ford, D. J., Gasser, T., Ghattas, J., Gkritzalis, T., Grassi, G., Gregor, L., Gruber, N., Gürses, Ö., Harris, I., Hefner, M., Heinke, J., Houghton, R. A., Hurtt, G. C., Iida, Y., Ilyina, T., Jacobson, A. R., Jain, A., Jarníková, T., Jersild, A., Jiang, F., Jin, Z., Joos, F., Kato, E., Keeling, R. F., Kennedy, D., Klein Goldewijk, K., Knauer, J., Korsbakken, J. I., Körtzinger, A., Lan, X., Lefèvre, N., Li, H., Liu, J., Liu, Z., Ma, L., Marland, G., Mayot, N., McGuire, P. C., McKinley, G. A., Meyer, G., Morgan, E. J., Munro, D. R., Nakaoka, S.-I., Niwa, Y., O'Brien, K. M., Olsen, A., Omar, A. M., Ono, T., Paulsen, M., Pierrot, D., Pocock, K., Poulter, B., Powis, C. M., Rehder, G., Resplandy, L., Robertson, E., Rödenbeck, C., Rosan, T. M., Schwinger, J., Séférian, R., Smallman, T. L., Smith, S. M., Sospedra-Alfonso, R., Sun, Q., Sutton, A. J., Sweeney, C., Takao, S., Tans, P. P., Tian, H., Tilbrook, B., Tsujino, H., Tubiello, F., van der Werf, G. R., van Ooijen, E., Wanninkhof, R., Watanabe, M., Wimart-Rousseau, C., Yang, D., Yang, X., Yuan, W., Yue, X., Zaehle, S., Zeng, J., and Zheng, B.: Global Carbon Budget 2023, Earth Syst. Sci. Data, 15, 5301–5369, https://doi.org/10.5194/essd-15-5301-2023, 2023.
Gerten, D., Schaphoff, S., Haberlandt, U., Lucht, W., and Sitch, S.: Terrestrial vegetation and water balance – hydrological evaluation of a dynamic global vegetation model, J. Hydrol., 286, 249–270, https://doi.org/10.1016/J.JHYDROL.2003.09.029, 2004.
Göckede, M., Foken, T., Aubinet, M., Aurela, M., Banza, J., Bernhofer, C., Bonnefond, J. M., Brunet, Y., Carrara, A., Clement, R., Dellwik, E., Elbers, J., Eugster, W., Fuhrer, J., Granier, A., Grünwald, T., Heinesch, B., Janssens, I. A., Knohl, A., Koeble, R., Laurila, T., Longdoz, B., Manca, G., Marek, M., Markkanen, T., Mateus, J., Matteucci, G., Mauder, M., Migliavacca, M., Minerbi, S., Moncrieff, J., Montagnani, L., Moors, E., Ourcival, J.-M., Papale, D., Pereira, J., Pilegaard, K., Pita, G., Rambal, S., Rebmann, C., Rodrigues, A., Rotenberg, E., Sanz, M. J., Sedlak, P., Seufert, G., Siebicke, L., Soussana, J. F., Valentini, R., Vesala, T., Verbeeck, H., and Yakir, D.: Quality control of CarboEurope flux data – Part 1: Coupling footprint analyses with flux data quality assessment to evaluate sites in forest ecosystems, Biogeosciences, 5, 433–450, https://doi.org/10.5194/bg-5-433-2008, 2008.
Golaz, J. C., Caldwell, P. M., Van Roekel, L. P., Petersen, M. R., Tang, Q., Wolfe, J. D., Abeshu, G., Anantharaj, V., Asay-Davis, X. S., Bader, D. C., Baldwin, S. A., Bisht, G., Bogenschutz, P. A., Branstetter, M., Brunke, M. A., Brus, S. R., Burrows, S. M., Cameron-Smith, P. J., Donahue, A. S., Deakin, M., Easter, R. C., Evans, K. J., Feng, Y., Flanner, M., Foucar, J. G., Fyke, J. G., Griffin, B. M., Hannay, C., Harrop, B. E., Hoffman, M. J., Hunke, E. C., Jacob, R. L., Jacobsen, D. W., Jeffery, N., Jones, P. W., Keen, N. D., Klein, S. A., Larson, V. E., Leung, L. R., Li, H. Y., Lin, W., Lipscomb, W. H., Ma, P. L., Mahajan, S., Maltrud, M. E., Mametjanov, A., McClean, J. L., McCoy, R. B., Neale, R. B., Price, S. F., Qian, Y., Rasch, P. J., Reeves Eyre, J. E. J., Riley, W. J., Ringler, T. D., Roberts, A. F., Roesler, E. L., Salinger, A. G., Shaheen, Z., Shi, X., Singh, B., Tang, J., Taylor, M. A., Thornton, P. E., Turner, A. K., Veneziani, M., Wan, H., Wang, H., Wang, S., Williams, D. N., Wolfram, P. J., Worley, P. H., Xie, S., Yang, Y., Yoon, J. H., Zelinka, M. D., Zender, C. S., Zeng, X., Zhang, C., Zhang, K., Zhang, Y., Zheng, X., Zhou, T., and Zhu, Q.: The DOE E3SM Coupled Model Version 1: Overview and Evaluation at Standard Resolution, J. Adv. Model. Earth Syst., 11, 2089–2129, https://doi.org/10.1029/2018MS001603, 2019.
Hardouin, L., Delire, C., Decharme, B., Lawrence, D. M., Nabel, J. E. M. S., Brovkin, V., Collier, N., Fisher, R., Hoffman, F. M., Koven, C. D., Séférian, R., and Stacke, T.: Uncertainty in land carbon budget simulated by terrestrial biosphere models: the role of atmospheric forcing, Environ. Res. Lett., 17, 094033, https://doi.org/10.1088/1748-9326/AC888D, 2022.
Haszpra, L., Barcza, Z., Davis, K. J., and Tarczay, K.: Long-term tall tower carbon dioxide flux monitoring over an area of mixed vegetation, Agr. Forest Meteorol., 132, 58–77, https://doi.org/10.1016/J.AGRFORMET.2005.07.002, 2005.
Haverd, V., Smith, B., Nieradzik, L., Briggs, P. R., Woodgate, W., Trudinger, C. M., Canadell, J. G., and Cuntz, M.: A new version of the CABLE land surface model (Subversion revision r4601) incorporating land use and land cover change, woody vegetation demography, and a novel optimisation-based approach to plant coordination of photosynthesis, Geosci. Model Dev., 11, 2995–3026, https://doi.org/10.5194/gmd-11-2995-2018, 2018.
He, B., Chen, C., Lin, S., Yuan, W., Chen, H. W., Chen, D., Zhang, Y., Guo, L., Zhao, X., Liu, X., Piao, S., Zhong, Z., Wang, R., and Tang, R.: Worldwide impacts of atmospheric vapor pressure deficit on the interannual variability of terrestrial carbon sinks, Natl. Sci. Rev., 9, nwab150, https://doi.org/10.1093/NSR/NWAB150, 2022.
Hersbach, H., Bell, B., Berrisford, P., Hirahara, S., Horányi, A., Muñoz-Sabater, J., Nicolas, J., Peubey, C., Radu, R., Schepers, D., Simmons, A., Soci, C., Abdalla, S., Abellan, X., Balsamo, G., Bechtold, P., Biavati, G., Bidlot, J., Bonavita, M., De Chiara, G., Dahlgren, P., Dee, D., Diamantakis, M., Dragani, R., Flemming, J., Forbes, R., Fuentes, M., Geer, A., Haimberger, L., Healy, S., Hogan, R. J., Hólm, E., Janisková, M., Keeley, S., Laloyaux, P., Lopez, P., Lupu, C., Radnoti, G., de Rosnay, P., Rozum, I., Vamborg, F., Villaume, S., and Thépaut, J. N.: The ERA5 global reanalysis, Q. J. Roy. Meteorol. Soc., 146, 1999–2049, https://doi.org/10.1002/QJ.3803, 2020.
Jinxun, L., Xuehe, L., Qiuan, Z., Wenping, Y., Quanzhi, Y., Zhen, Z., Qingxi, G., Carol, D., Jinxun, L., Xuehe, L., Qiuan, Z., Wenping, Y., Quanzhi, Y., Zhen, Z., Qingxi, G., and Carol, D.: Terrestrial Ecosystem Modeling with IBIS: Progress and Future Vision, J. Resour. Ecol., 13, 2–16, https://doi.org/10.5814/J.ISSN.1674-764X.2022.01.001, 2022.
Jones, L. A., Kimball, J. S., Reichle, R. H., Madani, N., Glassy, J., Ardizzone, J. V., Colliander, A., Cleverly, J., Desai, A. R., Eamus, D., Euskirchen, E. S., Hutley, L., Macfarlane, C., and Scott, R. L.: The SMAP Level 4 Carbon Product for Monitoring Ecosystem Land-Atmosphere CO2 Exchange, IEEE Trans. Geosci. Remote Sens., 55, 6517–6532, https://doi.org/10.1109/TGRS.2017.2729343, 2017.
Jung, M., Koirala, S., Weber, U., Ichii, K., Gans, F., Camps-Valls, G., Papale, D., Schwalm, C., Tramontana, G., and Reichstein, M.: The FLUXCOM ensemble of global land-atmosphere energy fluxes, Sci. Data, 6, 1–14, https://doi.org/10.1038/s41597-019-0076-8, 2019.
Jung, M., Schwalm, C., Migliavacca, M., Walther, S., Camps-Valls, G., Koirala, S., Anthoni, P., Besnard, S., Bodesheim, P., Carvalhais, N., Chevallier, F., Gans, F., Goll, D. S., Haverd, V., Köhler, P., Ichii, K., Jain, A. K., Liu, J., Lombardozzi, D., Nabel, J. E. M. S., Nelson, J. A., O'Sullivan, M., Pallandt, M., Papale, D., Peters, W., Pongratz, J., Rödenbeck, C., Sitch, S., Tramontana, G., Walker, A., Weber, U., and Reichstein, M.: Scaling carbon fluxes from eddy covariance sites to globe: synthesis and evaluation of the FLUXCOM approach, Biogeosciences, 17, 1343–1365, https://doi.org/10.5194/bg-17-1343-2020, 2020.
Kimball, J. S., Endsley, K. A., Jones, L. A., Kundig, T., and Reichle, R.: SMAP L4 Global Daily 9 km EASE-Grid Carbon Net Ecosystem Exchange, Version 7 | National Snow and Ice Data Center, https://doi.org/10.5067/3K9F0S1Q5J2U, 2022.
Kimball, J. S., Endsley, A., Jones, L. A., Kundig, T., and Reichle, R.: SMAP L4 Global Daily 9 km EASE-Grid Carbon Net Ecosystem Exchange, (SPL4CMDL, Version 7), Boulder, Colorado USA, NASA National Snow and Ice Data Center Distributed Active Archive Center [data set], https://doi.org/10.5067/3K9F0S1Q5J2U, 2022.
Kong, Z., Wang, T., Han, Q., Dai, Y., Wang, L., and Chen, X.: Evaluation of Environmental Controls on Terrestrial Net Ecosystem Exchange of CO2: A Global Perspective From the FLUXNET Sites, J. Geophys. Res.-Atmos., 127, e2022JD037217, https://doi.org/10.1029/2022JD037217, 2022.
Krinner, G., Viovy, N., de Noblet-Ducoudré, N., Ogée, J., Polcher, J., Friedlingstein, P., Ciais, P., Sitch, S., and Prentice, I. C.: A dynamic global vegetation model for studies of the coupled atmosphere-biosphere system, Global Biogeochem. Cy., 19, 1–33, https://doi.org/10.1029/2003GB002199, 2005.
Kurbatova, J., Li, C., Varlagin, A., Xiao, X., and Vygodskaya, N.: Modeling carbon dynamics in two adjacent spruce forests with different soil conditions in Russia, Biogeosciences, 5, 969–980, https://doi.org/10.5194/bg-5-969-2008, 2008.
Lasslop, G., Reichstein, M., Papale, D., Richardson, A., Arneth, A., Barr, A., Stoy, P., and Wohlfahrt, G.: Separation of net ecosystem exchange into assimilation and respiration using a light response curve approach: critical issues and global evaluation, Glob. Chang. Biol., 16, 187–208, https://doi.org/10.1111/J.1365-2486.2009.02041.X, 2010.
Lawrence, D. M., Fisher, R. A., Koven, C. D., Oleson, K. W., Swenson, S. C., Bonan, G., Collier, N., Ghimire, B., van Kampenhout, L., Kennedy, D., Kluzek, E., Lawrence, P. J., Li, F., Li, H., Lombardozzi, D., Riley, W. J., Sacks, W. J., Shi, M., Vertenstein, M., Wieder, W. R., Xu, C., Ali, A. A., Badger, A. M., Bisht, G., van den Broeke, M., Brunke, M. A., Burns, S. P., Buzan, J., Clark, M., Craig, A., Dahlin, K., Drewniak, B., Fisher, J. B., Flanner, M., Fox, A. M., Gentine, P., Hoffman, F., Keppel-Aleks, G., Knox, R., Kumar, S., Lenaerts, J., Leung, L. R., Lipscomb, W. H., Lu, Y., Pandey, A., Pelletier, J. D., Perket, J., Randerson, J. T., Ricciuto, D. M., Sanderson, B. M., Slater, A., Subin, Z. M., Tang, J., Thomas, R. Q., Val Martin, M., and Zeng, X.: The Community Land Model Version 5: Description of New Features, Benchmarking, and Impact of Forcing Uncertainty, J. Adv. Model. Earth Syst., 11, 4245–4287, https://doi.org/10.1029/2018MS001583, 2019.
Le Quéré, C., Andrew, R. M., Friedlingstein, P., Sitch, S., Pongratz, J., Manning, A. C., Korsbakken, J. I., Peters, G. P., Canadell, J. G., Jackson, R. B., Boden, T. A., Tans, P. P., Andrews, O. D., Arora, V. K., Bakker, D. C. E., Barbero, L., Becker, M., Betts, R. A., Bopp, L., Chevallier, F., Chini, L. P., Ciais, P., Cosca, C. E., Cross, J., Currie, K., Gasser, T., Harris, I., Hauck, J., Haverd, V., Houghton, R. A., Hunt, C. W., Hurtt, G., Ilyina, T., Jain, A. K., Kato, E., Kautz, M., Keeling, R. F., Klein Goldewijk, K., Körtzinger, A., Landschützer, P., Lefèvre, N., Lenton, A., Lienert, S., Lima, I., Lombardozzi, D., Metzl, N., Millero, F., Monteiro, P. M. S., Munro, D. R., Nabel, J. E. M. S., Nakaoka, S., Nojiri, Y., Padin, X. A., Peregon, A., Pfeil, B., Pierrot, D., Poulter, B., Rehder, G., Reimer, J., Rödenbeck, C., Schwinger, J., Séférian, R., Skjelvan, I., Stocker, B. D., Tian, H., Tilbrook, B., Tubiello, F. N., van der Laan-Luijkx, I. T., van der Werf, G. R., van Heuven, S., Viovy, N., Vuichard, N., Walker, A. P., Watson, A. J., Wiltshire, A. J., Zaehle, S., and Zhu, D.: Global Carbon Budget 2017, Earth Syst. Sci. Data, 10, 405–448, https://doi.org/10.5194/essd-10-405-2018, 2018.
Li, Q., Tietema, A., Reinsch, S., Schmidt, I. K., de Dato, G., Guidolotti, G., Lellei-Kovács, E., Kopittke, G., and Larsen, K. S.: Higher sensitivity of gross primary productivity than ecosystem respiration to experimental drought and warming across six European shrubland ecosystems, Sci. Total Environ., 900, 165627, https://doi.org/10.1016/j.scitotenv.2023.165627, 2023.
Lienert, S. and Joos, F.: A Bayesian ensemble data assimilation to constrain model parameters and land-use carbon emissions, Biogeosciences, 15, 2909–2930, https://doi.org/10.5194/bg-15-2909-2018, 2018.
Lin, S., Hu, Z., Wang, Y., Chen, X., He, B., Song, Z., Sun, S., Wu, C., Zheng, Y., Xia, X., Liu, L., Tang, J., Sun, Q., Joos, F., and Yuan, W.: Underestimated Interannual Variability of Terrestrial Vegetation Production by Terrestrial Ecosystem Models, Global Biogeochem. Cy., 37, e2023GB007696, https://doi.org/10.1029/2023GB007696, 2023.
Lindeskog, M., Smith, B., Lagergren, F., Sycheva, E., Ficko, A., Pretzsch, H., and Rammig, A.: Accounting for forest management in the estimation of forest carbon balance using the dynamic vegetation model LPJ-GUESS (v4.0, r9710): implementation and evaluation of simulations for Europe, Geosci. Model Dev., 14, 6071–6112, https://doi.org/10.5194/gmd-14-6071-2021, 2021.
Longo, M., Knox, R. G., Medvigy, D. M., Levine, N. M., Dietze, M. C., Kim, Y., Swann, A. L. S., Zhang, K., Rollinson, C. R., Bras, R. L., Wofsy, S. C., and Moorcroft, P. R.: The biophysics, ecology, and biogeochemistry of functionally diverse, vertically and horizontally heterogeneous ecosystems: the Ecosystem Demography model, version 2.2 – Part 1: Model description, Geosci. Model Dev., 12, 4309–4346, https://doi.org/10.5194/gmd-12-4309-2019, 2019.
Madani, N., Kimball, J. S., Jones, L. A., Parazoo, N. C., and Guan, K.: Global Analysis of Bioclimatic Controls on Ecosystem Productivity Using Satellite Observations of Solar-Induced Chlorophyll Fluorescence, Remote Sens., 9, 530, https://doi.org/10.3390/RS9060530, 2017.
Martinez del Castillo, E., Zang, C. S., Buras, A., Hacket-Pain, A., Esper, J., Serrano-Notivoli, R., Hartl, C., Weigel, R., Klesse, S., Resco de Dios, V., Scharnweber, T., Dorado-Liñán, I., van der Maaten-Theunissen, M., van der Maaten, E., Jump, A., Mikac, S., Banzragch, B. E., Beck, W., Cavin, L., Claessens, H., Čada, V., Čufar, K., Dulamsuren, C., Gričar, J., Gil-Pelegrín, E., Janda, P., Kazimirovic, M., Kreyling, J., Latte, N., Leuschner, C., Longares, L. A., Menzel, A., Merela, M., Motta, R., Muffler, L., Nola, P., Petritan, A. M., Petritan, I. C., Prislan, P., Rubio-Cuadrado, Á., Rydval, M., Stajić, B., Svoboda, M., Toromani, E., Trotsiuk, V., Wilmking, M., Zlatanov, T., and de Luis, M.: Climate-change-driven growth decline of European beech forests, Commun. Biol., 51, 1–9, https://doi.org/10.1038/s42003-022-03107-3, 2022.
Messori, G., Ruiz-Pérez, G., Manzoni, S., and Vico, G.: Climate drivers of the terrestrial carbon cycle variability in Europe, Environ. Res. Lett., 14, 063001, https://doi.org/10.1088/1748-9326/AB1AC0, 2019.
Monteith, J. and Unsworth, M.: Principles of Environmental Physics – 3rd Edition, Academic Press, 440 pp., ISBN 9780080976150, 2007.
Muñoz Sabater, J.: ERA5-Land hourly data from 1950 to present, Copernicus Climate Change Service (C3S) Climate Data Store (CDS) [data set], https://doi.org/10.24381/cds.e2161bac, 2019.
Muñoz-Sabater, J., Dutra, E., Agustí-Panareda, A., Albergel, C., Arduini, G., Balsamo, G., Boussetta, S., Choulga, M., Harrigan, S., Hersbach, H., Martens, B., Miralles, D. G., Piles, M., Rodríguez-Fernández, N. J., Zsoter, E., Buontempo, C., and Thépaut, J.-N.: ERA5-Land: a state-of-the-art global reanalysis dataset for land applications, Earth Syst. Sci. Data, 13, 4349–4383, https://doi.org/10.5194/essd-13-4349-2021, 2021.
Nelson, J. A., Walther, S., Jung, M., Gans, F., Kraft, B., Weber, U., Hamdi, Z., Duveiller, G., Zhang, W.: FLUXCOM-X-BASE: Global CO2 and water flux products from the FLUXCOM-X framework, Max Planck Institute for Biogeochemistry [data set], https://doi.org/10.18160/5NZG-JMJE, 2023.
Nelson, J. A., Walther, S., Gans, F., Kraft, B., Weber, U., Novick, K., Buchmann, N., Migliavacca, M., Wohlfahrt, G., Šigut, L., Ibrom, A., Papale, D., Göckede, M., Duveiller, G., Knohl, A., Hörtnagl, L., Scott, R. L., Dušek, J., Zhang, W., Hamdi, Z. M., Reichstein, M., Aranda-Barranco, S., Ardö, J., Op de Beeck, M., Billesbach, D., Bowling, D., Bracho, R., Brümmer, C., Camps-Valls, G., Chen, S., Cleverly, J. R., Desai, A., Dong, G., El-Madany, T. S., Euskirchen, E. S., Feigenwinter, I., Galvagno, M., Gerosa, G. A., Gielen, B., Goded, I., Goslee, S., Gough, C. M., Heinesch, B., Ichii, K., Jackowicz-Korczynski, M. A., Klosterhalfen, A., Knox, S., Kobayashi, H., Kohonen, K.-M., Korkiakoski, M., Mammarella, I., Gharun, M., Marzuoli, R., Matamala, R., Metzger, S., Montagnani, L., Nicolini, G., O'Halloran, T., Ourcival, J.-M., Peichl, M., Pendall, E., Ruiz Reverter, B., Roland, M., Sabbatini, S., Sachs, T., Schmidt, M., Schwalm, C. R., Shekhar, A., Silberstein, R., Silveira, M. L., Spano, D., Tagesson, T., Tramontana, G., Trotta, C., Turco, F., Vesala, T., Vincke, C., Vitale, D., Vivoni, E. R., Wang, Y., Woodgate, W., Yepez, E. A., Zhang, J., Zona, D., and Jung, M.: X-BASE: the first terrestrial carbon and water flux products from an extended data-driven scaling framework, FLUXCOM-X, Biogeosciences, 21, 5079–5115, https://doi.org/10.5194/bg-21-5079-2024, 2024 (data available at: https://meta.icos-cp.eu/collections/zfwf1Ak2I7OlziGDTX8Xl6_T, last access: 24 September 2024).
Pan, Y., Birdsey, R. A., Phillips, O. L., Houghton, R. A., Fang, J., Kauppi, P. E., Keith, H., Kurz, W. A., Ito, A., Lewis, S. L., Nabuurs, G.-J., Shvidenko, A., Hashimoto, S., Lerink, B., Schepaschenko, D., Castanho, A., and Murdiyarso, D.: The enduring world forest carbon sink, Nature, 631, 563–569, https://doi.org/10.1038/s41586-024-07602-x, 2024.
Pastorello, G., Trotta, C., Canfora, E., Chu, H., Christianson, D., Cheah, Y. W., Poindexter, C., Chen, J., Elbashandy, A., Humphrey, M., Isaac, P., Polidori, D., Ribeca, A., van Ingen, C., Zhang, L., Amiro, B., Ammann, C., Arain, M. A., Ardö, J., Arkebauer, T., Arndt, S. K., Arriga, N., Aubinet, M., Aurela, M., Baldocchi, D., Barr, A., Beamesderfer, E., Marchesini, L. B., Bergeron, O., Beringer, J., Bernhofer, C., Berveiller, D., Billesbach, D., Black, T. A., Blanken, P. D., Bohrer, G., Boike, J., Bolstad, P. V., Bonal, D., Bonnefond, J. M., Bowling, D. R., Bracho, R., Brodeur, J., Brümmer, C., Buchmann, N., Burban, B., Burns, S. P., Buysse, P., Cale, P., Cavagna, M., Cellier, P., Chen, S., Chini, I., Christensen, T. R., Cleverly, J., Collalti, A., Consalvo, C., Cook, B. D., Cook, D., Coursolle, C., Cremonese, E., Curtis, P. S., D'Andrea, E., da Rocha, H., Dai, X., Davis, K. J., De Cinti, B., de Grandcourt, A., De Ligne, A., De Oliveira, R. C., Delpierre, N., Desai, A. R., Di Bella, C. M., di Tommasi, P., Dolman, H., Domingo, F., Dong, G., Dore, S., Duce, P., Dufrêne, E., Dunn, A., Dušek, J., Eamus, D., Eichelmann, U., ElKhidir, H. A. M., Eugster, W., Ewenz, C. M., Ewers, B., Famulari, D., Fares, S., Feigenwinter, I., Feitz, A., Fensholt, R., Filippa, G., Fischer, M., Frank, J., Galvagno, M., Gharun, M., Gianelle, D., et al.: The FLUXNET2015 dataset and the ONEFlux processing pipeline for eddy covariance data, Sci. Data, 71, 1–27, https://doi.org/10.1038/s41597-020-0534-3, 2020.
Piao, S., Ciais, P., Friedlingstein, P., De Noblet-Ducoudré, N., Cadule, P., Viovy, N., and Wang, T.: Spatiotemporal patterns of terrestrial carbon cycle during the 20th century, Global Biogeochem. Cy., 23, 1–16, https://doi.org/10.1029/2008GB003339, 2009.
Prentice, I. C., Farquhar, G. D., Fasham, M. J. R., Goulden, M. L., Heimann, M., Jaramillo, V. J., Kheshgi, H. S., Le Quéré, C., Scholes, R. J., Contributing, D. W. R. W., Archer, D., Ashmore, M. R., Aumont, O., Baker, D., Battle, M., Bender, M., Bopp, L. P., Bousquet, P., Caldeira, K., Ciais, P., Cox, P. M., Cramer, W., Dentener, F., Enting, I. G., Field, C. B., Friedlingstein, P., Holland, E. A., Houghton, R. A., House, J. I., Ishida, A., Jain, A. K., Janssens, I. A., Joos, F., Kaminski, T., Keeling, C. D., Keeling, R. F., Kicklighter, D. W., Kohfeld, K. E., Knorr, W., Law, R., Lenton, T., Lindsay, K., Maier-Reimer, E., Manning, A. C., Matear, R. J., Mcguire, A. D., Melillo, J. M., Meyer, R., Mund, M., Orr, J. C., Piper, S., Plattner, K., Rayner, P. J., Sitch, S., Slater, R., Taguchi, S., Tans, P. P., Tian, H. Q., Weirig, M. F., Whorf, T., Review, A. Y., Pitelka, E. L., and Rojas, A. R.: The Carbon Cycle and Atmospheric Carbon Dioxide, in Climate Change 2001: The Scientific Basis. Contribution of Working Group I to the Third Assessment Report of the Intergovernmental Panel on Climate Change, 183–237 pp., https://www.ipcc.ch/report/ar3/wg1/ (last access: 6 March 2024), 2001.
Pugh, T. A. M., Lindeskog, M., Smith, B., Poulter, B., Arneth, A., Haverd, V., and Calle, L.: Role of forest regrowth in global carbon sink dynamics, P. Natl. Acad. Sci. USA, 116, 4382–4387, https://doi.org/10.1073/pnas.1810512116, 2019.
Saunders, M., Tobin, B., Black, K., Gioria, M., Nieuwenhuis, M., and Osborne, B. A.: Thinning effects on the net ecosystem carbon exchange of a Sitka spruce forest are temperature-dependent, Agr. Forest Meteorol., 157, 1–10, https://doi.org/10.1016/J.AGRFORMET.2012.01.008, 2012.
Schimel, D., Stephens, B. B., and Fisher, J. B.: Effect of increasing CO2 on the terrestrial carbon cycle, P. Natl. Acad. Sci. USA, 112, 436–441, https://doi.org/101073/PNAS.1407302112, 2015.
Seddon, A. W. R., Macias-Fauria, M., Long, P. R., Benz, D., and Willis, K. J.: Sensitivity of global terrestrial ecosystems to climate variability, Nat., 531, 229–232, https://doi.org/10.1038/nature16986, 2016.
Seiler, C., Melton, J. R., Arora, V. K., and Wang, L.: CLASSIC v1.0: the open-source community successor to the Canadian Land Surface Scheme (CLASS) and the Canadian Terrestrial Ecosystem Model (CTEM) – Part 2: Global benchmarking, Geosci. Model Dev., 14, 2371–2417, https://doi.org/10.5194/gmd-14-2371-2021, 2021.
Sharma, B., Kumar, J., Collier, N., Ganguly, A. R., and Hoffman, F. M.: Quantifying Carbon Cycle Extremes and Attributing Their Causes Under Climate and Land Use and Land Cover Change From 1850 to 2300, J. Geophys. Res.-Biogeosci., 127, e2021JG006738, https://doi.org/10.1029/2021JG006738, 2022.
Sitch, S., Huntingford, C., Gedney, N., Levy, P. E., Lomas, M., Piao, S. L., Betts, R., Ciais, P., Cox, P., Friedlingstein, P., Jones, C. D., Prentice, I. C., and Woodward, F. I.: Evaluation of the terrestrial carbon cycle, future plant geography and climate-carbon cycle feedbacks using five Dynamic Global Vegetation Models (DGVMs), Global Chang. Biol., 14, 2015–2039, https://doi.org/10.1111/J.1365-2486.2008.01626.X, 2008.
Sitch, S., O'Sullivan, M., Robertson, E., Friedlingstein, P., Albergel, C., Anthoni, P., Arneth, A., Arora, V. K., Bastos, A., Bastrikov, V., Bellouin, N., Canadell, J. G., Chini, L., Ciais, P., Falk, S., Harris, I., Hurtt, G., Ito, A., Jain, A. K., Jones, M. W., Joos, F., Kato, E., Kennedy, D., Klein Goldewijk, K., Kluzek, E., Knauer, J., Lawrence, P. J., Lombardozzi, D., Melton, J. R., Nabel, J. E. M. S., Pan, N., Peylin, P., Pongratz, J., Poulter, B., Rosan, T. M., Sun, Q., Tian, H., Walker, A. P., Weber, U., Yuan, W., Yue, X., and Zaehle, S.: Trends and Drivers of Terrestrial Sources and Sinks of Carbon Dioxide: An Overview of the TRENDY Project, Global Biogeochem. Cy., 38, e2024GB008102, https://doi.org/10.1029/2024GB008102, 2024.
Smith, N. E., Kooijmans, L. M. J., Koren, G., Van Schaik, E., Van Der Woude, A. M., Wanders, N., Ramonet, M., Xueref-Remy, I., Siebicke, L., Manca, G., Brümmer, C., Baker, I. T., Haynes, K. D., Luijkx, I. T., and Peters, W.: Spring enhancement and summer reduction in carbon uptake during the 2018 drought in northwestern Europe, Philos. Trans. R. Soc. B, 375, 1–11, https://doi.org/10.1098/RSTB.2019.0509, 2020.
Tang, X., Li, H., Desai, A. R., Nagy, Z., Luo, J., Kolb, T. E., Olioso, A., Xu, X., Yao, L., Kutsch, W., Pilegaard, K., Köstner, B., and Ammann, C.: How is water-use efficiency of terrestrial ecosystems distributed and changing on Earth?, Sci. Rep., 41, 1–11, https://doi.org/10.1038/srep07483, 2014.
Team, W. W. and Centre, I. E. T.: Warm Winter 2020 ecosystem eddy covariance flux product for 73 stations in FLUXNET-Archive format – release 2022-1 (Version 1.0), ICOS Carbon Portal, https://doi.org/10.18160/2G60-ZHAK, 2022.
Thompson, R. L., Broquet, G., Gerbig, C., Koch, T., Lang, M., Monteil, G., Munassar, S., Nickless, A., Scholze, M., Ramonet, M., Karstens, U., Van Schaik, E., Wu, Z., and Rödenbeck, C.: Changes in net ecosystem exchange over Europe during the 2018 drought based on atmospheric observations, Philos. Trans. R. Soc. B, 375, 1–10, https://doi.org/10.1098/RSTB.2019.0512, 2020.
Tian, H., Lu, C., Ciais, P., Michalak, A. M., Canadell, J. G., Saikawa, E., Huntzinger, D. N., Gurney, K. R., Sitch, S., Zhang, B., Yang, J., Bousquet, P., Bruhwiler, L., Chen, G., Dlugokencky, E., Friedlingstein, P., Melillo, J., Pan, S., Poulter, B., Prinn, R., Saunois, M., Schwalm, C. R., and Wofsy, S. C.: The terrestrial biosphere as a net source of greenhouse gases to the atmosphere, Nature, 531, 225–228, https://doi.org/10.1038/nature16946, 2016.
Tramontana, G., Jung, M., Schwalm, C. R., Ichii, K., Camps-Valls, G., Ráduly, B., Reichstein, M., Arain, M. A., Cescatti, A., Kiely, G., Merbold, L., Serrano-Ortiz, P., Sickert, S., Wolf, S., and Papale, D.: Predicting carbon dioxide and energy fluxes across global FLUXNET sites with regression algorithms, Biogeosciences, 13, 4291–4313, https://doi.org/10.5194/bg-13-4291-2016, 2016.
van der Woude, A. M., Peters, W., Joetzjer, E., Lafont, S., Koren, G., Ciais, P., Ramonet, M., Xu, Y., Bastos, A., Botía, S., Sitch, S., de Kok, R., Kneuer, T., Kubistin, D., Jacotot, A., Loubet, B., Herig-Coimbra, P. H., Loustau, D., and Luijkx, I. T.: Temperature extremes of 2022 reduced carbon uptake by forests in Europe, Nat. Commun., 14, 1–11, https://doi.org/10.1038/s41467-023-41851-0, 2023.
von Buttlar, J., Zscheischler, J., Rammig, A., Sippel, S., Reichstein, M., Knohl, A., Jung, M., Menzer, O., Arain, M. A., Buchmann, N., Cescatti, A., Gianelle, D., Kiely, G., Law, B. E., Magliulo, V., Margolis, H., McCaughey, H., Merbold, L., Migliavacca, M., Montagnani, L., Oechel, W., Pavelka, M., Peichl, M., Rambal, S., Raschi, A., Scott, R. L., Vaccari, F. P., van Gorsel, E., Varlagin, A., Wohlfahrt, G., and Mahecha, M. D.: Impacts of droughts and extreme-temperature events on gross primary production and ecosystem respiration: a systematic assessment across ecosystems and climate zones, Biogeosciences, 15, 1293–1318, https://doi.org/10.5194/bg-15-1293-2018, 2018.
Walker, A. P., De Kauwe, M. G., Bastos, A., Belmecheri, S., Georgiou, K., Keeling, R. F., McMahon, S. M., Medlyn, B. E., Moore, D. J. P., Norby, R. J., Zaehle, S., Anderson-Teixeira, K. J., Battipaglia, G., Brienen, R. J. W., Cabugao, K. G., Cailleret, M., Campbell, E., Canadell, J. G., Ciais, P., Craig, M. E., Ellsworth, D. S., Farquhar, G. D., Fatichi, S., Fisher, J. B., Frank, D. C., Graven, H., Gu, L., Haverd, V., Heilman, K., Heimann, M., Hungate, B. A., Iversen, C. M., Joos, F., Jiang, M., Keenan, T. F., Knauer, J., Körner, C., Leshyk, V. O., Leuzinger, S., Liu, Y., MacBean, N., Malhi, Y., McVicar, T. R., Penuelas, J., Pongratz, J., Powell, A. S., Riutta, T., Sabot, M. E. B., Schleucher, J., Sitch, S., Smith, W. K., Sulman, B., Taylor, B., Terrer, C., Torn, M. S., Treseder, K. K., Trugman, A. T., Trumbore, S. E., van Mantgem, P. J., Voelker, S. L., Whelan, M. E., and Zuidema, P. A.: Integrating the evidence for a terrestrial carbon sink caused by increasing atmospheric CO2, New Phytol., 229, 2413–2445, https://doi.org/10.1111/NPH.16866, 2021.
Wang, J., Chen, J., Zhang, J., Yang, S., Zhang, S., Bai, Y., and Xu, R.: Consistency and uncertainty of remote sensing-based approaches for regional yield gap estimation: A comprehensive assessment of process-based and data-driven models, F. Crop. Res., 302, 109088, https://doi.org/10.1016/J.FCR.2023.109088, 2023.
Welp, L. R., Randerson, J. T., and Liu, H. P.: The sensitivity of carbon fluxes to spring warming and summer drought depends on plant functional type in boreal forest ecosystems, Agr. Forest Meteorol., 147, 172–185, https://doi.org/10.1016/J.AGRFORMET.2007.07.010, 2007.
Woodward, F. I. and Lomas, M. R.: Vegetation dynamics–simulating responses to climatic change, Biol. Rev. Camb. Philos. Soc., 79, 643–670, https://doi.org/10.1017/S1464793103006419, 2004.
Wu, Z., Ahlström, A., Smith, B., Ardö, J., Eklundh, L., Fensholt, R., and Lehsten, V.: Climate data induced uncertainty in model-based estimations of terrestrial primary productivity, Environ. Res. Lett., 12, 064013, https://doi.org/10.1088/1748-9326/AA6FD8, 2017.
Xia, J., Chen, Y., Liang, S., Liu, D., and Yuan, W.: Global simulations of carbon allocation coefficients for deciduous vegetation types, Tellus B Chem. Phys. Meteorol., 6, 1–15, https://doi.org/10.3402/TELLUSB.V67.28016, 2015.
Xu, S., Gentine, P., Li, L., Wang, L., Yu, Z., Dong, N., Ju, Q., and Zhang, Y.: Response of Ecosystem Productivity to High Vapor Pressure Deficit and Low Soil Moisture: Lessons Learned From the Global Eddy-Covariance Observations, Earth's Futur., 11, e2022EF003252, https://doi.org/10.1029/2022EF003252, 2023.
Zaehle, S., Friend, A. D., Friedlingstein, P., Dentener, F., Peylin, P., and Schulz, M.: Carbon and nitrogen cycle dynamics in the O-CN land surface model: 2. Role of the nitrogen cycle in the historical terrestrial carbon balance, Global Biogeochem. Cy., 24, 1006, https://doi.org/10.1029/2009GB003522, 2010.
Zhuravlev, R., Dara, A., Santos, A. L. D. dos, Demidov, O., and Burba, G.: Globally Scalable Approach to Estimate Net Ecosystem Exchange Based on Remote Sensing, Meteorological Data, and Direct Measurements of Eddy Covariance Sites, Remote Sens., 14, 5529, https://doi.org/10.3390/RS14215529, 2022.