the Creative Commons Attribution 4.0 License.
the Creative Commons Attribution 4.0 License.
 | 28 Aug 2025
Assessing the effect of forest management on above-ground carbon stock by remote sensing
Sofie Van Winckel
Jonas Simons
Stef Lhermitte
Bart Muys
As the global community intensifies efforts to combat climate change, insights on the influence of management on forest carbon stocks and fluxes are becoming invaluable for establishing sustainable forest management practices. However, accurately and efficiently monitoring carbon stocks remains technologically challenging. In this study, we aim to (1) assess the effect of forest management on carbon stock by comparing unconfounded pairs of managed and unmanaged forests in the National Park Brabantse Wouden (Flanders, Belgium) and (2) leverage the complementary strengths of optical, light detection and ranging (lidar), and synthetic aperture radar (SAR) remote sensing technologies to improve overall accuracy and scalability in carbon stock estimation. Remote sensing data from Sentinel-2, Sentinel-1, and a canopy height product derived from the Global Ecosystem Dynamics Investigation (GEDI) mission and Sentinel-2 were used as predictors in a generalized additive model (GAM) to estimate carbon stock. The combination of Sentinel-1 and Sentinel-2 significantly improved model accuracy (R2=0.73, RMSE=59.21 t ha−1, MAE=50.29 t ha−1) compared to a model using only Sentinel-2 indices (R2=0.56, RMSE=99.44 t ha−1, MAE=91.40 t ha−1). The addition of canopy height estimates did not affect the model fit. While field assessment exhibited higher carbon stocks in unmanaged stands compared to managed ones, this difference was not detectable using a remote sensing model that incorporated Sentinel-2, Sentinel-1, and/or GEDI-derived variables. Potential explanations for this discrepancy include signal saturation and the need for more training data.
- Article
(1246 KB) - Full-text XML
- BibTeX
- EndNote


1.1 Problem statement
Increasing forest carbon stocks to enhance the climate mitigation potential is a key component of many international agreements aimed at combating climate change (e.g., Kyoto Protocol, Paris Agreement, European Green Deal). Accurate quantification of forest carbon over time provides the foundation for various initiatives targeting carbon management, especially within ecosystem service frameworks like carbon credit schemes and the development of climate-smart forest management guidelines. Among different forest carbon pools, above-ground biomass has proven to be the most susceptible to human activities, including forest management practices (Gurung et al., 2015). Since above-ground carbon stocks are easier to measure and can serve as a proxy for below-ground carbon through modeling, they are increasingly considered a valuable indicator of sustainable forest management (Sabatini et al., 2019). However, while forest management practices affect above-ground biomass carbon stocks in different ways, the precise impact of these practices remains poorly quantified. Evidence suggesting that unmanaged forests continue to function as effective carbon sinks, even into later stages of forest development, highlights the need for better localization and protection of these ecosystems (Kun et al., 2020; Luyssaert et al., 2008; Mikolāš et al., 2023). Nevertheless, accurately capturing carbon stocks over large areas presents both technical and logistical challenges. In this context, remote sensing provides cost-efficient means for large-scale monitoring of above-ground carbon in forests.
1.2 State of the art and research gaps
1.2.1 Managed versus unmanaged forests
Despite the growing need to understand how to optimize a forest's climate mitigation capacity, controversy persists regarding the influence of management on above-ground carbon stocks (Kalies et al., 2016). On the one hand, natural ecosystems, such as unmanaged forests, may store more carbon due to a higher basal area, increased litter production, and unrestricted biomass accumulation. These natural ecosystems are generally viewed as more stable and resilient compared to heavily modified forests, leading to a more stable storage of carbon (Morel and Nogué, 2019). On the other hand, optimizing species composition in managed forests may enhance productivity and increase carbon stocks (Vayreda et al., 2012). Management may also reduce the susceptibility of a stand to climate disturbances such as wildfires and windthrows, therefore avoiding big losses of carbon stock and assuring carbon stability (Garcia-Gonzalo et al., 2007; Jandl et al., 2007; Ruiz-Peinado et al., 2017; Vayreda et al., 2012). Due to the presence of confounding factors at study sites, such as climate, soil, slope, aspect, and stand history, drawing clear conclusions about the causes of observed differences in carbon stock and the effects of forest management has been challenging in previous research (Nadrowski et al., 2010). Dugan et al. (2017), Melikov et al. (2023), and Ruiz-Peinado et al. (2017) emphasize the need to clarify the relationship between forest management and carbon stock by accounting for or excluding these confounding variables.
1.2.2 Measuring carbon
Traditionally, above-ground carbon has been calculated for individual trees from tree height and diameter at breast height (DBH), wood density, and species-specific carbon concentration factors. This information can be extrapolated using expansion factors to a per-hectare basis (Zianis et al., 2005). While such in situ methods achieve high accuracy at small extents, it becomes costly and labor-intensive when scaling to larger regions. Spaceborne remote sensing technologies have been widely adopted to expand the reach and efficiency of biomass estimation (Rodríguez-Veiga et al., 2017). Advances in remote sensing have led to a suite of techniques, with each approach offering distinct advantages and disadvantages (Tian et al., 2023).
Passive optical remote sensing has become the predominant method for large-scale biomass estimation, due to its extensive data availability, high spatial and temporal resolution, and low cost (Tian et al., 2023; Xiao et al., 2019). Vegetation indices, such as the Normalized Difference Vegetation Index (NDVI), indicate the photosynthetic activity and health of trees and are often-used indicators of biomass (Askar et al., 2018; Laurin et al., 2018). Additionally, light detection and ranging (lidar) technology is an active remote sensing method that enables predictions of the canopy profile, and from there biomass, within the sensor's footprint. Synthetic aperture radars (SARs) are also active remote sensors, which use microwave signals to capture the vegetation structure, related to the plant's biomass (Sinha et al., 2015). The used signals are backscatter intensity, frequency, and polarization to reflect the vegetation's moisture content, surface roughness, and dielectric properties (Goetz et al., 2009; Xiao et al., 2019). Microwaves penetrate clouds, making it particularly valuable in regions with persistent cloud cover (Xiao et al., 2019).
While each remote sensing method offers unique advantages, their individual limitations constrain the precision and comprehensiveness of forest carbon assessments. Both passive optical sensors and SAR struggle with signal saturation in dense forests with a complex vegetation structure, where increasing biomass no longer affects the sensor signal (Rodríguez-Veiga et al., 2017). Passive optical sensors, while effective for measuring photosynthetic activity, additionally fail to capture structural characteristics and are hindered by cloud cover, which impairs the signal-to-noise ratio. Lidar, on the other hand, only measures the structural characteristics of the forest, missing photosynthetic information on tree health and chlorophyll content. Spaceborne lidar measurements moreover require interpolation, for example with passive optical remote sensing, because they do not provide wall-to-wall data. This can introduce errors, especially in variable forest structures (Lu et al., 2012). Additionally, SAR faces issues with temporal decorrelation and signal interference from environmental factors, further complicating biomass monitoring (Koch, 2010; Xiao et al., 2019). Lastly, all three sensor types may suffer from mixed pixels when a single pixel captures multiple surface types and complicates accurate biomass estimation.
In conclusion, each technique offers valuable insights but also comes with limitations, which underscore the importance of integrating remote sensing technologies (Jiang et al., 2022; Jiao et al., 2023; Sun et al., 2024). The integration of several remote sensing sources has already proven successful for biomass estimations, but most studies are limited to two sensor types. For example, David et al. (2022) and Forkuor et al. (2020) reported improved model predictions when using SAR and passive optical remote sensing indicators in dryland forest. Hoscilo et al. (2018) reported a saturation effect at 200 t ha−1 biomass in temperate forests of Poland when combining the same sensor types. In this study, we aim to (1) assess the effect of forest management on carbon stock by comparing unconfounded pairs of managed and unmanaged temperate Atlantic forests in Flanders, Belgium, and (2) leverage the complementary strengths of optical, lidar, and SAR remote sensing technologies to improve overall accuracy and scalability in above-ground forest carbon stock modeling.
2.1 Study region: Brabantse Wouden National Park
Our study is located in the Brabantse Wouden National Park (BW NP) in central Belgium and was selected by the INFORMA Forest Management Platform (IFMP) to represent the temperate Atlantic forest ecosystems in Europe (Fig. 1a) (INFORMA, 2022). The BW NP encompasses a vast area including 10 000 ha of forest, composed of several large fragments, including the Sonian Forest and Meerdael Forest (Fig. 1a). Since October 2023 it has been one of the six national parks in Belgium, unique for its monumental beeches and oaks, sunken lanes, and meandering rivers (Brabantse Wouden, 2023).
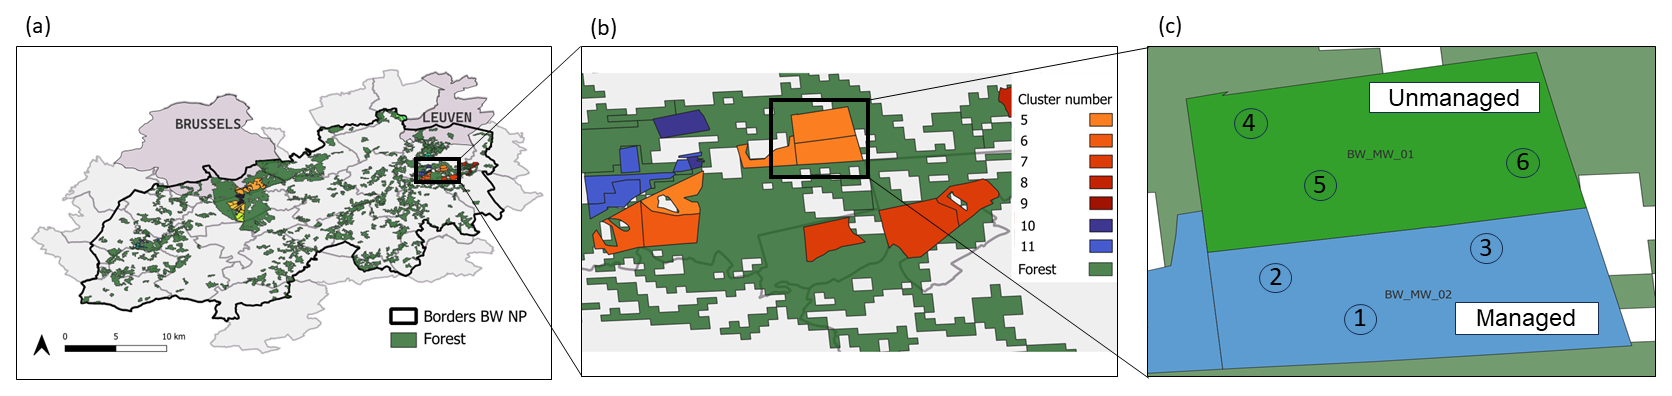
Figure 1The study site is situated in the Brabantse Wouden National Park (a). Adjacent forest patches were clustered (b), where patches within a cluster only differed in management (c). Three plots were randomly attributed to each forest patch (c). (The high-resolution forest map from the European Union's Copernicus Land Monitoring Service was used for the creation of this map, available at https://doi.org/10.2909/db1af59f-f01f-4bd4-830c-f0eb652500c1, European Environment Agency, 2020).
2.2 The effect of forest management on carbon stock
Above-ground carbon stock as calculated from individual tree height and DBH, measured in the field, is considered as the ground truth. The effect of forest management on the carbon stock can thus trustfully be deduced from such field data, which will also serve as calibration data in the remote sensing model.
The database has an orthogonal design, which ensures the minimization of confounding effects (Nadrowski et al., 2010). It consists of a collection of forest patches grouped into clusters, with each cluster containing patches that differ only in management practices (Fig. 1b). Other factors affecting the accumulated carbon stock – such as aspect, soil, dominant species, elevation, slope, climate, and land use and management legacy – are therefore controlled for. Each cluster includes at least one managed and one unmanaged forest patch, with the unmanaged patch having remained undisturbed for at least 20 years (Fig. 1c). For each patch, basic information is available, including forest management details, time since abandonment, and dominant tree species. A random selection of clusters, considering different dominant tree species, was made within the constraints of the IFMP and the time and resources available for field data collection. The resulting selection contained 13 clusters and 26 patches: one managed and one unmanaged forest patch per cluster. Next, three plots were randomly assigned within each patch (Fig. 1c). The size of the patches was not considered, as homogeneity was ensured through the IFMP design. In total, 78 plots were identified across 26 forest patches, representing 13 clusters. Field measurements and remote sensing data were collected from these plots (Fig. 2).
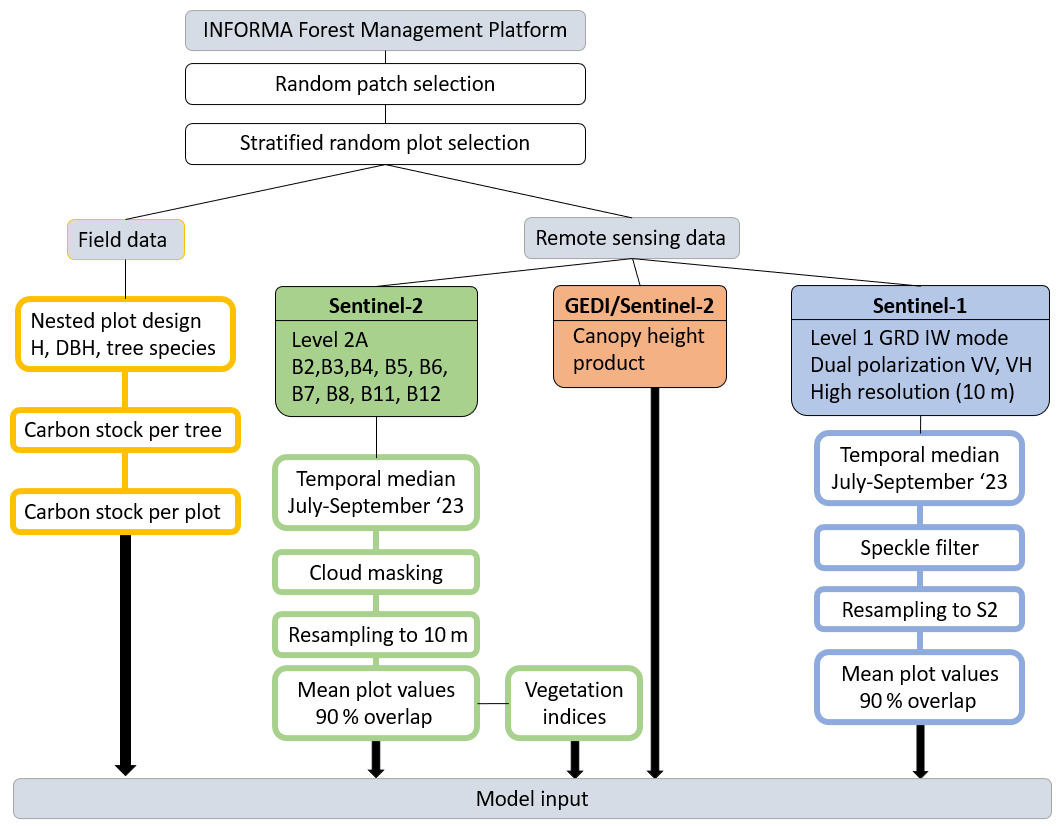
Figure 2Overview of the data collection process and pre-processing of all data. H = tree height, DBH = diameter at breast height, GRD IW = Ground Range Detected, Interferometric Wide Swath mode, S2 = Sentinel-2.
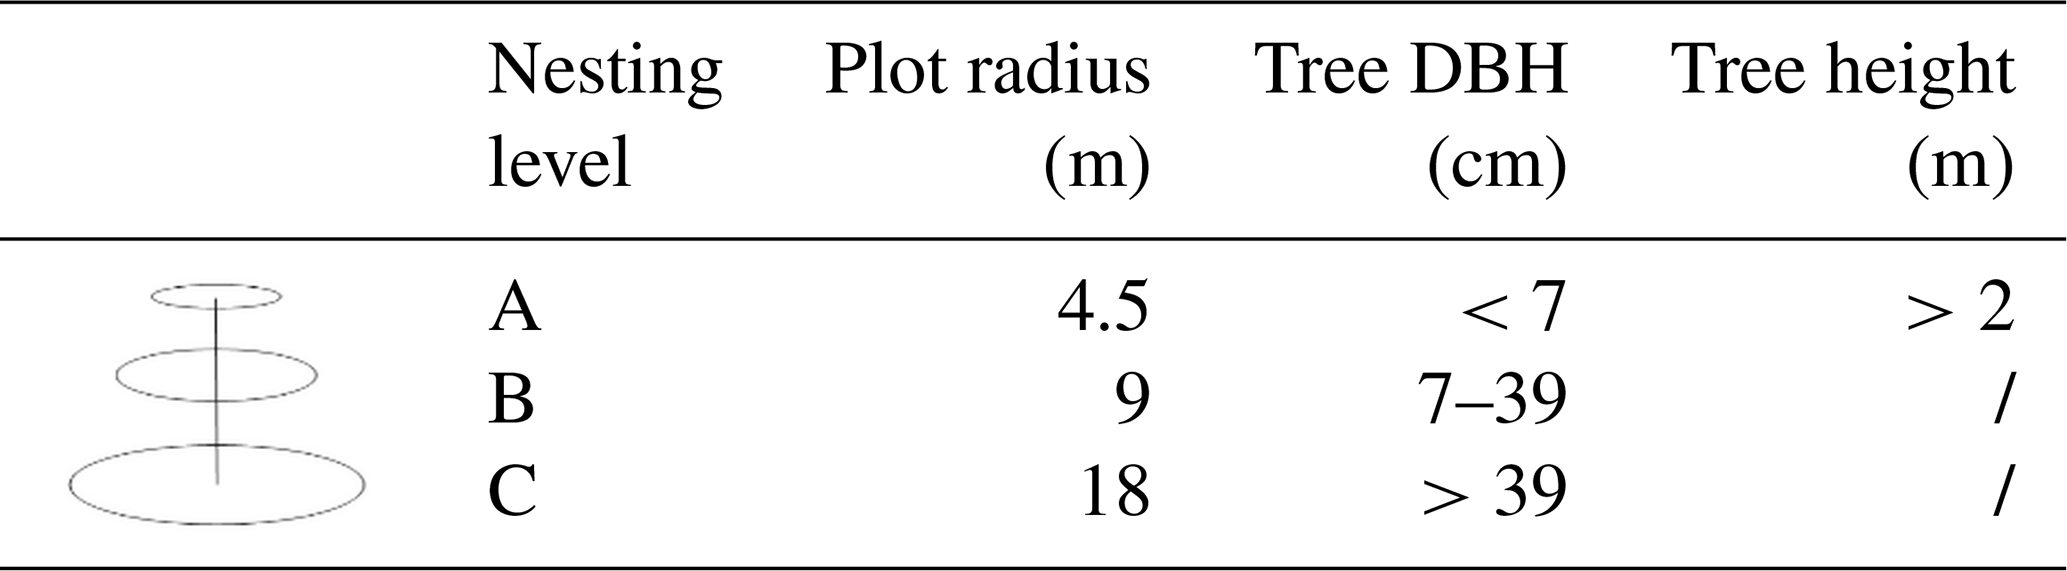
A nested plot design was used, following the thresholds in DBH and tree height as used in the Flemish Forest Inventory (FFI) (Table 1). The system boundaries were defined as standing above-ground biomass, because below-ground biomass or deadwood cannot be easily quantified by remote sensing. The DBH and tree height were measured for each tree, according to the nesting levels.
Table 1Characteristics of the trees per nesting level for Brabantse Wouden National Park.
With site- and species-specific allometric equations, obtained from the FFI, the relationship between carbon stock, tree height, and DBH is described, following Eq. (1):
where Vstem is the stem volume (m3), VEF is the volume expansion factor (–), WD is the wood density (t m−3), and CF is the carbon factor (–).
The VEF was used to convert merchantable volume to above-ground biomass and was available through the National Inventory Report (Belgium, 2020). The WD is also species-specific and described in the National Forestry Accounting Plan of Belgium (Perin et al., 2019). For the CF, a value of 0.5 was used for all species, as described in the IPCC report (IPCC, 2003) and the National Inventory Report (Belgium, 2020). The stem volume can be calculated using species-specific double-entry volume equations with DBH and height (H) measurements as specified in Eq. (2). The coefficients a, b, c, d, and e were derived from Dagnélie et al. (1985), Berben (1983), and Quataert et al. (2011):
The double-entry volume equations are designed for trees with a DBH larger than 7 cm. For smaller trees, the volumes were approximated with the volume of a cylinder. Still, for some smaller trees with a DBH between 7 and 10 cm, the double-entry volume equations resulted in a negative volume. In this case, the volume was recalculated as a truncated cone with a capping diameter of 7 cm (Eqs. 3–5):
with DBH and H in meters. These formulas were based on the Flemish Forest Inventory.
After calculation of the carbon stock per tree and then per plot, the mean carbon stock per patch was obtained from the three plots situated in each forest patch (Fig. 2). Finally, the difference in carbon stock between unmanaged and managed patches was calculated per cluster.
We used a generalized linear mixed model (GLMM) with a gamma distribution to statistically test the difference between carbon stocks of managed and unmanaged field-measured plots (Wood, 2006). The mean carbon stock per patch was the response variable, management was the fixed effect, and the patch was nested in the cluster as a random effect.
2.3 Carbon stock modeling with remote sensing
2.3.1 Data collection and preprocessing
Once the field measurements were obtained, remote sensing data were extracted and preprocessed for the same forest plots (Fig. 2).
First, data from the Sentinel-2 mission (passive optical remote sensing), launched by the ESA Copernicus program, were obtained at level 2A via Google Earth Engine (https://earthengine.google.com/, last access: 27 December 2023). Data were retrieved for all bands except B1, B9, and B10 because these bands are recorded at 60 m resolution, which is too coarse for analyses at stand level. Band 8A was also left out given its close relation to B8, but with a lower resolution and narrower band width, to avoid data redundancy. A 3-month period (1 July 2023 to 1 September 2023) was selected to align with the time frame for field data collection. A cloud masking was performed (filtered with a 60 % cloudy pixel percentage, masked with a 40 % cloud probability threshold), and all 20 m resolution bands were resampled to 10 m resolution. The cloud probability layer of Sentinel-2 was used, openly available in Google Earth Engine (Schwehr, 2020). Weighted average band values were then calculated for each selected plot, weighted by the percentage of plot overlap. A lower limit of 90 % overlap between the pixel and the plot area was used.
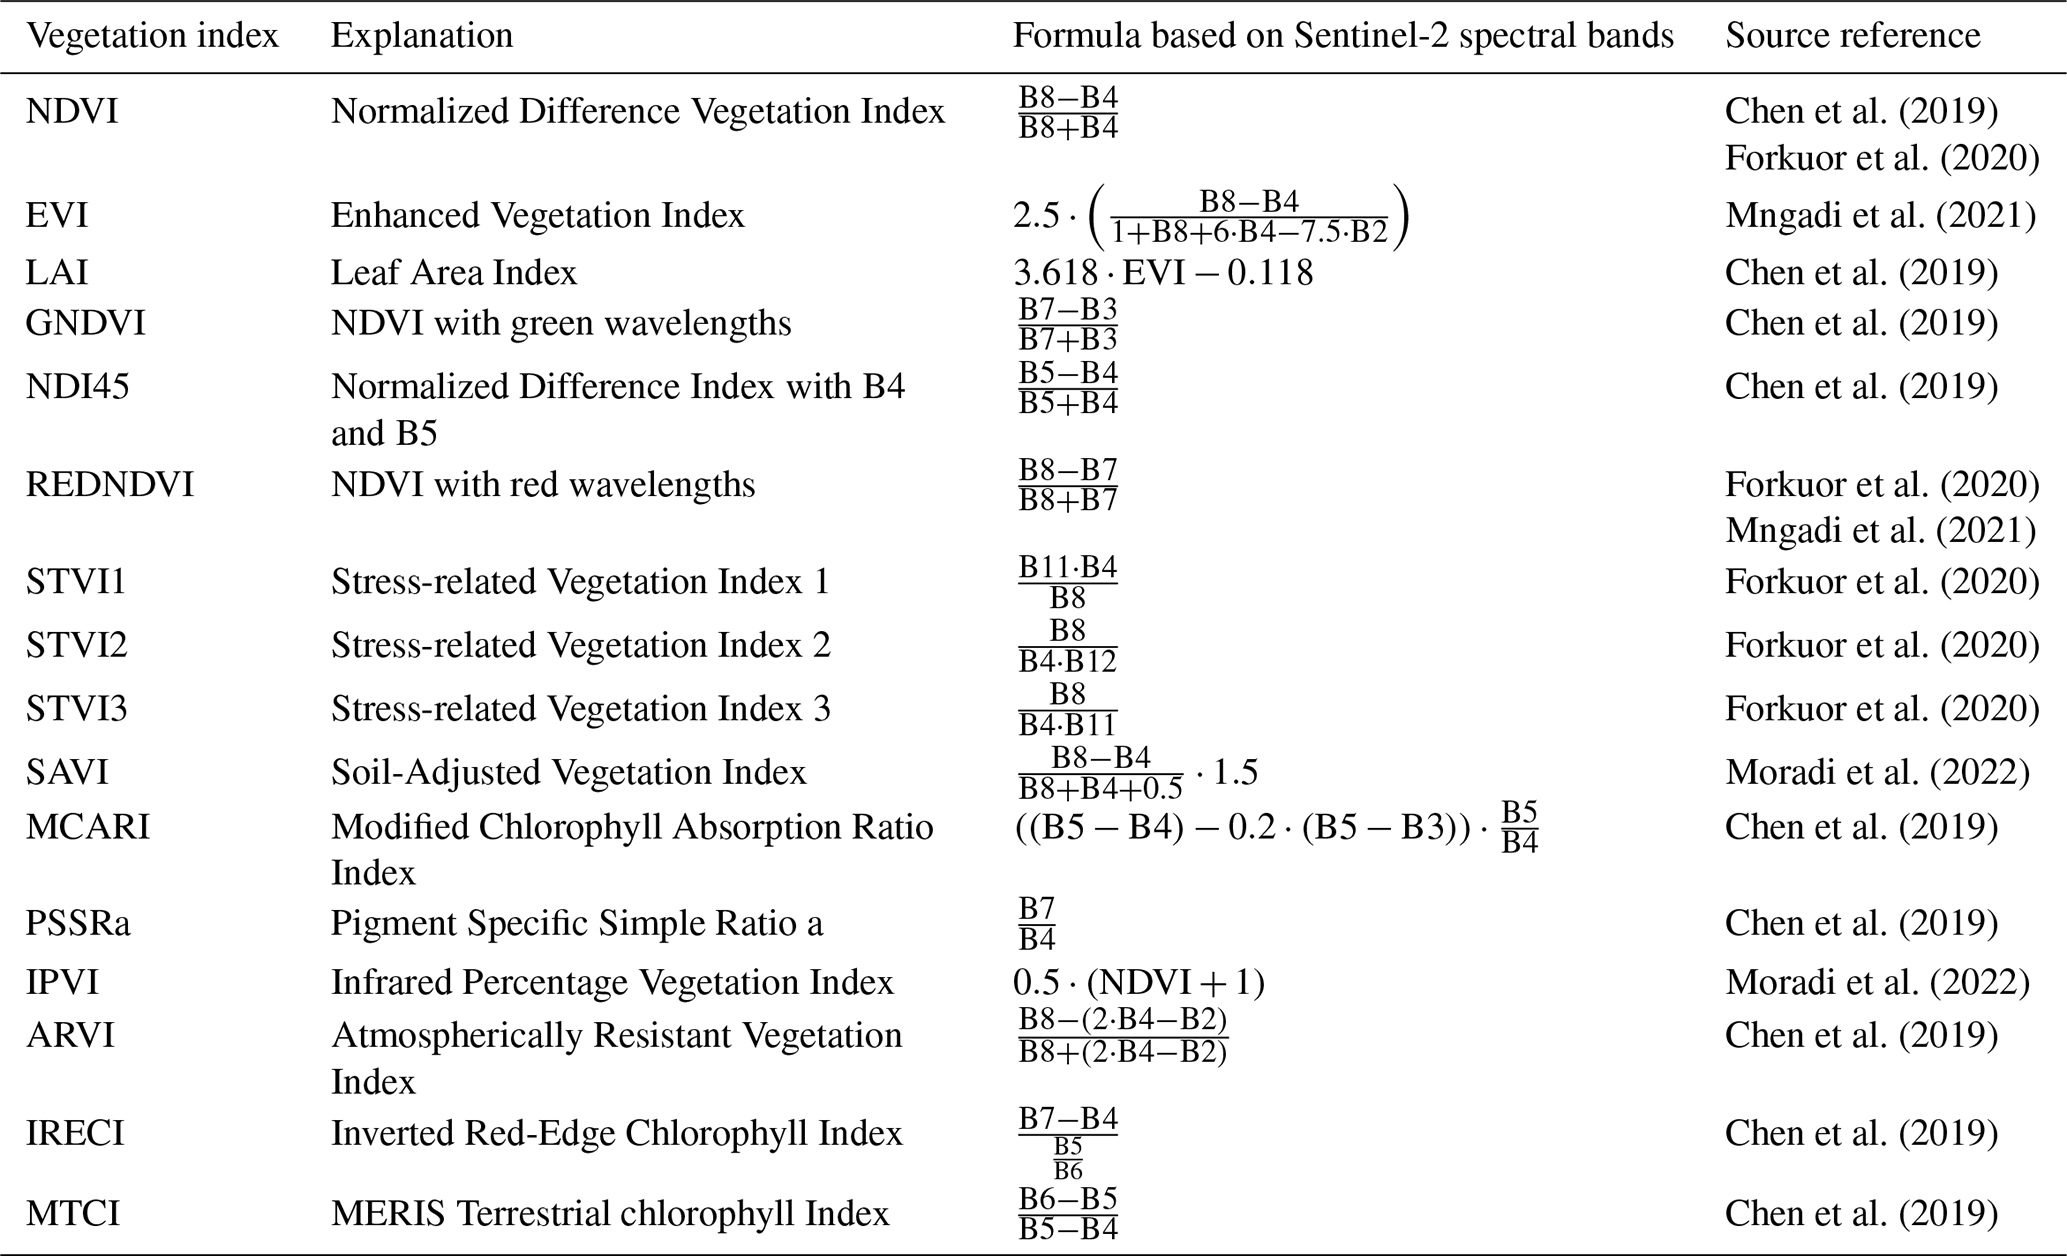
Vegetation indices, rather than raw band values, are particularly useful indicators of biomass. An explorative review of relevant scientific literature led to a selection of vegetation indices, derived from Sentinel-2, that have been proven useful for above-ground biomass (AGB) modeling (Table 2) (Chen et al., 2019; Forkuor et al., 2020; Mngadi et al., 2021; Moradi et al., 2022). The mean of each vegetation index per plot was calculated identically to the mean Sentinel band values, to be used as explanatory variables for above-ground carbon stock.
Table 2Vegetation indices, derived from Sentinel-2, which were used in this study with respective calculations and references.
Second, GEDI, or Global Ecosystem Dynamics Investigation, is a spaceborne lidar mission launched in 2018 by NASA to measure the vertical structure of the Earth's forests (Dubayah et al., 2020). A prediction of the canopy height profile for the 25 m footprint area can be derived from the GEDI observations, a morphological variable that is also measured in the field with conventional methods. However, the measurements are in discrete footprints and thus lack the full coverage of passive optical remote sensing missions such as Sentinel-2. Therefore, a high-resolution canopy height model of the Earth (10 m×10 m) was recently developed by Lang et al. (2022, 2023) using a probabilistic deep learning model to extrapolate height data from the GEDI mission via spectral information from Sentinel-2. Even though the product was developed at a global scale, lacking local calibration and introducing significant uncertainty, it was already successfully used for local carbon stock mapping in the context of the high carbon stock approach (Lang et al., 2021). The product was directly downloaded for the study regions, and no preprocessing was needed.
Finally, the Sentinel-1 mission, part of the ESA Copernicus program, is a C-band synthetic aperture radar (SAR) system. The Sentinel-1 radar emits vertical waves and receives both vertical and horizontal waves (VV and VH respectively), yielding a SAR image. While VV backscatter indicates surface roughness and water content, VH backscatter is rather sensitive to volumetric scattering (Laurin et al., 2018). The amount of backscatter is influenced by the structural attributes of forest canopies and the interactions between surface and volumetric scattering in vegetation, both of which serve as indicators of above-ground biomass (AGB). Data were acquired in Google Earth Engine at level-1 Ground Range Detected (GRD) in Interferometric Wide Swath mode (10 m resolution) with dual polarization (VV and VH) for both ascending and descending passes. Data were collected during the same time period as the Sentinel-2 data. Orthorectification, thermal noise removal, radiometric calibration, and border noise removal were already conducted in this GRD product. A refined Lee speckle filter was then applied to the data for speckle reduction, and the temporal median was taken for every pixel. Mean plot values for VV and VH were finally calculated separately to serve as explanatory variables, similar to the Sentinel-2 processing.
2.3.2 Data analysis
In Fig. 3, the workflow of the modeling process is depicted, as can be followed throughout this section. First, only Sentinel-2 imaging bands and vegetation indices were used to predict above-ground carbon stock. After optimizing this first model, data from Sentinel-1 and the GEDI/Sentinel-2 canopy height product were added to assess the added value of multi-sensor remote sensing modeling.
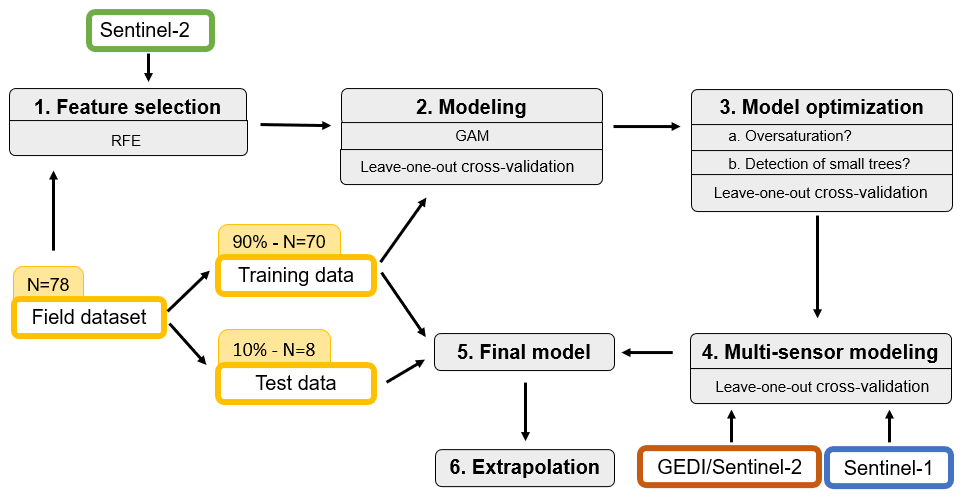
Figure 3Graphical overview of the data analysis process. The test dataset remained unseen until evaluation of the final model. Leave-one-out cross-validation in intermediary stages (2, 3, 4) was performed with the training dataset only.
-
Feature selection. The number of field observations (78), and thus the degrees of freedom, was limited, and a selection of the predictive variables (vegetation indices and Sentinel bands) was made by recursive feature elimination (RFE) to avoid overfitting (Kursa and Rudnicki, 2010). RFE identifies the most relevant features by systematically removing the least important features. The outer resampling method was used, with 10-fold cross-validation repeated five times. Model performance was evaluated by R2, RMSE, and MAE. Multicollinear variables resulting from the RFE feature selection were identified and excluded from the selection.
-
Modeling. A generalized additive model (GAM) was chosen as a semi-parametric extension of generalized linear models (GLMs) (Hastie and Tibshirani, 1986). The smooth functions make GAMs flexible while maintaining interpretability: a significant advantage compared to the more often used random forest algorithms (Wood, 2006). The response variable followed a gamma distribution, and all variables were scaled. Neighborhood cross-validation (NCV) was identified as the optimal method for estimating smoothing parameters. A fixed value of 1.4 was assigned to the gamma parameter, and adjustments to the k values were deemed unnecessary, following Wood (2006). A training dataset of 90 % of all data points (70) was used in this process, reserving 10 % (8) for the testing of the final model (Fig. 3). Leave-one-out cross-validation (LOOCV) was performed on this training set to tune the model at several intermediate stages of the modeling, avoiding overfitting with the rather small field dataset. The root mean square error (RMSE), the mean absolute error (MAE), and the coefficient of determination (R2) were chosen as model test and validation metrics.
-
Model optimization. We employed LOOCV again on the same 90 % training dataset during model optimization, aiming for the best model performance by evaluating different scenarios. First, a known limitation of passive optical remote sensing is signal saturation for forests with high complexity and biomass (Rodríguez-Veiga et al., 2017). This may lead to deviating spectral values that are detected, which may negatively affect the model performance. To evaluate oversaturation, the model was run excluding plots where field data showed a biomass greater than 450 t ha−1, which corresponds to a carbon stock exceeding 225 t ha−1. The impact of these underestimated high-biomass plots was evaluated by comparing model validation parameters. Second, small trees are more difficult to detect by passive optical remote sensing. The influence of the small trees in nesting level A was assessed by comparing the model including all diameter classes with a model containing only trees from nesting levels B and C (Table 1). Then, the diameter threshold of detection by remote sensing was sought, based on improvement or impairment of the validation metrics when iteratively disregarding trees in different diameter percentiles.
-
Multi-sensor modeling. Finally, the inclusion of height estimates from the product derived from GEDI and Sentinel-2, along with VV and VH polarization data from the Sentinel-1 mission, was evaluated by incorporating these new explanatory variables into the GAM.
-
Final model. The final model was constructed using the full 90 % training data and evaluated on the remaining 10 % that was isolated in the test dataset (Fig. 3) and remained unseen during model tuning and optimization.
-
Model application. To compare the results of the field measurements with the carbon stocks as predicted by the remote sensing model, the carbon stock was predicted for every pixel of the patches from the IFMP, including both the field-measured patches and the patches that were not selected by the random sampling (Bolar, 2019). The mean predicted carbon stock and the standard error of the mean were then calculated for each forest patch. The standard error of the mean indicates the deviation of the estimated sample mean from the real sample mean (Goos, 2017). Additionally, the overall bias was estimated at patch level by comparing the field-measured carbon stocks with the model-estimated values. Again, a GLMM was used to statistically compare the carbon stock estimates between managed and unmanaged forest patches. To assess the extrapolation error caused by the reduced training dataset, the convex hull methodology as described by Renaud et al. (2022) was followed (Appendix B).
3.1 The effect of forest management on above-ground carbon stock
Results of the statistical analysis on the field measurements show a clear difference between managed and unmanaged forest plots. Unmanaged forest plots store a significantly (α=0.05) higher amount of carbon (196.50 ± 61.28 t ha−1) in their above-ground biomass than managed forest plots (143.68 ± 48.90 t ha−1) (Fig. 4a). The unmanaged plots are characterized by a higher variation in carbon stock than the managed plots, where the density curve is negatively skewed (Fig. 4a). Within each cluster, the difference fluctuates between 10 and 180 t ha−1 (Fig. 4b). From the analysis at patch level, managed patches have a lower carbon stock than unmanaged patches (p=0.01, effect size −0.33).
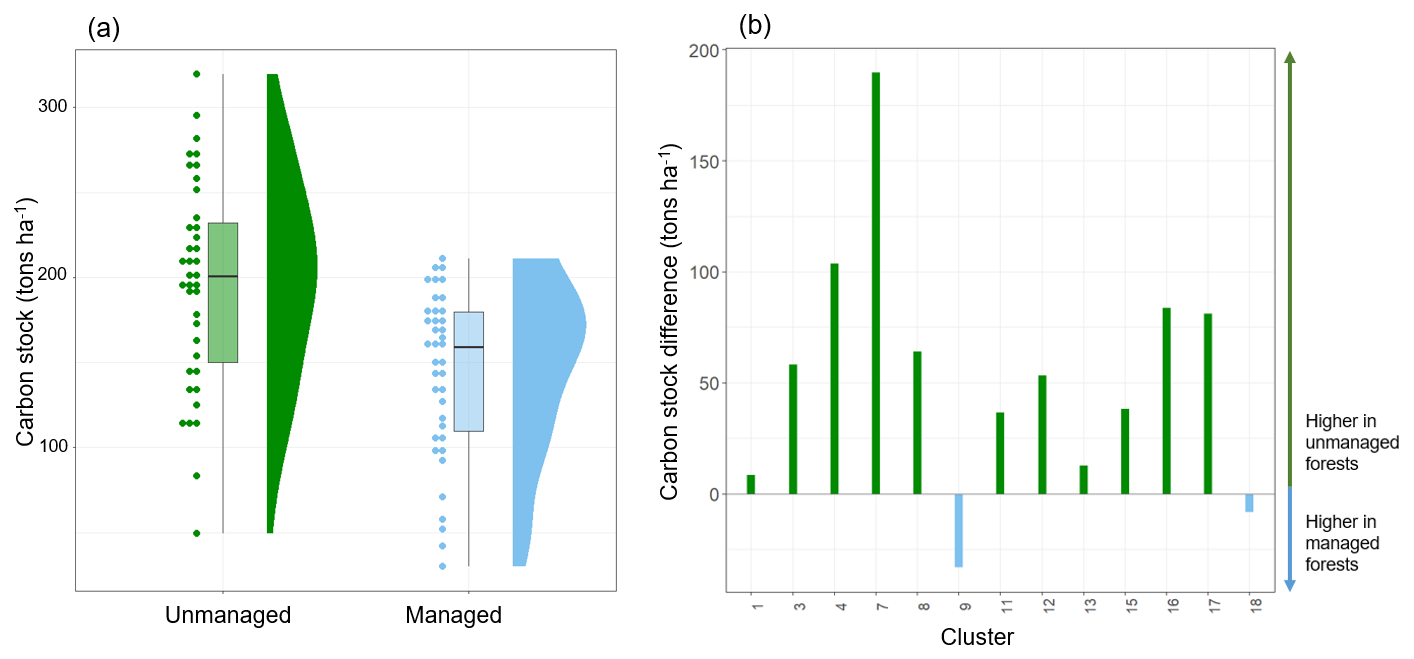
Figure 4Results of the carbon stock analysis comparing managed and unmanaged forests in the field plots, (a) comparing density distributions, and (b) by calculating the difference in mean carbon stock per forest patch (unmanaged minus managed) for each cluster as measured in the field.
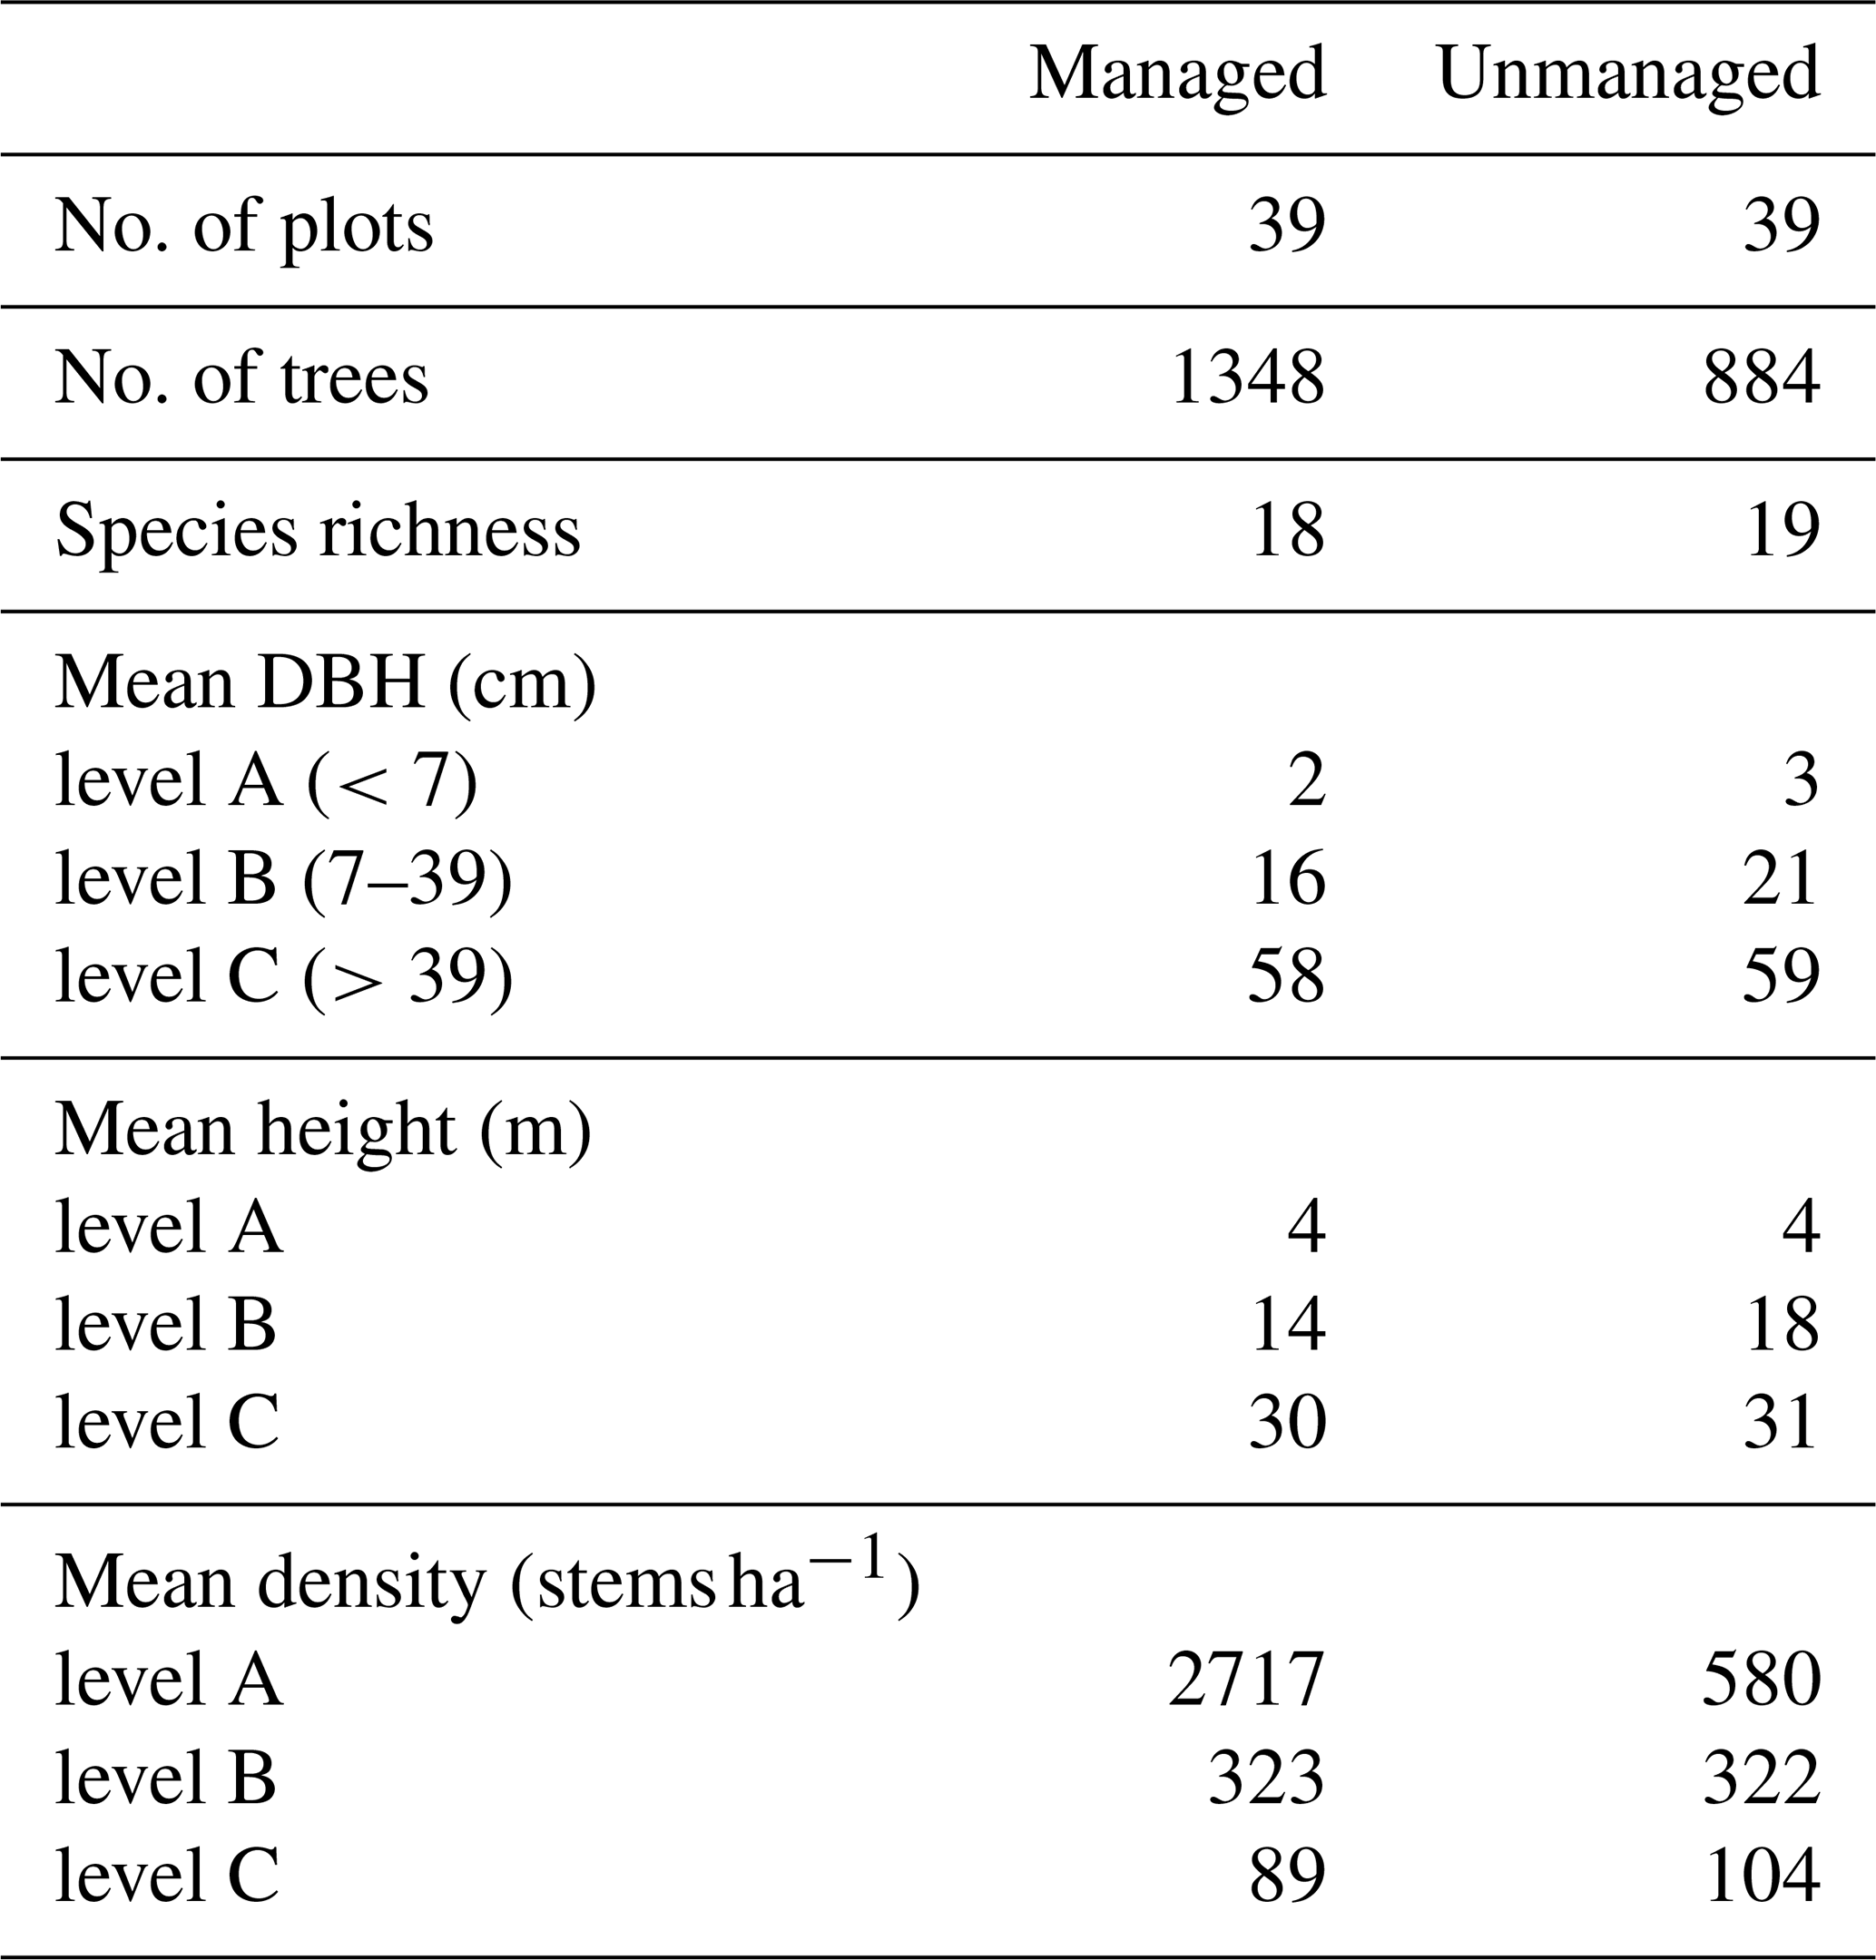
The difference in tree count between managed and unmanaged plots is noteworthy, a difference that is mostly reflected in the trees from nesting level A (Table 1), corresponding to the smallest trees (Table 3). Secondly, there is a higher tree density of the largest diameter class (nesting level C) in the unmanaged plots. In general, higher and larger trees are measured in unmanaged plots in BW NP.
Table 3Overview of the plot characteristics in managed and unmanaged forests, measured in the field. The different levels (A, B, C) refer to the nesting levels as defined in Table 1. Plot radius level A = 2.5 m, level B = 9 m, level C = 18 m.
3.2 Carbon stock modeling with remote sensing
-
Feature selection. The Sentinel-2 variables selected through recursive feature elimination for the generalized additive model (GAM) capture various photosynthetic and structural characteristics of vegetation. The first selection of features included several multicollinear features, such as B5 and B6, GNDVI and NDI45, and STVI3 and STVI2. The first five features that were not highly correlated were selected. These included B5, B12, GNDVI, STVI3, and MCARI. The inclusion of indices compared to only spectral bands enhanced the interpretation. The red-edge wavelengths were represented, which help detect vegetation density and type. The short-wave infrared wavelengths, along with GNDVI and MCARI, provide insights into photosynthetic capacity and chlorophyll absorption depth. Lastly, near- and mid-infrared bands were included in the stress-related vegetation index (STVI3).
-
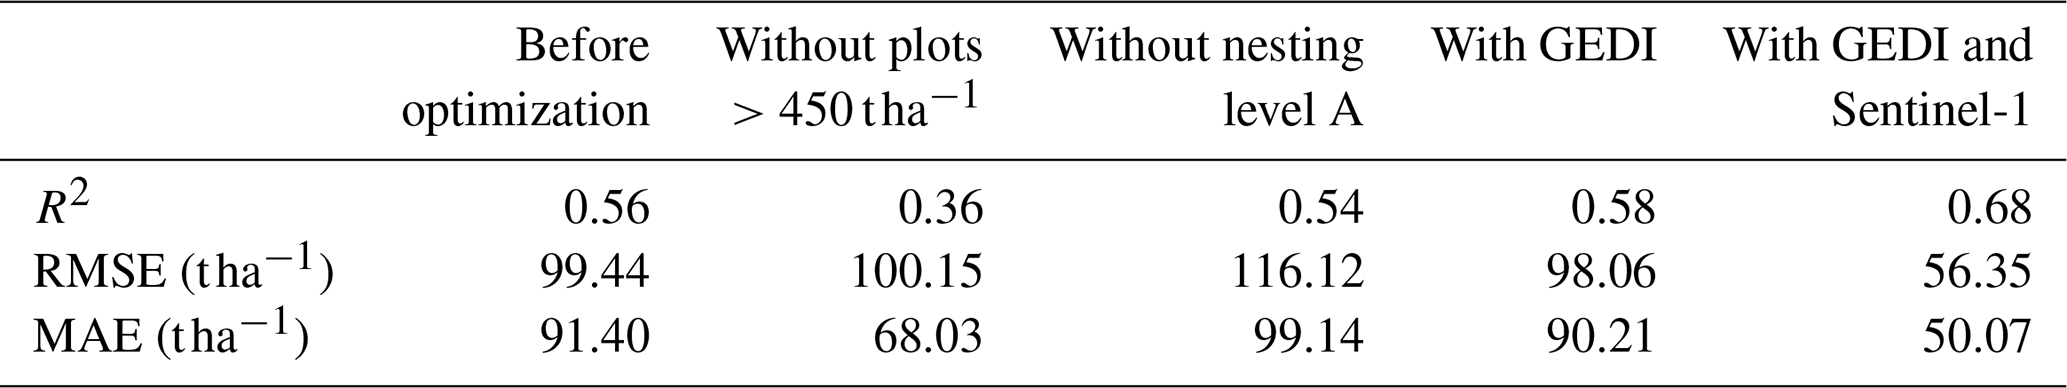
Modeling. Before model optimization, the validation parameters of the model, at this moment only containing Sentinel-2 variables, were R2=0.56, RMSE=99.44 t ha−1, and MAE=91.40 t ha−1 (Table 4). These validation parameters were not improved by disregarding plots with a high biomass (>450 t ha−1) or by disregarding small trees. A more detailed result of the model optimization can be found in Appendix A.
-
Multi-sensor modeling. Incorporating the canopy height estimates derived from GEDI and Sentinel-2 enhanced both the model fit and predictive capabilities slightly (Table 4). Especially in the high DBH classes, the error decreased (Fig. 5). The canopy height estimates of the GEDI/Sentinel-2 product and the field measurements follow approximately the same trend. However, a systematic underestimation was detected with a paired t test (). No signal saturation was observed: the underestimation did not increase for plots with a higher biomass (Fig. 7). There was no clear explanation found for this systematic bias, but this is a trend that has been seen in other remote sensing models in the region as well (e.g., CCI biomass product). The introduction of both VV and VH also improved the model fit and predictive power. Again, oversaturation-induced underestimation was significantly reduced, and predictions also improved notably in the lower DBH classes. Adding Sentinel-1 data or GEDI data thus improves model prediction, but adding both did not improve the predictive performance compared to only using Sentinel-2 and Sentinel-1 indices. Only the RMSE and the underestimation at high biomasses slightly decrease, but the R2 decreases with 5 % (Table 4).
The model optimization resulted in a final model, used for application (Eq. 6).
-
Model application. The final model did not successfully detect the carbon stock difference between managed and unmanaged patches, as measured in the field. When iteratively leaving out one of the test plots, a maximal loss of 6.7 % RMSE was noted, showing that the test metrics were not majorly influenced by one singular test plot. The predicted mean carbon stock for the unmanaged patches was 165.89 ± 26.46 t ha−1; for managed patches this was 166.80 ± 32.28 t ha−1 (Fig. 8a). It is remarkable that unmanaged patches are overall underestimated, while the opposite is true for managed patches (Fig. 6). This results in an almost-zero overall estimation bias of −0.83 t ha−1. On average, the standard error of the mean was 1.27 t ha−1, and the maximal standard error of the mean was 5.94 for the smallest patch that only contained 130 pixels. The managed patches have a higher variability in predicted carbon stock compared to the unmanaged patches (Fig. 8a), while again the opposite was true for the data as measured in the field. According to the remote-sensing-based model, there is no significant difference between managed and unmanaged patches (α=0.05, p=0.61). For some clusters, almost no difference in carbon stock between the unmanaged and the managed patches was observed (Fig. 8b). For other clusters, a difference up to 40 t ha−1 was estimated, however not in a consistent pattern. Compared to the field data, the estimated differences between managed and unmanaged forests are substantially smaller. However, falling below the mean absolute error of the model, they indicate a high degree of uncertainty. No abnormalities were detected in the images of the clusters where a carbon stock difference of over 20 t ha−1 was estimated.
Table 4Evolution of the model validation parameters with the addition of multiple remote sensors. S-2 = Sentinel-2, S-1 = Sentinel-1.
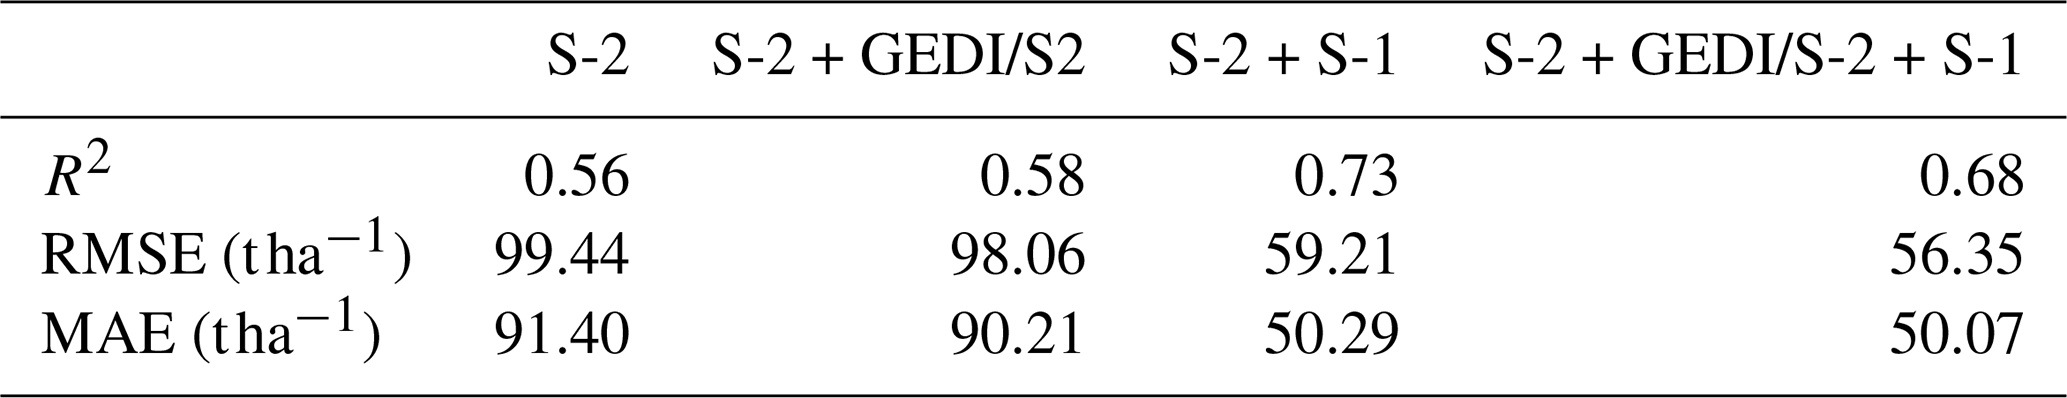
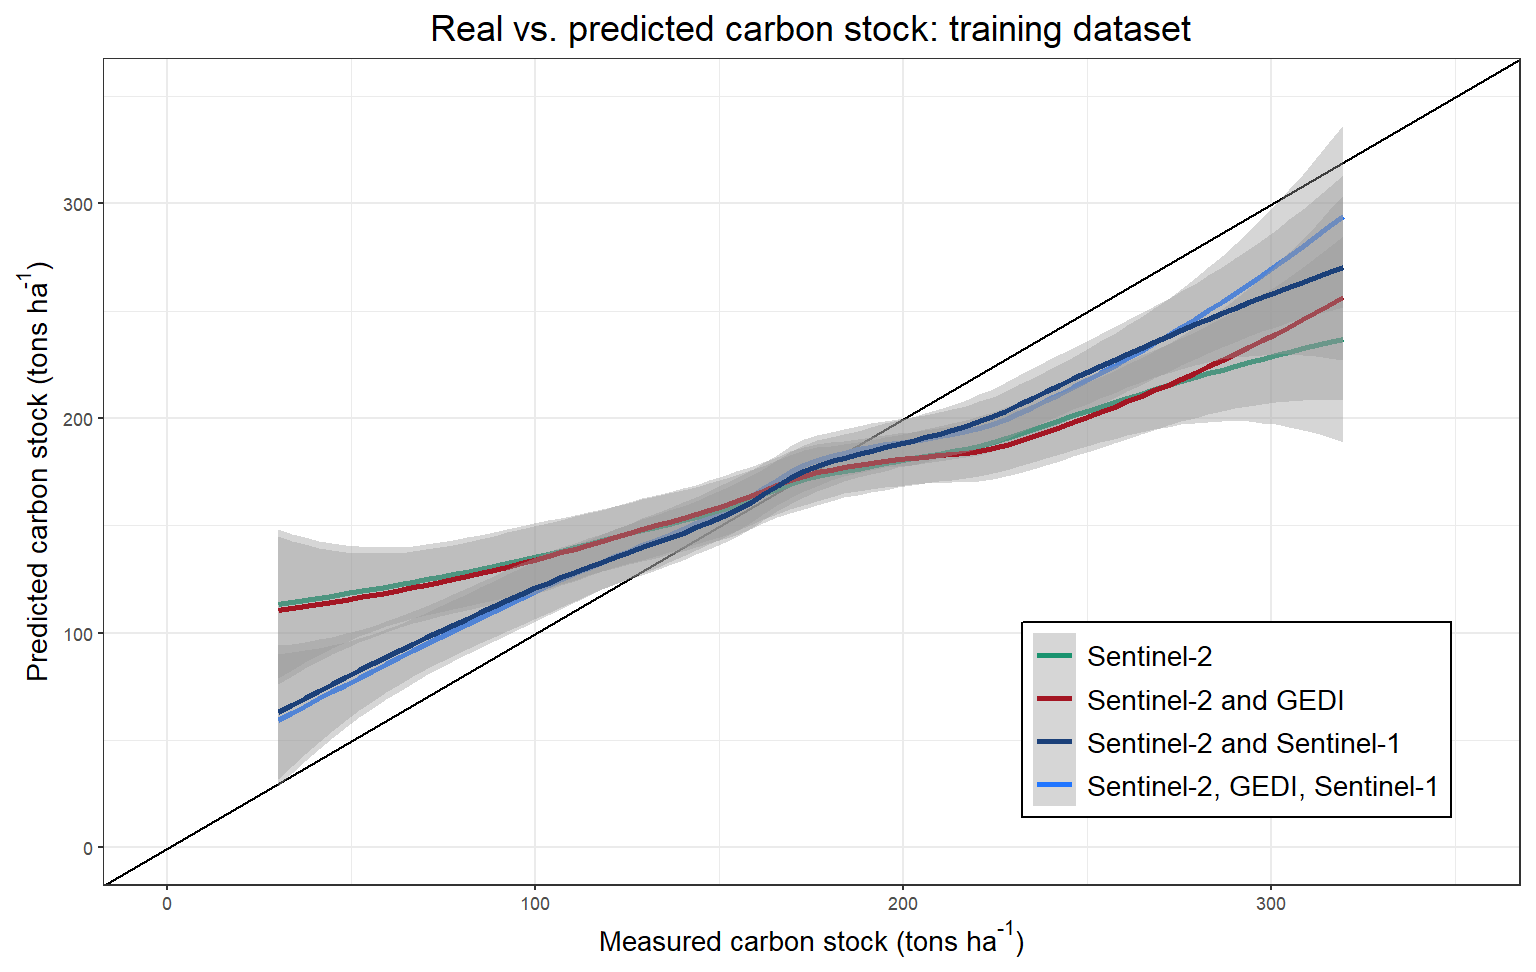
Figure 5Model prediction accuracy after the model training with different remote sensing components, compared to the bisector of perfect prediction (measured = predicted carbon stock).
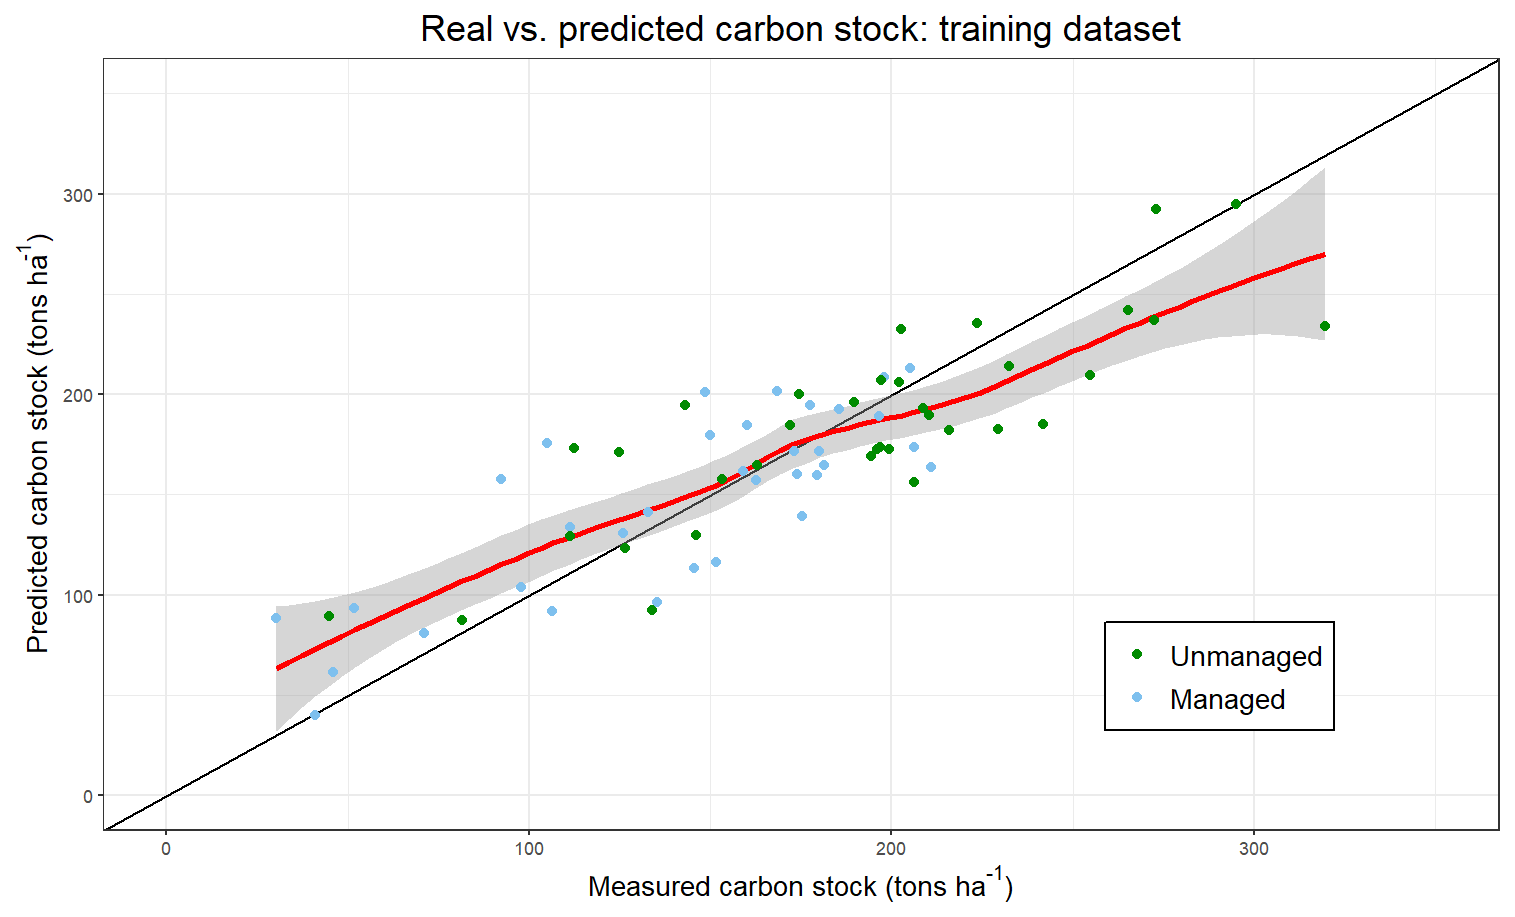
Figure 6The final model fit with all plots in the training data set, compared to the bisector of perfect prediction.
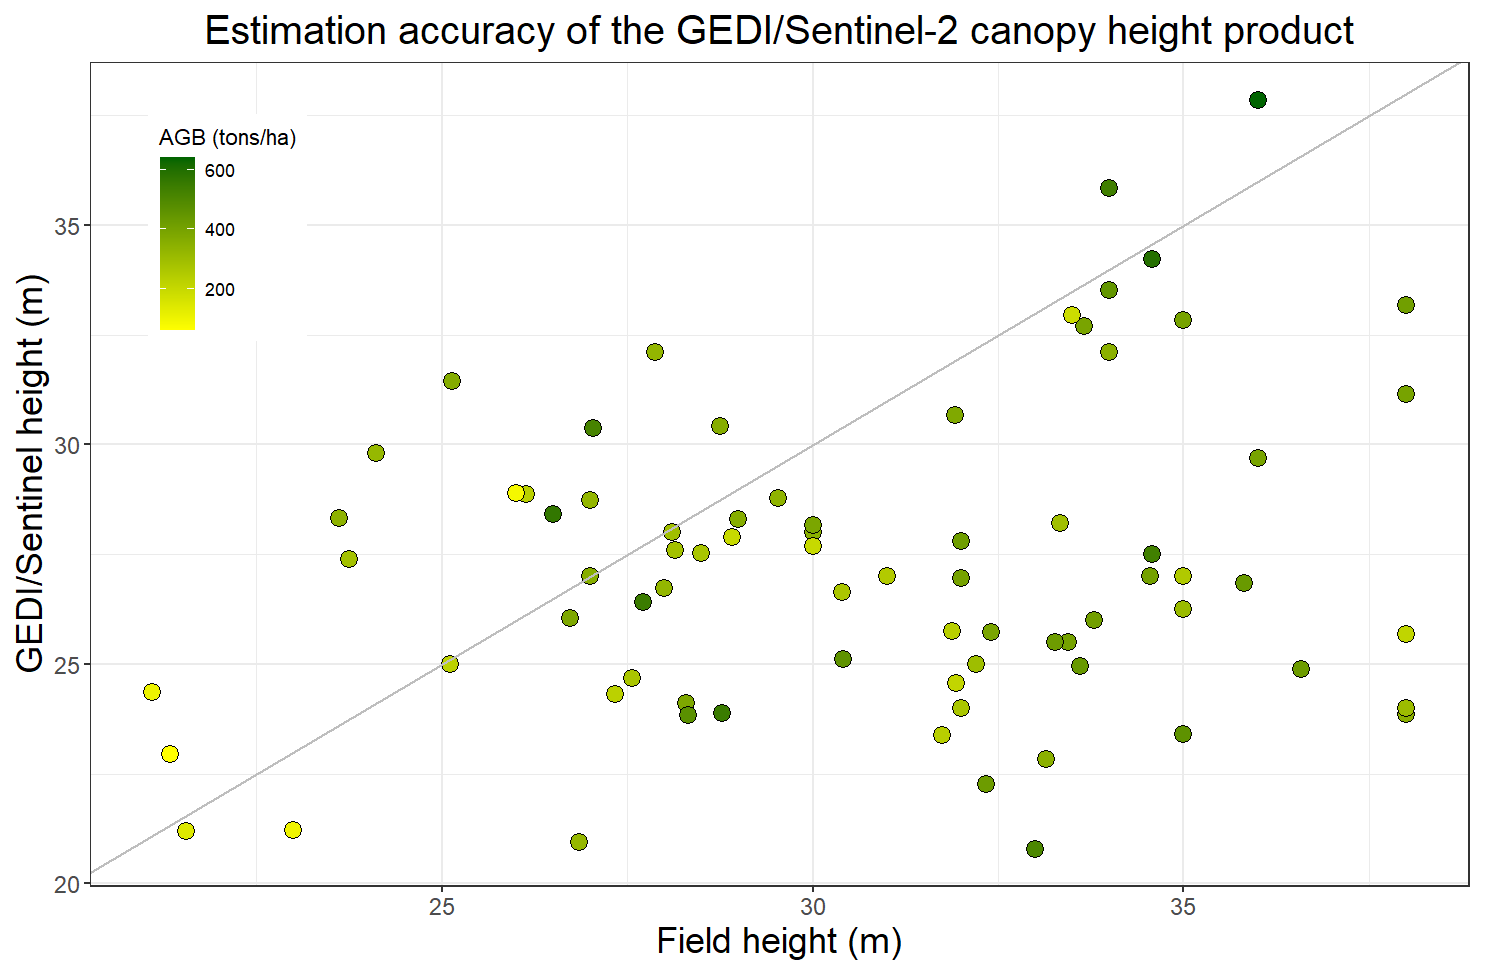
Figure 7Comparison of the canopy height estimates by the GEDI/Sentinel-2 product and the field measurements.
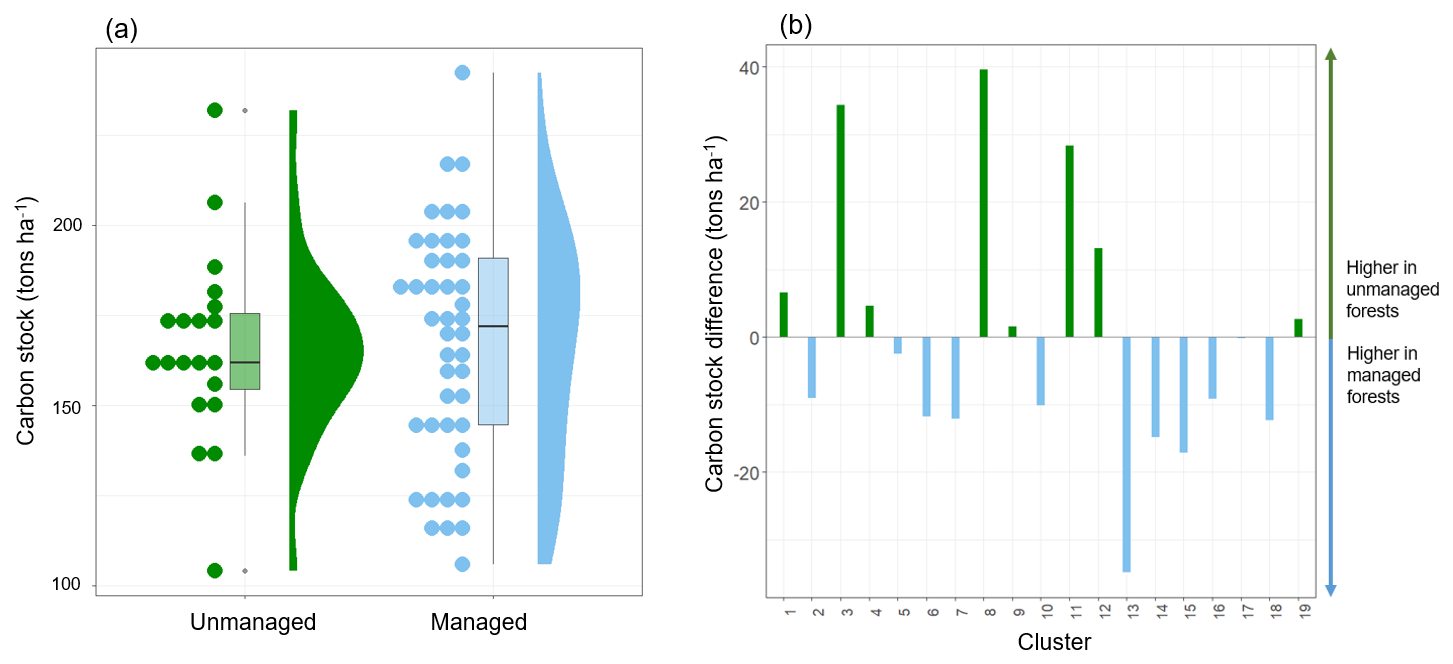
Figure 8Results of the carbon stock analysis comparing managed and unmanaged forests, as predicted by the remote sensing model, (a) comparing density distributions and (b) by calculating the difference in mean carbon stock per forest patch (unmanaged minus managed) for each cluster from pixel-level carbon predictions.
4.1 The effect of forest management on above-ground carbon stock
The field data allowed us to assess the effect of forest management on above-ground carbon stock in a pairwise comparison analysis and were then used as calibration data for a remote sensing model to predict the carbon stock at locations that were not measured in the field. The selection of forest patches, grouped into clusters, made it possible to extract the effect of forest management without confounding factors and included detailed information about the environmental conditions in the field. From the measured carbon stocks in the field, a significant difference between managed and unmanaged forest patches was detected in the BW NP. Tree density was higher in managed plots, primarily due to the predominance of smaller trees belonging to the lowest diameter class (nesting level A). A few managed plots were situated in dense regeneration, and unmanaged plots on average thus had fewer but larger trees (in height and diameter). In unmanaged plots, older trees continue growing without harvest, leading to higher biomass and carbon stock. The results align with Vanhellemont et al. (2024), who performed a similar study to compare above-ground carbon pools in set-aside forests and the average forest in Flanders. Even though our measured carbon stocks are higher, due to the fertile soil conditions in the NP BW, a similar trend was reported.
4.2 Carbon stock modeling with remote sensing
The prediction of forest above-ground carbon stock using remote sensing remains technologically challenging. However, this study demonstrates significant potential by combining multiple types of remote sensors, leading to improved model predictions. The study also highlights the limitations of remote sensing, as it was unable to effectively distinguish carbon stock differences between managed and unmanaged forests.
The model fit and predictive accuracy of the GAM did not change markedly when adding the dominant tree height as estimated from the GEDI/Sentinel-2 product. Even though saturation effects were slightly reduced, no real improvement in predictivity was noted. Even though the GEDI/Sentinel-2 product could accurately detect the relative canopy height differences between plots well, it appeared to systematically underestimate canopy height values as measured in the field, explaining the lack of additional explanatory power of the product. Lidar proved useful for biomass prediction at high forest AGB values in earlier research. Namely, the GEDI/Sentinel-2 product was developed with a focus on detecting tall canopies, which typically have large carbon stocks. Our findings do not align with previous research combining lidar and Sentinel-2 for above-ground biomass estimation, which reported enhanced predictivity of the model (Francini et al., 2022; Puliti et al., 2020).
The combination of optical remote sensing (for measuring photosynthetic activity and vegetation health) and C-band SAR (for measuring vegetation structure) on the other hand did improve model performance compared to the use of Sentinel-2 alone (R2 increased by 17 %, RMSE decreased by 40.23 t ha−1, MAE decreased by 41.20 t ha−1). Especially in dense forest structures, C-band (and X-band) microwave remote sensing proved successful for AGB estimation, which is also confirmed by our study (Chen et al., 2019; David et al., 2022; Forkuor et al., 2020; Hoscilo et al., 2018; Nuthammachot et al., 2022; Santoro et al., 2011; Thurner et al., 2014).
C-band radars are more sensitive to detecting leaves and needles than trunks and branches, in contrast to P- and L-band SAR (Rüetschi et al., 2018). The shorter wavelength interacts more strongly with smaller vegetation elements with a higher water content. Possibilities to improve predictions even more may lie in further integration of C-band with L-band SAR, which can enhance the detection of texture features, vegetation diversity, and density (Laurin et al., 2018). For example, Santoro et al. (2021) successfully estimated AGB at a global scale from the ALOS satellite (L-band) and Envisat (C-band). They report the combination of different sensors with varying spatial resolution as an important challenge and a source of systematic modeling errors at the regional level. This has however been a popular approach in the last years, with the CCI Biomass product as an important example. L-band SAR is generally more suited in high-biomass areas, as these longer wavelengths can penetrate deeper into the canopy than C-band wavelengths. Santoro et al. (2021) therefore implement a weighting scheme, where a different sensitivity of backscatter data from both sensors is applied depending on the growing stock volume. The successful implementation of multifrequency SAR data in remote-sensing-based analyses of AGB is also shown in other studies, such as Huang et al. (2018) and Musthafa and Singh (2022).
Even though a significant improvement in model performance was noted, the combination of sensors did not successfully detect the difference in carbon stock between managed and unmanaged forests. The understory, often insufficiently detected by remote sensing, did not appear problematic in our case study as the presence or absence of the smallest trees (<15 cm DBH) did not affect the model fit. Nevertheless, the mean absolute error was higher than the estimated carbon stock difference, indicating a high uncertainty. Moreover, the obtained estimated differences in mean carbon per patch did not fully align with the differences measured in the field. The unmanaged patches, which are mostly in the higher biomass ranges, appear to be underestimated by the GAM when considering the conventional field method as the ground truth (Fig. 6). In contrast, the model overestimates the biomass for managed patches. The underestimation of high biomass in unmanaged patches is likely due to signal saturation, a common issue when passive optical remote sensing and SAR struggle to detect complex forest structures. Although excluding plots with a biomass greater than 450 t ha−1 did not improve the model, a systematic underestimation for plots above 400 t ha−1 biomass (200 t ha−1 carbon stock) was observed for BW NP. This is most likely due to signal saturation, as noted in several previous studies (Hoscilo et al., 2018; Laurin et al., 2018). Second, low biomasses (mostly managed patches) were overestimated; this corresponds with the research of Hoscilo et al. (2018) and Zhang et al. (2023). A serious overestimation is reported for biomasses lower than 125 t ha−1 (Fig. 6). Fewer plots were measured in these outer ranges, which may lead to deviations, as well for low as for high biomasses. A solution could be to separately model managed and unmanaged patches, but more observations are then needed. Past management intensity was defined as one of the major drivers for above-ground carbon stock in Atlantic forests by Pires Coelho et al. (2022). Hence, management history may also overrule the effect of current management practices in remote sensing analyses.
The reduced training dataset (70 plots) may have limited the model's goodness of fit in general and adds an important uncertainty to the model's predictions. To assess this uncertainty, an convex hull approach was followed (Appendix B). A significant extrapolation error was identified due to the large number of predictors, but this was not found to be problematic. Namely, the training dataset rightfully represented the center of the feature space for each combination of two features, hereby including the majority of the pixels used for model application. Therefore, we assume the GAM is able to rightfully estimate values slightly outside the training dataset's feature space. Lastly, comparisons were made at patch level, reducing the error of prediction by taking the average of all pixels.
The time of non-management in our study design ranged from 20 to 40–45 years, corresponding to at least two thinning cycles in the paired managed forests and relating to an important time horizon in the context of international climate goals (e.g., the Green Deal). In addition to the technical limitations as described above, it is possible that the forest has not been left unmanaged for long enough to detect a difference through remote sensing, while it is already detectable by field measurements. This may be completely different in forests that have been set aside for much longer, but they cannot be found in the study region. Therefore, the results of this study are not to be generalized to all unmanaged forests, including primary forests.
Investigating the effects of different management practices, rotation lengths, and thinning regimes on carbon stock – along with the substitution effect of resulting wood products – was beyond the scope of this study. However, such research could lead to more specific management guidelines and decision rules. Additionally, while maximizing carbon stock is important, it should be noted that managed forests provide various benefits, including wood and non-wood forest products, and regulating and cultural services. Future studies should consider these ecosystem services, alongside carbon stock, in local contexts and explore the trade-offs between them.
In this study, a deeper methodological understanding on the potential and limitations of different remote sensing technologies was obtained in a case study where the effect of forest management on above-ground biomass carbon stock was assessed. Research in this domain holds significance in the context of international policy agreements to fight climate change, for example with carbon credit schemes, where accurate assessment of carbon stocks is essential for incentivizing forest conservation and restoration efforts. Unmanaged forests were found to store more carbon in their above-ground biomass than managed forests in the temperate Atlantic region. The combination of passive optical remote sensing and synthetic aperture radar improved the estimation of above-ground carbon stock compared to the use of passive optical remote sensing alone, while the addition of a canopy height product derived from spaceborne lidar did not further improve model performance. Nevertheless, observed carbon stock differences in the field were not detected by the multi-sensor remote sensing model due to saturation errors, a rather limited training dataset, and a high mean absolute model error.
First, disregarding all plots with a carbon stock >450 t ha−1 did not result in a better fit (Table A1): only the MAE decreased remarkably. Even though oversaturation was detected at a level of 200 t ha−1 carbon stock when plotting the GNDVI and B5 (the variables that are most prone to oversaturation) for all plots, this did not have a significant influence on the overall model fit. Second, only modeling carbon stock in nesting levels B and C (Table 1) did not result in a better fit either for all three validation parameters (Table A1). In a more detailed analysis, we found that leaving trees smaller than 15 cm DBH (50th percentile) out of the calibration dataset did not affect the model fit. While accounting for 50 % of the number of trees, they overall only store 4 % of the total carbon stock. Trees with a DBH>15 cm contain a substantial amount of carbon and were sufficiently detected by the model. Leaving these trees out of the field dataset resulted in a lower model fit.
Table A1Evolution of the model validation parameters during model optimization and the addition of multiple remote sensors.
Extrapolation errors may arise as a consequence of the rather small training dataset (N=70) used for model training, inducing unreliable predictions. To address this concern, the feature space delineated by the training database is calculated as a convex hull, following the approach of Renaud et al. (2022). By evaluating the share of pixels for model application that is situated in this space, the percentage of extrapolation can be assessed. However, due to the high number of features (7), and the resulting extremely narrow high-dimensional convex hull, a very large proportion of extrapolated pixels (98 %) were identified. Nevertheless, the training dataset provided a comprehensive representation of the total value range for each 2D combination of variables separately (Fig. B1). Values that only slightly differ from the training data variable range fall strictly outside the hull, though they are still believed to be in line with the training data. Even though labeled as “extrapolated pixels”, underestimated biomasses are in this case probably due to signal saturation rather than extrapolation errors. When allowing pixel values to deviate 5 % of the hull range for each variable, the percentage of extrapolated pixels decreases to 28 % (27 % without extreme outliers), underpinning this statement.
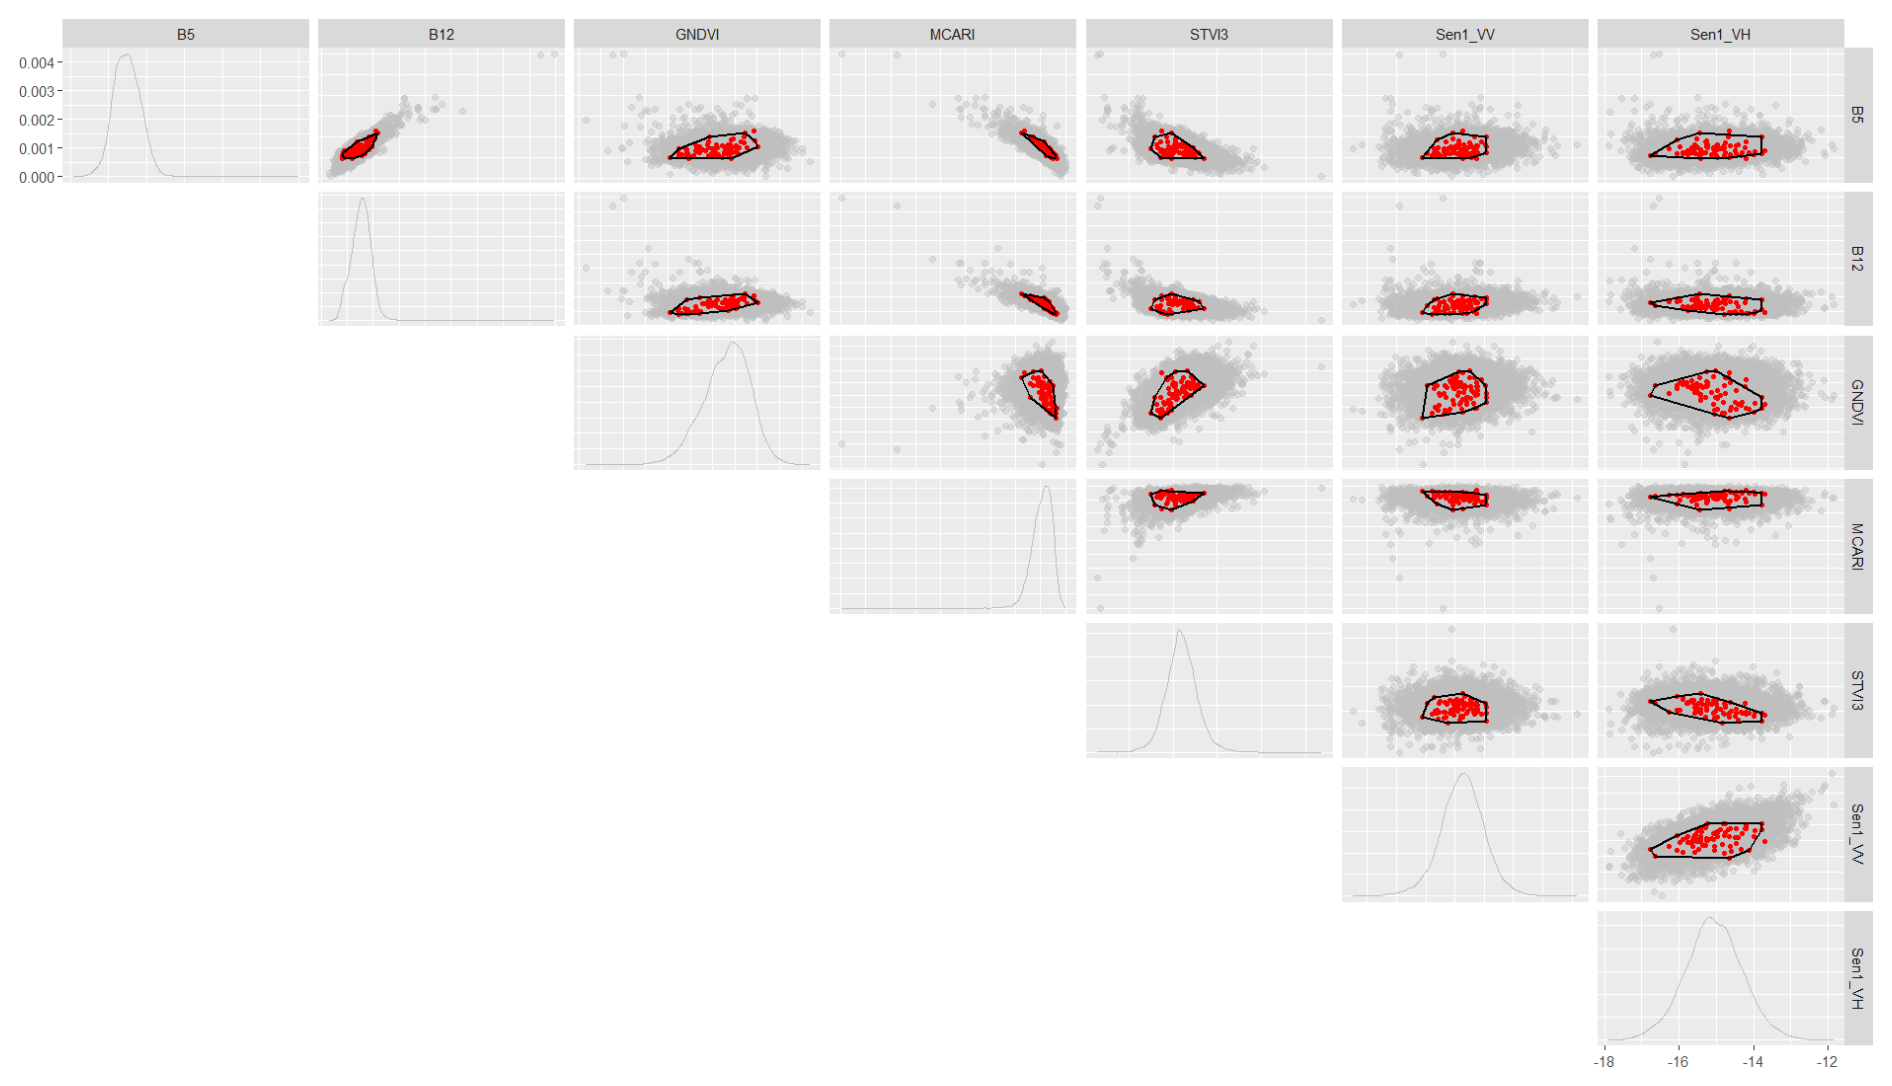
Figure B1The 2-dimensional representations of the 7-dimensional convex hull (black) of the training data (red) are shown for all combinations of predictors. A subset of 20 000 pixels used for model application are plotted in gray.
The R code and data used for this paper are publicly available on GitHub (https://github.com/sofievanwinckel/RemoteSensing_CarbonManagement (last access: 9 May 2025; DOI: https://doi.org/10.5281/zenodo.15631281, Van Winckel, 2025).
SVW and JS designed the field campaign and carried out the field measurements, under the supervision of BM. The formal analysis, validation, and visualization were performed by SVW, under the supervision of JS and BM. SVW prepared the original draft of the manuscript with review and editing contributions of JS, SL, and BM.
The contact author has declared that none of the authors has any competing interests.
Publisher's note: Copernicus Publications remains neutral with regard to jurisdictional claims made in the text, published maps, institutional affiliations, or any other geographical representation in this paper. While Copernicus Publications makes every effort to include appropriate place names, the final responsibility lies with the authors.
We thank the Flemish Agency for Nature and Forest for granting access to the field plots. Many thanks also go to Ilié Storms and Arne Van Wolputte for their great help with data collection in the field. We acknowledge the support of the EU Horizon Europe INFORMA project for data access and logistical support. Jonas Simons was funded by the INFORMA project. ChatGPT was used in this paper as a language assistant for improving the writing of this paper and for limited code editing.
This research has been supported by the EU Horizon Europe INFORMA project (grant no. 101060309).
This paper was edited by Mirco Migliavacca and reviewed by two anonymous referees.
Askar, Nuthammachot, N., Phairuang, W., Wicaksono, P., and Sayektiningsih, T.: Estimating Aboveground Biomass on Private Forest Using Sentinel-2 Imagery, J. Sensors, 6745629, 2018, https://doi.org/10.1155/2018/6745629, 2018.
Belgium: National Inventory Report (NIR), United Nations Framework Convention on Climate Change, https://unfccc.int/documents/224891 (last access: 20 November 2023), 2020.
Berben, J.: Dendrometrische studie van de Corsikaanse den, LISEC, Genk, 1983.
Bolar, K.: STAT: Interactive Document for Working with Basic Statistical Analysis, R package version 0.1.0, CRAN [code], https://CRAN.R-project.org/package=STAT (last access: 10 December 2024), 2019.
Brabantse Wouden: https://www.vlaamsbrabant.be/nl/natuur-en-milieu/brabantse-wouden, last access: 23 October 2023.
Chen, L., Wang, Y., Ren, C., Zhang, B., and Wang, Z.: Optimal Combination of Predictors and Algorithms for Forest Above-Ground Biomass Mapping from Sentinel and SRTM Data, Remote Sens.-Basel, 11, 414, https://doi.org/10.3390/rs11040414, 2019.
Dagnelie, P., Palm, R., Rondeux, J., and Thill, A.: Tables de cubage des arbres et des peuplements forestiers, Les presses agronomiques de Gembloux, ISBN 2-87016-062-3, 1985.
David, R. M., Rosser, N. J., and Donoghue, D. N. M.: Improving above ground biomass estimates of Southern Africa dryland forests by combining Sentinel-1 SAR and Sentinel-2 multispectral imagery, Remote Sens. Environ., 282, 113232, https://doi.org/10.1016/j.rse.2022.113232, 2022.
Dubayah, R., Blair, J. B., Goetz, S., Fatoyinbo, L., Hansen, M., Healey, S., Hofton, M., Hurtt, G., Kellner, J., Luthcke, S., Armston, J., Tang, H., Duncanson, L., Hancock, S., Jantz, P., Marselis, S., Patterson, P. L., Qi, W., and Silva, C.: The Global Ecosystem Dynamics Investigation: High-resolution laser ranging of the Earth’s forests and topography, Science of Remote Sensing, 1, 100002, https://doi.org/10.1016/j.srs.2020.100002, 2020.
Dugan, A. J., Birdsey, R., Healey, S. P., Pan, Y., Zhang, F., Mo, G., Chen, J., Woodall, C. W., Hernandez, A. J., McCullough, K., McCarter, J. B., Raymond, C. L., and Dante-Wood, K.: Forest sector carbon analyses support land management planning and projects: assessing the influence of anthropogenic and natural factors, Climatic Change, 144, 207–220, https://doi.org/10.1007/s10584-017-2038-5, 2017.
European Environment Agency: Forest Type 2018 (raster 100 m), Europe, 3-yearly, EEA [data set] https://doi.org/10.2909/db1af59f-f01f-4bd4-830c-f0eb652500c1, 2020.
Forkuor, G., Benewinde Zoungrana, J.-B., Dimobe, K., Ouattara, B., Vadrevu, K. P., and Tondoh, J. E.: Above-ground biomass mapping in West African dryland forest using Sentinel-1 and 2 datasets – A case study, Remote Sens. Environ., 236, 111496, https://doi.org/10.1016/j.rse.2019.111496, 2020.
Francini, S., D'Amico, G., Vangi, E., Borghi, C., and Chirici, G.: Integrating GEDI and Landsat: Spaceborne Lidar and Four Decades of Optical Imagery for the Analysis of Forest Disturbances and Biomass Changes in Italy, Sensors-Basel, 22, 2015, https://doi.org/10.3390/s22052015, 2022.
Garcia-Gonzalo, J., Peltola, H., Briceño-elizondo, E., and Kellomäki, S.: Changed thinning regimes may increase carbon stock under climate change: A case study from a Finnish boreal forest, Climatic Change, 81, 431–454, https://doi.org/10.1007/s10584-006-9149-8, 2007.
Goetz, S. J., Baccini, A., Laporte, N. T., Johns, T., Walker, W., Kellndorfer, J., Houghton, R. A., and Sun, M.: Mapping and monitoring carbon stocks with satellite observations: a comparison of methods, Carbon Balance Manag., 4, 2, https://doi.org/10.1186/1750-0680-4-2, 2009.
Goos, P.: Inleiding tot statistiek en kansrekenen, Acco, Leuven, 774, ISBN 9789463441858, 2017.
Gurung, M. B., Bigsby, H., Cullen, R., and Manandhar, U.: Estimation of carbon stock under different management regimes of tropical forest in the Terai Arc Landscape, Nepal, Forest Ecol. Manag., 356, 144–152, https://doi.org/10.1016/j.foreco.2015.07.024, 2015.
Hastie, T. and Tibshirani, R.: Generalized Additive Models, Stat. Sci., 1, 297–310, https://doi.org/10.1214/ss/1177013604, 1986.
Hoscilo, A., Aneta, L., Ziolkowski, D., Stereńczak, K., Lisańczuk, M., Schmullius, C., and Carsten, P.: Forest Aboveground Biomass Estimation Using a Combination of Sentinel-1 and Sentinel-2 Data, in: IGARSS 2018, IEEE International Geoscience and Remote Sensing Symposium, Valencia, Spain, 22–27 July 2018, 9026–9029, https://doi.org/10.1109/IGARSS.2018.8517965, 2018.
Huang, X., Ziniti, B., Torbick, N., and Ducey, M. J.: Assessment of Forest above Ground Biomass Estimation Using Multi-Temporal C-band Sentinel-1 and Polarimetric L-band PALSAR-2 Data, Remote Sens.-Basel, 10, 1424, https://doi.org/10.3390/rs10091424, 2018.
INFORMA: Science-based INtegrated FORest Mitigation mAnagement made operational for Europe: INFORMA Forest Management Platform, CORDIS – Eur. Comm., 46 pp., https://doi.org/10.3030/101060309, 2022.
IPCC: Good Practice Guidance for Land Use, Land-Use Change and Forestry. Institute for Global Environmental Strategies (IGES), Hayama, Japan, ISBN 4-88788-003-0, 2003.
Jandl, R., Lindner, M., Vesterdal, L., Bauwens, B., Baritz, R., Hagedorn, F., Johnson, D. W., Minkkinen, K., and Byrne, K. A.: How strongly can forest management influence soil carbon sequestration?, Geoderma, 137, 253–268, https://doi.org/10.1016/j.geoderma.2006.09.003, 2007.
Jiang, F., Deng, M., Tang, J., Fu, L., and Sun, H.: Integrating spaceborne LiDAR and Sentinel-2 images to estimate forest aboveground biomass in Northern China, Carbon Balance Manag., 17, 12, https://doi.org/10.1186/s13021-022-00212-y, 2022.
Jiao, Y., Wang, D., Yao, X., Wang, S., Chi, T., and Meng, Y.: Forest Emissions Reduction Assessment Using Optical Satellite Imagery and Space LiDAR Fusion for Carbon Stock Estimation, Remote Sens.-Basel, 15, 1410, https://doi.org/10.3390/rs15051410, 2023.
Kalies, E. L., Haubensak, K. A., and Finkral, A. J.: A meta-analysis of management effects on forest carbon storage, J. Sustain. Forest., 35, 311–323, https://doi.org/10.1080/10549811.2016.1154471, 2016.
Koch, B.: Status and future of laser scanning, synthetic aperture radar and hyperspectral remote sensing data for forest biomass assessment, ISPRS J. Photogramm., 65, 581–590, https://doi.org/10.1016/j.isprsjprs.2010.09.001, 2010.
Kun, Z., DellaSala, D., Keith, H., Kormos, C., Mercer, B., Moomaw, W. R., and Wiezik, M.: Recognizing the importance of unmanaged forests to mitigate climate change, GCB Bioenergy, 12, 1034–1035, https://doi.org/10.1111/gcbb.12714, 2020.
Kursa, M. and Rudnicki, W.: Feature Selection with Boruta Package, J. Stat. Softw., 36, 1–13, https://doi.org/10.18637/jss.v036.i11, 2010.
Lang, N., Schindler, K., and Wegner, J. D.: High carbon stock mapping at large scale with optical satellite imagery and spaceborne LIDAR, arXiv [preprint], https://doi.org/10.48550/arXiv.2107.07431, 15 July 2021.
Lang, N., Schindler, K., and Wegner, J. D.: Global canopy height map for the year 2020 derived from Sentinel-2 and GEDI, ETH Zurich [data set], https://doi.org/10.3929/ethz-b-000609802, 2022.
Lang, N., Jetz, W., and Wegner, J.: A high-resolution canopy height model of the Earth, Nature Ecology & Evolution, 7, 1–12, https://doi.org/10.1038/s41559-023-02206-6, 2023.
Laurin, G. V., Balling, J., Corona, P., Mattioli, W., Papale, D., Puletti, N., Rizzo, M., Truckenbrodt, J., and Urban, M.: Above-ground biomass prediction by Sentinel-1 multitemporal data in central Italy with integration of ALOS2 and Sentinel-2 data, J. Appl. Remote Sens., 12, 016008, https://doi.org/10.1117/1.JRS.12.016008, 2018.
Lu, D., Chen, Q., Wang, G., Moran, E., Batistella, M., Zhang, M., Vaglio Laurin, G., and Saah, D.: Aboveground Forest Biomass Estimation with Landsat and LiDAR Data and Uncertainty Analysis of the Estimates, Int. J. For. Res., 2012, 436537, https://doi.org/10.1155/2012/436537, 2012.
Luyssaert, S., Schulze, E.-D., Börner, A., Knohl, A., Hessenmöller, D., Law, B. E., Ciais, P., and Grace, J.: Old-growth forests as global carbon sinks, Nature, 455, 213–215, https://doi.org/10.1038/nature07276, 2008.
Melikov, C. H., Bukoski, J. J., Cook-Patton, S. C., Ban, H., Chen, J. L., and Potts, M. D.: Quantifying the Effect Size of Management Actions on Aboveground Carbon Stocks in Forest Plantations, Curr. For. Rep., 9, 131–148, https://doi.org/10.1007/s40725-023-00182-5, 2023.
Mikolāš, M., Piovesan, G., Ahlström, A., Donato, D. C., Gloor, R., Hofmeister, J., Keeton, W. S., Muys, B., Sabatini, F. M., Svoboda, M., and Kuemmerle, T.: Protect old-growth forests in Europe now, Science, 380, 466–466, https://doi.org/10.1126/science.adh2303, 2023.
Mngadi, M., Odindi, J., and Mutanga, O.: The Utility of Sentinel-2 Spectral Data in Quantifying Above-Ground Carbon Stock in an Urban Reforested Landscape, Remote Sens.-Basel, 13, 4281, https://doi.org/10.3390/rs13214281, 2021.
Moradi, F., Sadeghi, S. M. M., Heidarlou, H. B., Deljouei, A., Boshkar, E., and Borz, S. A.: Above-ground biomass estimation in a Mediterranean sparse coppice oak forest using Sentinel-2 data, Ann. For. Res., 65, 165–182, https://doi.org/10.15287/afr.2022.2390, 2022.
Morel, A. C. and Nogué, S.: Combining Contemporary and Paleoecological Perspectives for Estimating Forest Resilience, Front. For. Glob. Change, 2, 57, https://doi.org/10.3389/ffgc.2019.00057, 2019.
Musthafa, M. and Singh, G.: Improving Forest Above-Ground Biomass Retrieval Using Multi-Sensor L- and C-Band SAR Data and Multi-Temporal Spaceborne LiDAR Data, Front. For. Glob. Change, 5, 822704, https://doi.org/10.3389/ffgc.2022.822704, 2022.
Nadrowski, K., Wirth, C., and Scherer-Lorenzen, M.: Is forest diversity driving ecosystem function and service?, Curr. Opin. Env. Sust., 2, 75–79, https://doi.org/10.1016/j.cosust.2010.02.003, 2010.
Nuthammachot, N., Askar, A., Stratoulias, D., and Wicaksono, P.: Combined use of Sentinel-1 and Sentinel-2 data for improving above-ground biomass estimation, Geocarto Int., 37, 366–376, https://doi.org/10.1080/10106049.2020.1726507, 2022.
Perin, J., Bauwens, S., Pitchugin, M., Lejeune, P., and Hébert, J.: National Forestry Accounting Plan of Belgium, National Climate Commission, Belgium, 58 pp., https://www.cnc-nkc.be/sites/default/files/report/file/national_forestry_accounting_plan_-_belgium_-_18122019_1.pdf (last access: 20 November 2023), 2019.
Pires Coelho, A. J., Ribeiro Matos, F. A., Villa, P. M., Heringer, G., Pontara, V., de Paula Almado, R., and Alves Meira-Neto, J. A.: Multiple drivers influence tree species diversity and above-ground carbon stock in second-growth Atlantic forests: Implications for passive restoration, J. Environ. Manage., 318, 115588, https://doi.org/10.1016/j.jenvman.2022.115588, 2022.
Puliti, S., Hauglin, M., Breidenbach, J., Montesano, P., Neigh, C. S. R., Rahlf, J., Solberg, S., Klingenberg, T. F., and Astrup, R.: Modelling above-ground biomass stock over Norway using national forest inventory data with ArcticDEM and Sentinel-2 data, Remote Sens. Environ., 236, 111501, https://doi.org/10.1016/j.rse.2019.111501, 2020.
Quataert, P., Van der Aa, B., and Verschelde, P.: Opstellen van tarieven voro Inlandse eik en beuk in Vlaanderen ten behoeve van het berekenen van houtvolumes. Statistische evaluatie van de regressiemodellen en overzicht van de resultaten (technisch rapport deel III), Rapporten van het Instituut voor Natuuren Bosonderzoek 2011, 18, ISSN 1782-9054, https://publicaties.vlaanderen.be/view-file/9175 (last access: 20 November 2023), 2011.
Renaud, J. P., Sagar, A., Barbillon, P., Bouriaud, O., Deleuze, C., and Vega, C.: Characterizing the calibration domain of remote sensing models using convex hulls, Int. J. Appl. Earth Obs., 112, 102939, https://doi.org/10.1016/j.jag.2022.102939, 2022.
Rodríguez-Veiga, P., Wheeler, J., Louis, V., Tansey, K., and Balzter, H.: Quantifying Forest Biomass Carbon Stocks From Space, Curr. For. Rep., 3, 1–18, https://doi.org/10.1007/s40725-017-0052-5, 2017.
Rüetschi, M., Schaepman, M. E., and Small, D.: Using Multitemporal Sentinel-1 C-band Backscatter to Monitor Phenology and Classify Deciduous and Coniferous Forests in Northern Switzerland, Remote Sens.-Basel, 10, 55, https://doi.org/10.3390/rs10010055, 2018.
Ruiz-Peinado, R., Bravo-Oviedo, A., López-Senespleda, E., Bravo, F., and Río, M. D.: Forest management and carbon sequestration in the Mediterranean region: A review, For. Syst., 26, eR04S–eR04S, https://doi.org/10.5424/fs/2017262-11205, 2017.
Sabatini, F. M., de Andrade, R. B., Paillet, Y., Ódor, P., Bouget, C., Campagnaro, T., Gosselin, F., Janssen, P., Mattioli, W., Nascimbene, J., Sitzia, T., Kuemmerle, T., and Burrascano, S.: Trade-offs between carbon stocks and biodiversity in European temperate forests, Glob. Change Biol., 25, 536–548, https://doi.org/10.1111/gcb.14503, 2019.
Santoro, M., Beer, C., Cartus, O., Schmullius, C., Shvidenko, A., McCallum, I., Wegmüller, U., and Wiesmann, A.: Retrieval of growing stock volume in boreal forest using hyper-temporal series of Envisat ASAR ScanSAR backscatter measurements, Remote Sens. Environ., 115, 490–507, https://doi.org/10.1016/j.rse.2010.09.018, 2011.
Santoro, M., Cartus, O., Carvalhais, N., Rozendaal, D. M. A., Avitabile, V., Araza, A., de Bruin, S., Herold, M., Quegan, S., Rodríguez-Veiga, P., Balzter, H., Carreiras, J., Schepaschenko, D., Korets, M., Shimada, M., Itoh, T., Moreno Martínez, Á., Cavlovic, J., Cazzolla Gatti, R., da Conceição Bispo, P., Dewnath, N., Labrière, N., Liang, J., Lindsell, J., Mitchard, E. T. A., Morel, A., Pacheco Pascagaza, A. M., Ryan, C. M., Slik, F., Vaglio Laurin, G., Verbeeck, H., Wijaya, A., and Willcock, S.: The global forest above-ground biomass pool for 2010 estimated from high-resolution satellite observations, Earth Syst. Sci. Data, 13, 3927–3950, https://doi.org/10.5194/essd-13-3927-2021, 2021.
Schwehr, K.: Sentinel-2: Cloud Probability in Earth Engine, Version 1, Zenodo [data set], https://doi.org/10.5281/zenodo.7411046, 2020.
Sinha, S., Jeganathan, C., Sharma, L. K., and Nathawat, M. S.: A review of radar remote sensing for biomass estimation, Int. J. Environ. Sci. Te., 12, 1779–1792, https://doi.org/10.1007/s13762-015-0750-0, 2015.
Sun, X., Li, G., Wu, Q., Ruan, J., Li, D., and Lu, D.: Mapping Forest Carbon Stock Distribution in a Subtropical Region with the Integration of Airborne Lidar and Sentinel-2 Data, Remote Sens.-Basel, 16, 3847, https://doi.org/10.3390/rs16203847, 2024.
Thurner, M., Beer, C., Santoro, M., Carvalhais, N., Wutzler, T., Schepaschenko, D., Shvidenko, A., Kompter, E., Ahrens, B., Levick, S. R., and Schmullius, C.: Carbon stock and density of northern boreal and temperate forests, Global Ecol. Biogeogr., 23, 297–310, https://doi.org/10.1111/geb.12125, 2014.
Tian, L., Wu, X., Tao, Y., Li, M., Qian, C., Liao, L., and Fu, W.: Review of Remote Sensing-Based Methods for Forest Aboveground Biomass Estimation: Progress, Challenges, and Prospects, Forests, 14, 1086, https://doi.org/10.3390/f14061086, 2023.
Vanhellemont, M., Leyman, A., Govaere, L., De Keersmaeker, L., and Vandekerkhove, K.: Site-specific additionality in aboveground carbon sequestration in set-aside forests in Flanders (northern Belgium), Front. For. Glob. Change, 7, 1236203, https://doi.org/10.3389/ffgc.2024.1236203, 2024.
Van Winckel, S.: sofievanwinckel/RemoteSensing_CarbonManagement: Assessing the effect of forest management on above-ground carbon stock, v1.0, Zenodo [code and data set], https://doi.org/10.5281/zenodo.15631281, 2025.
Vayreda, J., Martinez-Vilalta, J., Gracia, M., and Retana, J.: Recent climate changes interact with stand structure and management to determine changes in tree carbon stocks in Spanish forests, Glob. Change Biol., 18, 1028–1041, https://doi.org/10.1111/j.1365-2486.2011.02606.x, 2012.
Wood, S. N.: Generalized Additive Models: An Introduction with R, Chapman & Hall/CRC, Boca Raton, 392 pp., https://doi.org/10.1201/9781315370279, 2006.
Xiao, J., Chevallier, F., Gomez, C., Guanter, L., Hicke, J. A., Huete, A. R., Ichii, K., Ni, W., Pang, Y., Rahman, A. F., Sun, G., Yuan, W., Zhang, L., and Zhang, X.: Remote sensing of the terrestrial carbon cycle: A review of advances over 50 years, Remote Sens. Environ., 233, 111383, https://doi.org/10.1016/j.rse.2019.111383, 2019.
Zhang, H., Zhang, Z., Liu, K., Huang, C., and Dong, G.: Integrating land use management with trade-offs between ecosystem services: A framework and application, Ecol. Indic., 149, 110193, https://doi.org/10.1016/j.ecolind.2023.110193, 2023.
Zianis, D., Muukkonen, P., Mäkipää, R., and Mencuccini, M.: Biomass and stem volume equations for tree species in Europe, Silva Fenn. Monographs, 4, 1–2, 5–63, ISBN 951-40-1983-0, 2005.