the Creative Commons Attribution 4.0 License.
the Creative Commons Attribution 4.0 License.
 | 04 Sep 2025
A national-scale redox clustering for quantifying CO2 emissions from groundwater denitrification
Julian Koch
Birgitte Hansen
Rasmus Jakobsen
Nitrate pollution from agriculture poses a significant global threat to the environment and to public health. In groundwater, nitrate can be reduced through denitrification, a process that produces dissolved inorganic carbon (DIC) via organic carbon (OC) mineralization and/or carbonate dissolution. This DIC acts as a net anthropogenic source of atmospheric CO2; however, its overall climatic impact remains poorly constrained. In this study, we quantified CO2 production from groundwater denitrification across Denmark using extensive observational datasets and national-scale modeling tools. A set of machine learning techniques was applied to cluster groundwater redox conditions and map the dominant electron donors for denitrification at the national scale. At the redox interface, denitrification was predicted to be mediated by pyrite oxidation in approximately 76 % of Denmark, with the remainder dominated by OC oxidation. Our results underscore the central role of hydrogeology in controlling the distribution of dominant electron donors. Spatial variability in CO2 production from groundwater denitrification was governed by nitrogen leaching and prevailing denitrification pathways. Assuming complete denitrification, we estimated that groundwater denitrification produces approximately 204 as DIC, of which ∼50 % is likely released into the atmosphere. The Intergovernmental Panel on Climate Change (IPCC) guidelines account for agricultural CO2 emissions from liming, urea, and other carbon-containing fertilizers, estimated at 246, 16 and 6 , respectively, for Denmark in 2022. Although CO2 comprises a minor share (∼2 %) of the total agricultural GHG emissions, our findings suggest that denitrification-derived CO2 should be included in agricultural GHG inventories.
- Article
(5922 KB) - Full-text XML
-
Supplement
(1577 KB) - BibTeX
- EndNote


The application of inorganic nitrogen (N) fertilizers and animal manure in agriculture is essential for global food production. However, their use poses significant environmental and public health risks (Diaz and Rosenberg, 2008; Galloway et al., 2003; Howarth et al., 2011; Jensen et al., 2023; Schullehner et al., 2018; Temkin et al., 2019; Trends et al., 2008; Ward et al., 2018). Reactive N, primarily in the form of nitrate (), leaches from agricultural soils into nearby aquatic ecosystems, leading to eutrophication and hypoxic “dead zones” in coastal areas (Diaz and Rosenberg, 2008; Galloway et al., 2003; Howarth et al., 2011). Elevated nitrate concentrations in drinking water are associated with several health risks, such as infant methemoglobinemia (blue-baby syndrome). The current regulatory limit for nitrate in drinking water (50 mg L−1 as nitrate) is set to prevent this condition, yet recent studies have shown that the risks of certain cancers and birth defects may increase at concentrations below this threshold (Jensen et al., 2023; Schullehner et al., 2018; Temkin et al., 2019; Ward et al., 2018).
Nitrogen fertilizers and manure are also a major source of anthropogenic greenhouse gases (GHGs; Gao and Cabrera Serrenho, 2023; Menegat et al., 2022; Mosier et al., 1998; Zamanian et al., 2018). Nitrate undergoes denitrification, a sequence of redox reactions that converts it to nitrite (), nitrogen monoxide (NO), nitrous oxide (N2O), and finally inert nitrogen (N2) gas. Nitrous oxide is a potent GHG, with 265 times the warming potential of carbon dioxide (CO2). Nearly all global N2O emissions originate from agricultural fertilizer applications (Ritchie et al., 2023), primarily from soils, while 10 %–15 % occurs via indirect pathways such as groundwater, streams, and estuaries (Gao and Cabrera Serrenho, 2023; Nielsen et al., 2024).
The use of N fertilizers and manure also contributes to soil acidification through microbial oxidation of ammoniacal fertilizer or urea application (Barak et al., 1997).
-
Nitrification of ammonia:
-
Nitrification of ammonium:
-
Hydrolysis of urea and nitrification of products:
Liming is commonly used to counteract acidification, but application of both liming and urea lead to CO2 emissions (Zamanian et al., 2018). In terms of CO2 equivalents (CO2 eq.), liming is comparable to the indirect N2O emissions (Gao and Cabrera Serrenho, 2023; Zamanian et al., 2018), while CO2 from urea is relatively insignificant (Nielsen et al., 2024).
During denitrification, CO2 is produced. When oxygen is completely depleted and reduced materials (electron donors) such as organic matter are available, nitrate can be reduced to N2 gas, simultaneously increasing dissolved inorganic carbon (DIC) in water (Eq. 1 in Table 1; Appelo and Postma, 2005; Seitzinger et al., 2006). Assuming complete denitrification, this process mineralizes organic carbon (shown as CH2O), releasing 5 mol of DIC per 4 mol of nitrate reduced. If denitrification is incomplete and terminates at N2O, only 4 mol of DIC are produced per 4 mol of nitrate reduced. Pyrite can be oxidized by oxygen (Eq. 3 in Table 1) as well as by nitrate (Eq. 2 in Table 1; Postma et al., 2012; Torrentó et al., 2010; Zhang et al., 2009). Both reactions (2 and 3) produce protons that can dissolve carbonate minerals if present (Eq. 5 in Table 1).
Table 1Reactions considered in this study and key stoichiometric ratios of the reactions.
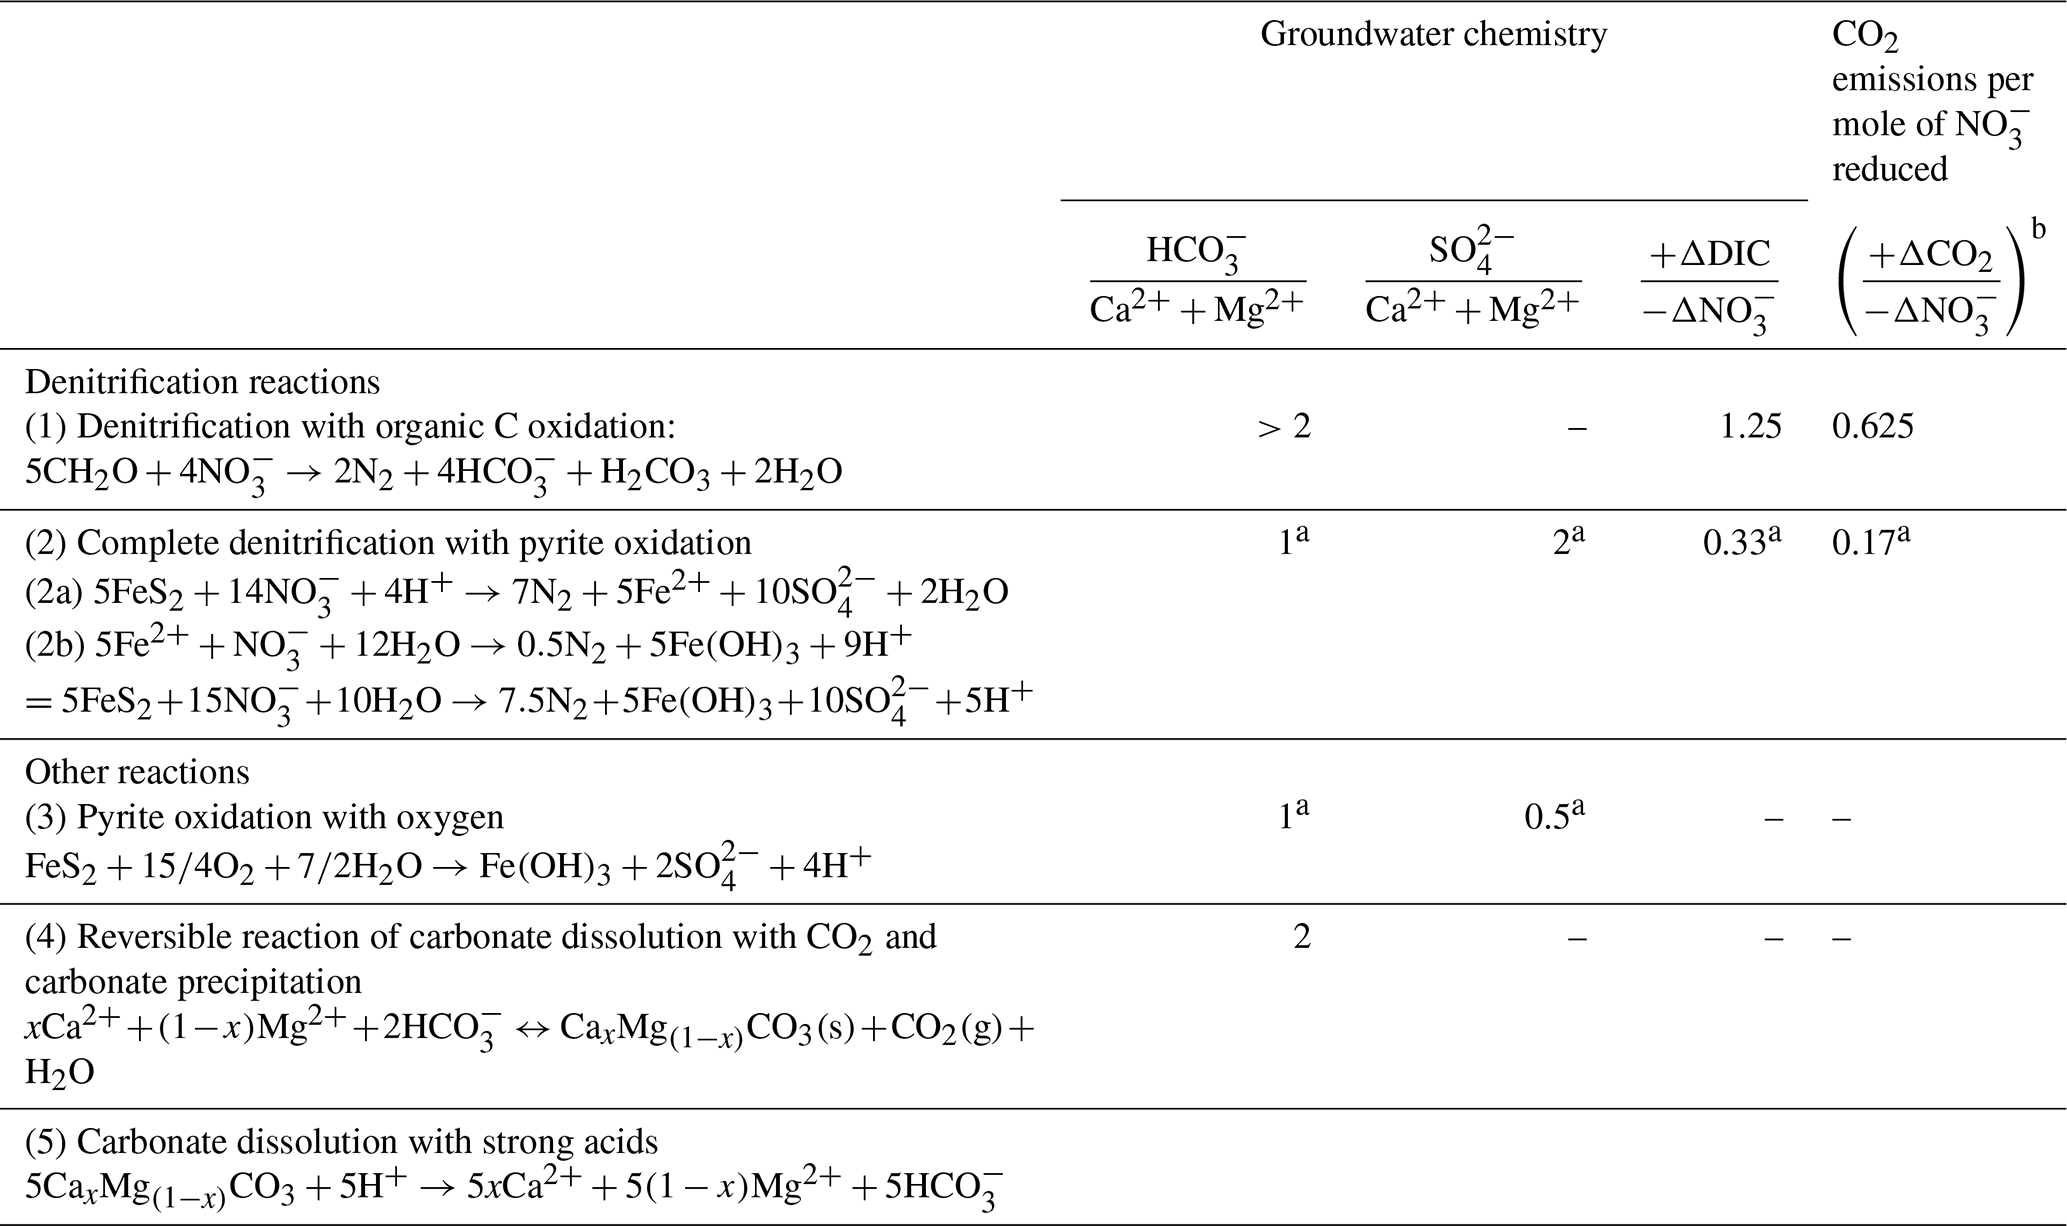
a Coupled with carbonate dissolution. b In the case of calcite saturation.
These processes elevate DIC levels in streams and groundwater, which naturally have significantly higher partial pressure of CO2 (pCO2) than the atmosphere, largely due to soil respiration, resulting in CO2 outgassing from these waters (Duvert et al., 2018; Macpherson, 2009; Martinsen et al., 2024). If groundwater or stream water reaches the saturation point of calcite as CO2 degasses, calcite will precipitate (Eq. 4 in Table 1). In this case, while 1 mol of DIC is re-stored as calcite, the other is released as CO2. This series of processes, i.e., from denitrification to calcite precipitation, does not involve atmospheric CO2 but is triggered by anthropogenic nitrogen input primarily from agriculture, making them a net anthropogenic source of atmospheric CO2.
Globally, approximately 50 teragrams (Tg; 1012 g) of reactive N is lost from agricultural soils annually through leaching and erosion (Liu et al., 2010), and the subsurface serves as a large reservoir of reactive N (Ascott et al., 2017). Denitrification of this leached reactive N below the soil layer could represent a significant indirect pathway for agriculturally derived CO2 emissions. Unlike nitrate in streams and/or estuaries, which could promote primary productivity and thus the fixing of CO2, nitrate in groundwater is simply a pollutant and a potential source of CO2 when it is reduced. Furthermore, compared to direct emissions from soil, which occur promptly, indirect pathways via groundwater exhibit dispersed and delayed signals due to long and variable transit times (Basu et al., 2022; Meals et al., 2010). This delay could potentially undermine the effectiveness of climate mitigation efforts and increase the uncertainty in GHG inventories and future projections.
Despite their potential relevance, CO2 emissions from denitrification, particularly in groundwater, have not been systematically quantified. According to the Intergovernmental Panel on Climate Change (IPCC) guidelines, anthropogenic GHG emissions from managed soils – “lands where human interventions and practices have been applied to perform production, ecological, or social functions” (IPCC, 2006) – include (1) direct (i.e., soil) and indirect (i.e., stream, groundwater, and estuary) N2O emissions from N fertilizer inputs and (2) direct (i.e., soil) CO2 emissions from liming, urea, and other carbon-containing fertilizers. CO2 emissions from denitrification are not currently included in the IPCC framework (IPCC, 2006). Compared to methane (CH4) and N2O, CO2 contributes a minor share of the total GHG emissions from agriculture. However, the IPCC guidelines require accounting for each GHG individually unless there are specific methodological reasons for aggregation (IPCC, 2006). Thus, all anthropogenic sources of CO2 in agriculture are required to be accounted for, regardless of magnitude.
This study, therefore, aims to quantify CO2 release from denitrification of nitrate derived from agricultural N fertilizer use in the context of national GHG inventories. To enable this quantification, we assumed complete denitrification. While incomplete denitrification can result in the production of N2O, which has a substantial climate impact, this N2O is typically further reduced to N2 in deeper anoxic aquifers (Jurado et al., 2017). As a result, the fraction of N2O emitted from groundwater is generally insignificant compared to the total amount of nitrate denitrified in groundwater. For instance, Bouwman et al. (2013) estimated that about 1 % of total groundwater denitrification results in N2O emissions, and the most recent IPCC guidelines suggest that 0.6 % of leached N would be ultimately emitted as N2O from groundwater (IPCC, 2019; Tian et al., 2019). Furthermore, N2O production and reduction processes are highly heterogeneous in space and time (Clough et al., 2007; Jahangir et al., 2013; Jurado et al., 2017; McAleer et al., 2017). While these hotspots and hot moments may be relevant for local-scale assessments, they are unlikely to significantly influence large-scale GHG budgets. Therefore, we believe that assuming complete denitrification is a reasonable approximation for large-scale assessments such as this study.
In Denmark, a national groundwater monitoring program provides extensive long-term groundwater chemistry data across the country (Thorling et al., 2024). Additionally, the National Nitrogen Model (den Nationale Kvælstof Model; NKM) provides a national N budget at the catchment scale (Højberg et al., 2021). These data and tools effectively transform Denmark into a virtual laboratory for quantitative and systematic investigations of CO2 emissions from denitrification at the national scale. Using these resources along with machine learning techniques, we addressed three specific objectives: (1) characterization of the geochemical architecture of Danish groundwater, focusing on redox conditions and dominant electron donors for denitrification; (2) prediction of a national map of denitrification electron donors (i.e., a redox cluster map); and (3) quantification of the CO2 emissions from groundwater denitrification in the context of the agricultural GHG emissions in Denmark.
2.1 Groundwater chemistry data
Groundwater chemistry data were retrieved from the National Borehole Database, Jupiter (http://www.geus.dk, last access: 30 November 2022), in November 2022. The dataset includes all the groundwater chemistry data deposited in Jupiter in the period of 1890–2022. A total of 186 887 records from 36 216 screens across the country were extracted. Some wells have multiple screens. To ensure the data quality and integrity, the dataset was cleaned using five exclusion criteria, removing (1) wells within a 100 m buffer zone of landfill sites; (2) wells identified as contaminated with micro-organic pollutants by the Danish Environmental Protection Agency; (3) records with incomplete geographical information (x, y, and screen depth); (4) duplicate entries; and (5) records with detection limits exceeding 1 mg L−1 for , , Ca2+, Mg2+, and , indicating low analytical quality. Post-cleaning, the dataset contained 115 276 records from 24 323 screens, primarily collected between 1990 and 2020.
Approximately 70 % of these screens were sampled only once, with varying combinations of solutes measured. For further analysis, we selected screens that (1) had at least five measurements of , , , Ca2+, and Mg2+ over the entire period and (2) had at least one measurement for pH, Fe2+, Mn2+, CH4, , Na+, and Cl−. This process resulted in 6272 screens being included in the final dataset. Finally, values below detection limits were converted to half of the detection limit.
2.2 Characterization of redox architecture of the Danish groundwater
The cleaned dataset was analyzed to categorize redox conditions and to identify dominant processes by combining two machine learning techniques: nonnegative matrix factorization (NMF) and K-means clustering. The analyses were done in MATLAB using built-in functions. Both methods are widely used to identify sources and underlying processes of water chemistry (Haggerty et al., 2023; Kim et al., 2021a; Shaughnessy et al., 2021; Vesselinov et al., 2018). Specifically, the results of NMF can be interpreted as endmembers and their mixing ratios (Haggerty et al., 2023; Shaughnessy et al., 2021; Vesselinov et al., 2018), which we used as a pre-processing step before applying K-means clustering. Since groundwater chemistry can be influenced by mixing and/or result from a series of processes, this approach reduced data dimensionality and enhanced the robustness of the subsequent clustering.
NMF decomposes the original matrix (V) into two nonnegative matrices: one representing endmember compositions (H) and the other representing the contributions (i.e., mixing proportion, W) of these endmembers in the context of hydrogeochemistry:
The optimal number of endmembers was determined using the elbow method, which is commonly used in clustering analysis to find the optimal number of clusters by plotting the sum of squared error (SSE) as a function of the clusters (Syakur et al., 2018). In our study, the optimal number of endmembers was identified at the minimum reconstruction error. The mixing ratios (matrix W) were subsequently used for K-means clustering. The silhouette score – a measure of how well each data point fits within its own cluster while remaining well-separated from others – and within-cluster sum of square (WCSS) – a measure of the variability within each cluster – were used to determine the optimal cluster number. K-means clustering was repeated 50 times to achieve the highest silhouette score and the lowest WCSS.
To further supervise the NMF and clustering analysis, we computed the mean stoichiometric ratios of and at the screen level. To minimize the impact of outliers, the stoichiometric ratios were calculated by randomly selecting 70 % of the data for each screen and calculating the mean ratios 20 times. Outliers from these subsets were excluded from the final mean ratio calculations for each screen. These two ratios can provide insights into the dominant processes and the source of DIC. When carbonate dissolution occurs due to carbonic acid from CO2, the ratio equals 2, with no effect on concentrations (Fig. 1a, Eq. 4 in Table 1). If carbonate dissolution is coupled with pyrite oxidation, the ratio becomes 1, and its ratio will be either 2 (with nitrate; Eqs. 2 and 5 in Table 1, Fig. 1a) or 0.5 (with oxygen; Eqs. 3 and 5 in Table 1, Fig. 1a). When organic carbon mineralization occurs without carbonate minerals, concentrations increase without changing the Ca2+ and Mg2+ concentrations, resulting in a ratio greater than 2 (Fig. 1a). Additionally, the means of all the available constituents were also calculated at the screen level, and redox-sensitive elements such as nitrate, sulfate, iron, and methane were included in the analysis to interpret the redox conditions of the clusters (all the elements listed in Table S1 in the Supplement). All values were log transformed and normalized before analysis.
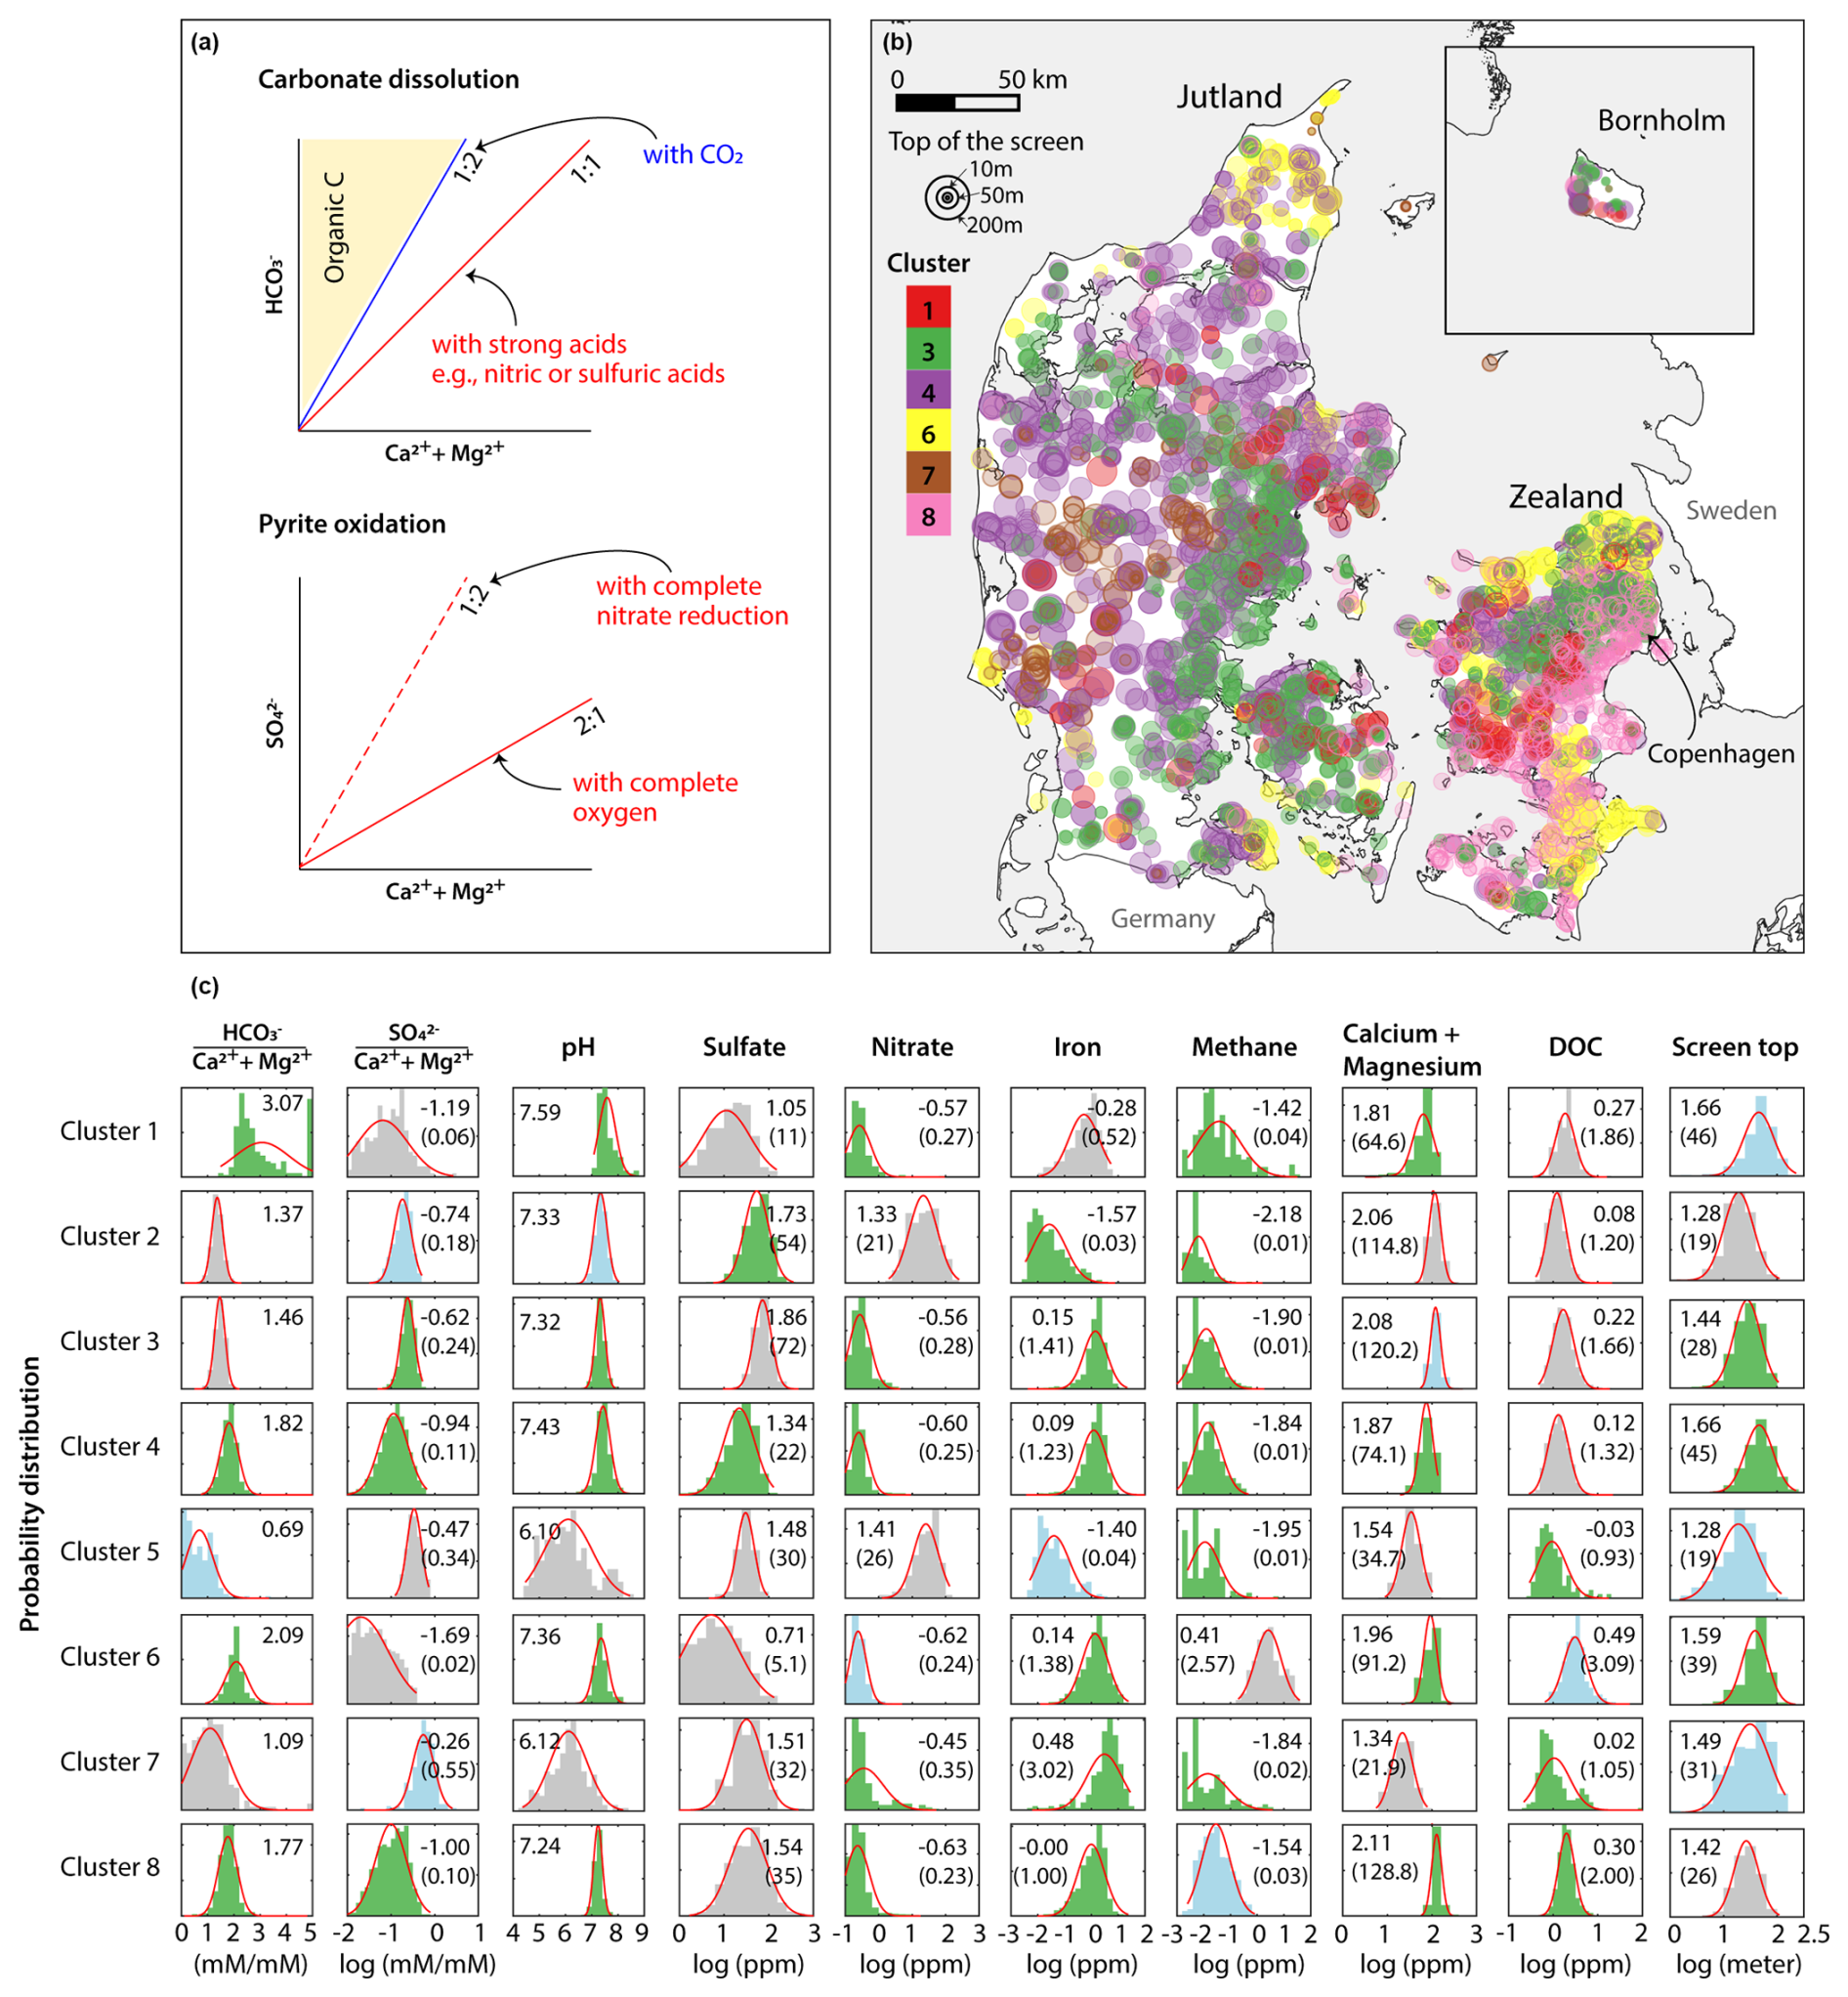
Figure 1Overview of the groundwater chemistry analysis results. (a) Theoretical relationships of vs. and vs. for key processes of the study. (b) Map of cluster distribution. Marker colors represent different clusters, and marker sizes indicate the depth to the top of the screen. The oxic clusters (cluster 2 and 5) are not shown (available in Fig. S2 in the Supplement). (c) Histograms of the nonnegative matrix factorization (NMF) and K-means clustering results for groundwater. The red lines represent the probability distribution function of a normal distribution. The green, blue, and gray bars correspond to p values of <0.01, 0.01−0.05, and >0.05, respectively. The values displayed in the histograms are means (μ), and the numbers in parentheses are back-transformed values.
2.3 Prediction of a national map of redox clusters at the redox interface
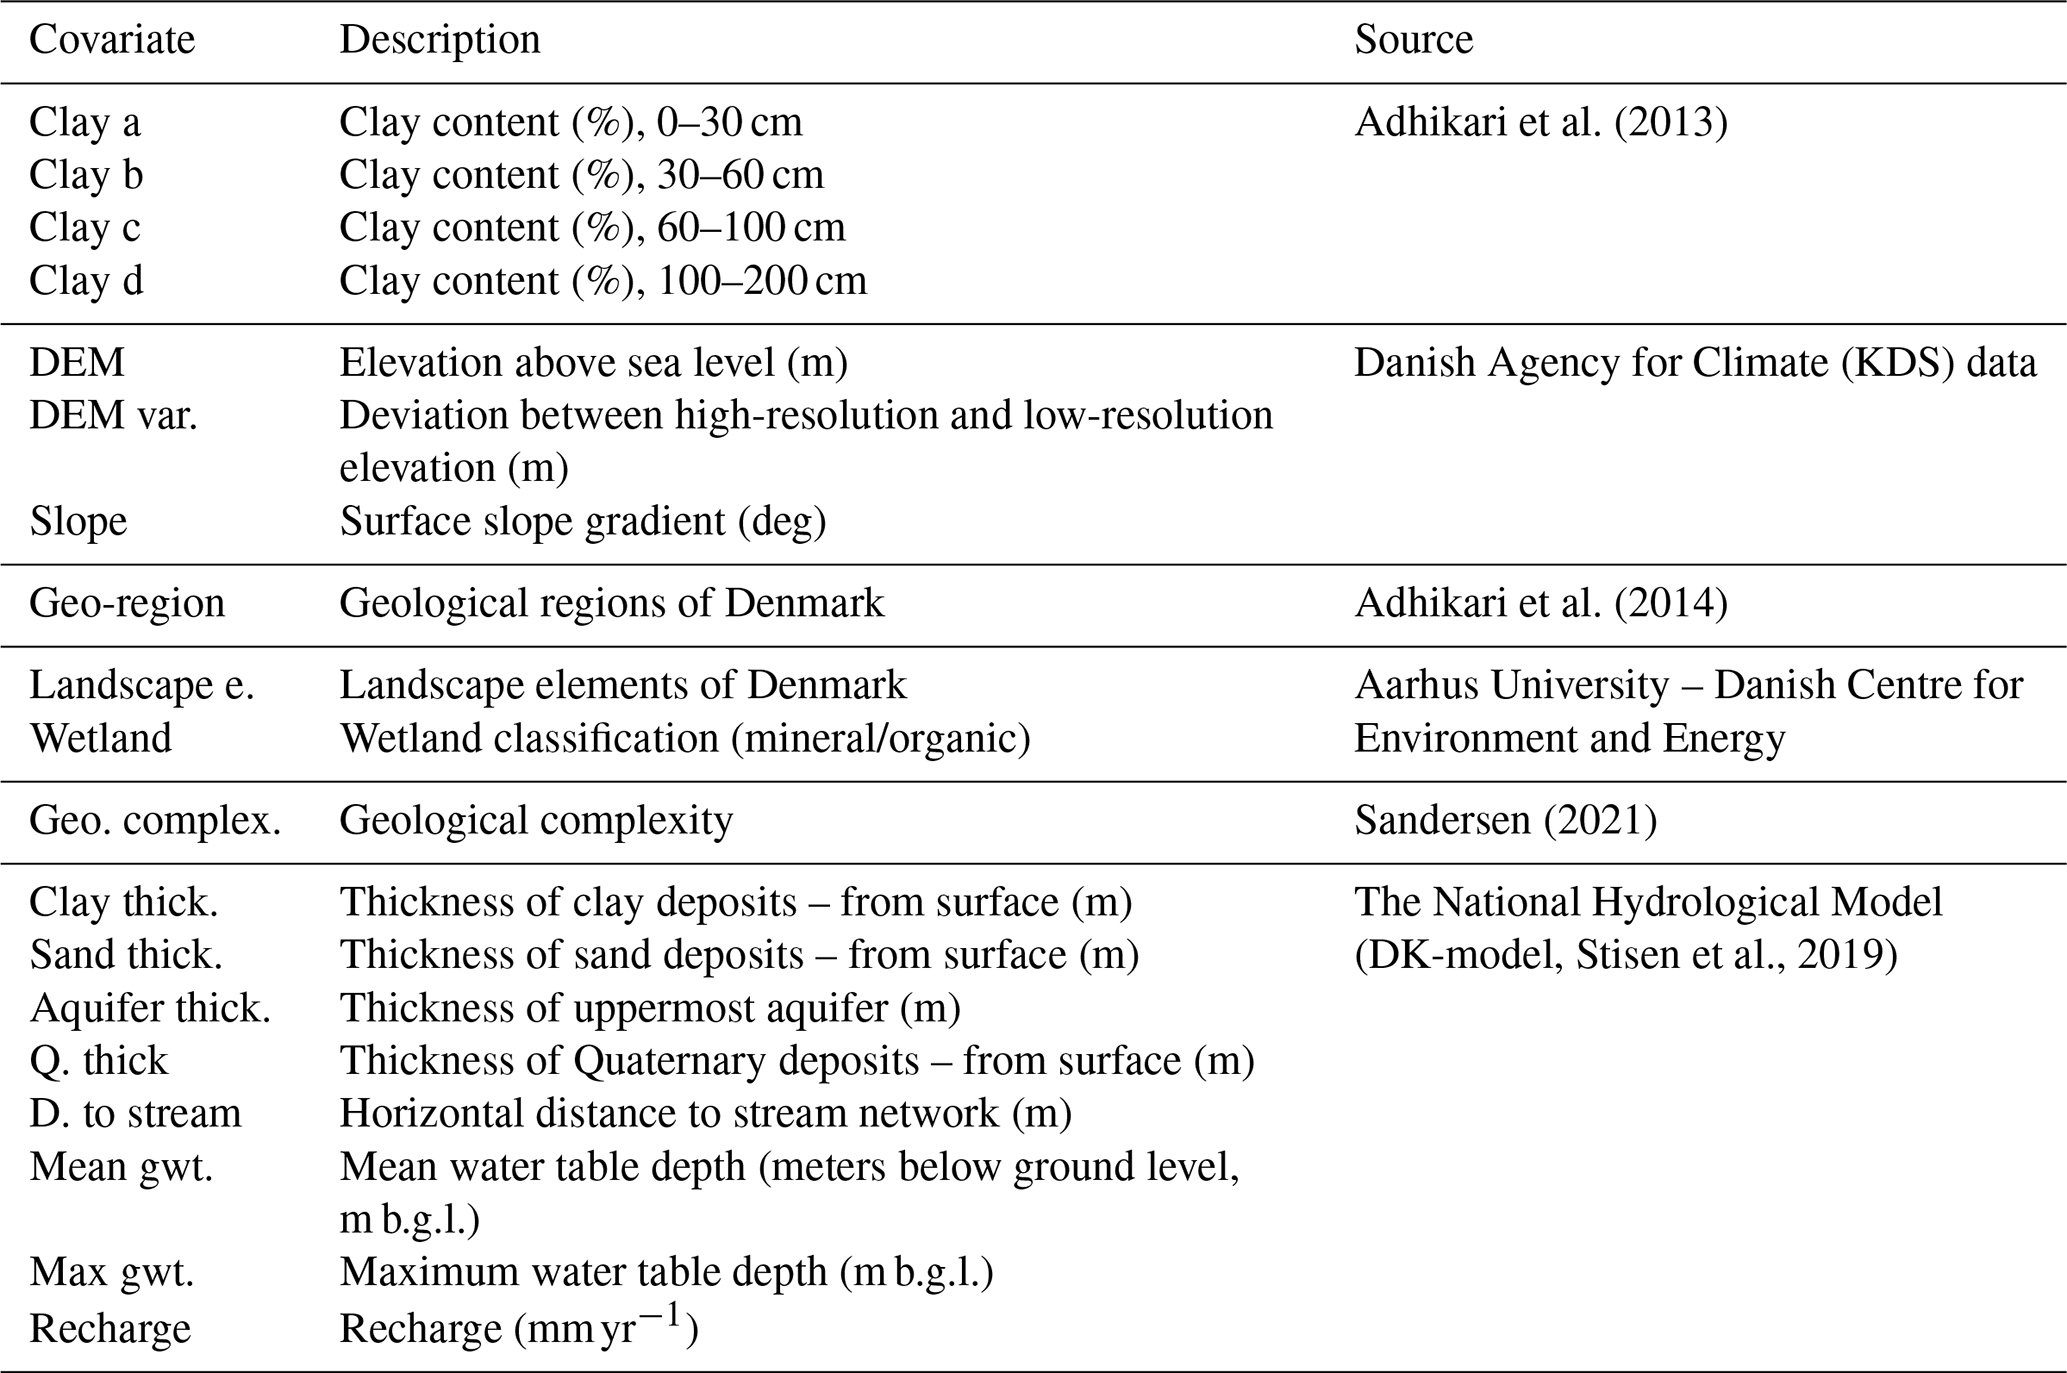
After identifying the redox clusters and dominant processes in groundwater, this point-scale information was upscaled to the national scale to predict dominant electron donors of denitrification at the redox interface, defined by the interface between the nitrate-reducing and iron-reducing zones. In Denmark, due to glaciotectonic deformation during the most recent glaciations, the complexity of the redox architecture varies significantly, resulting in multiple redox interfaces (Kim et al., 2019; Koch et al., 2024). Koch et al. (2024) predicted the depth to the first redox interface as well as its structural complexity at the national scale at a 25 m×25 m resolution based on sediment color data and 20 explanatory variables (Table 2) using a gradient boosting with decision tree (GBDT) algorithm (Koch et al., 2024). Using the same method and variables, we predicted a national-scale map of redox clusters at a 100 m×100 m resolution. GBDT is a commonly used machine learning technique in various fields for solving prediction tasks in both classification and regression. Through iterative training, GBDT builds ensemble-based prediction models using weak learners (i.e., decision trees). The ensemble is iteratively improved by adding decision trees that focus on correcting the residuals of the previous model. We used Microsoft's LightGBM (light gradient boosting machine) implementation of the GBDT algorithm in this study (Ke et al., 2017).
Table 2Explanatory variables for prediction of the redox cluster map.
For the prediction of the redox cluster map, we first excluded groundwater screens from (1) oxic clusters (about 14 % of the total screens) and (2) reduced clusters with a silhouette score less than 0 (about 13 % of the total screens). Among the remaining screens, we selected those located near the redox interface. Considering the uncertainty in the redox interface map (Koch et al., 2024) and the availability of the groundwater chemistry data used for clustering, three subsets of groundwater chemistry data were selected: those where the depths of the screen tops were no more than 5 (D5), 10 (D10), and 15 m (D15) below the redox interface. This resulted in 235 (D5), 566 (D10), and 1019 (D15) screens for training, respectively (Fig. S1 in the Supplement). The three depth-derived models were evaluated based on a two-fold cross validation procedure, in which two models used 50 % of the data for training and validated against the remaining 50 %. The model's uncertainty was quantified through bootstrapping by repeatedly training the classification model and predicting the redox cluster map. We generated 100 realizations of the redox cluster map for each depth criterion, each based on bootstrapped samples (with replacement).
The Shapley additive explanation (SHAP) approach was employed to assess the sensitivity of the trained classification models, i.e., feature importance (Lundberg and Lee, 2017). SHAP, which is based on game theory principles, explains the output of machine learning models by attributing predictions to individual covariates, quantifying their marginal contributions. In this study, absolute SHAP values were used to measure feature importance. SHAP values are reported for each class, i.e., each cluster in the classification model, and as an average across the classes.
2.4 Estimation of DIC produced by denitrification in groundwater
DIC production due to denitrification was estimated by combining the predicted redox cluster maps with the average of groundwater nitrate reduction estimates from 1990 to 2010 provided by the National Nitrogen Model (NKM). NKM is a comprehensive model that links three existing sets of models (Henriksen et al., 2003; Højberg et al., 2015, 2017): (1) empirical statistical models for reactive N leaching from the root zone (NLES; Børgesen et al., 2020), (2) the National Hydrological Model (DK-model; Stisen et al., 2019) with particle tracking in MIKE-SHE for groundwater and drain flow and nitrate reduction, and (3) statistical models for nitrate reduction in surface waters such as streams and lakes. Nitrate reduction is simulated at the catchment level, where the average catchment size is roughly 15 km2. Nitrate reduction in groundwater is calculated based on the fraction of particles passing through the redox interface, assuming instantaneous and complete denitrification at the interface. The NKM was developed, calibrated, and validated using 21 years of measurements from 340 stream stations, covering approximately half of Denmark.
The groundwater nitrate reduction estimates () at the catchment level, provided in shapefile format, were converted into a GeoTIFF file using QGIS to match the extent and grid size (100 m×100 m) of the redox cluster map. For each of the 100 realizations of the redox cluster maps, the groundwater nitrate reduction and cluster data were linked at the grid level using MATLAB. DIC production for each grid cell (i) was calculated by multiplying groundwater nitrate reduction (GNRi) and the stoichiometric ratio of DIC production per nitrate reduction for the respective cluster (ri):
where the ri values are 1.25 for denitrification by organic carbon and 0.33 for denitrification by pyrite oxidation coupled with carbonate dissolution (Table 1). The estimated DIC production was first summed up for the catchment level and then for the national level. The mean (μ) and standard deviation (σ) of DIC production from the 100 realizations for D5, D10, and D15 were calculated using MATLAB.
3.1 Redox architecture of the Danish groundwater
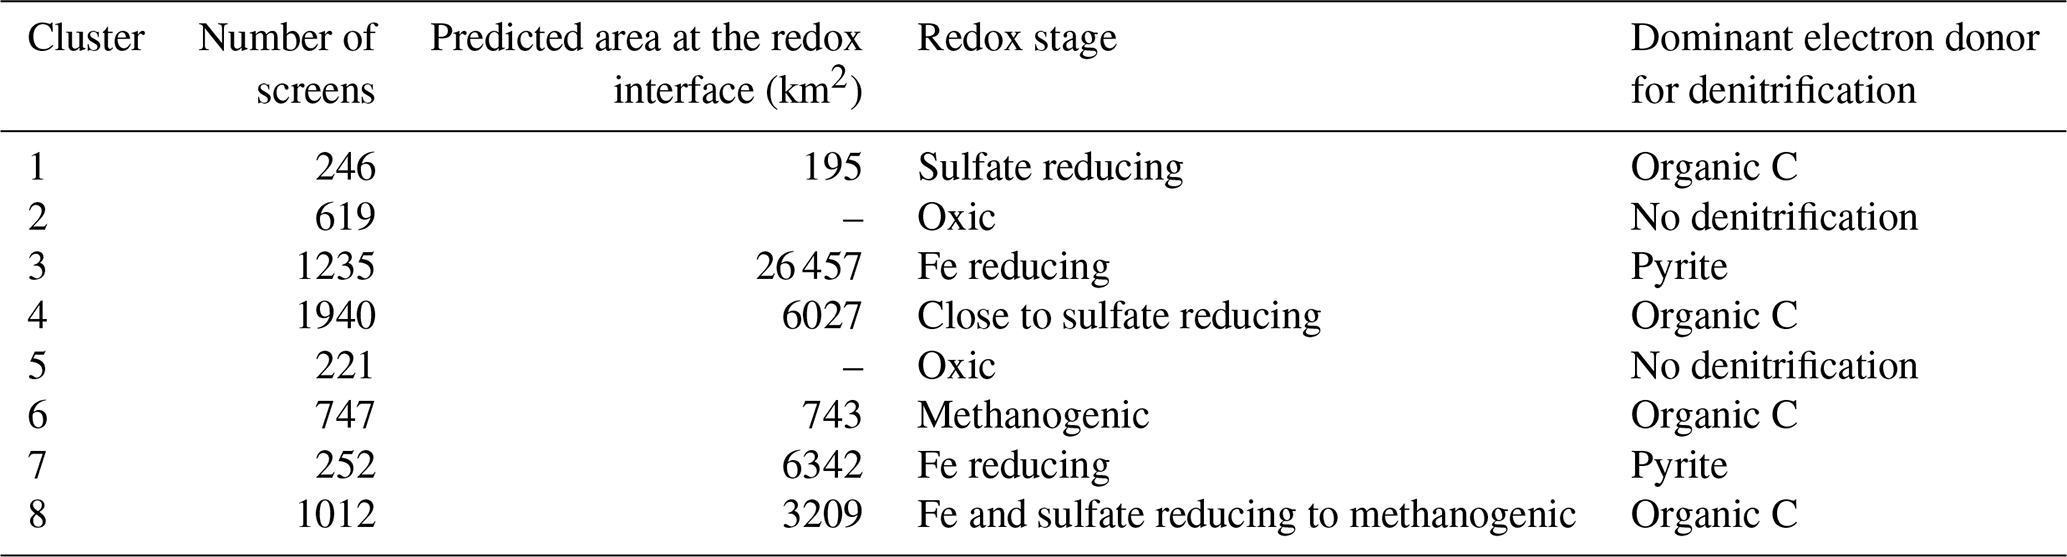
Our results showed that the Danish groundwater can be categorized into eight clusters): two oxic clusters (clusters 2 and 5) and six reduced clusters (1, 3, 4, 6, 7, and 8) at various redox stages (Fig. 1c). Cluster 4 was the most frequent cluster (1940 screen), followed by cluster 3 (1235 screens), cluster 8 (1012 screens), cluster 6 (747), cluster 2 (619 screens), cluster 7 (252 screens), cluster 5 (221 screens), and cluster 1 (246 screens; Table 3). The mean silhouette score for the clustering results in this study was 0.45. Figure 1c presents histograms of the concentrations and stoichiometric ratios of input parameters. The two oxic clusters were characterized by high nitrate concentrations (mean (μ)=21 and 26 mg L−1), low iron concentrations (μ=0.03 and 0.04 mg L−1), and relatively shallow depths (μ=19 m for both; Fig. 1c). These clusters had ratios of 1.37 (cluster 2) and 0.67 (cluster 5), suggesting a strong influence of anthropogenic impacts, such as carbonate dissolution by nitric acid produced by microbial oxidation of ammoniacal fertilizers, as mentioned earlier (Barak et al., 1997; Perrin et al., 2008). Cluster 2 was found mainly in the eastern part of Denmark, while cluster 5 was mainly in the western and northern regions (Fig. S2). Denitrification in these oxic clusters was considered negligible; therefore, further interpretations focused on the six reduced clusters.
The six reduced clusters have nitrate concentrations below 1 mg L−1 and have elevated iron concentrations (; Fig. 1c). Clusters 1 and 6 had high ratios (μ=3.07 and 2.09, respectively; Fig. 1c), indicating the dominance of organic carbon oxidation. Sulfate concentrations varied widely in both clusters, but the mean values were the lowest among all the reduced clusters (μ=11 and 5 mg L−1, respectively; Fig. 1c), indicative of sulfate reduction. Notably, cluster 6 had high methane concentrations (; Fig. 1c), suggesting highly reduced methanogenic conditions.
Cluster 3 had the highest sulfate concentrations (μ=72 mg L−1) and the second-highest Fe concentrations (; Fig. 1c). The elevated sulfate levels were attributed to pyrite oxidation, and its elevated Fe concentration could be due to incomplete pyrite oxidation and/or reductive dissolution of Fe(II)-bearing minerals. While anthropogenic sulfur input can elevate sulfate concentrations in groundwater, cluster 3 displayed higher sulfate concentrations than the oxic clusters did (μ=54 and 30 mg L−1, respectively). Since the oxic clusters were generally closer to the direct input of groundwater recharge and thus more responsive to anthropogenic signals, we conclude that pyrite oxidation likely plays a larger role in the elevated sulfate concentrations in this cluster. However, the ratios were lower than the theoretical values for pyrite oxidation (μ=0.24). This discrepancy may arise if carbonate mineral dissolution occurs by both strong (nitric and sulfuric acids) and carbonic acids (H2CO3; ), as indicated by the μ of the ratio of 1.48. This value aligns with the ratios typical of agricultural streams (Perrin et al., 2008; Stets et al., 2014), supporting our interpretation.
Cluster 4 was characterized by low sulfate concentrations () and was found at greater depths (μ=45 m). These conditions indicated moderately reduced states, likely transitioning from Fe reducing to sulfate reducing conditions. The high ratios (μ=1.82) and relatively low concentrations () were attributed to production from the oxidation of organic carbon by reducing sulfate and Fe oxides in groundwater already in equilibrium with carbonate minerals (e.g., calcite).
Cluster 7 showed the highest Fe concentrations () and lowest pH (μ=6.12) among the reduced clusters (Fig. 1c). Its mean and ratios were 0.55 and 1.09, respectively, closely aligning with those of pyrite oxidation with oxygen coupled with carbonate dissolution (Eqs. 3 and 5 in Table 1). Previous transect-level studies from the area near cluster 7 showed that denitrification in groundwater is mediated by pyrite oxidation (Jessen et al., 2017; Postma et al., 1991). They also reported that the study area has no carbonates and attributed total inorganic carbon (TIC) in groundwater to agricultural liming. The low pH and concentrations of cluster 7 are consistent with these studies' results. However, cluster 7 displayed low sulfate () but high Fe () concentrations for conditions dominated by complete denitrification by pyrite oxidation (Eq. 2 in Table 1). For instance, Danish oxic groundwater displays between 40 and 50 mg L−1 of nitrate (Thorling et al., 2024). If it is denitrified by pyrite oxidation, it will result in an increase in concentrations by 41–51 mg L−1 and in very low Fe concentrations. We attributed these discrepancies to combinations of (1) sulfate and iron reduction by oxidation of organic carbon, (2) mixing with reduced groundwater from deeper depths, and/or (3) incomplete oxidation of pyrite sulfur (Zhang et al., 2009):
The low ratios of cluster 7 imply that the role of organic carbon decomposition may be minor; thus, the second and/or third processes may more likely be responsible for the cluster 7 groundwater chemistry.
Cluster 8 exhibited signs of transitioning from Fe- to sulfate-reducing/methanogenic environments in organic- and carbonate-rich conditions. The ratio (μ=1.7) was significantly higher than for carbonate dissolution by strong acids. Moderately elevated dissolved organic carbon (DOC; ) and detectable methane () indicated an abundance of organic C. Additionally, this cluster exhibited the highest concentrations among all clusters, further supporting carbonate-rich conditions.
Altogether, the redox sequence of the clusters can be summarized according to the redox ladder: clusters 2 and 5 as oxic, clusters 3 and 7 as Fe reducing, clusters 4 and 8 as transitioning from Fe reducing to sulfate reducing, cluster 1 as sulfate reducing, and cluster 6 as methanogenic (Table 3). We hypothesized that if clusters 3 and 7 are found near the redox interface, denitrification in these regions would likely be mediated by pyrite oxidation. Both clusters displayed pyrite oxidation signals and the completion of nitrate reduction, which are expected at the redox interface. Conversely, if clusters 1 and 6, representing highly reduced conditions, are found at the redox interface, denitrification in these areas may be mediated by organic carbon oxidation. These clusters are expected to appear in areas with abundant organic matter, where the thicknesses of the nitrate-reducing and iron-reducing zones may be too thin to resolve at the scale of most of the groundwater screens. Cluster 4 and 8, interpreted as transitioning to Fe- and sulfate-reducing/methanogenic conditions, did not display a clear dominance of pyrite oxidation or organic C oxidation. However, we suggest that organic C oxidation may be more dominant in these clusters, as indicated by their ratios compared to those clusters where pyrite oxidation was the most probable process.
Table 3Summary of cluster analysis and redox cluster prediction.
3.2 A national map of redox clusters at the redox interface
Figure 2a shows the predicted spatial distribution of redox clusters at the redox interface using the 10 m (D10) distance criterion. Results for D5 (5 m) and D15 (15 m) are available in Fig. S1. The overall accuracies based on the two-fold cross validation were 0.58 (D5), 0.61 (D10), and 0.64 (D15). The final maps (Figs. 2a and S1) of redox clusters were generated by GBDT models trained on 100 % of the available data.
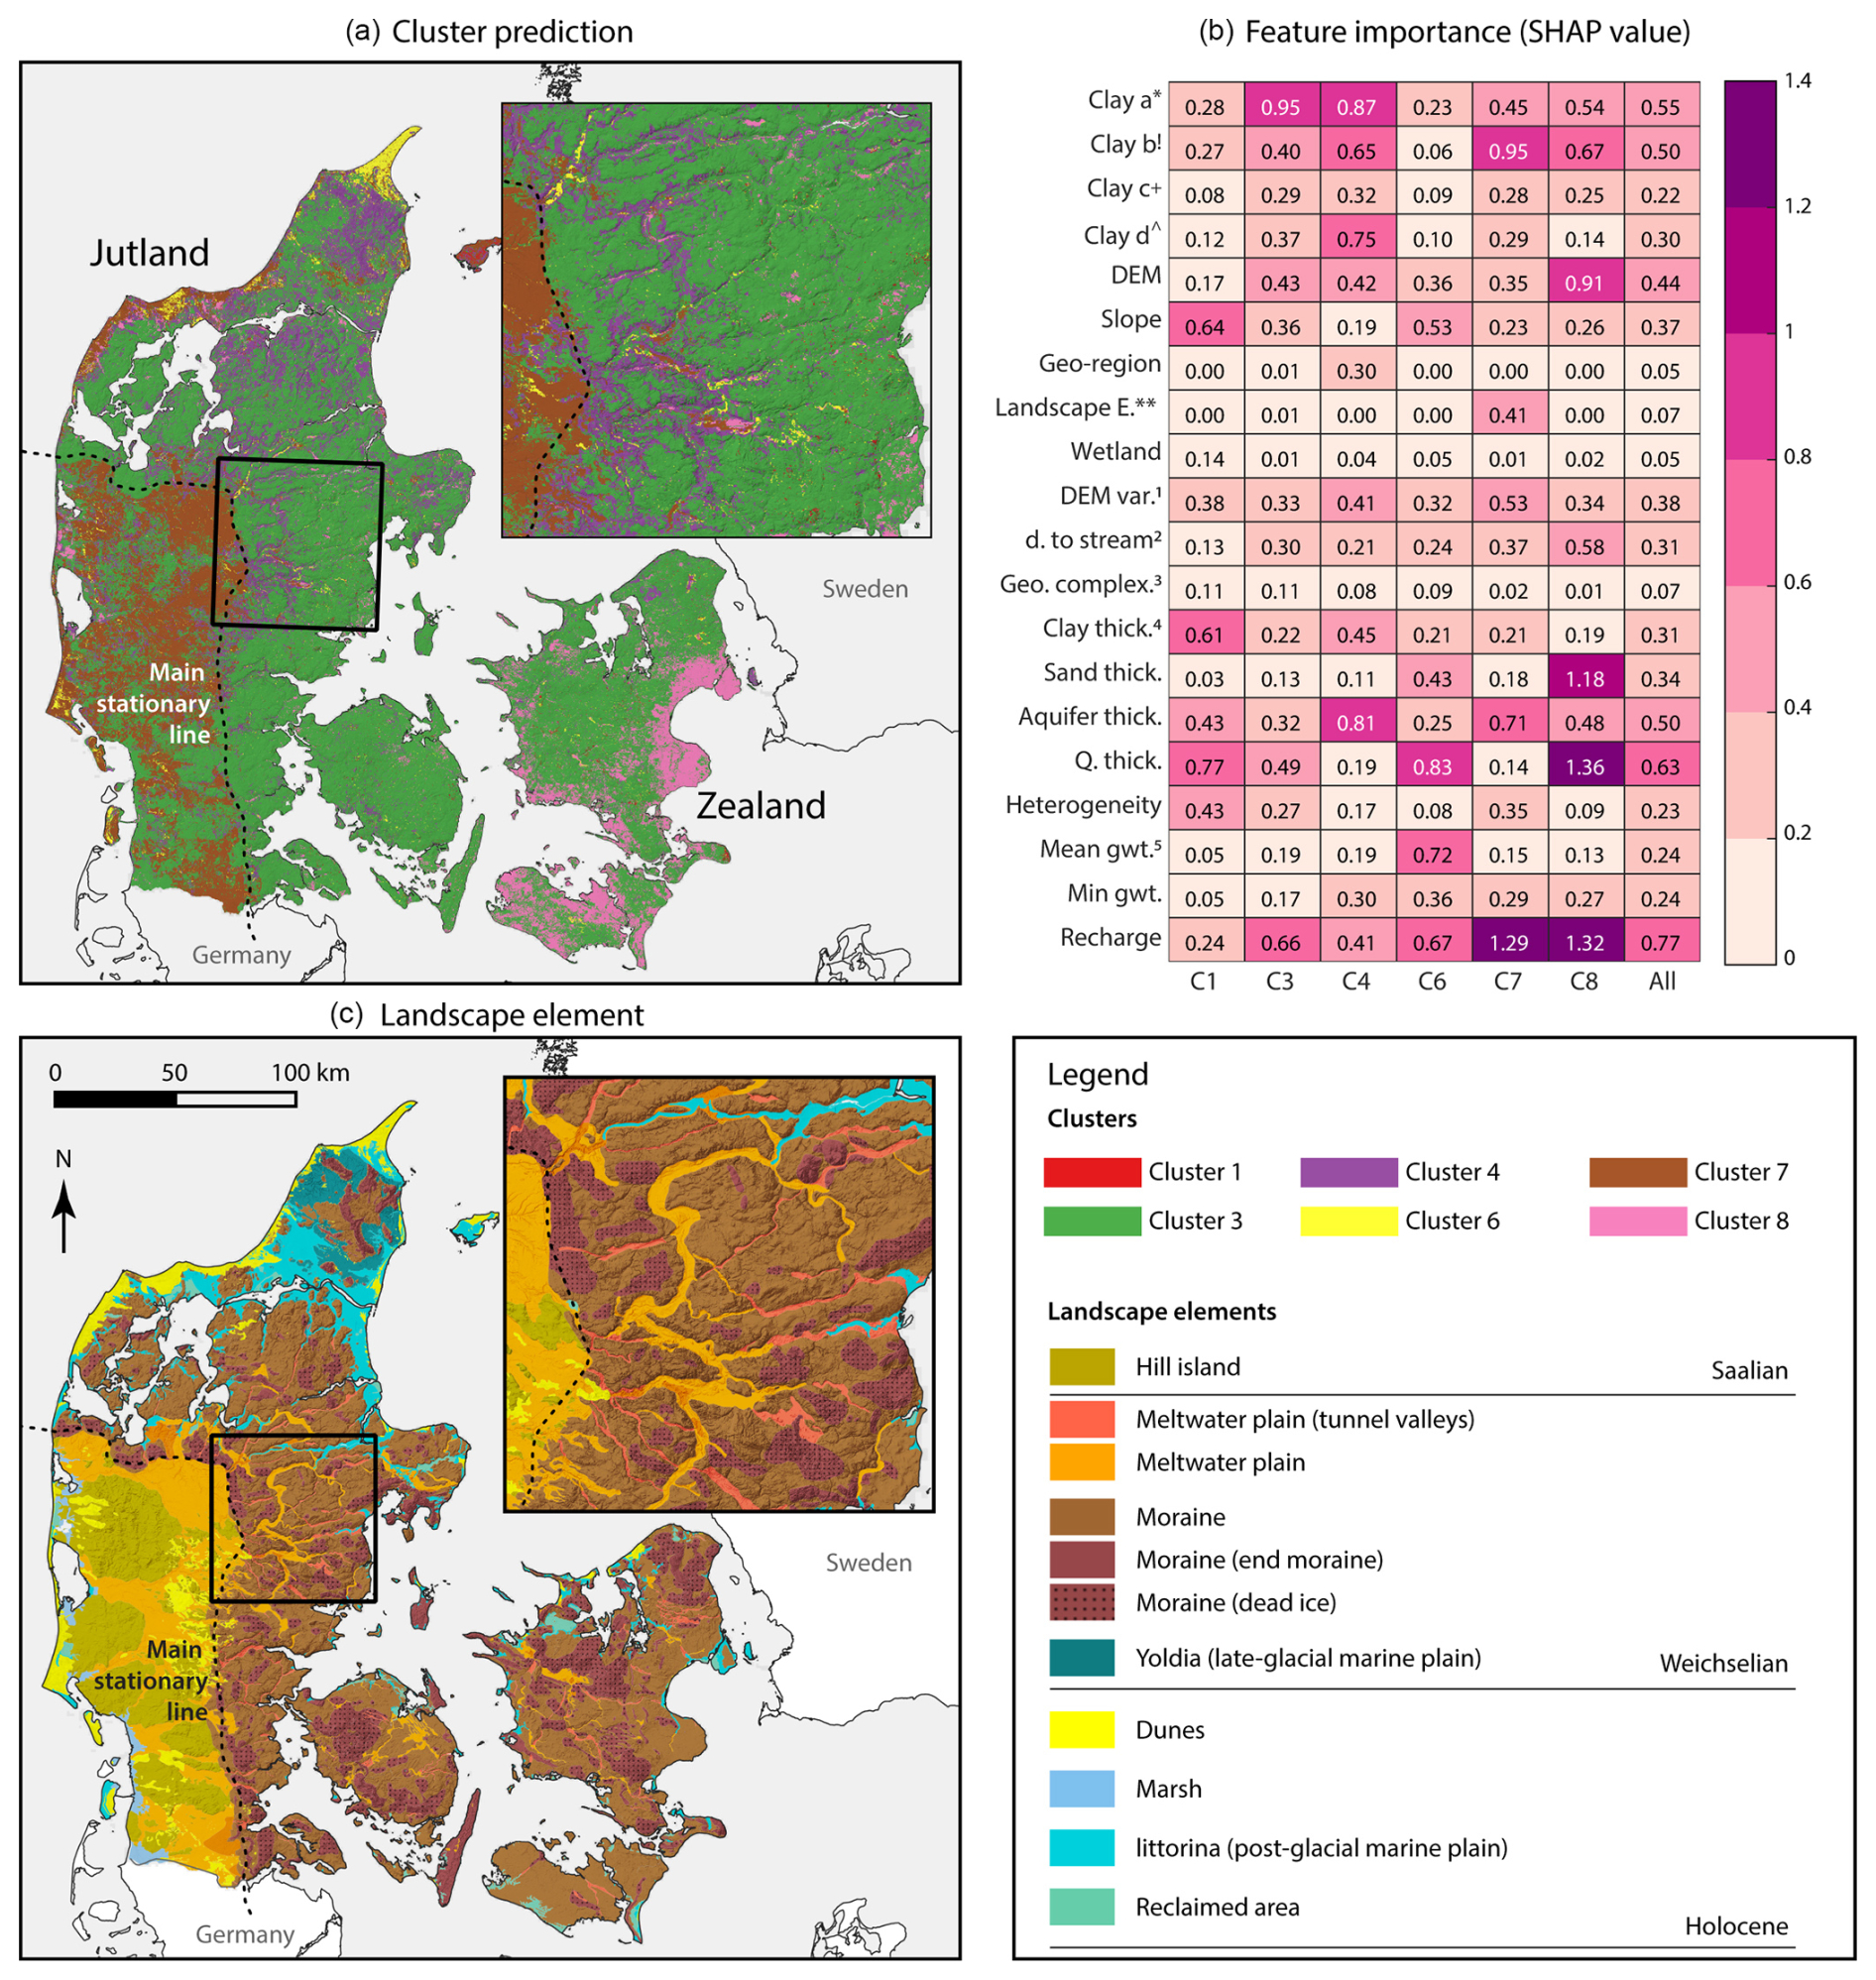
Figure 2(a) Map of redox clusters at the redox interface with the distance criterion of 10 m from the redox interface to the screen tops (D10). (b) Feature importance of the 20 input variables used for map prediction. The superscripts are as follows: ∗ clay a: clay content (%) 0–30 cm; ! clay b: clay content (%) 30–60 cm; + clay c: clay content (%) 60–100 cm; clay d: clay content (%), 100–200 cm; landscape e.: landscape element; 1 DEM var.: digital elevation map variability; 2 D. to stream: horizontal distance to the stream network (m); 3 geo. complex.: geological complexity; 4 clay thick.: thickness of clay deposits from the surface (m). Sand thick., aquifer thick., and Q. thick. refer to the thickness of the sandy layer, aquifer, and Quaternary layers, respectively; 5mean gwt. is the mean depth to the groundwater table in meters below the ground level. Panel (c) shows the landscape element map of Denmark with the legend displayed on the right.
The redox cluster map resembles the landscape elements of Denmark (Fig. 2c), although the contribution of the landscape classification to the prediction was minimal except in the case of cluster 7 (Fig. 2b). Among the 20 explanatory variables, the thickness of Quaternary deposits and groundwater recharge were identified as the two most influential variables (Fig. 2b). These findings highlight the central role of hydrogeology in determining the distribution of clusters at the redox interface. For instance, cluster 7, representing nitrate reduction by pyrite oxidation in carbonate-limited environments, was predicted predominantly in meltwater plain areas south and west of the main stationary line of the ice sheet from the last glaciation. In contrast, cluster 3, interpreted similarly but under carbonate-rich conditions, was mainly found east and north of the main stationary line. This difference likely arises because the meltwater plains west and south of the main stationary line have been exposed to weathering for longer than areas covered by the last ice sheets, leading to the depletion of easily weatherable minerals such as carbonates. Additionally, groundwater recharge emerged as the most influential predictive variable for cluster 7, further suggesting intensive weathering. Overall, cluster 7 corresponds to more intensively weathered hydrogeological conditions.
In the postglacial (more recent) sediment areas, where fresh organic matter is likely abundant, highly reduced conditions were predicted around the redox interface, which is consistent with our hypothesis of the cluster distribution at the redox interface. Cluster 6, associated with methanogenesis, would require reactive organic matter, which is consistent with its presence in dunes and postglacial marine sediment areas (Hansen et al., 2001; Jakobsen and Cold, 2007; Jakobsen and Postma, 1999). The thickness of the Quaternary deposits and the mean depth of the groundwater table were the most important predictors for cluster 6, implying that the combination of organic-rich conditions and a shallow groundwater table can result in such extremely reduced conditions. Cluster 1 (sulfate reducing conditions) rarely appeared near the redox interface.
The spatial distributions of cluster 4 and cluster 8, which transition from Fe- to sulfate-reducing conditions, were also distinctive. Cluster 4 was mostly found in postglacial marine sediments and meltwater plains within the main stationary line. These meltwater plains typically evolve into river valleys (Kaiser et al., 2007), where recent reactive organic matter accumulates. However, cluster 8 was predicted in areas where a thin Quaternary layer overlays limestone in Zealand. This limestone is primarily the Danian bryozoan limestone, formed in cool, deep-water conditions shortly after the Cretaceous–Tertiary (K/T) mass extinction (Bjerager and Surlyk, 2007; Jorgensen, 1988). The limestone represents a highly diverse marine benthic ecosystem, rich in organic matter such as bryozoan-coral mounds (Bjerager and Surlyk, 2007; Jorgensen, 1988), leading to the formation of pyrite in the limestone from seawater sulfate. Indeed, pyrite is observed in bryozoan limestone (Damholt et al., 2006). In clusters 4 and 8, pyrite oxidation may be probable. However, the groundwater chemical signatures (i.e., ratios and highly reduced conditions) of these two clusters may indicate a more dominant role of organic C oxidation.
We compared our predicted redox clusters with findings from previous Danish studies on redox processes at both transect and catchment scales (Jakobsen and Cold, 2007; Jakobsen and Postma, 1999; Kim et al., 2021a, b; Postma et al., 1991; Fig. S3). For example, Postma et al. (1991) investigated denitrification along a transect following a groundwater flow path in an unconfined sandy aquifer in Denmark. They found that nitrate concentration decreased rapidly at the redoxcline, primarily by pyrite oxidation, despite the higher abundance of organic matter. This transect corresponds to cluster 7 in our classification, consistent with our prediction.
Jakobsen and Postma (1999) also conducted a transect-based field study along a groundwater flow path within the dune area underlain by postglacial sand of central Rømø, Denmark. They investigated how redox processes including iron reduction, sulfate reduction, and methanogenesis vary horizontally and vertically. They concluded that although slow, the fermentation of organic matter controls the co-occurrence of multiple redox processes. Jakobsen and Cold (2007) reported similar findings to Jakobsen and Postma (1999) in an aeolian/post-glacial marine sandy aquifer in northern Zealand. Our redox cluster map indicated that Rømø is primarily predicted to be cluster 6 (methanogenesis) and cluster 7 (Fe reducing), while northern Zealand near the Jakobsen and Cold study site is classified as cluster 4 (close to sulfate reducing), demonstrating reasonable agreement with the earlier transect-based findings. The key role of organic matter fermentation in these study areas further suggests the dominance of organic carbon oxidation as the electron donor for denitrification.
At the catchment scale, Kim et al. (2021a) investigated the subsurface structure of the denitrification zone in a glacial sediment catchment in Northern Jutland, using a combination of geophysical, geological, hydrological, and geochemical data. By analyzing groundwater chemistry data using K-means clustering analysis, they found that both pyrite oxidation and organic carbon oxidation contribute to denitrification in shallow groundwater. Note that the data used in Kim et al. (2021a) were not included in our analysis. They showed that the chemistry of reduced groundwater near the stream showed clear signatures of organic carbon oxidation, while that in the rest of the catchment indicated pyrite oxidation. Consistently, our results identified cluster 4 along the stream, while the remainder of the catchment was predominantly classified as cluster 3 (Fe reducing, pyrite oxidation; Table 3). Kim et al. (2021b) also carried out a similar study in eastern Jutland in a clay–till catchment. High-resolution profiles of groundwater geochemistry revealed that denitrification in this catchment may primarily be driven by pyrite oxidation. This catchment was also predominantly predicted to be cluster 3. Overall, our predictions of redox clusters and dominant electron donors for denitrification showed strong agreement with the results of prior process-focused field investigations.
3.3 Anthropogenic DIC production in groundwater due to N fertilizer applications
For the period of 1990–2010, the NKM estimated that an average of 125 kt N yr−1 was reduced in groundwater on the national scale. At the catchment scale, higher groundwater nitrate reduction was observed in western Jutland, particularly in the southeast, with values up to 86 (Fig. 3a). In contrast, in Zealand, the nitrate reduction in groundwater ranged from 0 to 10 (Fig. 3a). These regional variabilities can be attributed to hydrogeological differences. In eastern Jutland and Zealand, drain flow is the main reactive N pathway (Møller et al., 2018), whereas in western Jutland, the sandy soils result in lower drain flow, and reactive N is instead transported via groundwater (Møller et al., 2018). In addition, reactive N leaching in western Jutland is relatively high due to intensive animal farming and high infiltration in the sandy soils. As a result, groundwater's contribution to nitrate reduction at the catchment level becomes more pronounced in western Jutland.
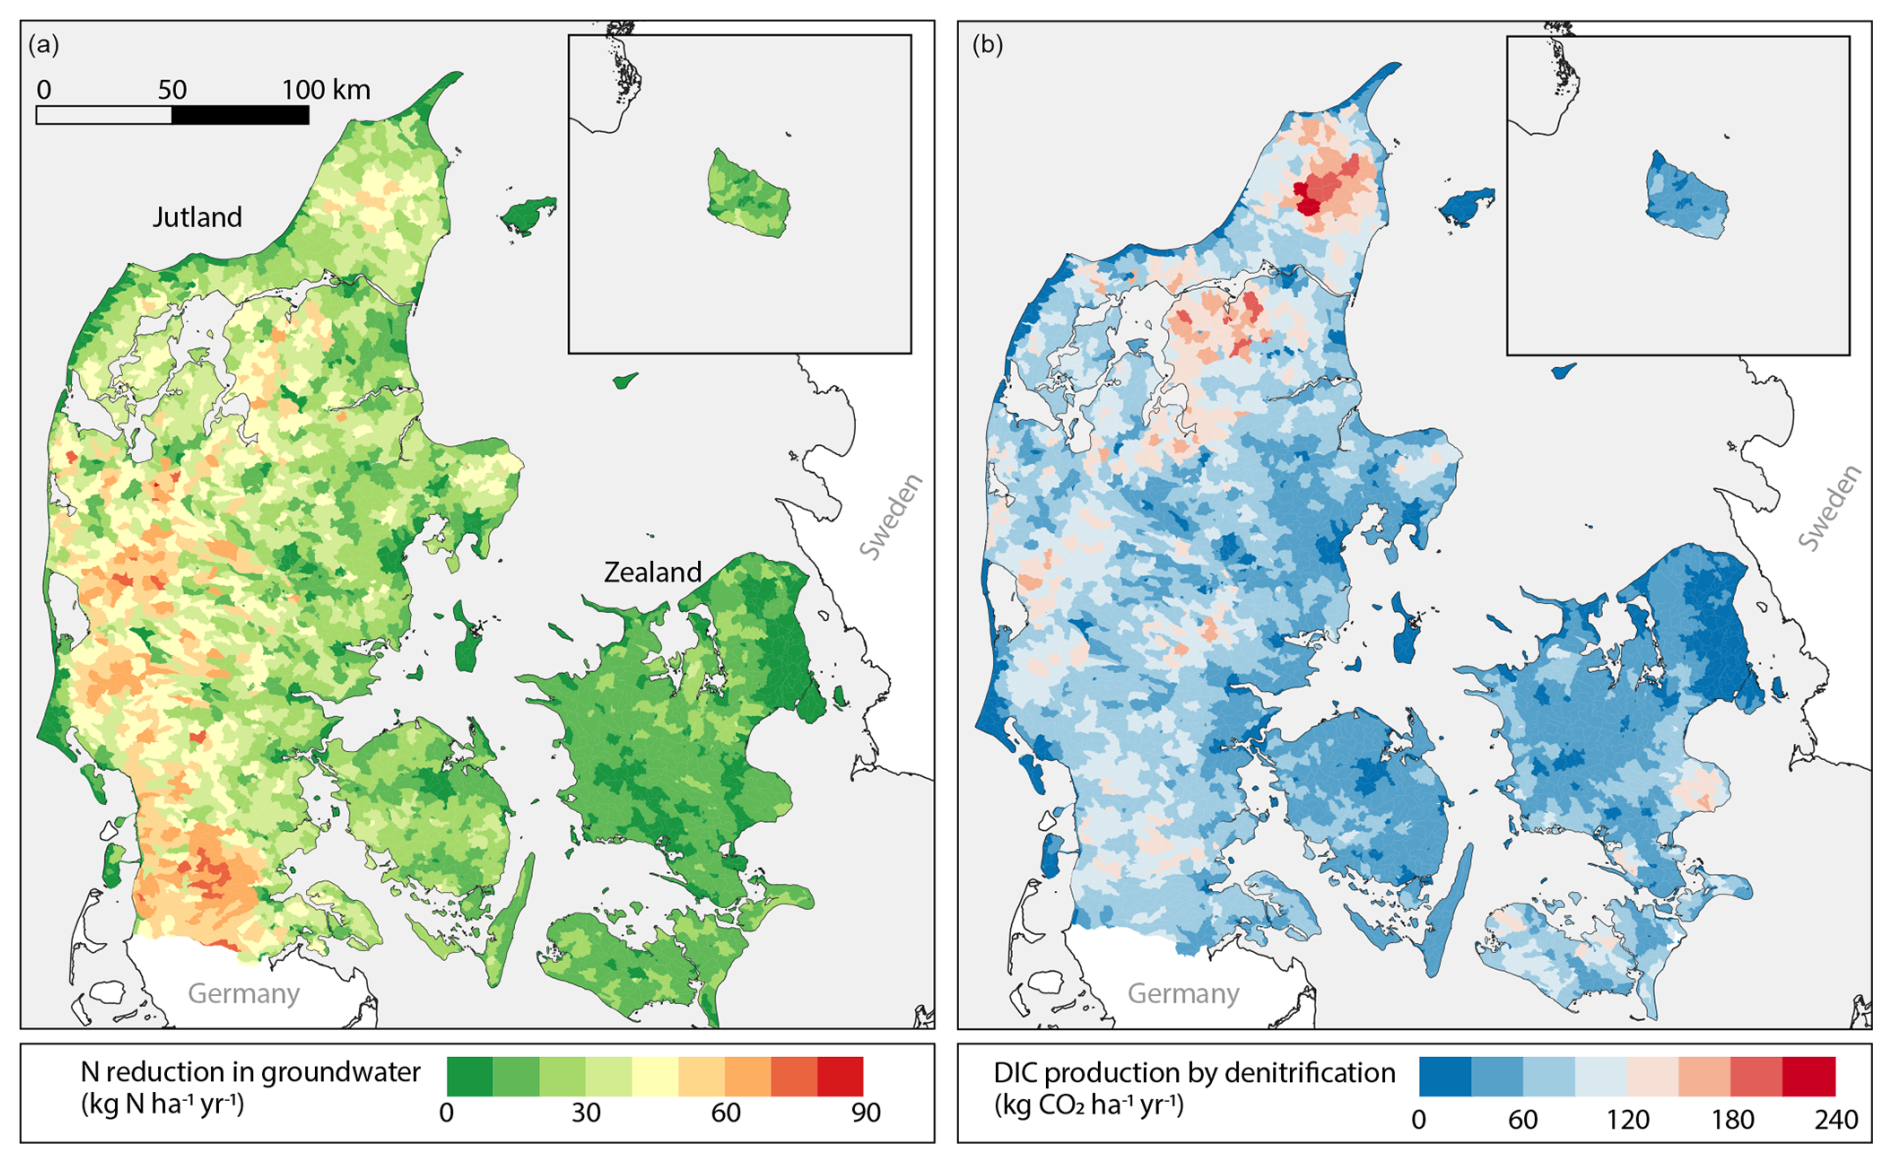
Figure 3Maps of estimates of (a) nitrate reduction in groundwater in and (b) DIC production by denitrification at the catchment scale in .
We estimated that DIC production in groundwater by denitrification of nitrate leached from the agricultural soils for the D5, D10, and D15 models was 182 (standard deviation (SD): 10.58), 204 (SD: 11.25), and 229 kt CO2 yr−1 (SD: 10.50), respectively. Like nitrate reduction, CO2 production was characterized by spatial heterogeneity. Although western Jutland showed the highest nitrate reduction in groundwater, DIC production was moderately high, ranging from 60 to 145 . The highest DIC production was predicted in northern Jutland (up to 180 ; Fig. 3b) despite the low to moderate nitrate reduction in groundwater (). Such results can be attributed to differences in the dominant electron donors. In northern Jutland, denitrification was predicted to be mediated by organic C (Fig. 3a). Compared to pyrite oxidation, which releases 0.33 mol of DIC per mole of nitrate reduction, organic-matter-mediated denitrification releases 1.25 mol of DIC per mole of nitrate reduction (Table 1). Consequently, more DIC and thus more CO2 is produced by denitrification in this region.
3.4 Contribution of denitrification in the national inventory of greenhouse gas emissions
Agriculture in Denmark is the second-largest contributor to greenhouse gas emissions excluding land use, land-use change, and forestry (LULUCF; Nielsen et al., 2024) According to the IPCC guidelines, the current national inventory for the agricultural sector includes emissions from (1) CH4 due to enteric fermentation, manure management, and field burning; (2) N2O from manure management, N-fertilizer use in agricultural soils, and field burning; and (3) CO2 from liming, urea, and other C-containing fertilizers (Nielsen et al., 2024). In 2022, the agricultural sector of Denmark emitted a total of 11 527 GHGs, primarily as CH4 (7059 ) and N2O (4201 ; Fig. 4). Carbon dioxide accounted for about 2 % (268 ) of the total GHG emissions from agriculture (Fig. 4). The largest source of CO2 was liming (246 ), followed by urea (16 ) and other C-containing fertilizers (6 ).
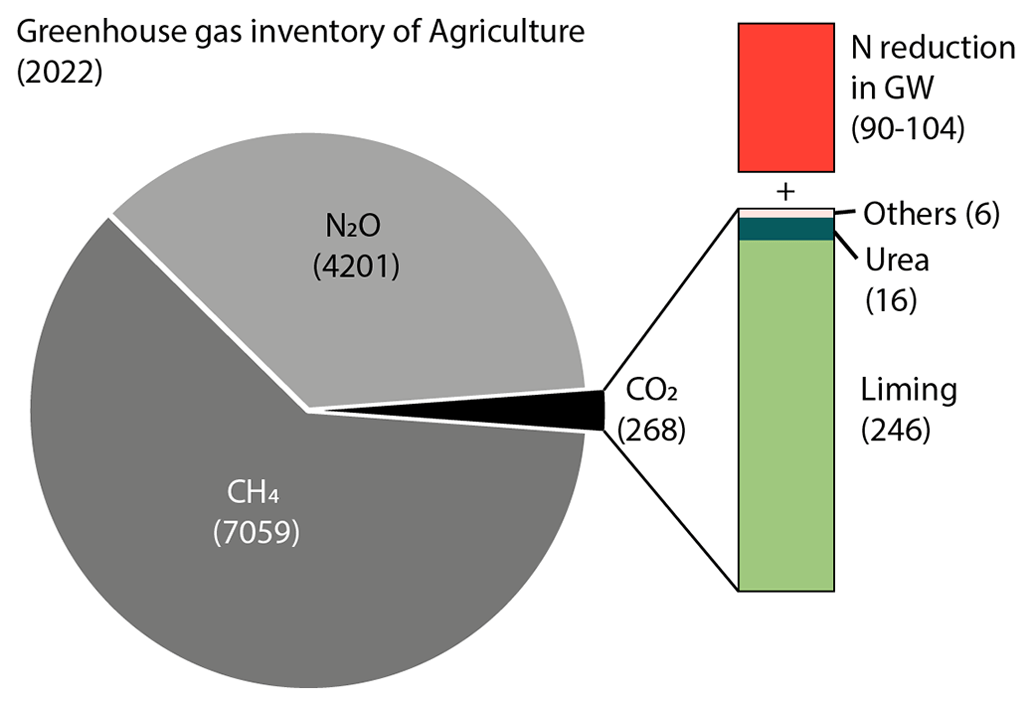
Figure 4National inventory of greenhouse gas emissions from Danish agriculture. The numbers represent GHG emissions in . The red box labeled “N reduction in GW” shows the potential CO2 emissions from denitrification in groundwater estimated in this study.
Our study estimated that approximately 204 of DIC is produced by denitrification in groundwater. As groundwater discharges back into surface waters such as streams, CO2 will be degassed from groundwater because groundwater is supersaturated with CO2 with respect to the atmosphere. The actual magnitude of CO2 emissions from groundwater depends on various physicochemical conditions, particularly the degree of calcite saturation of groundwater as CO2 degasses. Among the groundwater screens used for the D10 prediction, 476 of them had field measured pH values. Calculated using PHREEQC (Parkhurst and Appelo, 2013), their log (pCO2) levels ranged between −2.14 (7244 µatm) to −1.49 (32 359 µatm; Fig. 5a), and the saturation indices (SI) for calcite () were close to zero except for cluster 7 (−3.72; Fig. 5b). Assuming equilibration with atmospheric pCO2 (400 µatm), of these groundwater screens would increase by approximately 1–2 orders of magnitude (Fig. 5c). These results suggest (based on Table 1) that for clusters 1, 3, 4, 6, and 8, approximately half of the DIC produced by denitrification will be emitted into the atmosphere, with the remainder being re-stored as calcite. We further quantified the distribution of the increased DIC between CO2 emissions, calcite precipitation, and the solution using PHREEQC by taking cluster 2 (oxic cluster) as the initial conditions (Sect. S1 in the Supplement). PHREEQC results indicated that half of the increased DIC was emitted as CO2, while the remainder was precipitated as calcite (30 % to 66 % of the increased DIC) or stayed in solution as bicarbonate (−15 % to 10 % of the increased DIC).
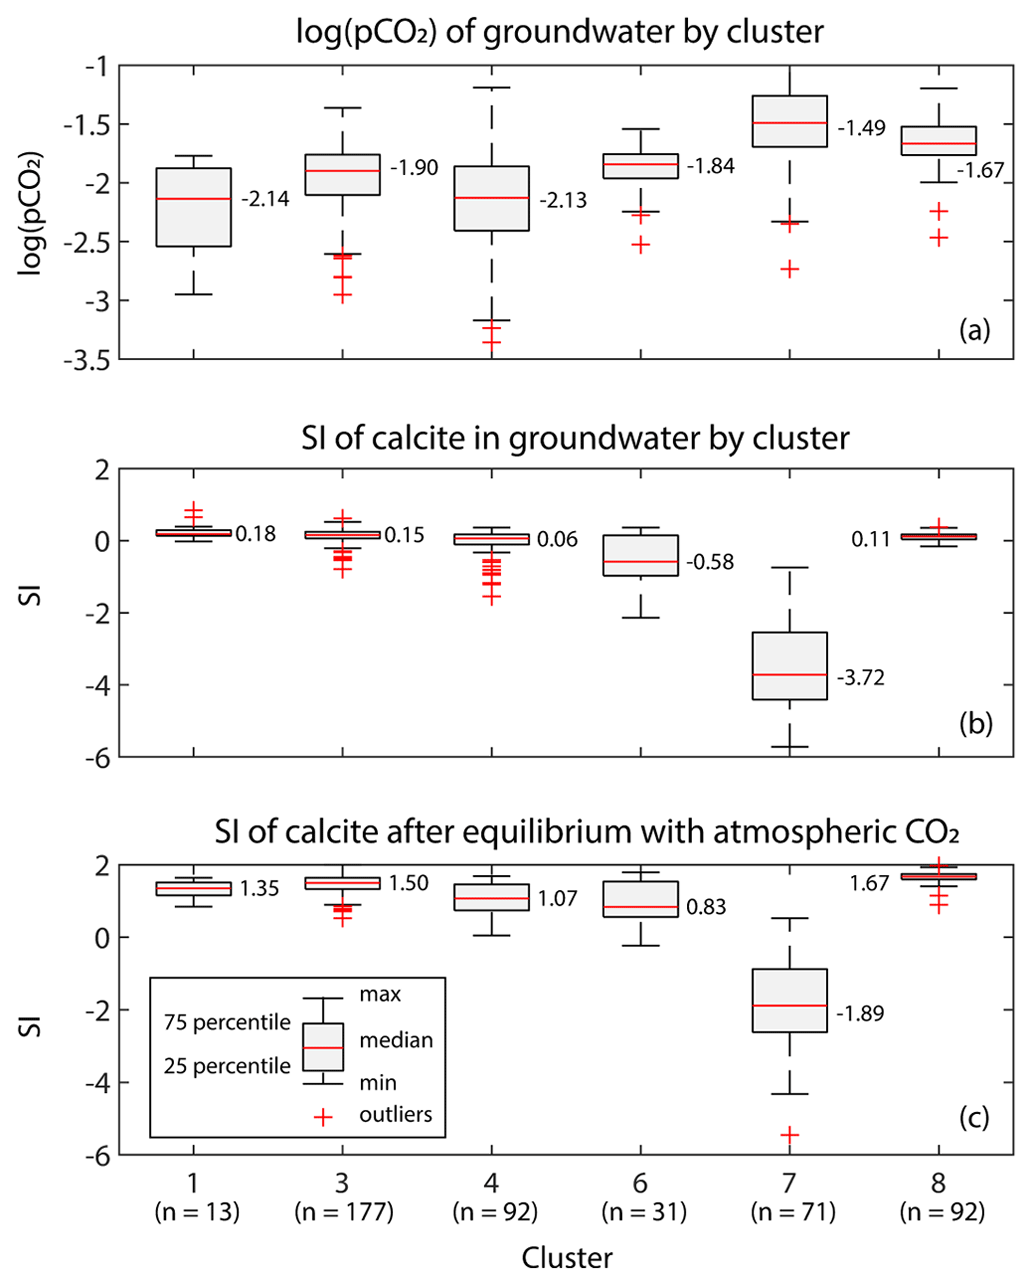
Figure 5Boxplots of (a) the log of pCO2 of groundwater by cluster, (b) the saturation index (SI) of calcite in groundwater by cluster, and (c) SI of calcite in groundwater after equilibrium with atmospheric CO2 by cluster.
In cluster 7, however, carbonate may have originated primarily from liming, meaning its CO2 emissions were already accounted for as liming; thus, no CO2 will be emitted due to denitrification. On the other hand, cluster 7 groundwater was able to pass through the carbonate front, becoming saturated with calcite before discharging into the stream. In this case, its ratio of CO2 emission per nitrate reduction will be the same as in cluster 3. Taking these two cases as the minimum and maximum limits, we estimated that 90–104 kt CO2 yr−1 will be emitted due to denitrification in groundwater. It is important to note that CO2 production from denitrification in streams and estuaries was not included in this estimation. For comparison, the national GHG inventories of Denmark estimate that 360 of N2O would be emitted via groundwater in 2022 (Nielsen et al., 2024). Using machine learning models with observational data and hydrological model outputs, Martinsen et al. (2024) estimated that about 513 kt CO2 yr−1 is released from the national stream network (Martinsen et al., 2024), and the specific effect of nitrate in this is not given.
Our results indicate that groundwater denitrification may represent a significant anthropogenic source of CO2 – comparable in magnitude to liming and substantially larger than other CO2 sources currently included in the IPCC guidelines. These findings imply that the current estimations of CO2 emissions from the agricultural sector may be underestimated. While further evaluation is needed, our findings suggest that CO2 emissions from denitrification should be considered in future revisions of the IPCC GHG inventory guidelines. These results would benefit from validation through additional studies across diverse settings. Denitrification is one of the most extensively investigated biogeochemical processes globally, and findings from these studies may help estimate CO2 emissions from denitrification in groundwater and potentially in streams and estuaries under varying agricultural, climatic, and geological conditions. By synthesizing existing research, CO2 emission factors for denitrification could be more accurately constrained at both local and national levels.
Nitrate pollution is a major environmental issue around the world. Research and policy efforts have primarily focused on water quality impacts, such as eutrophication and public health concerns. However, our study underscores the need to pay attention to the climatic consequences of nitrate pollution as well as N fertilizer use and management. Remediation and restoration efforts for nitrate pollution will inevitably lead to anthropogenic CO2 emissions. Thus, more holistic approaches are necessary to address both water quality and climate impact.
In this study, we evaluated the role of groundwater denitrification of nitrate from agricultural N use as a potentially important anthropogenic net source of CO2 from agriculture at the national scale. Using a long-term dataset of groundwater chemistry in Denmark, we characterized the subsurface redox architecture and identified the dominant denitrification processes. This point-scale information was then scaled up to the national level to produce a predictive map of redox clusters at the redox interface, which could also provide information on the dominant electron donor for denitrification. The redox cluster map highlighted the critical role of hydrogeology in shaping dominant processes by controlling the availability of inorganic carbon and the types of reduced materials, i.e., pyrite and organic carbon. By integrating these findings with the NKM estimates of nitrate reduction in groundwater, we calculated that denitrification contributed about 204 kt CO2 as DIC in groundwater annually, with about half of this CO2 likely released into the atmosphere when groundwater discharges into surface waters.
Our results indicated that in Denmark, CO2 emissions from groundwater denitrification are comparable in magnitude to those from liming, a predominant source of CO2 in the agricultural sector. To the best of our knowledge, this is the first study to quantify the contribution of groundwater denitrification to atmospheric CO2 on a national scale. Besides liming, the current IPCC guidelines on greenhouse gas inventory account for CO2 emissions from urea and C-containing fertilizers, which are up to 17 times smaller than those from denitrification in groundwater in Denmark. These findings suggest that the current CO2 emissions from the agriculture sector are likely underestimated and that subsurface denitrification may be a non-negligible component. While CO2 is a relatively minor component of the overall agricultural GHG budget, our findings highlight the fact that groundwater denitrification represents a previously unaccounted for anthropogenic CO2 source. We recommend that this process should be considered in future efforts to improve the completeness of agricultural CO2 inventories.
This study also highlights the value of integrating process-based understanding with data-driven methods to address the challenges posed by spatial heterogeneity and the upscaling of complex subsurface biogeochemical processes such as greenhouse gas emissions. While the mechanisms and primary controls of denitrification have been extensively studied at small spatial scales, such as profiles, transects, and catchment, translating this knowledge into robust large-scale quantification has remained challenging. By integrating insights from hydrogeology, groundwater redox chemistry, and long-term monitoring data within a predictive mapping framework, we demonstrated how multidisciplinary approaches – including machine learning – can integrate fundamental process-based understanding. This integrative approach offers a promising pathway for not only improving nitrate management strategies but also reducing uncertainties in greenhouse gas inventories from agricultural systems and, more generally, for large-scale studies on groundwater geochemistry.
Denitrification is a natural process and is necessary for mitigating nitrate pollution in groundwater. However, it inevitably releases CO2 through the mineralization of organic C or carbonate minerals. These geological C sources would otherwise remain stable over geological timescales. Restoring these losses will be challenging. Therefore, strategies addressing N pollution in aquatic ecosystems, particularly in groundwater, must consider both water quality management and climate impact comprehensively.
All groundwater chemistry data are available on the National Borehole Database (http://www.geus.dk/jupiter, last access: 30 November 2022). The data for predicting the national map are available at the following DOI: https://doi.org/10.22008/FK2/I9YCF6 (Koch, 2004).
The supplement related to this article is available online at https://doi.org/10.5194/bg-22-4387-2025-supplement.
HK, JK, BH, and RJ contributed to the conceptualization. HK and JK conducted analyses. HK acquired funding and managed the project. HK wrote the original draft and revised it with comments from all coauthors.
The contact author has declared that none of the authors has any competing interests.
Publisher's note: Copernicus Publications remains neutral with regard to jurisdictional claims made in the text, published maps, institutional affiliations, or any other geographical representation in this paper. While Copernicus Publications makes every effort to include appropriate place names, the final responsibility lies with the authors.
This project was funded by Geocenter, Denmark. We thank the two anonymous reviewers for providing constructive feedback. We thank Anker Lajer Højberg for providing the results of NKM.
This research has been supported by the Geocenter Danmark (Emission of geologic C by agricultural nitrate leaching – an overlooked CO2 source in terrestrial ecosystems?).
This paper was edited by Gabriel Singer and reviewed by two anonymous referees.
Adhikari, K., Kheir, R. B., Greve, M. B., Bøcher, P. K., Malone, B. P., Minasny, B., McBratney, A. B., and Greve, M. H.: High-Resolution 3-D Mapping of Soil Texture in Denmark, Soil Sci. Soc. Am. J., 77, 860–876, https://doi.org/10.2136/sssaj2012.0275, 2013.
Adhikari, K., Hartemink, A. E., Minasny, B., Bou Kheir, R., Greve, M. B., and Greve, M. H.: Digital Mapping of Soil Organic Carbon Contents and Stocks in Denmark, PLoS One, 9, e105519, https://doi.org/10.1371/journal.pone.0105519, 2014.
Appelo, C. A. J. and Postma, D.: Geochemistry, Groundwater and Pollution, edited by: Appelo, C. A. J. and Postma, D., CRC Press, https://doi.org/10.1201/9781439833544, 2005.
Ascott, M. J., Gooddy, D. C., Wang, L., Stuart, M. E., Lewis, M. A., Ward, R. S., and Binley, A. M.: Global patterns of nitrate storage in the vadose zone, Nat. Commun., 8, 1–6, https://doi.org/10.1038/s41467-017-01321-w, 2017.
Barak, P., Jobe, B. O., Krueger, A. R., Peterson, L. A., and Laird, D. A.: Effects of long-term soil acidification due to nitrogen fertilizer inputs in Wisconsin, Plant Soil, 197, 61–69, https://doi.org/10.1023/A:1004297607070, 1997.
Basu, N. B., Van Meter, K. J., Byrnes, D. K., Van Cappellen, P., Brouwer, R., Jacobsen, B. H., Jarsjö, J., Rudolph, D. L., Cunha, M. C., Nelson, N., Bhattacharya, R., Destouni, G., and Olsen, S. B.: Managing nitrogen legacies to accelerate water quality improvement, Nat. Geosci., 15, 97–105, https://doi.org/10.1038/s41561-021-00889-9, 2022.
Bjerager, M. and Surlyk, F.: Benthic palaeoecology of Danian deep-shelf bryozoan mounds in the Danish Basin, Palaeogeogr. Palaeocl., 250, 184–215, https://doi.org/10.1016/j.palaeo.2007.03.008, 2007.
Børgesen, C. D., Sørensen, P., Blichers-Mathiesen, G., Kristensen, K. M., Pullens, J. W. M., Zhao, J., and Olesen, J. E.: NLES5 – An empirical model for prediciting nitrate leaching from the root zone of agricultural land in Denmark, Aarhus University DCA – Danish Centre for Food and Agriculture, 116 pp., ISBN 978-87-93787-60-5, 2020.
Bouwman, A. F., Beusen, A. H. W., Griffioen, J., Van Groenigen, J. W., Hefting, M. M., Oenema, O., Van Puijenbroek, P. J. T. M., Seitzinger, S., Slomp, C. P., and Stehfest, E.: Global trends and uncertainties in terrestrial denitrification and N2O emissions, Philos. T. R. Soc. Lon. B, 368, 2013-01-12, https://doi.org/10.1098/rstb.2013.0112, 2013.
Clough, T. J., Addy, K., Kellogg, D. Q., Nowicki, B. L., Gold, A. J., and Groffman, P. M.: Dynamics of nitrous oxide in groundwater at the aquatic-terrestrial interface, Glob. Change Biol., 13, 1528–1537, https://doi.org/10.1111/j.1365-2486.2007.01361.x, 2007.
Damholt, S. F., Bjerager, M., and Damholt, T.: Stevns Klint, Denmark: Uppermost Maastrichtian chalk, Cretaceous–Tertiary boundary, and lower Danian bryozoan mound complex, B. Geol. Soc. Denmark, 54, 1–48, https://doi.org/10.37570/bgsd-2006-54-01, 2006.
Diaz, R. J. and Rosenberg, R.: Spreading Dead Zones and Consequences for Marine Ecosystems, Science, 321, 926–929, https://doi.org/10.1126/science.1156401, 2008.
Duvert, C., Butman, D. E., Marx, A., Ribolzi, O., and Hutley, L. B.: CO2 evasion along streams driven by groundwater inputs and geomorphic controls, Nat. Geosci., 11, 813–818, https://doi.org/10.1038/s41561-018-0245-y, 2018.
Galloway, J. N., Aber, J. D., Erisman, J. W., Seitzinger, S. P., Howarth, R. W., Cowling, E. B., Cosby, B. J., and Galloway, J. N.: The Nitrogen Cascade, Bioscience, 53, 341–356, https://doi.org/10.1641/0006-3568(2003)053[0341:TNC]2.0.CO;2, 2003.
Gao, Y. and Cabrera Serrenho, A.: Greenhouse gas emissions from nitrogen fertilizers could be reduced by up to one-fifth of current levels by 2050 with combined interventions, Nat. Food, 4, 170–178, https://doi.org/10.1038/s43016-023-00698-w, 2023.
Haggerty, R., Sun, J., Yu, H., and Li, Y.: Application of machine learning in groundwater quality modeling – A comprehensive review, Water Res., 233, 119745, https://doi.org/10.1016/j.watres.2023.119745, 2023.
Hansen, L. K., Jakobsen, R., and Postma, D.: Methagnogenesis in a shallow sandy aquifer, Rømø, Denmark, Geochim. Cosmochim. Ac., 65, 2925–2935, https://doi.org/10.1016/S0016-7037(01)00653-6, 2001.
Henriksen, H. J., Troldborg, L., Nyegaard, P., Sonnenborg, T. O., Refsgaard, J. C., and Madsen, B.: Methodology for construction, calibration and validation of a national hydrological model for Denmark, J. Hydrol., 280, 52–71, https://doi.org/10.1016/S0022-1694(03)00186-0, 2003.
Højberg, A., Troldborg, L., Tornbjerg, H., Windolf, J., Blicher-Mathiesen, G., Thodsen, H., Kronvang, B., and Børgesen, C. D.: Development of a Danish national nitrogen model – input to a new spatial differentiated regulation, Abstract from Land Use and Water Quality: Agricultural Production and the Environment, Vienna, Austria, 21–24 September 2015, 82, 2015.
Højberg, A. L., Hansen, A. L., Wachniew, P., Żurek, A. J., Virtanen, S., Arustiene, J., Strömqvist, J., Rankinen, K., and Refsgaard, J. C.: Review and assessment of nitrate reduction in groundwater in the Baltic Sea Basin, J. Hydrol. Reg. Stud., 12, 50–68, https://doi.org/10.1016/j.ejrh.2017.04.001, 2017.
Højberg, A. L., Thodsen, H., Duus Børgesen, C., Tornbjerg, H., Nordstrøm, B. O., Troldborg, L., Christian Hoffmann, C., Kjeldgaard, A., Holm, H., Audet, J., Ellermann, T., Heile Christensen, J., Bach, E. O., and Pedersen, B. F.: National kvælstofmodel – version 2020, Opdatering af nationalt retentionskort, Metode rapport, ISBN 978-87-7871-551-7, 2021.
Howarth, R., Chan, F., Conley, D. J., Garnier, J., Doney, S. C., Marino, R., and Billen, G.: Coupled biogeochemical cycles: Eutrophication and hypoxia in temperate estuaries and coastal marine ecosystems, Front. Ecol. Environ., 9, 18–26, https://doi.org/10.1890/100008, 2011.
IPCC: 2006 IPCC Guidelines for National Greenhouse Gas Inventories, Prepared by the National Greenhouse Gas Inventories Programme, edited by: Eggleston, H. S., Buendia, L., Miwa, K., Ngara, T., and Tanabe, K., IGES, Japan, https://www.ipcc-nggip.iges.or.jp/public/2006gl/ (last access: 27 November 2024), 2006.
IPCC: 2019 Refinement to the 2006 IPCC Guidelines for National Greenhouse Gas Inventories, in: N2O Emissions from Managed Soils, and CO2 Emissions from Lime and Urea Application, Chapt. 11, https://www.ipcc.ch/report/2019-refinement-to-the- 2006-ipcc-guidelines-for-national-greenhouse-gas-inventories (last access: 27 November 2024), 2019.
Jahangir, M. M. R., Johnston, P., Addy, K., Khalil, M. I., Groffman, P. M., and Richards, K. G.: Quantification of in situ denitrification rates in groundwater below an arable and a grassland system, Water Air. Soil Poll., 224, 1693, https://doi.org/10.1007/s11270-013-1693-z, 2013.
Jakobsen, R. and Cold, L.: Geochemistry at the sulfate reduction-methanogenesis transition zone in an anoxic aquifer-A partial equilibrium interpretation using 2D reactive transport modeling, Geochim. Cosmochim. Ac., 71, 1949–1966, https://doi.org/10.1016/j.gca.2007.01.013, 2007.
Jakobsen, R. and Postma, D.: Redox zoning, rates of sulfate reduction and interactions with Fe-reduction and methanogenesis in a shallow sandy aquifer, Romo, Denmark, Geochim. Cosmochim. Ac., 63, 137–151, https://doi.org/10.1016/S0016-7037(98)00272-5, 1999.
Jessen, S., Postma, D., Thorling, L., Müller, S., Leskelä, J., and Engesgaard, P.: Decadal variations in groundwater quality: A legacy from nitrate leaching and denitrification by pyrite in a sandy aquifer, Water Resour. Res., 53, 184–198, https://doi.org/10.1002/2016WR018995, 2017.
Jensen, A. S., Coffman, V. R., Schullehner, J., Trabjerg, B. B., Pedersen, C. B., Hansen, B., Olsen, J., Pedersen, M., Stayner, L. T., and Sigsgaard, T.: Prenatal exposure to tap water containing nitrate and the risk of small-for-gestational-age: A nationwide register-based study of Danish births, 1991–2015, Environ. Int., 174, 107883, https://doi.org/10.1016/j.envint.2023.107883, 2023.
Jorgensen, N. O.: Dolomite and dedolomitization in Danian bryozoan limestone from Fakse, Denmark, B. Geol. Soc. Denmark, 37, 63–74, https://doi.org/10.37570/bgsd-1988-37-06, 1988.
Jurado, A., Borges, A. V., and Brouyère, S.: Dynamics and emissions of N2O in groundwater: A review, Sci. Total Environ., 584–585, 207–218, https://doi.org/10.1016/j.scitotenv.2017.01.127, 2017.
Kaiser, K., Rother, H., Lorenz, S., Gärtner, P., and Papenroth, R.: Geomorphic evolution of small river–lake-systems in northeast Germany during the Late Quaternary, Earth Surf. Proc. Land., 32, 1516–1532, https://doi.org/10.1002/esp.1480, 2007.
Ke, G., Meng, Q., Finley, T., Wang, T., Chen, W., Ma, W., Ye, Q., and Liu, T.-Y.: LightGBM: A Highly Efficient Gradient Boosting Decision Tree, in: 31st Conference on Neural Information Processing Systems (NIPS 2017), Long Beach, CA, USA, 4–9 December 2017, 3149–3157, ISBN 978-1-5108-6096-4, 2017.
Kim, H., Høyer, A.-S., Jakobsen, R., Thorling, L., Aamand, J., Maurya, P. K., Christiansen, A. V., and Hansen, B.: 3D characterization of the subsurface redox architecture in complex geological settings, Sci. Total Environ., 693, 133583, https://doi.org/10.1016/j.scitotenv.2019.133583, 2019.
Kim, H., Sandersen, P. B. E., Jakobsen, R., Kallesøe, A. J., Claes, N., Blicher-Mathiesen, G., Foged, N., Aamand, J., and Hansen, B.: A 3D hydrogeochemistry model of nitrate transport and fate in a glacial sediment catchment: A first step toward a numerical model, Sci. Total Environ., 776, 146041, https://doi.org/10.1016/j.scitotenv.2021.146041, 2021a.
Kim, H., Jakobsen, R., Aamand, J., Claes, N., Erlandsen, M., and Hansen, B.: Upscaling of Denitrification Rates from Point to Catchment Scales for Modeling of Nitrate Transport and Retention, Environ. Sci. Technol., 55, 15821–15830, https://doi.org/10.1021/acs.est.1c04593, 2021b.
Koch, J.: Groundwater Redox Modeling Denmark, GEUS Dataverse [data set], https://doi.org/10.22008/FK2/I9YCF6, 2024.
Koch, J., Kim, H., Tirado-Conde, J., Hansen, B., Møller, I., Thorling, L., Troldborg, L., Voutchkova, D., and Højberg, A. L.: Modeling groundwater redox conditions at national scale through integration of sediment color and water chemistry in a machine learning framework, Sci. Total Environ., 947, 174533, https://doi.org/10.1016/j.scitotenv.2024.174533, 2024.
Liu, J., You, L., Amini, M., Obersteiner, M., Herrero, M., Zehnder, A. J. B., and Yang, H.: A high-resolution assessment on global nitrogen flows in cropland, P. Natl. Acad. Sci. USA, 107, 8035–8040, https://doi.org/10.1073/pnas.0913658107, 2010.
Lundberg, S. M. and Lee, S. I.: A unified approach to interpreting model predictions, Adv. Neural Inf. Process. Syst., in: 31st Conference on Neural Information Processing Systems (NIPS 2017), Long Beach, CA, USA, 4–9 December 2017, 4766–4775, ISBN 978-1-5108-6096-4, 2017.
Macpherson, G. L. L.: CO2 distribution in groundwater and the impact of groundwater extraction on the global C cycle, Chem. Geol., 264, 328–336, https://doi.org/10.1016/j.chemgeo.2009.03.018, 2009.
Martinsen, K. T., Sand-Jensen, K., Bergmann, V., Skjærlund, T., Kjær, J. E., and Koch, J.: Seasonal Carbon Dioxide Concentrations and Fluxes Throughout Denmark's Stream Network, J. Geophys. Res.-Biogeo., 129, e2024JG008031, https://doi.org/10.1029/2024JG008031, 2024.
McAleer, E. B., Coxon, C. E., Richards, K. G., Jahangir, M. M. R., Grant, J., and Mellander, P. E.: Groundwater nitrate reduction versus dissolved gas production: A tale of two catchments, Sci. Total Environ., 586, 372–389, https://doi.org/10.1016/j.scitotenv.2016.11.083, 2017.
Meals, D. W., Dressing, S. A., and Davenport, T. E.: Lag Time in Water Quality Response to Best Management Practices: A Review, J. Environ. Qual., 39, 85–96, https://doi.org/10.2134/jeq2009.0108, 2010.
Menegat, S., Ledo, A., and Tirado, R.: Greenhouse gas emissions from global production and use of nitrogen synthetic fertilisers in agriculture, Sci. Rep., 12, 1–13, https://doi.org/10.1038/s41598-022-18773-w, 2022.
Møller, A. B., Beucher, A., Iversen, B. V., and Greve, M. H.: Predicting artificially drained areas by means of a selective model ensemble, Geoderma, 320, 30–42, https://doi.org/10.1016/j.geoderma.2018.01.018, 2018.
Mosier, A., Kroeze, C., Nevison, C., Oenema, O., and Seitzinger, S.: Closing the global N2O budget: nitrous oxide emissions through the agricultural nitrogen cycle, Nutr. Cycl. Agroecosys., 52, 225–248, https://doi.org/10.1023/A:1009740530221, 1998.
Nielsen, O.-K., Plejdrup, M. S., Winther, M., Nielsen, M., Gyldenkærne, S., Mikkelsen, M. H., Albrektsen, R., Hjelgaard, K., Patrik Fauser, Bruun, H. G., Levin, G., Callisen, L. W., Andersen, T. A., Johannsen, V. K., Nord-Larsen, T., Vesterdal, L., Stupak, I., Scott-Bentsen, N., Rasmussen, E., Petersen, S. B., Baunbæk, L., and Hansen, M. G.: Denmark's National Inventory Document 2024. Emission Inventories 1990–2022 – Submitted under the United Nations Framework Convention on Climate Change and the Paris Agreement, Aarhus University, DCE – Danish Centre for Environment and Energy, 933 pp., ISBN 978-87-7156-900-1, 2024.
Parkhurst, D. L., and Appelo, C. A. J.: Description of input and examples for PHREEQC version 3 – A computer program for speciation, batch-reaction, one-dimensional transport, and inverse geochemical calculations: U.S. Geological Survey Techniques and Methods, book 6, chap. A43, 497 pp., https://doi.org/10.3133/tm6A43, 2013.
Perrin, A.-S., Probst, A., and Probst, J.-L.: Impact of nitrogenous fertilizers on carbonate dissolution in small agricultural catchments: Implications for weathering CO2 uptake at regional and global scales, Geochim. Cosmochim. Ac., 72, 3105–3123, https://doi.org/10.1016/j.gca.2008.04.011, 2008.
Postma, D., Boesen, C., Kristiansen, H., and Larsen, F.: Nitrate Reduction in an Unconfined Sandy Aquifer: Water Chemistry, Reduction Processes, and Geochemical Modeling, Water Resour. Res., 27, 2027–2045, https://doi.org/10.1029/91WR00989, 1991.
Postma, D., Larsen, F., Thai, N. T., Trang, P. T. K., Jakobsen, R., Nhan, P. Q., Long, T. V., Viet, P. H., and Murray, A. S.: Groundwater arsenic concentrations in Vietnam controlled by sediment age, Nat. Geosci., 5, 656–661, https://doi.org/10.1038/ngeo1540, 2012.
Ritchie, H., Rosado, P., and Roser, M.: “Breakdown of carbon dioxide, methane and nitrous oxide emissions by sector” Published online at OurWorldinData.org. Retrieved from: “https://ourworldindata.org/emissions-by-sector” (last access: 3 September 2024) [Online Resource], 2023.
Sandersen, P. B. E.: A basic geological complexity map for use in the implementation of the MapField concept, GEUS, Geological Survey of Denmark and Greenland Report vol. 2021 no. 37, https://doi.org/10.22008/gpub/34597, 2021.
Schullehner, J., Hansen, B., Thygesen, M., Pedersen, C. B., and Sigsgaard, T.: Nitrate in drinking water and colorectal cancer risk: A nationwide population-based cohort study, Int. J. Cancer, 143, 73–79, https://doi.org/10.1002/ijc.31306, 2018.
Seitzinger, S., Harrison, J. A., Böhlke, J. K., Bouwman, A. F., Lowrance, R., Peterson, B., Tobias, C., and Van Drecht, G.: Denitrification across landscapes and waterscapes: A synthesis, Ecol. Appl., 16, 2064–2090, https://doi.org/10.1890/1051-0761(2006)016[2064:DALAWA]2.0.CO;2, 2006.
Shaughnessy, A. R., Gu, X., Wen, T., and Brantley, S. L.: Machine learning deciphers CO2 sequestration and subsurface flowpaths from stream chemistry, Hydrol. Earth Syst. Sci., 25, 3397–3409, https://doi.org/10.5194/hess-25-3397-2021, 2021.
Stets, E. G., Kelly, V. J., and Crawford, C. G.: Long-term trends in alkalinity in large rivers of the conterminous US in relation to acidification, agriculture, and hydrologic modification, Sci. Total Environ., 488–489, 280–289, https://doi.org/10.1016/j.scitotenv.2014.04.054, 2014.
Stisen, S., Ondracek, M., Troldborg, L., Schneider, R. J. M., and van Til, M. J.: National Water Resources Model. Modeling and calibration of the DK model 2019, GEUS, Geological Survey of Denmark and Greenland Report vol. 2019 no. 31, https://doi.org/10.22008/gpub/32631, 2020.
Syakur, M. A., Khotimah, B. K., Rochman, E. M. S., and Satoto, B. D.: Integration K-Means Clustering Method and Elbow Method for Identification of the Best Customer Profile Cluster, IOP Conf. Series: Materials Science and Engineering 336 (2018) 012017, https://doi.org/10.1088/1757-899X/336/1/012017, 2018.
Temkin, A., Evans, S., Manidis, T., Campbell, C., and Naidenko, O. V.: Exposure-based assessment and economic valuation of adverse birth outcomes and cancer risk due to nitrate in United States drinking water, Environ. Res., 176, 108442, https://doi.org/10.1016/j.envres.2019.04.009, 2019.
Thorling, L., Albers, C. N., Ditlefsen, D., Hansen, B., Johnsen, A. R., Kazmierczak, J., Mortensen, M. H., and Troldborg, L.: Grundvand. Status og udvikling 1989–2022 (Technical report, Geological Survey of Denmark and Greenland), 1–147, ISBN 978-87-7871-576-0, 2024.
Tian, L., Cai, Y., and Akiyama, H.: A review of indirect N2O emission factors from agricultural nitrogen leaching and runoff to update of the default IPCC values, Environ. Pollut., 245, 300–306, https://doi.org/10.1016/j.envpol.2018.11.016, 2019.
Torrentó, C., Cama, J., Urmeneta, J., Otero, N., and Soler, A.: Denitrification of groundwater with pyrite and Thiobacillus denitrificans, Chem. Geol., 278, 80–91, https://doi.org/10.1016/j.chemgeo.2010.09.003, 2010.
Trends, R., Galloway, J. N., Townsend, A. R., Erisman, J. W., Bekunda, M., Cai, Z., Freney, J. R., Martinelli, L. A., Seitzinger, S. P., and Sutton, M. A.: Transformation of the Nitrogen Cycle, Science, 320, 889–892, 2008.
Vesselinov, V. V., Alexandrov, B. S., and O'Malley, D.: Contaminant source identification using semi-supervised machine learning, J. Contam. Hydrol., 212, 134–142, https://doi.org/10.1016/j.jconhyd.2017.11.002, 2018.
Ward, M., Jones, R., Brender, J., de Kok, T., Weyer, P., Nolan, B., Villanueva, C., and van Breda, S.: Drinking Water Nitrate and Human Health: An Updated Review, Int. J. Env. Res. Pub. He., 15, 1557, https://doi.org/10.3390/ijerph15071557, 2018.
Zamanian, K., Zarebanadkouki, M., and Kuzyakov, Y.: Nitrogen fertilization raises CO2 efflux from inorganic carbon: A global assessment, Glob. Change Biol., 24, 2810–2817, https://doi.org/10.1111/gcb.14148, 2018.
Zhang, Y. C., Slomp, C. P., Broers, H. P., Passier, H. F., and Cappellen, P. Van: Denitrification coupled to pyrite oxidation and changes in groundwater quality in a shallow sandy aquifer, Geochim. Cosmochim. Ac., 73, 6716–6726, https://doi.org/10.1016/j.gca.2009.08.026, 2009.
Nitrate pollution from farming is a global problem. A natural process called denitrification helps remove nitrate but also releases CO2, which contributes to climate change. Our study shows that CO2 from this process in Danish groundwater may be a major overlooked source – similar to other known agricultural CO2 emissions. This highlights the need to update greenhouse gas reporting to better reflect farming’s full climate impact.
Nitrate pollution from farming is a global problem. A natural process called denitrification...