the Creative Commons Attribution 4.0 License.
the Creative Commons Attribution 4.0 License.
 | 04 Sep 2025
Particulate inorganic carbon pools by coccolithophores in low-oxygen–low-pH waters off the Southeast Pacific margin
Francisco Javier Díaz-Rosas
Cristian Antonio Vargas
Peter von Dassow
A predicted consequence of ocean acidification is the decrease in coccolithophore-produced particulate inorganic carbon (PIC) pools. PIC is thought to enhance the sinking of particulate organic carbon (POC) to deeper waters, potentially influencing the depth of organic matter remineralization and subsurface O2 levels. To explore these potential feedbacks, we examined the relationships between PIC, coccolithophores, carbonate chemistry, and dissolved O2 in the Southeast Pacific open-ocean oxygen minimum zone – a region characterized by naturally low dissolved O2, low pH, and high pCO2 levels. Measurements of PIC and coccolithophore abundance from late spring 2015 and mid-summer 2018 revealed that coccolithophores, particularly Gephyrocapsa (Emiliania) huxleyi, were major contributors to PIC through the shedding of coccoliths. On average, about half of the PIC was attributed to reliably enumerated coccospheres and detached coccoliths, with significantly diminished pools below the euphotic zone. Temperature, O2, and pH emerged as key factors associated with PIC variability. PIC pools and PIC : POC ratios in both surface and subsurface waters in this naturally low-pH–low-O2 zone are lower than available data from most oceanic regions, with the exception of the Western Arctic. Our findings support the prediction that in upwelling regions with a shallow oxygen minimum zone, POC production is promoted by phytoplankton other than PIC-producing coccolithophores due to the injection of nutrient rich but low-pH water. This process decreases PIC : POC ratios, suggesting that the role of PIC in POC sedimentation might be decreased under such conditions. We emphasize that comparing PIC dynamics across diverse upwelling systems will be valuable for understanding how low-pH and low-O2 conditions influence POC fluxes mediated by coccolithophores.
- Article
(9741 KB) - Full-text XML
-
Supplement
(5964 KB) - BibTeX
- EndNote


The particulate inorganic carbon (PIC) pool is a key component of marine carbon cycles and atmospheric reservoirs (Ridgwell and Zeebe, 2005). It originates from various sources, including land-derived inputs to coastal margins (Cai, 2011) and biological processes such as phytoplankton calcification (Taylor and Brownlee, 2016). Coccolithophores, particularly the cosmopolitan species Gephyrocapsa (Emiliania) huxleyi, significantly contribute to PIC through coccolith production. Coccoliths are thought to enhance the sinking of organic matter (i.e., the “ballast effect”), facilitating the export of particulate organic carbon (POC) to deeper waters (e.g., Klaas and Archer, 2002), thereby influencing carbon sequestration and nutrient cycling in the global pelagic ocean (Monteiro et al., 2016; Balch, 2018). Changes in PIC dynamics, driven by shifts in coccolithophore communities across spatial and temporal scales, feed back into the ocean–atmosphere system (Balch et al., 2016; Claxton et al., 2022). For example, ocean acidification (OA) – characterized by decreasing pH and carbonate ion concentration – can impair coccolithophore calcification (Riebesell et al., 2000; Barcelos e Ramos et al., 2010; von Dassow et al., 2018; Kottmeier et al., 2022; von Dassow, 2022). This could lead to diminished CaCO3 fluxes to the seafloor, increasing organic matter respiration and potentially decreasing both organic carbon flux and mid-water O2 levels (Hofmann and Schellnhuber, 2009; Zhang et al., 2023). In this context, understanding the relationships between coccolithophore PIC, pH/pCO2, and O2 in natural oxygen minimum zones (OMZs) – where pH and O2 levels can reach extremely low levels – is of particular interest.
While PIC measurements are more extensive in the Atlantic Ocean and the Atlantic sector of the Southern Ocean, the Pacific Ocean remains underrepresented in PIC and coccolithophore data. Nevertheless, research on coccolithophore distributions is increasing in the Indian Ocean, the subpolar Pacific, and the Southern Ocean (Balch et al., 2018; Oliver et al., 2023). A particularly notable basin-scale coccolithophore feature, the Great Calcite Belt, encircles the Southern Ocean and is primarily sustained by G. huxleyi growth (Balch et al., 2016; Balch and Mitchell, 2023). This feature, which decreases in the Pacific sector of the Southern Ocean, advances southward each year, peaking in austral summer (Hopkins et al., 2019). Temperature, competition with diatoms for nutrients, and Fe availability have been proposed as factors controlling coccolithophore distributions in the Southern Ocean (Oliver et al., 2023, and references therein). Early satellite data suggested that the Pacific hosts relatively lower surface PIC concentrations compared to the Atlantic (Brown and Yoder, 1994), but this is less clear in more recent analyses (Hopkins et al., 2019), and higher subsurface PIC concentrations and/or higher coccolithophore abundances have been reported in remote Southeast Pacific waters at depths beyond the detection limits of satellites (Beaufort et al., 2008; Oliver et al., 2023).
Vast OMZs are persistent features of the tropical and subtropical Eastern Pacific waters (Schmidtko et al., 2017), where low pH and high pCO2 levels are common (Torres et al., 2002, 2011; Beaufort et al., 2011; Vargas et al., 2017, 2021). Although such conditions have been shown to inhibit coccolithophore growth and calcification in laboratory settings, field observations suggest more complex relationships (Beaufort et al., 2011; Müller et al., 2015; von Dassow et al., 2018). There is still limited data on how PIC, POC, pH, and O2 interact within OMZ systems.
Here, we evaluated total PIC and the fraction derived from coccolithophores in OMZ waters, distinguishing pools in the well-lit waters above the oxycline from pools in the subsurface OMZ core below the oxycline. We first analyzed satellite imagery to assess how well the in situ sampling captured the spatial and temporal variability of surface PIC during two cruises. We also present the physicochemical structure of the upper water column from both cruises to evaluate how variations in the depth of the oxycline and carbonate system parameters were reflected in the discrete samples collected for coccolithophore and PIC analysis. Coccolithophore and detached coccolith diversity were analyzed to identify the major species contributing to PIC and to quantify the proportion of total PIC derived from coccolithophores. We further examined how low-pH and low-O2 conditions may act as barriers to coccolithophore stocks and their associated PIC. Finally, total and coccolithophore-derived PIC were estimated separately for the upper layer, including the euphotic zone, where coccolithophores are presumed to grow, and for the oxygen-deficient core of the OMZ, where coccolithophore-derived PIC is assumed to originate from sinking particles. These values were then compared with available data from the same depths in other oceanic regions, obtained using comparable methodologies.
2.1 Sampling
The sampling consisted of two cruises conducted in waters off the Southeast Pacific margin near northern Chile (Fig. 1a). In spring 2015 (LowpHOx 1), we sampled six stations along an inshore–offshore transect off Iquique (20° S; sts. T1–T6), along with six stations arranged latitudinally between 22 and 29.5° S (sts. L1–L6). During summer 2018 (LowpHOx 2), three of the inshore–offshore stations were replicated (sts. T1, T3, T5), along with seven stations sampled southward down to ∼34° S (sts. Lander and Hydro; Fig. 1a). In depth, the sampling crossed both the euphotic zone and OMZ core (Figs. 1b, 3c–e, 5a–c). The predominant oceanographic conditions during these two cruises, some reported previously by Vargas et al. (2021), provide the context for the new data presented here.
At each station, discrete seawater samples were collected, filtered, stored, and moved to the lab for the determination of PIC (Sect. 2.2) and coccolithophore standing stocks (Sect. 2.3). Due to seawater availability onboard in 2018, sampling for coccolithophores only reached 100 m, except for station T5, which reached a depth of 2000 m. This contrasts with the 2015 sampling reaching depths equal to or greater than 350 m (max. 1000 m in T3 and T4). As ancillary data, 1 m averaged temperature, salinity, O2, and fluorescence continuous profiles, as well as discrete data on Chlorophyll a (Chl a), nutrients, POC, and carbonate system (Vargas et al., 2021) were extracted from Vargas et al. (2023a, b, c). The euphotic depth (Zeu) was estimated by calculating the depth at which the photosynthetically active radiation (PAR) is reduced to 1 % of surface levels, using the attenuation coefficients (Kd490) provided by the Bio-Geo-Chemical products based on the Copernicus-GlobColour processor (Copernicus-GlobColour, 2023). The averaged Kd(490) values (3×3 pixels and 3 d average) were converted into Kd(PAR) values following the model of Morel et al. (2007), and the 4.6 optical depth was calculated as ln(100) Kd(PAR) (Morel, 1988). Where available, a good fit was found between the euphotic zone depth derived from satellite observations and PAR obtained from a sensor attached to the CTD (Fig. S1 in the Supplement). Lastly, the OMZ core was defined as the water layer where dissolved O2 was below 20 µmol kg−1, a commonly used threshold (e.g., Gilly et al., 2013), which we also use here to approximate the depth of the base of the upper oxycline.
2.2 Particulate inorganic carbon standing stocks
Monthly and weekly satellite-derived PIC products (November–December 2015 and January–February 2018) were obtained from the MODIS-Aqua mission (NASA Ocean Biology Processing Group, 2023; Balch and Mitchell, 2023). The data were then converted from mol CaCO3 m−3 to µg C L−1 by multiplying by 11 910.69 and plotted in R (R Core Team, 2024) using the RStudio IDE (Posit Software, PBC, 2024).
For in situ measurements of total PIC (PICTotal), we used a modified version of the procedure introduced by Poulton et al. (2006). In summary, we filtered between 0.1–1.5 L of seawater (increasing with sampled depth) onto 25 mm polycarbonate filters with a 0.4 µm pore size. Prior to removal from vacuum, filters were immediately rinsed with a squirt of potassium tetraborate solution in 2015 or with seawater alkalinized with ammonium in 2018 (to maintain pH >8.0 while in storage) and stored in metal-free Falcon tubes at −20 °C until transit to the lab. Subsequently, Ca2+ was extracted with nitric acid and quantified using Inductively Coupled Plasma Atomic Mass Spectrophotometry facilities at the Bigelow Laboratory for Ocean Sciences. A correction was made to correct for potential excess of Ca2+ due to Na+ residues that might be left on the filters. This calculation indicated that residual seawater contributed on average 29.1±25.8 % of total Ca2+ in LowpHOx 1 samples and on average 35.2±21.5 % of total Ca2+ in LowpHOx 2 samples. The PIC concentrations were expressed in µg C L−1. Additionally, we examined the association between calcification (PIC) and POC using PIC : POC ratios. These PIC, POC, and PIC : POC ratios were then categorized into two groups: above the oxycline and within the OMZ core.
Data from this study were compared with those reported for other regions (see Balch et al., 2018). PIC and POC data came from the SEABASS (Werdell et al., 2003) and BCO-DMO repositories (Balch, 2010). Depth intervals were chosen to detect broader ecological patterns robustly. We aimed to be roughly comparable with the categories above the oxycline (mostly corresponding to the Zeu, where coccolithophores are growing) and below the oxycline, where coccolithophores are presumed present entirely due to sinking from the surface. However, OMZ systems are highly stratified, and eukaryotic phytoplankton growth is excluded from below the lower half of the oxycline (which also corresponds to a strong pycnocline) even when sufficient light penetrates for photosynthesis (Wong et al., 2023). In contrast, in non-OMZ systems, the lower limits of growing phytoplankton are less constrained, and coccolithophores are part of the “shade flora” (Balch, 2018). Therefore, data were binned over 0–100 m depths to represent the surface, and over 100–400 depths to represent the subsurface.
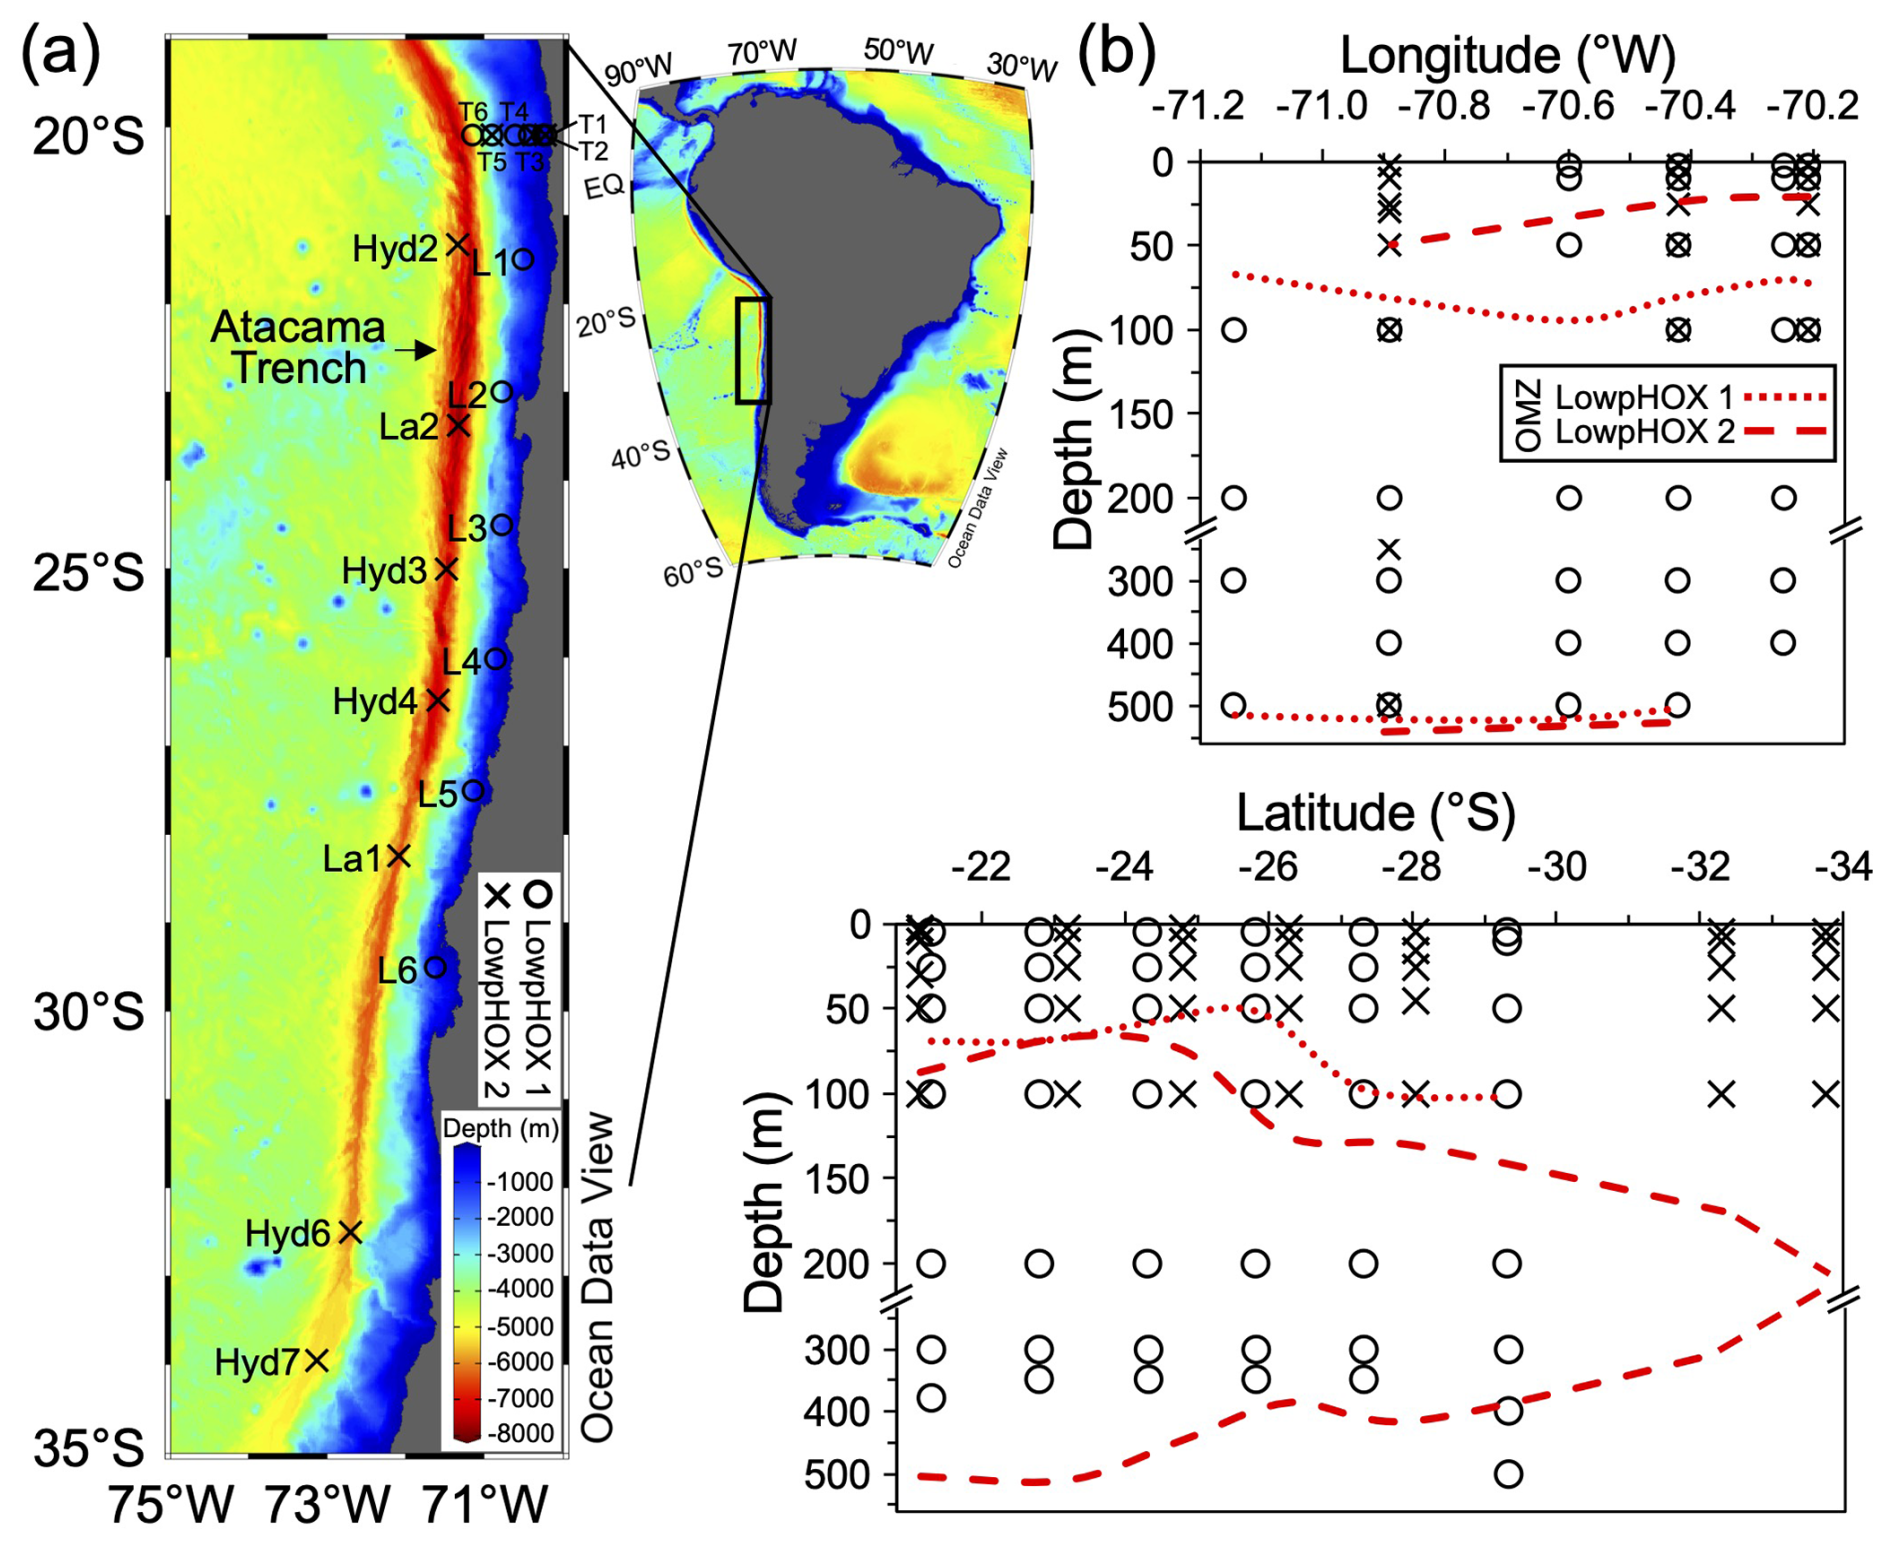
Figure 1(a) Map of the Southeast Pacific margin showing the study site and stations sampled during late spring 2015 (circles) and mid-summer 2018 (crosses). (b) Sampling depth coverage for coccolithophores, highlighting areas crossing the OMZ core thresholds of 20 µmol kg−1 (dotted and dashed red lines). Map produced by Ocean Data View (Schlitzer, 2024), with bathymetry based on the GEBCO chart (GEBCO, 2023).
2.3 Coccospheres and detached coccoliths standing stocks
For enumeration of coccospheres and detached coccoliths, between 0.1 to 1.0 L of seawater (increasing with depth) was filtered onto 25 mm 0.8 µm pore polycarbonate filters, dried in Petri dishes, and stored with desiccant until microscopy analyses. Coccosphere counts were conducted on filter slide preparations with oil immersion, using cross-polarized light microscopy (LM; Zeiss, Axioscope 5), analyzing 20 fields of view at 400× magnification covering 5.1 mm2 of the filter area (corresponding to 1.9 to 16.3 mL of seawater). For counts of total detached coccoliths, 11 fields of view per filter were screened (224×165 µm per frame) at 630× magnification (oil immersion objective), covering 0.41 mm2 of the filter area, corresponding to total volumes of 0.2–1.3 mL of seawater analyzed. On average, 171±307 coccospheres (range: 2–2099) and 708±664 coccoliths (range: 5–4067) were analyzed per sample. An issue arose where some filters from the inshore–offshore 2015 sampling (20° S; Stations T1–T6) exhibited excessive brightness under LM. The coccosphere and detached coccolith counts were made by scanning electron microscopy (SEM) analysis (Quanta FEG 250), as described in Díaz-Rosas et al. (2021). For the quantification of coccosphere abundances by SEM, between 28–48 images taken at 800–1500× magnification were examined per filter, covering from 5 to 6 mm2 of the filter area and corresponding to a range of 2.1–18.4 mL of seawater analyzed. For total detached coccolith abundances, between 4–5 images were examined per filter, covering from 0.6 to 1.0 mm2 of the filter area and corresponding to a range of 0.2–2.8 mL of seawater analyzed. On average, 166±280 coccospheres (range: 1–1141) and 861±879 detached coccoliths (range: 58–3815) were counted per sample. Layers of coccoliths detached from G. huxleyi (Fig. S2a–d) were added to the detached-coccolith counts. Collapsed coccospheres were included when they remained mostly intact, but when more disintegrated could not be accurately counted, especially as they were often less reflective than intact coccospheres and coccoliths (Fig. S2e–h). In a subset of samples, collapsed coccospheres were estimated to contribute <21 % (min. = 0 %, average = 7.1 %) of the total number of coccospheres. As expected, the standard error of the means (among the images obtained from the same sample) drops hyperbolically with the total number of coccospheres or coccoliths counted, whether with LM or SEM (Fig. S3), but remains higher in SEM due to the smaller size of SEM images. To check for differences between coccolithophore counts obtained through LM and SEM, five samples with varying abundances were analyzed using SEM as outlined above. The results showed highly linear relationships (R2>0.9), with slopes not significantly different from 1 and intercepts close to 0 (Fig. S4), supporting the combination of counts from both methods.
2.4 Diversity of coccospheres and detached coccoliths
Identification of coccolithophores and detached coccoliths by LM is limited, which may impact the estimation of coccolithophore-derived PIC relative to total PIC, as it relies on the estimated PIC quotas of coccospheres and coccoliths. To understand this effect, taxonomic classification by SEM was performed on samples from the LowpHOx 1 cruise (2015), focusing on samples from T1 to T6 as well as selected samples from L1 (at 5 and 25 m), L2 (at 5 and 50 m), and L3 (at 5 m). Between 6–11 and 4–5 images per filter, depending on magnification (ranging from 800× to 1500×), were examined for coccosphere and coccolith classification, respectively, following classifications of Young et al. (2003). Due to limitations in SEM time, it was not always possible to zoom to higher magnification to differentiate between G. parvula and G. ericsonii coccospheres, so they were merged into the G. parvula/ericsonii category. The only character distinguishing their coccoliths is a small bridge present in G. ericsonii and not G. parvula (representing a minor effect on PIC quotas). Also, the grouping of the two species is phylogenetically supported (Bendif et al., 2016, 2019). Moreover, as some of the small coccoliths detached from G. parvula/ericsonii might be overlooked (2.0 µm in length), the few coccoliths found in distal-shield view, and the coccoliths from G. huxleyi (3.6 µm in length) were merged into the Gephyrocapsa <4 µm category. Larger coccoliths (>5 µm in length) were classified into species or genus, being subtracted from total counts of coccoliths obtained in the same SEM image to obtain the number of coccoliths <4 µm. Most rare detached coccoliths were grouped in the miscellaneous category, that includes Syracosphaera spp., Acanthoica spp., Discosphaera tubifera, Umbellosphaera spp., and Umbilicosphaera spp. Moreover, the counts of detached coccoliths from Calcidiscus leptoporus might contain a few coccoliths of Oolithotus spp. as it was not always possible to differentiate them. In all surface samples taken in 2018, as well as in samples L4 to L6 from 2015, species dominating the coccosphere and detached coccolith pools were identified using LM (40× and 63× objectives, Zeiss Axioscope 5) following Frada et al. (2010).
2.5 Coccolithophore specific PIC quotas and estimation of coccolithophore-derived PIC
The PIC quotas of individual coccoliths and coccospheres were estimated following Young and Ziveri (2000) and used to calculate coccolithophore-derived PIC stocks (PICCocco) from abundances of coccospheres and detached coccoliths. To obtain the coccolith mass (in pg CaCO3), the cube of the mean distal-shield length of coccoliths (= biovolume in µm3) measured in the SEM images (see Table S1 in the Supplement) was multiplied by the respective taxonomic-specific shape factor Ks (Young and Ziveri, 2000) and by the density of calcite (2.7 g cm−3). The number of coccospheres was converted to coccoliths by using the compilation of coccoliths per coccosphere in Yang and Wei (2003). For G. huxleyi, the 17 coccoliths per coccosphere determined by Beaufort et al. (2011) was in agreement with those seen in our SEM images. We did not account for variation in coccoliths per coccosphere or in mass of coccoliths among G. huxleyi morphotypes. The PICCocco standing stock (in µg C L−1) included both coccospheres and detached coccoliths. Given the lack of taxonomic resolution for the 2018 samples, the G. huxleyi PIC quota (mass = 2.5 pg CaCO3 per coccolith; see Table S1) was applied as the maximum threshold to all samples for consistency, a scenario justified as G. huxleyi was the most common coccolithophore in both the 2015 and 2018 samples (see below). Notably, PICCocco quotas estimated using G. huxleyi as a uniform reference closely aligned with those derived from all-taxa coccolith mass factors across the 2015 T1–T6 transect (Fig. S5).
2.6 Statistical analyses
Rarefaction analyses using the iNEXT package (Hsieh et al., 2024) assessed sampling effort effects on diversity, based on the species richness and the exponential of Shannon entropy indexes.
Associations between selected pairs of variables across cruises were evaluated using simple linear regression. Key assumptions (linearity, homoscedasticity, normality, and independence) were assessed by visual inspection of scatterplots and residual plots. Trend lines were included only for relationships showing reasonable explanatory power (R2>0.5 or p value <0.05). All analyses were conducted in R (R Core Team, 2024) using the RStudio IDE (Posit Software, PBC, 2024).
To assess differences in PIC, POC, and PIC : POC ratios among the OMZ and other regions, we tested the assumptions of normality and homogeneity of variances. These assumptions were not met despite common data transformations. Therefore, we applied a robust ANOVA using 20 % trimmed means (Yuen, 1974; Kitchenham et al., 2017), implemented with the yuen function from the WRS2 package (Mair and Wilcox, 2020). Pairwise comparisons were conducted using a robust Tukey-type test (mcppb20), and results were summarized by letter groupings above each boxplot, where groups sharing a letter are not significantly different (p<0.05). A full table of all pairwise comparisons is provided in Tables S2–S8. Additionally, to test for differences between the two OMZ layers, we used a robust two-sample test with 10 % trimmed means (yuenbt), which provides bootstrapped p values and confidence intervals while reducing the influence of outliers. Letters indicating the results of this two-group comparison are shown above the corresponding boxplots.
3.1 Oceanographic context
3.1.1 Spatial variability in PIC indicated by satellite
During both sampling periods (Fig. 2), satellite-derived surface PIC concentrations exhibited spatial variability, with peaks (>10 µg C L−1) near 20° S at the coast. The high surface PIC extended further south in 2018, with prominent jets from the coast at approximately 21 and 23° S. In 2015, a wide band of moderately high PIC also occurred south of approximately 23° S and extended to 32° S. In situ sampling included most of the range of variability in surface PIC indicated by satellite.
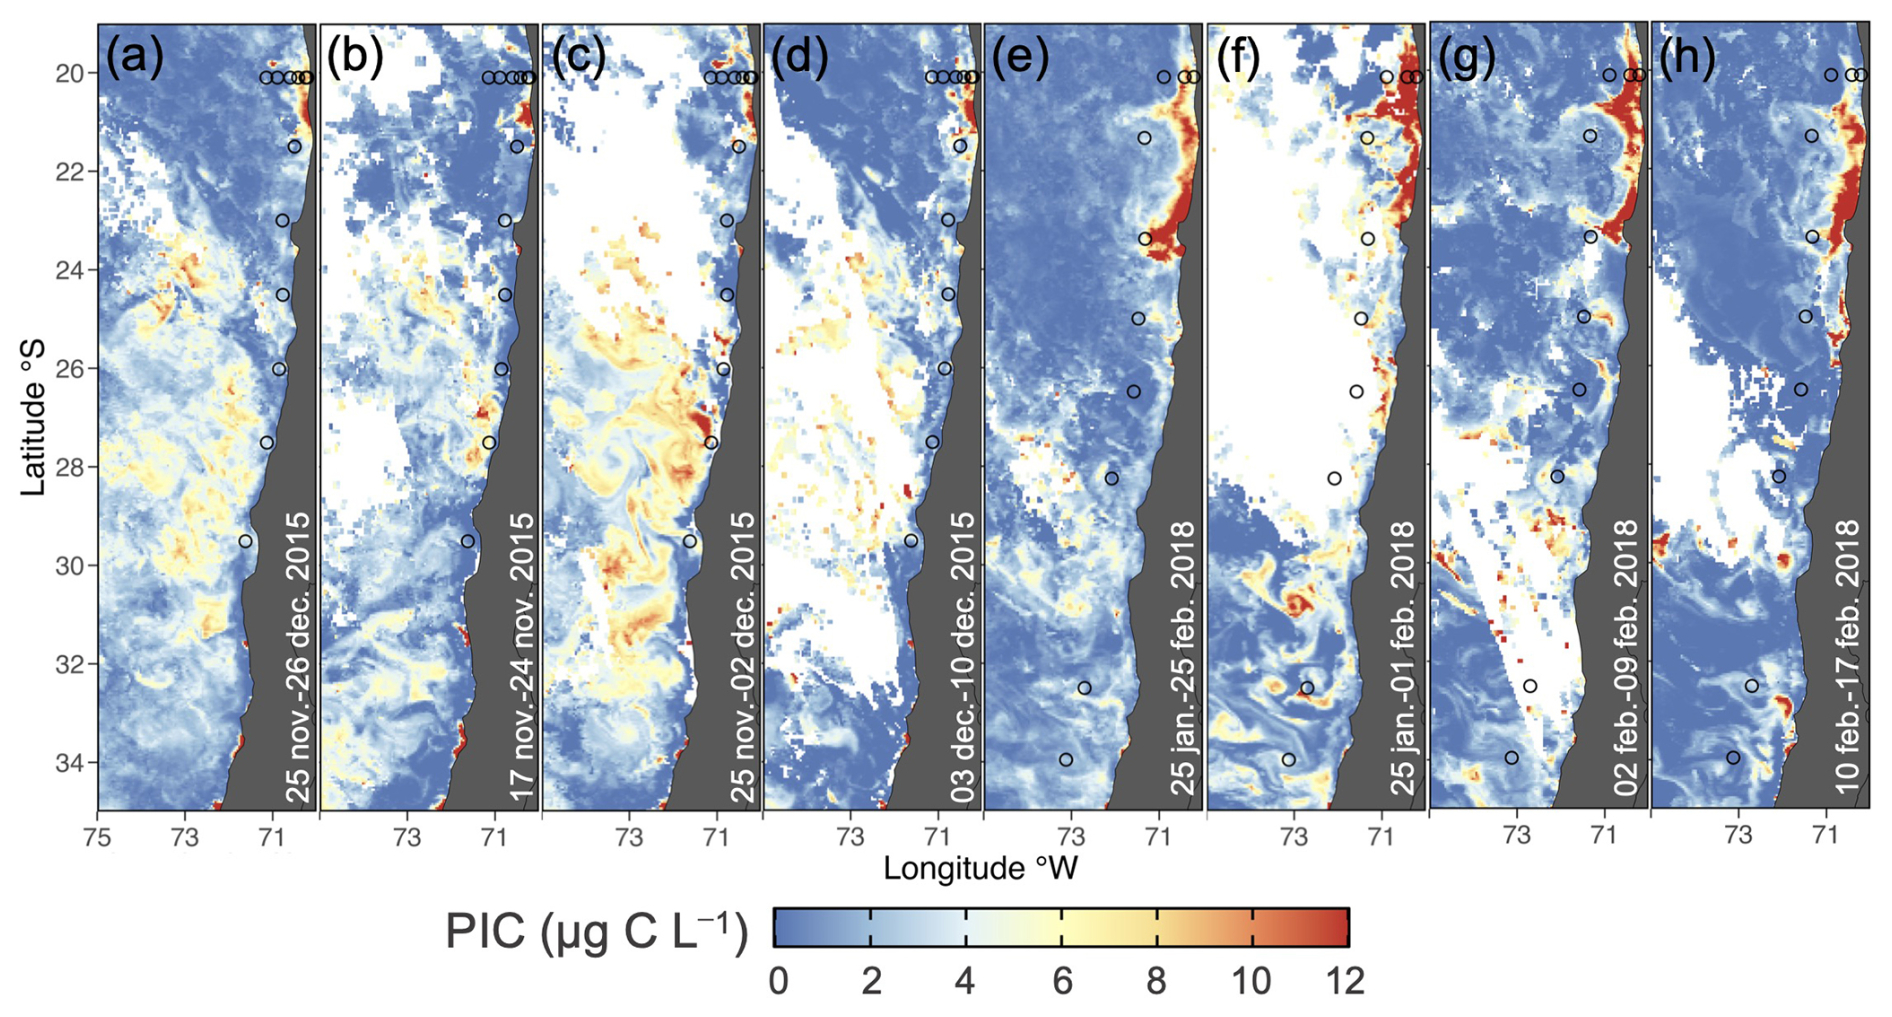
Figure 2Monthly (a) and weekly (b–d) satellite PIC during the LowpHOx 1 sampling (27–28 November/5–9 December 2015; open circles), along with monthly (e) and weekly (f–h) satellite PIC for the LowpHOx 2 sampling (30 January/3–9 February/12–13 February 2018; open circles).
3.1.2 Oceanographic context in situ
Surface (mixed) layer temperatures exceeded 21 °C to the north and offshore, while surface temperatures were below 17 °C near the coast, in the north and south of 21 and 24° S latitude in 2015, and south of 29° S in 2018 (Fig. 3a). The pycnocline (Fig. 3b) and oxycline (Fig. 3c) roughly paralleled the thermocline in both years. In 2015, the oxycline was always in the upper 50 m. In 2018, the depth of the oxycline increased to between 50 and 75 m south of 26° S. The estimated Zeu was often near the base of the oxycline, but these sometimes crossed (Fig. 3c). The highest phytoplankton biomass (extracted chlorophyll and calibrated fluorescence values reaching or exceeding 3 mg m−3) always occurred shallower than Zeu, though in some stations a defined primary chlorophyll maximum at the base of Zeu was not present and fluorescence was highest near the surface, not near Zeu (Fig. 3d–e).
Nitrate and phosphate levels were low above the pycnocline (<2 and <1 µM, respectively), and increased below (to approximately 20 and 2.5 µM respectively; Fig. 3f–g). Both pH and Ωcalcite declined sharply while pCO2 increased with depth through the oxycline (Fig. 3h–j). Within the upper 100 m, pH varied negatively with pCO2 and also positively with O2, while nitrate varied positively with pCO2 and negatively with pH and O2, though the scatter was somewhat higher for the relationships pH-O2 and nitrate-pCO2 (Fig. S6). In general, O2 was more restricted by depth compared to nitrate and pCO2 (Fig. S6). Ωcalcite was always greater than 1 in the upper 100 m (Fig. S6). In fact, values of Ωcalcite below 1 were never observed – even down to 1000 m (Fig. 3k).
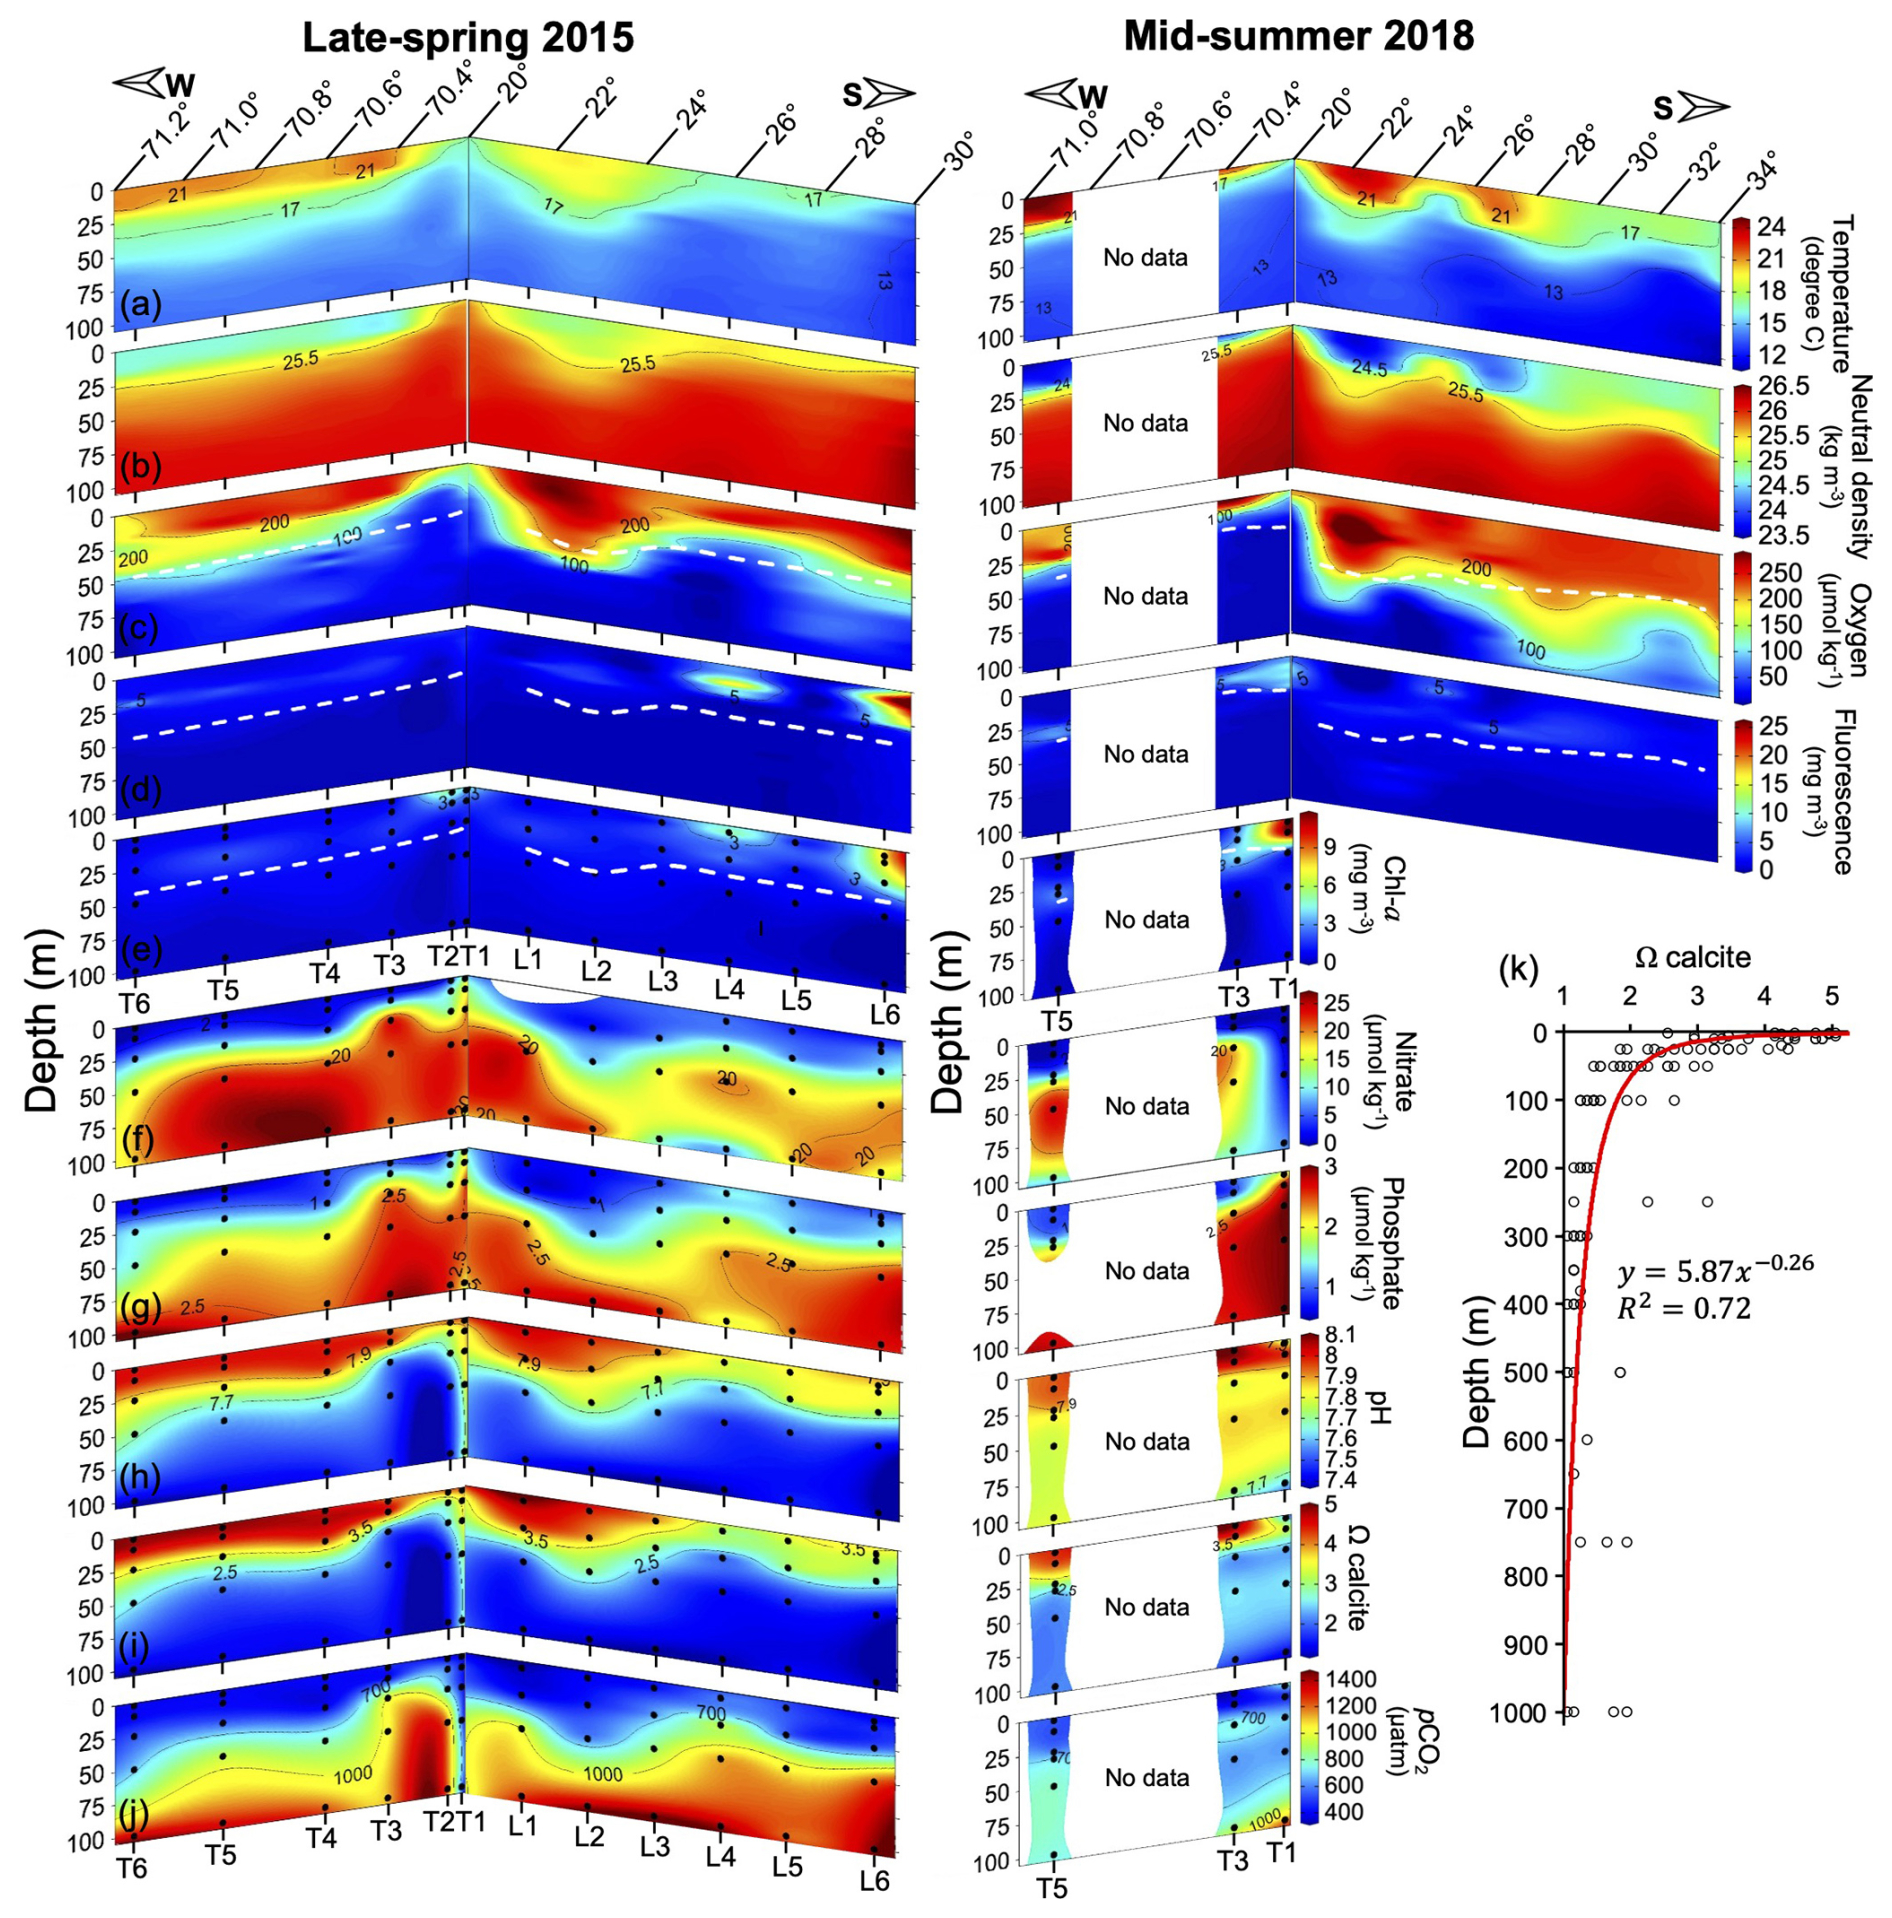
Figure 3Spatial variation in temperature (a), neutral density (b), O2 (c), fluorescence (d), Chl a (e), nitrate (f), phosphate (g), pH (h), Ωcalcite (i), and pCO2 (j) within the upper 100 m, along with vertical distribution of Ωcalcite down to 1000 m depth (k) during 2015 and 2018. In panels (e)–(j) sample locations are indicated by solid black circles. Continuous profiles in panels (a)–(d) are 1 m binned. Dashed white lines in panels (c)–(e) indicate the estimated euphotic depth. The red line in panel (k) represents a power trend curve.
3.2 Coccolithophore species contributing to PIC
In 2015, G. huxleyi was the numerically dominant coccolithophore south of 20° S (Fig. S7). It co-dominated with G. parvula/ericsonii, the coccosphere standing stocks at 20° S, where there was no consistent variation in the relative abundance of these taxa (Fig. 4a). Despite the presence of G. parvula/ericsonii, its small coccoliths were underrepresented, reinforcing the overwhelming prevalence of G. huxleyi in the samples (Fig. S8a). The low diversity of both coccospheres and detached coccoliths is supported by the rapid saturation of rarefaction curves from samples at different stations, grouped by depth layers (Fig. S9). The relative abundance of larger taxa (principally G. oceanica in stations T1–T2, Helicosphaera spp. in T3, and C. leptoporus in T4) increased below the Zeu, reaching 0 %–18 % and 0 %–15 %, respectively (Fig. 4), as total coccosphere and coccolith abundances declined sharply.
Only polarized LM data was available in 2018 (Fig. S10), and moderately sized Gephyrocapsa spp. dominated coccolithophore communities in all 2018 samples, as in 2015. Light microscopy cannot reliably distinguish G. huxleyi from G. parvula/ericsonii or G. muellerae (the bridge in G. ericsonii is too small to be reliably observed under LM and in both G. muellerae and G. ericsonii, the bridge may be absent in some coccoliths) but qualitative LM observations suggested that coccospheres and coccoliths smaller than G. huxleyi were very rare.
Above the Zeu, the coccospheres and detached coccoliths of G. huxleyi and G. ericsonii/parvula dominated the PICCocco pools (Fig. 4b–c). Coccosphere abundances reached maxima of 3.9×10⁵ and 5.2×10⁵ L−1, and abundances of detached coccoliths reached maxima of 63×105 and 49×105 L−1 in spring 2015 and summer 2018, respectively (Figs. S11–S12). Overall, coccosphere abundance tended to vary directly with detached coccolith abundance, although with a high scatter (Fig. S13a). Above the Zeu, the average ratio of coccoliths to coccospheres was 40 in 2015 (range: 4–104; n=21) and 33 in 2018 (range: 6–62; n=31) (Fig. S13b). Only one sample had a ratio higher than 100. The ratio of detached coccoliths to coccospheres was not related to either coccosphere abundance or PICCocco; notably, the three samples with the highest values for these variables all showed ratios below 20 (Fig. S13c–d).
In contrast, detached coccoliths of numerically rarer taxa, such as C. leptoporus, Helicosphaera spp., and G. oceanica, contributed significantly to PICCocco below the Zeu, sometimes exceeding the contributions of the smaller Gephyrocapsa species (Fig. 4c). However, because most samples were dominated by G. huxleyi, PICCocco estimations using taxa-specific conversions generally showed little differences with PICCocco estimations made with the assumption that all coccospheres and coccoliths had PIC quotas similar to G. huxleyi (Fig. S5a), so this simplification was made in estimating PICCocco pools over the whole dataset.
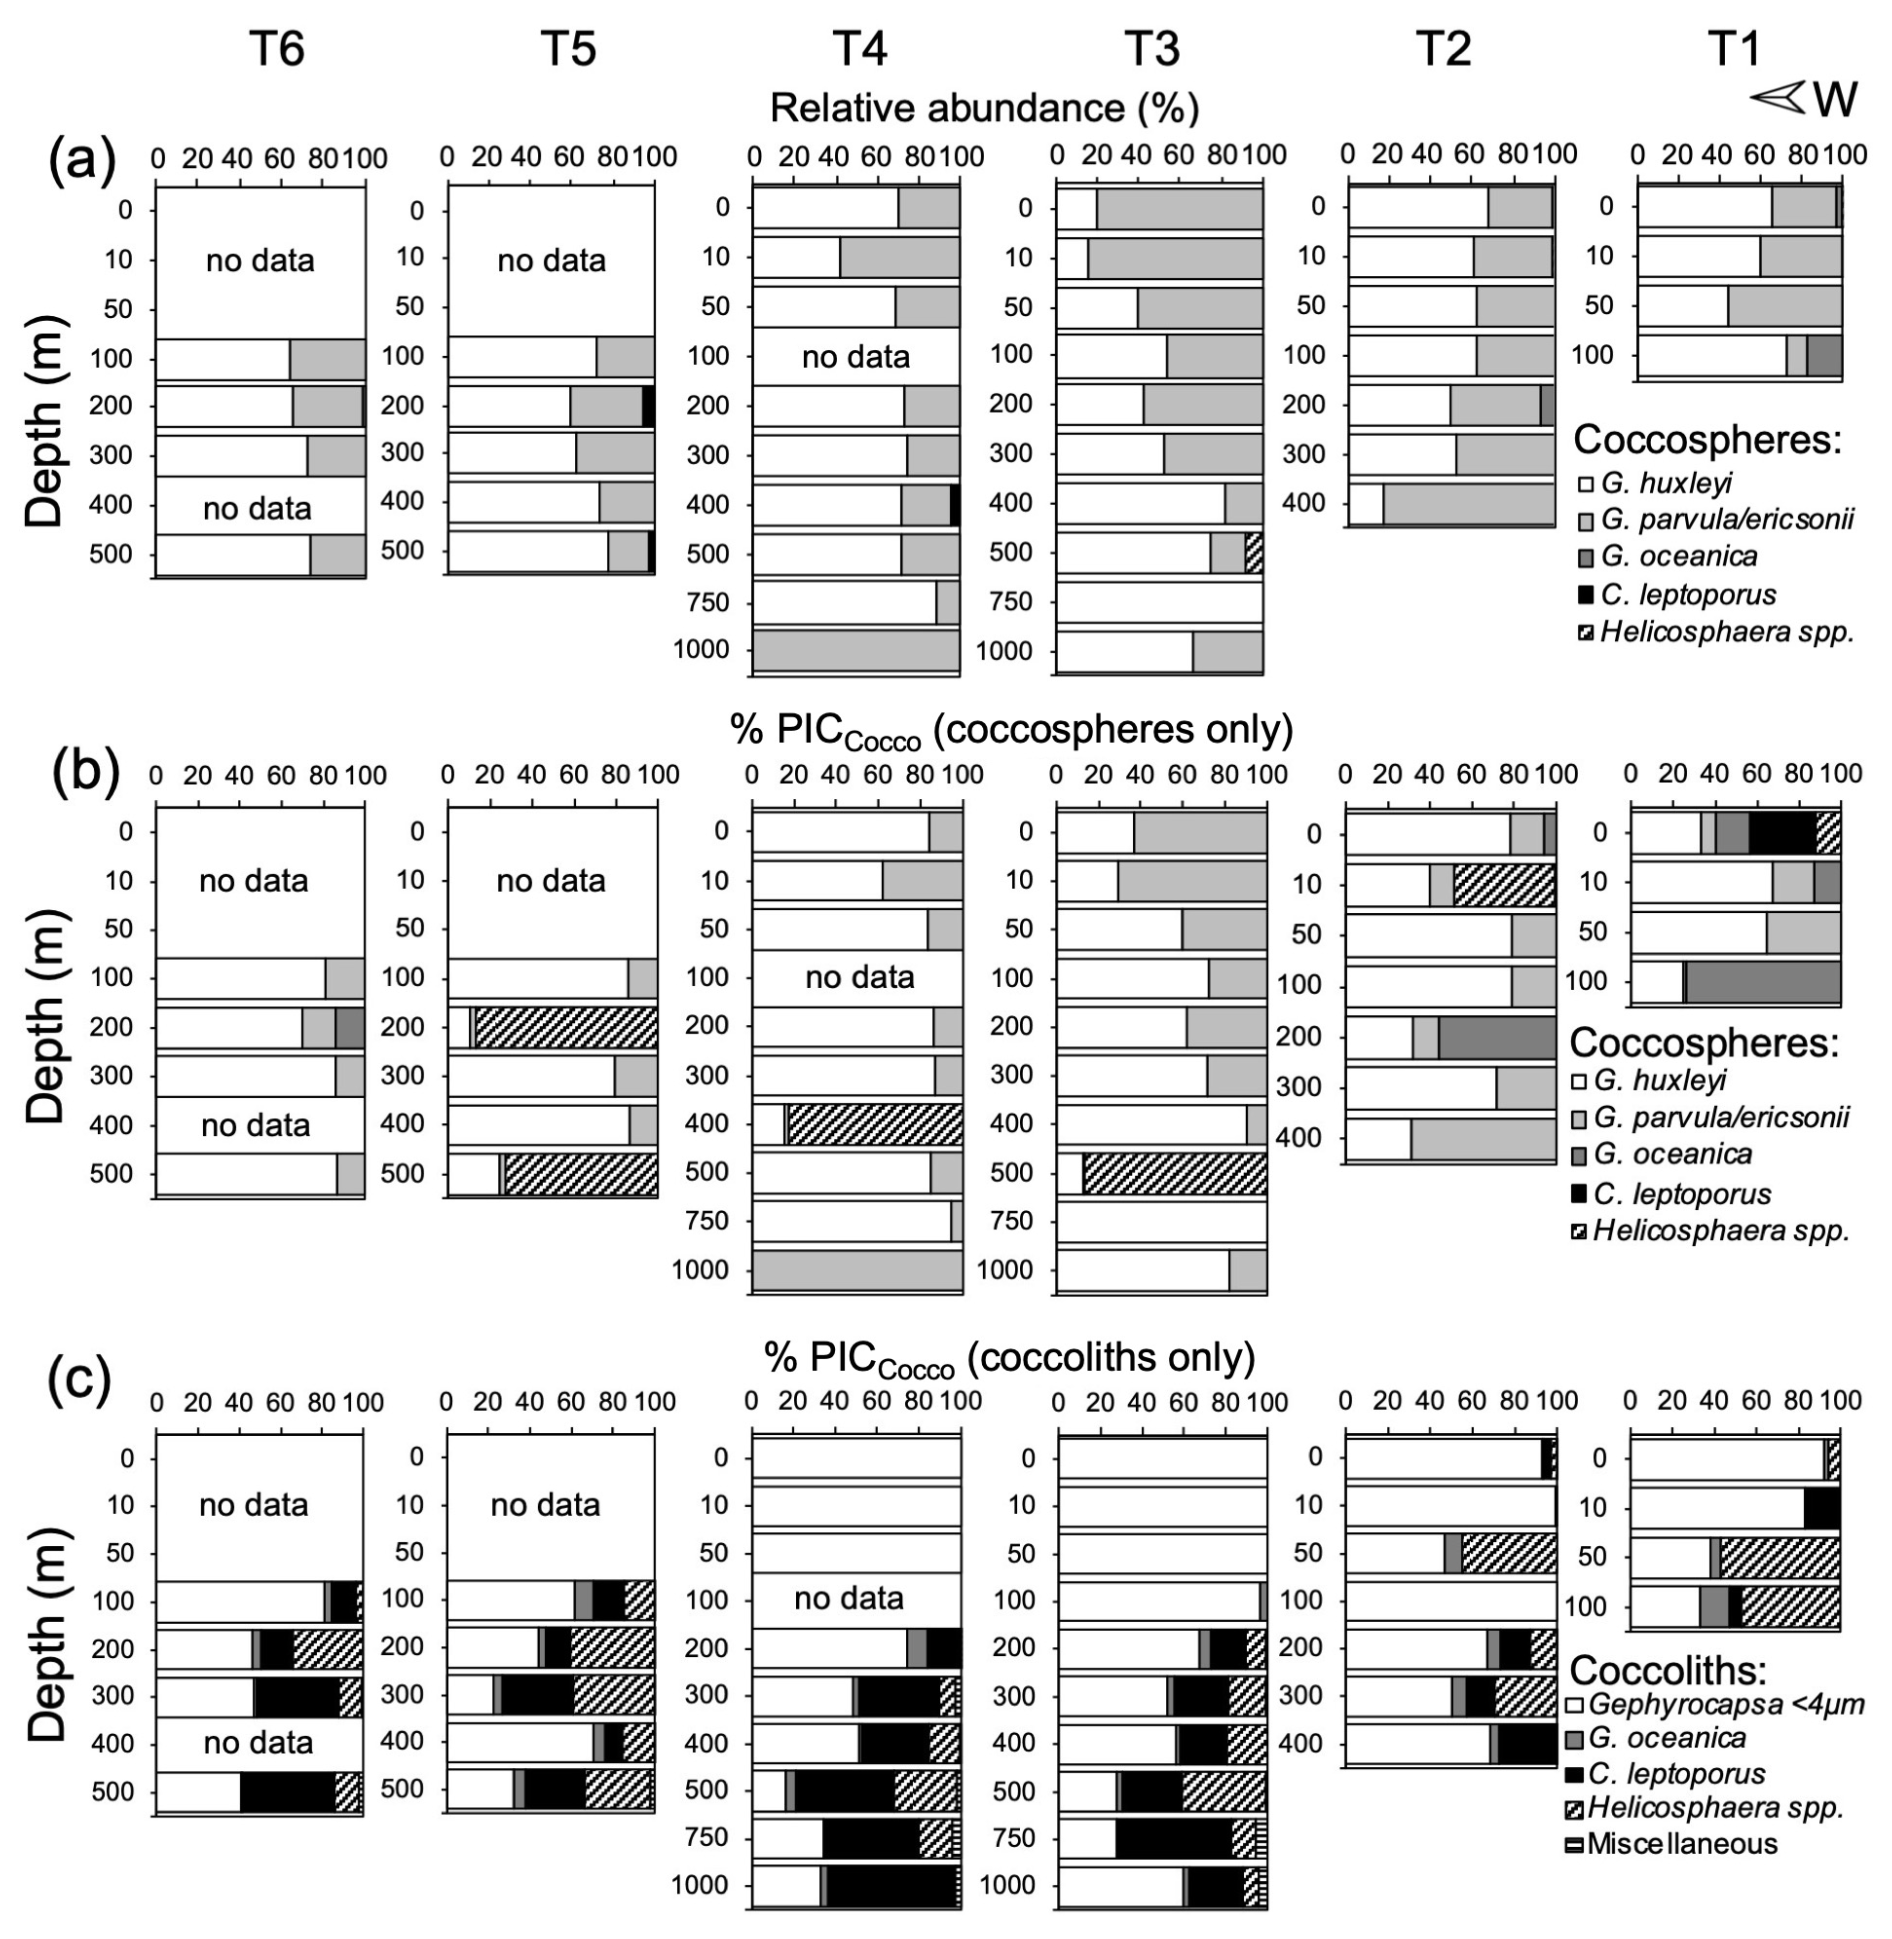
Figure 4Relative abundance of coccospheres (a) and estimated PIC masses from coccospheres (b) and detached coccoliths (c) off Iquique (20° S) in 2015. (b–c) Taxonomic breakdown of the relative contributions of coccospheres and detached coccoliths to PICCocco quotas, expressed as percentages of the total PICCocco pool. The PICCocco pool estimate is based on abundances obtained via scanning electron microscopy.
3.3 Variability in PIC, POC, and PIC : POC ratios and the contribution of coccolithophores to PIC
In both years, PICTotal and PICCocco were the highest off 20° S, extending further from the coast in 2018 (Fig. 5a–b), similar to what was observed by satellite (Fig. 2) and coinciding with patches high in POC. Some of the patches or bands of moderately high surface PIC observed by satellite between 26 and 32° S (Fig. 2a–d) were also reflected in surface in situ PICTotal and PICCocco. A patch of high PIC in 2018 near 32° S, as indicated by satellite, was likewise reflected in surface in situ PICTotal and PICCocco. However, deeper euphotic peaks in coccoliths or PICTotal, such as those observed in 2018 near 23–25° S (Fig. 5b), were not detected by satellite. Considering all stations and depths, PICTotal ranged from 0.18 to 3.81 µg C L−1 in 2015 and from 0.08 to 5.86 µg C L−1 in 2018 (Fig. 5a). The estimated PIC pools produced by coccolithophores ranged from 0.02 to 3.60 µg C L−1 in 2015 and from 0.01 to 3.69 µg C L−1 in 2018 (Fig. 5b).
PICCocco was well correlated with PICTotal (Fig. 5d), with the 1:1 line representing an upper limit. Almost half of PICTotal in the upper 100 m was directly accounted for by coccospheres or detached coccoliths (Fig. 5e). Below this depth, the proportion dropped substantially, with 70 % of PICTotal below 100 m not accounted for by microscopic counts; where most PICCocco was attributed to detached coccoliths (Figs. 5e, S8b).
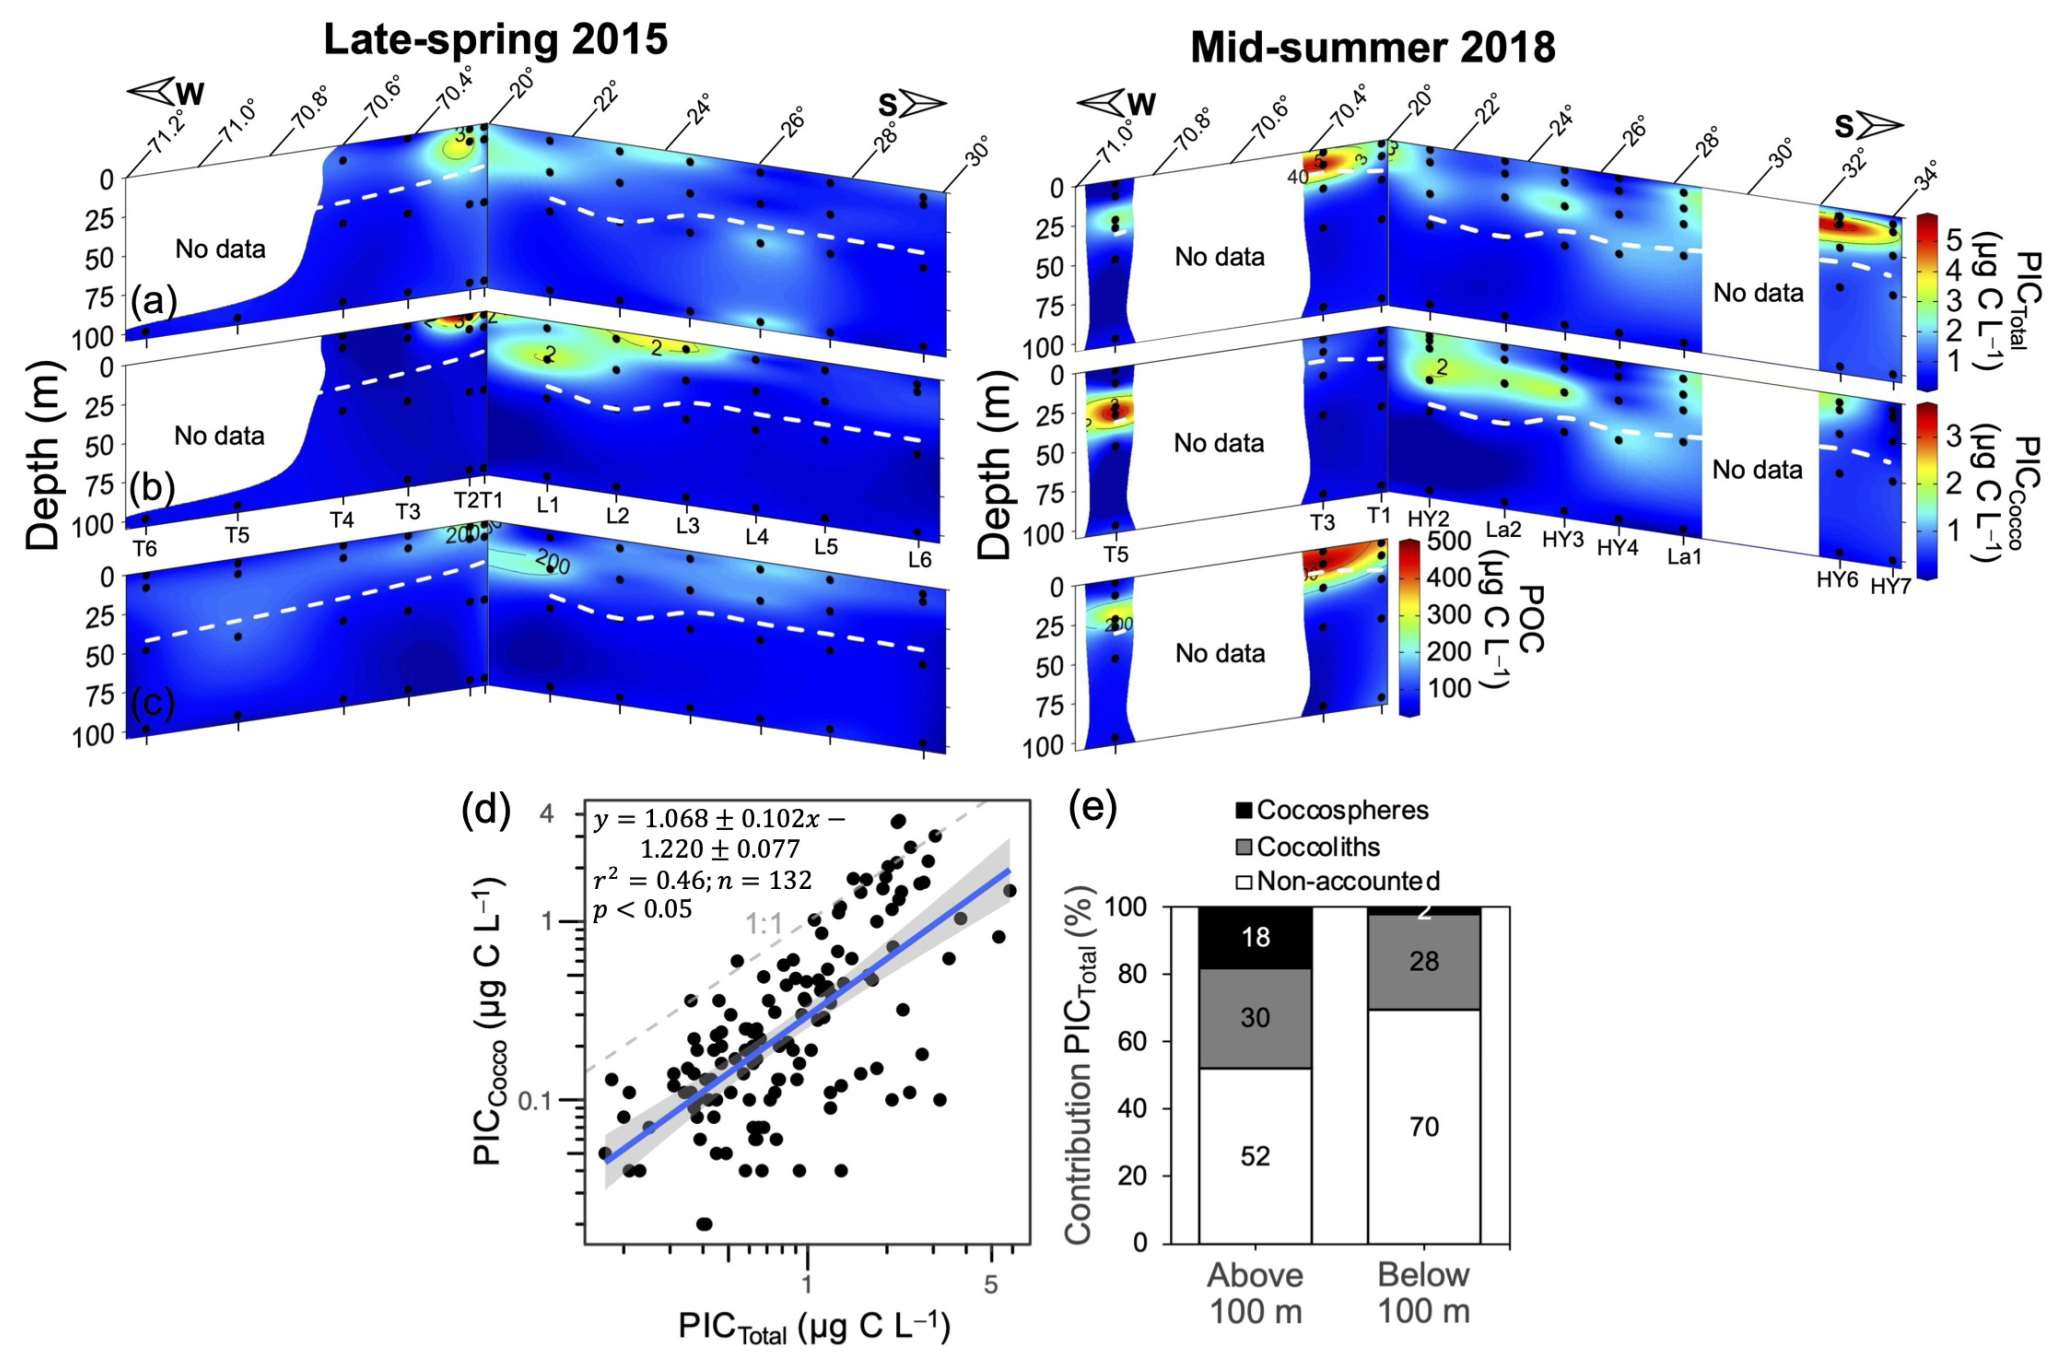
Figure 5Spatial variation in PICTotal (a), PICCocco (b), and POC (c) within the upper 100 m during 2015 and 2018, along with the relationship between PICTotal and PICCocco (d), and the bulk proportion of PICTotal accounted for by PICCocco (e) above and below 100 m depth. In panels (a)–(c) dashed white lines indicate the estimated euphotic depth and sample locations are indicated by solid black circles. In panel (d) the solid blue line represents the linear trend, with gray shading indicating 95 % confidence intervals. The dashed gray line represents the 1:1 relationship. Log-log axes highlight the performance of PICCocco estimates over ∼2 orders of magnitude of PICTotal concentrations. Deeper profiles of PICTotal and PICCocco are shown in Figs. S11–S12.
The PICTotal and PICCocco stocks were not statistically different (p<0.05) between the 2015 and 2018 cruises (result not shown), although mid-summer 2018 exhibited higher average and maximal values compared to late spring 2015 (Fig. 6a–b). On average, a unimodal thermal response peaking at ∼18 °C was observed for both PICCocco and PICTotal for depths above Zeu (Figs. S16a, S17a). Low-to-moderate Chl a levels (<4 mg m−3) were associated with enhanced PIC (>2 µg C L−1 PICCocco, >3 µg C L−1 PICTotal), with PICCocco returned to low levels at the highest Chl a concentrations (Figs. S16d, S17d). Overall, the average PICTotal and PICCocco pools below the Zeu decreased by 50 % and 83 %, respectively (Figs. 6a–b, S11–S12).
Because Zeu was sometimes below and sometimes within the oxycline, we separately analyzed the role of the O2 and pH, consolidating data from both sampled years. In addition to the restriction of Zeu, PIC was restricted by pH >7.7 and O2 >60 µmol kg−1 (Figs. 6c, S16c, g, S17c, g). One point within Zeu showed a pH below 7.7 and another showed O2 concentrations below 60 µmol kg−1; both had low PIC. PICCocco was higher at pH ∼7.9 (Fig. S16g). As a result, most PICTotal was concentrated above the OMZ core (below the oxycline), at depths generally suitable for coccolithophore growth (Fig. 6d). Across all samples, POC ranged from 22.7 to 250.0 µg C L−1 in 2015 and from 26.1 to 501.6 µg C L−1 in 2018 (Fig. 5c). POC was closely correlated with Chl a (Fig. S14a). PICTotal also correlated with POC (Fig. S14b), although POC concentrations were approximately two orders of magnitude higher. PIC : POC ratios ranged from 0.001 to 0.048 above 100 m depth (mean: 0.011±0.009) and from 0.002 to 0.054 below 100 m (mean: ±0.009) (Fig. S15). Within the OMZ core, both PIC and POC declined significantly, however, PIC : POC ratios were higher below the oxycline (Fig. 6d–f).
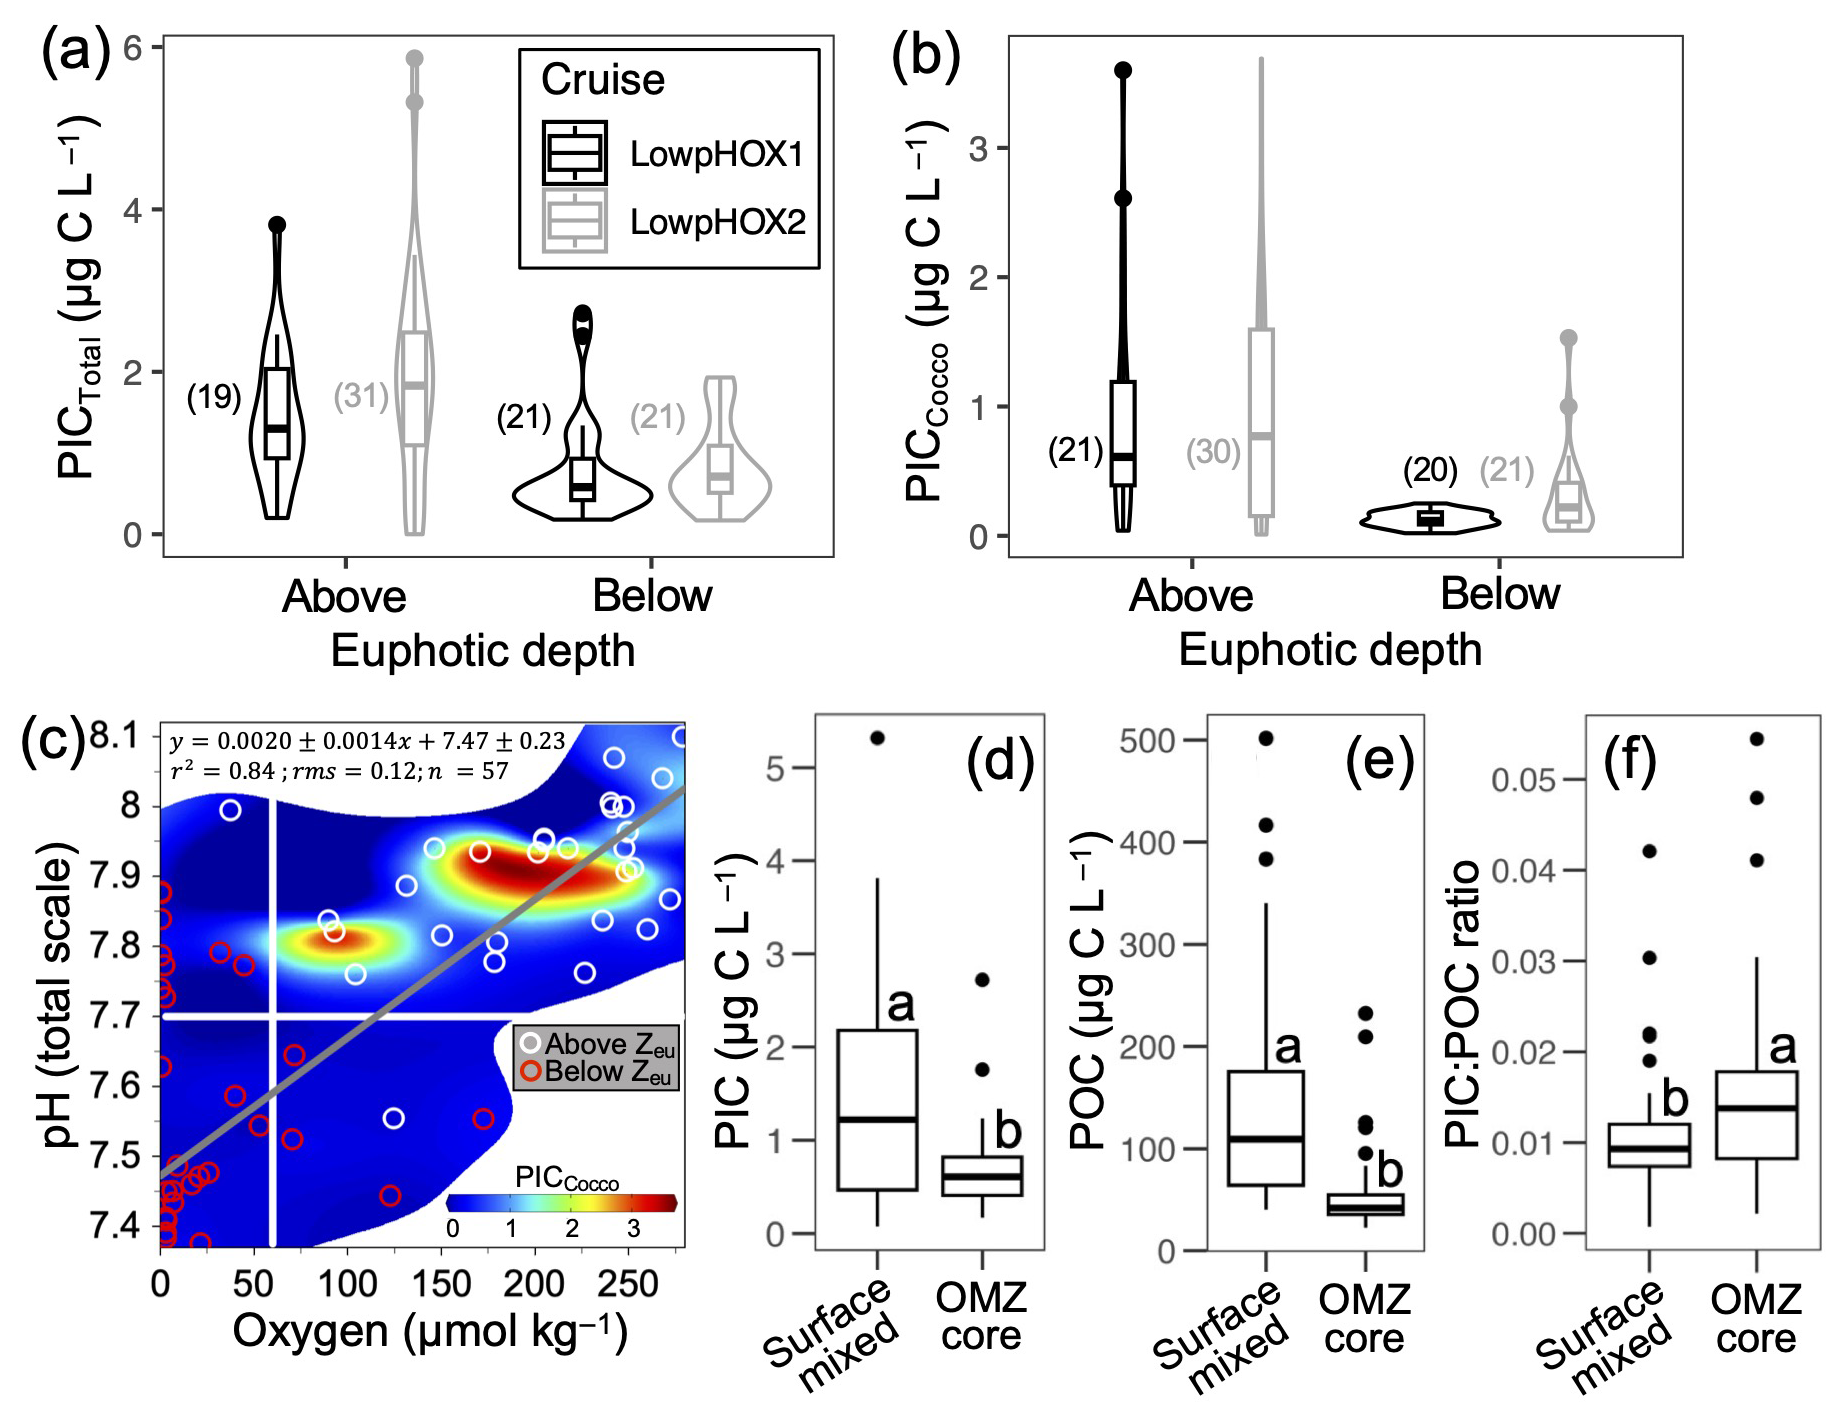
Figure 6Violin plots showing the variation in PICTotal (a) and PICCocco (b), as well as PICCocco in relation to O2 and pH levels (c), above and below the euphotic depth in 2015 and 2018. Panels (d)–(f) display the values of PIC, POC, and PIC : POC ratios above and within the OMZ core during the same years. Only samples from the upper 100 m are included in panels (a)–(c). In panels (a)–(b), the number of samples per category is indicated in parentheses. In panel (c), horizontal and vertical white lines represent the projected pH for the year 2100 and the O2 threshold for the Eastern Equatorial Pacific Ocean proposed by Stramma et al. (2008), respectively; the gray line indicates the least-squares model fit. In panels (d)–(f), all raw data are shown, with group comparisons based on robust two-sample bootstrapped tests (see Sect. 2.6).
3.4 Global comparison of SE Pacific PIC, POC, and PIC : POC to other ocean regions
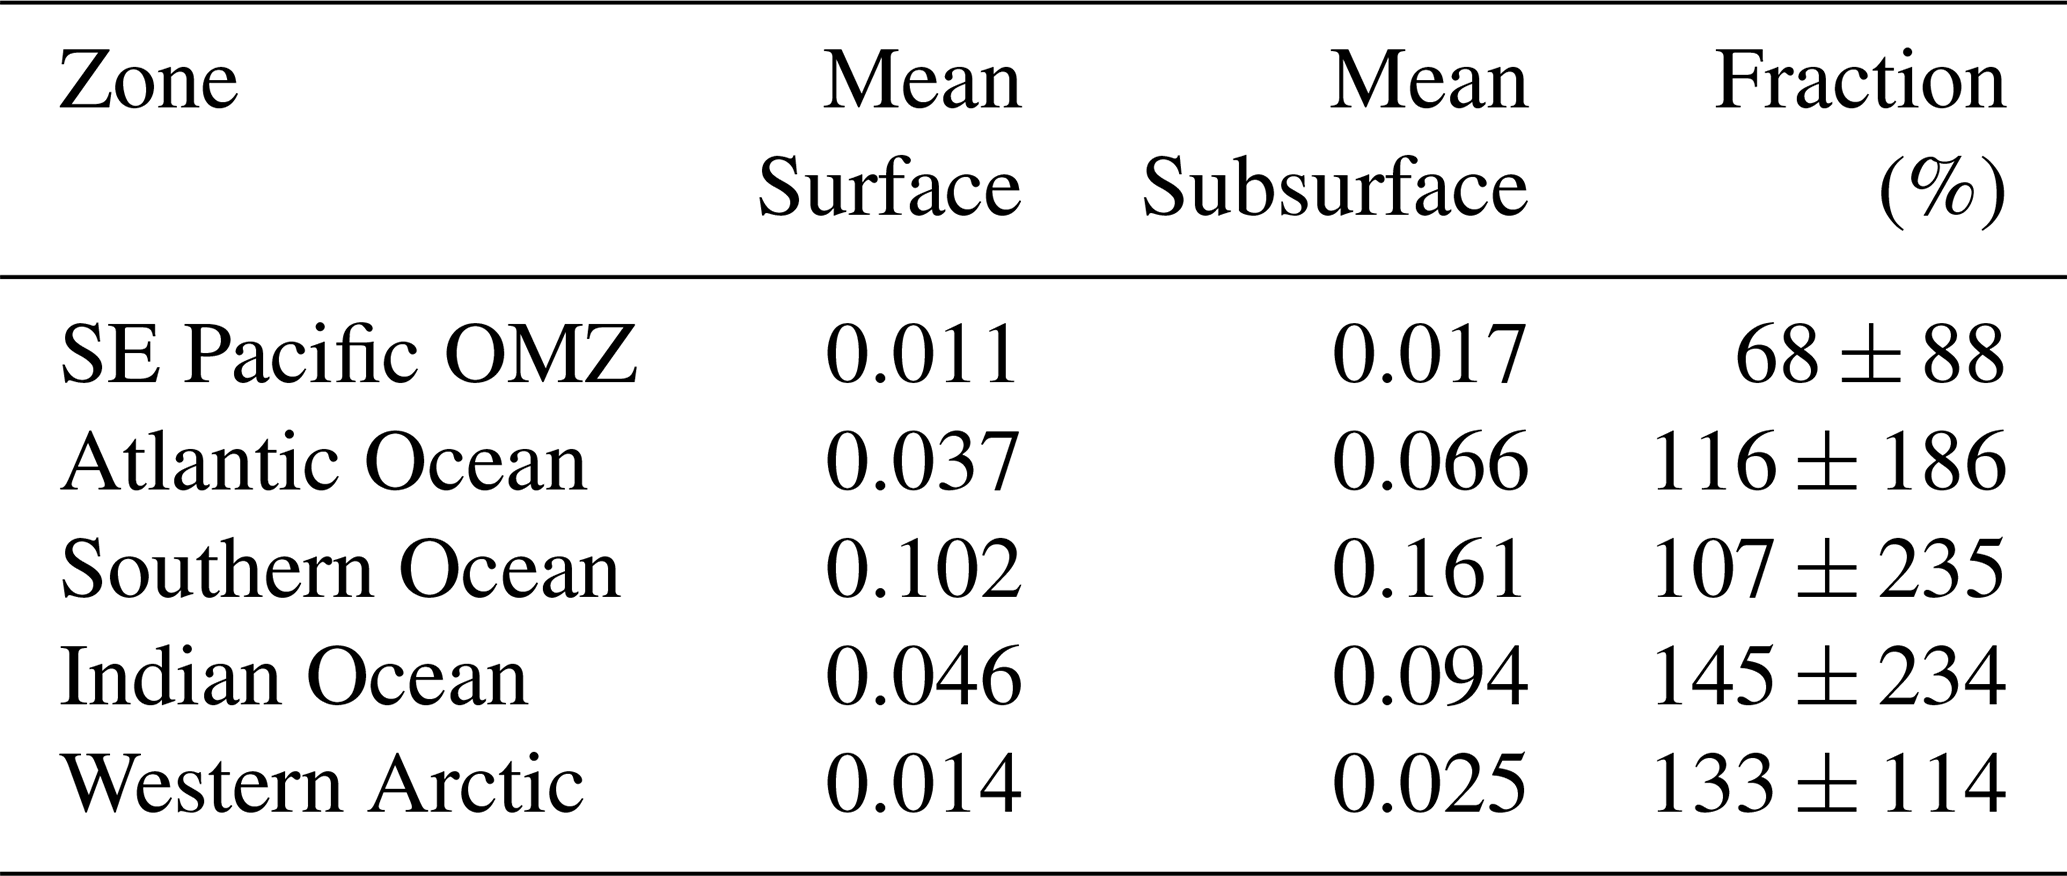
PICCocco originating from below Zeu contributed minimally to PICTotal above 100 m (Fig. 6c). This justified a simplified approach for global comparisons by binning all water columns into a 0–100 m interval, to correspond roughly to the Zeu, and a 100–400 m interval to be comparable to the most oxygen-deficient core of the OMZ. The PIC values from the SE Pacific OMZ reported here overlapped with the lower end of values reported for other regions in both depth intervals; however, all other regions exhibited higher maximum values (Table 1). Within each depth interval, PIC values in the OMZ were significantly lower than in all other regions compared, except for the Western Arctic (Fig. 7a–b, e). In contrast, POC concentrations in the OMZ were comparable to or exceeded those in other regions across both depth intervals (Fig. 7c, f). In the 0–100 m interval, the PIC : POC ratio in the OMZ was significantly lower than in all regions except the Western Arctic (Fig. 7d). For the 100–400 m interval, the PIC : POC ratio was significantly lower than in all other regions, with mean values differing by nearly an order of magnitude compared to those in the Southern Ocean and Indian Ocean (Fig. 7g).
Table 1Comparison of PIC standing stocks reported in surface layers (0–100 m depth) of different oceanic areas or shelf/coastal margins. Unless otherwise indicated, the PIC was measured chemically using mass spectrophotometry. AMT: Atlantic Meridional Transect; SP: spring; AU: autumn; WI: winter; SU: summer.
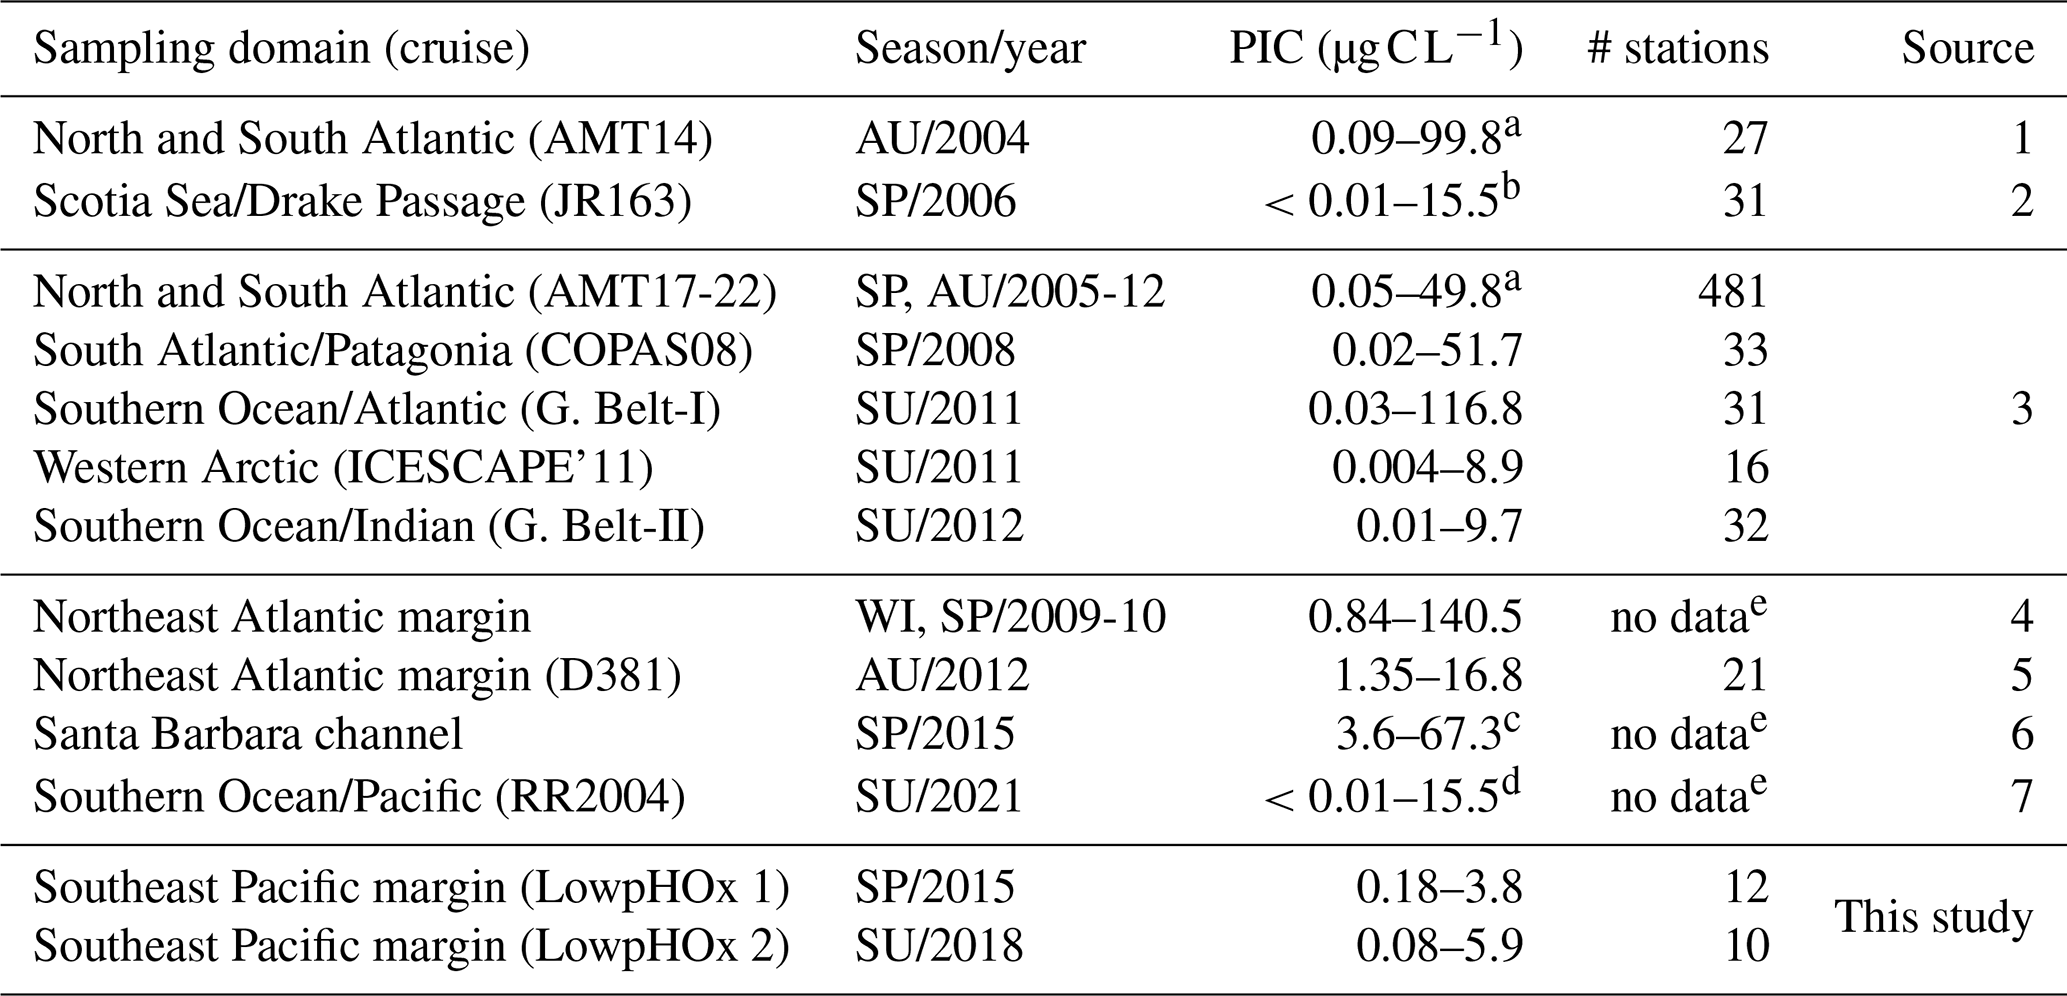
a Outliers values were not included. b Extracted manually from Fig. 4c. c Extracted manually from Fig. 3b. d Estimated from underway “acid-labile backscattering” measurements calibrated with PIC measurements obtained with the same methodology outlined above. e Restricted to the uppermost surface waters. 1: Poulton et al. (2006); 2: Holligan et al. (2010); 3: Balch et al. (2018); 4: Daniels et al. (2012); 5: Painter et al. (2016); 6: Matson et al. (2019); 7: Oliver et al. (2023).
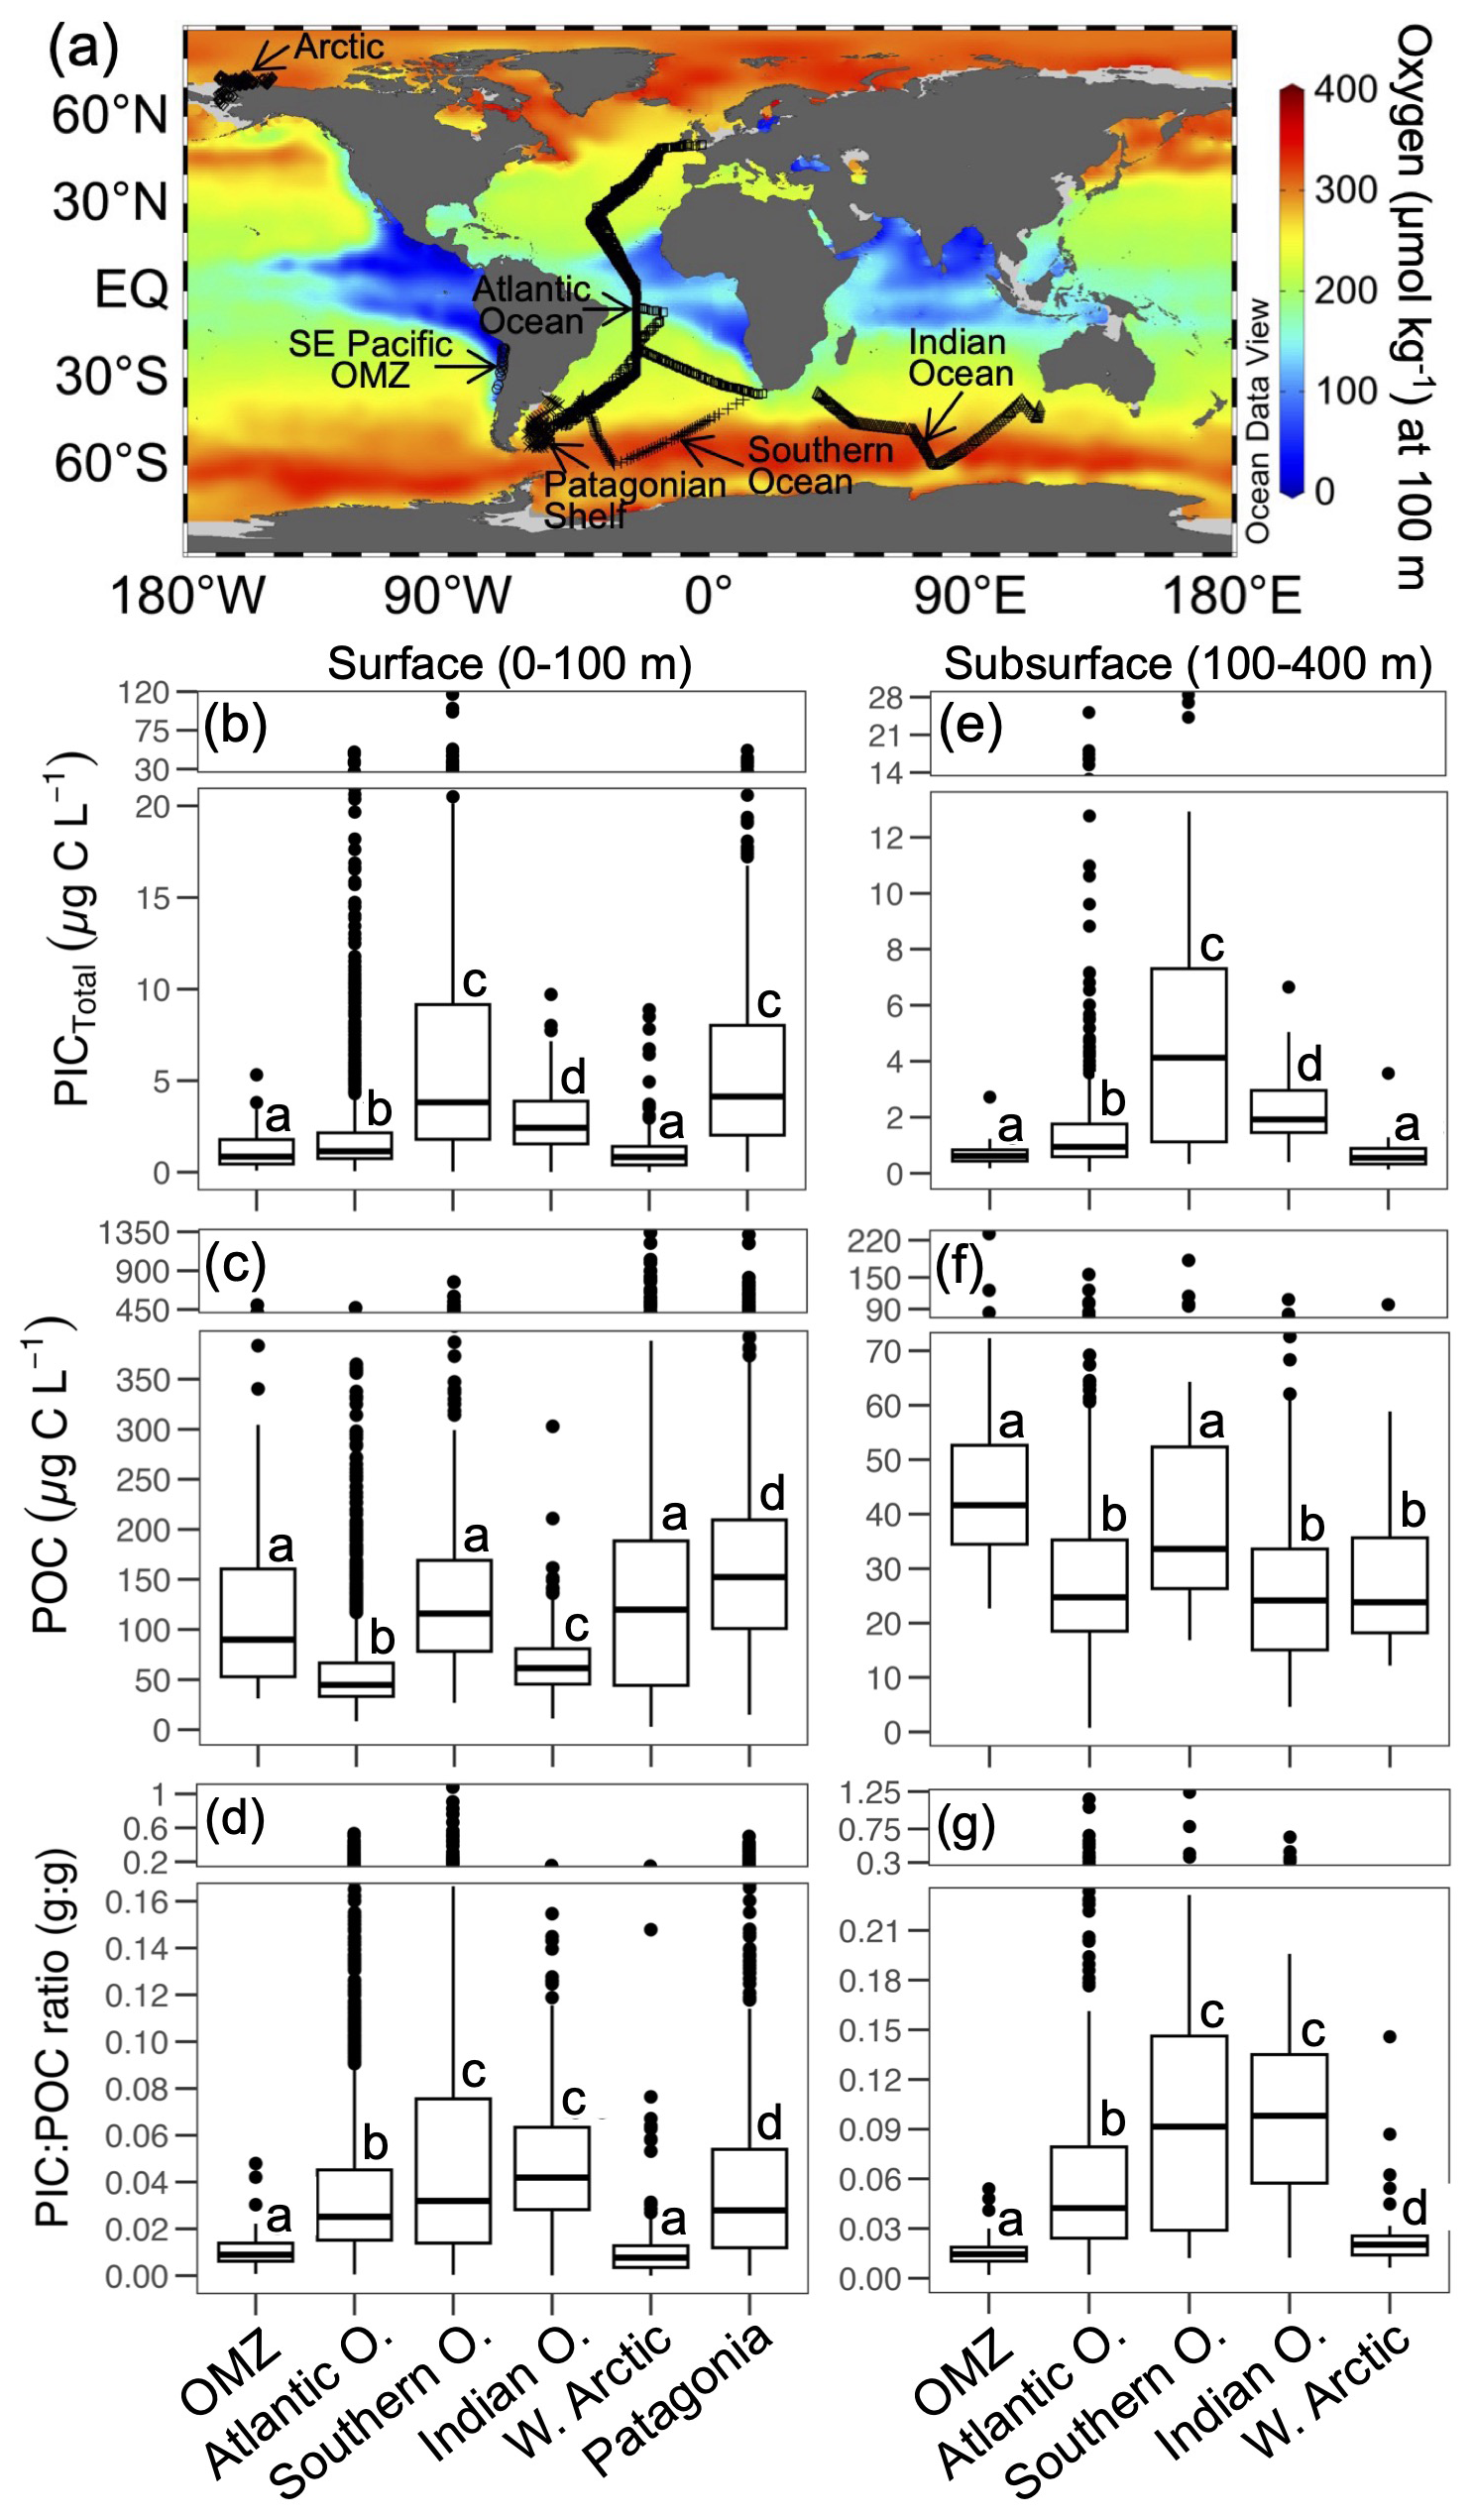
Figure 7(a) Global map showing the annual O2 concentrations at 100 m depth and the sampling locations for the well-mixed surface layer (0–100 m; panels b–d) and the stable subsurface layer (100–400 m; panels e–g). Values of PIC, POC, and PIC : POC ratios during late spring 2015 and mid-summer 2018 in the SE Pacific OMZ (this study), along with comparative data from other open-ocean and coastal margin regions (data from Balch et al., 2018), are presented. The Atlantic Ocean dataset includes samples from six cruises (AMT17-22). All raw data are shown, with group comparisons based on robust ANOVA and post hoc tests (see Sect. 2). The map was generated using Ocean Data View (Schlitzer, 2024), with annual O2 climatology from the World Ocean Atlas 2018 (García et al., 2018).
4.1 Coccolithophore species diversity and dominance off the Southeast Pacific margin
Unlike most other regions, where G. huxleyi is the dominant species (e.g., Winter et al., 2014), G. parvula/ericsonii were co-dominant with G. huxleyi in the coccolithophore communities at 20° S in 2015. The co-dominance of these three species was previously reported in winter samples from 2013 in the same zone (von Dassow et al., 2018; Díaz-Rosas et al., 2021). Likewise, “small Reticulofenestra complex” (presumably mostly G. parvula) and “small Gephyrocapsa complex” have been previously reported to be important in neighboring waters further offshore and to the north (Hagino and Okada, 2004), so these species are frequently important in the tropical Eastern South Pacific. To the south, co-dominance of G. huxleyi and G. muellerae has been reported previously (e.g., Díaz-Rosas et al., 2021). Thus, while coccolithophore richness remains low in the Eastern South Pacific margin, there is higher diversity within the genus Gephyrocapsa compared to other Eastern Boundary Currents (Ziveri et al., 1995; Henderiks et al., 2012; Guerreiro et al., 2013). Standing stocks of larger taxa contributed minimally to the total community above Zeu but became more prominent below this depth. It should be noted that each detached coccolith of C. leptoporus is equivalent, in terms of PIC, to approximately 45 coccoliths of G. huxleyi. This suggests that the heavier coccoliths of these larger species may sink more efficiently (e.g., Menschel et al., 2016; Guerreiro et al., 2021).
4.2 Potential uncertainties in PIC measurements and the contributions of coccolithophores to PIC
Direct chemical measurements of PIC become increasingly difficult to measure as it decreases. In natural waters, where the PIC : POC ratios is usually much less than 1, the method of measuring total carbon before and after acidification becomes insensitive and problematic (Balch and Kilpatrick, 1996). Thus, it is preferable to measure acid-extractable Ca2+ from particulate matter. This direct chemical method of measuring PIC also has error from seawater retained on the filter by organic matter, which can trap Ca2+ even after gentle rinsing. This error still may increase proportionally as PIC : POC becomes lower, but it can be assessed and corrected for by measuring Na+ (Matson et al., 2019).
How much coccolithophores contribute to PIC remains an open question, as contributions from lithogenic sources (Daniels et al., 2012) as well as calcifying zooplankton (e.g., foraminifera, pteropods; Ziveri et al., 2023) complicate the relationship between PIC and coccolithophores. Off the northern Chilean coast, lithogenic PIC sources are limited. Fluvial inputs are negligible (Thiel et al., 2007) and the depth and topography of the Atacama Trench limits sediment resuspension (Xu et al., 2021). Therefore, we consider total PIC measured in this study to be likely mostly biogenic.
Estimates of PICCocco by microscopy include sources of error which may underestimate PICCocco relative to PICTotal. One source of error relates to taxonomic and phenotypic variability in conversion factors, PIC quotas per coccolith, and estimates of the number of coccoliths per coccosphere, which might result in errors of up to 50 % in the estimation of PICCocco using microscopic methods (Young and Ziveri, 2000). However, in this study, improved taxonomic resolution caused only minor changes in PICCocco estimates due to the strong dominance of G. huxleyi and its close relatives in these waters. Difficulties in detection of smaller coccoliths, collapsed coccospheres, and fragmented coccoliths can also cause underestimation of PICCocco (Barrett et al., 2014; Subhas et al., 2022). Despite these limitations, PICCocco accounted for nearly half of direct PICTotal measurements and PICCocco values calculated from coccosphere and coccolith abundances were also linearly correlated with chemical measurements of PICTotal, so we conclude that coccolithophores are major contributors to suspended PIC both above and below the oxycline in these OMZ waters.
4.3 Surface variation in coccolithophore stocks and PIC pools
Higher coccosphere and detached coccoliths were observed near 20° S in both 2015 and 2018, a pattern reflected in both in situ and satellite data. On average, higher values were recorded during mid-summer 2018 compared to late spring 2015, suggesting potential seasonality in PIC levels. This observation aligns qualitatively with satellite-PIC retrievals showing PIC concentrations in February 2018 extending further offshore and southward from the inshore 20° S sampled site. This is consistent with global satellite-PIC estimations showing higher inventories off the coasts of Chile from austral spring (October–November) peaking in summer (January–February), a seasonal pattern similar to that in the Benguela Current System (Hopkins et al., 2019).
The sites of higher PIC and coccosphere abundances observed in this study were associated with ratios of detached coccoliths to coccospheres that were relatively low (<16). This contrasts with the much higher detached-coccolith-to-coccosphere ratios (exceeding 250) reported during the termination phase of massive blooms or below the Zeu (Balch et al., 1991; Holligan et al., 1993b; Lessard et al., 2005), suggesting that the coccospheres in the OMZ euphotic zone were actively growing. Higher coccolith PIC pools in the Zeu were associated with SST ∼18 °C, suggesting a preference for the transition between nutrient-rich (cooler, upwelling) and nutrient-poor (warmer, offshore waters), similar to patterns observed in many other regions (Balch and Kilpatrick, 1996; Balch et al., 2000; Tyrrell and Merico, 2004; Zondervan, 2007; Matson et al., 2019). There is likely to be a roughly inverse relationship between coccolithophores and diatoms (Tyrrell and Merico, 2004; Menschel et al., 2016; Díaz-Rosas et al., 2021), consistent with classical paradigms of a succession from diatoms to coccolithophores and other flagellates as recently mixed waters stratify (Margalef, 1978).
4.4 Comparing euphotic zone coccolithophore stocks and PIC pools from OMZ and non-OMZ regions
Despite maximum coccolithophore abundances recorded in both years in this study being about twice the maximum values previously reported in the entire Chilean sector of the Southeast Pacific (Beaufort et al., 2008; Menschel et al., 2016; Díaz-Rosas et al., 2021) and the previously reported maximum for the entire Humboldt Current System (Hagino and Okada, 2006), coccolithophore stocks were still about an order of magnitude lower than the typical bloom abundances reported in other regions (e.g., Balch et al., 1991; Holligan et al., 1993a; Tyrrell and Merico, 2004; Poulton et al., 2013). Coccolithophore stocks in both the California Current and the European margin of the North Atlantic upwelling region are generally within the same range as the values reported here and previously for the Chilean OMZ (Silva et al., 2008; Ziveri et al., 1995; Guerreiro et al., 2013; Díaz-Rosas et al., 2021; Guerreiro et al., 2023). However, higher values have been reported in the Benguela Upwelling (Henderiks et al., 2012). In the California Current, the most similar Eastern Boundary Upwelling system to the Humboldt Current System, a G. huxleyi bloom was reported to reach abundances like those seen in Atlantic and Bering Sea blooms (Matson et al., 2019). Thus, while coccolithophore stocks in the Humboldt Current do appear to be lower than reported for other productive regions (Díaz-Rosas et al., 2021), we caution that it is still difficult to compare among upwelling regions.
This study presents the first in situ PICTotal measurements from the OMZ waters off the Southeast Pacific margin, corresponding to late spring 2015 and mid-summer of 2018. PICTotal values tended to be in the lower range compared to values documented so far for most of the rest of the ocean (Table 1, Fig. 7b). Comparable PIC data from other Eastern Boundary Upwelling regions is scarce. However, PICTotal values as high as 67.3 µg C L−1 were reported in a California Current G. huxleyi bloom (Matson et al., 2019; data not included in Fig. 7 because POC values not available). This picture becomes clearer when POC is considered as well. The POC values in the OMZ region were in a similar range to those of other highly productive regions (Fig. 7c). Also, the OMZ waters had significantly lower PIC on average compared to the majority of the Atlantic and Indian Oceans, despite tending to have higher average POC.
Although PIC correlated with POC, PIC was always about two orders of magnitude below POC in the Zeu. In culture, PIC : POC ratios of G. huxleyi are around 1 (Paasche, 2001). These low PIC : POC ratios indicates that coccolithophores were only very minor contributors to total phytoplankton biomass in these waters. The Western Arctic Chukchi Sea is the only region where similarly low PIC and PIC : POC to the OMZ have been documented. This likely in part reflects that coccolithophores still have limited penetration into Arctic waters (Winter et al., 2014).
The findings of lower coccolithophore stocks, lower pools of PIC and lower PIC : POC in the SE Pacific OMZ compared to other regions are consistent with the possibility that the intrusions of low-pH–high-CO2 waters into the Zeu, as previously documented for this region (Torres et al., 2011; Vargas et al., 2021), might be limiting coccolithophore PIC in the region. Notably, among samples from within Zeu it appeared that both low pH and low O2 might limit coccolithophore PIC.
4.5 Subsurface PIC and PIC : POC ratios in the OMZ
As documented in other regions (Fernández et al., 1993; van der Wal et al., 1995; Ziveri et al., 2023), coccolithophore-derived PIC consisted predominantly of detached coccoliths, particularly in subsurface waters. The contributions to PIC of larger and rarer species with the heaviest coccoliths also increased below the Zeu, as seen previously in other regions (e.g., Ziveri et al., 2007; Menschel et al., 2016; Guerreiro et al., 2021). The greater decrease in PICCocco than PICTotal below the Zeu might be due to aggregation and fragmentation of coccoliths, suggesting the contribution of coccolithophores to subsurface PIC might be underestimated (Briggs et al., 2020).
Similar to the surface layer, PIC values in the subphotic zone (100–400 m) of the OMZ were lower than in the other regions compared (with the exception of the Western Arctic). The comparison of the subphotic PIC : POC ratios between the OMZ and other ocean regions was even more striking, as it was significantly lower than in all regions, including the Western Arctic. This pattern is consistent with a decreased availability of PIC as a ballast mineral in the OMZ.
An increase in the PIC : POC ratio below the Zeu is often interpreted as evidence that PIC-rich aggregates sink faster, a phenomenon known as the ballast effect (Lee et al., 2009; Iversen and Ploug, 2010). This pattern was also observed in the SE Pacific OMZ (Fig. 6f). However, the increase in PIC : POC ratios from the upper to subsurface layer was smaller than in other regions with comparable data (Table 2), further suggesting a diminished role of PIC as ballast in OMZs.
Despite low pH, Ωcalcite remained above 1 throughout the OMZ euphotic and mesopelagic depths. Although we cannot discount the possibility that microenvironments with Ωcalcite below 1 exist where dissolution occurs, this does not align with the model in which low pH, associated with low O2, leads to PIC dissolution, decreased ballasting by PIC, and consequently further O2 depletion – at least within the depth interval between the upper and lower oxyclines. The lower oxycline lies at approximately 400 m and is very gradual, extending to well over 1000 m (Cornejo and Farías, 2012; Vargas et al., 2021). Data on Ωcalcite below 1000 m are limited (not shown), so we also cannot rule out that enhanced PIC dissolution may contribute to a positive feedback on O2 depletion at greater depths.
Table 2Comparison of the fractional increase in PIC : POC ratios between the surface (0–100 m) and subsurface (0–400 m) layers in the SE Pacific OMZ (this study) and other open-ocean and coastal regions (data from Balch et al., 2018). Only data points with both surface and subsurface PIC : POC ratios were included in the analysis.
4.6 Conclusions
Coccolithophores were major contributors to PIC in the OMZ region studied, but in these waters, PIC and PIC : POC ratios were lower in both the upper and subsurface waters of the OMZ, compared to other ocean regions. The observations are consistent with low pH potentially limiting coccolithophore growth and PIC accumulation in the euphotic zone, thereby decreasing the availability of PIC as a ballast mineral in OMZ waters. At 20° S, where PIC concentrations were highest, the oxycline is consistently the shallowest and sharpest, and subsurface waters are the most oxygen-deficient, reaching effective anoxia as indicated by elevated subsurface nitrite concentrations (Cornejo and Farías, 2012; Vargas et al., 2021). However, the waters above the oxycline and within the euphotic zone at this latitude did not exhibit the lower pH values observed farther south, where both coccolithophore abundance and PIC levels were also lower. Notably, the OMZ core – the most oxygen-deficient layer – never reached thermodynamically favorable conditions for calcite dissolution. These observations suggest that a local feedback loop between PIC dissolution and O2 depletion below the euphotic zone is not significant within the OMZ core, though PIC dissolution might still play a role in deeper waters. Despite the decreased role of PIC suggested by our findings, we note that there is still no evidence that this results in slower POC sinking or shallower remineralization. In fact, some studies have reported efficient POC transfer from the euphotic zone to depth in OMZ systems (Cavan et al., 2017; Engel et al., 2017; Weber and Bianchi, 2020). Future studies that directly measure vertical fluxes of PIC, POC, and biogenic silica using sediment traps will be valuable for understanding how OMZs differ functionally from non-OMZ regions in terms of carbon export.
All data generated in this study are available upon request from the corresponding author. The scanning electron micrograph image datasets are accessible at https://doi.org/10.5281/zenodo.14048319 (Díaz-Rosas et al., 2024a). The cross-polarized light microscopy images shown in the Supplement can be found at https://doi.org/10.5281/zenodo.14708540 (Díaz-Rosas et al., 2024d). The coccosphere and detached coccolith count data, along with the associated PIC and POC measurements from 2015 and 2018, are available at https://doi.org/10.1594/PANGAEA.975783 (Díaz-Rosas et al., 2024b) and https://doi.org/10.1594/PANGAEA.975784 (Díaz-Rosas et al., 2024c), respectively.
The supplement related to this article is available online at https://doi.org/10.5194/bg-22-4405-2025-supplement.
FDR (conceptualization, data curation, formal analysis, investigation, methodology, visualization, writing – original draft preparation, writing – review and editing) provided key proof-of-concept ideas, led the study, conducted polarized light and SEM microscopic analyses and taxonomic characterization of coccospheres and detached coccoliths, examined the relationships between PIC measurements, coccolithophore pools, and environmental/biological variables, compared PIC, POC and PIC : POC values with existing repositories, and drafted the initial manuscript. PvD (conceptualization, funding acquisition, validation, visualization, writing – original draft preparation, writing – review and editing) defined the research goals, led the study, planned and conducted sampling during the 2015 and 2018 cruise, and provided continuous insights into results interpretation and manuscript structure. CAV (funding acquisition, validation, writing – review and editing) guided the interpretation of results and contributed to characterizing the physical and chemical environments. All co-authors provided critical feedback and contributed to the final editing of the manuscript.
The contact author has declared that none of the authors has any competing interests.
Publisher's note: Copernicus Publications remains neutral with regard to jurisdictional claims made in the text, published maps, institutional affiliations, or any other geographical representation in this paper. While Copernicus Publications makes every effort to include appropriate place names, the final responsibility lies with the authors.
We thank William Balch, Catherine Mitchell, and David Drapeau for providing valuable discussion on the manuscript. We also appreciate the constructive comments from the three referees, which helped improve the manuscript.
This study was supported by the National Agency for Research and Development (ANID) of Chile through grants AIM23-0003 and ICN12_019N for the Millennium Institute of Oceanography (IMO), as well as FONDECYT grant 1181614 to Peter von Dassow, and FONDECYT grant 1250048 to Cristian Antonio Vargas. Scanning electron microscopy analysis was performed at the Centro de Investigación en Nanotecnología y Materiales Avanzados (CIEN) of the Pontificia Universidad Católica de Chile using an SEM instrument purchased with FONDEQUIP (grant no. EQM150101).
This paper was edited by Huixiang Xie and reviewed by Alex Poulton, Silvan Goldenberg, and one anonymous referee.
Balch, W. M.: Underway Data (SAS) from R/V Roger Revelle KNOX22RR in the Patagonian Shelf (SW South Atlantic) from 2008–2009 (COPAS08 project), Biological and Chemical Oceanography Data Management Office (BCO-DMO), 2010.
Balch, W. M.: The Ecology, Biogeochemistry, and Optical Properties of Coccolithophores, Annu. Rev. Marine Sci., 10, 71–98, https://doi.org/10.1146/annurev-marine-121916-063319, 2018.
Balch, W. M. and Kilpatrick, K.: Calcification rates in the equatorial Pacific along 140° W, Deep-Sea Res. Pt. II, 43, 971–993, https://doi.org/10.1016/0967-0645(96)00032-x, 1996.
Balch, W. M. and Mitchell, C.: Remote sensing algorithms for particulate inorganic carbon (PIC) and the global cycle of PIC, Earth-Sci. Rev., 239, 104363, https://doi.org/10.1016/j.earscirev.2023.104363, 2023.
Balch, W. M., Holligan, P., Ackleson, S., and Voss, K.: Biological and optical properties of mesoscale coccolithophore blooms in the Gulf of Maine, Limnol. Oceanogr., 36, 629–643, https://doi.org/10.4319/lo.1991.36.4.0629, 1991.
Balch, W. M., Drapeau, D. T., and Fritz, J.: Monsoonal forcing of calcification in the Arabian Sea, Deep-Sea Res. Pt. II, 47, 1301–1337, https://doi.org/10.1016/S0967-0645(99)00145-9, 2000.
Balch, W. M., Bates, N. R., Lam, P., Twining, B. S., Rosengard, S. Z., Bowler, B. C., Drapeau, D. T., Garley, R., Lubelczyk, L. C., Mitchell, C., and Rauschenberg, S.: Factors regulating the Great Calcite Belt in the Southern Ocean and its biogeochemical significance, Global Biogeochem. Cycles, 30, 1124–1144, https://doi.org/10.1002/2016GB005414, 2016.
Balch, W. M., Bowler, B. C., Drapeau, D. T., Lubelczyk, L. C., and Lyczsckowski, E.: Vertical Distributions of Coccolithophores, PIC, POC, Biogenic Silica, and Chlorophyll a Throughout the Global Ocean, Global Biogeochem. Cycles, 32, 2–17, https://doi.org/10.1002/2016GB005614, 2018.
Barcelos e Ramos, J., Müller, M. N., and Riebesell, U.: Short-term response of the coccolithophore Emiliania huxleyi to an abrupt change in seawater carbon dioxide concentrations, Biogeosciences, 7, 177–186, https://doi.org/10.5194/bg-7-177-2010, 2010.
Barrett, P., Resing, J., Buck, N., Feely, R. A., Bullister, J., Buck, C., and Landing, W.: Calcium carbonate dissolution in the upper 1000 m of the eastern North Atlantic, Global Biogeochem. Cycles, 28, 386–397, https://doi.org/10.1002/2013GB004619, 2014.
Beaufort, L., Couapel, M., Buchet, N., Claustre, H., and Goyet, C.: Calcite production by coccolithophores in the south east Pacific Ocean, Biogeosciences, 5, 1101–1117, https://doi.org/10.5194/bg-5-1101-2008, 2008.
Beaufort, L., Probert, I., de Garidel-Thoron, T., Bendif, E. M., Ruiz-Pino, D., Metzl, N., Goyet, C., Buchet, N., Coupel, P., Grelaud, M., Rost, B., Rickaby, R. E. M., and de Vargas, C.: Sensitivity of coccolithophores to carbonate chemistry and ocean acidification, Nature, 476, 80–83, https://doi.org/10.1038/nature10295, 2011.
Bendif, E., Probert, I., Díaz-Rosas, F., Thomas, D., van den Engh, G., Young, J., and von Dassow, P.: Recent reticulate evolution in the ecologically dominant lineage of coccolithophores, Front. Microbiol., 7, 784, https://doi.org/10.3389/fmicb.2016.00784, 2016.
Bendif, E. M., Nevado, B., Wong, E., Hagino, K., Probert, I., Young, J. R., Rickaby, R. E. M., and Filatov, D.: Repeated species radiations in the recent evolution of the key marine phytoplankton lineage Gephyrocapsa, Nat. Commun., 10, 4234, https://doi.org/10.1038/s41467-019-12169-7, 2019.
Briggs, N., Dall'Olmo, G., and Claustre, Hervé: Major role of particle fragmentation in regulating biological sequestration of CO2 by the oceans, Science, 367, 791–793, https://doi.org/10.1126/science.aay1790, 2020.
Brown, C. W. and Yoder, J. A.: Coccolithophorid blooms in the global ocean, J. Geophys. Res., 99, 7467–7482, https://doi.org/10.1029/93JC02156, 1994.
Cai, W.-J.: Estuarine and Coastal Ocean Carbon Paradox: CO2 Sinks or Sites of Terrestrial Carbon Incineration?, Annu. Rev. Marine Sci., 3, 123–145, https://doi.org/10.1146/annurev-marine-120709-142723, 2011.
Cavan, E. L., Trimmer, M., Shelley, F., and Sanders, R.: Remineralization of particulate organic carbon in an ocean oxygen minimum zone, Nat. Commun., 8, 14847, https://doi.org/10.1038/ncomms14847, 2017.
Claxton, L., McClelland, H., Hermoso, M., and Rickaby, R. E. M.: Eocene emergence of highly calcifying coccolithophores despite declining atmospheric CO2, Nat. Geosci., 15, 826–831, https://doi.org/10.1038/s41561-022-01006-0, 2022.
Copernicus-GlobColour: Global Ocean Colour (Copernicus-GlobColour), Bio-Geo-Chemical, L4 (monthly and interpolated) from Satellite Observations (Near Real Time), Copernicus [data set], https://doi.org/10.48670/moi-00279, 2023.
Cornejo, M. and Farías, L.: Following the N2O consumption in the oxygen minimum zone of the eastern South Pacific, Biogeosciences, 9, 3205–3212, https://doi.org/10.5194/bg-9-3205-2012, 2012.
Daniels, C. J., Tyrrell, T., Poulton, A. J., and Pettit, L.: The influence of lithogenic material on particulate inorganic carbon measurements of coccolithophores in the Bay of Biscay, Limnol. Oceanogr., 57, 145–153, https://doi.org/10.4319/lo.2012.57.1.0145, 2012.
Díaz-Rosas, F., Alves-de-Souza, C., Alarcón, E., Menschel, E., González, H. E., Torres, R., and von Dassow, P.: Abundances and morphotypes of the coccolithophore Emiliania huxleyi in southern Patagonia compared to neighbouring oceans and Northern Hemisphere fjords, Biogeosciences, 18, 5465–5489, https://doi.org/10.5194/bg-18-5465-2021, 2021.
Díaz-Rosas, F., Vargas, C. A., and von Dassow, P.: Scanning Electron Microscopy Datasets – Coccospheres and detached coccoliths in waters off the Southeast Pacific margin, Zenodo [data set], https://doi.org/10.5281/zenodo.14048319, 2024a.
Díaz-Rosas, F., Vargas, C. A., and von Dassow, P.: Particulate Inorganic Carbon (PIC) and associated coccospheres and detached coccoliths in waters off the Southeast Pacific margin in 2015, PANGAEA [data set], https://doi.org/10.1594/PANGAEA.975783, 2024b.
Díaz-Rosas, F., Vargas, C. A., and von Dassow, P.: Particulate Inorganic Carbon (PIC) and associated coccospheres and detached coccoliths in waters off the Southeast Pacific margin in 2018, PANGAEA [data set], https://doi.org/10.1594/PANGAEA.975784, 2024c.
Díaz-Rosas, F., von Dassow, P., and Vargas, C.: Cross-polarized light microscopy images – Coccospheres and detached coccoliths in waters off the Southeast Pacific margin, Zenodo [data set], https://doi.org/10.5281/zenodo.14708539, 2024d.
Engel, A., Wagner, H., Le Moigne, F. A. C., and Wilson, S. T.: Particle export fluxes to the oxygen minimum zone of the eastern tropical North Atlantic, Biogeosciences, 14, 1825–1838, https://doi.org/10.5194/bg-14-1825-2017, 2017.
Fernández, E., Boyd, P. W., Holligan, P., and Harbour, D. S.: Production of organic and inorganic carbon within a large-scale coccolithophore bloom in the northeast Atlantic Ocean, Marine Ecol. Prog. Ser., 97, 271–285, https://doi.org/10.3354/meps097271, 1993.
Frada, M., Young, J., Cachão, M., Lino, S., Martins, A., Narciso, Á., Probert, I., and De Vargas, C.: A guide to extant coccolithophores (Calcihaptophycidae, Haptophyta) using light microscopy, Journal of Nannoplankton Research, 31, 58–112, https://doi.org/10.58998/jnr2094, 2010.
García, H. E., Weathers, K. W., Paver, C. R., Smolyar, I., Boyer, T. P., Locarnini, R. A., Zweng, M. M., Mishonov, A. V., Baranova, O. K., Seidov, D., and Reagan, J. R: World Ocean Data 2018, Volume 3: Dissolved Oxygen, Apparent Oxygen Utilization, and Oxygen Saturation, Mishonov, A. Technical Editor. NOAA Atlas NESDIS 83, https://doi.org/10.25923/qspr-pn52, 2018.
GEBCO: The GEBCO_2023 Grid – a continuous terrain model of the global oceans and land, National Oceanography Centre [data set], https://doi.org/10.5285/f98b053b-0cbc-6c23-e053-6c86abc0af7b, 2023.
Gilly, W., Beman, M., Litvin, S., and Robison, B.: Oceanographic and biological effects of shoaling of the oxygen minimum zone, Annu. Rev. Marine Sci., 5, 393–420, https://doi.org/10.1146/annurev-marine-120710-100849, 2013.
Guerreiro, C., Oliveira, A., de Stigter, H., Cachão, M., Sá, C., Borges, C., Cros, L., Fortuño, J.-M., and Rodrigues, A.: Late winter coccolithophore bloom off central Portugal in response to river discharge and upwelling, Cont. Shelf Res., 59, 65–83, https://doi.org/10.1016/j.csr.2013.04.016, 2013.
Guerreiro, C., Ferreira, A., Cros, L., Stuut, J.-B., Baker, A., Tracana, A., Pinto, C., Veloso, V., Rees, A., Cachão, M., Nunes, T., and Brotas, V.: Response of coccolithophore communities to oceanographic and atmospheric processes across the North- and Equatorial Atlantic, Front. Marine Sci., 10, 1119488, https://doi.org/10.3389/fmars.2023.1119488, 2023.
Guerreiro, C. V., Baumann, K.-H., Brummer, G. A., Valente, A., Fischer, G., Ziveri, P., Brotas, V., and Stuut, J. W.: Carbonate fluxes by coccolithophore species between NW Africa and the Caribbean: Implications for the biological carbon pump, Limnol. Oceanogr., 66, 3190–3208, https://doi.org/10.1002/lno.11872, 2021.
Hagino, K. and Okada, H.: Floral Response of Coccolithophores to Progressive Oligotrophication in the South Equatorial Current, Pacific Ocean, in: Global Environmental Change in the Ocean and on Land, TERRAPUB, Japan, 121–132, 2004.
Hagino, K. and Okada, H.: Intra- and infra-specific morphological variation in selected coccolithophore species in the equatorial and subequatorial Pacific Ocean, Marine Micropaleontol., 58, 184–206, https://doi.org/10.1016/j.marmicro.2005.11.001, 2006.
Henderiks, J., Winter, A., Elbrächter, M., Feistel, R., van der Plas, A., Nausch, G., and Barlow, R.: Environmental controls on Emiliania huxleyi morphotypes in the Benguela coastal upwelling system (SE Atlantic), Marine Ecol. Prog. Ser., 448, 51–66, https://doi.org/10.3354/meps09535, 2012.
Hofmann, M. and Schellnhuber, H.-J.: Oceanic acidification affects marine carbon pump and triggers extended marine oxygen holes, P. Natl. Acad. Sci. USA, 106, 3017–3022, https://doi.org/10.1073/pnas.0813384106, 2009.
Holligan, P., Charalampopoulou, A., and Hutson, R.: Seasonal distributions of the coccolithophore, Emiliania huxleyi, and of particulate inorganic carbon in surface waters of the Scotia Sea, J. Marine Syst., 82, 195–205, https://doi.org/10.1016/j.jmarsys.2010.05.007, 2010.
Holligan, P., Fernández, E., Aiken, J., Balch, W., Boyd, P. W., Burkill, P., Finch, M., Groom, S., Malin, G., Muller, K., Purdie, D., Robinson, C., Trees, Ch., Turner, S., and van der Wal, P.: A biocheochemical study of the coccolithophore, Emiliania huxleyi, in the North Atlantic, Global Biogeochem. Cycles, 7, 879–900, https://doi.org/10.1029/93GB01731, 1993a.
Holligan, P., Groom, S., and Harbour, D. S.: What controls the distribution of the coccolithophore, Emiliania huxleyi, in the North Sea?, Fisheries Oceanography, 2, 175–183, https://doi.org/10.1111/j.1365-2419.1993.tb00133.x, 1993b.
Hopkins, J., Henson, S. A., Poulton, A. J., and Balch, W. M.: Regional Characteristics of the Temporal Variability in the Global Particulate Inorganic Carbon Inventory, Global Biogeochem. Cycles, 33, 1328–1338, https://doi.org/10.1029/2019GB006300, 2019.
Hsieh, T., Ma, K., and Chao, A.: iNEXT: Interpolation and Extrapolation for Species Diversity (Version 3.0.2) [R package]. CRAN., https://doi.org/10.32614/CRAN.package.iNEXT, 2024.
Iversen, M. H. and Ploug, H.: Ballast minerals and the sinking carbon flux in the ocean: carbon-specific respiration rates and sinking velocity of marine snow aggregates, Biogeosciences, 7, 2613–2624, https://doi.org/10.5194/bg-7-2613-2010, 2010.
Kitchenham, B., Madeyski, L., Budgen, D., Keung, J., Brereton, P., Charters, S., Gibbs, S., and Pohthong, A.: Robust statistical methods for empirical software engineering, Empir. Softw. Eng., 22, 579–630, https://doi.org/10.1007/s10664-016-9437-5, 2017.
Klaas, C. and Archer, D.: Association of sinking organic matter with various types of mineral ballast in the deep sea: Implications for the rain ratio, Global Biogeochem. Cycles, 16, 1116, https://doi.org/10.1029/2001GB001765, 2002.
Kottmeier, D. M., Chrachri, A., Langer, G., Helliwell, K. E., Wheeler, G. L., and Brownlee, C.: Reduced H+ channel activity disrupts pH homeostasis and calcification in coccolithophores at low ocean pH, P. Natl. Acad. Sci. USA, 119, e2118009119, https://doi.org/10.1073/pnas.2118009119, 2022.
Lee, C., Peterson, M., Wakeham, S., Armstrong, R., Cochran, K., Miquel, J. C., Fowler, S., Hirschberg, D., Beck, A., and Xue, J.: Particulate organic matter and ballast fluxes measured using time-series and settling velocity sediment traps in the northwestern Mediterranean Sea, Deep-Sea Res. Pt. II, 56, 1420–1436, https://doi.org/10.1016/j.dsr2.2008.11.029, 2009.
Lessard, E., Merico, A., and Tyrrell, T.: Nitrate:phosphate ratios and Emiliania huxleyi blooms, Limnol. Oceanogr., 50, 1020–1024, https://doi.org/10.4319/lo.2005.50.3.1020, 2005.
Mair, P. and Wilcox, R.: Robust statistical methods in R using the WRS2 package, Behav. Res. Methods, 52, 464–488, https://doi.org/10.3758/s13428-019-01246-w, 2020.
Margalef, R.: Life-forms of phytoplankton as survival alternatives in an unstable environment, Oceanol. Acta, 1, 493–509, https://doi.org/10.4236/jmp.2019.1013103, 1978.
Matson, P., Washburn, L., Fields, E., Gotschalk, C., Ladd, T., Siegel, D., Welch, Z., and Iglesias-Rodriguez, M. D.: Formation, development, and propagation of a rare coastal coccolithophore bloom, J. Geophys. Res.-Oceans, 124, 3298–3316, https://doi.org/10.1029/2019JC015072, 2019.
Menschel, E., González, H. E., and Giesecke, R.: Coastal-oceanic distribution gradient of coccolithophores and their role in the carbonate flux of the upwelling system off Concepción, Chile (36° S), J. Plankton Res., 38, 798–817, https://doi.org/10.1093/plankt/fbw037, 2016.
Monteiro, F. M., Bach, L. T., Brownlee, C., Bown, P., Rickaby, R. E. M., Poulton, A. J., Tyrrell, T., Beaufort, L., Dutkiewicz, S., Gibbs, S., Gutowska, M. A., Lee, R., Riebesell, U., Young, J. R., and Ridgwell, A.: Why marine phytoplankton calcify, Sci. Adv., 2, e1501822, https://doi.org/10.1126/sciadv.1501822, 2016.
Morel, A.: Optical modeling of the upper ocean in relation to its biogenous matter content (case I waters), J. Geophys. Res., 93, 749–768, https://doi.org/10.1029/JC093iC09p10749, 1988.
Morel, A., Huot, Y., Gentili, B., Werdell, J., Hooker, S., and Franz, B.: Examining the consistency of products derived from various ocean color sensors in open ocean (Case 1) waters in the perspective of a multi-sensor approach, Remote Sens. Environ., 111, 69–88, https://doi.org/10.1016/j.rse.2007.03.012, 2007.
Müller, M., Trull, T. W., and Hallegraeff, G.: Differing responses of three Southern Ocean Emiliania huxleyi ecotypes to changing seawater carbonate chemistry, Marine Ecol. Prog. Ser., 531, 81–90, https://doi.org/10.3354/meps11309, 2015.
NASA Ocean Biology Processing Group: NASA Ocean Biology Processing Group: Particulate Inorganic Carbon (PIC), https://oceancolor.gsfc.nasa.gov/resources/atbd/pic/ (last access: 25 March 2024), 2023.
Oliver, H., McGillicuddy, D., Krumhardt, K., Long, M., Bates, N. R., Bowler, B., Drapeau, D., and Balch, W. M.: Environmental Drivers of Coccolithophore Growth in the Pacific Sector of the Southern Ocean, Global Biogeochem. Cycles, 37, e2023GB007751, https://doi.org/10.1029/2023GB007751, 2023.
Paasche, E.: A review of the coccolithophorid Emiliania huxleyi (Prymnesiophyceae), with particular reference to growth, coccolith formation, and calcification–photosynthesis interactions, Phycologia, 40, 503–529, https://doi.org/10.2216/i0031-8884-40-6-503.1, 2001.
Painter, S. C., Finlay, M., Hemsley, V., and Martin, A.: Seasonality, phytoplankton succession and the biogeochemical impacts of an autumn storm in the northeast Atlantic Ocean, Prog. Oceanogr., 142, 72–104, https://doi.org/10.1016/j.pocean.2016.02.001, 2016.
Posit Software, PBC: Posit Workbench: Integrated development environment for R, Phyton, and other languages, https://posit.co/products/enterprise/workbench/ (last access: 22 January 2025), 2024.
Poulton, A. J., Sanders, R., Holligan, P., Stinchcombe, M., Adey, T., Brown, L., and Chamberlain, K.: Phytoplankton mineralization in the tropical and subtropical Atlantic Ocean, Global Biogeochem. Cycles, 20, GB4002, https://doi.org/10.1029/2006GB002712, 2006.
Poulton, A. J., Painter, S. C., Young, J. R., Bates, N. R., Bowler, B. C., Drapeau, D., Lyczsckowski, E., and Balch, W. M.: The 2008 Emiliania huxleyi bloom along the Patagonian Shelf: Ecology, biogeochemistry, and cellular calcification, Global Biogeochem. Cycles, 27, 1023–1033, https://doi.org/10.1002/2013GB004641, 2013.
R Core Team: R: A language and environment for statistical computing, https://www.R-project.org/ (last access: 22 January 2025), 2024.
Ridgwell, A. and Zeebe, R.: The role of the global carbonate cycle in the regulation and evolution of the Earth system, Earth Planet. Sc. Lett., 234, 299–315, https://doi.org/10.1016/j.epsl.2005.03.006, 2005.
Riebesell, U., Zondervan, I., Rost, B., Tortell, P., Zeebe, R., and Morel, F.: Reduced calcification of marine plankton in response to increased atmospheric CO2, Nature, 407, 364–367, https://doi.org/10.1038/35030078, 2000.
Schlitzer, R.: Ocean Data View, http://odv.awi.de (last access: 27 April 2025), 2024.
Schmidtko, S., Stramma, L., and Visbeck, M.: Decline in global oceanic oxygen content during the past five decades, Nature, 542, 335–339, https://doi.org/10.1038/nature21399, 2017.
Silva, A., Palma, S., and Moita, M. T.: Coccolithophores in the upwelling waters of Portugal: Four years of weekly distribution in Lisbon bay, Cont. Shelf Res., 28, 2601–2613, https://doi.org/10.1016/j.csr.2008.07.009, 2008.
Stramma, L., Johnson, G., Sprintall, J., and Mohrholz, V.: Expanding oxygen-minimum zones in the tropical oceans, Science, 320, 655–658, https://doi.org/10.1126/science.1153847, 2008.
Subhas, A., Dong, S., Naviaux, J., Rollins, N., and Adkins, J.: Shallow Calcium Carbonate Cycling in the North Pacific Ocean, Global Biogeochem. Cycles, 36, e2022GB007388, https://doi.org/10.1029/2022GB007388, 2022.
Taylor, A. R. and Brownlee, C.: Calcification, in: The Physiology of Microalgae. Development in Applied Phycology, vol. 6, Springer, Cham, https://doi.org/10.1007/978-3-319-24945-2_14, 2016.
Thiel, M., Macaya, E., Acuña, E., Arntz, W., Bastias, H., Brokordt, K., Camus, P., Castilla, J. C., Castro, L., Cortés, M., Dumont, C., Escribano, R., Fernandez, M., Gajardo, J., Gaymer, C., Gomez, I., González, A., González, H., Haye, P., Illanes, J.-E., Iriarte, J. L., Lancellotti, D., Luna-Jorquera, G., Luxoro, C., Manriquez, P., Marín, V., Muñoz, P., Navarrete, S., Perez, E., Poulin, E., Sellanes, J., Sepúlveda, H., Stotz, W., Tala, F., Thomas, A., Vargas, C., Vasquez, J., and Vega, A.: The Humboldt current system of northern and central Chile Oceanographic processes, ecological interactions and socioeconomic feedback, Oceanogr. Marine Biol., 45, 195–344, https://doi.org/10.1201/9781420050943.ch6, 2007.
Torres, R., Turner, D., Rutllant, J. A., Sobarzo, M., Antezana, T., and González, H. E.: CO2 outgassing off central Chile (31–30° S) and northern Chile (24–23° S) during austral summer 1997: the effect of wind intensity on the upwelling and ventilation of CO2-rich waters, Deep-Sea Res. Pt. I, 49, 1413–1429, https://doi.org/10.1016/S0967-0637(02)00034-1, 2002.
Torres, R., Pantoja, S., Harada, N., González, H. E., Daneri, G., Frangopulos, M., Rutllant, J. A., Duarte, C. M., Rúiz-Halpern, S., Mayol, E., and Fukasawa, M.: Air-sea CO2 fluxes along the coast of Chile: From CO2 outgassing in central northern upwelling waters to CO2 uptake in southern Patagonian fjords, J. Geophys. Res.-Oceans, 116, C09006, https://doi.org/10.1029/2010JC006344, 2011.
Tyrrell, T. and Merico, A.: Emiliania huxleyi: bloom observations and the conditions that induce them, in: Coccolithophores, Springer Berlin Heidelberg, https://doi.org/10.1007/978-3-662-06278-4_4, 2004.
Vargas, C., Cantarero, S., Sepúlveda, J., Galán, A., De Pol-Holz, R., Walker, B., Schneider, W., Farías, L., Cornejo, M., Walker, J., Xu, X., and Salisbury, J.: A source of isotopically light organic carbon in a low-pH anoxic marine zone, Nat. Commun., 12, 1604, https://doi.org/10.1038/s41467-021-21871-4, 2021.
Vargas, C. A., Lagos, N. A., Lardies, M. A., Duarte, C., Manriquez, P. H., Aguilera, V. M., Broitman, B., Widdicombe, S., and Dupont, S.: Species-specific responses to ocean acidification should account for local adaptation and adaptive plasticity, Nature Ecology & Evolution, 1, 0084, https://doi.org/10.1038/s41559-017-0084, 2017.
Vargas, C. A., Alarcón, G., Navarro, E., and Cornejo-D'Ottone, M.: Discrete, profile measurement of dissolved inorganic carbon (DIC), total alkalinity, partial pressure of CO2, pH on total scale, water temperature, salinity, dissolved oxygen concentration and other variables obtained during the R/V Cabo de Hornos cruise Lowphox-I (ESPOCODE 20HZ20151205) in the South Pacific Ocean from 2015-12-05 to 2015-12-09 (NCEI Accession 0281723), NOAA National Centers for Environmental Information [data set], https://doi.org/10.25921/1tgf-v522, 2023a.
Vargas, C. A., Alarcón, G., Navarro, E., and Cornejo-D'Ottone, M.: Discrete, profile measurement of dissolved inorganic carbon (DIC), total alkalinity, partial pressure of CO2, pH on total scale, water temperature, salinity, dissolved oxygen concentration and other variables obtained during the R/V Cabo de Hornos cruise Lowphox-I (ESPOCODE 20HZ20151227) in the South Pacific Ocean from 2015-11-27 to 2015-11-28 (NCEI Accession 0281749), NOAA National Centers for Environmental Information [data set], https://doi.org/10.25921/0dg3-8e14, 2023b.
Vargas, C. A., Alarcón, G., Navarro, E., and Cornejo-D'Ottone, M.: Discrete, profile measurement of dissolved inorganic carbon (DIC), total alkalinity, partial pressure of CO2, pH on total scale, water temperature, salinity, dissolved oxygen concentration and other variables obtained during the R/V Cabo de Hornos cruise Lowphox-II (ESPOCODE 20HZ20180203) in the South Pacific Ocean from 2018-02-03 to 2018-02-06 (NCEI Accession 0281750), NOAA National Centers for Environmental Information [data set], https://doi.org/10.25921/6202-vf47, 2023c.
van der Wal, P., Kempers, R., and Veldhuis, M.: Production and downward flux of organic matter and calcite in a North Sea bloom of the coccolithophore Emiliania huxleyi, Marine Ecol. Prog. Ser., 126, 247–265, https://doi.org/10.3354/meps126247, 1995.
von Dassow, P.: Voltage-gated proton channels explain coccolithophore sensitivity to ocean acidification, P. Natl. Acad. Sci. USA, 119, e2206426119, https://doi.org/10.1073/pnas.2206426119, 2022.
von Dassow, P., Díaz-Rosas, F., Bendif, E. M., Gaitán-Espitia, J.-D., Mella-Flores, D., Rokitta, S., John, U., and Torres, R.: Over-calcified forms of the coccolithophore Emiliania huxleyi in high-CO2 waters are not preadapted to ocean acidification, Biogeosciences, 15, 1515–1534, https://doi.org/10.5194/bg-15-1515-2018, 2018.
Weber, T. and Bianchi, D.: Efficient particle tranfer to depth in Oxygen Minimum Zones of the Pacific and Indian oceans, Front. Earth Sci., 8, 1–11, https://doi.org/10.3389/feart.2020.00376, 2020.
Werdell, J., Bailey, S., Fargion, G., Pietras, C., Knobelspiesse, K., Feldman, G., and McClain, C.: Unique Data Repository Facilitates Ocean Color Satellite Validation, EOS, 84, 377–392, https://doi.org/10.1029/2003EO380001, 2003.
Winter, A., Henderiks, J., Beaufort, L., Rickaby, R. E. M., and Christopher W. Brown: Poleward expansion of the coccolithophore Emiliania huxleyi, J. Plankton Res., 36, 316–325, https://doi.org/10.1093/plankt/fbt110, 2014.
Wong, J., Raven, J., Aldunate, M., Silva, S., Gaitan-Espitia, J., Vargas, C., Ulloa, O., and von Dassow, P.: Do phytoplankton require oxygen to survive? A hypothesis and model synthesis from oxygen minimum zones, Limnol. Oceanogr., 68, 1417–1437, https://doi.org/10.1002/lno.12367, 2023.
Xu, Y., Li, X., Luo, M., Xiao, W., Fang, J., Rashid, H., Peng, Y., Li, W., Wenzhöfer, F., Rowden, A., and Glud, R.: Distribution, Source, and Burial of Sedimentary Organic Carbon in Kermadec and Atacama Trenches, J. Geophys. Res.-Biogeo., 126, e2020JG006189, https://doi.org/10.1029/2020JG006189, 2021.
Yang, T.-N. and Wei, K.-Y.: How many coccoliths are there in a coccosphere of the extant coccolithophorids? A compilation, Journal of Nannoplankton Research, 25, 7–15, https://doi.org/10.58998/jnr2275, 2003.
Young, J., Geisen, M., Cros, L., Kleijne, A., Sprengel, C., Probert, I., and Østergaard, J.: A guide to extant coccolithophore taxonomy, Journal of Nannoplankton Research Special Issue, 1, 1–125, https://doi.org/10.58998/jnr2297, 2003.
Young, J. R. and Ziveri, P.: Calculation of coccolith volume and its use in calibration of carbonate flux estimates, Deep-Sea Res. Pt. II, 47, 1679–1700, https://doi.org/10.1016/S0967-0645(00)00003-5, 2000.
Yuen, K.: The two-sample trimmed t for unequal population variances, Biometrika, 61, 165–170, https://doi.org/10.1093/biomet/61.1.165, 1974.
Zhang, H., Wang, K., Fan, G., Li, Z., Yu, Z., Jiang, J., Lian, T., and Feng, G.: Feedbacks of CaCO3 dissolution effect on ocean carbon sink and seawater acidification: a model study, Environ. Res. Commun., 5, 021004, https://doi.org/10.1088/2515-7620/aca9ac, 2023.
Ziveri, P., Thunell, R. C., and Rio, D.: Seasonal changes in coccolithophore densities in the Southern California Bight during 1991–1992, Deep-Sea Res. Pt. I, 42, 1893–1903, https://doi.org/10.1016/0967-0637(95)00089-5, 1995.
Ziveri, P., Bernardi, B., Baumann, K.-H., Stoll, H., and Mortyn, G.: Sinking of coccolith carbonate and potential contribution to organic carbon ballasting in the deep ocean, Deep-Sea Res. Pt. II, 54, 659–675, https://doi.org/10.1016/j.dsr2.2007.01.006, 2007.
Ziveri, P., Gray, W., Anglada-Ortiz, G., Manno, C., Grelaud, M., Incarbona, A., Buchanan, J., Subhas, A., Pallacks, S., White, A., Adkins, J., and Berelson, W.: Pelagic calcium carbonate production and shallow dissolution in the North Pacific Ocean, Nat. Commun., 14, 805, https://doi.org/10.1038/s41467-023-36177-w, 2023.
Zondervan, I.: The effects of light, macronutrients, trace metals and CO2 on the production of calcium carbonate and organic carbon in coccolithophores – A review, Deep-Sea Res. Pt. II, 54, 521–537, https://doi.org/10.1016/j.dsr2.2006.12.004, 2007.
Coccolithophores are tiny oceanic algae that produce calcium carbonate, which can help organic matter sink and affect the oxygen levels below. As ocean conditions change, we studied how these algae contribute to carbon transport in a low-oxygen, low-pH region of the Southeast Pacific. Our results show they survive in these challenging conditions, but their impact is lower than in most regions, suggesting that other phytoplankton may play a bigger role in moving organic carbon here.
Coccolithophores are tiny oceanic algae that produce calcium carbonate, which can help organic...