the Creative Commons Attribution 4.0 License.
the Creative Commons Attribution 4.0 License.
 | 04 Sep 2025
Technical note: Measurements of fluorescent dissolved organic matter (FDOM) in seawater (filter blanks, pore sizes, and storage)
Heejun Han
Intae Kim
Guebuem Kim
Fluorescent dissolved organic matter (FDOM) provides crucial information regarding the sources and characteristics of dissolved organic matter (DOM) in oceans. However, results from FDOM measurement can depend on filter blanks, pore sizes, and sample storage. To develop more reliable methods for FDOM measurements, we examined uncertainties associated with different preparation methods for seawater samples. Three primary components were identified from these samples using parallel factor analysis: terrestrial humic-like peak (C peak), marine humic-like peak (M peak), and protein-like peak (T peak). Relatively high blank values were observed when samples were filtered through a pre-combusted glass fiber filter (Whatman, borosilicate, 0.7 µm, 47 mm) and a membrane filter (Whatman, mixed cellulose ester, 0.2 µm, 47 mm) without pre-cleaning. These blank values were negligible when both filters were washed with 5 mL of 0.1 M HCl (∼0.29 mL cm−2) or 20 mL of distilled water (∼1.16 mL cm−2). The effects of different filter pore sizes were not observed for the C and M peaks, but lower T-peak values were observed for filtered samples relative to unfiltered samples. During storage, C and M peaks showed consistent results for 21 d (8 % ± 3 %) when kept in pre-combusted amber glass vials in a refrigerator or a freezer. In contrast, clear changes were observed in samples stored at room temperature after 5 d. Thus, reliable C and M peaks can be obtained from unfiltered or filtered samples stored in a refrigerator or freezer for up to 3 weeks. However, T-peak intensity decreased rapidly in both filtered (15 %–50 %) and unfiltered samples (10 %–40 %) within 5 d, indicating the influence of significant biological and abiotic processes. Therefore, our results suggest that careful sample filtration, storage, and blank controls are necessary for T-peak measurements.
- Article
(2096 KB) - Full-text XML
-
Supplement
(312 KB) - BibTeX
- EndNote


Fluorescent dissolved organic matter (FDOM), which emits fluorescent light after absorbing energy, is ubiquitous in the ocean and provides important information on the origins and behavior of dissolved organic matter (DOM) in the ocean (Nelson and Siegel, 2013; Stedmon and Nelson, 2015). FDOM in ocean waters is generally classified into two groups (humic-like and protein-like substances) based on the excitation and emission spectrum (Coble, 2007). The humic-like component is primarily derived from microbial decomposition of organic debris in sediments and soils and from materials sinking through the water column as marine snow (Yamashita and Tanoue, 2008; Yamashita and Tanoue, 2009). In contrast, the protein-like component represents a more labile fraction of DOM and is mainly produced through primary production and biological activity in the surface waters (Lønborg et al., 2010). Based on distinct fluorescent properties, FDOM has been used as a tracer for water circulation in the ocean (GonçAlves-Araujo et al., 2016; Galletti et al., 2019; Margolin et al., 2018), for estimating DOM turnover times in the global ocean (Catalá et al., 2015), and for calculating the fractions of different water masses in the ocean (Kim et al., 2020; Wang et al., 2022).
Over the last few decades, the measurements of FDOM in the ocean have been extensively conducted. Accordingly, various sampling and laboratory protocols have been developed in different laboratories without intercalibrations in sampling, storage, and measurements. In general, freezing and refrigeration have been used to store samples. The freezing of seawater samples after filtering with a pre-combusted (4 h, 450 °C) glass fiber filter (GF/F, Whatman, 0.7 µm pore size, 47 mm diameter) is one of the widely used methods to preserve samples when measurements are delayed (>1 month) (Conmy et al., 2009; Yamashita et al., 2021). However, FDOM intensity can vary up to ±50 % during the freezing and thawing process due to aggregation and disaggregation, especially when high levels of humic substances are present (Murphy et al., 2013a; Spencer et al., 2007). Thus, FDOM sampling was commonly performed by filtering the water sample (∼40 mL) with pre-combusted (4 h, 450 °C) GF/F and storing it in a pre-combusted (4 h, 450 °C) amber vial without any treatment. In some studies, different types of membrane filters, such as cellulose acetate, polyethersulfone, and polycarbonate, have also been used for FDOM measurement (Amaral et al., 2023; Chen et al., 2022; Vines and Terry, 2020). Then, the FDOM samples were generally kept in a refrigerator (4 °C) before the measurement (Coble et al., 1998; Stedmon et al., 2003). However, the potential uncertainties that can be introduced by these various sampling and storage methods, particularly in different marine environments, have not been evaluated carefully yet. Therefore, in this study, we measured FDOM intensities in open- and coastal-ocean samples under different conditions (i.e., filter pore sizes and storage strategies) to obtain reliable methods for FDOM measurements.
2.1 Procedural blank
We used pre-combusted GF/F and membrane filters (Whatman, 0.2 µm pore size, 47 mm diameter) to examine the filter blanks of FDOM measurements. The materials of GF/F and membrane filter are composed of borosilicate and mixed cellulose ester, respectively. Hereafter, membrane filter refers specifically to the mixed cellulose ester filter described above. The filter blank was tested with a sequential filtration process, adding up to 100 mL of distilled water and 0.1 M HCl, respectively. The measurement of FDOM was conducted by collecting 5 mL water samples at the volume of 5, 10, 15, 20, 30, 50, and 100 mL during the sequential filtration process.
2.2 Sampling and preparation
Sampling was conducted in the East Sea (Japan Sea) (Station EC1; 37.33° N, 131.45° E) in April 2019 and in the Jinhae Bay (JH; 35.04° N, 128.62° E) in August 2019. The water samples (3, 300, and 2300 m depths) of Station EC1 were collected using a Niskin sampler on board a ship (R/V Eardo). The surface water samples (∼0.5 m) from the JH were collected at three sites (JH1, JH2, and JH3). The samples from the JH were collected using a pump system on board a ship. All water samples were stored in pre-cleaned 20 L polypropylene containers in a refrigerator and transported to the land-based laboratory without any treatment.
In the laboratory, filtration was performed using a 47 mm diameter funnel system that had been cleaned with 1 M HCl. The funnel and filter system were rinsed with distilled water and seawater samples. Unfiltered and filtered (0.7 or 0.2 µm) water samples (∼40 mL each) were stored in the dark (i.e., in pre-combusted amber vials) to prevent photodegradation and kept at three different temperatures (−20, 4, or 25 °C). All the samples were triplicated. Thus, each sample was divided into 27 amber vial samples. The initial measurement was conducted within 2 d after seawater sampling. The measurement interval to examine the effect of storage time was 1, 3, 5, 7, 14, and 21 d, respectively, from the initial measurement.
2.3 Analytical protocols
FDOM fluorescence intensity was determined by a spectrophotometer (Aqualog, Horiba, USA). We used 10 mm path-length quartz cuvettes, which went through the signal-to-noise test. The 10 mm path-length quartz cuvettes have been widely used to measure FDOM in the marine environment (Murphy et al., 2013b). The measurement of ultra-pure water (Milli-Q water, <18.2 Ω) was performed at the start of FDOM analysis, and the result was considered as a blank value. The excitation–emission matrices (EEMs) were collected over excitation wavelengths ranging from 240 to 700 nm at 3 nm intervals and emission wavelengths ranging from 250 to 500 nm at 5 nm intervals. The integration time of EEMs was 5 s. The parallel factor analysis (PARAFAC) model was utilized through Solo software (Eigenvector Inc., USA) to identify and characterize key fluorescent components (Han et al., 2022). Before applying the model, corrections for the inner-filter effect were conducted to reduce distortions in fluorescence measurements (Kothawala et al., 2013). To ensure the reliability of the extracted components, the model was assessed through split-half validation and random initialization, confirming its robustness (Bro, 1997; Stedmon and Bro, 2008; Zepp et al., 2004). Since fluorescence intensity is highly instrument-dependent, the intensity of FDOM was normalized by the Raman peak area using ultra-pure water to convert to Raman unit (R.U.). The R.U. value represented the integrated area of the water Raman peak at an excitation wavelength of 350 nm (Lawaetz and Stedmon, 2009).
To compare the intensity of all samples, the PARAFAC model was applied to a single data set of the EEM data, including filter blank samples (distilled water and 0.1 M HCl) as well as open- and coastal-ocean samples while considering filter pore sizes, storage time, and temperature for the seawater samples. Terrestrial humic-like peak (C peak, nm), marine humic-like peak (M peak, nm), and protein-like peak (T peak, nm) were identified by the PARAFAC model. These peak positions were assigned based on the previously reported values (Coble, 1996, 2007; Coble et al., 1998). The fluorescence spectra results were compared with the OpenFluor spectra database (Murphy et al., 2014), and statistical matches were found at a confidence level of >95 %, with 28 matches for the C peak, 37 for the M peak, and 45 for the T peak. The EEM contours and loading results from the PARAFAC model are presented in Fig. 1.
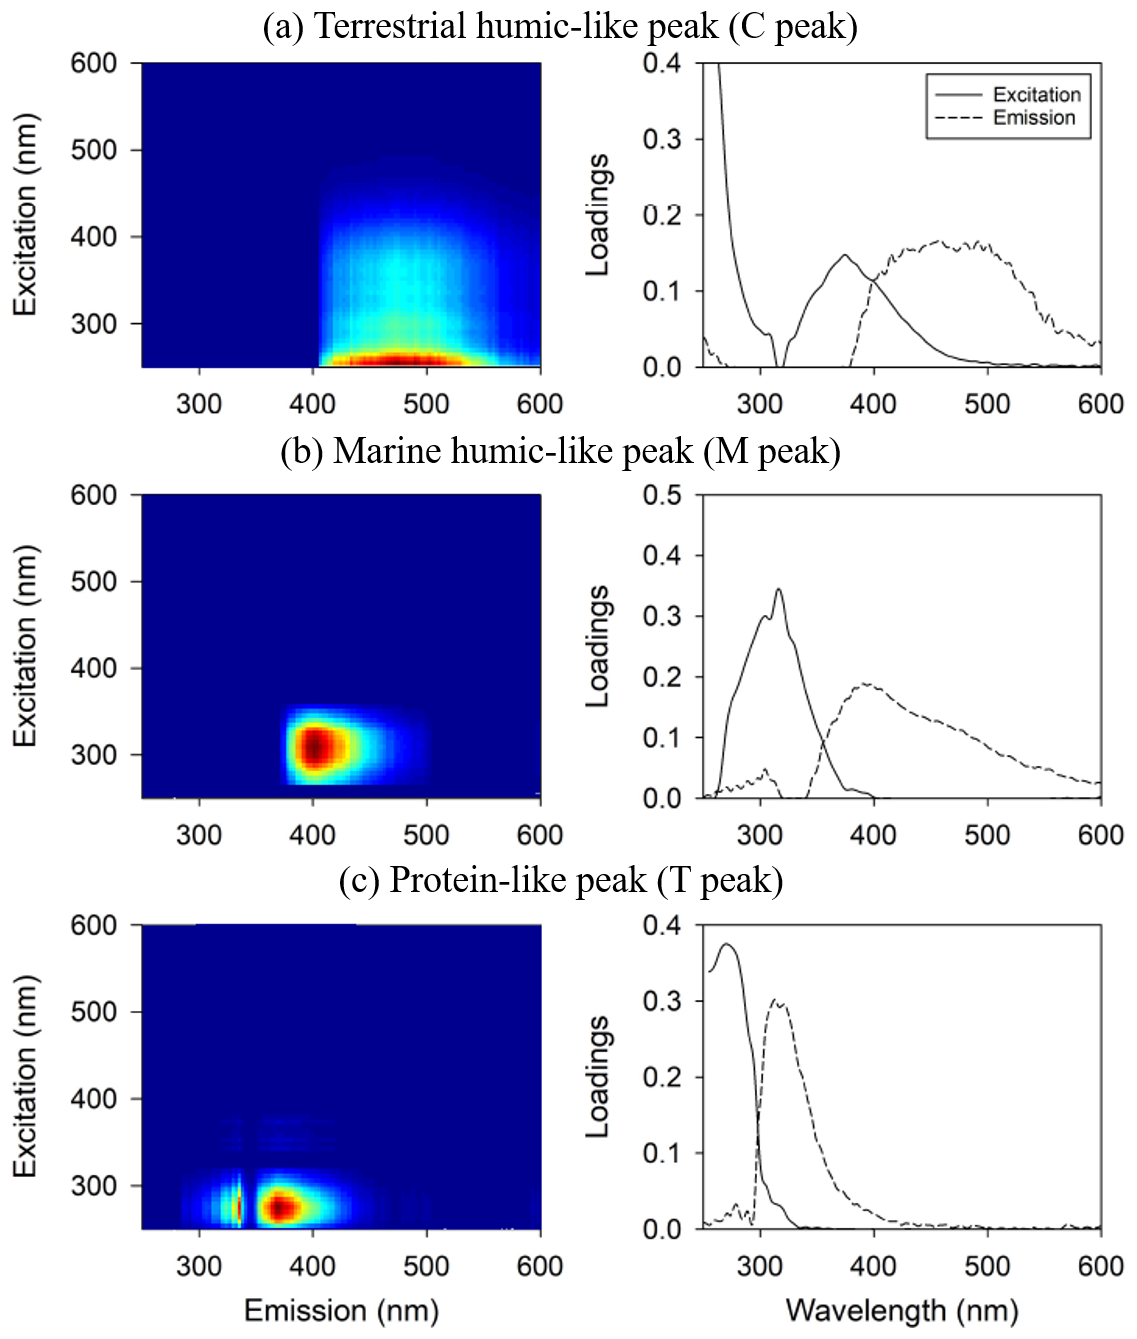
Figure 1EEM contours and loading results from the PARAFAC model include (a) terrestrial humic-like peak, (b) marine humic-like peak, and (c) protein-like peak.
3.1 Filter blanks
During GF/F filtration, the intensities of the C and T peaks measured in the filtrate were negligible for both distilled water-washed and acid-treated filters (Fig. 2). Unlike the C and T peaks, a significantly high intensity of the M peak (up to 0.15 R.U.) was observed in the filtrate when the filter was washed with less than 20 mL of distilled water (volume per filter surface area: ∼1.16 mL cm−2), corresponding to up to 60 % of the M peak in the coastal-ocean (Station JH) samples. The acid-washed filter showed a negligible intensity of the M peak.
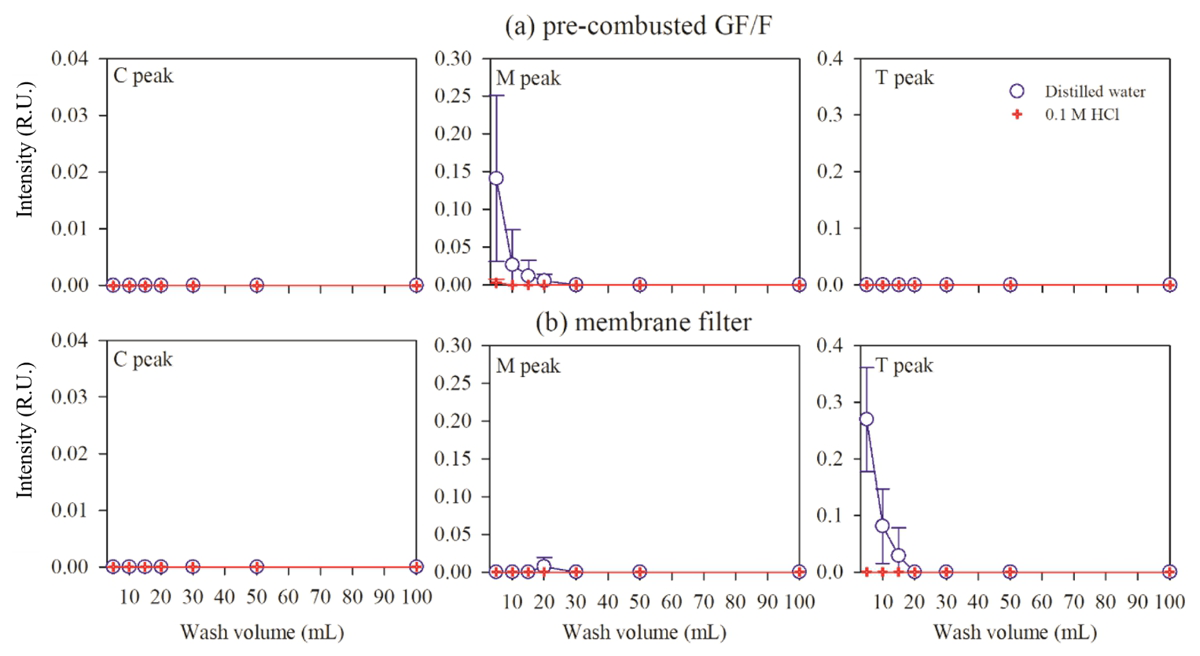
Figure 2Filter blanks of FDOM intensities for (a) pre-combusted GF/F and (b) membrane filters washing with distilled water or 0.1 M HCl.
During filtration with the membrane filter, the intensities of C and M peaks measured on the filtrate were negligible for both washing with distilled water and acid-treated filters (Fig. 2). However, the T peak showed high intensities in the filtrate of which the filter was washed with distilled water, particularly before 20 mL of filtration (up to 0.27 R.U.). The blank of the T peak was almost 95 % in the open-ocean (Station EC1) samples. The acid-washed filter exhibited a negligible filter blank for the T peak.
3.2 Filter pore sizes
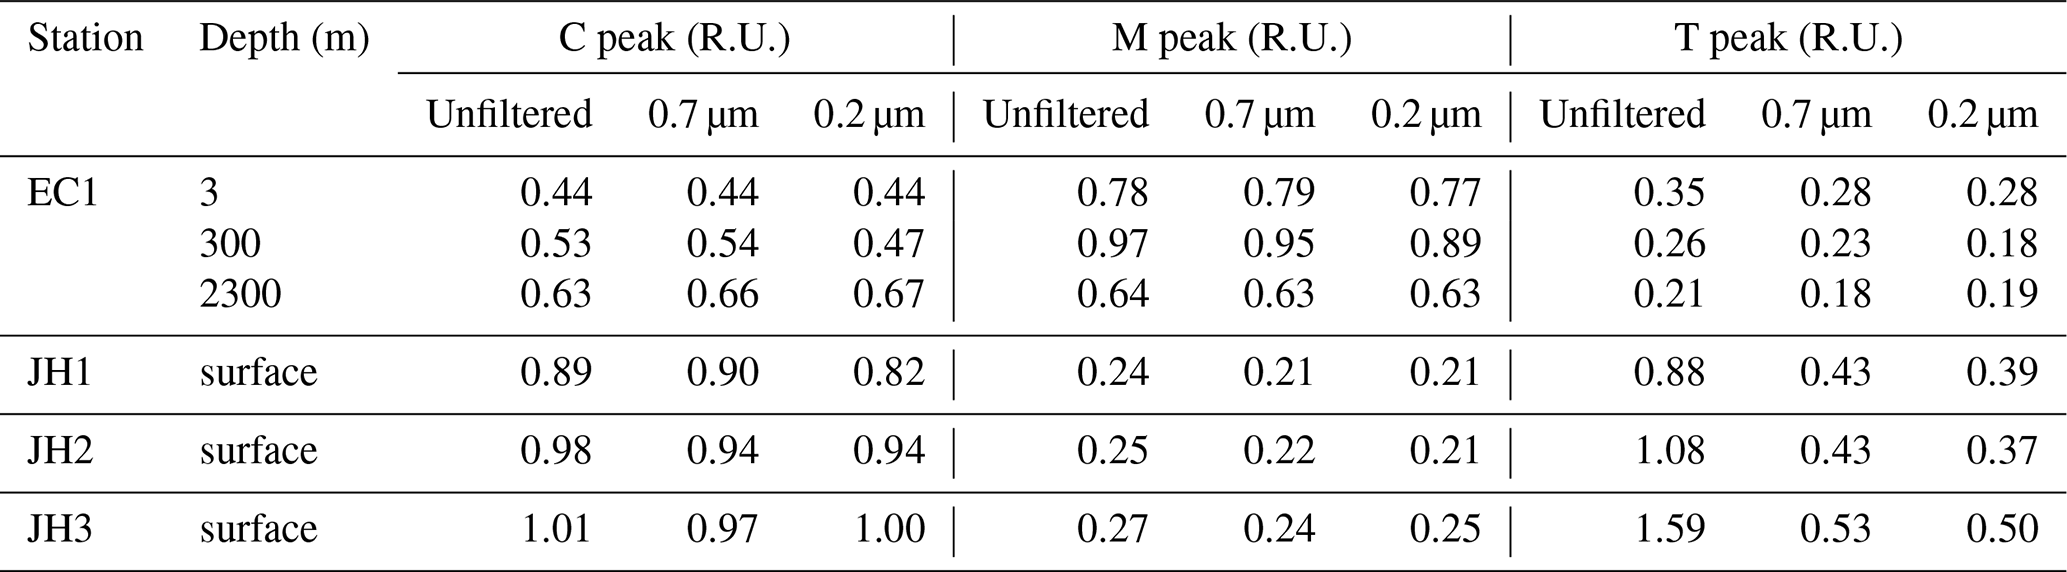
The initial intensities of the C, M, and T peaks at 3 m depth at station EC1 from unfiltered samples were 0.44, 0.78, and 0.35 R.U., respectively. At 300 m, the intensities of the C, M, and T peaks were 0.53, 0.97, and 0.26 R.U., and at 2300 m, they were 0.63, 0.64, and 0.21 R.U. (Table 1). The intensities of the C and T peaks in the open ocean showed no clear differences across depths, whereas the intensity of the M peak was relatively higher at 300 m compared to the other depths. In the coastal ocean, at stations JH1, JH2, and JH3, the intensities of the C, M, and T peaks from unfiltered samples were 0.89, 0.24, and 0.88 R.U. at JH1; 0.98, 0.25, and 1.08 R.U. at JH2; and 1.01, 0.27, and 1.59 R.U. at JH3. For samples filtered through 0.7 µm GF/F and 0.2 µm membrane filters, the initial intensities of the C and M peaks at 3, 300, and 2300 m in the open ocean and coastal stations JH1, JH2, and JH3 are similar to those observed from unfiltered samples and also summarized in Table 1. For the T peak, the intensities in samples filtered through the 0.7 µm GF/F were 0.28, 0.23, and 0.18 R.U. at 3, 300, and 2300 m in the open ocean, respectively, and 0.43, 0.43, and 0.53 R.U. at coastal stations JH1, JH2, and JH3, respectively. Similar T-peak intensities were observed in samples filtered through the 0.2 µm membrane filter.
Table 1Initial intensities of C, M, and T peaks in unfiltered and filtered samples from the East Sea and Jinhae Bay.
The intensities of C and M peaks for unfiltered samples were similar to those for the filtered samples (0.7 µm) in the open ocean (97 % ± 1 %, t test, p>0.05) and coastal ocean (96 % ± 4 %, p>0.05) (Fig. 3). The p value higher than 0.05 indicated that the differences between the unfiltered and filtered samples were not statistically significant. The intensities of T peak in unfiltered samples from the open ocean showed a slight difference to those in filtered samples (0.7 µm) (83 % ± 9 %, p=0.05). Unlike the open ocean, the intensities of T peak in unfiltered samples from the coastal ocean were 48 %–79 % higher than those observed in filtered samples (0.7 or 0.2 µm), and this difference was statistically significant (p<0.05). In both open- and coastal-ocean samples, no significant difference in FDOM intensities was observed between the 0.7 and 0.2 µm filtration.
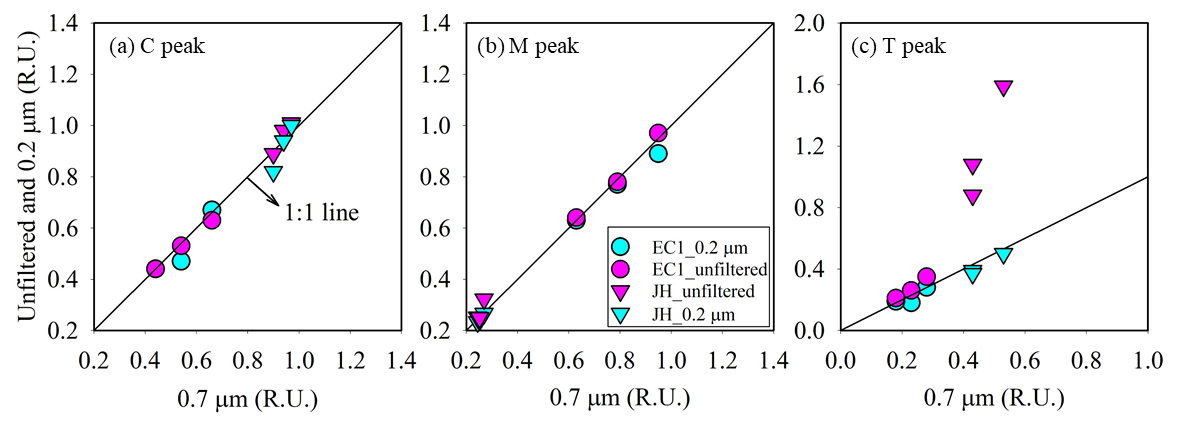
Figure 3Initial intensities of (a) C peak, (b) M peak, and (c) T peak in samples obtained from the open ocean and the coastal ocean, depending on the filter pore sizes. Circles and triangles indicate the samples from the East Sea and Jinhae Bay, respectively. The solid line indicates the 1:1 line.
3.3 Storage strategies
The intensities of C and M peaks for unfiltered and filtered samples (0.7 and 0.2 µm) from the open- and coastal-ocean stored in the refrigerator (4 °C) and freezer (−20 °C) under dark conditions showed no clear differences between the initial and after 21 d measurements (8 % ± 3 %, p>0.05) (Fig. 4). At room temperature, the intensities of C and M peaks in the unfiltered or filtered samples from the open and coastal ocean also showed no clear differences within 5 d (7 % ± 2 %, p>0.05) (Fig. 5). However, regardless of the open or coastal ocean, the intensities of T peak in unfiltered or filtered samples showed a variation after 5 d compared with the initial value (24 % ± 5 %, p<0.05). The difference of T peak increased more significantly after 21 d in unfiltered (42 % ± 3 %, p<0.05) and filtered samples (43 % ± 15 %, p<0.05).
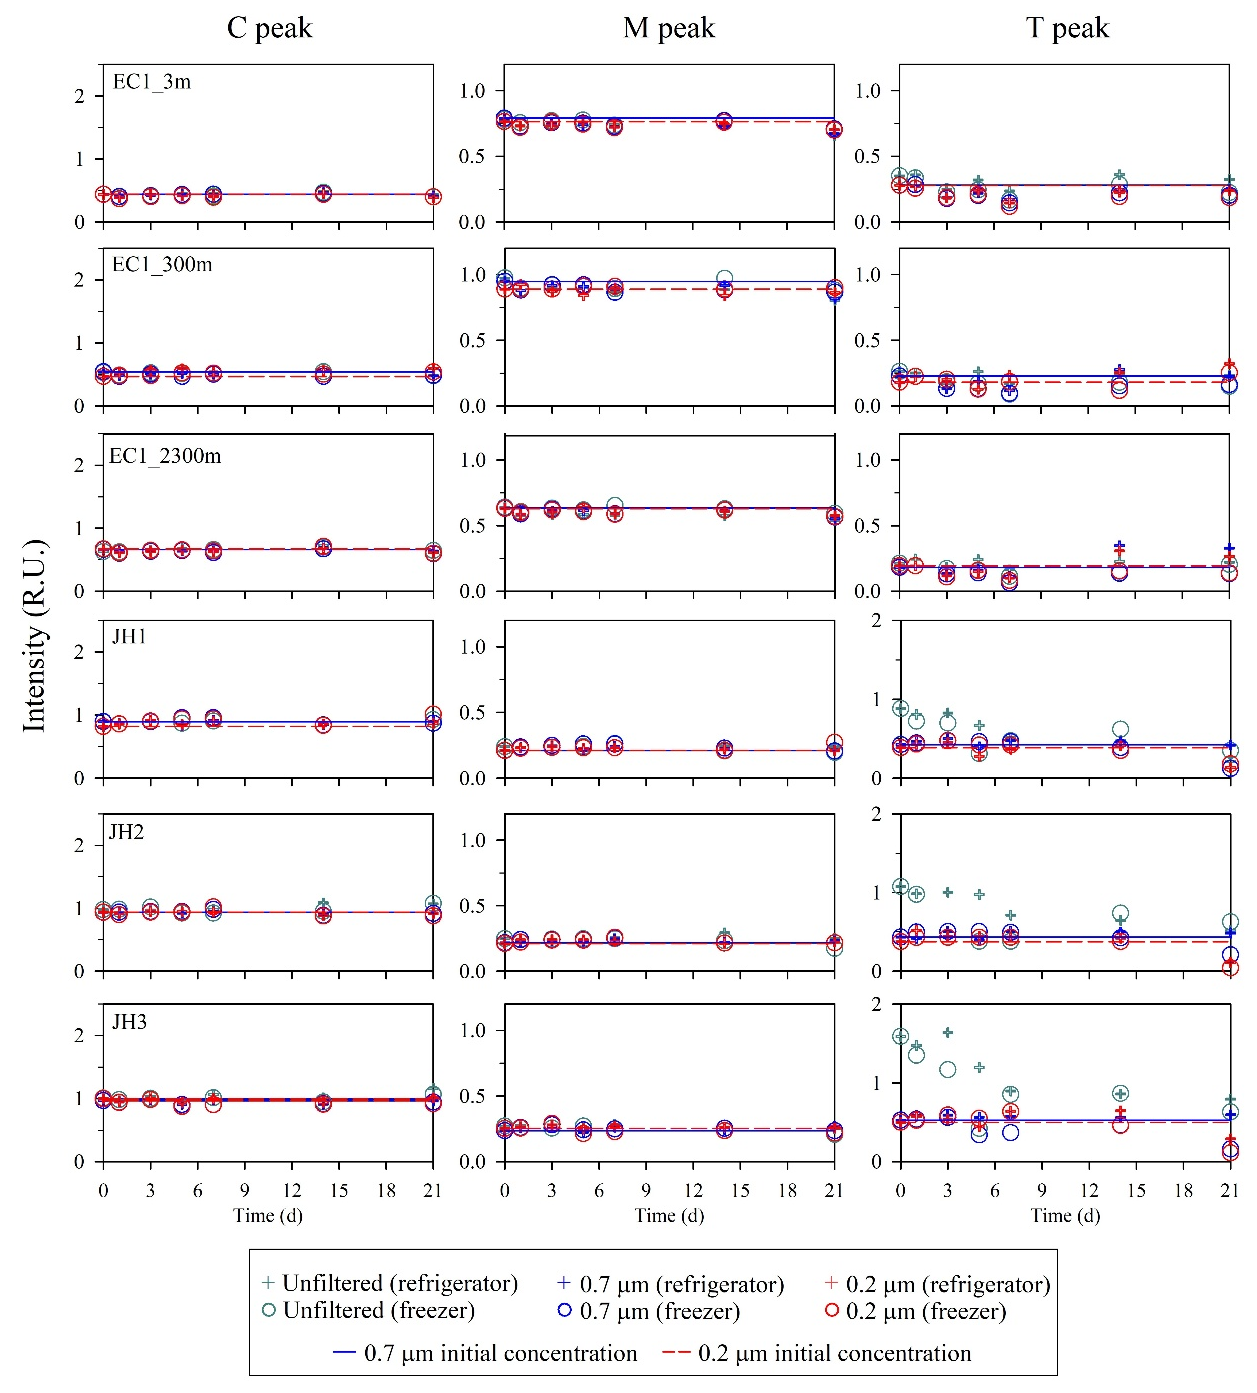
Figure 4Changes in FDOM intensities after being stored in the refrigerator or freezer for samples obtained from the open and coastal oceans. Circles and crosses represent the refrigerator and freezer, respectively. Solid and dashed lines denote the initial intensities of FDOM after filtration with 0.7 µm pore size (blue) and 0.2 µm pore size (red) filters, respectively.
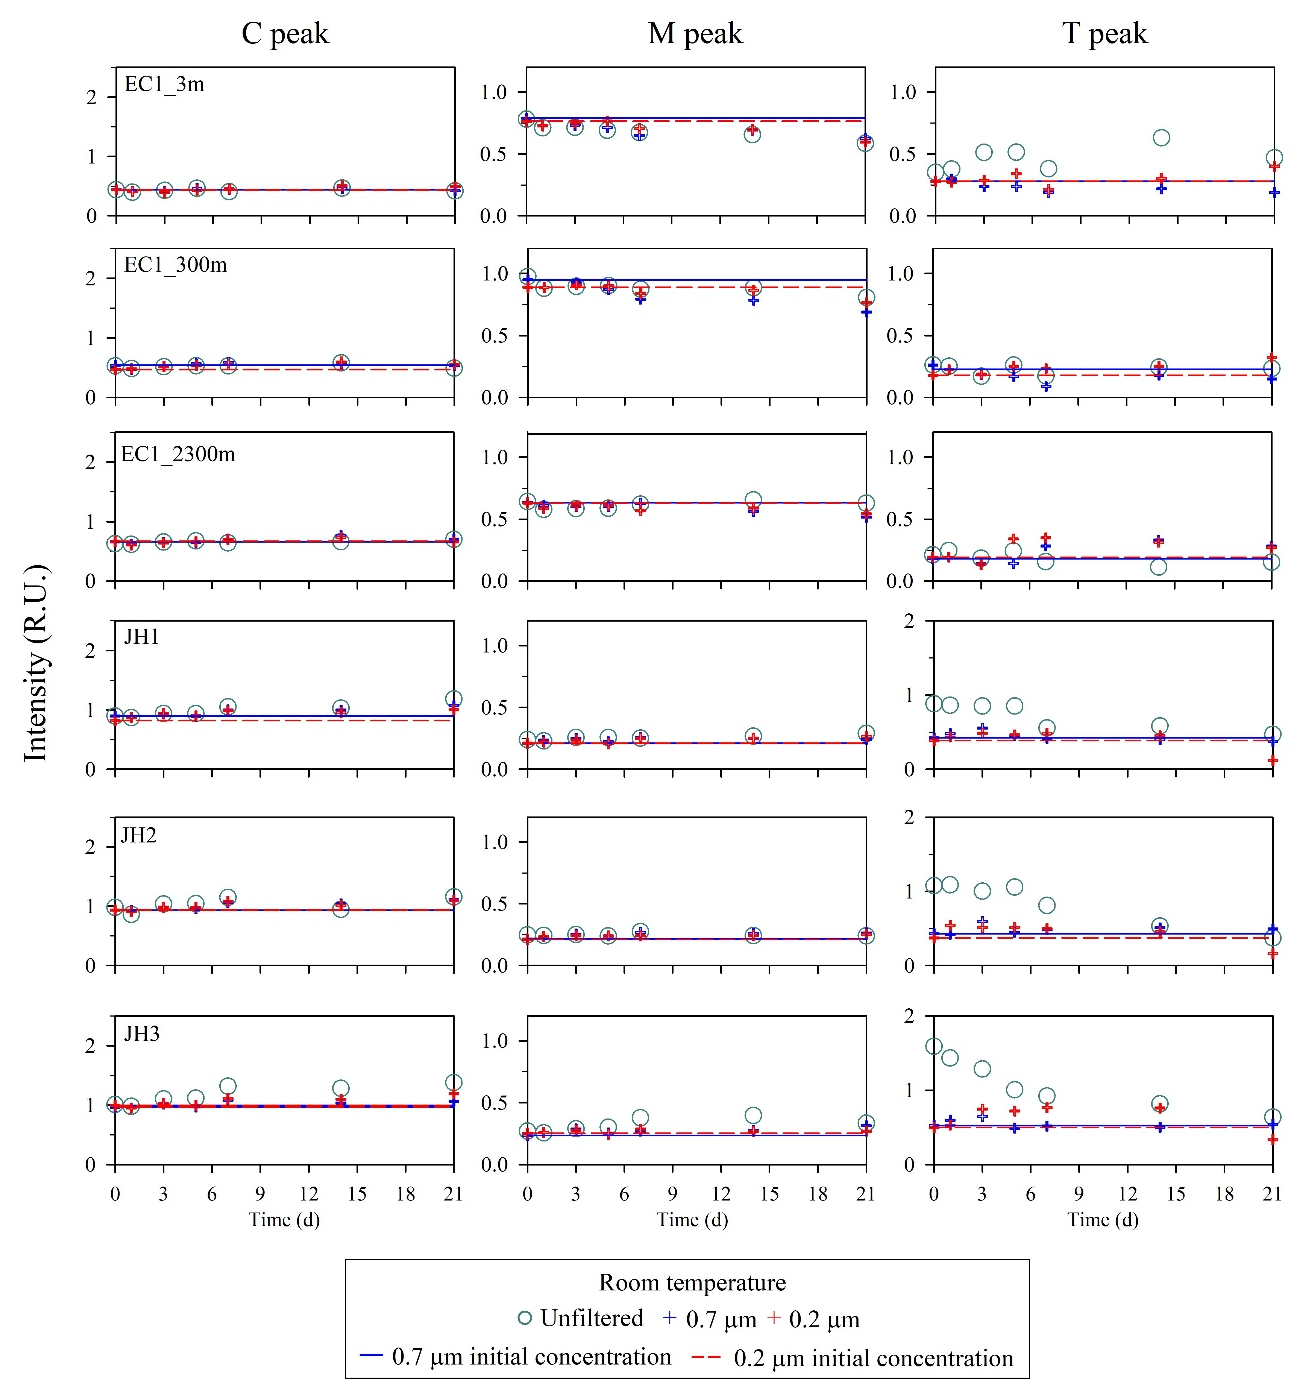
Figure 5Changes in FDOM intensities after being stored at room temperature for samples in the open and coastal oceans. Circles and crosses represent the unfiltered and filtered samples, respectively. Solid and dashed lines denote the initial intensities of FDOM after filtering by 0.7 µm pore size (blue) and 0.2 µm pore size (red) filters, respectively.
The accuracy of FDOM measurements can be largely affected by the filtration process. Pre-combusted GF/F has been widely used for water filtration for FDOM sampling due to its advantages in low DOM backgrounds after ignition, high flow rate, and large capacity. However, we observed high contamination of the M peak even after washing with distilled water. This seems to be produced by filter fiber particles from the ashed filter. This result suggested that GF/F should be washed with 20 mL of distilled water (∼1.16 mL cm−2) or 5 mL of 0.1 M HCl (∼0.29 mL cm−2) before the sample filtration for FDOM measurements. Although GF/F has such advantages, the large filter pore size (0.7 µm) can allow the passage of microorganisms or colloids (Tanoue, 1992), which could mislead the measurement due to the biological and abiotic activities, such as cell bursting and absorption/desorption on colloidal particles.
To prevent these effects, a membrane filter with a 0.2 µm pore size has been often used for FDOM sampling (Rochelle-Newall and Fisher, 2002). However, we observed high blank values of the membrane filter for the T peak without pre-washing using 20 mL of distilled water or 5 mL of 0.1 M HCl. Our results from the blank test for different filters indicated that the filter blank may introduce uncertainties in the measurement of FDOM in seawater. This is particularly noticeable for the M peak in open-ocean samples and the T peak in the coastal-ocean samples. Therefore, careful pre-washing, including ashing processes, is necessary to prevent any contamination from filtration. In cases where distilled water or acid is not available in the field, pre-washing the filter with sample water may be a practical alternative to reduce potential contamination before filtration.
The intensities of all FDOM components in the open ocean showed no significant differences between unfiltered and filtered samples (0.7 and 0.2 µm). This result suggested that the presence of particles in the sample did not significantly affect the fluorescent intensity in the open ocean. These results also indicated that filtration may not be essential for measuring C and M peaks in open-ocean waters, and measurements can be reliably conducted without filtration. Similarly, filtration was not conducted in the open-ocean samples to avoid potential contamination for radiocarbon analysis of dissolved organic carbon (Druffel et al., 2016; Druffel et al., 2019). Nevertheless, as filtration is a standard practice in oceanographic research, it can still be employed where necessary, particularly to reduce the potential risk of contamination from particulate matter and ensure sample homogeneity. In the coastal ocean, however, a notable difference was observed in the T-peak intensities between unfiltered and filtered samples (0.7 and 0.2 µm), whereas the C and M peaks remained consistent. The high intensities of T peak in unfiltered samples could be due to a fresh protein-like organic component, which has relatively large particle sizes (Lin and Guo, 2020). Therefore, while filtration appears to have minimal impact on C and M peaks in the open and coastal oceans, careful consideration of size fractionation is recommended for T-peak measurements, especially for coastal-water samples.
For the sample storage, C and M peaks in the open- and coastal-ocean waters can be preserved up to 21 d when stored in a refrigerator and freezer, regardless of whether samples were filtered or not (Fig. 4). However, at room temperature, significant changes in the intensities of the C and M peaks were observed after 5 d, particularly for the M peak in the open ocean and the both C and M peaks in the coastal ocean (Fig. 5). Thus, storage of C- and M-peak samples at room temperature for more than 5 d is not recommended in any sampling conditions. Unlike C and M peaks, the T peak showed significant changes within 5 d for any type of storage and filtration. These changes in T peak were presumably associated with rapid production and/or biodegradation of protein-like DOM. Thus, immediate measurements are required to accurately measure the T peak, which is biologically labile.
We investigated the effects of filter blanks, filter pore sizes, and storage strategies for measuring FDOM using seawater samples from the open and coastal oceans. We observed high blank values of FDOM originating from the filter without pre-washing and ashing procedures. The intensities of C and M peaks were not affected by filter pore sizes for open- and coastal-ocean samples. However, filter pore sizes affected the T-peak intensities significantly, showing higher intensities from 48 % to 79 % (unfiltered) in the coastal-ocean samples than in the filtered samples. These findings suggested a possible option for measuring C and M peaks without filtration in the open ocean. Nonetheless, filtration is recommended to ensure consistent and accurate measurements. The intensities of C and M peaks in seawater samples can be preserved for up to 21 d in a refrigerator or freezer, regardless of whether the samples are filtered or unfiltered. However, the intensity of T peak, even in filtered samples, rapidly decreased within 5 d, regardless of storage temperature. Overall, if only the C- and M-peak data are required, samples can be stored in the refrigerator and measured within 21 d. However, for T-peak measurements, filtered samples should be immediately measured after sampling to prohibit misinterpretation.
The original contributions presented in the study are included in the Supplement; further inquiries can be directed to the corresponding author(s).
The supplement related to this article is available online at https://doi.org/10.5194/bg-22-4423-2025-supplement.
JS and GK contributed to the conceptualization of the study. JS and HH performed sampling, experiments, and analyses. JS, IK, and GK were involved in the data interpretation and writing of the manuscript.
The contact author has declared that none of the authors has any competing interests.
Publisher's note: Copernicus Publications remains neutral with regard to jurisdictional claims made in the text, published maps, institutional affiliations, or any other geographical representation in this paper. While Copernicus Publications makes every effort to include appropriate place names, the final responsibility lies with the authors.
We thank the members of the Environmental and Marine Biogeochemistry Laboratory (EMBL), SNU, for their assistance with sampling and lab analysis. We also thank the captain and crew of the R/V Eardo for help at sea.
This study was funded by a Korea Institute of Ocean Science and Technology research grant (KIOST, PEA0174). This study was also supported by the Korea Institute of Marine Science and Technology Promotion (KIMST), funded by the Ministry of Ocean and Fisheries, South Korea (RS-2022-KS221662).
This paper was edited by Huixiang Xie and reviewed by Philippe Massicotte and one anonymous referee.
Amaral, J. H. F., Gaddy, J. R., Bianchi, T. S., Osborne, T. Z., Newman, S., Dombrowski, J., and Morrison, E. S.: Controls on the composition of dissolved organic matter in treatment wetland source waters of South Florida, USA, Ecol. Eng., 194, 107047, https://doi.org/10.1016/j.ecoleng.2023.107047, 2023.
Bro, R.: PARAFAC. Tutorial and applications, Chemometr. Intell. Lab., 38, 149–171, https://doi.org/10.1016/S0169-7439(97)00032-4, 1997.
Catalá, T. S., Reche, I., Fuentes-Lema, A., Romera-Castillo, C., Nieto-Cid, M., Ortega-Retuerta, E., Calvo, E., Alvarez, M., Marrasé, C., and Stedmon, C. A.: Turnover time of fluorescent dissolved organic matter in the dark global ocean, Nat. Commun., 6, 5986, https://doi.org/10.1038/ncomms6986, 2015.
Chen, J., Zhou, Y., and Zhang, Y.: New insights into microbial degradation of cyanobacterial organic matter using a fractionation procedure, Int. J. Env. Res. Pub. He., 19, 6981, https://doi.org/10.3390/ijerph19126981, 2022.
Coble, P. G.: Characterization of marine and terrestrial DOM in seawater using excitation-emission matrix spectroscopy, Mar. Chem., 51, 325–346, https://doi.org/10.1016/0304-4203(95)00062-3, 1996.
Coble, P. G.: Marine optical biogeochemistry: the chemistry of ocean color, Chem. Rev., 107, 402–418, https://doi.org/10.1021/cr050350, 2007.
Coble, P. G., Del Castillo, C. E., and Avril, B.: Distribution and optical properties of CDOM in the Arabian Sea during the 1995 Southwest Monsoon, Deep-Sea Res. Pt. II, 45, 2195–2223, https://doi.org/10.1016/S0967-0645(98)00068-X, 1998.
Conmy, R. N., Coble, P. G., Cannizzaro, J. P., and Heil, C. A.: Influence of extreme storm events on West Florida Shelf CDOM distributions, J. Geophys. Res.-Biogeo., 114, G00F04, https://doi.org/10.1029/2009JG000981, 2009.
Druffel, E. R., Griffin, S., Coppola, A. I., and Walker, B. D.: Radiocarbon in dissolved organic carbon of the Atlantic Ocean, Geophys. Res. Lett., 43, 5279–5286, https://doi.org/10.1002/2016GL068746, 2016.
Druffel, E. R., Griffin, S., Wang, N., Garcia, N. G., McNichol, A. P., Key, R. M., and Walker, B. D.: Dissolved organic radiocarbon in the central Pacific Ocean, Geophys. Res. Lett., 46, 5396–5403, https://doi.org/10.1029/2019GL083149, 2019.
Galletti, Y., Gonnelli, M., Brogi, S. R., Vestri, S., and Santinelli, C.: DOM dynamics in open waters of the Mediterranean Sea: New insights from optical properties, Deep-Sea Res. Pt. I, 144, 95–114, https://doi.org/10.1016/j.dsr.2019.01.007, 2019.
Gonçalves-Araujo, R., Granskog, M. A., Bracher, A., Azetsu-Scott, K., Dodd, P. A., and Stedmon, C. A.: Using fluorescent dissolved organic matter to trace and distinguish the origin of Arctic surface waters, Sci. Rep.-UK, 6, 33978, https://doi.org/10.1038/srep33978, 2016.
Han, H., Na, T., Cho, H.-M., Kim, G., and Hwang, J.: Large fluxes of continental-shelf-borne dissolved organic carbon in the East China Sea and the Yellow Sea, Mar. Chem., 240, 104097, https://doi.org/10.1016/j.marchem.2022.104097, 2022.
Kim, J., Kim, Y., Kang, H.-W., Kim, S. H., Rho, T., and Kang, D.-J.: Tracing water mass fractions in the deep western Indian Ocean using fluorescent dissolved organic matter, Mar. Chem., 218, 103720, https://doi.org/10.1016/j.marchem.2019.103720, 2020.
Kothawala, D. N., Murphy, K. R., Stedmon, C. A., Weyhenmeyer, G. A., and Tranvik, L. J.: Inner filter correction of dissolved organic matter fluorescence, Limnol. Oceanogr.-Meth., 11, 616–630, https://doi.org/10.4319/lom.2013.11.616, 2013.
Lawaetz, A. J. and Stedmon, C. A.: Fluorescence intensity calibration using the Raman scatter peak of water, Appl. Spectrosc., 63, 936–940, https://doi.org/10.1366/000370209788964548, 2009.
Lin, H. and Guo, L.: Variations in colloidal DOM composition with molecular weight within individual water samples as characterized by flow field-flow fractionation and EEM-PARAFAC analysis, Environ. Sci. Technol., 54, 1657–1667, https://doi.org/10.1021/acs.est.9b07123, 2020.
Lønborg, C., Álvarez-Salgado, X. A., Davidson, K., Martínez-García, S., and Teira, E.: Assessing the microbial bioavailability and degradation rate constants of dissolved organic matter by fluorescence spectroscopy in the coastal upwelling system of the Ría de Vigo, Mar. Chem., 119, 121–129, https://doi.org/10.1016/j.marchem.2010.02.001, 2010.
Margolin, A. R., Gonnelli, M., Hansell, D. A., and Santinelli, C.: Black Sea dissolved organic matter dynamics: Insights from optical analyses, Limnol. Oceanogr., 63, 1425–1443, https://doi.org/10.1002/lno.10791, 2018.
Murphy, K. R., Boehme, J. R., Brown, C., Noble, M., Smith, G., Sparks, D., and Ruiz, G. M.: Exploring the limits of dissolved organic matter fluorescence for determining seawater sources and ballast water exchange on the US Pacific coast, J. Marine Syst., 111, 157–166, https://doi.org/10.1016/j.jmarsys.2012.10.010, 2013a.
Murphy, K. R., Stedmon, C. A., Graeber, D., and Bro, R.: Fluorescence spectroscopy and multi-way techniques. PARAFAC, Anal. Methods-UK, 5, 6557–6566, https://doi.org/10.1039/C3AY41160E, 2013b.
Murphy, K. R., Stedmon, C. A., Wenig, P., and Bro, R.: OpenFluor – an online spectral library of auto-fluorescence by organic compounds in the environment, Anal. Methods-UK, 6, 658–661, https://doi.org/10.1039/C3AY41935E, 2014.
Nelson, N. B. and Siegel, D. A.: The global distribution and dynamics of chromophoric dissolved organic matter, Annu. Rev. Mar. Sci., 5, 447–476, https://doi.org/10.1146/annurev-marine-120710-100751, 2013.
Rochelle-Newall, E. and Fisher, T.: Production of chromophoric dissolved organic matter fluorescence in marine and estuarine environments: an investigation into the role of phytoplankton, Mar. Chem., 77, 7–21, https://doi.org/10.1016/S0304-4203(01)00072-X, 2002.
Spencer, R. G., Bolton, L., and Baker, A.: Freeze/thaw and pH effects on freshwater dissolved organic matter fluorescence and absorbance properties from a number of UK locations, Water Res., 41, 2941–2950, https://doi.org/10.1016/j.watres.2007.04.012, 2007.
Stedmon, C. A. and Bro, R.: Characterizing dissolved organic matter fluorescence with parallel factor analysis: a tutorial, Limnol. Oceanogr.-Meth., 6, 572–579, https://doi.org/10.4319/lom.2008.6.572, 2008.
Stedmon, C. A. and Nelson, N. B.: The optical properties of DOM in the ocean, in: Biogeochemistry of marine dissolved organic matter, Academic Press, Elsevier, 481–508, https://doi.org/10.1016/B978-0-12-405940-5.00010-8, 2015.
Stedmon, C. A., Markager, S., and Bro, R.: Tracing dissolved organic matter in aquatic environments using a new approach to fluorescence spectroscopy, Mar. Chem., 82, 239–254, https://doi.org/10.1016/S0304-4203(03)00072-0, 2003.
Tanoue, E.: Vertical distribution of dissolved organic carbon in the North Pacific as determined by the high-temperature catalytic oxidation method, Earth Planet. Sc. Lett., 111, 201–216, https://doi.org/10.1016/0012-821X(92)90179-Y, 1992.
Vines, M. and Terry, L. G.: Evaluation of the biodegradability of fluorescent dissolved organic matter via biological filtration, AWWA Water Science, 2, e1201, https://doi.org/10.1002/aws2.1201, 2020.
Wang, Y., Wang, Y., Ge, H., Liu, B., Wu, J., Han, L., Liu, Y., Yu, J., and Xu, Y.: Optical characterization of dissolved organic matter in Kuroshio-Oyashio confluence region: Implication for water mass mixing, Deep-Sea Res. Pt. I, 185, 103807, https://doi.org/10.1016/j.dsr.2022.103807, 2022.
Yamashita, Y. and Tanoue, E.: Production of bio-refractory fluorescent dissolved organic matter in the ocean interior, Nat. Geosci., 1, 579–582, https://doi.org/10.1038/ngeo279, 2008.
Yamashita, Y. and Tanoue, E.: Basin scale distribution of chromophoric dissolved organic matter in the Pacific Ocean, Limnol. Oceanogr., 54, 598–609, https://doi.org/10.4319/lo.2009.54.2.0598, 2009.
Yamashita, Y., Tosaka, T., Bamba, R., Kamezaki, R., Goto, S., Nishioka, J., Yasuda, I., Hirawake, T., Oida, J., and Obata, H.: Widespread distribution of allochthonous fluorescent dissolved organic matter in the intermediate water of the North Pacific, Prog. Oceanogr., 191, 102510, https://doi.org/10.1016/j.pocean.2020.102510, 2021.
Zepp, R. G., Sheldon, W. M., and Moran, M. A.: Dissolved organic fluorophores in southeastern US coastal waters: correction method for eliminating Rayleigh and Raman scattering peaks in excitation–emission matrices, Mar. Chem., 89, 15–36, https://doi.org/10.1016/j.marchem.2004.02.006, 2004.