the Creative Commons Attribution 4.0 License.
the Creative Commons Attribution 4.0 License.
 | 25 Sep 2025
Multidecadal trends in CO2 evasion and aquatic metabolism in a large temperate river
Gwenaël Abril
Jacob S. Diamond
Raphaël Lamouroux
Cécile Martinet
Florentina Moatar
Rivers play a critical role in the global carbon cycle. However, the environmental and hydro-climatic factors that control the direction and magnitude of river CO2 fluxes across seasons and multidecadal periods are poorly constrained. The origin of excess river CO2 – delivered by soils, wetlands and groundwater or produced by aquatic respiration of organic matter – remains an important unknown in linking terrestrial and aquatic carbon budgets. To address these knowledge gaps, we report on a 32-year high-frequency dataset (1990–2021) from the Loire River, a large, temperate river that underwent a shift from a phytoplankton-dominated regime to a macrophyte-dominated regime around 2005. We estimated daily river-atmosphere CO2 flux (FCO2) and river net ecosystem productivity (NEP) from hourly pH, alkalinity, dissolved oxygen, water temperature and solar radiation. We demonstrate that: (i) annual FCO2 varied an order of magnitude among years (range = 200–2600 g C m2 yr−1) with a long-term decrease trend, mainly linked to decreased groundwater contribution; (ii) the mean annual contribution of internal CO2 production from net ecosystem respiration to total FCO2 was 40 %, increasing from 37±27 % in phytoplankton-dominated regime to 57±10 % in macrophyte-dominated regime; (iii) while the river predominantly acted as a CO2 source, it occasionally functioned as a CO2 sink (FCO2<0) during summer, though this sink behavior constituted a minor component (−0.6 %) of the FCO2 budget; and (iv) FCO2 exhibited strong seasonality linked to discharge, exhibiting hysteresis where FCO2 levels at equivalent discharge were 1.5 to 2 times higher during the rising limb (autumn) compared to the falling limb (spring). The magnitude of this hysteresis diminished in the later macrophyte-dominated regime, indicating a reduced seasonal control by discharge on FCO2. This study demonstrates that river FCO2 and its source are dynamic within and across years, driven by hydro-climatic variations and biological activity. Catchment-scale hydrogeological changes (including groundwater and surface water interactions) can be a more dominant driver of long-term riverine CO2 evasion than in-stream ecological regime shifts (transitions from phytoplankton-dominated to macrophyte-dominated communities), controlling the balance between internal and external CO2 production.
- Article
(11677 KB) - Full-text XML
-
Supplement
(1422 KB) - BibTeX
- EndNote


Streams and rivers are a major component of inland water CO2 evasion, with the most recent estimates for this flux at 2.0±0.2 Pg C yr−1 (Liu et al., 2022). Earlier foundational work suggested this riverine flux accounted for approximately 60 % of all inland waters (Raymond et al., 2013). Most CO2 flux (FCO2) is often assumed to come from “external” sources, delivered to streams via groundwater inputs, surface and subsurface runoff, and via temporary hydrologic connectivity with riparian wetlands (Abril and Borges, 2019; Hotchkiss et al., 2015). Additionally, geochemical weathering and photochemical processes are also considered external sources to river FCO2 (Hotchkiss et al., 2015). While geochemical weathering primarily affects river alkalinity and indirectly influences CO2 dynamics through changes in water chemistry (Jones et al., 2003), photochemical processes make a relatively minor contribution to CO2 production when compared to biological processes (Amaral et al., 2013; Koehler et al., 2014). The remainder of FCO2 from rivers originates from in-stream respiration of organic matter (Cole et al., 2001), termed the “internal” source of CO2. While the balance between internal versus external CO2 sources is spatially predictable (Hotchkiss et al., 2015), its temporal variation is less clear. Most analyses on the origin of stream FCO2 occur over one season (e.g., Bernal et al., 2022; Rocher-Ros et al., 2020) or rely on discrete samplings (e.g., Hotchkiss et al., 2015). Consequently, while progress has been made, a comprehensive understanding of the full spectrum of temporal variability (seasonal to multidecadal) in FCO2 and its sources remains limited, particularly for large river systems. Recent work by Young et al. (2025) highlighted this complexity by documenting strong seasonal variability driven by hydrological events, temperature fluctuations, and biological productivity in a temperate river. Their four-year study emphasized the need for longer-term datasets to capture interannual variability, particularly in the context of ongoing climate and ecological changes. The seasonal hydrology plays an important role in determining the magnitude and timing of CO2 emissions from rivers, as changes in flow rates affect the transport of nutrient, organic carbon from surrounding land as input for stream metabolism and the exchange of CO2 between the river and the atmosphere (Cole et al., 2007; Hotchkiss et al., 2015). There is thus a lack of understanding of the temporal variability of FCO2 and its sources, which are becoming increasingly crucial under a changing climate that increases water temperature and modifies river flow (Floury et al., 2012; Van Vliet et al., 2013). This knowledge gap is most prominent in large rivers, leading to significant uncertainty in global FCO2 assessment from inland waters (Battin et al., 2023; Hotchkiss et al., 2015).
The relative contribution of internal CO2 sources can be quantified as the ratio between net ecosystem productivity (NEP) and FCO2. NEP is the balance between gross primary production (GPP) and ecosystem respiration (ER) (NEP = GPP − ER). When NEP is negative (GPP < ER), the river is in a “heterotrophic” state, and CO2 is added to the water column by net organic matter respiration. Assuming the river is a CO2 source (FCO2>0) and in a heterotrophic state, the −NEP FCO2 ratio yields the ratio of internal source contribution to total emissions, and by difference, the ratio of external CO2 source contribution (). This ratio can be evaluated in response to environmental drivers such as hydrology (Hotchkiss et al., 2015), light (Rocher-Ros et al., 2021), water temperature (Lynch et al., 2010; Wallin et al., 2020), and organic matter source (Bernal et al., 2022; Reed et al., 2021). However, rivers are not always CO2 sources and can seasonally function as CO2 sinks when high rates of GPP deplete CO2, leading to CO2 undersaturation (Aho et al., 2021; Zhang et al., 2017). In this “autotrophic” state (GPP > ER), positive NEP means a net production of organic matter within the reach, leading to increases in biomass (e.g., algal, macrophyte) and potentially contributing to particulate and dissolved organic matter pools. Such an autotrophic state, sometimes leading to CO2 undersaturation, can be more prevalent or sustained in larger rivers due to factors like greater water residence times, increased light availability across wider channels, and potentially a greater buffering capacity against rapid changes in external CO2 inputs compared to smaller streams (Hotchkiss et al., 2015). However, these periods, especially if transient or occurring outside of typical low-flow summer conditions, can be missed FCO2 by sampling campaigns that are often infrequent or biased towards specific seasons, thus underestimating their occurrence and impact.
The eutrophic state was common in large rivers across Europe throughout the 1980s and 1990s, characterized by high nutrient concentrations and high chlorophyll a, leading to a net autotrophic state (Dodds and Smith, 2016). The Loire River (France) was one of the most eutrophic rivers in Europe at that time with total phosphorus (TP) concentrations frequently exceeding 0.2 mg P L−1 and chlorophyll a concentrations often surpassing 100 µg L−1, with summer peaks reaching over 200 µg L−1 (Minaudo et al., 2015; Moatar and Meybeck, 2005). Despite potential autotrophic dominance, the CO2 dynamics during these periods remain poorly documented due to the lack of comprehensive CO2 data, leaving a gap in our understanding of whether the river predominantly acted as a CO2 source or sink.
Following efforts to reduce nutrient inputs between the early 1990s and the mid-2000s, TP concentrations declined by approximately 50 %–70 %, and mean summer chlorophyll a concentrations decreased to <30 µg L−1 (Minaudo et al., 2015). The Loire River underwent ecological shifts from planktonic autotrophic communities dominated by phytoplankton to benthic communities dominated by rooted macrophytes (Minaudo et al., 2015), which is termed “re-oligotrophication” (Ibáñez et al., 2022). The ecosystem transition was followed by a delayed shift in the river's metabolic regime around 2012–2014, with GPP declining and NEP decreasing by roughly 10 % during the growing season from spring to summer (Diamond et al., 2022). As re-oligotrophication may become increasingly common in developed countries, its effects on FCO2 and CO2 source variation remain unknown.
In this study, we used a 32-year daily dataset of coupled stream metabolism (NEP) and FCO2 to assess the temporal internal/external CO2 source contributions in the Loire River. We hypothesized that the FCO2 and its internal source contribution would increase following the re-oligotrophication ecosystem shift. Specifically, we predicted that these increases would manifest coincidentally with the shifts from a phytoplankton to a macrophyte-dominated regime in 2005 and stream metabolism regime in 2012. Finally, discharge influences FCO2 through multiple mechanisms, including gas transfer velocity, delivery of external CO2, and inhibition of in-stream primary production. Phytoplankton GPP can be sensitive to discharge (e.g., washout, turbidity), while macrophyte GPP may be less directly flow-dependent (Diamond et al., 2022). We therefore predicted that the overall control of discharge (Q) on FCO2 would change with the shift to macrophyte dominance. Specifically, we anticipated that the seasonal hysteresis patterns observed in the FCO2-Q relationship (where FCO2 differs between rising and falling limbs of the hydrograph at similar Q) would be altered, potentially becoming less pronounced or showing a different shape if macrophyte GPP imparts a more stable baseline of CO2 uptake across varying flow conditions compared to phytoplankton. Besides, this study is complementary to a concurrent study by Diamond et al. (2025), which focuses on the river's internal biogeochemical mechanisms, including inorganic carbon uptake pathways and changes in the ecosystem quotient.
2.1 Study site
The study site (47.6° N, 2.6° E) is located in the middle Loire River, France, 564 km from the source, with a mean discharge of 300 m3 s−1 (Fig. S1 in the Supplement). Its 36 000 km2 catchment is home to over two million residents. The land cover consists of forests (42 %), pasture (35 %), and agriculture (21 %) (Moatar and Meybeck, 2005). The Loire River and its tributaries, upstream of Dampierre, drain volcanic, granitic areas and sedimentary basins characterized by extensive limestone and marl formations (Fig. S1). After the confluence with the Allier River (100 km upstream of the study site), the carbonate-rich catchment and its interaction with the Loire River significantly contribute to river alkalinity primarily through the dissolution of carbonate minerals (Binet et al., 2022). Soil types within the Loire catchment are heterogeneous and their nature is closely linked to the underlying lithology. In addition, the catchment includes significant areas of alluvial deposits, which feature more fertile and productive soils for extensive agriculture in the region (Moatar et al., 2022; Moatar and Meybeck, 2005). This river is an 8th-order river with an anabranching fluvial pattern resulting from a gentle slope (0.4 m km−1). During summer low flows (<150 m3 s−1), the study site is typically shallow (around 1 m deep) and wide (330 m); during winter, with higher discharges (e.g., >500 m3 s−1), depths can increase significantly, typically ranging from 2 to 3 m. The anabranching fluvial pattern leads to a broad range of lateral hydrologic connectivity between the main channel and secondary channels colonized by semi-terrestrial vegetation (Janssen et al., 2023). These vegetated side channels may behave like floodplains by acting as seasonal sources of organic carbon (Abril and Borges, 2019).
2.2 Data acquisition and processing
Hourly data of pH, temperature, electrical conductivity (EC) at 25 °C, and dissolved oxygen (DO) from 1990 to 2021 were extracted from the monitoring program conducted by Électricité de France (EDF) upstream and downstream of the nuclear power plant Dampierre (47.6° N, 2.6° E) (Fig. S2). Total alkalinity (TA) was obtained from grab samples collected by both EDF and the Loire-Brittany Water Agency (AELB), with measurement frequency ranging from daily to monthly. We reconstructed a continuous daily TA time series from the relationship between EC and TA (Appendix A, Fig. A2). This study used the upstream data to calculate daily FCO2 and NEP, while the downstream data were used to support the data cleaning procedure. A full description of the data acquisition, quality control framework, and data processing is available in Appendix A.
We obtained daily global radiation data (W m−2) from a nearby meteorological station (https://donneespubliques.meteofrance.fr/, last access: 15 April 2024). Mean daily discharge (m3 s−1) was obtained from https://www.hydro.eaufrance.fr/ (last access: 15 April 2024). We then estimated average river depth (m) using a local rating curve (Depth (m) ), which was established based on the hydraulic model for the Loire River (Camenen et al., 2016).
2.3 NEP and FCO2 estimation
2.3.1 Metabolism estimation
We estimated daily GPP, ER (g O2 m−2 d−1), and the gas transfer velocity coefficient (K600, d−1) by using a single-station, open-channel inverse modeling approach implemented with the streamMetabolizer R package (Appling et al., 2018). This Bayesian state-space modeling framework simultaneously estimates daily metabolism parameters (GPP, ER, and K600) by fitting modeled diel dissolved oxygen (DO) patterns to observed hourly DO concentrations based on inputs of hourly DO, solar radiation, and water temperature while explicitly accounting for both process and observation errors. To avoid unrealistic estimates and address the common issue of equifinality, where multiple combinations of ER and K600 can produce similar DO curves, the model constrains daily K600 estimates. The K600 is constrained by daily river discharge and river depth with the formulations proposed by Raymond et al. (2012). Model priors for K600 were derived from floating-dome and eddy-covariance measurements, and priors for GPP and ER were informed by previous metabolic studies in rivers (Diamond et al., 2021). The covariance between estimated ER and K600 was low (R2=0.09), demonstrating reduced influence of equifinality problem (Appling et al., 2018). The detailed model setup for the Loire River was described by Diamond et al. (2021, 2025).
GPP and ER were then converted to carbon units (g C m−2 d−1) using a fixed molar O2:C ratio of 1:1. This assumption is widely used in river metabolism studies and reflects the stoichiometry of aerobic metabolism (Trentman et al., 2023). Although photosynthetic and respiratory quotients (PQ and RQ) can vary with autotrophic community composition, recent long-term analysis of the Loire River by Diamond et al. (2025) showed that such variability does not lead to cumulative bias in net ecosystem production or CO2 budgets when integrated over decadal timescales. Therefore, we adopt this approach as a reasonable and conservative approximation for estimating long-term carbon dynamics, while acknowledging it as a source of short-term uncertainty.
About 12 % of samples (n=1391) were discarded due to physically impossible results in metabolism estimation (i.e., negative values). Missing mean daily GPP and ER were then replaced by their daily 75th estimated percentile values provided by streamMetabolizer, as detailed in Appendix B, Sect. B1. We imputed the remaining 1.7 % of missing data using the rolling 7 d average. The K600 values derived from the model were validated against established empirical equations and found to be of the same order of magnitude, as detailed in Appendix B, Sect. B2.
2.3.2 pCO2 and FCO2 estimation
Daily concentrations of partial pressure of CO2 (pCO2, µatm) were estimated by pyCO2SYS, a Python package for the CO2SYS model (Humphreys et al., 2022), using mean daily pH, water temperature, and TA. Carbonate dissociation constants K1 and K2 were chosen based on freshwater estimates (Millero, 1979). CO2SYS freshwater pCO2 estimates are valid for water with TA >1000 µmol L−1, and results have been previously validated for the Loire River (2 %–9 % bias) (Abril et al., 2015). The daily TA data in this study were estimated from daily EC with an average error of 190 µmol L−1, leading to an uncertainty in pCO2 estimation. PyCO2SYS can estimate pCO2 uncertainty by propagating the TA uncertainty (Humphreys et al., 2022). The uncertainty of estimated TA leads to ±11 % uncertainty in pCO2 estimation; however, there was no significant difference in the river's CO2 state over 32 years, as detailed in the uncertainty analysis in Appendix B, Sect. B3.
FCO2 (mmol C m−2 d−1) between the water and the atmosphere was calculated based on Fick's law, using the CO2 transfer velocity (kCO2, m d−1) and the air-water CO2 gradient (mmol m−3) (Eq. 1). We obtained kCO2 (Eq. 2) using Schmidt number (Sc) at given water temperature (Eq. 3) scaling from the gas transfer velocity k600 (m d−1) (Raymond et al., 2012). The k600 was calculated by multiplying river depth (m) by gas transfer velocity coefficient K600 (d−1). The k600 estimates, derived from K600 values output by the StreamMetabolizer model, were selected for FCO2 calculations to ensure consistency with the NEP calculations.
CO2,water is aqueous CO2 (mmol m−3) estimated by pyCO2SYS, and CO2,air is CO2 in equilibrium with the atmosphere using global monthly atmospheric CO2 from 1990–2021 from the NOAA Global Monitoring Laboratory (Lan et al., 2023) is the Schmidt number for CO2 (unitless), T is the water temperature in degrees Celsius (°C). We used Henry's law to convert pCO2 in µatm into CO2 in mmol m−3 using temperature-dependent solubility constants.
2.3.3 Categorizing NEP-FCO2 states by autotrophic/heterotrophic and source/sink states
We categorized the river into four trophic-flux states (or “trophlux” states) based on daily NEP and FCO2 (Diamond et al., 2025). Following Odum (1956), if NEP is positive (GPP > ER), the river is autotrophic, while if NEP is negative (GPP < ER), the river is heterotrophic. Likewise, if FCO2 is positive, the river is a CO2 source, while if FCO2 is negative, the river is a CO2 sink, relative to the atmosphere. The river could thus be in four possible trophlux states: (1) autotrophic-sink, (2) autotrophic-source, (3) heterotrophic-sink, and (4) heterotrophic-source. The autotrophic-sink and heterotrophic-source states imply that NEP and FCO2 vectors are moving CO2 in the same direction, into water column biomass or out of the water column, respectively (Bogard and Del Giorgio, 2016). The remaining two states imply opposite directions between NEP and FCO2. The autotrophic-source state implies that although there is a net conversion of CO2 into biomass, there is a surplus of water column CO2 relative to autotrophic needs, leading to continued positive FCO2. The heterotrophic-sink, a temporary condition likely caused by temporal lags in the carbonate system's buffering capacity during the shift between autotrophic and heterotrophic states, indicates net conversion of biomass into water column CO2, even CO2 remains undersaturated relative to the atmosphere, likely due to prior autotrophic uptake. Recent work using this dataset has provided strong evidence for this mechanism, showing that these events are temporary and typically follow periods of intense autotrophic activity (Diamond et al., 2025). A more detailed discussion of methodological considerations for this state is provided in Appendix B, Sect. B4.
Conventionally, the aquatic metabolism contribution to river CO2 emissions (i.e., the internal CO2 source) is calculated as −NEP FCO2 in the heterotrophic-source state (Bernal et al., 2022; Hotchkiss et al., 2015; Kirk and Cohen, 2023).
2.4 Change points and long-term trend analysis
To test our hypothesis that FCO2 would vary as a function of ecosystem state and metabolism shifts in the Loire River, we compared change points in FCO2 with previously estimated change points in ecosystem regime (ca. 2005) and metabolic regime (ca. 2012) (Diamond et al., 2022; Minaudo et al., 2015). We used the ruptures Python package (Truong et al., 2020) with a five-year window interval to ensure that identified changes were sustained beyond year-to-year variation. The change point detection was also applied to the daily NEP and related variables (pH, alkalinity, pCO2, k600, GPP, and ER). We also conducted change point detection on the seasonal decomposed time series of daily FCO2 and NEP. This decomposition, performed using the statsmodels Python package (Seabold and Perktold, 2010), separates a time series into trend, seasonal, and residual components, allowing us to specifically identify change points in the characteristics of the seasonal cycle (e.g., amplitude changes) independently of the long-term trend (Appendix C, Sect. C1). To quantitatively assess differences between change point periods, we performed non-parametric Kruskal-Wallis tests followed by post-hoc Mann-Whitney U tests (Appendix C, Sect. C2).
We further estimated long-term trends of FCO2 and NEP as functions of hydroclimatic conditions (discharge, water temperature) in each trophlux state by using the Mann-Kendall test (pyMannKendall Python package) (Hussain and Mahmud, 2019).
2.5 Seasonal hysteresis of NEP and FCO2 in response to discharge changes
To test the influence of discharge on CO2 emissions, we evaluated the hysteresis of mean daily FCO2 and NEP against mean daily discharge across the periods delineated by the change point analysis. We predicted that for the same discharge, FCO2 would exhibit a range of magnitudes depending on the season but that this range would decrease systematically as a function of decreasing phytoplankton coverage in the Loire River. We evaluated the hysteresis loops by the direction of hysteresis (clockwise or counterclockwise) and the magnitude (i.e., difference of FCO2 at the same discharge but in the rising and falling flow stage). We anticipated that the shift to a macrophyte-dominated regime, with potentially more stable GPP across flow conditions, might lead to a flattening or a reduction in the magnitude of these hysteresis loops for FCO2 and NEP. We additionally calculated hysteresis magnitude for −NEP, external source contribution (FCO2+ NEP), and −NEP FCO2 at the mean discharge (300 m3 s−1, Table 2) during the rising (autumn) and falling stage (spring).
3.1 Daily, seasonal, inter-annual FCO2 emissions and NEP contribution for 32 years
FCO2 and NEP exhibited strong daily, seasonal, and inter-annual variations (Fig. 1). The pronounced seasonal variability drove successive transitions among different trophlux states. Typically, the river would shift from being heterotrophic and a CO2 source in winter, towards becoming more autotrophic in spring and potentially a CO2 sink in summer during low flows, before returning to heterotrophic source conditions in autumn with rising flows. This general seasonal pattern, involving changes in both NEP (autotrophic/heterotrophic) and FCO2 (sink/source), recurred each year, though its specific timing and intensity varied (Fig. 1c). The corresponding hydro-climatic context, including mean annual discharge for each year, is provided in the Supplementary Information (Fig. S3) for a detailed comparison.
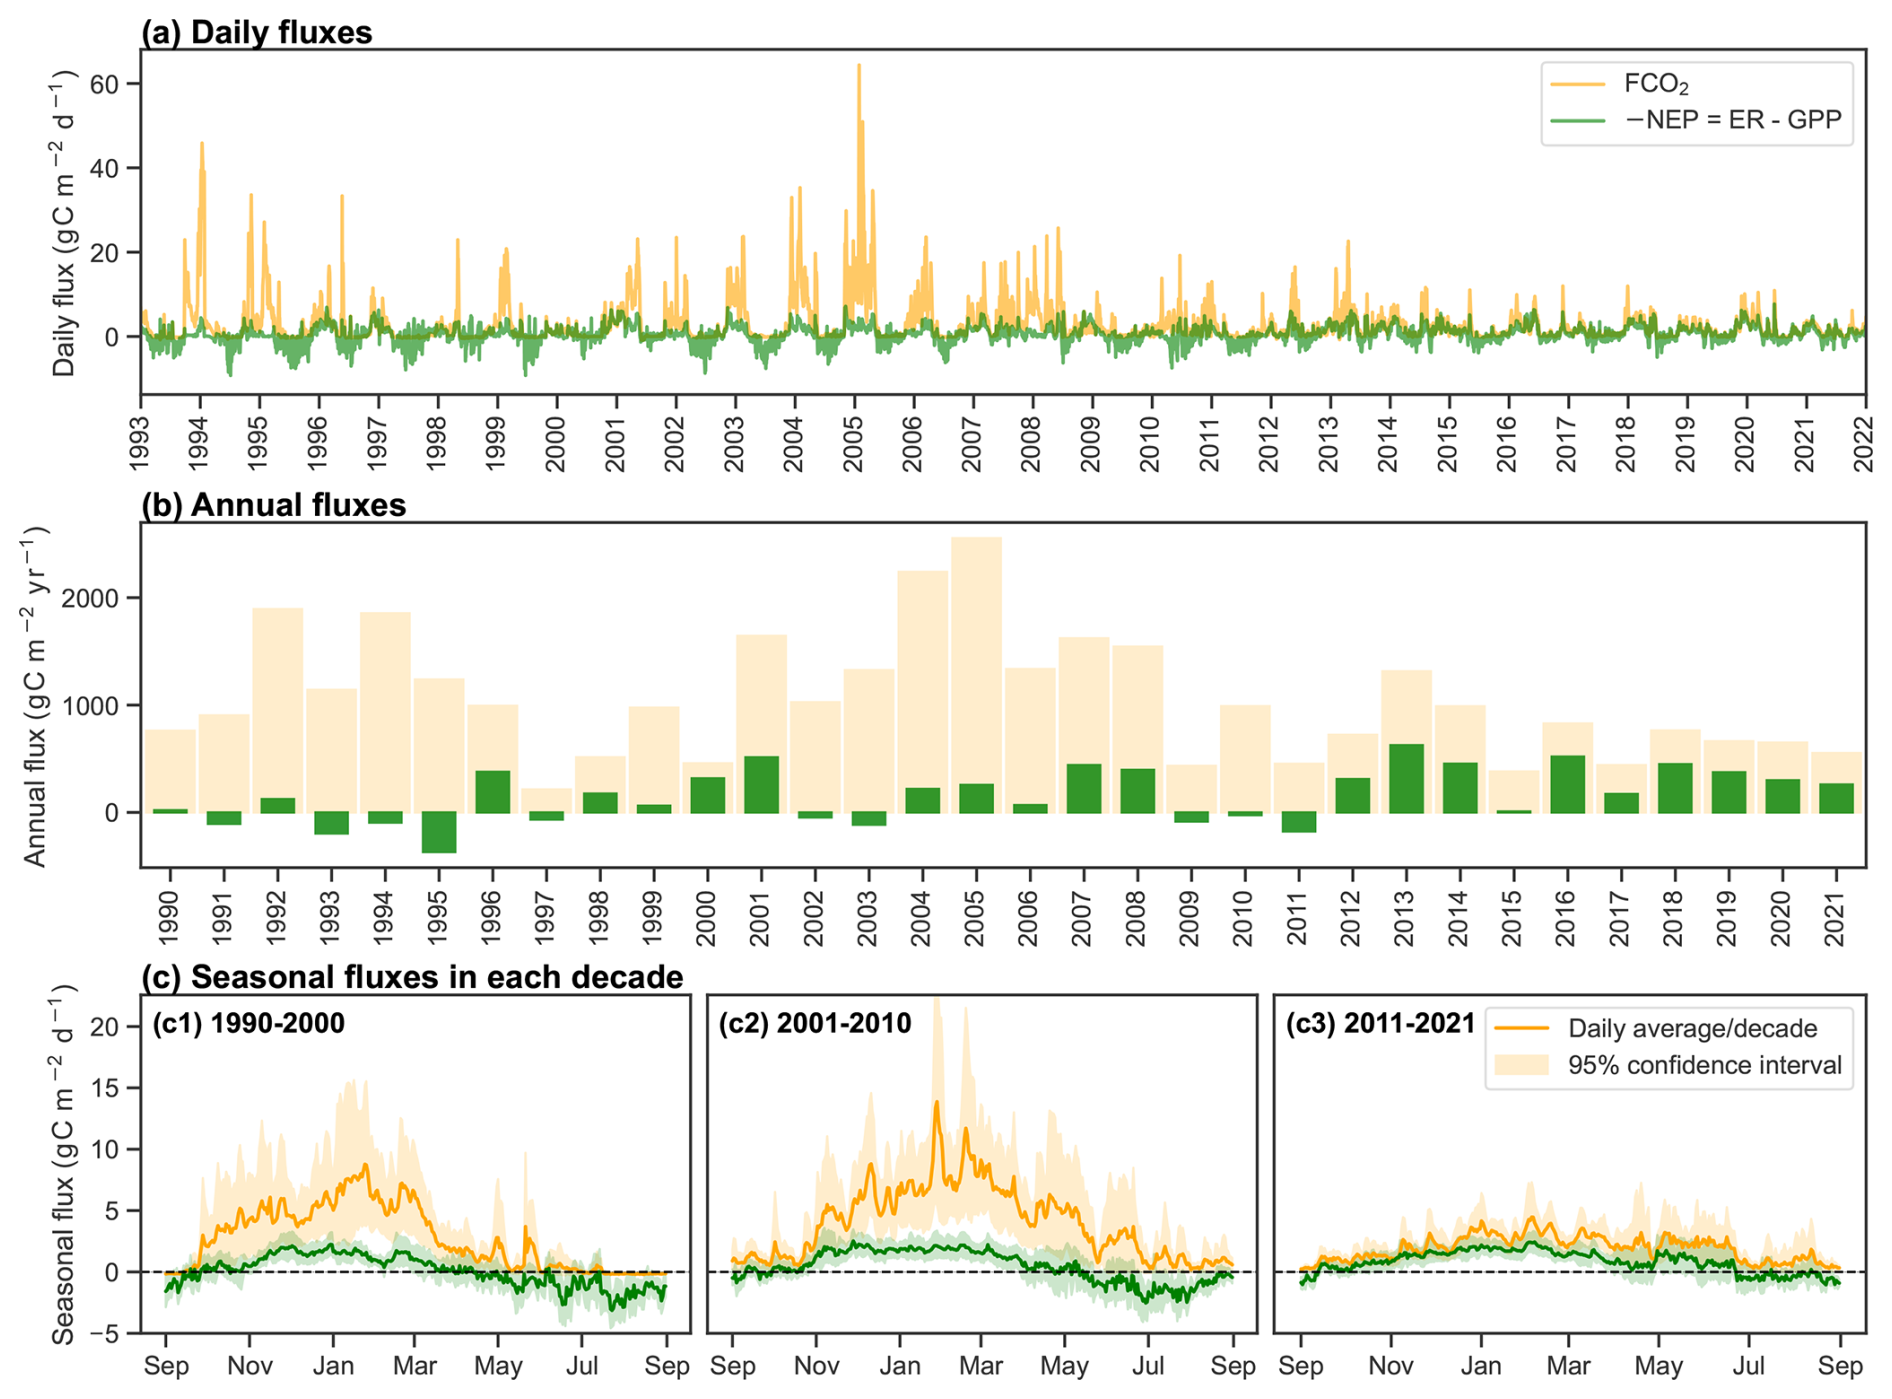
Figure 1Evolution of FCO2 and −NEP during 1990–2021. (a) Daily values (g C m−2 d−1), (b) Cumulative annual fluxes (calendar year, g C m−2 yr−1), (c) Seasonal fluxes during hydrological year in each decade 1990–2000, 2001–2010, 2011–2021. In Fig. 1c, the solid line and shaded area are the average and the 95 % confidence interval of the daily fluxes each decade, calculated by 10 daily fluxes in the same day-year.
The daily average FCO2 was 3 g C m−2 d−1, with high peaks reaching 20–60 g C m−2 d−1 during high flow in winter (1000–2000 m3 s−1) and low peaks with negative FCO2 of −0.8 g C m−2 d−1 during the low flow in summer (<150 m3 s−1) (Fig. 1). The daily NEP was −0.45 g C m−2 d−1, with average peaks from −4.0 g C m−2 d−1 in winter to 3.6 g C m−2 d−1 in summer (Fig. 1a).
Cumulative annual FCO2 ranged from 221 to 2633 g C m−2 yr−1 and NEP from −383 to 584 g C m−2 yr−1. Notably, the Loire River experienced several years of net autotrophic state (Fig. 1b, green bars), mainly in 1990–2000. Even during these years, the Loire River was a net source of CO2 to the atmosphere (Fig. 1b, grey bars). The contribution of external CO2 sources (FCO2+ NEP) ranged from 800–2400 g C m−2 yr−1 in 1990–2010. However, the contribution of external CO2 sources has significantly decreased to ca. 400 g C m−2 yr−1 since 2011 (Fig. 1b).
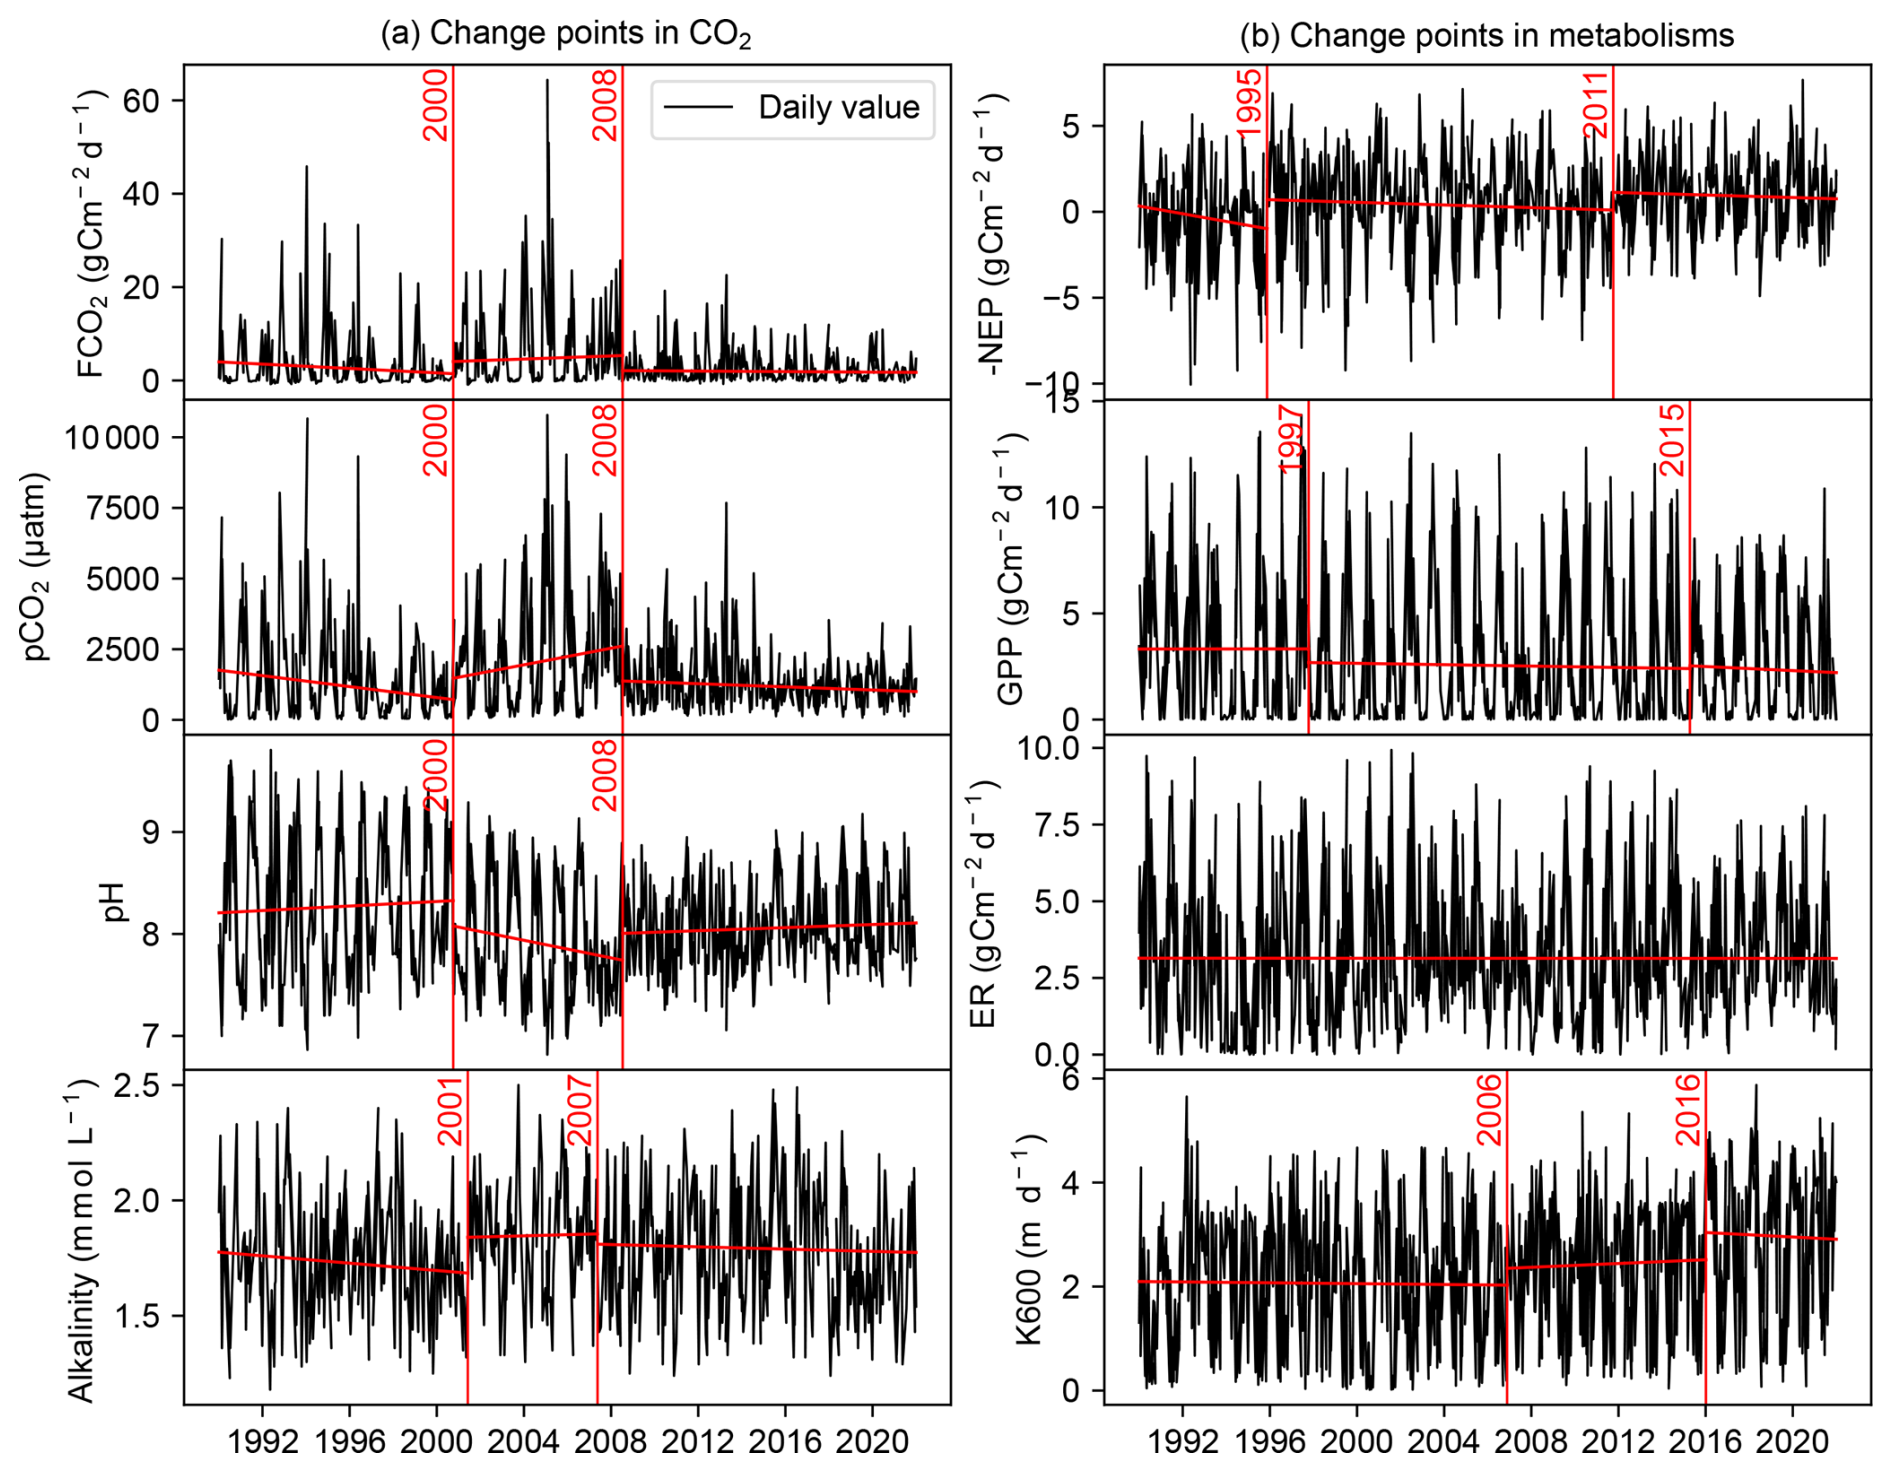
Figure 2Change point detection in the daily time series of (a) FCO2, pCO2, pH, alkalinity and (b) −NEP, k600, GPP, ER during 1990–2021. The vertical red lines indicate the year of the change point.
The change point analysis on daily time series detected that the FCO2 experienced two change points in 2000 and 2008 (Fig. 2a), while the change points of −NEP were detected in 1995 and 2011 (Fig. 2b). While change points in −NEP described a gradual increase, change points in FCO2 indicated more abrupt fluctuations, with abnormal decreases in 2000 and 2008. The daily time series of pCO2, pH, and alkalinity had similar change points to FCO2. The change points of −NEP were mainly dependent on GPP, while there was no significant change in the ER time series (Fig. 2b). In addition, the seasonal decomposition analysis detected the same change point in 2008 for the seasonal amplitude in both FCO2 and NEP, indicating a significant decrease in the seasonal variations (Fig. C1).
The periods of change in both FCO2 and NEP spanned roughly three decades: (i) 1990–2000, (ii) 2001–2010, and (iii) 2011–2021. These time frames were selected based on changepoint analysis, which identified shifts in FCO2 around 2000 and 2008, in NEP around 1995 and 2011, and GPP around 1997 and 2015 (Fig. 2). Despite some discrepancies in the exact timing of these changepoints between FCO2 and NEP, grouping the data by decades allowed for a coherent comparison of long-term trends in ecosystem behavior. These periods corresponded to distinct phases in river metabolism and CO2 emissions: (i) high primary productivity (cumulative annual GPP = 1113±225 g C m−2 yr−1, ER = 1136±241 g C m−2 yr−1) and low CO2 emission (FCO g C m−2 yr−1); (ii) reduced primary productivity (GPP = 973±292 g C m−2 yr−1, ER = 1136±128 g C m−2 yr−1) and high CO2 emission (FCO g C m−2 yr−1), and (iii) low primary productivity (GPP = 867±212 g C m−2 yr−1, ER = 1167±163 g C m−2 yr−1) and low CO2 emission (FCO g C m−2 yr−1).
3.2 Occurrence and contribution of trophlux states to CO2 emissions
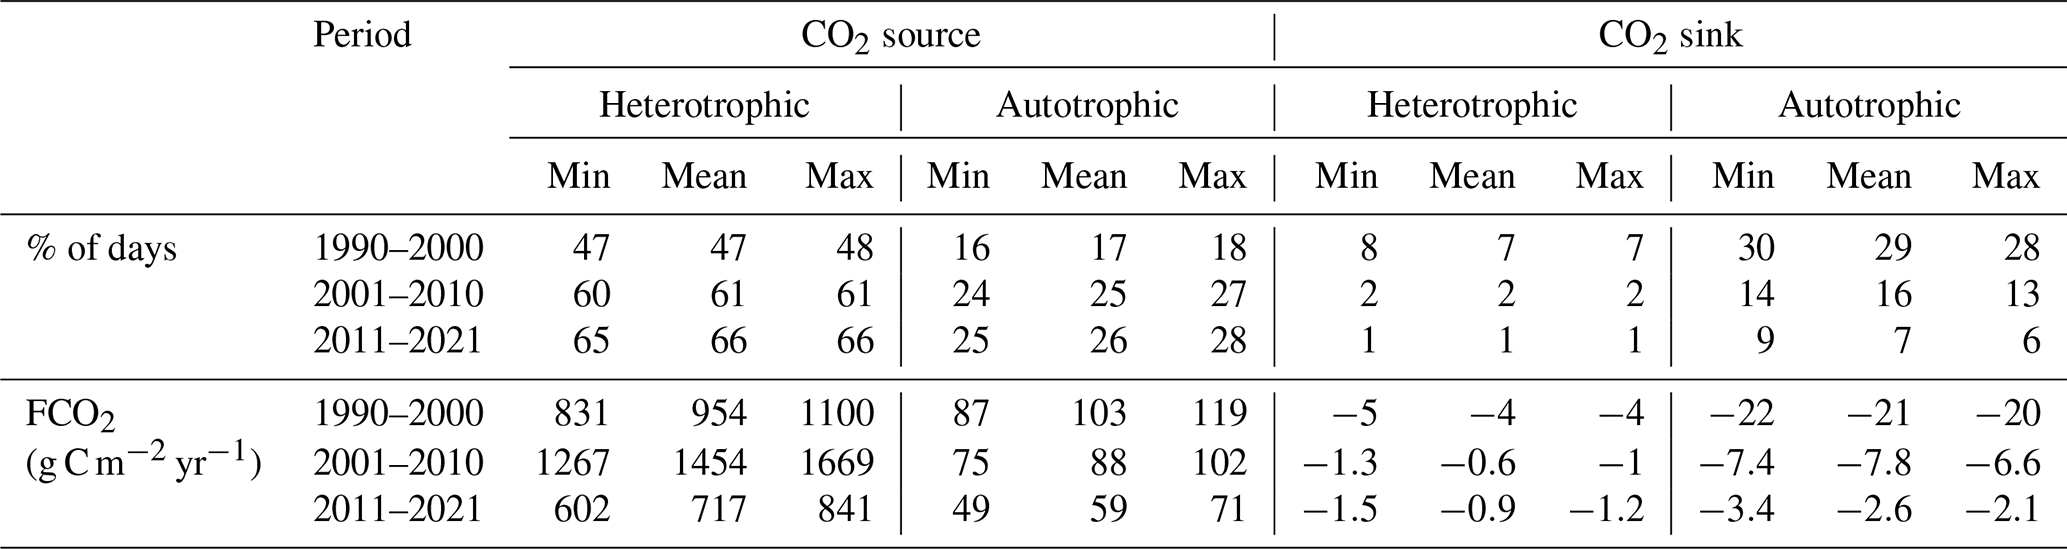
At the seasonal time scale, the Loire River varied among trophlux states, with the heterotrophic-source state predominating. The source state occurred the least (64 % of time) in the first decade delineated by change points (1990–2000) and occurred the most (92 % of time) in the most recent decade (2011–2021). Likewise, the heterotrophic state occurred at a minimum of 54 % and a maximum of 67 % of time during those decades, respectively. The joint occurrence of the heterotrophic-source state each year thus ranged from 47.3±9.4 % in 1990–2000 to 66.8±11.3 % in 2011–2021 (Table 1), coinciding with low water temperature and high discharge (Fig. C2). This state contributed more than 90 % of the total annual CO2 emissions. Within this heterotrophic-source state, the contribution of internal sources (−NEP FCO2) to total CO2 emissions varied across the decades: it was 37±27 % in 1990–2000, 28±9 % in 2001–2010, and increased to 57±10 % in 2011–2021 (Table 1). This implies that external CO2 sources, accounting for the remaining proportion in each period, have declined over time.
The remaining three trophlux states (autotrophic-source, autotrophic-sink, and heterotrophic-sink) had a combined net impact of less than 10 % on total FCO2 despite their regular occurrence (e.g., up to 50 % of time) during the 1990–2000 decade. The autotrophic-sink state, driven by high GPP, typically occurred for 1–3 months during the summer growing season, coinciding with the highest water temperatures and the lowest discharge (Table 1). The autotrophic-sink reduced annual FCO2 by % during 1990–2000 and by % in 2011–2021. In spring and autumn, the Loire River was regularly in an autotrophic state (17 % to 28 % of time) but remained a CO2 source, presumably attributed to external CO2 sources. This autotrophic-source state contributed 8.2 %–9.2 % to annual FCO2 across years. The heterotrophic-sink state occurred rarely (1 %–7 % of time) and had a small influence on the annual FCO2 budget (reducing it by 0.1 % to 0.8 % across the decades). This state typically occurred as relatively short events of 1–14 d from June to August during the transition from autotrophic-sink state or heterotrophic-source state.
Table 1Summary of the occurrence, fluxes, and related hydroclimatic conditions of each trophlux state in three decades, 1990–2021. The values within the table are depicted as the mean annual value ± standard deviation, calculated for each decade (N=10 or 11).
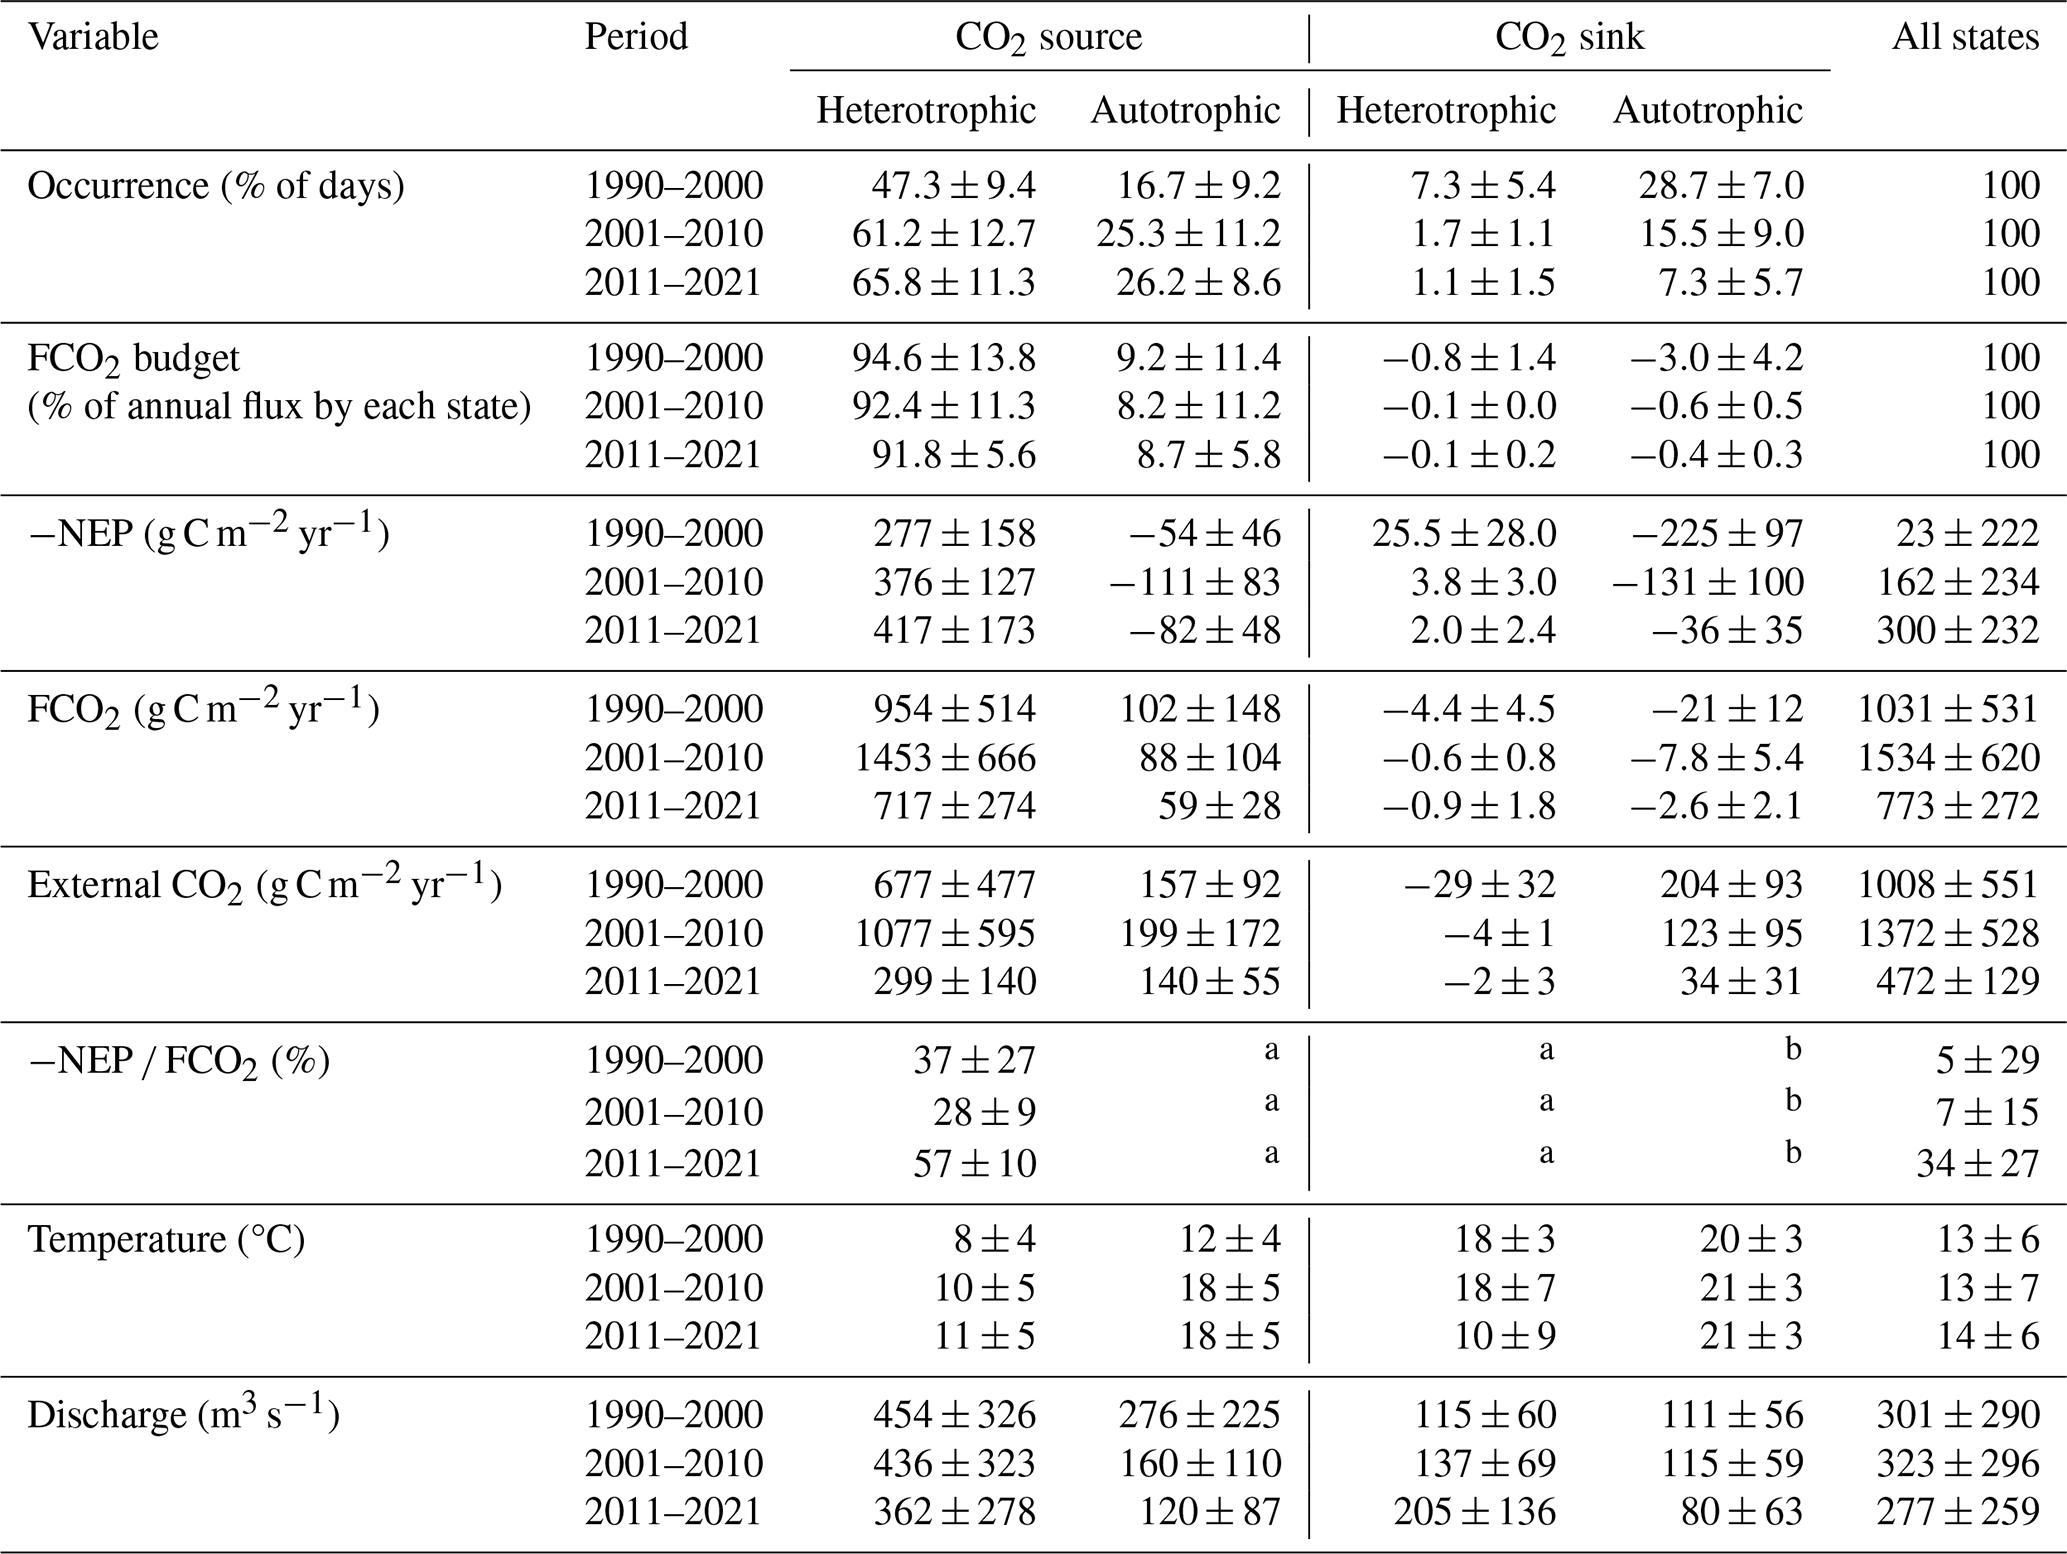
a Not applicable. In these cases, the −NEP FCO2 ratio does not represent a simple contribution of internal respiration to CO2 evasion and is therefore not reported. The mass balance for these states is presented in Fig. 5.
b Not Applicable. Internal metabolism consumes both external CO2 and the CO2 supplied from the atmosphere through the gas exchange at the air-water interface.
The external CO2 (g C m−2 yr−1) = FCO2 + NEP
3.3 The inter-annual trend of FCO2 depending on trophlux states
The occurrence of heterotrophic-source and autotrophic-sink and their contribution to FCO2 gradually changed from 1990 to 2021 (Fig. 3). The occurrence of the heterotrophic-source state increased from 140 d in 1990 to 250 d in 2021 (Fig. 3a). However, the annual flux of −NEP within this state remained relatively stable (Fig. 3b), while FCO2 decreased with an average rate of 0.16 g C m2 d−1 yr−1, resulting in a 62 % reduction of FCO2 in the heterotrophic-source state over the 32 years (Fig. 3d). The annual decline in FCO2 was uncorrelated (R2=0.09) with the increase in annual water temperature (+5.7 °C/32 years), but it was positively correlated (R2=0.36) with the decrease in annual discharge (−13 %/32 years) (Table D1). Since the annual −NEP remained stable and FCO2 decreased, the ratio of −NEP FCO2 thus increased from 20 %–40 % in the 1990s to 60 %–75 % in recent years, +1.25 % per year (Fig. 3f). There were some abnormal increases of −NEP FCO2 observed in 1995–2000, with the ratio reaching 100 % in 1997 and 90 % in 1996 and 2000. These peaks were associated with a significant drop in FCO2 (Fig. 3d) and, thus, in external CO2 sources (Fig. 3b).
The autotrophic-sink state occurrence decreased from 140 d in 1990–2000 to 30 d in recent years (Fig. 3a), following a reduction in +NEP from about 2 to 1.5 g C m−2 d−1 (−25 %/32 years), corresponding to −0.015 g C m2 d−1 yr−1 (Fig. 3b). In this state, annual discharge and temperature did not show significant changes (p>0.05) (Fig. 3c, e). The decrease in +NEP was not significantly correlated with either annual discharge (R2=0.03) or annual temperature (R2=0.00) (Table D2).
Regarding the other two trophlux states, the autotrophic-source state showed a significant increasing trend in occurrence, similar to the heterotrophic-source state (Fig. 3a). This state was also associated with increasing annual temperatures and decreasing annual discharge over time (Fig. 3c, e). However, unlike the heterotrophic-source state, there was no significant long-term trend in FCO2. In contrast, the heterotrophic-sink state existed rarely over the study period and showed no significant long-term trends due to its very infrequent occurrence.
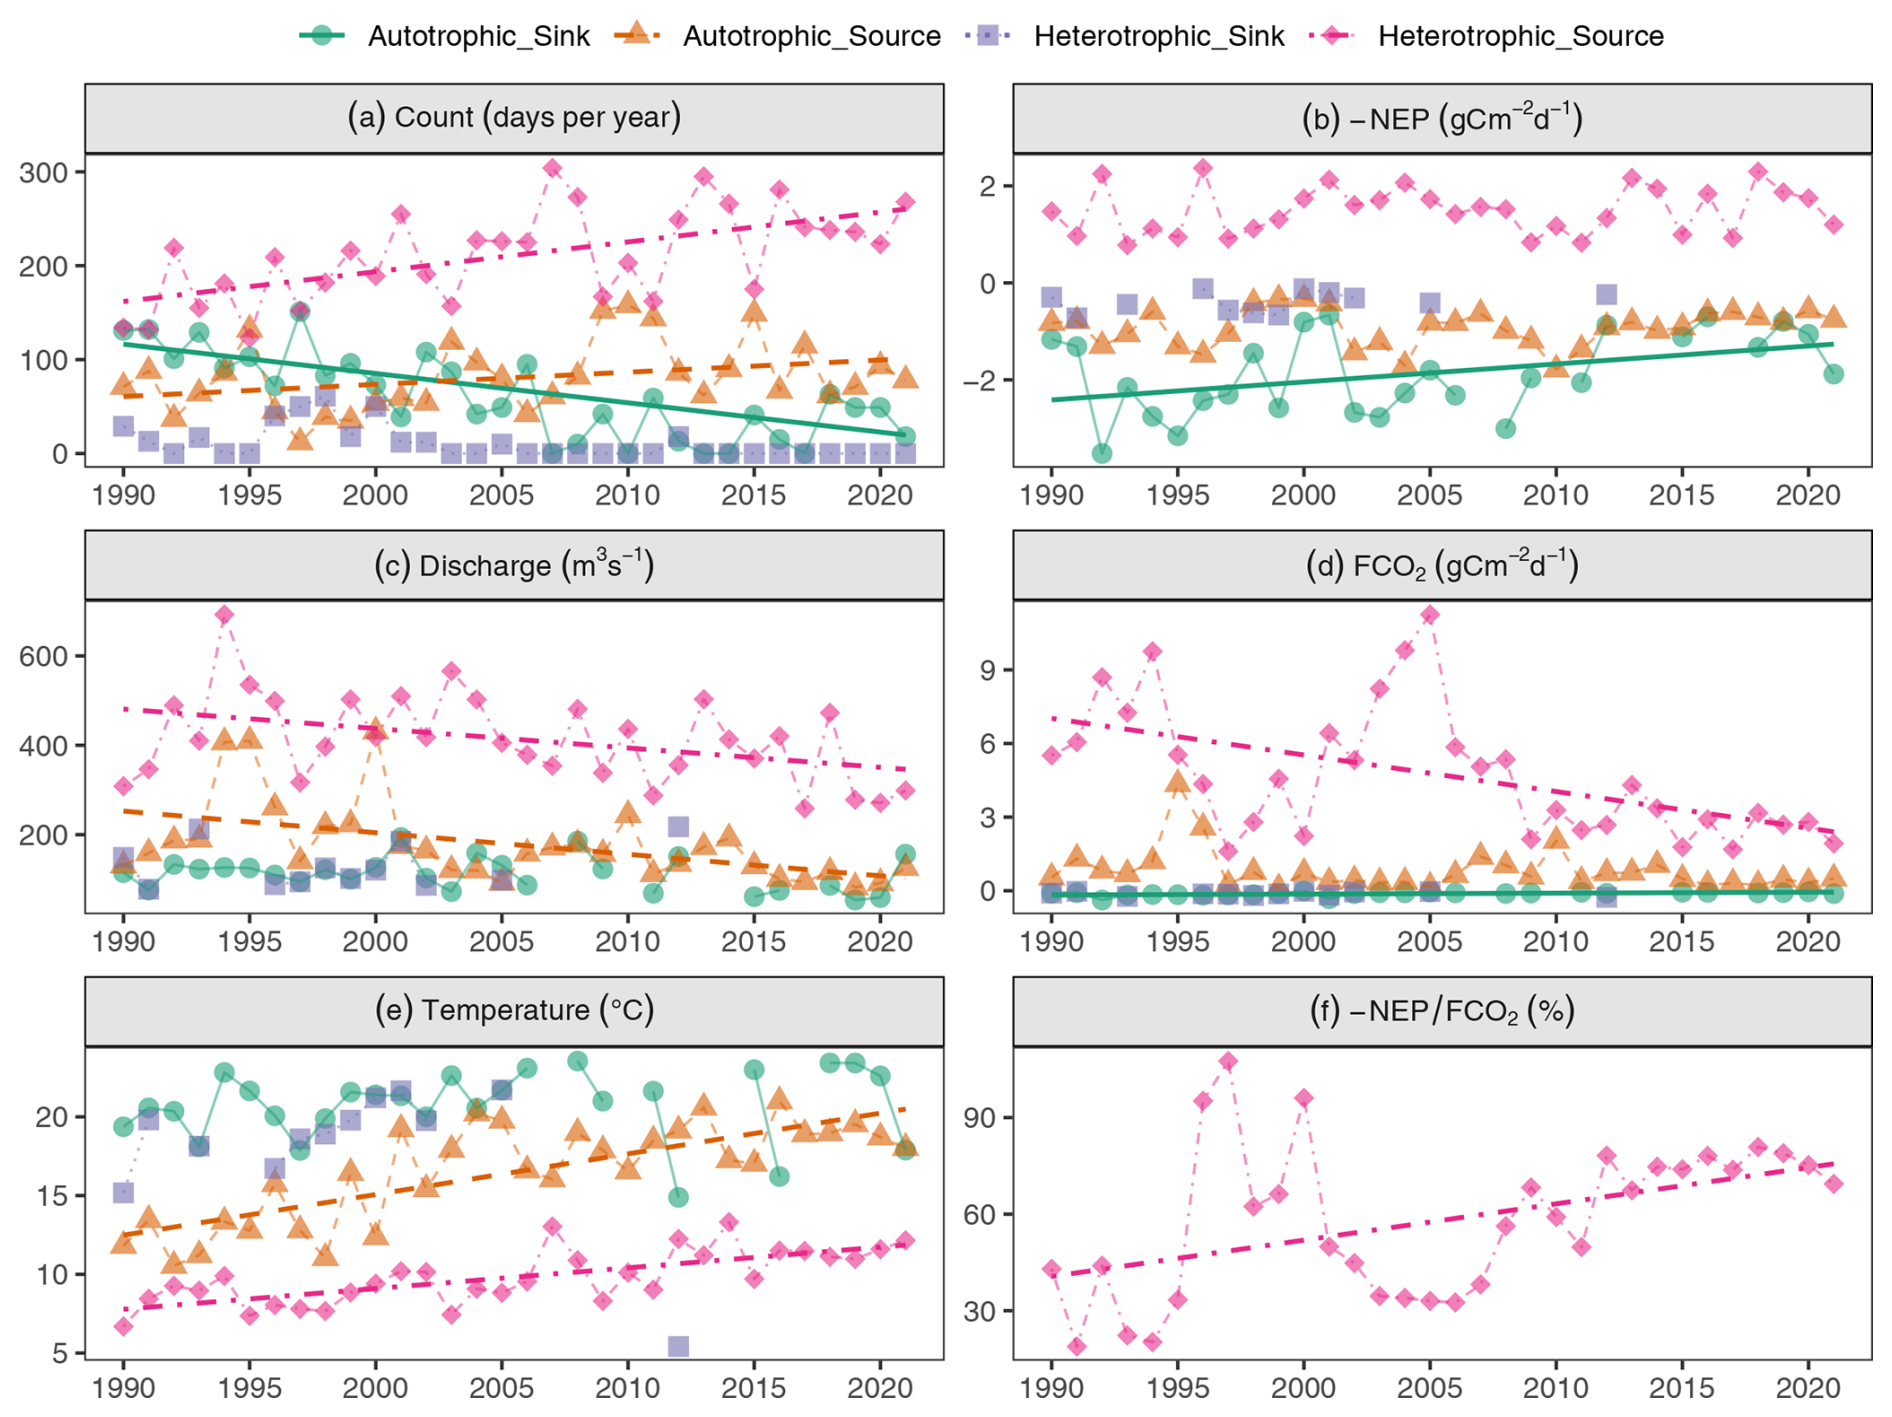
Figure 3Long-term trends over 32 years of CO2 fluxes, aquatic metabolism contribution, and hydroclimatic conditions on each trophlux state: (a) occurrence per year, (b) annual aquatic metabolism flux (−NEP), (c) annual discharge, (d) annual FCO2, (e) annual water temperature, (f) −NEP FCO2. The points depicted on the graph were the annual averages. The regression lines were the Theil-Sen slopes with significant trends (p value <0.05).
3.4 Seasonal hysteresis of NEP and FCO2 in relation to discharge
FCO2 and NEP exhibited a similar clockwise hysteresis pattern in response to seasonal variations of discharge, i.e., higher fluxes in the rising discharge stage compared to the falling stage (Fig. 4). Typically, hysteresis cycles started with FCO2 minima and NEP maxima in July and August (mean discharge <150 m3 s−1, mean temperature 23 °C), with opposite peaks in January and February (mean discharge >500 m3 s−1, mean temperature 5 °C) (Fig. 4a). As river discharge gradually increased from summer to winter, the river transitioned from an autotrophic to a heterotrophic state and from CO2 sink to source. Subsequently, but along a different trajectory, the river shifted back to an autotrophic state during the spring-summer falling discharge stage (150–300 m3 s−1). During this time, however, the river continued to act as a CO2 source, lasting two to three months (April–June) before returning to the FCO2 minimum again in summer. The contribution of external CO2 sources (FCO2+ NEP) also exhibited a clockwise hysteresis loop with discharge, with higher external contributions during the rising limb (autumn/winter) and lower contributions during the falling limb (spring) at equivalent discharge rates, generally mirroring the patterns observed for FCO2 and −NEP (Fig. 4, bottom row).
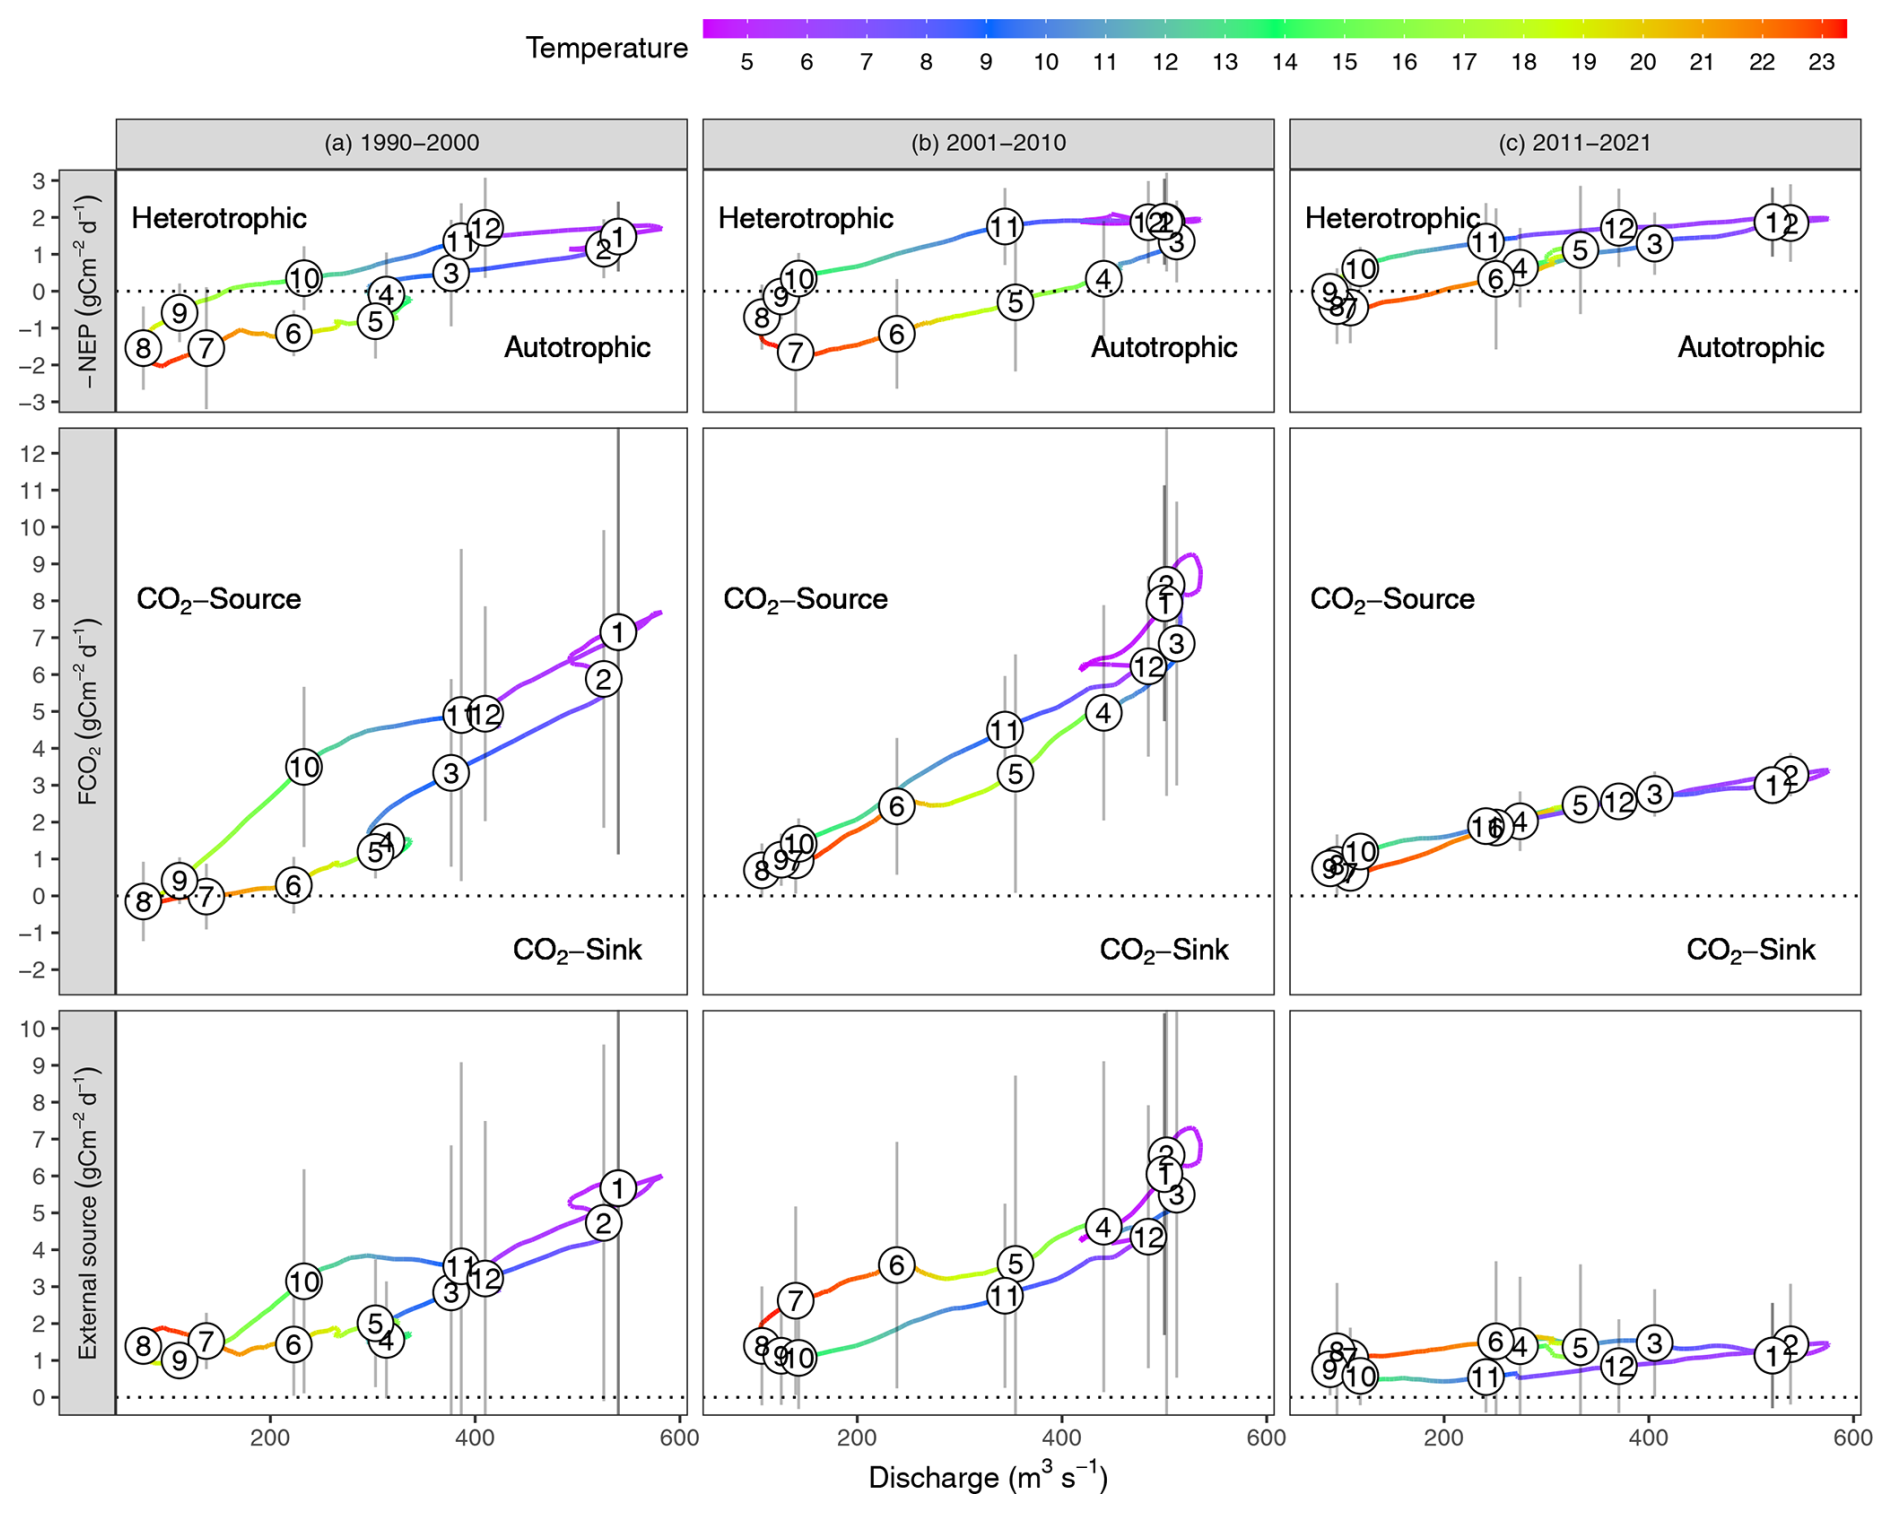
Figure 4Hysteresis loops of −NEP, FCO2, and external sources (FCO2+ NEP) during the hydrological cycle in each decade 1990–2000, 2001–2010, and 2011–2021. The color lines are the daily average fluxes in each decade. The circle shape with numbers is the monthly average and standard deviation fluxes in each decade.
The discharge trajectories of −NEP, FCO2, and external sources varied across the three decades delineated by the change point analysis. In three decades, all hysteresis loops exhibited positive relationships with discharge, except for the external CO2 sources in 2011–2021. FCO2 hysteresis magnitude at 300 m3 s−1 (autumn–spring) decreased from 3.2 g C m−2 d−1 in 1990–2000 to −0.09 g C m−2 d−1 in 2011–2021. The near-zero FCO2 hysteresis magnitude at 300 m3 s−1 in 2011–2021 (Table 2) indicates that FCO2 values at this discharge were very similar during both the rising (autumn) and falling (spring) limbs of the hydrograph. This reduction in the hysteresis loop area suggests that the relationship between FCO2 and discharge became less dependent on the seasonal progression of the hydrograph in recent years, making FCO2 at a given moderate discharge more predictable regardless of season. Likewise, the magnitude of −NEP hysteresis at 300 m3 s−1 was weakest in recent years (0.68 g C m−2 d−1), but unlike FCO2, it exhibited a peak (2.12 g C m−2 d−1) in 2001–2010 (Table 2).
The internal source contribution of FCO2 (−NEP FCO2) at 300 m3 s−1 between spring and autumn had contrasting ratios, with a positive CO2 contribution in autumn (14 %–34 %) but a negative contribution in spring (−26 %, i.e., CO2 consumption) in 1990–2000 and 2001–2010 (Table 2). In 2011–2021, internal source contributions of FCO2 in autumn and spring were both positive, 64 % and 34 %, respectively.
Table 2The mean ± standard deviation fluxes of daily −NEP, FCO2, external CO2, and −NEP FCO2 in spring and autumn at the mean river discharge of 300±30 (m3 s−1).
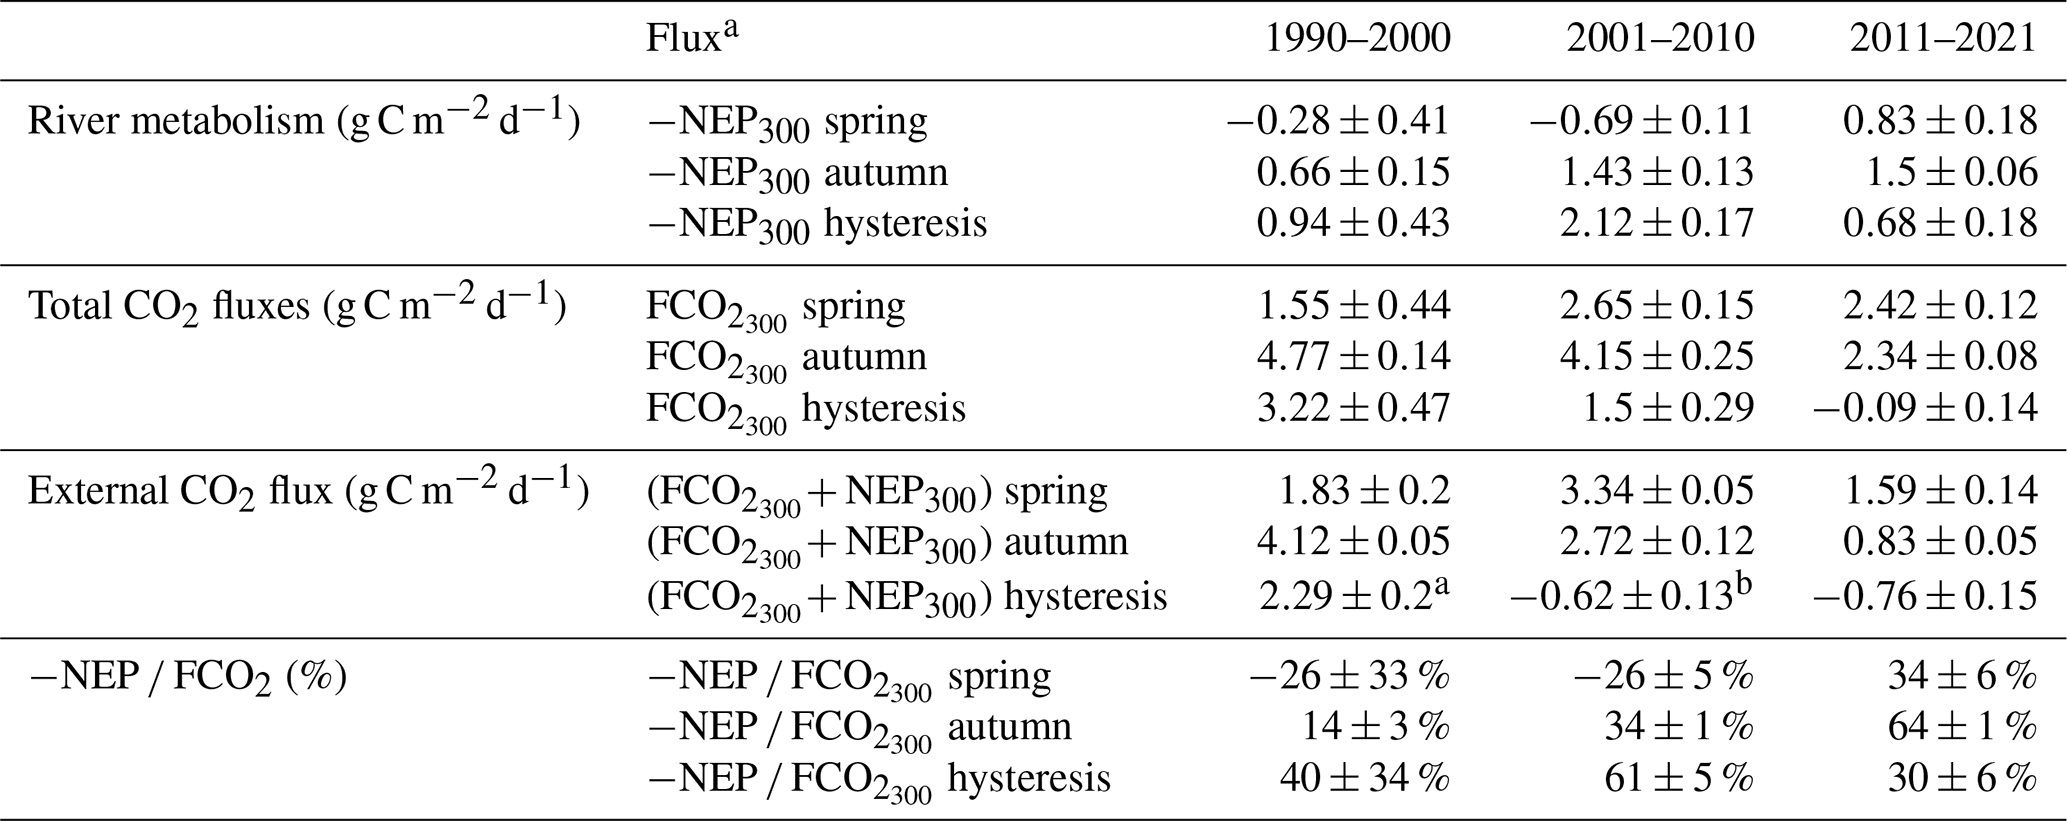
a The hysteresis flux is equal to the difference of flux in autumn and spring, i.e., , where the 300 subscript refers to the fact that these measurements are averages from mean discharge at 300 m3 s−1. b Negative hysteresis flux indicates lower flux in autumn (rising waters stage), i.e., .
Our data analysis reveals important long-term changes in carbon fluxes of the Loire River. Re-oligotrophication led to an increase in the contribution of internal source of FCO2, supporting our hypothesis but for reasons that ran counter to our predictions. Indeed, under oligotrophic conditions and macrophyte dominance, −NEP FCO2 increased by fourfold overall under the heterotrophic-source state, with −NEP contributing up to 75 % of FCO2 at the monitoring station during the last decade (Fig. 3). However, this change was largely due to decreases in total FCO2 rather than an increase in the magnitude of −NEP. While the magnitude of −NEP did not change notably, the CO2 consumption by the autotrophic state has significantly decreased in magnitude and duration over the recent decade (Fig. 3b), resulting in slight increases in annual cumulative −NEP. Instead, decreases in FCO2 appeared to be due to an approximate halving of external CO2 sources (Fig. 5). Still, the timing of FCO2 shifts, as detected by our change point analysis (ca. 2000 and 2010), broadly corresponded to our predictions based on previous studies (i.e., 2005 for trophic state change and 2012 for metabolism change), suggesting similar drivers of external and internal CO2. Finally, we observed clear support for our prediction of weaker discharge controls on FCO2 and −NEP FCO2 based on hysteresis analysis. However, this appeared to be most strongly due to a weakened discharge-external CO2 source link rather than a weakened discharge-internal CO2 source link.
4.1 Trophlux states and their contribution to CO2 emissions
Large river systems function predominately as a source of CO2 to the atmosphere (Battin et al., 2023; Butman and Raymond, 2011; Cole et al., 2007; Raymond et al., 2013; Abril and Borges, 2019), and CO2 sink states are rarely observed, even in large eutrophic rivers (Raymond et al., 1997). However, our unique dataset revealed the commonality of CO2 sink behavior in the Loire River and further highlighted the seasonal transitions among all four possible trophlux states and how these transitions varied annually and across decades (Figs. 1, 4).
This capacity for CO2 uptake distinguishes the Loire from other comparable river systems that consistently report persistent emissions. For example, the highly urbanized Seine River (France) has remained a persistent CO2 source since the 1970s; even during periods of intense phytoplankton blooms, in-stream respiration and high loads of organic matter from wastewater treatment plants (WWTPs) overwhelmed any photosynthetic CO2 drawdown (Marescaux et al., 2018). Similarly, studies of the eutrophic Han River in South Korea show that while high phytoplankton biomass can reduce CO2 concentrations, the system remains a net source due to the rapid mineralization of both algal- and wastewater-derived organic matter (Kim et al., 2021). This high rate of mineralization can even be amplified by synergistic interactions, where mixing different organic matter pools leads to greater CO2 production than expected (Begum et al., 2019).
Our finding challenges the conventional understanding of large rivers as persistent CO2 sources and demonstrates how ecosystem metabolism can fundamentally alter carbon cycling patterns. The frequency of CO2 sink conditions in the Loire River reveals an important but often overlooked aspect of river carbon budgets that may be significant for other large temperate systems undergoing similar environmental changes. Importantly, the transitions among these trophlux states are influenced by seasonal climatic drivers (temperature, solar radiation, discharge patterns, which themselves are subject to long-term climate change) and broader environmental changes like nutrient loading (e.g., re-oligotrophication) or external factors such as groundwater, making such long-term analyses critical for systems undergoing similar pressures.
We found that, regardless of the long-term trophic regime, the heterotrophic/source state was the most prevalent (47 %–66 % of time), while the autotrophic-source state occurred for approximately a quarter of the year (17 %–26 % of time) (Fig. 5). By contrast, the mean annual occurrence of the autotrophic-sink state depended strongly on the trophic conditions of the river, decreasing from 28.7±7.0 % of days in the eutrophic 1990–2000 period to 7.3±5.7 % in the oligotrophic 2011–2021 period (Table 1). This shift in trophlux state dominance reflects the ecosystem's response to re-oligotrophication (Diamond et al., 2022). Reduced nutrient availability, particularly phosphorus, directly restrained GPP more substantially than ER because ER is supported by both autochthonous organic matter (linked to GPP) and allochthonous inputs from the catchment. The declining prevalence of autotrophic-sink conditions indicates that the river's capacity to sequester atmospheric CO2 has diminished with the transition from phytoplankton to macrophyte dominance. This demonstrates long-term trophic shifts, such as re-oligotrophication, can fundamentally alter river carbon dynamics, affecting ecosystem metabolism and atmospheric CO2 exchange beyond mere adjustments in productivity rates.
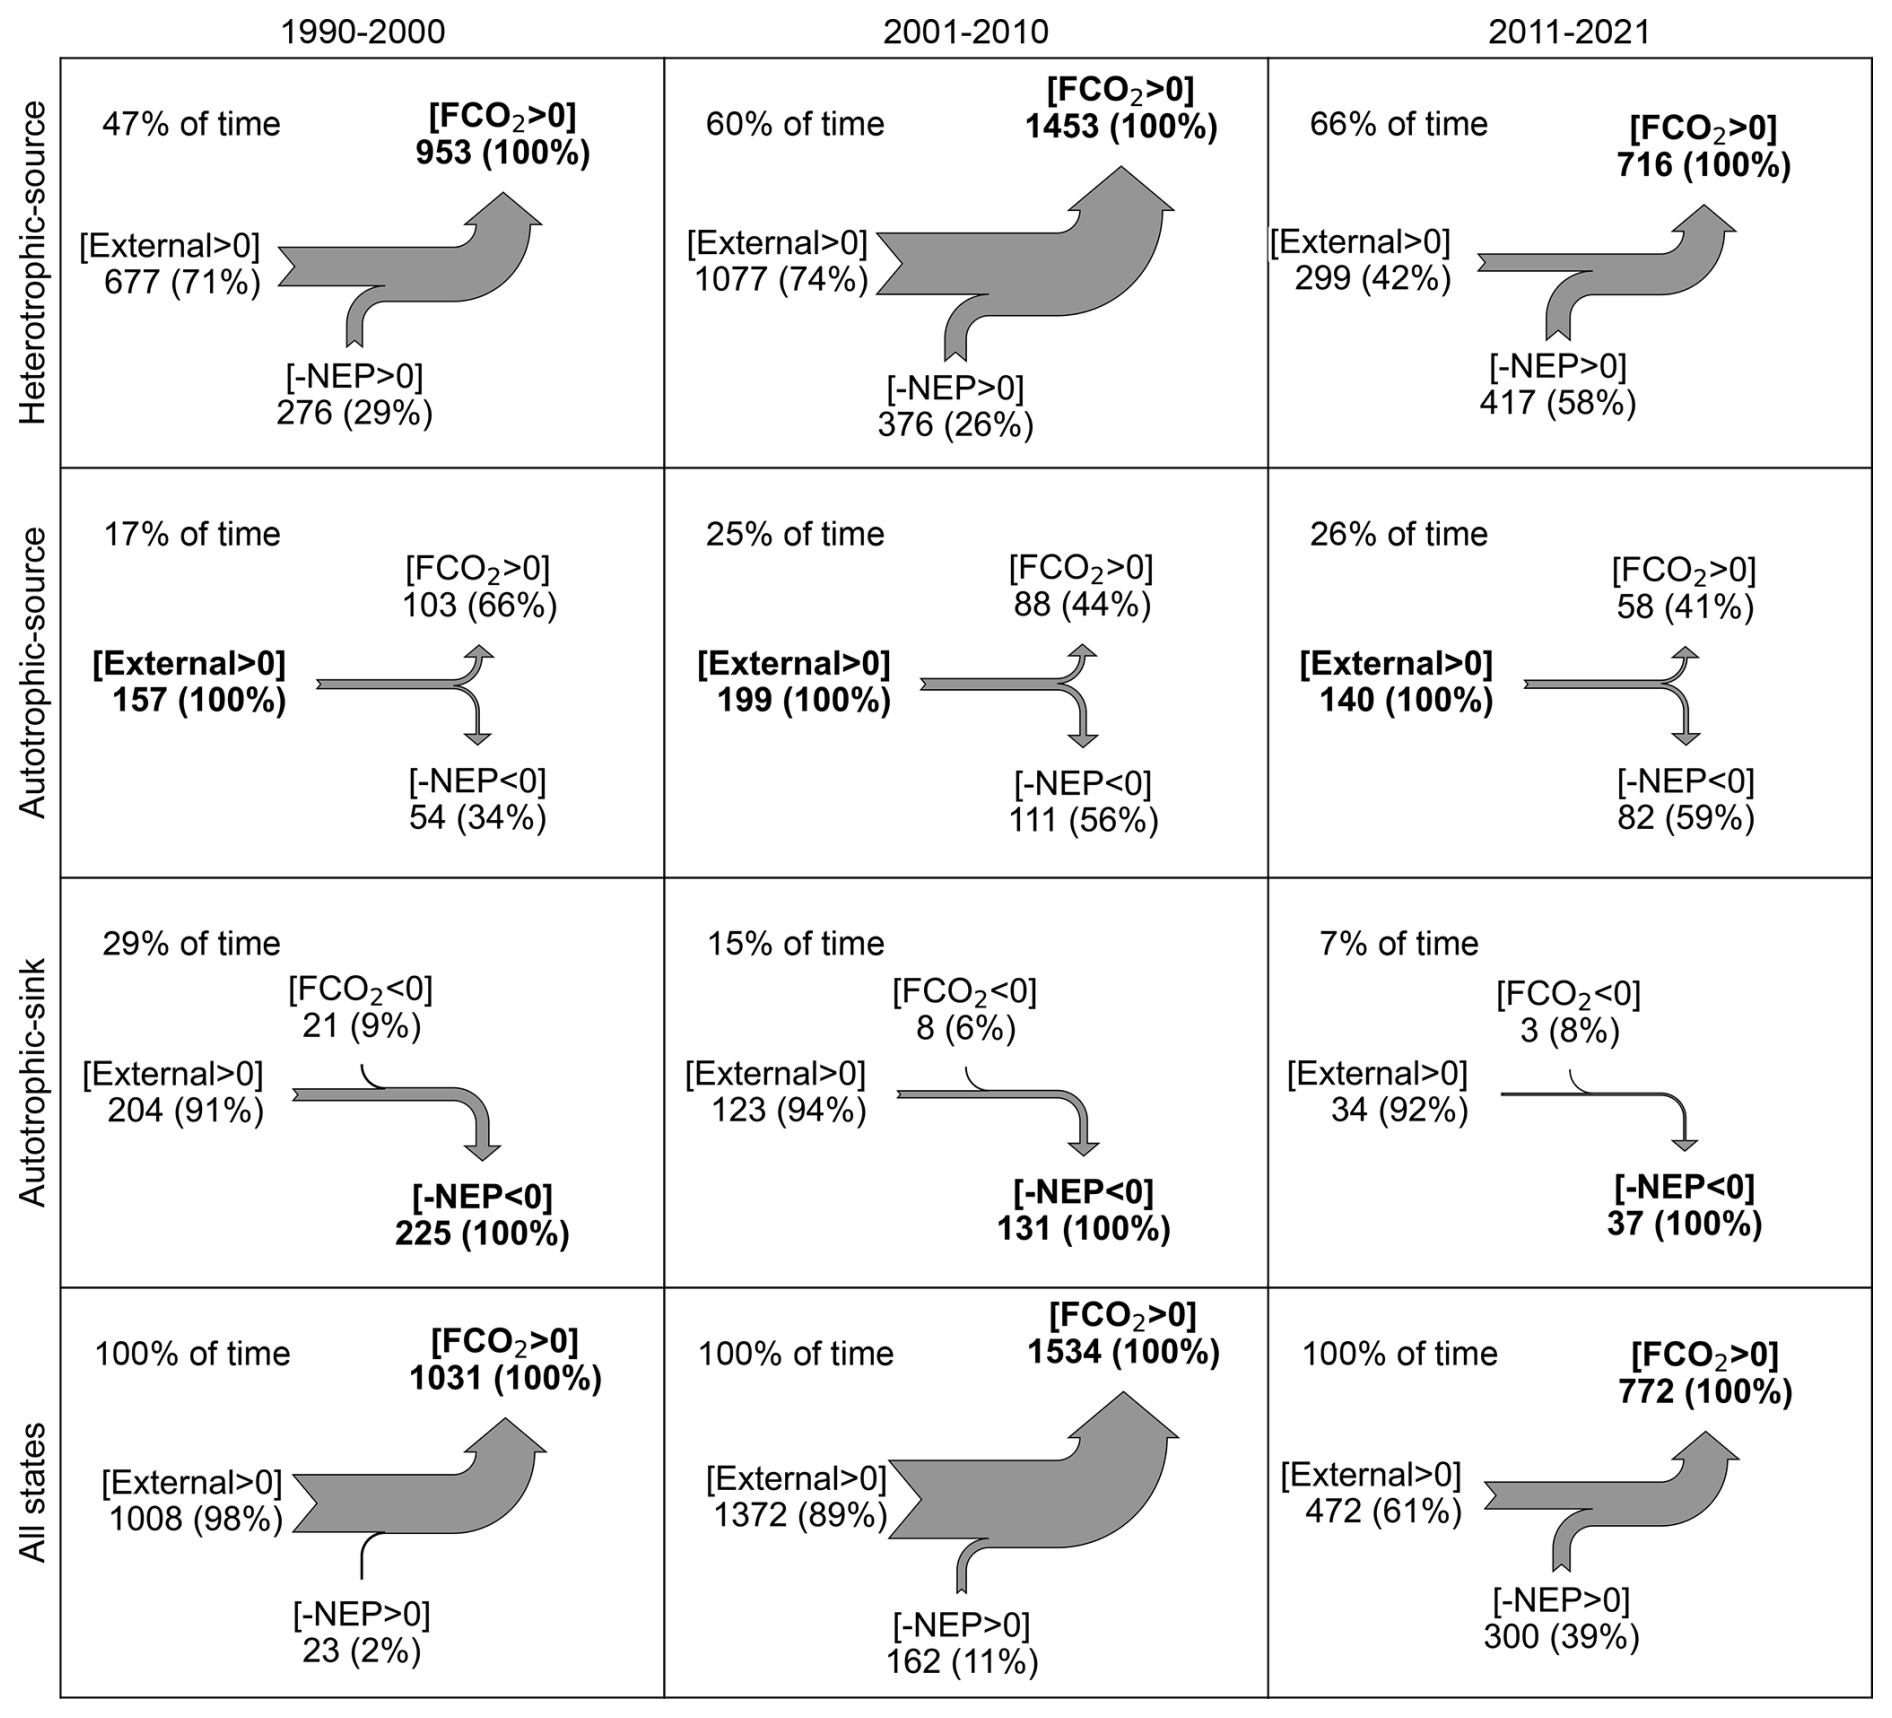
Figure 5Annual CO2 budget in three main trophlux states in 1990–2000, 2001–2010, and 2011–2021. All flux values are expressed in units of g C m−2 yr−1. The notation [FCO2>0] denotes CO2 emissions from rivers to the atmosphere, whereas [FCO2<0] signifies CO2 ingassing. The percentages in parentheses represent the proportion of each flux component, with the percentage calculated relative to the maximum flux component (shown in black bold).
4.2 Changes in CO2 sources in relation to hydrology and re-oligotrophication
This work provides a significant long-term perspective to our understanding of the contribution of internal and external sources to FCO2 in large rivers. Despite this decades-old research question (Cole et al., 2001), the capacity to quantify the relative strength of these two fluxes is relatively recent (Bernal et al., 2022; Hotchkiss et al., 2015; Kirk and Cohen, 2023), and data in mid-sized and large rivers are still limited. Utilizing a dataset comprising five rivers with mean discharge >100 m3 s−1, Hotchkiss et al. (2015) estimated an NEP of −0.51 to −1.01 g C m−2 d−1 and −NEP FCO2 of 25 % to 54 %. More recently, Solano et al. (2023) highlighted the vast range of this contribution, with values spanning from less than 10 % to over 100 %. Our results in the Loire River, which show strong seasonal variability in this metric, align with this broader context. This reinforces that within a single large river system, the contribution of internal metabolism to FCO2 can be highly dynamic, covering much of the spectrum reported across diverse global systems.
While the magnitude of discharge is a known control on CO2 dynamics, our results highlight that the seasonal timing and the rising or falling limb of the hydrograph are equally crucial for determining CO2 fluxes and sources, due to hysteresis effects. Depending on the season, our results caution that measurements at the same discharge may yield contrasting estimates of the internal source contribution (Table 2, Fig. 4). This difference was mainly explained by the difference in NEP magnitude and not by differences in FCO2. For example, at the same mean discharge, NEP in autumn during the rising stage was more negative, and the river was more heterotrophic than in spring during the falling stage. This difference was only partly explained by differences in daily temperature between the two seasons (R2=0.29, Fig. D1). First autumn floods are known to mobilize labile organic matter in temperate rivers, whose drying river beds in summer accumulate plant litter from riparian vegetation (Coynel et al., 2005; Etcheber et al., 2007). In the Middle Loire, the emergence of large, fertile riverbanks during the summer dry season may lead to organic matter deposition that is easily remobilized in autumn. Indeed, Minaudo et al. (2015) observed that the heterotrophy in the Middle Loire in autumn was strongly stimulated by a larger availability of biodegradable organic matter compared to spring. Such a seasonal hydrology-driven variability in river heterotrophy and associated CO2 dynamics was also recently observed by Young et al. (2025) in the Upper Clark Fork River, USA. They reported pronounced seasonal variation in FCO2 primarily linked to snowmelt-driven hydrological events mobilizing terrestrial carbon sources, reinforcing our observations that river CO2 dynamics are strongly shaped by seasonal hydrological connectivity and terrestrial organic matter inputs.
Notably, Fig. 4 reveals decadal changes in the magnitude of these hysteresis patterns. The FCO2 hysteresis magnitude at 300 m3 s−1 decreased dramatically from 3.2 g C m−2 d−1 in 1990–2000 to −0.09 g C m−2 d−1 in 2011–2021, indicating a weakening discharge-FCO2 relationship in recent years. Similarly, external source hysteresis (bottom row, Fig. 4) has flattened considerably in 2011–2021, suggesting diminished influence of terrestrial carbon inputs on seasonal CO2 dynamics. As these insights would have been invisible without a high-frequency long-term dataset (Fig. 1), we, therefore, encourage future efforts to capture seasonality and varying discharges in the measurement campaigns.
During the 1990–2000 decade, the Loire River acted as a CO2 sink for almost half the years due to high rates of GPP. The occurrence of this state has gradually declined over the three decades (Table 1), highlighting an important environmental trade-off where improved water quality from re-oligotrophication has diminished the river's capacity to act as a CO2 sink. In 1990–2000, the biogeochemical dynamics of the Loire River during the summer months coincided with long water residence times, shallow waters, low discharge, high water temperature, and high eutrophication (>200 µg chlorophyll a L−1) (Moatar et al., 1999, 2001). These conditions were similar to eutrophic lakes, which regularly act as CO2 sinks (Bogard and Del Giorgio, 2016; He et al., 2022). In addition, autotrophy can exert a stronger control on CO2 dynamics in larger rivers compared to small streams. This is due to factors such as increased light penetration across wider channels supporting higher areal GPP, and a larger water volume where internal metabolic signals may be less rapidly overwhelmed by the proportional influence of external CO2 inputs from groundwater or riparian zones (Hotchkiss et al., 2015). Our data show that in the Loire, the long-term shift from phytoplankton to macrophyte-dominance in 2005 has resulted in a reduction in the duration and magnitude of seasonal autotrophy and greater annual net heterotrophy. Diamond et al. (2021) showed that the changes in stream metabolism in the Loire River in 2010–2012 were related to the shift of other state variables in 2005 (turbidity, nutrient concentrations, Corbicula fluminea densities, and chlorophyll a), suggesting a decade lag for metabolism shift. Moreover, while annual water temperature increased (+0.18 °C per decade, +5.7 °C over 32 years) and annual river discharge decreased (−4 % per decade, −13 % over 32 years) (Fig. 3, Table D1), these hydroclimatic trends did not show a direct, strong correlation with the timing or magnitude of these decadal metabolic shifts (Fig. D2), suggesting that their manifestation on the magnitude of NEP is insignificant.
4.3 Long-term changes in the external CO2 source
Contrary to our expectations, we observed a decreasing trend of FCO2 attributable to an over 50 % reduction in external CO2 sources in the Loire River. This conclusion is supported by the key finding that, despite the overall decline in total FCO2, the relative contribution of internal CO2 production (−NEP FCO2 ratio) notably increased from an average of 37±27 % to 57±10 % (Table 1). The Loire River has indeed experienced dramatic reductions in anthropogenic inputs from urban wastewater treatment plants and agricultural runoff since the early 1990s. Total phosphorus inputs decreased 4-fold (Minaudo et al., 2015), and total organic carbon fluxes declined more than three times from the early 1990s to the 2010s (Minaudo et al., 2016). However, this decline in organic matter inputs cannot explain the observed decrease in FCO2, as heterotrophic respiration did not significantly change over the study period (Fig. 3b). Besides, a decrease in anthropogenic organic matter would theoretically lower internal CO2 production, reducing −NEP FCO2 ratio. As our observations indicate the opposite trend, the significant reduction in total FCO2 must therefore be predominantly driven by declines in external inorganic carbon inputs from groundwater.
At first glance, the reduction in external CO2 inputs appears to be due to overall reductions in discharge and the magnitude of lateral CO2 transport from groundwater and wetlands to the river (Abril and Borges, 2019). While our data show a modest long-term decline in total river discharge (∼ 13 % over 32 years), this alone is insufficient to explain the large reduction in external CO2 inputs (Figs. D1 and D2). Besides, the linkage between external CO2 and river discharge is more consistent with the seasonal variation (Figs. 4, D1) rather than the inter-annual variation (Fig. D2). In addition, while the discharge can explain ca. 37 %–48 % of the decay in FCO2, it only explains ca. 19 %–26 % of the variation in external CO2 source magnitude (Figs. D1 and D2). Similarly, in a forested sandy watershed, Deirmendjian and Abril (2018) reported that the export of CO2 flux from groundwater to the stream was independent of stream discharge and relatively constant seasonally. This can be explained by the fact that higher discharge periods in these systems are associated with low dissolved CO2 groundwater concentrations and vice-versa. Still, to explain the >500 g C m−2 yr−1 reduction in external CO2 between 2001–2010 and 2011–2021, it seems clear that some reduction in groundwater CO2 is occurring. This decrease in external inputs must be driven by either a decrease in the volume of contributing groundwater or a decrease in the CO2 concentration of that groundwater, or a combination of both.
In regions with carbonate bedrock, weathering of carbonate minerals can significantly contribute to the CO2 flux through the production of alkalinity (Vihermaa et al., 2014). Although this weathering reaction does not directly release CO2, it provides bicarbonate ions (HCO), which can equilibrate with CO2 and subsequently degas under certain conditions, influencing the CO2 flux observed in groundwater and rivers. Additionally, the transfer of CO2 to groundwater depends on the spatiotemporal connections between zones of maximal soil respiration and their intersection with the water table (Tsypin and Macpherson, 2012). If the water table remains disconnected from the topsoil where respiration is strongest, the transfer of soil CO2 to groundwater becomes limited. Trend analysis of the groundwater table in France over the past 30 years shows low-frequency variations of multi-annual (∼7 years) and decadal (∼17 years) cycles in groundwater level (Baulon et al., 2022). Further evidence from a representative local borehole at Montifault (20 km from our site) shows a clearly decreasing trend in the piezometric level since 2003 (Appendix D, Fig. D3). This regional decrease in groundwater levels supports a reduction in groundwater discharge to the river.
To further explore the potential drivers behind the inferred long-term decrease in external CO2 inputs, we analyzed available data of pH and TA during 1990–2021 from several groundwater monitoring stations situated in aquifers hydraulically connected to our study site. This analysis revealed a long-term increasing trend in groundwater pH, particularly after 2008, while groundwater TA remained relatively stable (Fig. D4). At stable alkalinity, an increase in pH directly corresponds to a decrease in pCO2. This inferred decline in groundwater pCO2 provides a strong, complementary mechanism explaining the observed reduction in external CO2 inputs to the river. Given the relative stability of in-river TA over the study period (Fig. 2), it is likely that these shifts in the carbonate system are driven by changes in CO2 supply rather than major changes in catchment-scale weathering rates. In addition, a study at a site located 20 km downstream from our study area in the Val d'Orléans fluviokarst aquifer reported that dissolved inorganic carbon flux from groundwater has decreased by about 20 % along with the decrease of groundwater level between 2000 and 2020 (Binet et al., 2022). Binet et al. (2022) also assessed that there was no significant change in the carbonate weathering rate at this aquifer, which is similar to the relatively stable alkalinity at the Loire River (Fig. 2). Together, the evidence for both reduced groundwater discharge and lower groundwater pCO2 provides a robust explanation for the observed multidecadal decline in external CO2 sources to the Loire River.
In the middle Loire River, three main trophlux states alternately occur in the hydrological year cycle, predominated by the heterotrophic-source state. The heterotrophic-source state contributes more than 90 % of annual CO2 emissions, with an average of 40 % from internal contribution (−NEP). Besides, in the 1990s, the autotrophic-sink state was still common; however, this state has gradually disappeared in recent years with the decline of phytoplankton, replaced by the dominance of macrophytes. Our analysis of seasonal hysteresis of NEP and CO2 fluxes in relation to discharge indicates stronger heterotrophy in autumn during rising waters than in spring during the falling waters, and this is partly explained by river temperature but more likely due to the remobilization of organic matter in floodplains and secondary channels during the first floods.
We report a strong long-term decrease in CO2 fluxes (−62 % over the 32 years) and an increase in the contribution of heterotrophy (−NEP) to this CO2 outgassing flux. The Loire River's transformation from severe eutrophication to oligotrophic conditions involved dramatic reductions in anthropogenic inputs, including reductions in nutrients and organic matter in urban and agricultural runoff. However, these anthropogenic changes primarily influenced internal CO2 production through altered organic matter processing within the river, while the observed external CO2 source reduction appears driven by groundwater biogeochemical changes that cascaded from surface ecological shifts. While our study infers changes in external CO2 sources, a full understanding of carbon transfer at the groundwater-river interface requires more DIC data from groundwaters and riparian zones (Deirmendjian and Abril, 2018; Duvert et al., 2018). Future work should focus on obtaining such data to quantify these fluxes better. We also suggest that developing approaches to extrapolate findings from such detailed site studies across diverse river networks, integrating them with spatial hydrological and ecological data, will be key to better understanding and predicting how global changes will influence the balance between internal and external CO2 production at broader scales, ultimately refining estimates of the role of rivers in the global carbon budget.
This appendix provides detailed information on the data acquisition, quality assurance/control (QA/QC) framework, and processing procedures used to generate the 32-year high-frequency dataset.
A1 Data acquisition and QA/QC framework
The dataset combines high-frequency continuous monitoring data from Électricité de France (EDF) with lower-frequency grab sample data from both EDF and the Loire-Brittany Water Agency (AELB).
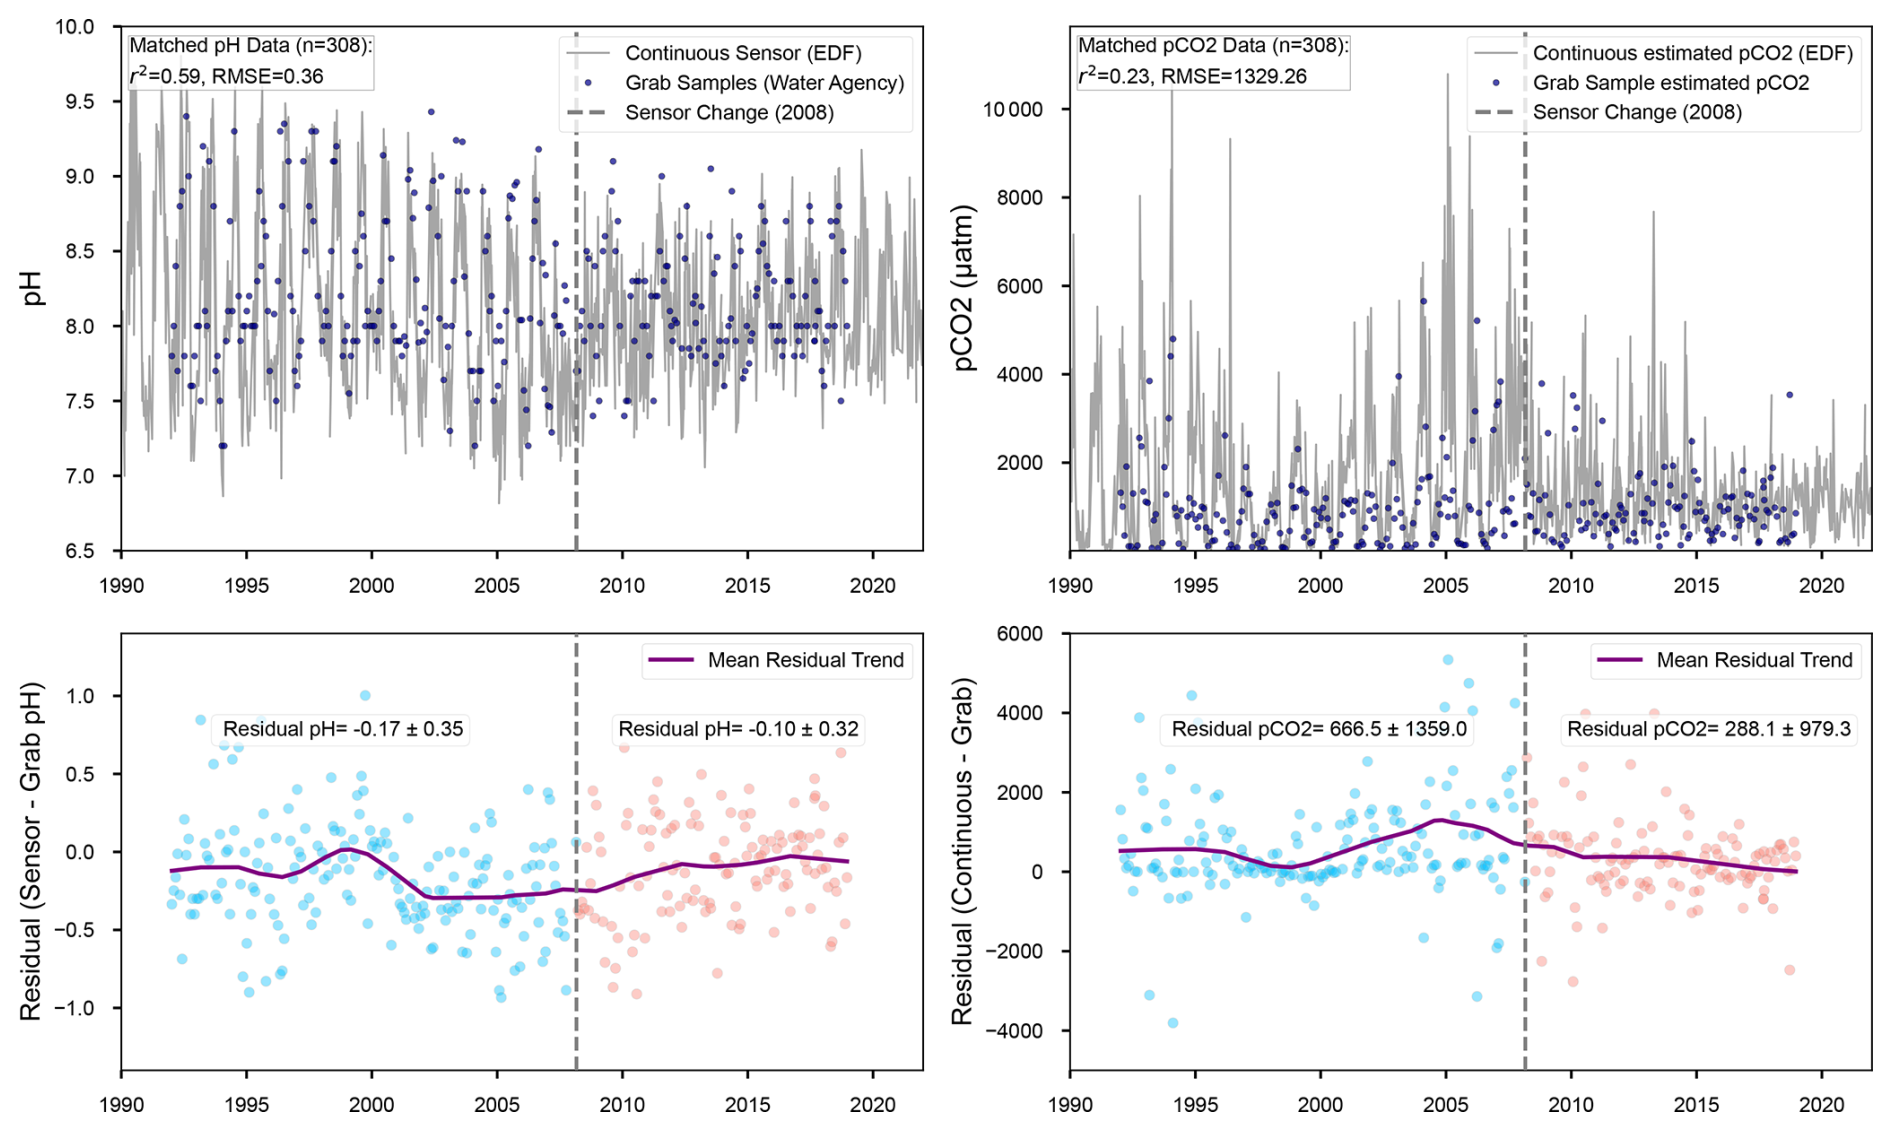
Figure A1Comparison of continuous sensor (EDF) vs. independent grab samples from the water agency for pH and estimated pCO2 in 1990–2021. Bottom panels show residuals (Sensor – Grab) with points colored pre/post sensor change in 2008, a LOWESS trend, and mean residual ± SD.
The continuous measurement system of EDF is a floating platform with a temperature sensor and sensors for pH (range 0–14), DO (range 0–20 mg L−1), and conductivity (range 0–1000 µS cm−1) (Campbell l®). The surface water at 20 cm depth is pumped (ca. 0.5 L s−1) through the system and measurements are recorded every 5 s, with average values saved every hour. It should be noted that data were collected both upstream and downstream of the nuclear power plant, with the upstream station located at the entrance of the dam and the downstream station located approximately 2–5 km downstream of the dam. The data used for data analysis in this study were from the upstream station because of its data completeness. Grab sampling data were collected by EDF and Loire-Brittany Water Agency (AELB), including pH, conductivity, and TA in 1990–2021, with frequency ranging from daily to monthly. Grab sampling data exist only upstream of the nuclear power plant. While AELB provided data for the period of 1990 to 2003 for these parameters, EDF supplied data from 2007 to 2021.
EDF's environmental monitoring operates under mandatory oversight from ASN (Autorité de Sûreté Nucléaire), France's nuclear safety authority, with QA/QC protocols documented for two main periods. Prior to 2008, measurements were made with membrane sensors and validated using a multi-level quality control methodology that included routine calibrations and automated checks (Moatar et al., 2001), achieving an accuracy of approximately ±0.3 pH units and ± 8 % for DO. In 2008, the sensor technology was upgraded to optical sensors, and since 2009, all procedures have complied with ISO 17025:2005 standards, requiring documented calibration with certified reference standards and regular external audits.
We cross-validate the pH data from EDF with independent Water Agency grab samples (http://www.naiades.eaufrance.fr, last access: 15 April 2024). The cross-validation confirms measurement continuity across the sensor transition, showing improved post-2008 agreement (pH residuals: to pH units) while preserving statistically significant long-term trends (Fig. A1). Post-2008 optical sensors indicate fewer differences with the grab samples, but both continuous sensor data from EDF and grab sample data from the water agency are well consistent with the long-term trend. This demonstrates that the sensor upgrade enhanced data quality rather than creating systematic artifacts, with the step change in 2008 contributing to but not solely explaining the multidecadal trends.
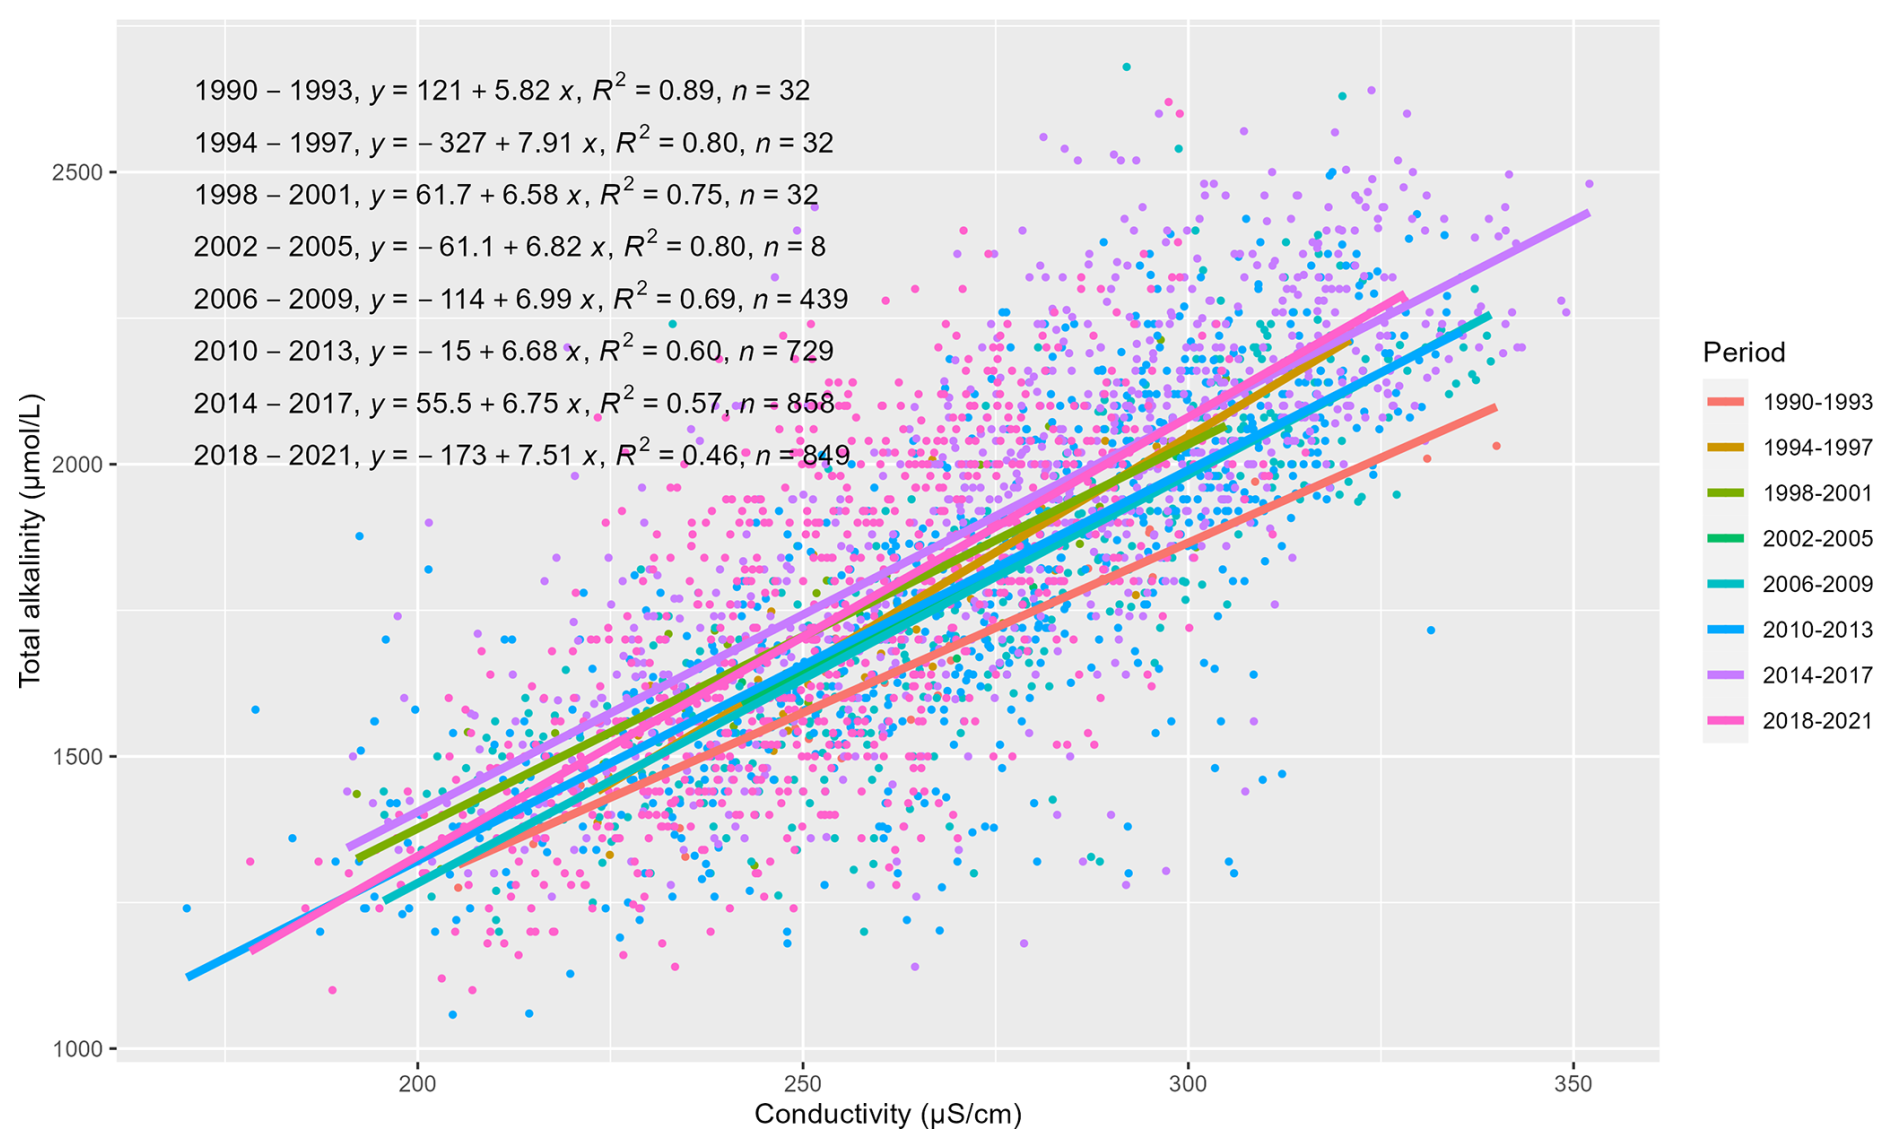
Figure A2Relationship between measured total alkalinity and continuously measured conductivity in the Loire River.
A2 Data Processing and Reconstruction
A2.1 Data Cleaning
Although the sensors for pH and DO measurements were periodically calibrated by EDF, the dataset still exhibited a notable number of anomalous values prior to 2008, which prompted the implementation of comprehensive data control procedures. These procedures addressed sensor drift and outlier removal, which were proposed by (Moatar et al., 2001). Data cleaning was conducted for the hourly pH and dissolved oxygen data in this study, while the daily conductivity was carried out by EDF, which was heavily based on visual inspection. Hourly temperature and alkalinity data from grab sampling were only checked through a range check to eliminate unrealistic values, but there was minimal significant removal of this data.
The following steps were carried out for the data cleaning and correction for hourly pH. Firstly, performing the rules-based anomaly detection and correction as a first pass at quality control, including range check (pH ranges from 6 to 10 in the Loire River), data persistence check (pH relatively constant in few days), significant change check (jump or drop within a few hours), calibration and drift event detection check. This step was performed automatically with the support of pyhydroqc, a Python package for automating aquatic sensor data processing (Jones et al., 2022). Secondly, error detection was manually inspected by comparing values between upstream and downstream, together with the daily discharge. This step used the interactive plot with the support of plotly package to check the errors that were identified in previous steps. The use of daily discharge was to eliminate false detection of abnormal data, especially in the case of high discharge, where there are often sudden changes in pH and conductivity. There was 10.6 % data (about 3 years of data) that was assessed as anomalous and was discarded. Finally, missing data will be completed based on several cases. Linear interpolation was applied for missing data within 6 h (2.3 % of data). Linear interpolation between upstream and downstream stations was applied for missing either upstream or downstream (7.5 % of data). Linear interpolation between adjacent stations was applied when missing data in both upstream and downstream at the Dampierre station, but existed in adjacent stations (0.5 % data). The remaining missing data were then filled based on the seasonal Kalman smoother, which estimates the missing values while considering the seasonal patterns and annual trend (tsmoothie package) (0.3 % data).
The data cleaning procedure was similar for hourly DO. We first removed physically impossible values and then applied a low-pass filter to remove instrument noise in the DO signal. We then removed values that exceeded plausible hourly changes in DO (e.g., a leap from 10 to 15 mg L−1) using 95 % confidence intervals for hourly changes on a monthly basis as our cutoff. We finally used visual inspection to flag data of questionable validity and corrected for linear drift and anomalous drops or jumps in DO data. We then filled all remaining missing values with a seasonal Kalman filter (3 % data). The data cleaning and correction for hourly DO were detailed by Diamond et al. (2025).
A2.2 Alkalinity Reconstruction
As daily TA data were not available for the entire 32-year period, a continuous daily TA time series was reconstructed from the continuous daily conductivity data.
To reconstruct daily alkalinity from conductivity, we employed the IterativeImputer function with BayesianRidge estimator (i.e., regularized linear regression) by using scikit-learn, a Python package. The BayesianRidge estimator filled the missing daily alkalinity by iteratively modeling the linear relationship between daily conductivity and available alkalinity data, while regularization accounts for potential changes in their relationship over 32 years. This process begins by estimating data for the period with the fewest missing data, then continues iteratively until the imputed values converge, meaning subsequent iterations produce minimal changes in the estimates. This iterative process allows the imputer to adapt to underlying trends and shifts in the data. Besides, to verify the stability of the relationship between alkalinity and conductivity, we performed linear regressions on a 4-year period of 32 years dataset, which revealed quite similar slopes across all periods except 1990–1993 (Fig. A2).
This appendix details the methods for handling model outputs, validates key model parameters, and assesses the impact of uncertainty on the final conclusions.
B1 Handling of Metabolism Model Outputs
The streamMetabolizer model can occasionally produce physically unrealistic values, such as negative GPP or positive ER. This issue typically arises when diel variations in dissolved oxygen (DO) are weak – meaning the DO levels are similar between day and night – making it difficult for the model to accurately separate the contributions of GPP and ER (Appling et al., 2018). When the diel DO signal is minimal, the GPP is likely close to zero, which can lead to the model estimating a negative median GPP value. Consequently, it is common practice to set these negative GPP estimates to zero (Blaszczak et al., 2019). In our study, rather than forcing these estimates to zero, we replaced unrealistic estimates with the 75th percentile of the modeled posterior distribution for that day. This approach avoids artificially setting values to zero while still acknowledging that the true value is likely small.
In general, this correction did not substantially alter the annual GPP or ER calculations. Replacing negative GPP with the 75th percentile increased annual GPP by an average of 1.3 % (ranging from 0.1 % to 5.3 %), while setting negative GPP to zero resulted in a smaller increase, ranging from 0.04 % to 3.4 % (Fig. B1). Similarly, the annual ER calculations across different treatments for unrealistic ER values show no significant differences, with an average flux variation of around 1 %, except in 1995, where the difference reaches 15 % (Fig. B2).
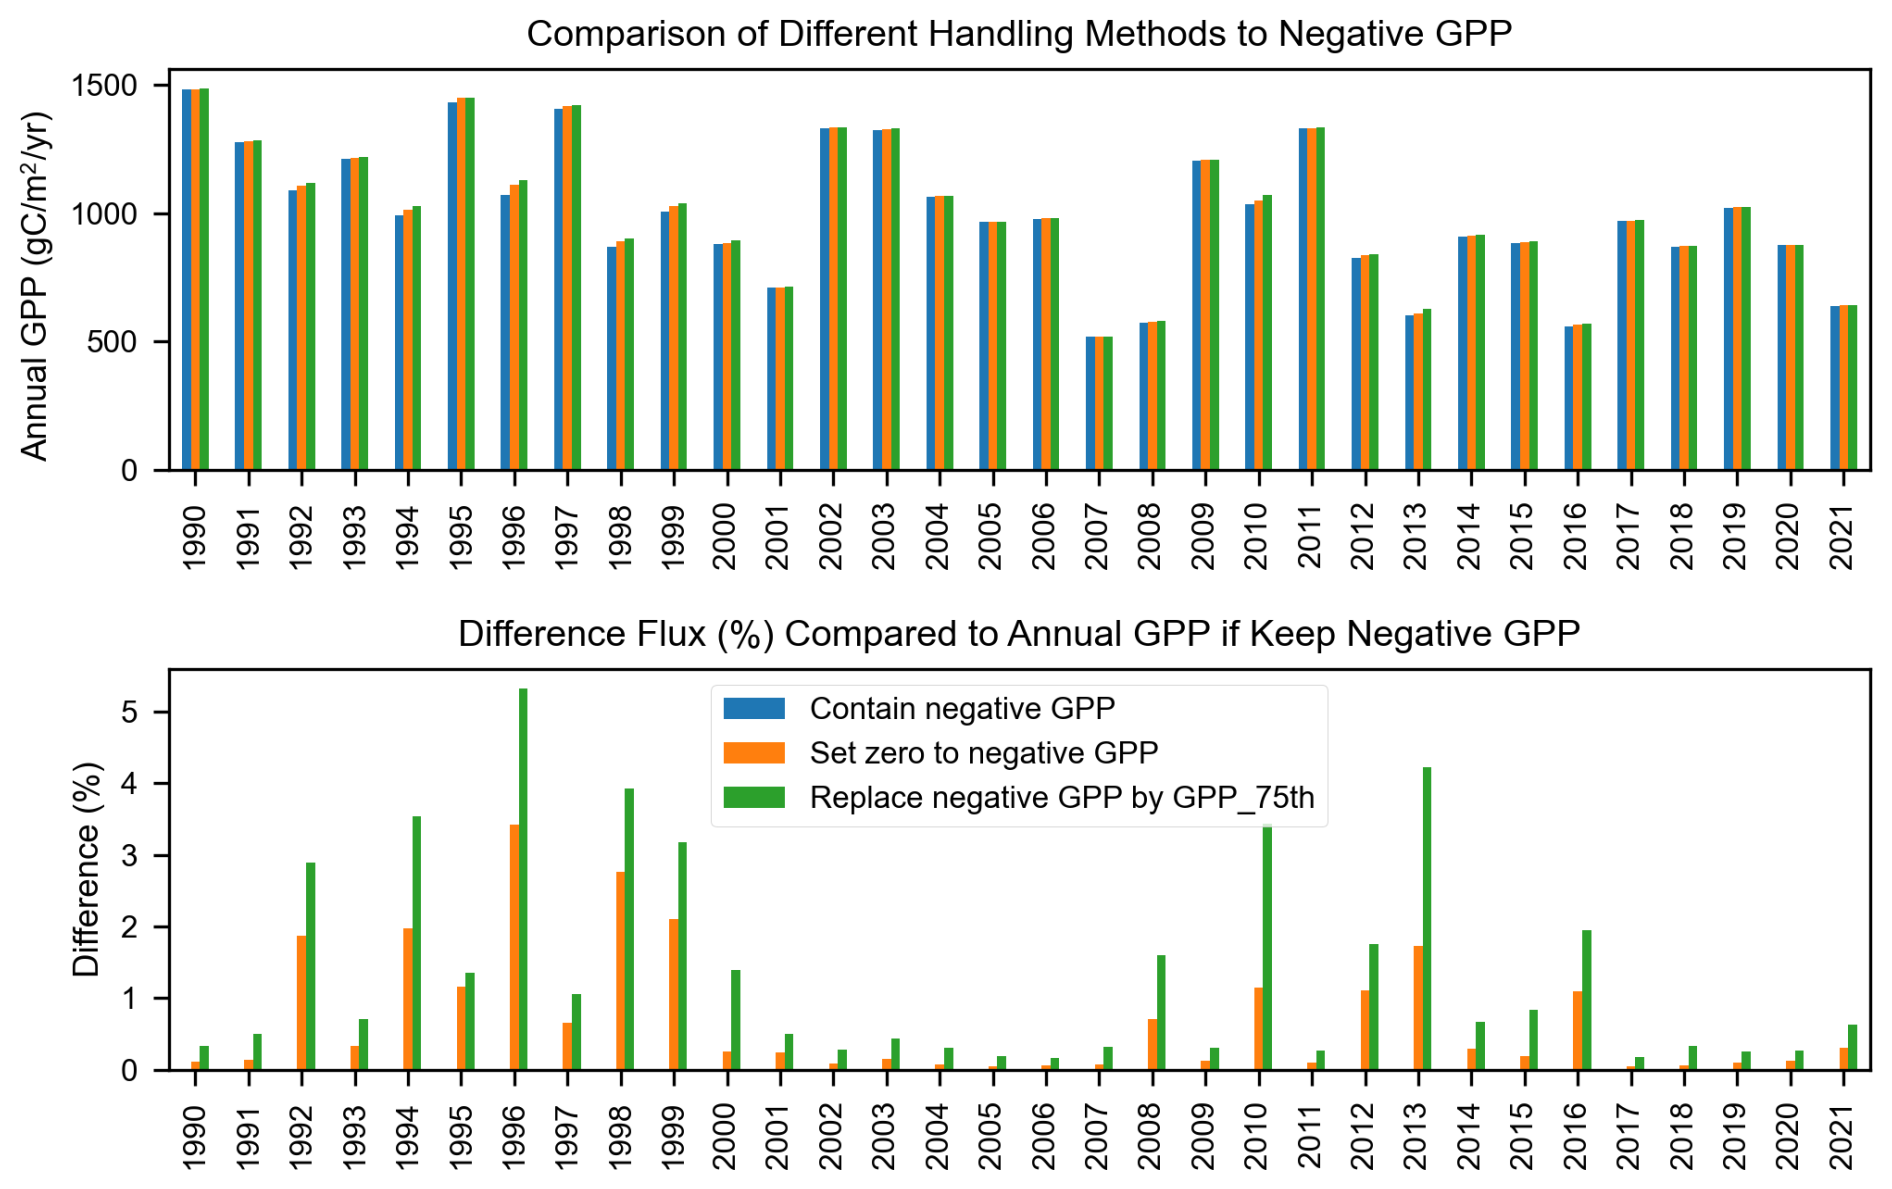
Figure B1Comparison of annual GPP estimates based on different approaches for handling negative GPP values: retaining negative GPP, setting negative GPP to zero, and replacing negative GPP with the 75th percentile of estimated GPP from the streamMetabolizer model.
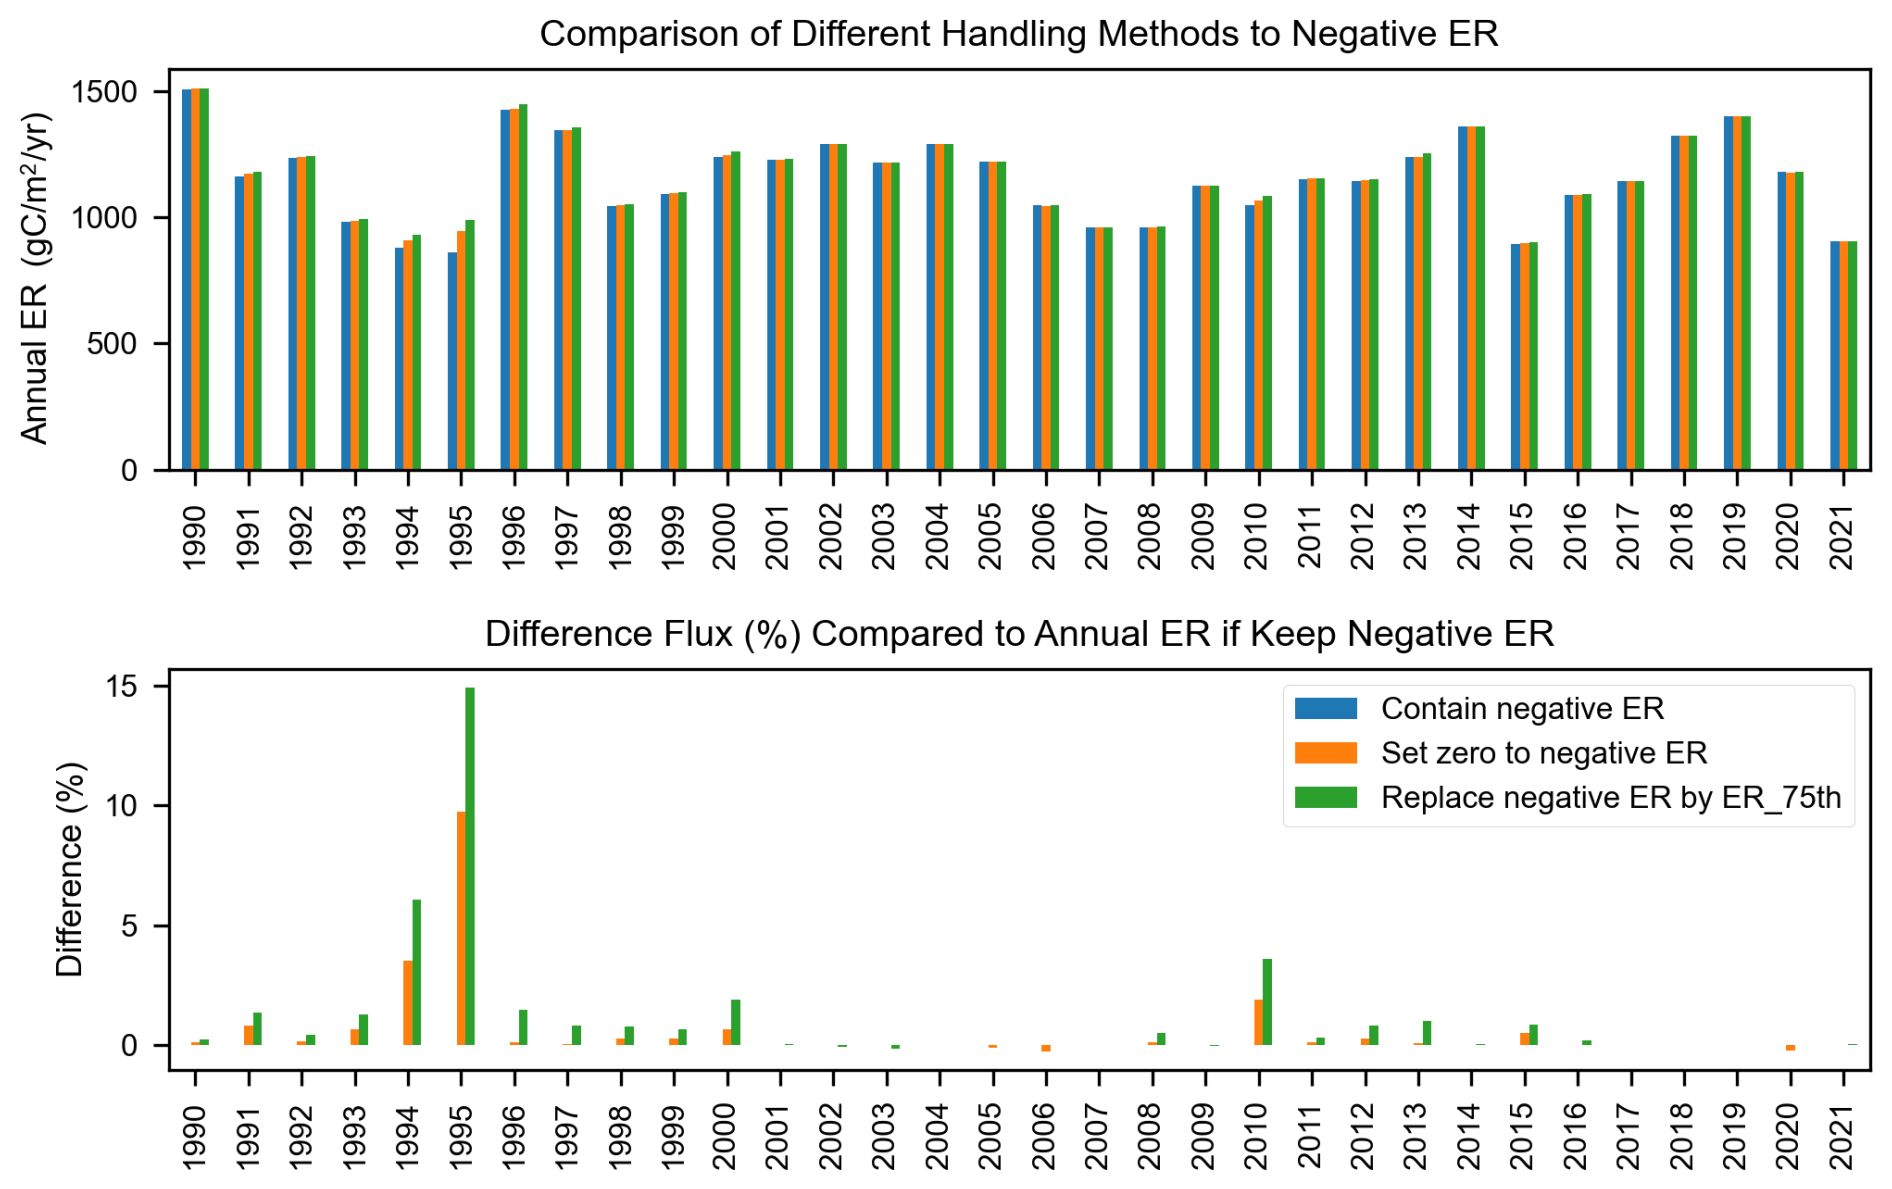
Figure B2Comparison of annual ER estimates based on different approaches for handling negative ER values: retaining negative ER, setting negative ER to zero, and replacing negative ER with the 75th percentile of estimated ER from the streamMetabolizer model.
B2 Validation of the Gas exchange coefficient (k600)
The k600 values used in this study, which were derived from the K600 output of the StreamMetabolizer model, were compared with the seven k600 values calculated from seven fitted equations proposed by Raymond et al. (2012) for streams and small rivers. Both k600 estimates exhibited similar seasonal fluctuations, with the lowest values occurring in summer and the highest in winter (Fig. B3). The comparison revealed that the mean absolute percentage error (MAPE) between the StreamMetabolizer estimates and the mean k600 from the seven fitted equations ranged from 36 % to 62 %. Specifically, the Raymond et al. (2012) k600 estimates tended to be higher in summer (low discharge) and lower in winter (high discharge) compared to those estimated by the StreamMetabolizer model (Fig. B4). Such discrepancies can arise because streamMetabolizer co-estimates K600 with GPP and ER by fitting observed DO dynamics, making its estimate sensitive to the strength of the biological signal, whereas empirical equations rely solely on hydraulic proxies for turbulence. At high flow (winter), streamMetabolizer may underestimate k600 because the strong turbulence and deep water can weaken the biological signal (i.e., the daily change in dissolved oxygen), which the model relies on for its estimations. The Raymond et al. (2012) hydraulic equations, by contrast, are driven by high velocity and are less sensitive to this biological signal dampening. At low flow (summer), streamMetabolizer may estimate a higher k600 because the biological signal is very strong and clear in the shallow, warm, and productive water. The model may attribute a larger portion of the observed oxygen change to gas exchange to best fit the data.
However, the k600 values derived from StreamMetabolizer fall within the same order of magnitude as those from the seven fitted equations (Fig. B3). To maintain internal consistency between the metabolic and FCO2 calculations, the k600 estimates from streamMetabolizer were used for all subsequent flux calculations.
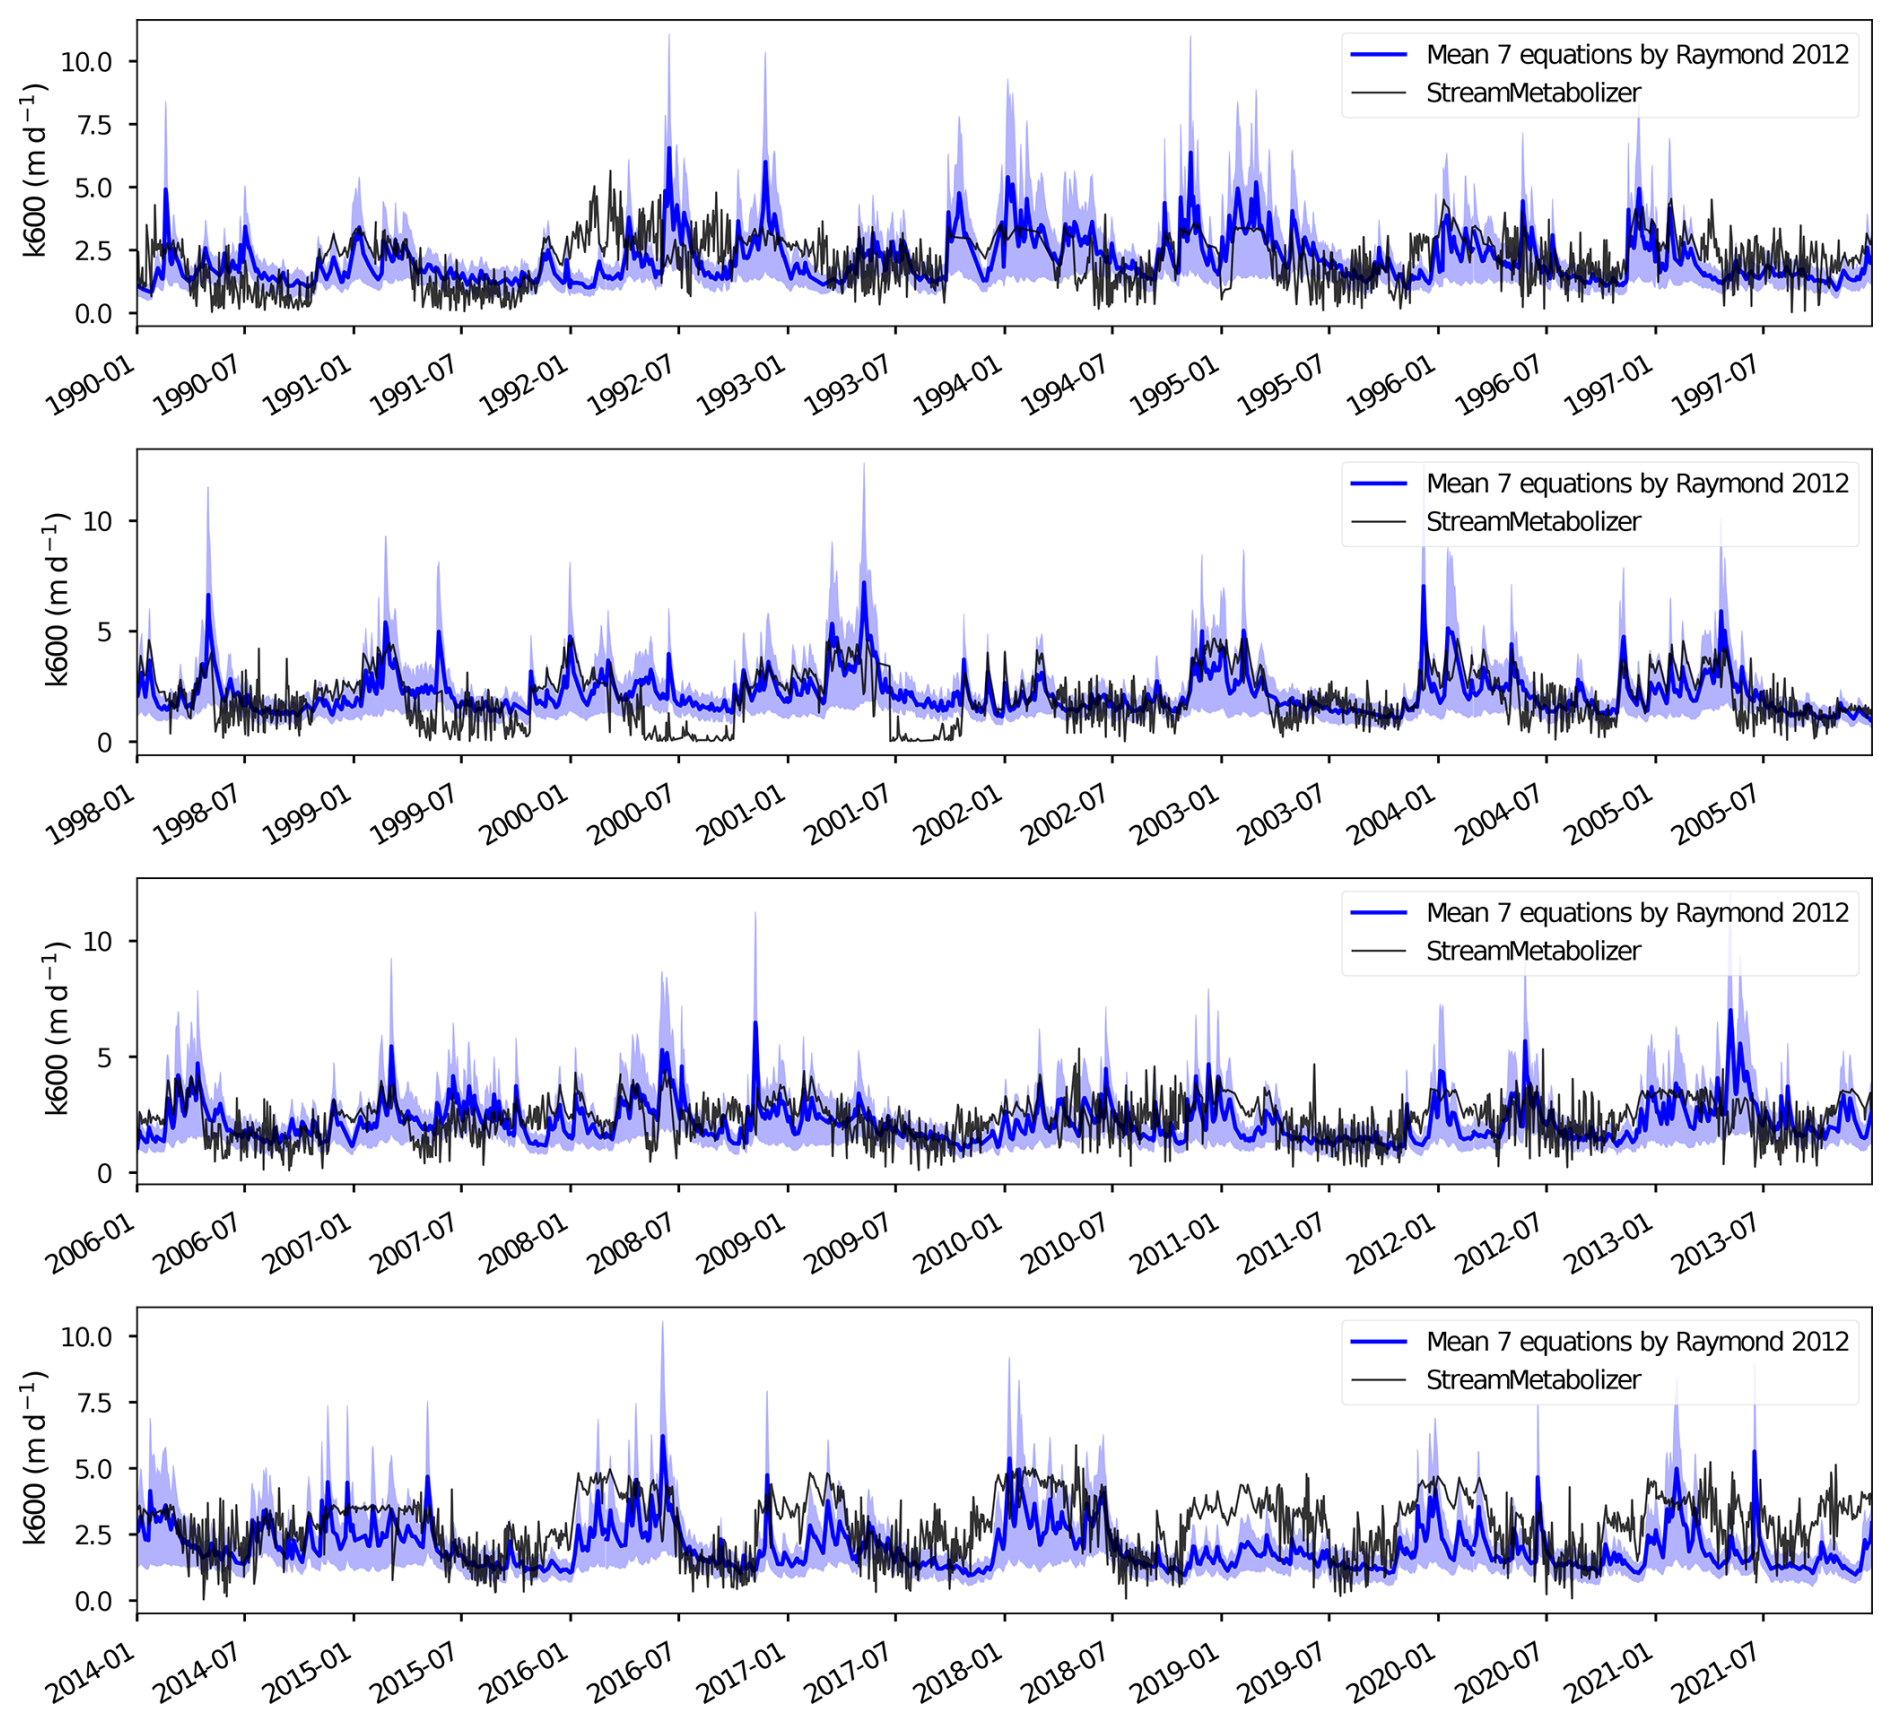
Figure B3Comparison of the gas exchange coefficient (k600) derived from streamMetabolizer (black line) with the mean and range (blue shaded area) of values derived from seven empirical equations from Raymond et al. (2012).
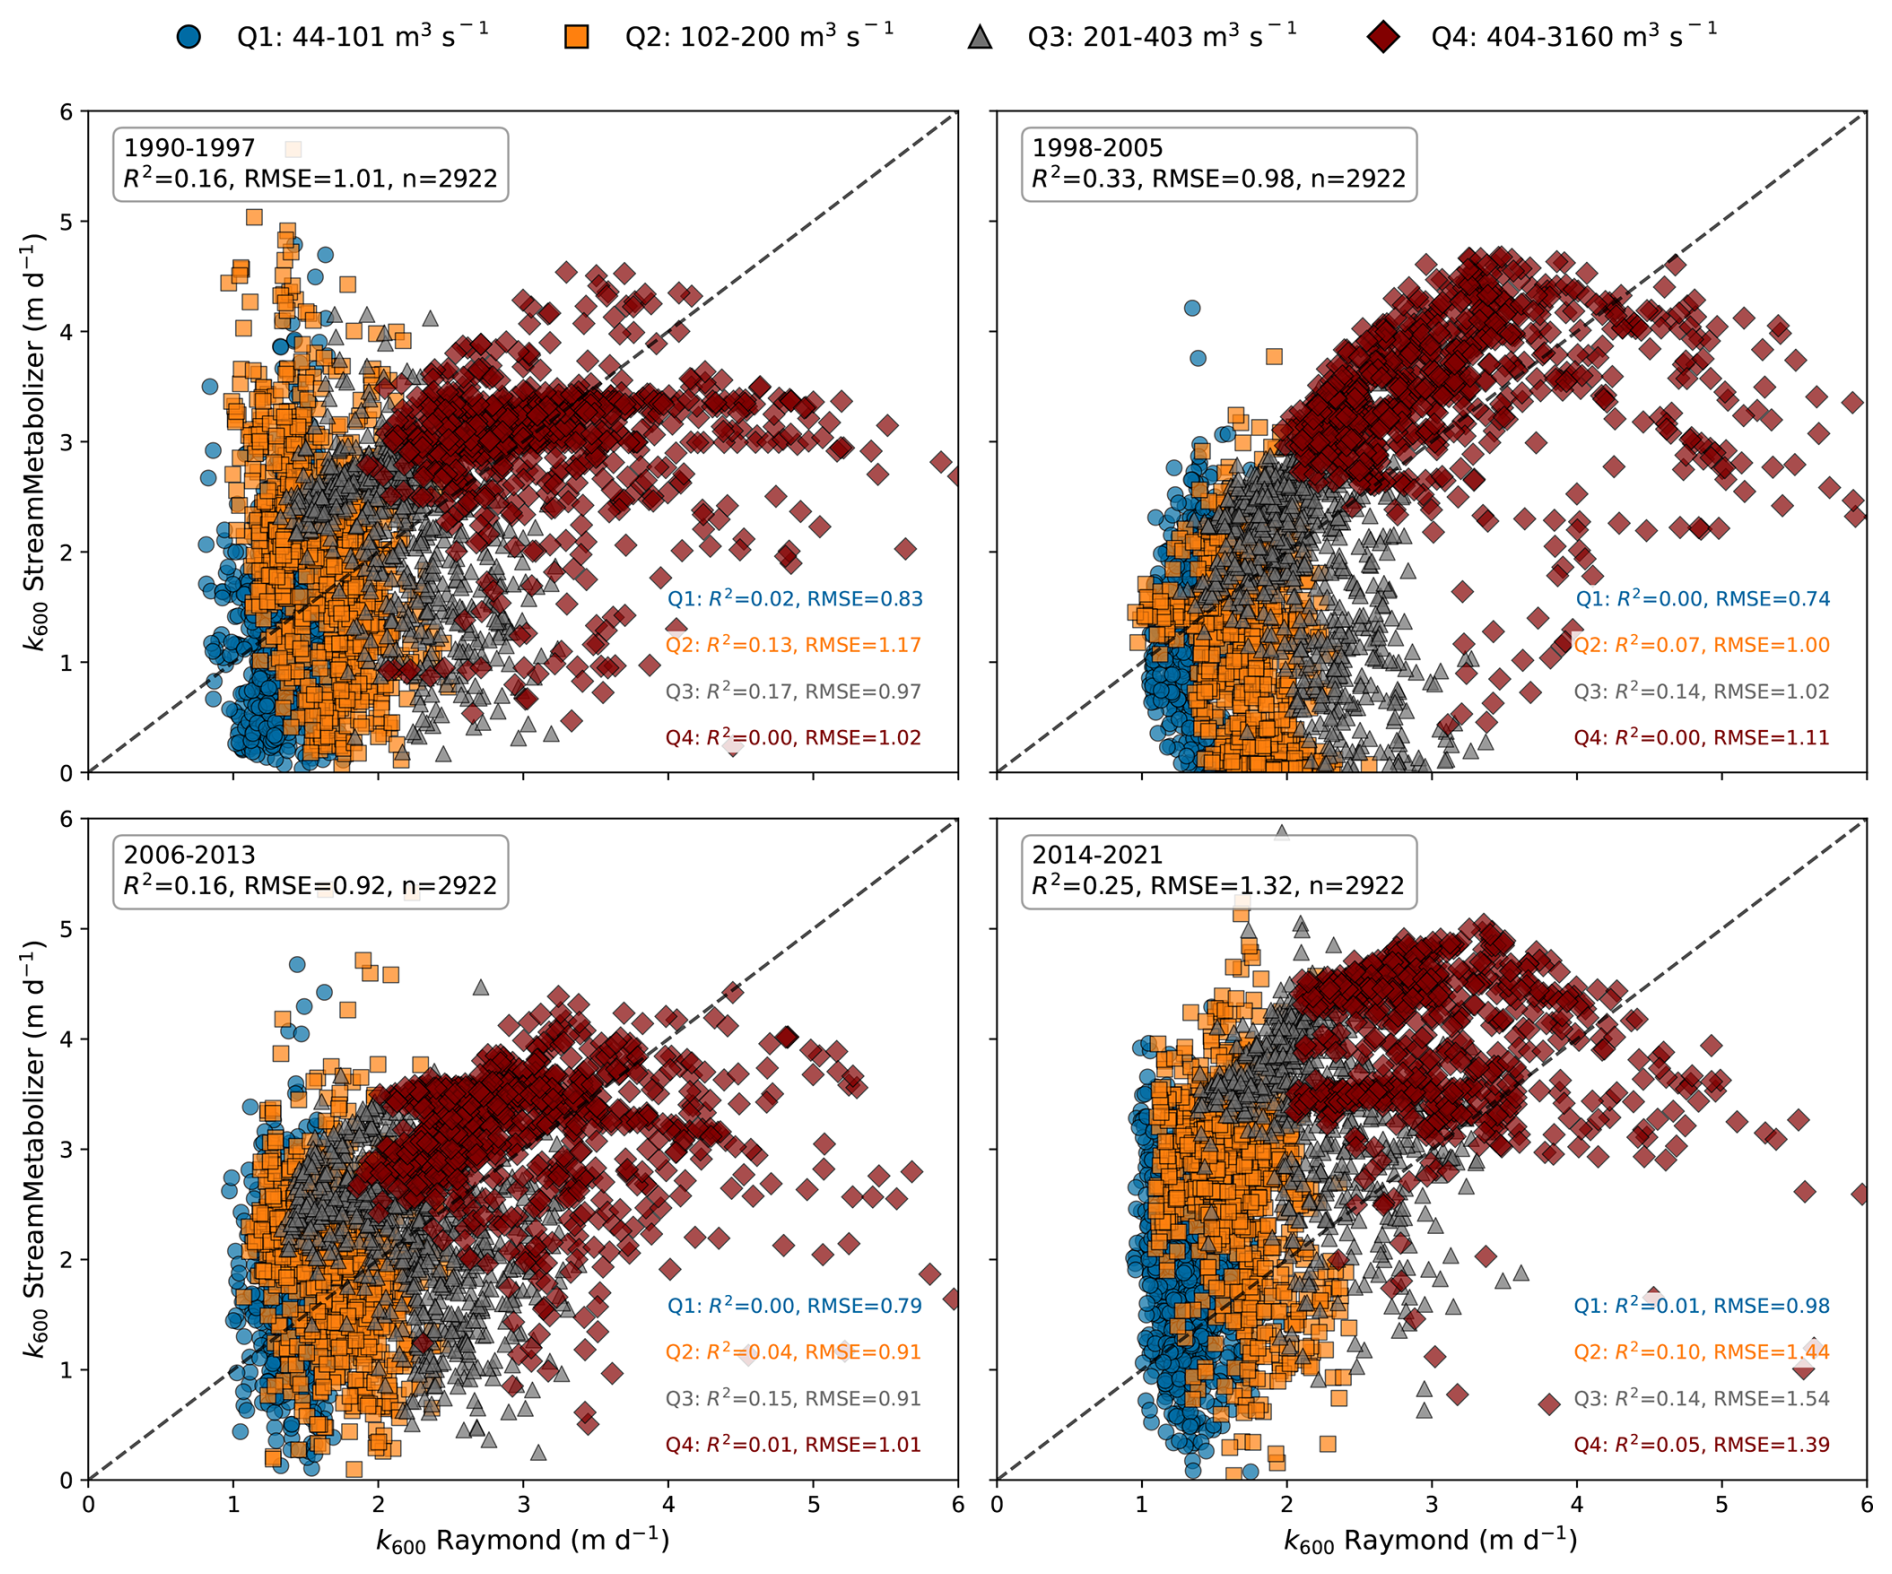
Figure B4Compare the k600 between the mean of seven equations, Raymond et al. (2012), and StreamMetabolizer for 1990–2021. Colors indicate discharge quantiles (Q1–Q4, legend above). R2 and RMSE are shown per discharge quantile range.
Table B1Impact of TA uncertainty on the occurrence and FCO2 of each trophlux state.
B3 Uncertainty Analysis
Estimating FCO2 and NEP using models such as PyCO2SYS and streamMetabolizer often involves large uncertainties, particularly when considering the propagation of errors in all model input data and the summing/multiplying of these uncertainties in calculating fluxes (Battin et al., 2023; Kirk and Cohen, 2023). Estimating FCO2 and NEP involves uncertainties from multiple sources. While a full error propagation was beyond the scope of this study, we assessed the impact of the largest source of input uncertainty: the reconstruction of daily TA, which was based on daily conductivity. The error in TA could potentially affect conclusions regarding the temporal distribution of CO2 sink/source states throughout the year, as well as comparisons with NEP.
The average error in the reconstructed TA was ±190 µmol L−1. Propagating this uncertainty through the pyCO2SYS model resulted in an uncertainty of ±11 % in the final pCO2 estimates. As shown in Table B1, this level of uncertainty did not alter the main conclusions of the study. The annual distribution of trophic states remains consistent, with a maximum deviation of only 3 % fluxes. Moreover, the dominance of the CO2 source–heterotrophic state throughout the year remains almost unchanged, with less than a 1 % difference under any range of TA uncertainty, though the magnitude of FCO2 could vary up to 602 to 841 g C m−2 yr−1.
B4 Methodological considerations for the Heterotrophic-Sink State
The Heterotrophic-Sink state (NEP <0, FCO2 <0) represents a condition where the river is a net CO2 sink from the atmosphere despite ongoing net ecosystem respiration. As discussed in the main text, we primarily attribute this transient state to significant CO2 undersaturation in the water column resulting from intense prior autotrophic uptake. A recent analysis by Diamond et al. (2025) using this same dataset provides strong evidence for this mechanism. They found that heterotrophic-sink events were temporary, lasting an average of 4.7±4.1 d, and that 76 % of these events were immediately preceded by an autotrophic-sink state. This confirms our interpretation that the heterotrophic-sink state is not a stable condition but rather a short-lived transitionary phase as the river shifts from being an autotrophic-sink to either an autotrophic-source or a heterotrophic-source state. An additional potential contributing factor is the possible underestimation of GPP by the diel oxygen method. If oxygen produced within dense benthic macrophyte beds does not fully mix into the water column on a diel timescale, the reach-integrated GPP would be underestimated. This would result in a calculated NEP that is more negative than the true value, which could contribute to the Heterotrophic-Sink state.
This appendix provides detailed results from the statistical analyses used to identify and quantify the long-term changes discussed in the main text.
C1 Change-Point Analysis
We evaluated the long-term changes in FCO2 and metabolism using a statistical change point analysis, which identifies points in a time series where the statistical properties, such as the mean or variance, undergo significant shifts. We first applied seasonal decomposition on the daily time series to extract trend, seasonal, and residual components using the statsmodels Python package (Seabold and Perktold, 2010).
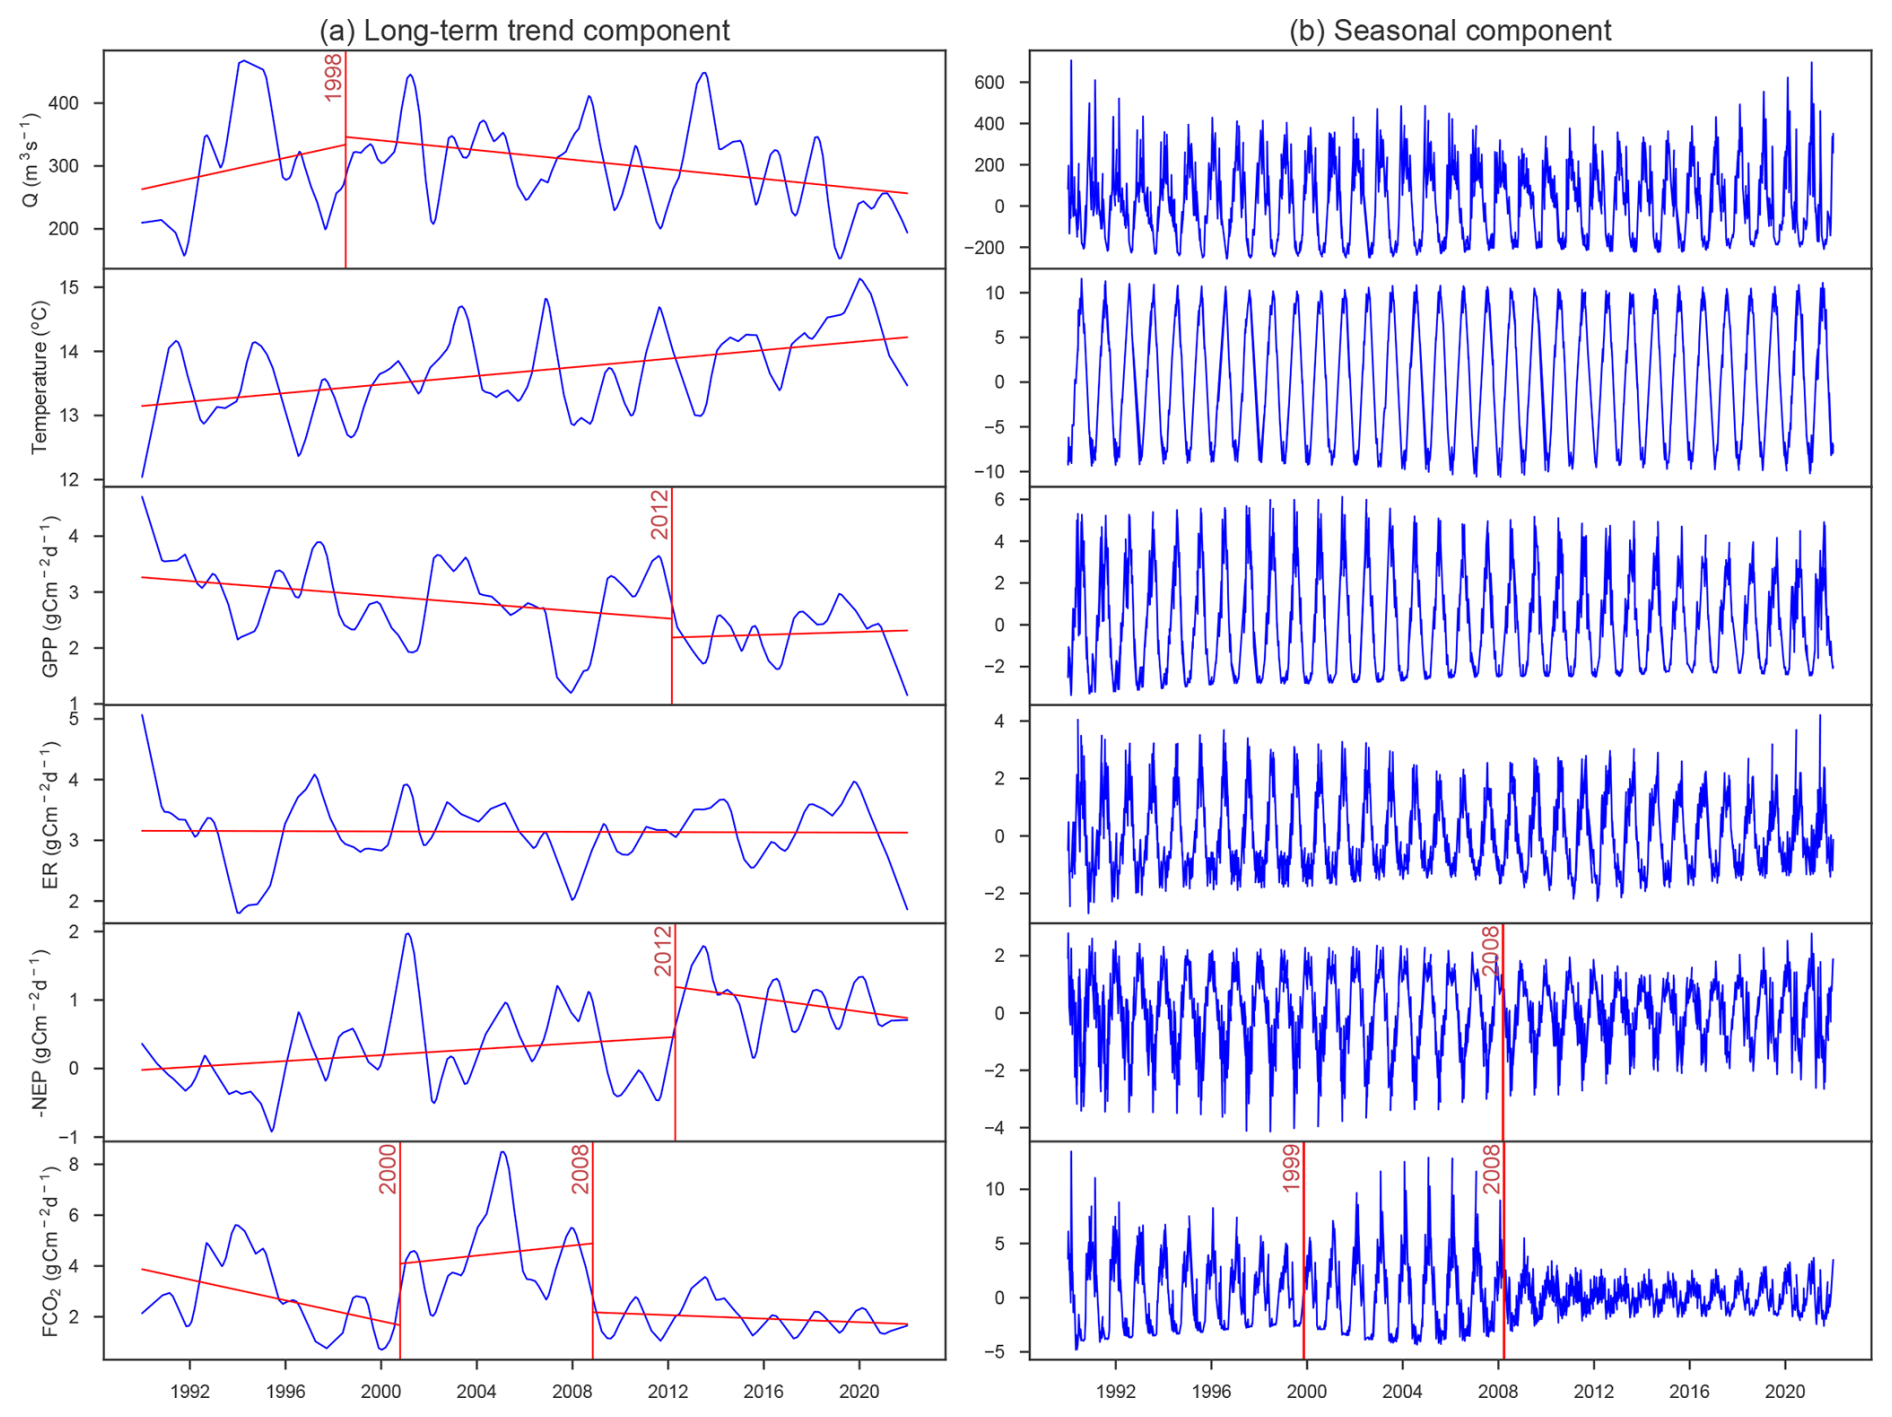
Figure C1Change-point analysis on the decomposed time series: (a) long-term trend components and (b) seasonal components of daily discharge, temperature, and fluxes of GPP, ER, −NEP, and FCO2. The red vertical lines indicate the change periods.
The long-term trend component was analyzed using a piecewise linear regression method (model = “linear” in ruptures, a Python package), while shift point detection by standard deviation (changes in variance by model = “normal” in ruptures) was employed for the seasonal components. This process was also applied to related parameters, including daily discharge, temperature, GPP, and ER. The results of this analysis (Fig. C1) informed the division of the 32-year record into the three decadal periods used for comparison throughout the manuscript.
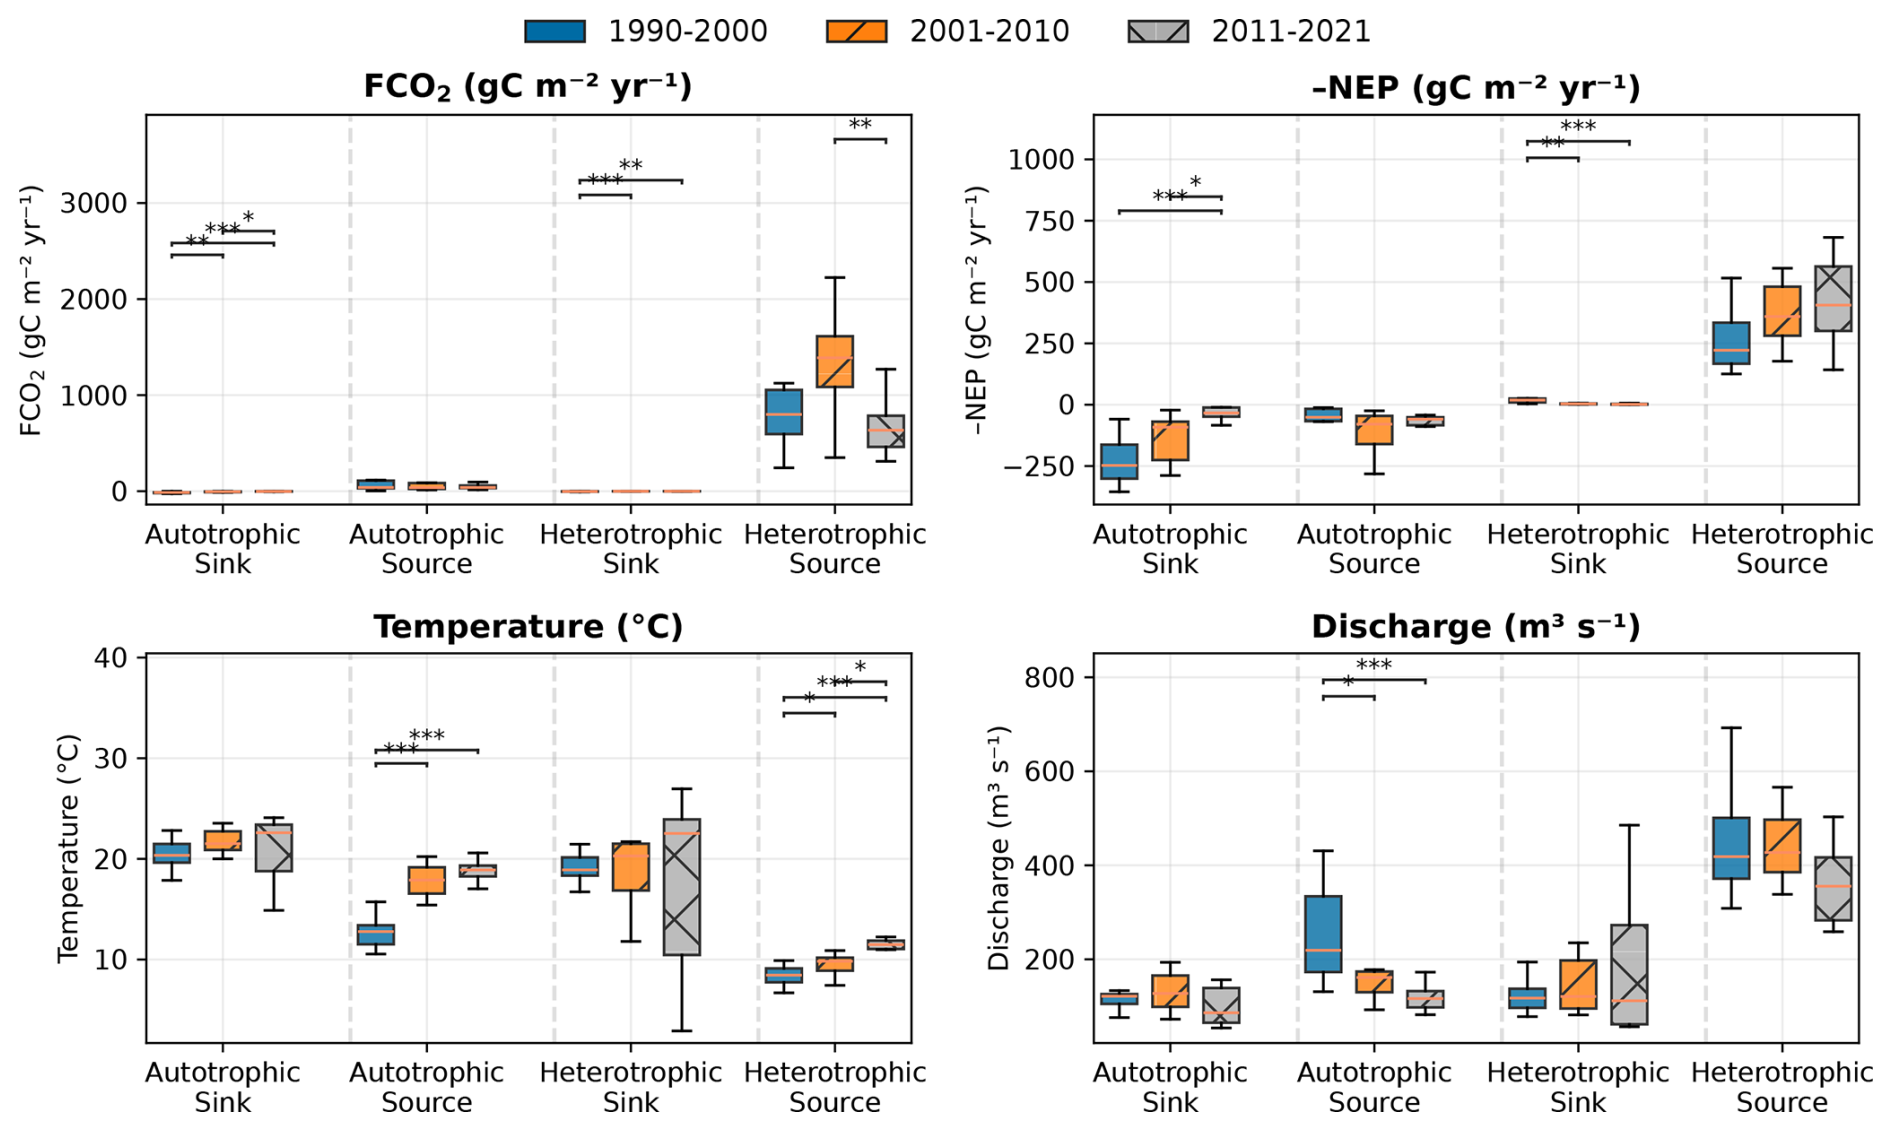
Figure C2Statistical comparison of key variables across decades within each trophlux. Boxplots show median (horizontal line), interquartile range (box), and distribution of annual values (black dots). Colored boxes represent different decades: blue (1990–2000), orange (2001–2010), and grey (2011–2021). Statistical significance of differences between decades was assessed using Kruskal-Wallis tests, with significant pairwise differences (Mann-Whitney U test) indicated by horizontal bars with asterisks (* p<0.05, ** p<0.01, *** p<0.001).
C2 Inter-Decadal Statistical Comparisons
To quantitatively assess differences between the three identified decades, we performed non-parametric Kruskal-Wallis tests followed by post-hoc Mann-Whitney U tests. The results (Fig. C2) provide statistical validation for the observed shifts in key variables between the decadal periods.
This appendix presents the analyses that explore the potential drivers behind the observed long-term trends, particularly the decline in external CO2 sources.
Table D1The correlations (R2) between annual FCO2, −NEP, and hydroclimatic conditions (discharge, temperature) in each trophlux state.
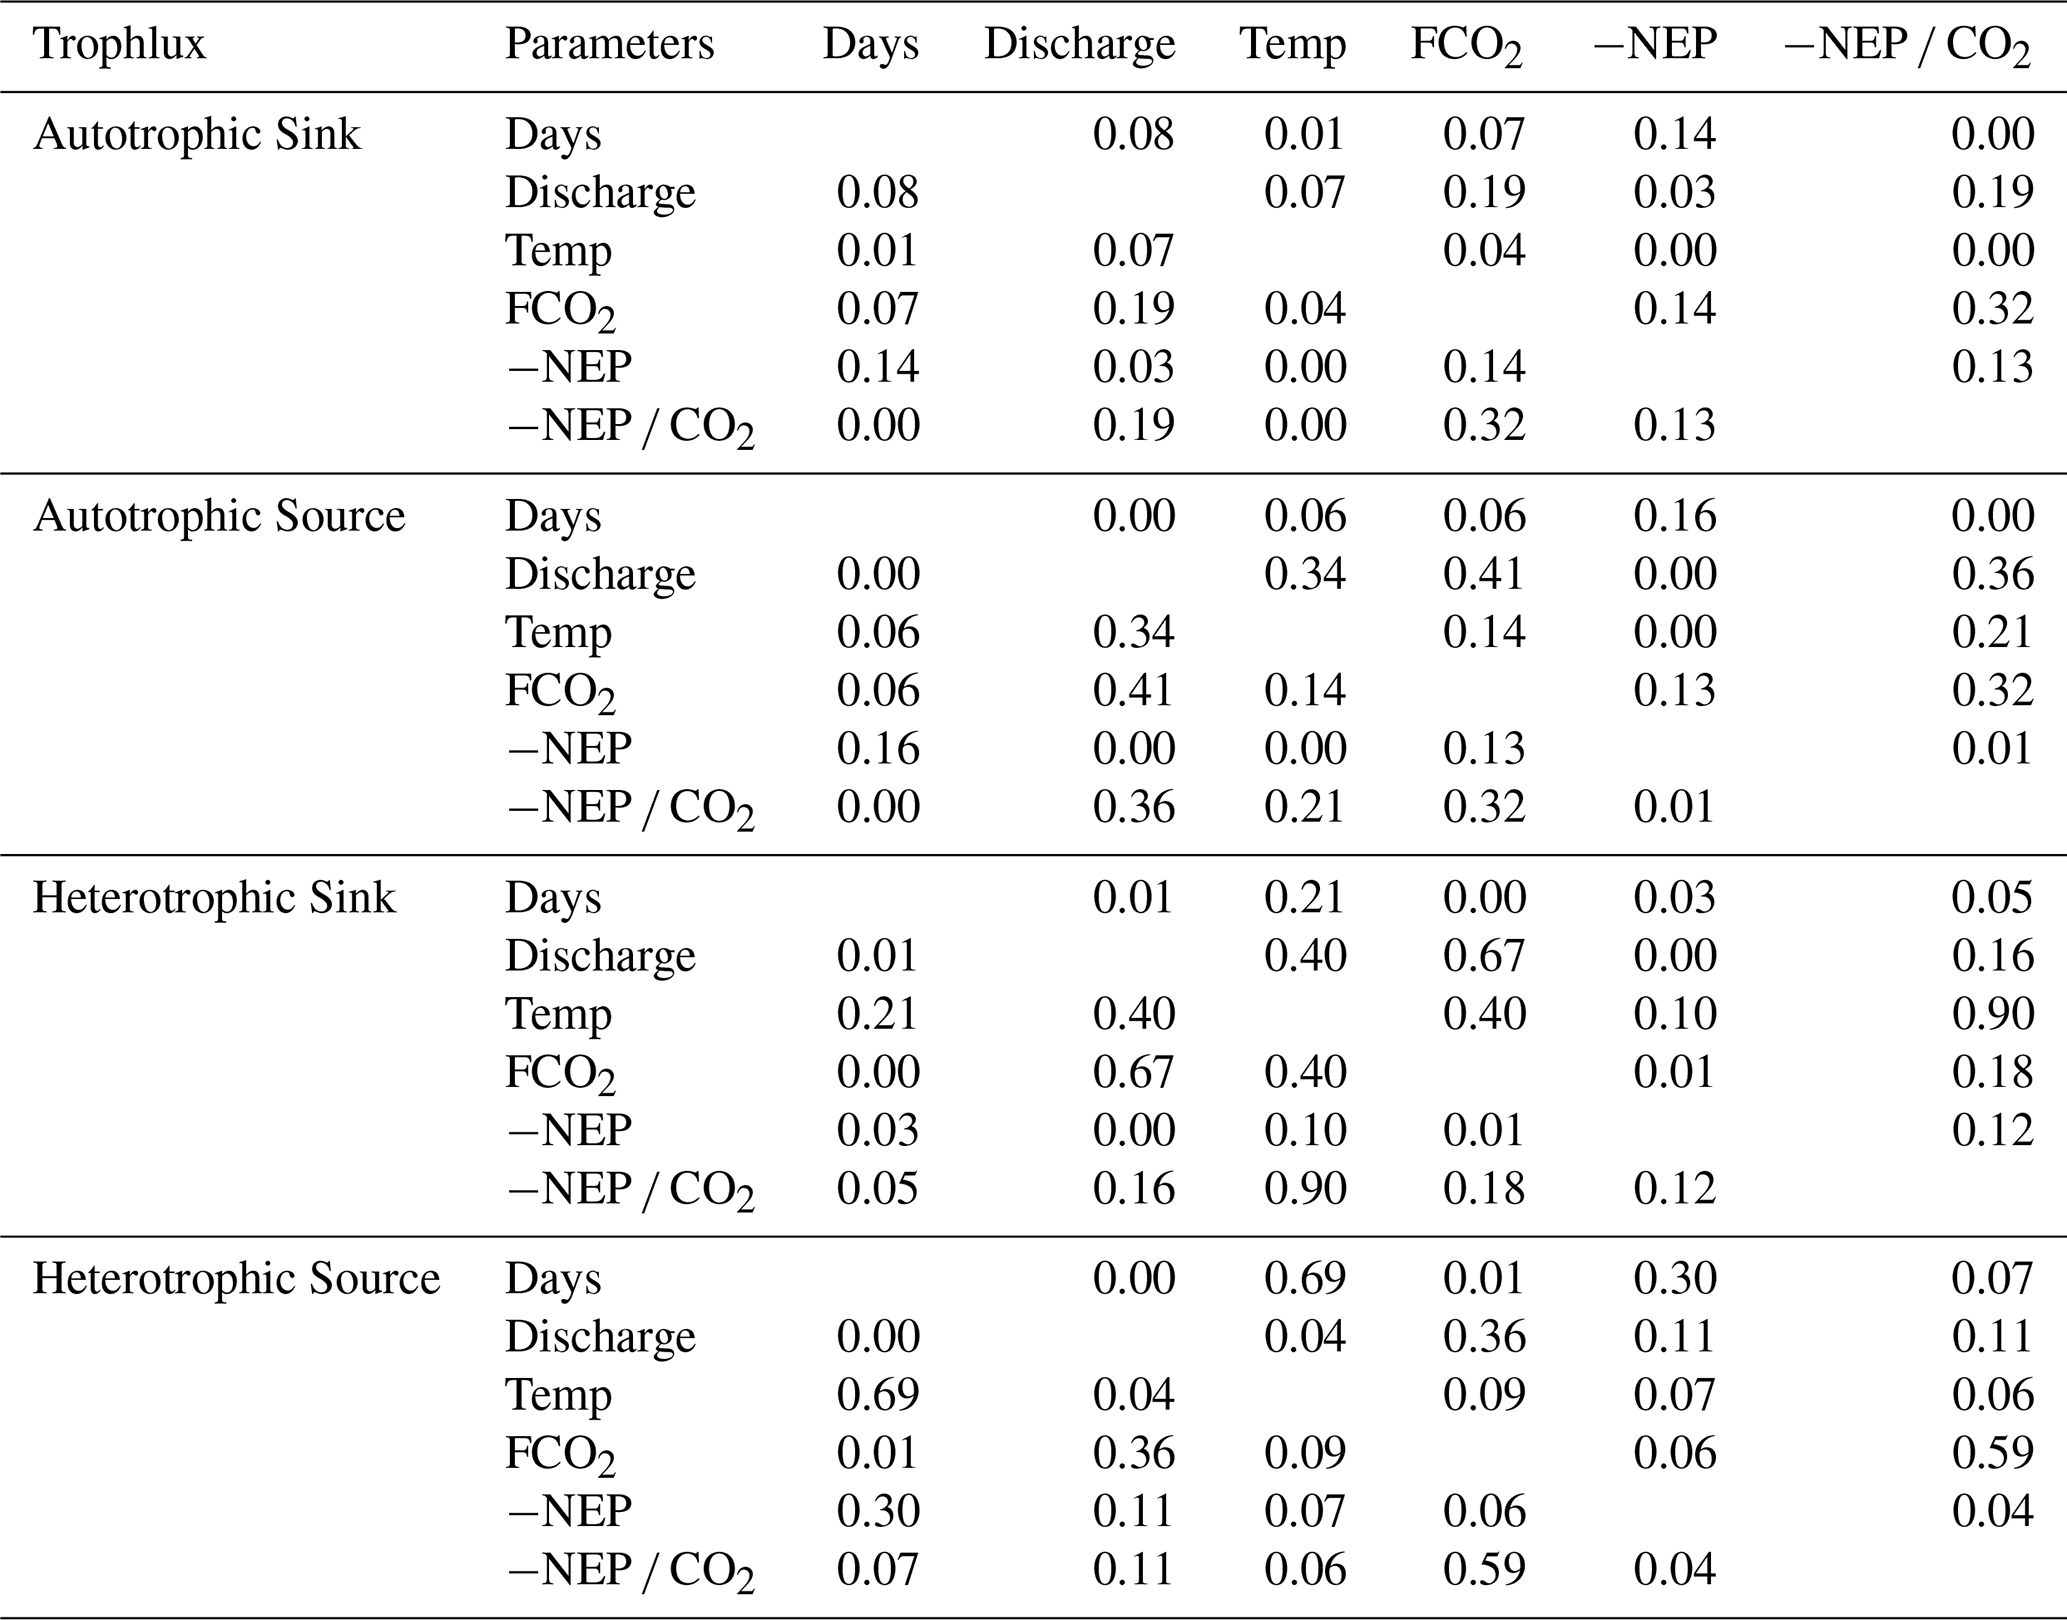
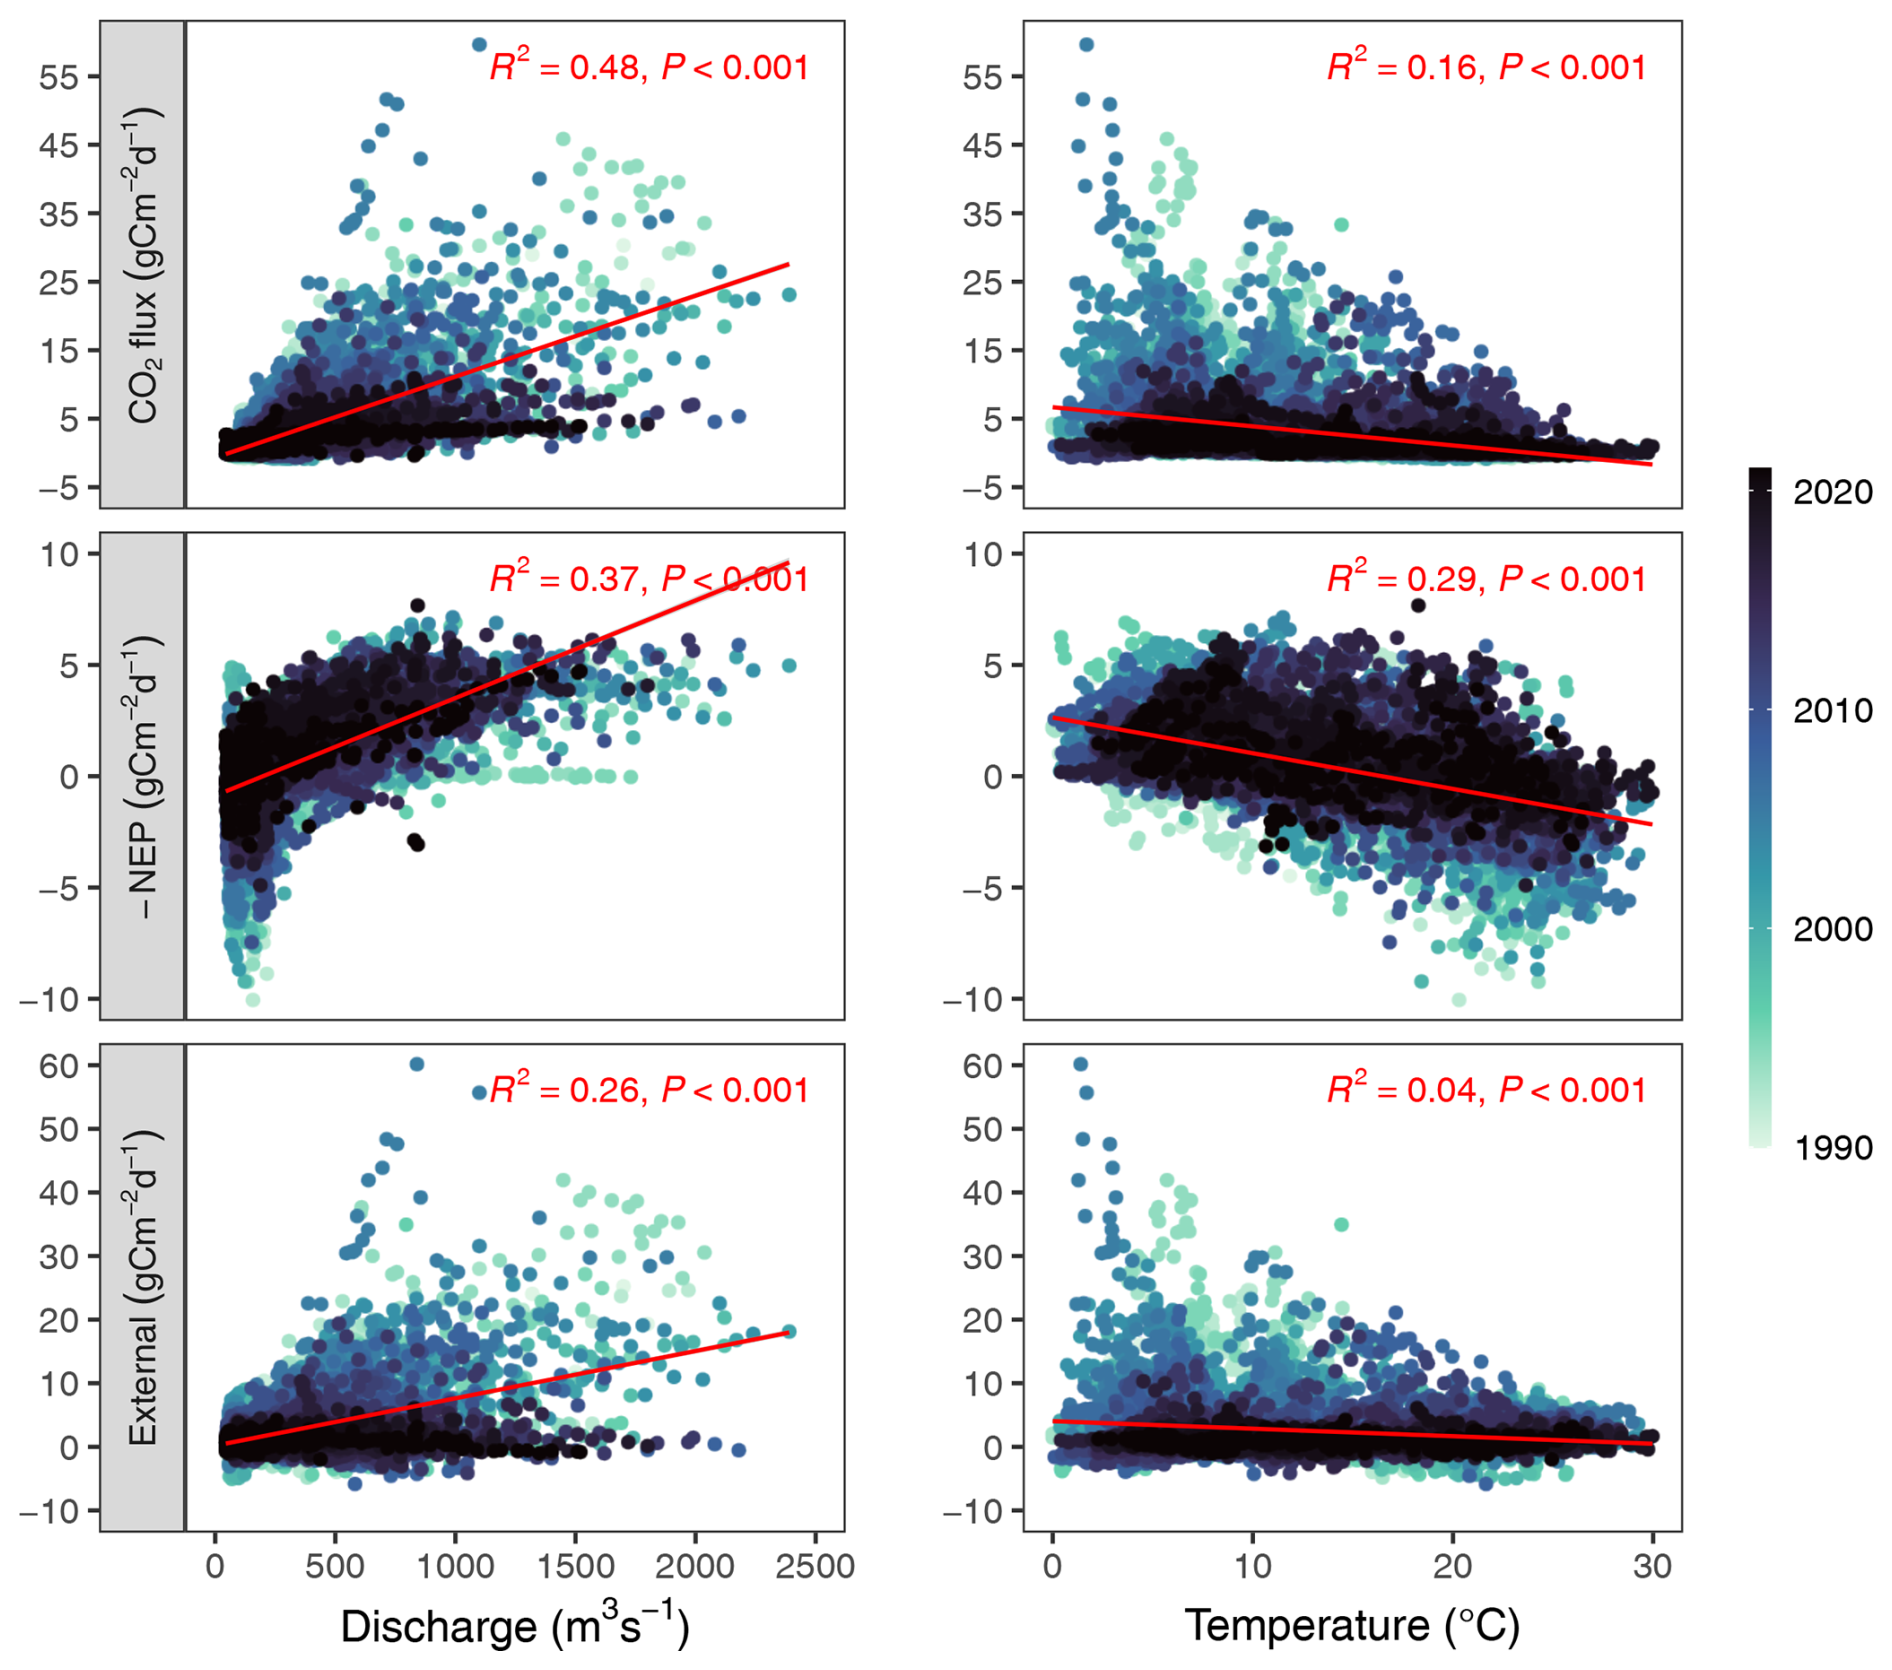
Figure D1Relationship of daily fluxes and daily discharge or daily water temperature. Points are colored by year, as indicated by the color bar.
Figure D2Relationship of annual fluxes and annual discharge or annual water temperature. Points are colored by year, as indicated by the color bar.
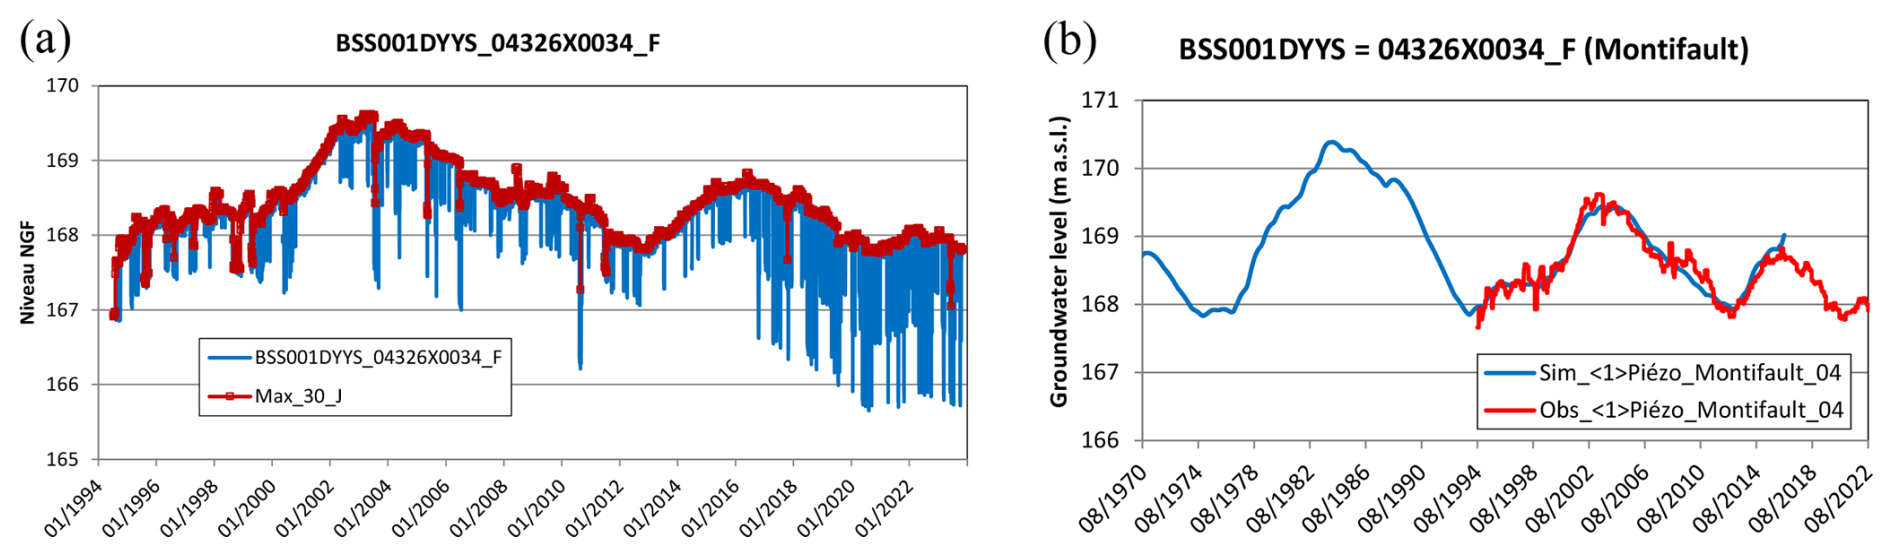
Figure D3A decreasing trend in the groundwater level in Montifault (20 km from the study site). (a) raw data, (b) after removing pumping effects with the ÉROS model (Data source: Thiéry, 2018). NGF stands for “Nivellement Général de la France”, which is the official vertical datum for France.
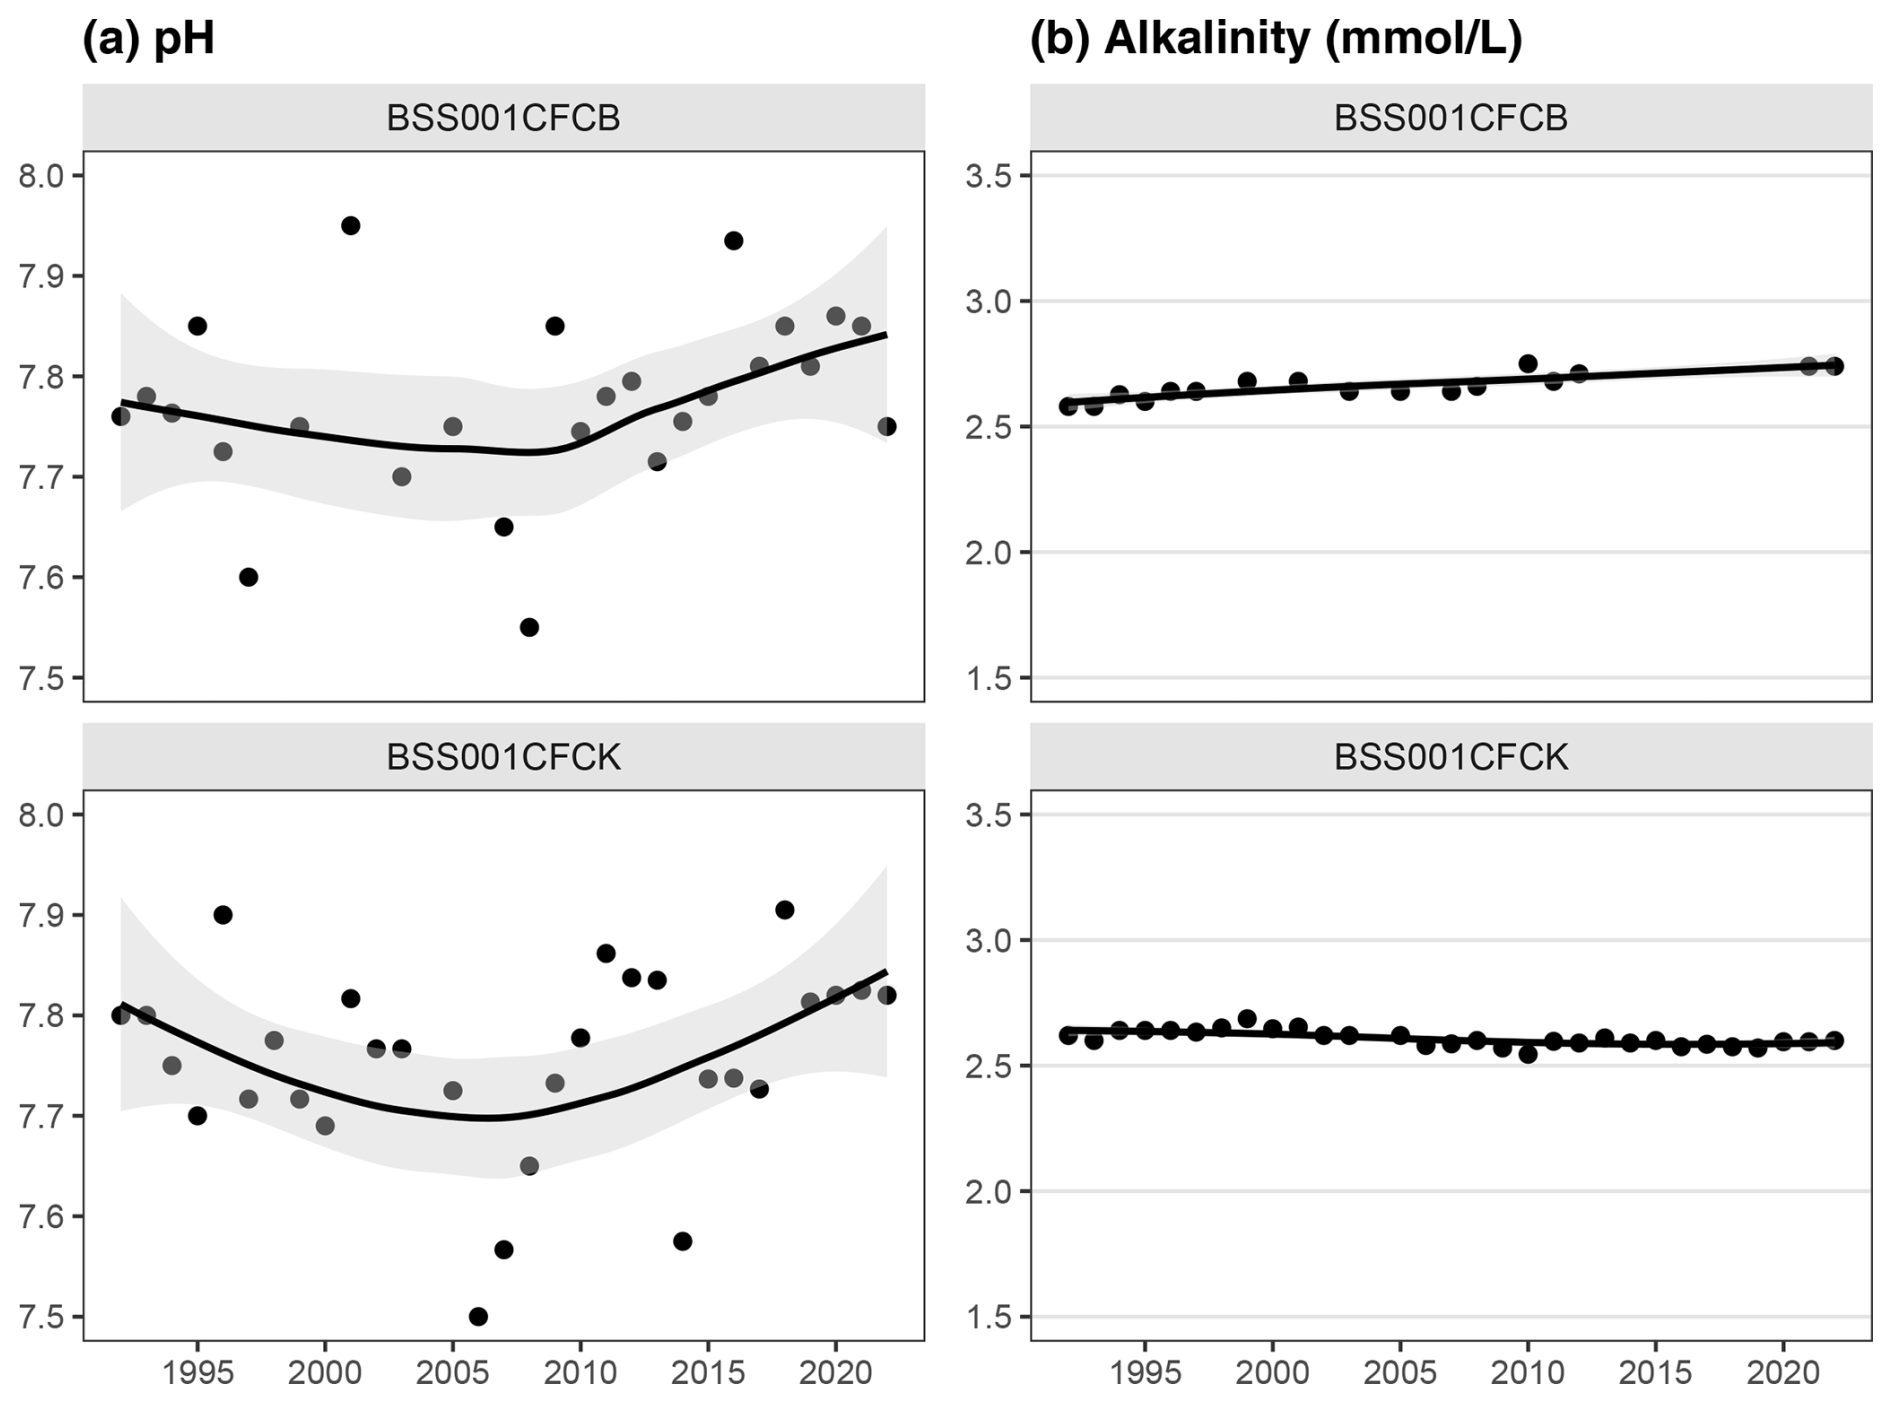
Figure D4pH and alkalinity in groundwater monitoring stations in the vicinity (5 km radius) of the Dampierre study site (1990–2021). Points represent individual measurements, and solid lines are LOESS smoothers with 95 % confidence intervals (shaded areas). Data source: https://hubeau.eaufrance.fr/page/api-qualite-nappes (last access: 15 April 2024).
The hourly temperature, conductivity, dissolved oxygen, and pH data used in this study are owned by Électricité de France (EDF). Due to EDF's data-sharing policy, these data are not publicly available but can be accessed upon reasonable request by contacting EDF directly. Other publicly available datasets used include discharge (https://www.hydro.eaufrance.fr, last access: 15 April 2024), river water quality (http://www.naiades.eaufrance.fr, last access: 15 April 2024).
The supplement related to this article is available online at https://doi.org/10.5194/bg-22-4923-2025-supplement.
ATN led the manuscript effort. ATN, JSD, GA, and FM came up with the research question and designed the study approach. ATN and JSD conducted the data curation and preparation, and ANT conducted the statistical analyses. ANT wrote the paper with contributions from all authors.
The contact author has declared that none of the authors has any competing interests.
Publisher's note: Copernicus Publications remains neutral with regard to jurisdictional claims made in the text, published maps, institutional affiliations, or any other geographical representation in this paper. While Copernicus Publications makes every effort to include appropriate place names, the final responsibility lies with the authors. Also, please note that this paper has not received English language copy-editing. Views expressed in the text are those of the authors and do not necessarily reflect the views of the publisher.
We express our gratitude to Electricité de France (EDF) for generously providing extensive long-term datasets from the Middle Loire River, and to the Loire-Brittany Water Agency (AELB) for additional water quality data. We thank Dominique Thiéry for providing groundwater level data from the ÉROS hydrological model. We also acknowledge the French water agencies and public institutions for maintaining open-access databases that supported this research, including the national surface water quality database (http://www.naiades.eaufrance.fr, last access: 15 April 2024) and the groundwater quality API (http://hubeau.eaufrance.fr, last access: 15 April 2024). We thank the anonymous reviewers for their constructive comments that significantly improved the manuscript.
This paper was edited by Ji-Hyung Park and reviewed by two anonymous referees.
Abril, G. and Borges, A. V.: Ideas and perspectives: Carbon leaks from flooded land: do we need to replumb the inland water active pipe?, Biogeosciences, 16, 769–784, https://doi.org/10.5194/bg-16-769-2019, 2019.
Abril, G., Bouillon, S., Darchambeau, F., Teodoru, C. R., Marwick, T. R., Tamooh, F., Ochieng Omengo, F., Geeraert, N., Deirmendjian, L., Polsenaere, P., and Borges, A. V.: Technical Note: Large overestimation of pCO2 calculated from pH and alkalinity in acidic, organic-rich freshwaters, Biogeosciences, 12, 67–78, https://doi.org/10.5194/bg-12-67-2015, 2015.
Aho, K. S., Hosen, J. D., Logozzo, L. A., McGillis, W. R., and Raymond, P. A.: Highest rates of gross primary productivity maintained despite CO 2 depletion in a temperate river network, Limnol. Oceanogr. Lett., 6, 200–206, https://doi.org/10.1002/lol2.10195, 2021.
Amaral, J., Suhett, A., Melo, S., and Farjalla, V.: Seasonal variation and interaction of photodegradation and microbial metabolism of DOC in black water Amazonian ecosystems, Aquat. Microb. Ecol., 70, 157–168, https://doi.org/10.3354/ame01651, 2013.
Appling, A. P., Hall, R. O., Yackulic, C. B., and Arroita, M.: Overcoming Equifinality: Leveraging Long Time Series for Stream Metabolism Estimation, J. Geophys. Res.-Biogeo., 123, 624–645, https://doi.org/10.1002/2017JG004140, 2018.
Battin, T. J., Lauerwald, R., Bernhardt, E. S., Bertuzzo, E., Gener, L. G., Hall, R. O., Hotchkiss, E. R., Maavara, T., Pavelsky, T. M., Ran, L., Raymond, P., Rosentreter, J. A., and Regnier, P.: River ecosystem metabolism and carbon biogeochemistry in a changing world, Nature, 613, 449–459, https://doi.org/10.1038/s41586-022-05500-8, 2023.
Baulon, L., Allier, D., Massei, N., Bessiere, H., Fournier, M., and Bault, V.: Influence of low-frequency variability on groundwater level trends, J. Hydrol., 606, 127436, https://doi.org/10.1016/j.jhydrol.2022.127436, 2022.
Begum, M. S., Jang, I., Lee, J.-M., Oh, H. B., Jin, H., and Park, J.-H.: Synergistic effects of urban tributary mixing on dissolved organic matter biodegradation in an impounded river system, Sci. Total Environ., 676, 105–119, https://doi.org/10.1016/j.scitotenv.2019.04.123, 2019.
Bernal, S., Cohen, M. J., Ledesma, J. L. J., Kirk, L., Martí, E., and Lupon, A.: Stream metabolism sources a large fraction of carbon dioxide to the atmosphere in two hydrologically contrasting headwater streams, Limnol. Oceanogr., 67, 2621–2634, https://doi.org/10.1002/lno.12226, 2022.
Binet, S., Charlier, J.-B., Jozja, N., Défarge, C., and Moquet, J.-S.: Evidence of long term biogeochemical interactions in carbonate weathering: the role of planktonic microorganisms and riverine bivalves in a large fluviokarst system, Sci. Total Environ., 842, 156823, https://doi.org/10.1016/j.scitotenv.2022.156823, 2022.
Blaszczak, J. R., Delesantro, J. M., Urban, D. L., Doyle, M. W., and Bernhardt, E. S.: Scoured or suffocated: Urban stream ecosystems oscillate between hydrologic and dissolved oxygen extremes, Limnol. Oceanogr., 64, 877–894, 2019.
Bogard, M. J. and Del Giorgio, P. A.: The role of metabolism in modulating CO2 fluxes in boreal lakes, Global Biogeochem. Cycles, 30, 1509–1525, https://doi.org/10.1002/2016GB005463, 2016.
Butman, D. and Raymond, P. A.: Significant efflux of carbon dioxide from streams and rivers in the united states, Nat. Geosci., 4, 839–842, https://doi.org/10.1038/ngeo1294, 2011.
Camenen, B., Grabowski, R. C., Latapie, A., Paquier, A., Solari, L., and Rodrigues, S.: On the estimation of the bed-material transport and budget along a river segment: application to the Middle Loire River, France, Aquat. Sci., 78, 71–81, https://doi.org/10.1007/s00027-015-0442-3, 2016.
Cole, J. J., Cole, J. J., Caraco, N. F., and Caraco, N. F.: Carbon in catchments: connecting terrestrial carbon losses with aquatic metabolism, Mar. Freshwater Res., 52, 101, https://doi.org/10.1071/MF00084, 2001.
Cole, J. J., Prairie, Y. T., Caraco, N. F., McDowell, W. H., Tranvik, L. J., Striegl, R. G., Duarte, C. M., Kortelainen, P., Downing, J. A., Middelburg, J. J., and Melack, J.: Plumbing the global carbon cycle: Integrating inland waters into the terrestrial carbon budget, Ecosystems, 10, 171–184, https://doi.org/10.1007/s10021-006-9013-8, 2007.
Coynel, A., Etcheber, H., Abril, G., Maneux, E., Dumas, J., and Hurtrez, J.-E.: Contribution of small mountainous rivers to particulate organic carbon input in the bay of biscay, Biogeochemistry, 74, 151–171, 2005.
Deirmendjian, L. and Abril, G.: Carbon dioxide degassing at the groundwater-stream-atmosphere interface: isotopic equilibration and hydrological mass balance in a sandy watershed, J. Hydrol., 558, 129–143, https://doi.org/10.1016/j.jhydrol.2018.01.003, 2018.
Diamond, J. S., Bernal, S., Boukra, A., Cohen, M. J., Lewis, D., Masson, M., Moatar, F., and Pinay, G.: Stream network variation in dissolved oxygen: Metabolism proxies and biogeochemical controls, Ecological Indicators, 131, 108233, https://doi.org/10.1016/j.ecolind.2021.108233, 2021.
Diamond, J. S., Moatar, F., Cohen, M. J., Poirel, A., Martinet, C., Maire, A., and Pinay, G.: Metabolic regime shifts and ecosystem state changes are decoupled in a large river, Limnol. Oceanogr., 67, S54–S70, https://doi.org/10.1002/lno.11789, 2022.
Diamond, J. S., Truong, A. N., Abril, G., Bertuzzo, E., Chanudet, V., Lamouroux, R., and Moatar, F.: Inorganic carbon dynamics and their relation to autotrophic community regime shift over three decades in a large, alkaline river, Limnol. Oceanogr., 70, 1122–1136, https://doi.org/10.1002/lno.70016, 2025.
Dodds, W. K. and Smith, V. H.: Nitrogen, phosphorus, and eutrophication in streams, Inland Waters, 6, 155–164, https://doi.org/10.5268/IW-6.2.909, 2016.
Duvert, C., Butman, D. E., Marx, A., Ribolzi, O., and Hutley, L. B.: CO2 evasion along streams driven by groundwater inputs and geomorphic controls, Nat. Geosci., 11, 813–818, https://doi.org/10.1038/s41561-018-0245-y, 2018.
Etcheber, H., Taillez, A., Abril, G., Garnier, J., Servais, P., Moatar, F., and Commarieu, M.-V.: Particulate organic carbon in the estuarine turbidity maxima of the gironde, loire and seine estuaries: origin and lability, Hydrobiologia, 588, 245–259, https://doi.org/10.1007/s10750-007-0667-9, 2007.
Floury, M., Delattre, C., Ormerod, S. J., and Souchon, Y.: Global versus local change effects on a large european river, Sci. Total Environ., 441, 220–229, https://doi.org/10.1016/j.scitotenv.2012.09.051, 2012.
He, H., Wang, Y., Liu, Z., Bao, Q., Wei, Y., Chen, C., and Sun, H.: Lake metabolic processes and their effects on the carbonate weathering CO2 sink: insights from diel variations in the hydrochemistry of a typical karst lake in SW china, Water Res., 222, 118907, https://doi.org/10.1016/j.watres.2022.118907, 2022.
Hotchkiss, E. R., Hall Jr., R. O., Sponseller, R. A., Butman, D., Klaminder, J., Laudon, H., Rosvall, M., and Karlsson, J.: Sources of and processes controlling CO2 emissions change with the size of streams and rivers, Nat. Geosci., 8, 696–699, https://doi.org/10.1038/ngeo2507, 2015.
Hub'Eau – Eaufrance: Groundwater quality data, BRGM [data set], https://hubeau.eaufrance.fr/page/api-qualite-nappes (last access: 15 April 2024), 2024.
Humphreys, M. P., Lewis, E. R., Sharp, J. D., and Pierrot, D.: PyCO2SYS v1.8: marine carbonate system calculations in Python, Geosci. Model Dev., 15, 15–43, https://doi.org/10.5194/gmd-15-15-2022, 2022.
Hussain, Md. and Mahmud, I.: pyMannKendall: a python package for non parametric mann kendall family of trend tests., J. Open Source Softw., 4, 1556, https://doi.org/10.21105/joss.01556, 2019.
Hydro Eaufrance: Daily discharge data, SCHAPI [data set], https://www.hydro.eaufrance.fr/ (last access: 15 April 2024), 2024.
Ibáñez, C., Caiola, N., Barquín, J., Belmar, O., Benito, X., Casals, F., Fennessy, S., Hughes, J., Palmer, M., Peñuelas, J., Romero, E., Sardans, J., and Williams, M.: Ecosystem-level effects of re-oligotrophication and N:P imbalances in rivers and estuaries on a global scale, Global Change Biology, 29, 1248–1266, https://doi.org/10.1111/gcb.16520, 2022.
Janssen, P., Chevalier, R., Chantereau, M., Dupré, R., Evette, A., Hémeray, D., Mårell, A., Martin, H., Rodrigues, S., Villar, M., and Greulich, S.: Can vegetation clearing operations and reprofiling of bars be considered as an ecological restoration measure? Lessons from a 10-year vegetation monitoring program (loire river, france), Restor. Ecol., 31, e13704, https://doi.org/10.1111/rec.13704, 2023.
Jones, A. S., Jones, T. L., and Horsburgh, J. S.: Toward automating post processing of aquatic sensor data, Environ. Modell. Softw., 151, 105364, https://doi.org/10.1016/j.envsoft.2022.105364, 2022.
Jones, J. B., Stanley, E. H., and Mulholland, P. J.: Long-term decline in carbon dioxide supersaturation in rivers across the contiguous united states, Geophys. Res. Lett., 30, 2003GL017056, https://doi.org/10.1029/2003GL017056, 2003.
Kim, D., Lim, J.-H., Chun, Y., Nayna, O. K., Begum, M. S., and Park, J.-H.: Phytoplankton nutrient use and CO2 dynamics responding to long-term changes in riverine N and P availability, Water Res., 203, 117510, https://doi.org/10.1016/j.watres.2021.117510, 2021.
Kirk, L. and Cohen, M. J.: River corridor sources dominate CO2 emissions from a lowland river network, J. Geophys. Res.-Biogeo., 128, e2022JG006954, https://doi.org/10.1029/2022JG006954, 2023.
Koehler, B., Landelius, T., Weyhenmeyer, G. A., Machida, N., and Tranvik, L. J.: Sunlight-induced carbon dioxide emissions from inland waters, Global Biogeochem. Cycles, 28, 696–711, https://doi.org/10.1002/2014GB004850, 2014.
Lan, X., Tans, P., and Thoning, K.: Trends in globally-averaged CO2 determined from NOAA Global Monitoring Laboratory measurements, Version 2023-07, Global Monitoring Laboratory [data set], https://doi.org/10.15138/9N0H-ZH07, 2023.
Liu, S., Kuhn, C., Amatulli, G., Aho, K., Butman, D. E., Allen, G. H., Lin, P., Pan, M., Yamazaki, D., Brinkerhoff, C., Gleason, C., Xia, X., and Raymond, P. A.: The importance of hydrology in routing terrestrial carbon to the atmosphere via global streams and rivers, P. Natl. Acad. Sci. USA, 119, e2106322119, https://doi.org/10.1073/pnas.2106322119, 2022.
Lynch, J. K., Beatty, C. M., Seidel, M. P., Jungst, L. J., and DeGrandpre, M. D.: Controls of riverine CO2 over an annual cycle determined using direct, high temporal resolution pCO2 measurements, J. Geophys. Res.-Biogeo., 115, 2009JG001132, https://doi.org/10.1029/2009JG001132, 2010.
Marescaux, A., Thieu, V., Borges, A. V., and Garnier, J.: Seasonal and spatial variability of the partial pressure of carbon dioxide in the human-impacted seine river in france, Sci. Rep., 8, 13961, https://doi.org/10.1038/s41598-018-32332-2, 2018.
Météo-France: Daily global radiation data, Météo-France [data set], https://donneespubliques.meteofrance.fr/ (last access: 15 April 2024), 2024.
Millero, F. J.: The thermodynamics of the carbonate system in seawater, Geochim. Cosmochim. Ac., 43, 1651–1661, https://doi.org/10.1016/0016-7037(79)90184-4, 1979.
Minaudo, C., Meybeck, M., Moatar, F., Gassama, N., and Curie, F.: Eutrophication mitigation in rivers: 30 years of trends in spatial and seasonal patterns of biogeochemistry of the Loire River (1980–2012), Biogeosciences, 12, 2549–2563, https://doi.org/10.5194/bg-12-2549-2015, 2015.
Minaudo, C., Moatar, F., Coynel, A., Etcheber, H., Gassama, N., and Curie, F.: Using recent high-frequency surveys to reconstitute 35 years of organic carbon variations in a eutrophic lowland river, Environ. Monit. Assess., 188, 1–17, https://doi.org/10.1007/s10661-015-5054-9, 2016.
Moatar, F. and Meybeck, M.: Compared performances of different algorithms for estimating annual nutrient loads discharged by the eutrophic River Loire, Hydrol. Process., 19, 429–444, https://doi.org/10.1002/hyp.5541, 2005.
Moatar, F., Fessant, F., and Poirel, A.: pH modelling by neural networks. Application of control and validation data series in the middle loire river, Ecol. Modell., 120, 141–156, https://doi.org/10.1016/S0304-3800(99)00098-8, 1999.
Moatar, F., Miquel, J., and Poirel, A.: A quality-control method for physical and chemical monitoring data. Application to dissolved oxygen levels in the river loire (france), J. Hydrol., 252, 25–36, https://doi.org/10.1016/S0022-1694(01)00439-5, 2001.
Moatar, F., Descy, J.-P., Rodrigues, S., Souchon, Y., Floury, M., Grosbois, C., Minaudo, C., Leitao, M., Wantzen, K. M., and Bertrand, F.: Chapter 7 – the loire river basin, in: Rivers of Europe (Second Edition), edited by: Tockner, K., Zarfl, C., and Robinson, C. T., Elsevier, 245–271, https://doi.org/10.1016/B978-0-08-102612-0.00007-9, 2022.
Naiades – Eaufrance: Surface water quality data, Office International de l'Eau [data set], http://www.naiades.eaufrance.fr (last access: 15 April 2024), 2024.
Odum, H. T.: Primary Production in Flowing Waters, Limnol. Oceanogr., 1, 102–117, https://doi.org/10.4319/lo.1956.1.2.0102, 1956.
Raymond, P. A., Caraco, N. F., and Cole, J. J.: Carbon dioxide concentration and atmospheric flux in the hudson river, Estuaries, 20, 381, https://doi.org/10.2307/1352351, 1997.
Raymond, P. A., Zappa, C. J., Butman, D., Bott, T. L., Potter, J., Mulholland, P., Laursen, A. E., McDowell, W. H., and Newbold, D.: Scaling the gas transfer velocity and hydraulic geometry in streams and small rivers, Limnol. Oceanogr. Fluids Environ., 2, 41–53, https://doi.org/10.1215/21573689-1597669, 2012.
Raymond, P. A., Hartmann, J., Lauerwald, R., Sobek, S., McDonald, C., Hoover, M., Butman, D., Striegl, R., Mayorga, E., Humborg, C., Kortelainen, P., Dürr, H., Meybeck, M., Ciais, P., and Guth, P.: Global carbon dioxide emissions from inland waters, Nature, 503, 355–359, https://doi.org/10.1038/nature12760, 2013.
Reed, A. P., Stets, E. G., Murphy, S. F., and Mullins, E. A.: Aquatic-terrestrial linkages control metabolism and carbon dynamics in a mid-sized, urban stream influenced by snowmelt, J. Geophys. Res.-Biogeo., 126, e2021JG006296, https://doi.org/10.1029/2021JG006296, 2021.
Rocher-Ros, G., Sponseller, R. A., Bergström, A., Myrstener, M., and Giesler, R.: Stream metabolism controls diel patterns and evasion of CO 2 in arctic streams, Global Change Biol., 26, 1400–1413, https://doi.org/10.1111/gcb.14895, 2020.
Rocher-Ros, G., Harms, T. K., Sponseller, R. A., Väisänen, M., Mörth, C.-M., and Giesler, R.: Metabolism overrides photo-oxidation in CO2 dynamics of Arctic permafrost streams, Limnol. Oceanogr., 66, S169–S181, https://doi.org/10.1002/lno.11564, 2021.
Seabold, S. and Perktold, J.: Statsmodels: econometric and statistical modeling with python, Python in Science Conference, Austin, Texas, 92–96, https://doi.org/10.25080/Majora-92bf1922-011, 2010.
Solano, V., Duvert, C., Birkel, C., Maher, D. T., García, E. A., and Hutley, L. B.: Stream respiration exceeds CO2 evasion in a low-energy, oligotrophic tropical stream, Limnol. Oceanogr., 68, 1132–1146, https://doi.org/10.1002/lno.12334, 2023.
Thiéry, D.: ÉROS: a semi-global hydrological modelling application for a catchment area divided into sub-basins, https://www.brgm.fr/en/software/eros-semi-global-hydrological-modelling-application-catchment-area-divided-sub-basins (last access: 15 April 2024), 2018.
Trentman, M. T., Hall, R. O., and Valett, H. M.: Exploring the mismatch between the theory and application of photosynthetic quotients in aquatic ecosystems, Limnol. Oceanogr. Lett., 8, 565–579, https://doi.org/10.1002/lol2.10326, 2023.
Truong, C., Oudre, L., and Vayatis, N.: Selective review of offline change point detection methods, Signal Process., 167, 107299, https://doi.org/10.1016/j.sigpro.2019.107299, 2020.
Tsypin, M. and Macpherson, G. L.: The effect of precipitation events on inorganic carbon in soil and shallow groundwater, konza prairie LTER site, NE kansas, USA, Appl. Geochem., 27, 2356–2369, https://doi.org/10.1016/j.apgeochem.2012.07.008, 2012.
Van Vliet, M. T. H., Franssen, W. H. P., Yearsley, J. R., Ludwig, F., Haddeland, I., Lettenmaier, D. P., and Kabat, P.: Global river discharge and water temperature under climate change, Global Environ. Change, 23, 450–464, https://doi.org/10.1016/j.gloenvcha.2012.11.002, 2013.
Vihermaa, L. E., Waldron, S., Garnett, M. H., and Newton, J.: Old carbon contributes to aquatic emissions of carbon dioxide in the Amazon, Biogeosciences, 11, 3635–3645, https://doi.org/10.5194/bg-11-3635-2014, 2014.
Wallin, M. B., Audet, J., Peacock, M., Sahlée, E., and Winterdahl, M.: Carbon dioxide dynamics in an agricultural headwater stream driven by hydrology and primary production, Biogeosciences, 17, 2487–2498, https://doi.org/10.5194/bg-17-2487-2020, 2020.
Young, F. L., Colman, B. P., Carter, A. M., Fiejó De Lima, R., Shangguan, Q., Payn, R. A., and DeGrandpre, M. D.: Variability and Controls of pCO2 and Air-Water CO2 Fluxes in a Temperate River, JGR Biogeosciences, 130, e2024JG008434, https://doi.org/10.1029/2024JG008434, 2025.
Zhang, T., Li, J., Pu, J., Martin, J. B., Khadka, M. B., Wu, F., Li, L., Jiang, F., Huang, S., and Yuan, D.: River sequesters atmospheric carbon and limits the CO2 degassing in karst area, southwest China, Sci. Total Environ., 609, 92–101, https://doi.org/10.1016/j.scitotenv.2017.07.143, 2017.
- Abstract
- Introduction
- Methods
- Results
- Discussion
- Conclusions
- Appendix A: Dataset integrity and validation
- Appendix B: Model Validation and Uncertainty
- Appendix C: Statistical Analyses of Long-Term Trends
- Appendix D: Analysis of Hydroclimatic and External Drivers on FCO2
- Data availability
- Author contributions
- Competing interests
- Disclaimer
- Acknowledgements
- Review statement
- References
- Supplement