the Creative Commons Attribution 4.0 License.
the Creative Commons Attribution 4.0 License.
 | 29 Sep 2025
Snow thermal conductivity controls future winter carbon emissions in shrub–tundra
Johnny Rutherford
Nick Rutter
Leanne Wake
Alex J. Cannon
The Arctic winter is disproportionately vulnerable to climate warming and approximately 1700 Gt of carbon stored in high-latitude permafrost ecosystems is at risk of degradation in the future due to enhanced microbial activity. Few studies have been directed at high-latitude cold season land–atmosphere processes and it is suggested that the contribution of winter season greenhouse gas (GHG) fluxes to the annual carbon budget may have been underestimated. Snow, acting as a thermal blanket, influences the Arctic soil temperatures during winter and parameters such as snow effective thermal conductivity (Keff) are not well constrained in land surface models, which impacts our ability to accurately simulate wintertime soil carbon emissions. To address this, we investigated the impacts of implementing a Keff parameterisation more suitable to Arctic snowpacks into the Community Land Model (CLM5.0). A point-model version of CLM5.0 forced by an ensemble of NA-CORDEX (North American Coordinated Regional Downscaling Experiment) future climate realisations (RCP 4.5 and 8.5) indicates that median winter CO2 emissions will have more than tripled by the end of the century (2066–2096) under RCP 8.5. Implementing the refined Keff parameterisation increases simulated winter CO2 in the latter half of the century (2066–2096) by 130 % and CH4 flux by 50 % under RCP 8.5 compared to the widely used default Keff parameterisation. The influence of snow Keff parameterisation within CLM5.0 on future simulated CO2 and CH4 is at least as significant, if not more so, than climate variability from a range of NA-CORDEX projections to 2100. The average difference in refined Keff compared with the default Keff raises minimum winter soil temperatures by 4–7 °C by the end of the century under RCP 4.5 and 8.5. Furthermore, CLM5.0 simulations using the refined Keff show an extension of the early winter (September–October) zero-curtain period, by nearly a month under RCP 8.5. Consequently, recent increases in both zero-curtain duration and winter CO2 emissions appear set to continue to 2100. Modelled winter soil temperatures and carbon emissions further highlight the importance of climate mitigation in preventing a significant increase in winter carbon emissions from the Arctic in the future.
- Article
(5704 KB) - Full-text XML
- BibTeX
- EndNote


It is estimated that ∼ 1700 Gt of carbon is stored in the permafrost ecosystems of northern latitudes (Miner et al., 2022), which accounts for half of the global soil carbon storage (Hugelius et al., 2014) and is at risk of degradation due to climate change (Koven et al., 2013). The near-surface permafrost temperature has been increasing 1.1 °C decade−1 since 1987 (AMAP, 2017), which acts to reduce the near-surface permafrost extent and increase active layer thickness (Intergovernmental Panel on Climate, 2023); such loss of permafrost drives the further release of carbon in the form of CO2 during winter. Arctic winters are estimated to warm by 4.8 °C by 2100 compared to 2.2 °C in the summer over the same period (Webb et al., 2016; Christensen et al., 2013). Climate warming has enhanced the warming of the soil at Arctic sites in the recent past (AMAP, 2017; Ednie and Smith, 2015) and future warming will enhance the microbial decomposition of soil organic matter, driving the subsequent release of carbon dioxide (CO2) and methane (CH4) (Natali et al., 2019; Schuur et al., 2015). Furthermore, the winter carbon flux is crucial to the annual carbon budget, as demonstrated through flux measurements from a tundra site, where approximately 60 % of CO2 uptake in the growing season was then lost in the non-growing period, and CH4 emissions during this period accounted for 30 % of the annual budget (Kittler et al., 2017). Arctic tundra ecosystems, once considered to be carbon sinks, are increasingly acting as carbon sources due to elevated winter carbon emissions driven by rising temperatures and deeper snow cover (Pongracz et al., 2021; Fahnestock et al., 1999; Welker et al., 2000; Schimel et al., 2004). Future winter emissions will likely offset growing season uptake under Representative Concentration Pathways (RCP) 4.5 (medium global emission scenario) and 8.5 (high global emission scenario) (Natali et al., 2019). Additionally, the Arctic winter is longer than the growing season (the latter being typically 2–5 months in length), and therefore may represent a substantial input of carbon to the atmosphere that is not accurately represented in current climate models nor quantified accurately in global carbon budgets (Treat et al., 2024). Assessing simulations of heat and gas fluxes to and from subnivean soils is therefore critical in understanding how well models, such as the Community Land Model (CLM5.0; Lawrence et al., 2019), can be expected to simulate future carbon cycling in the Arctic.
Arctic snow is a key determinant of ground temperature and plays a major role in the wider hydrological and ecological Arctic system (Callaghan et al., 2011). The hydrological cycle in the Arctic is projected to intensify throughout the 21st century and new model estimates from the Coupled Model Intercomparison Project 6 (CMIP6) support a future transition from a snow- to rain-dominated Arctic in the summer and autumn by 2100 (McCrystall et al., 2021). Despite future temperatures still being cold enough to enhance snowfall, winter rainfall also intensifies, with projected increases even matching that of snow (Bintanja and Andry, 2017). Snow is a key determinant of ground temperature and the freeze–thaw state through its insulating properties (Bigalke and Walsh, 2022). The prospect of a rain-dominated Arctic has implications for soil temperature, through changes in the snow cover duration (Mudryk et al., 2021; Mudryk et al., 2020), insulative and structural snow properties (Cohen et al., 2015; Serreze et al., 2021), and increased soil moisture (Trenberth, 1998; Cohen et al., 2015). In the recent past (1979–2018) snowpack properties have featured significant increases in the spring snow bulk density (May and June), a downward trend in the snow cover duration, and an upward trend in wet snow, all of which have resulted in a soil surface temperature increase of +0.41 K decade−1 in winter (Royer et al., 2021). Such temperature increases, induced by snowpack evolution may contribute to increased soil heterotrophic respiration and carbon release (CO2 and CH4) in future winters (Natali et al., 2019).
The “shoulder” seasons, defined here as the early (after the summer plant senescence has ended) and late (before the snowmelt is complete) winter period (Natali et al., 2019), are a critical period in the context of the annual Arctic carbon budget, especially in terms of CH4, where zero-curtain (when soil temperatures are poised near 0 °C, such as in early winter) emissions alone contribute around ∼ 20 % of the annual budget (Zona et al., 2016). In terms of CO2, historic early winter season emission rates have increased 73 % ± 11 % since 1975 (October–December) (Commane et al., 2017) in response to a warming climate, demonstrating the vulnerability of this period to future warming. To date Earth system models (ESMs) have poorly simulated respiration in the early winter shoulder season (Commane et al., 2017), which is a key component of the annual Arctic carbon budget (Kittler et al., 2017). This study addresses this knowledge gap by examining how projected changes in the shoulder season air temperature, precipitation, snow thermal conductivity, and soil temperature influence the cold season carbon dynamics (Figs. 2–5).
Land surface models (LSMs) such as CLM5.0 struggle to accurately reproduce cold season CH4 and CO2 emissions due to uncertain numerical representation of mechanisms controlling heterotrophic respiration (Zona et al., 2016; Commane et al., 2017; Tao et al., 2021; Natali et al., 2019). One such mechanism is the mediation of winter soil temperatures by the insulating effect of seasonal snow. The default parameterisation of snow thermal conductivity (Keff, ; Jordan, 1991) in CLM5.0 produces winter soil temperatures that are colder than observations (Dutch et al., 2024), which may contribute to an underestimation of the soil respiration (SR) in the early winter (Commane et al., 2017). Sturm et al. (1997) presented an alternative parameterisation for Keff derived from extensive Arctic snow measurements (n = 488) that was implemented into CLM5.0 by Dutch et al. (2024). The Sturm et al. (1997) parameterisation is more relevant for Arctic snow types compared to Jordan (1991), as it accounts for snow layers such as basal depth hoar and wind slab within the snowpack and produced more accurate simulations of subnivean soil temperature (Dutch et al., 2024). Further, the CLM5.0 default soil moisture threshold for decomposition (Ψmin = −2 MPa) is too high to permit sub-zero SR and this has been identified as a limitation in winter simulations (Tao et al., 2021; Dutch et al., 2024). Similarly, the CLM5.0 default settings of Q10 (1.5) and Q10ch4 (1.3), which dictate respiratory responses to changes in temperature, are too low for Arctic tundra environments (Müller et al., 2015; Dutch et al., 2024). These parameters Ψmin, Q10, and Q10ch4, alongside Keff, require adjustment to realistically simulate soil temperature (TSOI), SR, and methane flux (FCH4) under cold season conditions. Implementing the Sturm et al. (1997) parameterisation reduces cold bias in simulated soil temperatures by two-thirds. Further, while the default CLM5.0 produces negligible winter net ecosystem exchange (NEE), combining the Sturm et al. (1997) parameterisation with a mid-range value for Ψmin (−20 MPa) produces winter NEE values consistent with field observations (Dutch et al., 2024; Fig. 5). Our study applies Q10 and Ψmin values suitable for tundra soil as defined by Dutch et al. (2024) to investigate the influence of different Keff parameterisations on future projections of soil temperature and carbon emissions.
This study assesses the sensitivity of SR (i.e. soil CO2 flux to the atmosphere during winter) and CH4 flux to Keff, Ψmin, Q10, and Q10ch4 within CLM5.0, and presents future projections of carbon emissions for Trail Valley Creek (TVC) to 2100. Firstly, future changes in Arctic meteorology at TVC are analysed using an ensemble (n = 33) of future NA-CORDEX (North American Coordinated Regional Downscaling Experiment) projections (McGinnis and Mearns, 2021), representing varying global climate model–regional climate model (GCM–RCM) combinations; RCP scenarios (4.5; n = 6 and 8.5; n = 27), and RCM resolutions (0.22°; n = 11, and 0.44°; n = 22). The NA-CORDEX ensemble is then applied to a point model of the default version CLM5.0 (“CORDEX-Jordan”) to simulate present (2016–2046) and future (2066–2096) snow water equivalent (SWE), 10 cm ground temperature (GT10), and soil moisture (SOILLIQ) and resulting winter SR and CH4 fluxes. The ensemble of experiments is then re-run, with the representation of Keff changed from Jordan (1991) to Sturm et al. (1997) to assess the impact on the soil temperature; this ensemble is named “CORDEX-Sturm”. Finally, a plausible parameter space of Ψmin, Q10, and Q10ch4 for Arctic environments is applied to each experiment grouping (CORDEX-Jordan and CORDEX-Sturm) to assess the effect of assumptions governing the moisture- and temperature-related controls on SR, resulting in an overall set of 396 experiments to quantify the effects of parametric and future climate uncertainty on carbon emissions at TVC.
2.1 Study location
Point scale CLM5.0 simulations were produced for TVC (68°45′ N, 133°30′ W), a research basin on the boundary of the boreal-tundra ecotone ∼ 50 km north of Inuvik in the Inuvialuit Settlement Region of western Inuit Nunangat in the Western Canadian Arctic. The basin lies within the Inuvialuit Settlement Region near the Inuvik-Tuktoyaktuk Highway. Vegetation consists of shrub–tundra and is dominated by mineral earth hummocks. The mean annual air temperature from 1999–2018 averaged −7.9 °C (Grünberg et al., 2019), with average seasonal variations of +10 °C in summer and −25 °C in winter (1995) (Marsh et al., 2002). Air temperatures increased 1.1 °C decade−1 during the 1990–2018 period, with the strongest warming observed in May (2.8 °C decade−1) (Grünberg et al., 2019). The snow depth at TVC is typically < 50 cm, with deeper packs associated with variations in topography and vegetation (King et al., 2018). The snow is often redistributed by wind, resulting in scour and snow drift features (Thompson et al., 2016). Snow cover typically lasts for 8 months (October–May) and the underlying permafrost is between 350–500 m in thickness, with an active layer of 0.5–1.0 m (Wilcox et al., 2019; Dutch et al., 2024). Tundra environments occupy ∼ 31 % of the Canadian Arctic (Bliss and Matveyeva, 1992; Quinton et al., 2000) and well-drained, shrub- and lichen-covered uplands, such as those at TVC, comprise 80 % of the Arctic-boreal region (Voigt et al., 2023). TVC has long lasting concurrent hydrometeorological and eddy covariance (EC) carbon flux data since 2013 (Tutton et al., 2024), which can be used to bias-correct future meteorological simulations (see Sect. 2.2).
2.2 Meteorological forcing data and simulations using CLM5.0
The NA-CORDEX meteorological forcing data (incoming shortwave and longwave radiation, precipitation, humidity, wind speed, air pressure, and min and max temperature) for the grid cell closest to TVC provide CLM5.0 with daily meteorological conditions to 2100. This forcing dataset was generated from a suite of 33 bias-corrected GCM–RCM combinations for North America (McGinnis and Mearns, 2021) run under full transient conditions with a historical period spanning 1950–2005 and with scenarios RCPs 4.5 and 8.5 for 2006–2100 at 0.22 and 0.44° resolution. To minimise the influence of climate model bias on model results, the meteorological forcing data from the climate models were bias-adjusted to match the statistical characteristics of the meteorological observations (Tutton et al., 2024) in the overlapping 1992–2022 period following Cannon (2018) and Cannon et al. (2022). The CLM5.0 was run in “point mode” (a 0.1° × 0.1° grid cell) and centred at the location of TVC as per Dutch et al. (2021). A model spinup is required to stabilise the carbon pools within CLM5.0 prior to model initiation; model simulations were spun up for 512 years and full details of these spinup conditions are outlined in Dutch et al. (2024).
2.3 The CLM5.0 parameter assessment
Keff describes the rate of heat transfer from the atmosphere through the snow to underlying soils and as such Keff influences the heterotrophic respiration rates and subsequent production of CO2 and CH4. The CLM5.0 default Keff parameterisation using Jordan (1991) overestimates Keff by a factor of 3 for tundra snow (Dutch et al., 2021). In the CLM5.0, Keff is parameterised as a function of snow density (ρ, kg m−3) (Eq. 1), which is calculated from relative proportions of ice mass (mi) and liquid water mass (mlw), weighted by the snow cover fraction (Fsno) multiplied by the height of the snow layer (hsl) for each grid cell. Keff can then be calculated using coefficients in Eq. (2) (Jordan, 1991), which utilises the thermal conductivity of air and ice (Kice−Kair), or Eq. (3) (Sturm et al., 1997):
The use of the snow thermal conductivity parameterisation following Sturm et al. (1997) improved soil temperature simulations in CLM5.0 at TVC (Dutch et al., 2021) and at other sites with additional LSMs (Royer et al., 2021). Here, the Sturm et al. (1997) Keff parameterisation was applied to future CLM5.0 simulations and compared with the default parameterisation which follows Jordan (1991). CLM5.0 uses Ψmin to describe the soil moisture threshold for respiration (MPa). Without adjustments to Ψmin, CLM5.0 simulates near-zero SR for the majority of the snow-covered, non-growing season, which is not consistent with field observations (Dutch et al., 2024). Reducing Ψmin facilitates respiration in moisture-limited soils (Tao et al., 2021). Ψmin is applied in CLM5.0, as described by Andren and Paustian (1987):
where the rate scalar for soil water potential (rW) is calculated from Ψj that is the soil water potential in soil layer j, and as upper and lower limits. The default values of for CLM5.0 are −2 and −0.002 MPa, respectively.
As well as Keff and Ψmin, we also focus on the temperature soil decomposition modifier rT, which is parameterised using a Q10 function which describes the dependence of biological metabolic processes, such as respiration, on temperature. rT is calculated as follows:
where Tj is the temperature of soil layer j and Tref is a reference temperature with a default value of 25 °C. CLM5.0 uses a fixed Q10 of 1.5; however, this is unrealistic for Arctic ecosystems, which typically have an average Q10 of 5.4 (Chen et al., 2020). A range of Ψmin (“minpsi_ hr”, −2 to −20 MPa) and Q10 (“q10_ hr”, “froz_ q10”, 1.5 to 7.5) was used to assess the sensitivity of CLM5.0 for future simulations to 2100. A parameter “q10ch4” within the methane module of CLM5.0 which controls the temperature dependency of CH4 production is available and was tested from its default value 1.33 to a plausible extreme of 4 (Müller et al., 2015; Riley et al., 2011) with a reference temperature of 22 °C. We implemented a broad range of Q10 and q10ch4 (1.5–7.5) to capture variability in the temperature sensitivity of SR associated with differences in carbon pool lability (Fierer et al., 2005; Yan et al., 2017). The full range of tested parameters is presented in Fig. A1.
A major focus of this study is the winter season when snow is on the ground (i.e. the snow-covered non-growing season). We define this period as the time when all model ensemble members (RCP 4.5 n = 6, RCP 8.5 n = 27) agree that the SWE is > 5 mm. Simulations of SR and FCH4 are filtered by these constraints so the analysis in Figs. 5 and 6 is focused only on carbon fluxes across a common snow-covered, non-growing season in all scenarios and forcing datasets. The resulting data are therefore weighted towards a shorter snow cover period as ensemble members capture a range of snow cover durations. Periods of the winter season that are critical to driving the timing and rates of respiration are described as follows. The “zero-curtain period” is defined as days where the soil temperature falls between −0.75 and 0.75 °C (Tao et al., 2021; Zona et al., 2016) while “shoulder seasons” describes annual transitional periods of snowmelt (April–May) and plant senescence to freeze up (September–October) (Shogren et al., 2020). Testing for statistically significant differences between distributions of future meteorological conditions and median winter carbon fluxes was evaluated using the non-parametric Kolmogorov–Smirnov (K-S) test.
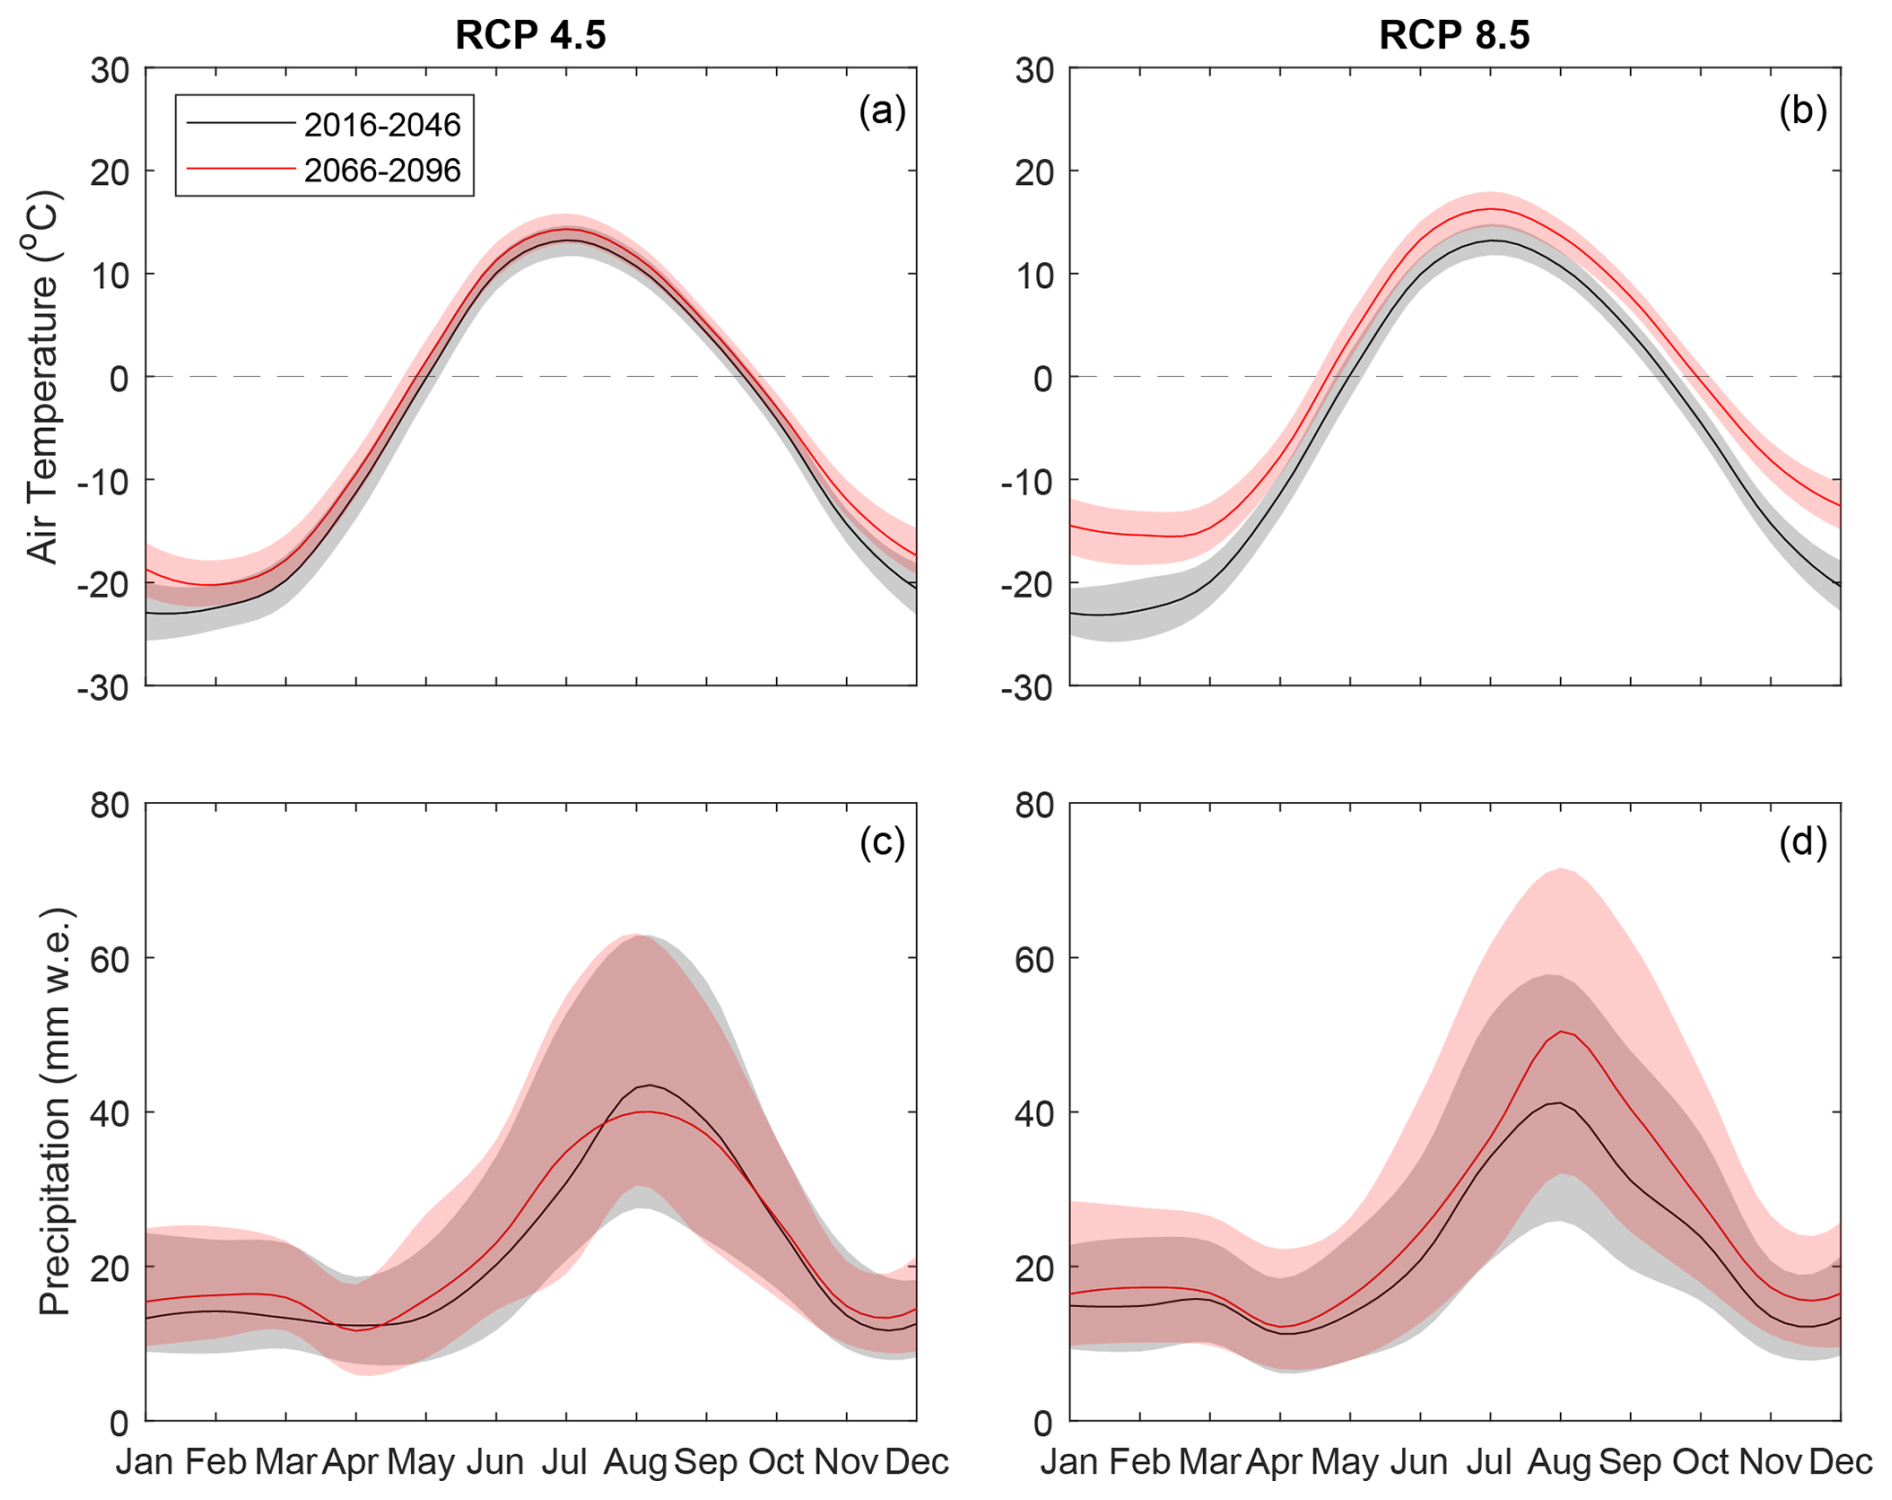
Figure 1Simulated median monthly precipitation and temperature over two 30-year time periods: 2016–2046 (black) and 2066–2096 (red) under RCP 4.5 and RCP 8.5, for TVC, using meteorological data from an ensemble of 33 NA-CORDEX GCM–RCM combinations (RCP 4.5 n = 6, RCP 8.5 n = 27). The shaded areas represent the 25th and 75th percentiles (the variability between individual ensemble members for precipitation is presented in Fig. A1).
3.1 NA-CORDEX meteorological forcing data
Bias-corrected NA-CORDEX model ensemble projections show an increase in future winter air temperatures at TVC, which intensifies under RCP 8.5, with a 9 °C increase from the present to the future in median January air temperatures (Fig. 1a and b). The timing and rate of air temperature increase in the spring is comparable between the present and the future, whereas the rate of cooling after the summer maximum decreases in the future under RCP 8.5 (a decrease of 6.8 °C per month in the present and 5.7 °C per month in the future for July–December). Under RCP 8.5, significant increases in precipitation are projected from July–December, the largest increase occurring in August from 41 to 50 (two sample K-S test, test statistic: D = 0.16, p < 0.05, Fig. 1d). In shoulder season months (April, May, September, and October), projected air temperatures increase on average by 1.6 °C under RCP 4.5 and 3.7 °C under RCP 8.5. Warmer future air temperatures influence the phase of future precipitation with more precipitation falling as rain than snow, especially in transitional shoulder seasons between summer and winter (Fig. 2).
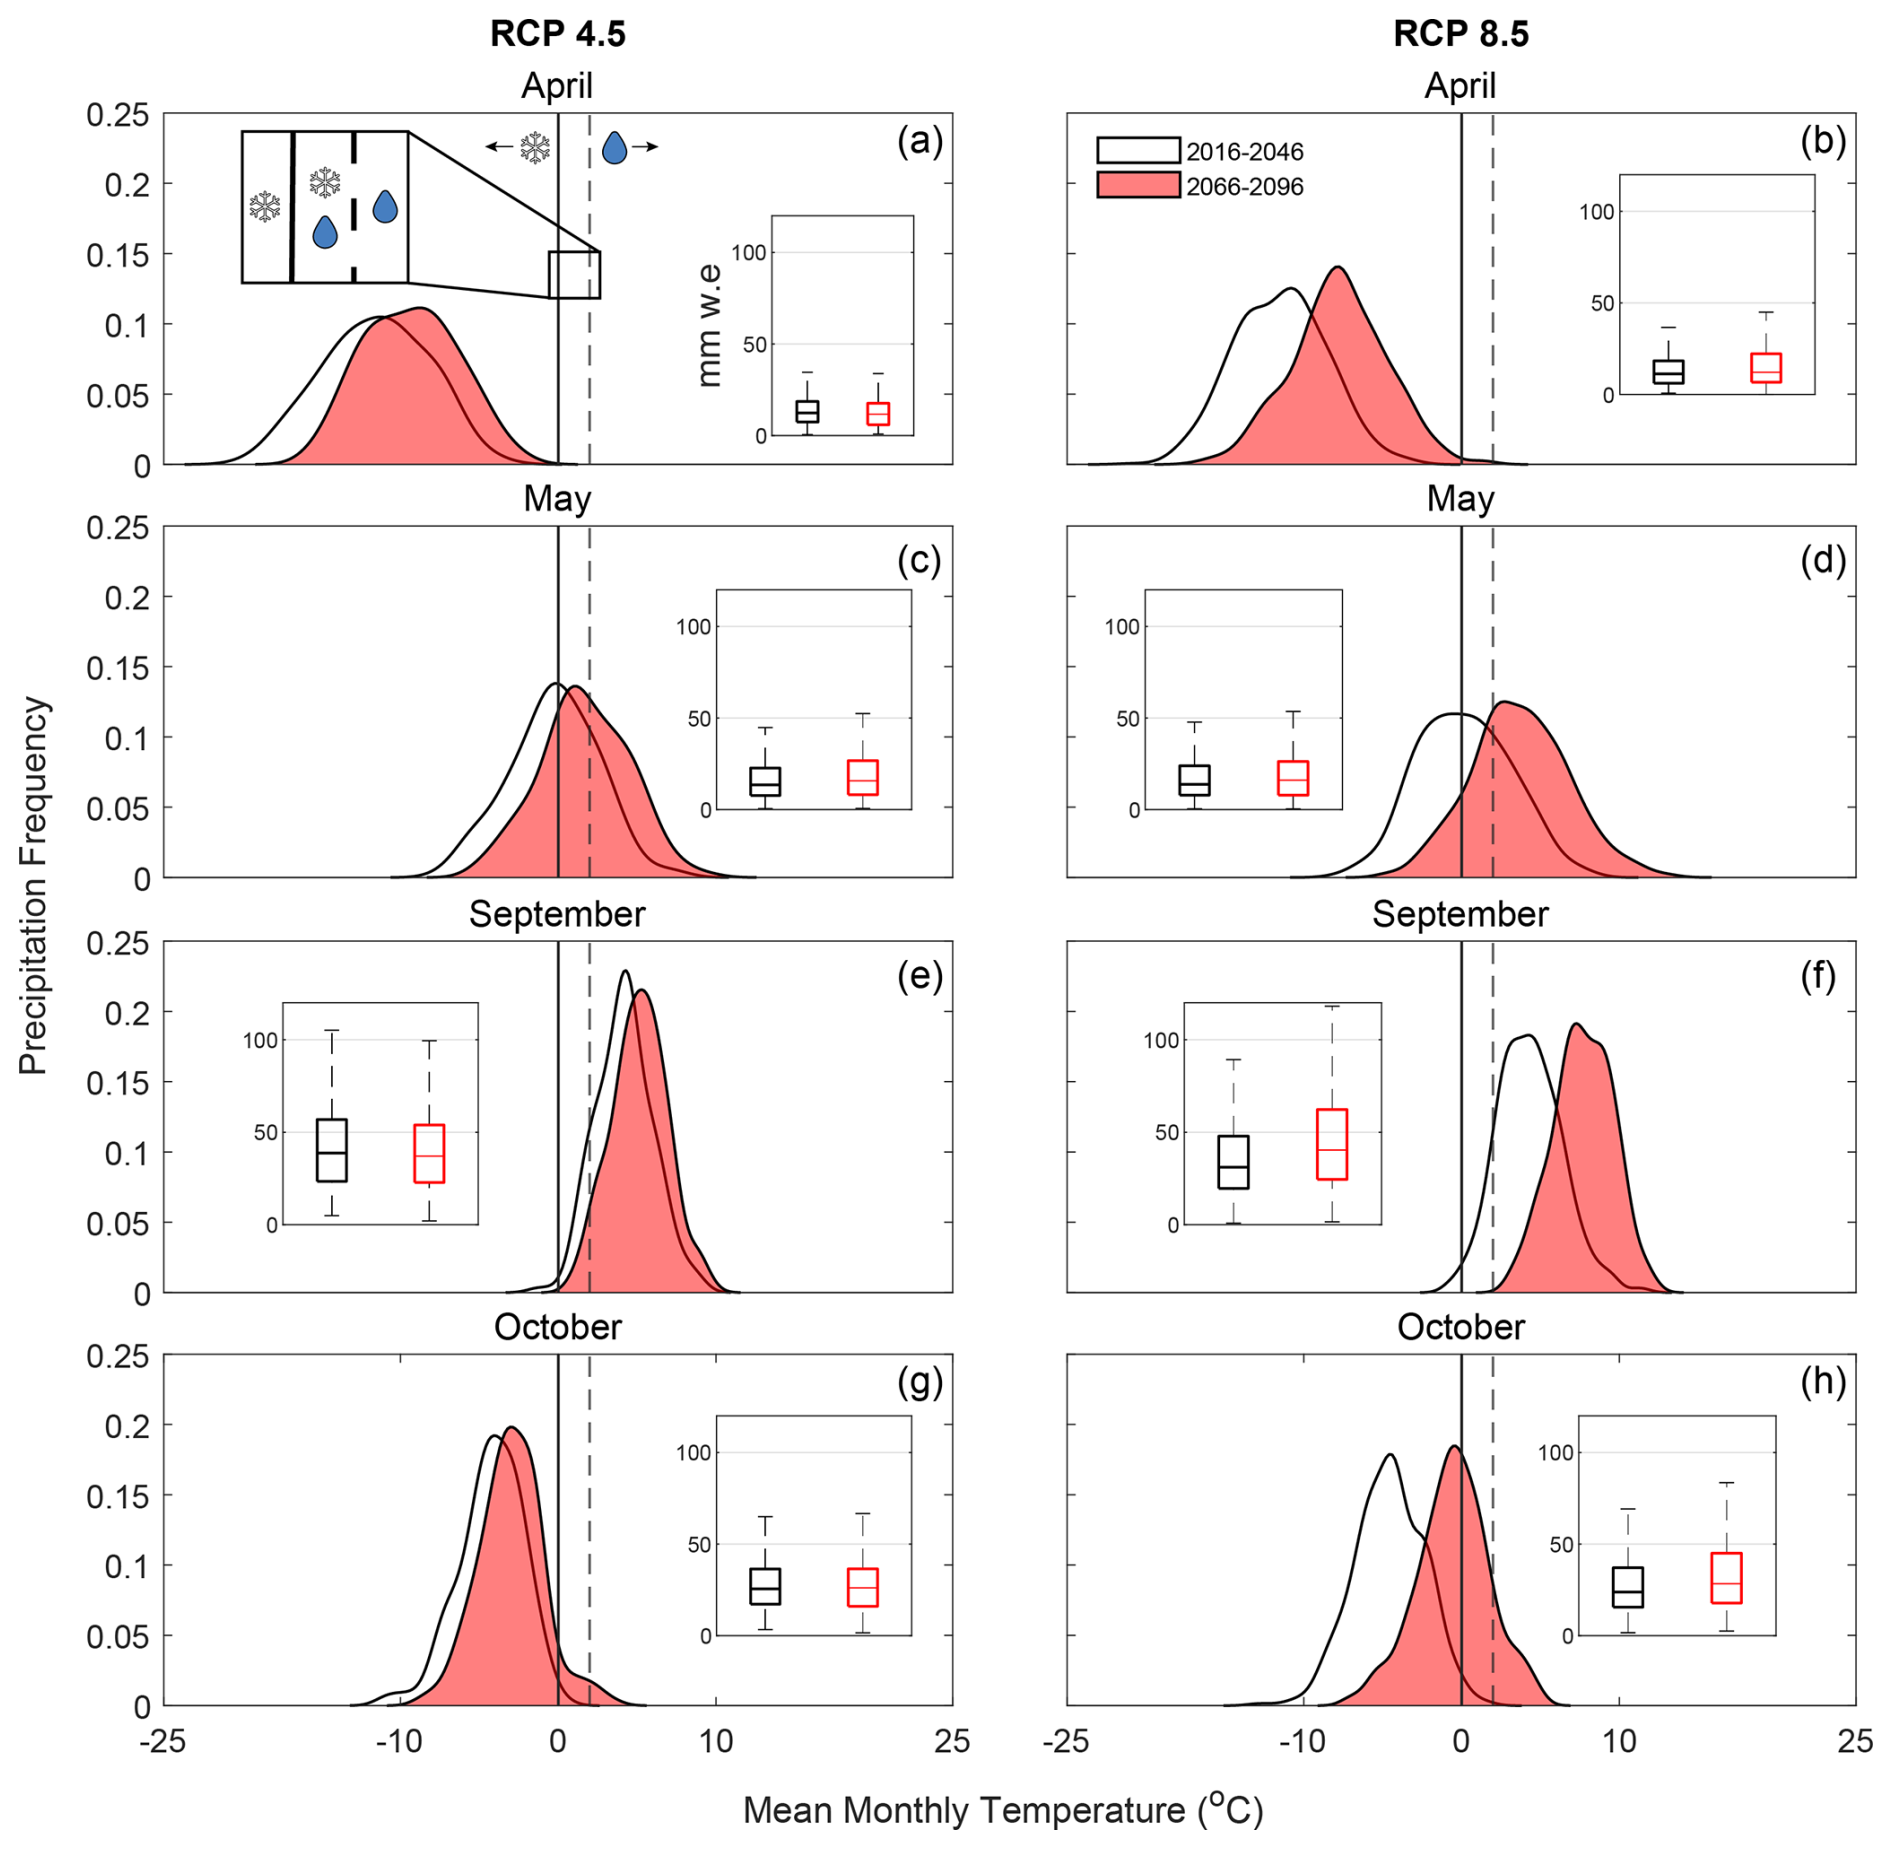
Figure 2The half-violin plots show the frequency distribution of precipitation events as a function of air temperature for TVC in April, May, September, and October under RCP 4.5 (a, c, e, g) and RCP 8.5 (b, d, f, h), from an ensemble of 33 NA-CORDEX GCM–GCM combinations (RCP 4.5 n = 6, RCP 8.5 n = 27). The white violins with black outlines represent 2016–2046 and red violins 2066–2096. The height of each violin represents the frequency of precipitation events at a given temperature. The solid and dashed black lines at 0 and 2 °C show transitional temperatures between snow and rain, where CLM5.0 treats the transition in the precipitation phase as a linear ramp. The inset boxplots show the monthly total precipitation for the two 30-year periods.
Changes in air temperature in May and October cause a phase shift (snow to rain) in the total monthly precipitation under RCP 8.5 from the present to the future (Fig. 2d and h). In May, in the present (2016–2046) 50 % of precipitation events in the current period fall within 0–20 °C (as rain or as a mix of snow and rain) compared to 87 % in the future (2066–2096). In October, only 2 % of precipitation events fall within 0–20 °C compared to 40 % in the future. Furthermore, in May, future (red) peak precipitation frequency occurs at 2.7 °C compared to −0.6 °C at present (black), and in October at −0.5 °C compared to −4.6 °C at present (Fig. 2) under RCP 8.5, which indicates a shoulder season precipitation shift from majority snow to a mix of rain/snow. By contrast, differences between the current and future total precipitation are small (Fig. 2a–h, insets), and increases from the present to the future are significant only in September (two sample K-S test: 31 to 40 mm, D = 0.17, p < 0.05) and October (two sample K-S test: 23 to 28 mm, D = 0.12, p < 0.05) under RCP 8.5. As such, changes in the magnitude and phase of precipitation in the shoulder seasons may influence future snow-season length, snow thermal conductivity (due to an increase in melt conditions), and the subsequent temperature and moisture of soils.
3.2 CLM5.0 simulations
3.2.1 Environmental conditions
An increase in future rainfall in September impacts both the timing of winter onset of snow accumulation and the magnitude of peak SWE later in the winter (Fig. 3). The duration of winter snow cover is shorter in the future where future spring melt-out occurs between 18 to 25 d earlier in both RCP scenarios, while the timing of the initial snow accumulation remains similar (± 4–6 d). The projected future peak annual SWE shows an increase of 14 under RCP 4.5 and a decrease of 6 under RCP 8.5 and early spring snowmelt is coincident with earlier increases in soil temperature in mid-late spring (Fig. 3a–d). Compared to CORDEX-Jordan, snow thermal conductivity using CORDEX-Sturm is lower on average by 0.07 and 0.14 under RCP 4.5 and RCP 8.5, respectively.
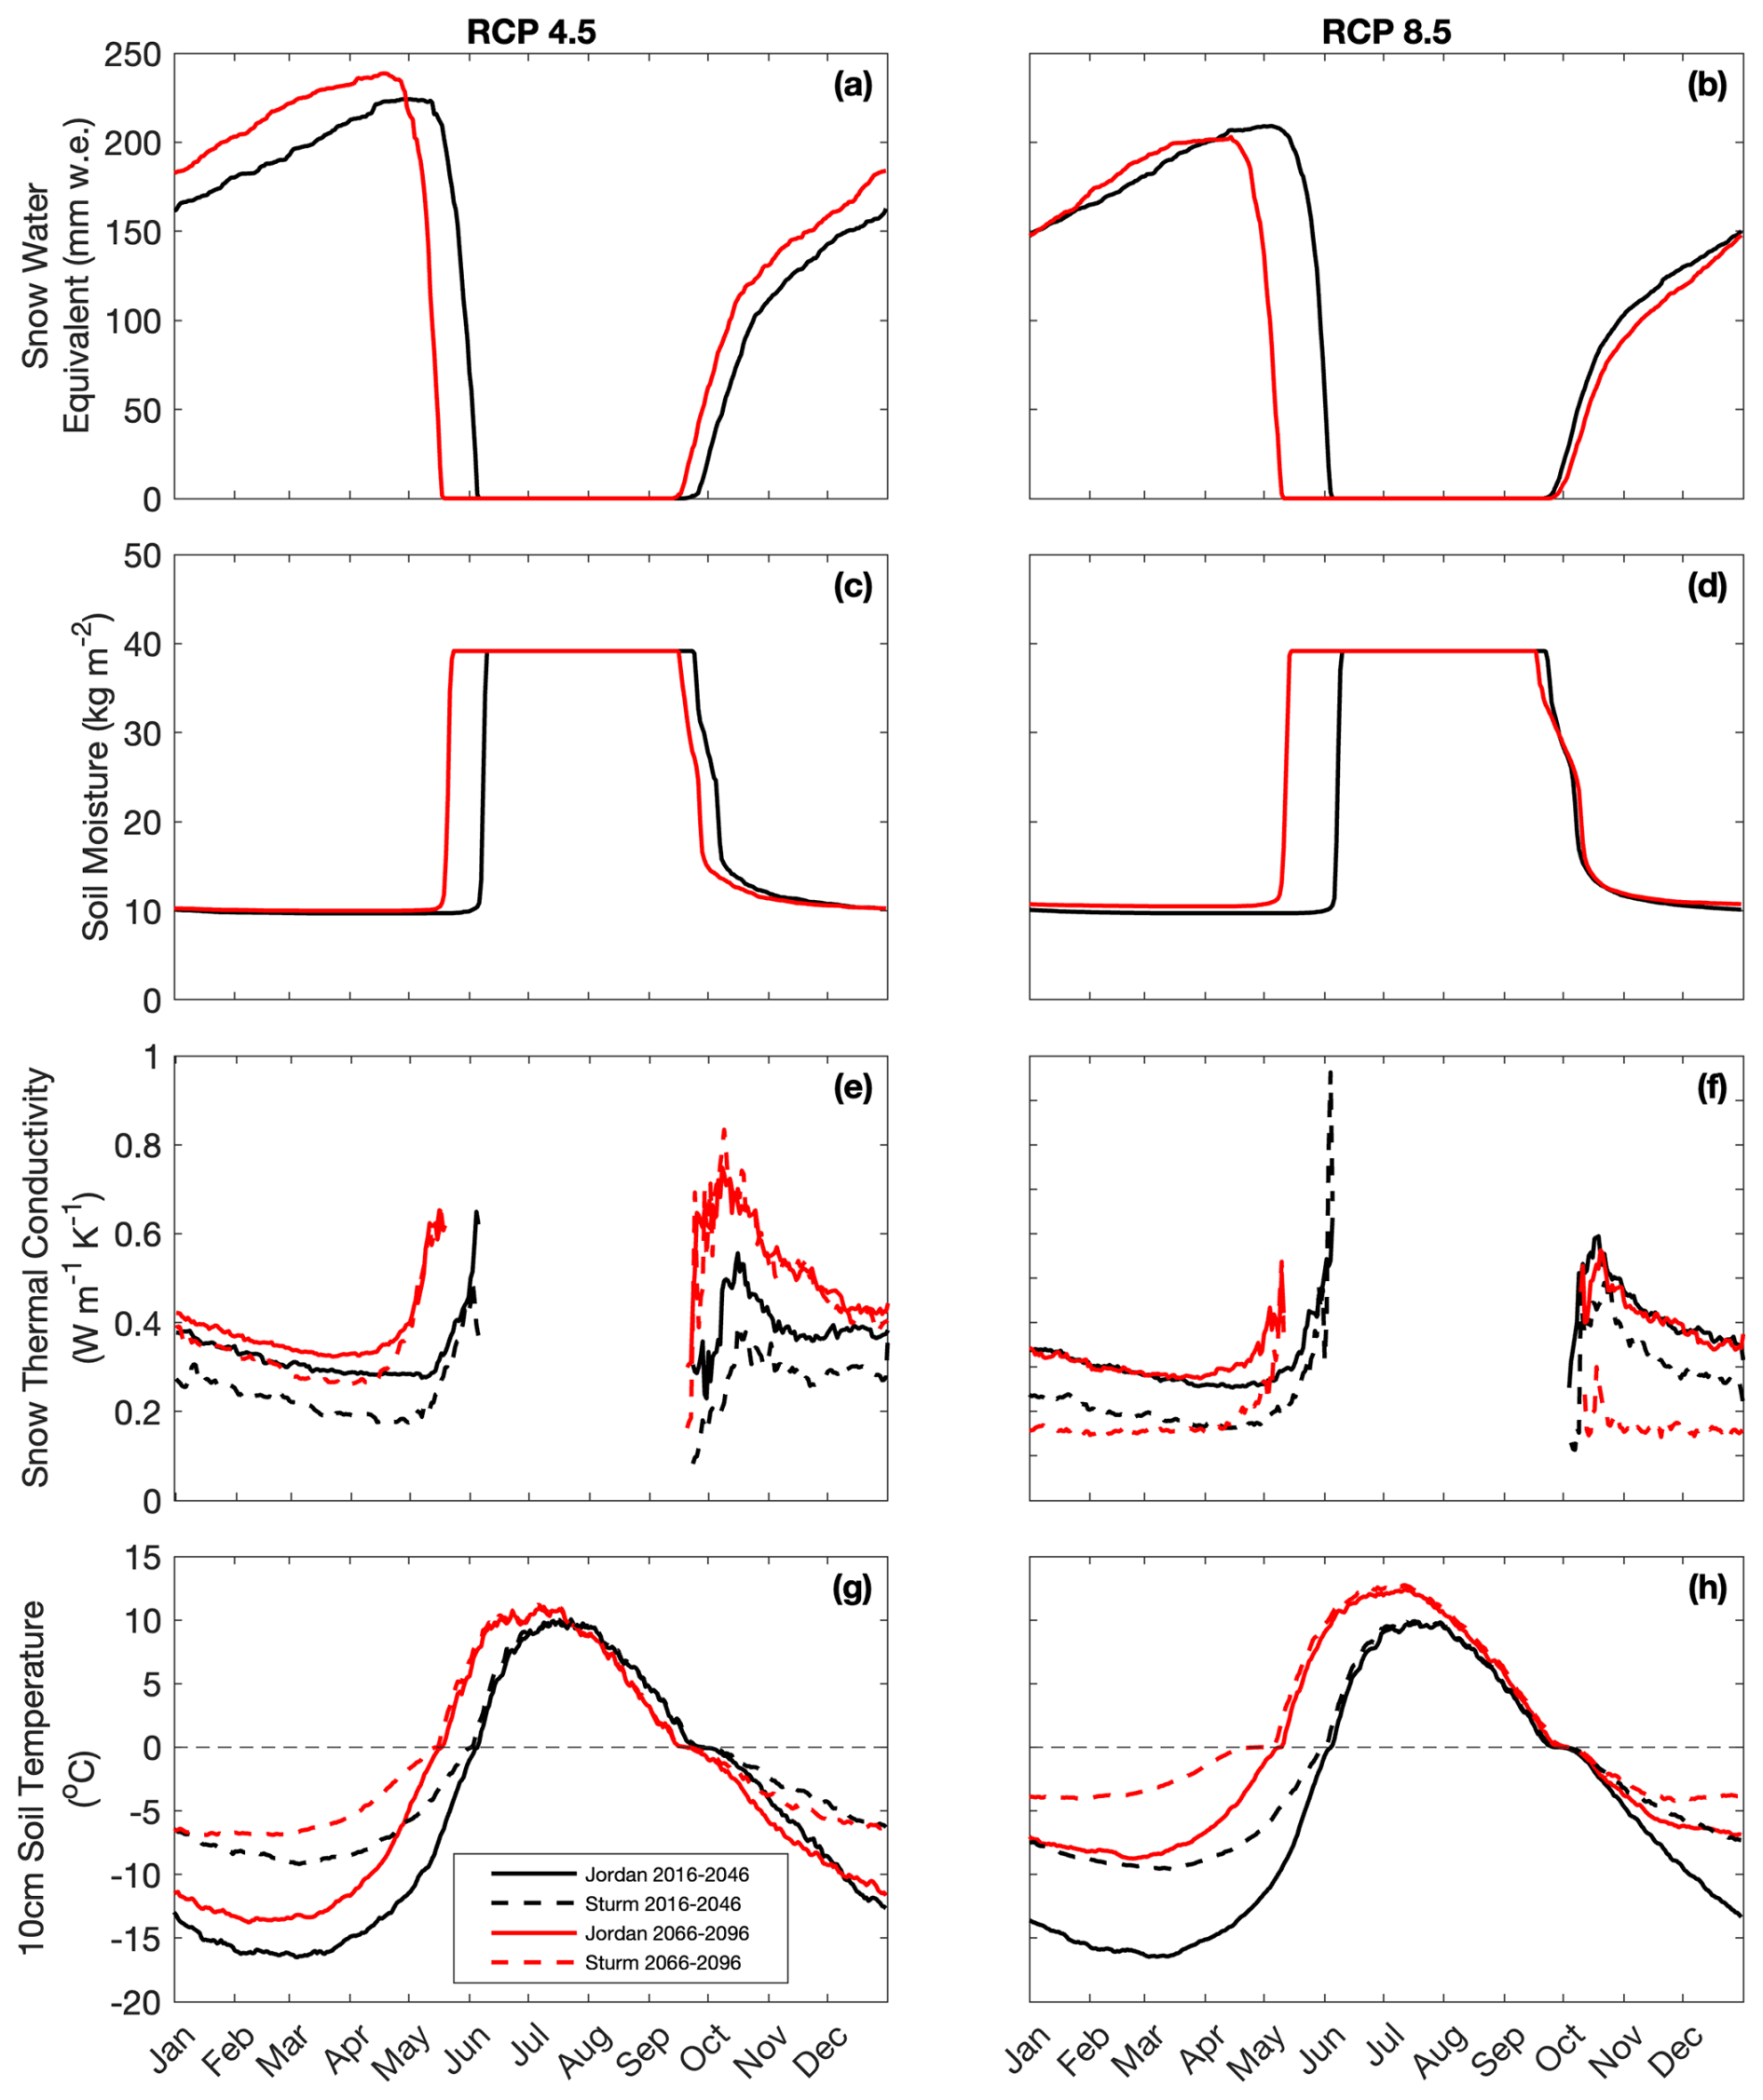
Figure 3The CLM5.0 simulated median daily SWE (a, b), soil liquid water (12 cm) content (c, d), snow thermal conductivity (e, f), and 10 cm soil temperature (g, h) over two 30-year time periods: 2016–2046 (black) and 2066–2096 (red) under RCP 4.5 and RCP 8.5, for TVC, using input meteorological data from an ensemble of 33 RCM–GCM combinations (RCP 4.5 n = 6, RCP 8.5 n = 27). The solid and dashed lines show the ensemble median values for the CORDEX-Jordan and CORDEX-Sturm experiments, respectively.
Using CORDEX-Sturm, the median minimum winter soil temperature is 4–7 °C warmer by the end of the century (2066–2096) compared to CORDEX-Jordan under both RCP scenarios (Fig. 3g and h). Warmer air temperatures predicted for the end of this century (Fig. 1a and b) will warm the soil, and snow cover will then insulate the soil from the colder atmosphere, maintaining these elevated soil temperatures throughout the winter (Fig. 3g and h).
Due to earlier snowmelt, soils are predicted to thaw earlier in the year under both RCP scenarios (RCP 4.5 = 19 d, RCP 8.5 = 26 d; Fig. 3e and f). The timing of soil moisture increase in May and June remains similar in the present (2016–2046) between RCP 4.5 and 8.5 but occurs 20–30 d earlier in the future (2046–2096). By comparison, the timing of soil moisture decrease in September and October remains similar at Julian day 257–267 between the two RCP scenarios and 30-year time periods. The modelled soil moisture plateaus at 10 kg m−2 from October–May and reaches saturation 39.167 kg m−2 from late May–early October.
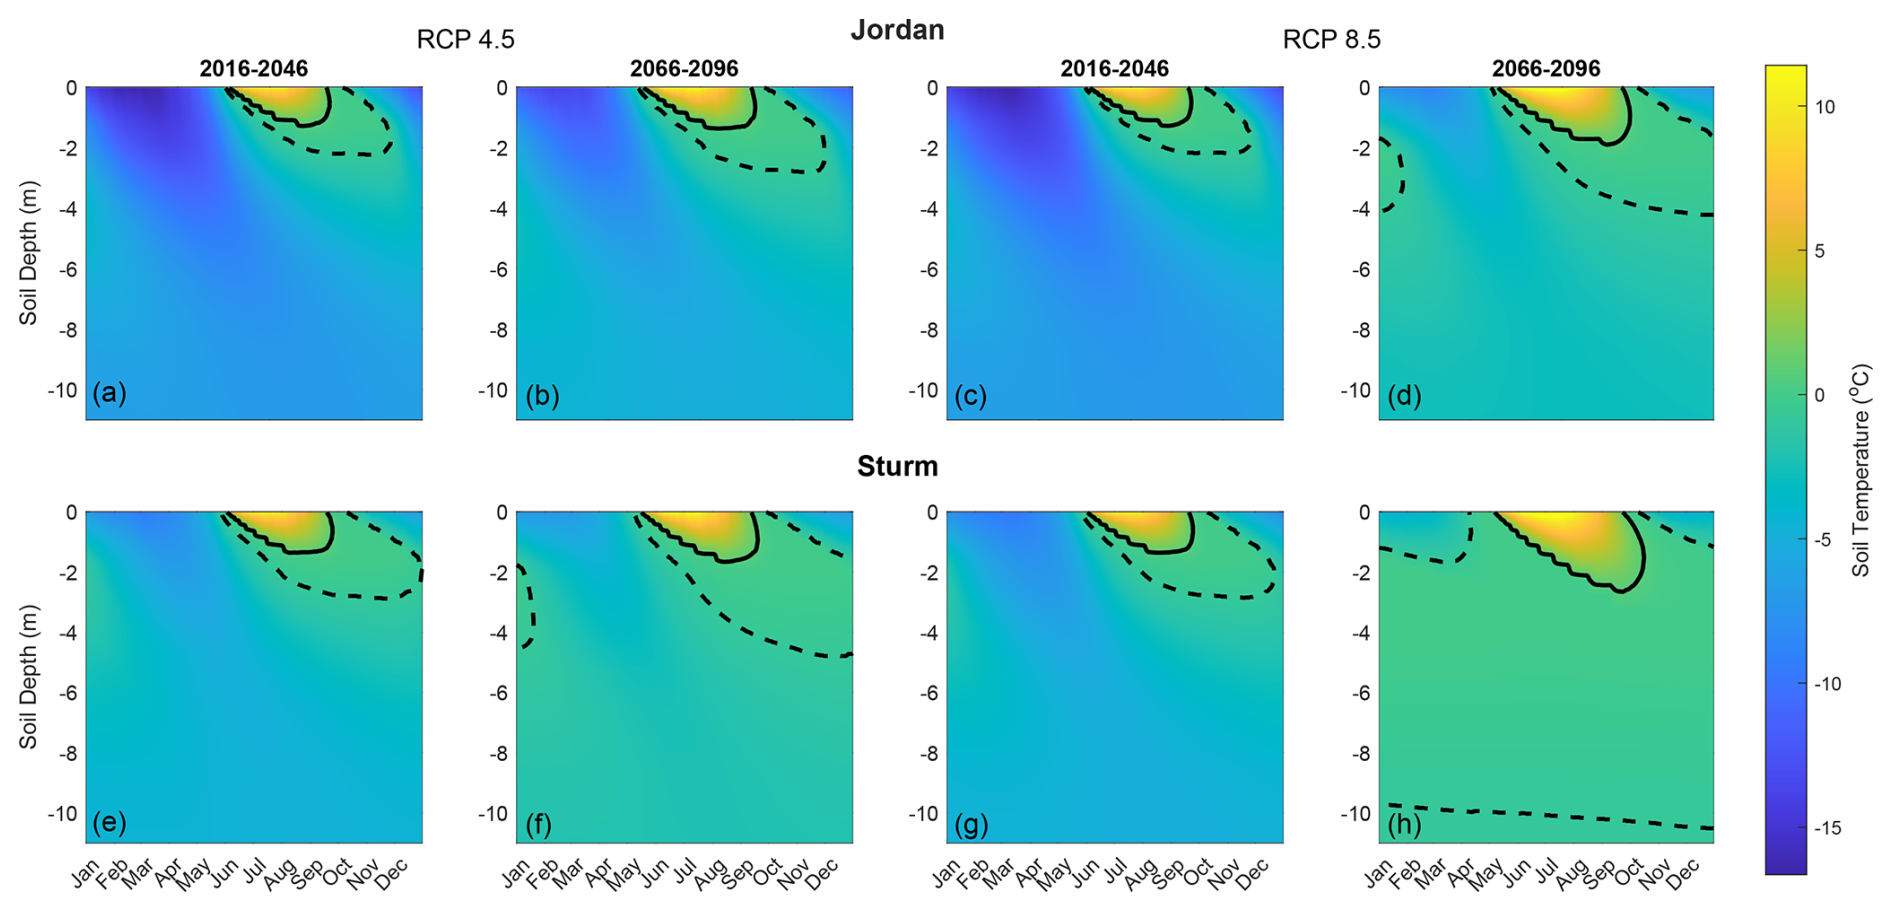
Figure 4The CLM5.0 simulated median daily soil temperature with depth over two 30-year time periods: 2016–2046 and 2066–2096 under RCP 4.5 (a, b) and 8.5 (c, d). The first row plots show CLM5.0 under the default Keff parameters (Jordan, 1991) and the second row plots show an alternative parameterisation for snow thermal conductivity (Sturm et al., 1997). The solid black lines indicate 0.75 °C and the dashed −0.75 °C, indicating the zero-curtain period between them.
Evidence of a late winter (February–March) zero-curtain period is minimal across all but one scenario (Fig. 4h); however, soil temperatures at depths up to 10 m suggest that the zero-curtain duration from August–December increases by 10 and 36 d in the future under CORDEX-Jordan and CORDEX-Sturm, respectively (Fig. B1). In the future under RCP 8.5, autumn shoulder season (September–October) near-zero temperatures penetrate up to 6 m deeper into the soil column compared with the present day in the CORDEX-Sturm simulations (Fig. 4h). An earlier spring snowmelt, increasing winter soil temperatures, and longer zero-curtain duration combine to create the conditions for increased cumulative seasonal carbon emissions in the future at TVC.
3.2.2 CO2 and CH4 emissions
Cumulative snow-covered CO2 and CH4 fluxes are projected to increase under both RCP scenarios (Fig. 5), with the highest CO2 increase produced for CORDEX-Sturm (34.2 g CO2 m−2; from 21.1 to 55.3 g CO2 m−2) under RCP 8.5. An earlier onset of snow in 2066–2096 facilitates earlier emissions of CO2 and CH4 during the autumn under RCP 4.5 (12–13 d post 1 September; Fig. 5a and c) compared with RCP 8.5 (41–47 d post 1 September; Fig. 5b and d). A delayed snow onset reduces overall cumulative carbon emissions during the snow cover period under RCP 8.5 (Fig. 5b and d) compared with RCP 4.5 (Fig. 5a and c). By the start of November, cumulative CO2 emissions reach 50 %–90 % of their winter totals, highlighting the importance of autumn shoulder season emissions to the winter CO2 budget. Under RCP 4.5 there is minimal increase in cumulative CO2 after mid-late November (after day 80) with increases of 0.02 and 0.00015 . Comparatively, under RCP 8.5, higher levels of emissions continue deeper into the winter, with average increases of 0.070 and 0.003 (day 80 to day 240) (Fig. 5). Applying the Sturm et al. (1997) snow thermal conductivity scheme within CLM5.0 increases the total accumulation of winter CO2 at TVC from 2016–2100 by 50 %–150 % and CH4 by 50 %–74 % across both RCP scenarios compared to CORDEX-Jordan. Fig. D1 presents a comparison between cumulative emissions limited to when snow is on the ground as per Fig. 5 and those unconstrained by snow cover. The cumulative emissions not limited to the snow-covered period are 3–4 times higher than those constrained by snow and highlight the impact of the early winter period on accumulated winter soil carbon emissions.
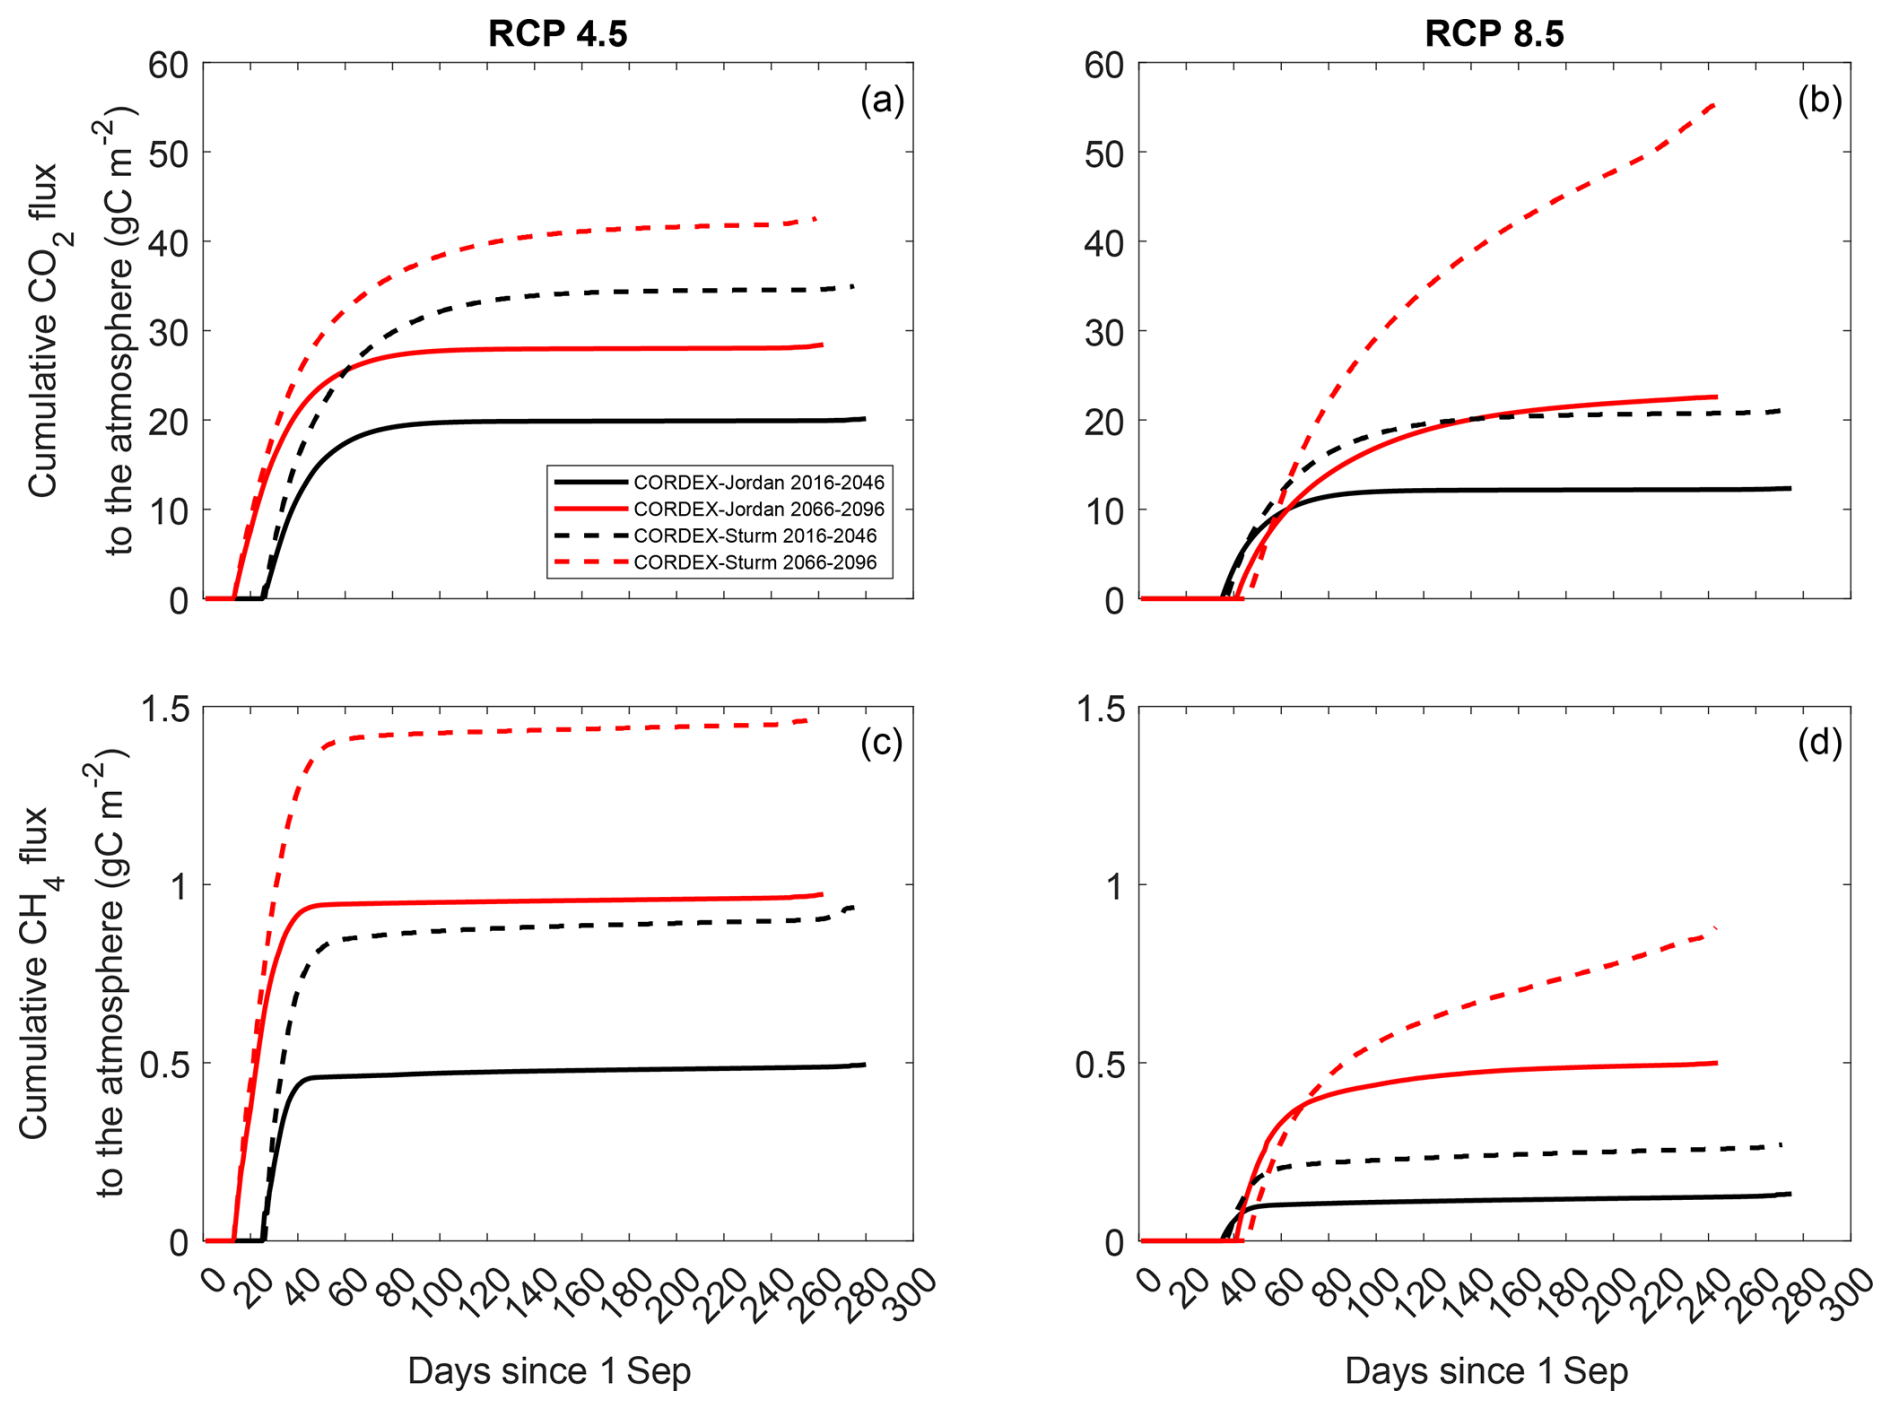
Figure 5The CLM5.0 simulated cumulative CO2 and CH4 flux to the atmosphere during snow cover periods over two 30-year time periods: 2016–2046 (black) and 2066–2096 (red) under RCP 4.5 and RCP 8.5, for TVC, using the meteorological forcing from an ensemble of 33 RCM–GCM combinations (RCP 4.5 n = 6, RCP 8.5 n = 27). The solid lines show the median values from the CORDEX-Jordan ensemble and the dashed lines show values for the CORDEX-Sturm ensemble. The variable plot line lengths are indicative of changes in the snow-season length.
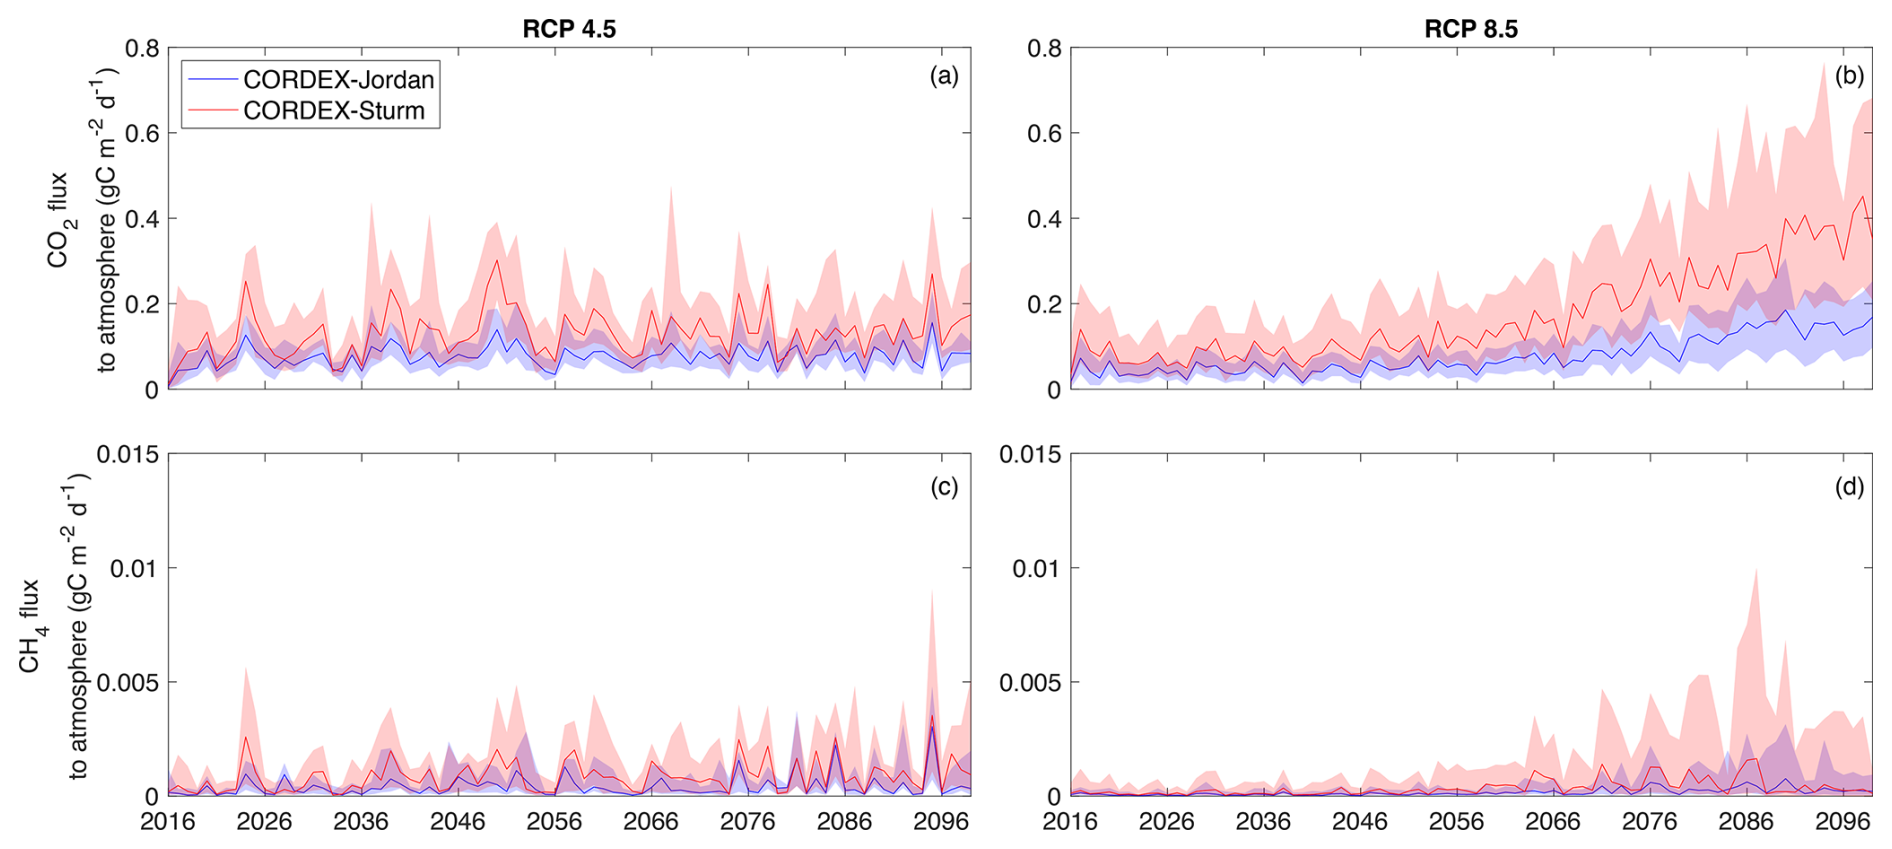
Figure 6The CLM5.0 simulated median SR for the winter season, comparing the CORDEX-Jordan ensemble with CORDEX-Sturm for two RCP scenarios (RCP 4.5 n = 6, RCP 8.5 n = 27). The shaded areas represent the 75th and 25th percentiles and represent the ensemble distribution. The ensemble median and uncertainty calculations incorporate a range of Ψmin, Q10, and Q10ch4 (Fig. E1).
From 2016–2046 to 2066–2096, the median winter CO2 flux increases by 18 % (0.11–0.13 ) under RCP 4.5 and more than triples (0.08 to 0.3 ) under RCP 8.5, using CORDEX-Sturm. CORDEX-Sturm significantly increases the winter CO2 emissions compared with CORDEX-Jordan, by 57 % (2016–2046) to 62 % (2066–2096) in RCP 4.5 and 100 % (2016–2046) to 130 % (2066–2096) in RCP 8.5 (two sample K-S test: D = 0.26, p < 0.01, Fig. 6). Likewise, under RCP 8.5 CORDEX-Sturm significantly increases the median CH4 emissions by 50 % during 2066–2096 compared to CORDEX-Jordan (2.5 to 3.8 ) (two sample K-S test: D = 0.13, p < 0.01, Fig. 6), further showing the impact of snow representation on the simulation of CH4 from Arctic soils. Between RCP 4.5 and 8.5, the median CO2 emissions more than double (0.13 to 0.30 ) for the last 30 years of the century using CORDEX-Sturm. Simulations with reduced Ψmin (−20 MPa) consistently stimulate higher carbon fluxes under RCP 4.5 and 8.5 compared to simulations using the default Ψmin value (−2 MPa) (Fig. E1). This is particularly evident under CORDEX-Sturm, which shows average increases of 0.13–0.16 and 0.0014–0.0018 from 2016–2100. CLM5.0 simulations indicate that warmer soil conditions induced by climate warming under RCP 8.5 intensify the winter carbon emissions from TVC soils in the future.
4.1 Future temperature, precipitation, and snow cover
NA-CORDEX forecasts suggest rising future winter air temperatures (Fig. 1) which may increase winter soil heterotrophic respiration and contribute significantly to winter carbon emissions, offsetting growing season carbon uptake in the future (Natali et al., 2019; Commane et al., 2017). The mobilisation of “legacy” carbon (Pedron et al., 2023) within the Arctic permafrost is of concern in a warming climate (Schuur et al., 2015) and warmer winters will enhance future climate change through carbon output from the decomposition of soil carbon. Understanding changes in future Arctic air temperature and meteorology is key in determining the influence of a warming world on Arctic winter carbon emissions and vice versa. The NA-CORDEX ensemble simulations demonstrate a shift from a snow- to rain-dominated Arctic in the future, reported elsewhere in the literature (Mccrystall et al., 2021), which is intensified under RCP 8.5 (Fig. 2). The shift in precipitation phase in September and October will lead to a change in snow properties, particularly the effective conductivity of the snowpack. Additionally, melt conditions and rain-on-snow events in the initial stage of the snow cover season provide energy for melt through the condensation of water vapour onto the snowpack (Harr, 1981; Mazurkiewicz et al., 2008). An increase in the precipitation fraction falling as rain is therefore a likely driver of earlier snowmelt in CLM5.0 simulations (Fig. 3). Future changes in precipitation have key, yet uncertain, implications for the Arctic surface and soil energy balance with regard to snow cover depth, timing, and duration, which are major factors controlling the temperature variability in the upper 3 m soil (Callaghan et al., 2011).
4.2 Future soil carbon emissions
The CLM5.0 parameterisations for Keff, Q10, and Ψmin explored by Dutch et al. (2024) were found to be highly suitable for representing winter soil temperatures and carbon fluxes under present-day conditions. This alignment between observations and simulations increases confidence in the model's ability to simulate future Arctic soil processes through to 2100. Our simulations show that by the end of the century (2066–2096), CLM5.0 simulated median winter soil CO2 emissions under RCP 4.5 are predicted to be less than half of those under RCP 8.5, showing that projected winter carbon emissions are tied to the magnitude of global temperature increase. Soil temperatures are linked to changes in the atmosphere by the thermal conductivity of the snow layer. Under RCP 8.5, cumulative winter carbon emissions from soils at TVC are projected to increase in the future despite a reduction in the snow cover duration. A reduced Keff (0.07–0.14 ), as introduced by CORDEX-Sturm (Fig. 3), increases cumulative winter CO2 and CH4 emissions by 50 %–150 % for 2016–2100 compared with CORDEX-Jordan under both RCP 4.5 and 8.5. By comparison, Natali et al. (2019) projected a 41 % increase in CO2 emissions by 2100 compared to the present. Additionally, under RCP 8.5, the magnitude of the influence of CORDEX-Sturm on winter carbon fluxes is comparable to the uncertainty associated with future climate projections, and snow-related processes – snow cover extent and duration (Natali et al., 2019) and snow thermal conductivity (this study) – emerge as common critical drivers of this uncertainty.
The response of carbon fluxes from permafrost zones is highly sensitive to hydrological change and an increase in CO2 emissions post-2050 (Fig. 6) is indicative of soil drying where, as temperatures increase, soil CH4 production is strongly suppressed (Lawrence et al., 2015). The zero-curtain period is an important period for facilitating cold season emissions from tundra ecosystems (Tao et al., 2021) and an increasing proportion of the soil at or around 0 °C presents a risk of elevated carbon emissions from Arctic soils in the future. The seasonality of soil temperature is critical in controlling winter CO2 emissions from soils, particularly the length of time at which soil remains at or near 0 °C at the beginning of winter (Schimel et al., 2006). Future CO2 and CH4 emissions show greater seasonal variability under CORDEX-Sturm compared with CORDEX-Jordan, particularly under RCP 8.5, which suggests that soil moisture and thermal dynamics are more sensitive to snow cover in the CORDEX-Sturm configuration (Fig. E1). Persistent carbon emissions throughout the winter period are partly attributable to a permanently unfrozen active soil layer (Zona et al., 2016) and its influence in the future will be intensified by a longer zero-curtain period. Simulations performed in this study indicate an increase in both the duration and depth of the early winter zero-curtain period under future climate conditions (Fig. 4). Under CORDEX-Sturm, the projected early winter zero-curtain period extends up to 26 d longer and reaches depths up to 6 m deeper than under CORDEX-Jordan, further highlighting the impact of snow representation on simulated soil temperatures. Increases in the duration of the zero-curtain period is concurrent with measured borehole data from 2006–2015 at an Arctic tundra site, which show an increase of up to 20 d, with large emissions of CO2 between September and December in years with a longer zero-curtain period (Euskirchen et al., 2017; Larson et al., 2021). A deeper active layer (Aalto et al., 2018) and an increase in unfrozen soil (Schaefer and Jafarov, 2015; Natali et al., 2019; Elberling and Brandt, 2003) as a result of a longer and deeper zero-curtain period will increase SR in the future, accelerate the degradation of permafrost and likely mobilise the legacy carbon from Arctic soils.
Future changes in the shoulder season air temperature, soil moisture, and snow cover control both CO2 and CH4 due to moisture limitation, oxygen limitation, and soil temperature. A major fraction of cold season CH4 emissions occur in the early winter shoulder season, particularly during the zero-curtain stage (Zona et al., 2016) and interannual variability in both CO2 and CH4 depends largely on this period (Kittler et al., 2017). Soil moisture fluctuations (Fig. 3) critically impact the rates of microbial decomposition of organic matter via methanogenesis, which favours wet, anoxic environments. CH4 emissions are closely tied to soil moisture in the upper 30 cm of soil and are closely correlated with soil moisture fluctuations during the soil freeze-in period (Sturtevant et al., 2012). In the early winter (September–October) the soil profile is saturated, which drives anoxic conditions favoured by methanogens, which increases with depth (Arndt et al., 2020). Soil moisture increases in late September between RCP 4.5 and 8.5 (Fig. 3) resulting in wetter soil, alongside increased zero-curtain period at depth (Fig. 4) under RCP 8.5, present a risk of increased CH4 emissions during this early winter period in the future at TVC. Such soil moisture increases, by slowing the soil freezing process have implications for the extension of elevated CH4 emissions longer into the winter season (Sturtevant et al., 2012). Understanding the potential impacts of climate warming on both the early and late winter shoulder seasons is therefore key for assessing the risk of elevated winter carbon emissions from tundra soils. As well as persistent winter carbon emissions, “pulses” of CO2 and CH4 have been observed during both the early and late winter shoulder seasons (Raz-Yaseef et al., 2017; Mastepanov et al., 2013) where trapped gases are released as soils fluctuate between freeze and thaw. Soil emission pulses, which are not simulated by CLM5.0, are enhanced by an increase in rain-on-snow events. Such events accelerate soil warming in the spring, making soils more susceptible to cracking and rapid gas release (Raz-Yaseef et al., 2017). A shift towards a rain-dominated Arctic (Fig. 2) may therefore increase the abundance of spring gas pulses from soils in both frequency and distribution, increasing cumulative carbon emissions annually. Further work is required to better understand the impact of these pulses on annual carbon budgets and their representation within LSMs.
Warming air and soil temperatures are facilitating higher rates of heterotrophic respiration in CLM5.0 simulations for TVC soils, resulting in an expected increase in winter carbon output in the future under RCP scenarios 4.5 and 8.5. Such winter emissions outpace those modelled by Natali et al. (2019) and therefore reinforce the vulnerability of Arctic soils and the carbon stored within to climate warming. Soil temperature simulations show a lengthening of the zero-curtain period in the future as well as deeper penetration of near-zero temperatures into the soil column which will mobilise legacy carbon in the future. A longer zero-curtain period, leading to a persistently unfrozen active layer of soil, where higher rates of soil respiration persist for longer into the snow cover period, poses a risk of significantly increased cumulative carbon output in the future from tundra soils.
The modelled winter carbon emissions demonstrate the importance of climate mitigation in preventing a significant increase in the Arctic winter carbon budget. The use of parameterisation for Keff from Sturm et al. (1997) reduces soil temperature biases and presents significantly higher CO2 production from 2016–2100 compared to the default parameters from Jordan (1991). An improved representation of Keff exacerbates already increasing CO2 emissions from the Arctic tundra caused by a warming climate and the influence of the selected Keff parameterisation is shown to be as important, if not more, than the variability in the future climate on simulated carbon emissions from Arctic tundra. Projected CO2 and CH4 emissions are highly sensitive to parameters Keff, Ψmin, Q10, and Q10ch4, which govern SR. We find that lower Ψmin consistently increases cold season carbon fluxes and higher Q10 suppresses them, which aligns with the findings of Dutch et al. (2024). Implementing the Sturm et al. (1997) Keff parameterisation increases the sensitivity of the modelled carbon emissions to Ψmin and Q10 compared with the default Keff parameterisation. Further work should aim to improve representations of snow thermal conductivity in LSMs while increasing the spatial coverage of future simulations to allow a more holistic outlook for Arctic soil carbon emissions and better inform climate mitigation strategies and carbon budgets.
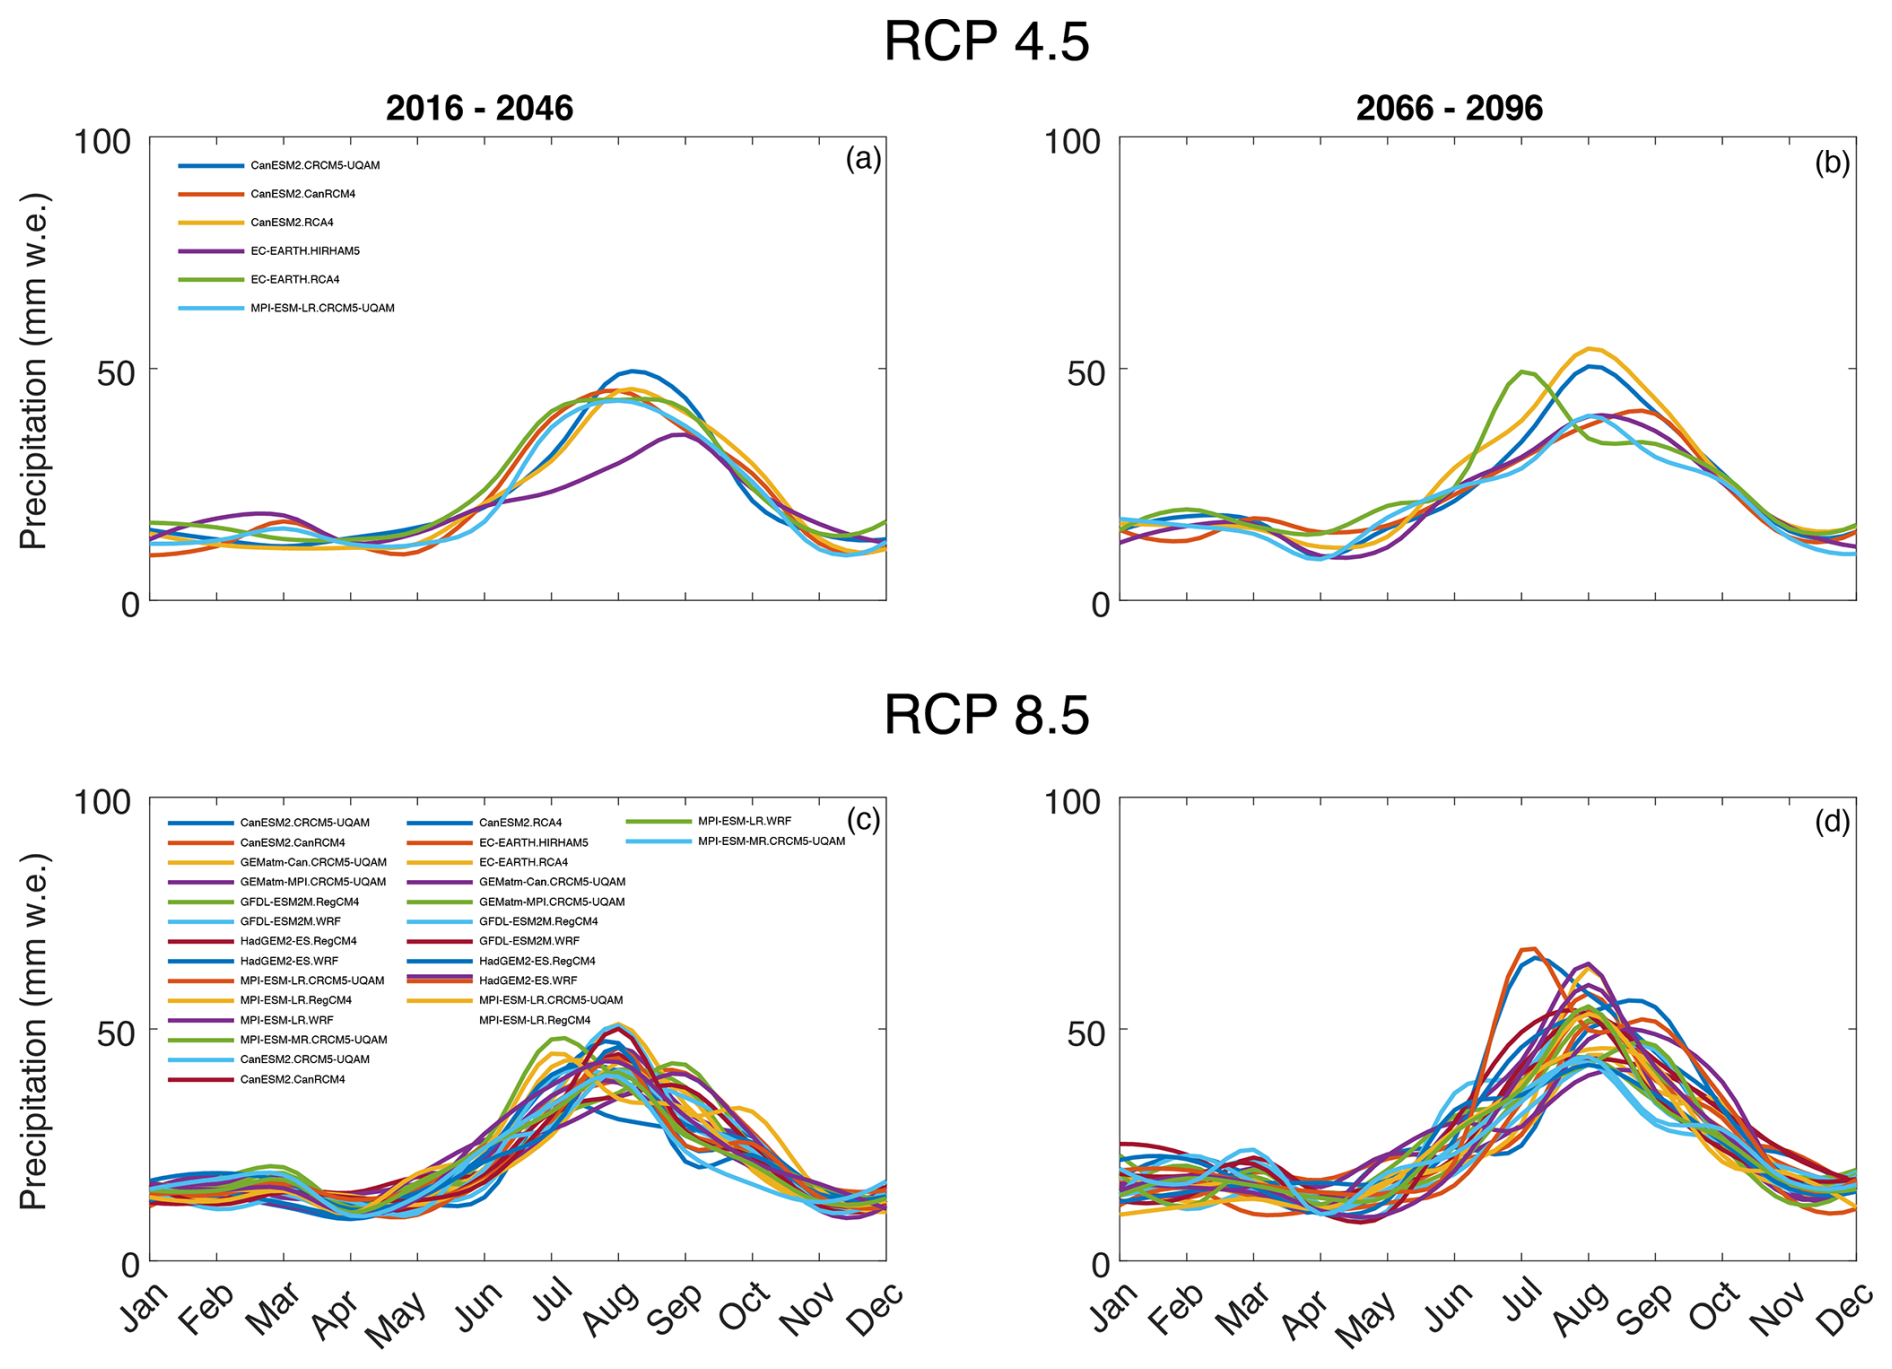
Figure A1The NA-CORDEX ensemble median monthly precipitation (January–December) split by individual ensemble member (RCP 4.5 n = 6, RCP 8.5 n = 27).
The CLM5.0 simulations indicate minimal changes in the late winter zero-curtain duration but a notable increase in the early winter zero-curtain duration. The early winter has been identified as a key period in facilitating carbon emissions from Arctic tundra, particularly CH4 (Tao et al., 2021). The variation in future zero-curtain duration from August to December is presented below.
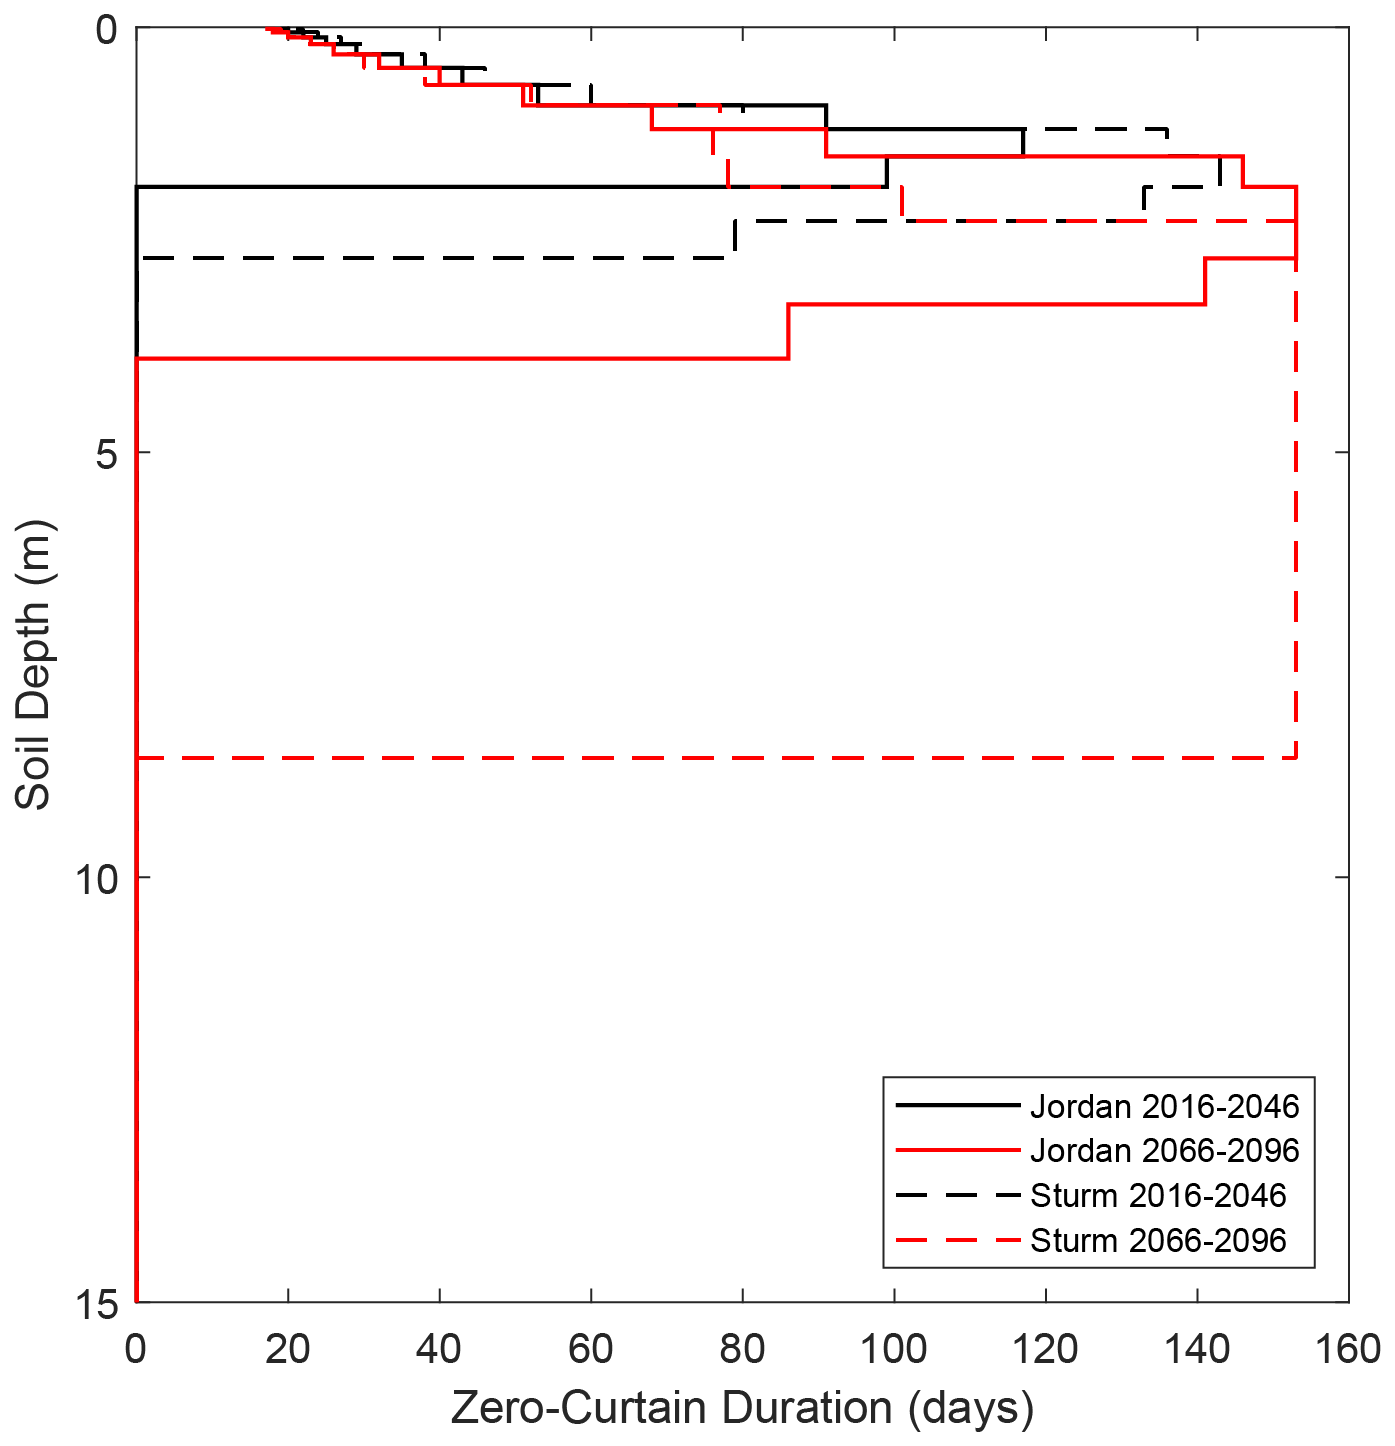
Figure B1The August–December zero-curtain duration with soil depth for the CORDEX-Jordan (solid black and red lines) and CORDEX-Sturm (dashed black and red lines) for 2016–2046 and 2066–2096.
To further constrain the CLM5.0 parameter uncertainties, the values of Ψmin and Q10 were adjusted alongside two parameterisations for Keff (Jordan and Sturm). A range of realistic Ψmin and Q10 values were chosen as per Dutch et al. (2024) alongside a range of Q10ch4.
The full combination of applying changes in Keff, Ψmin, Q10, and Q10ch4 as well as the variability provided by the CORDEX ensemble is presented in the main document. Figure E1 shows the upper and lower bounds of the simulated CO2 and CH4 when parameter adjustments are applied, with Q10 = 7.5, Ψmin = −2, Q10ch4 = 4.0 being the lower extreme and Q10 = 1.5, Ψmin = −20 MPa, Q10ch4 = 1.3 being the upper extreme.
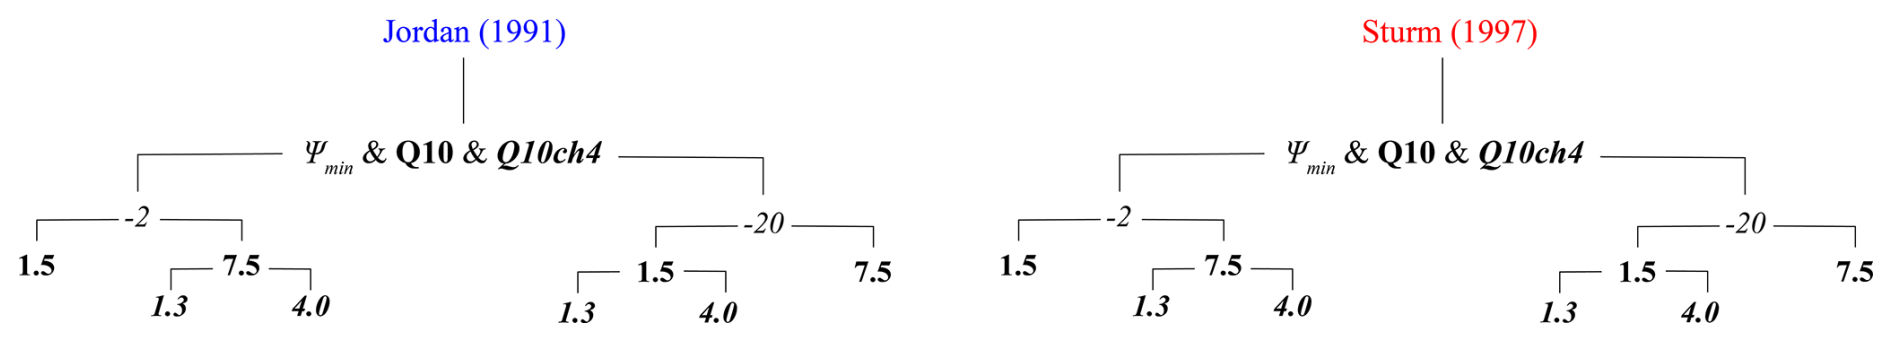
Figure C1Schematic showing the range of Q10 and Ψmin values applied to CLM5.0 using the CORDEX-Jordan (blue) and CORDEX-Sturm (red) for the modelling experiment.
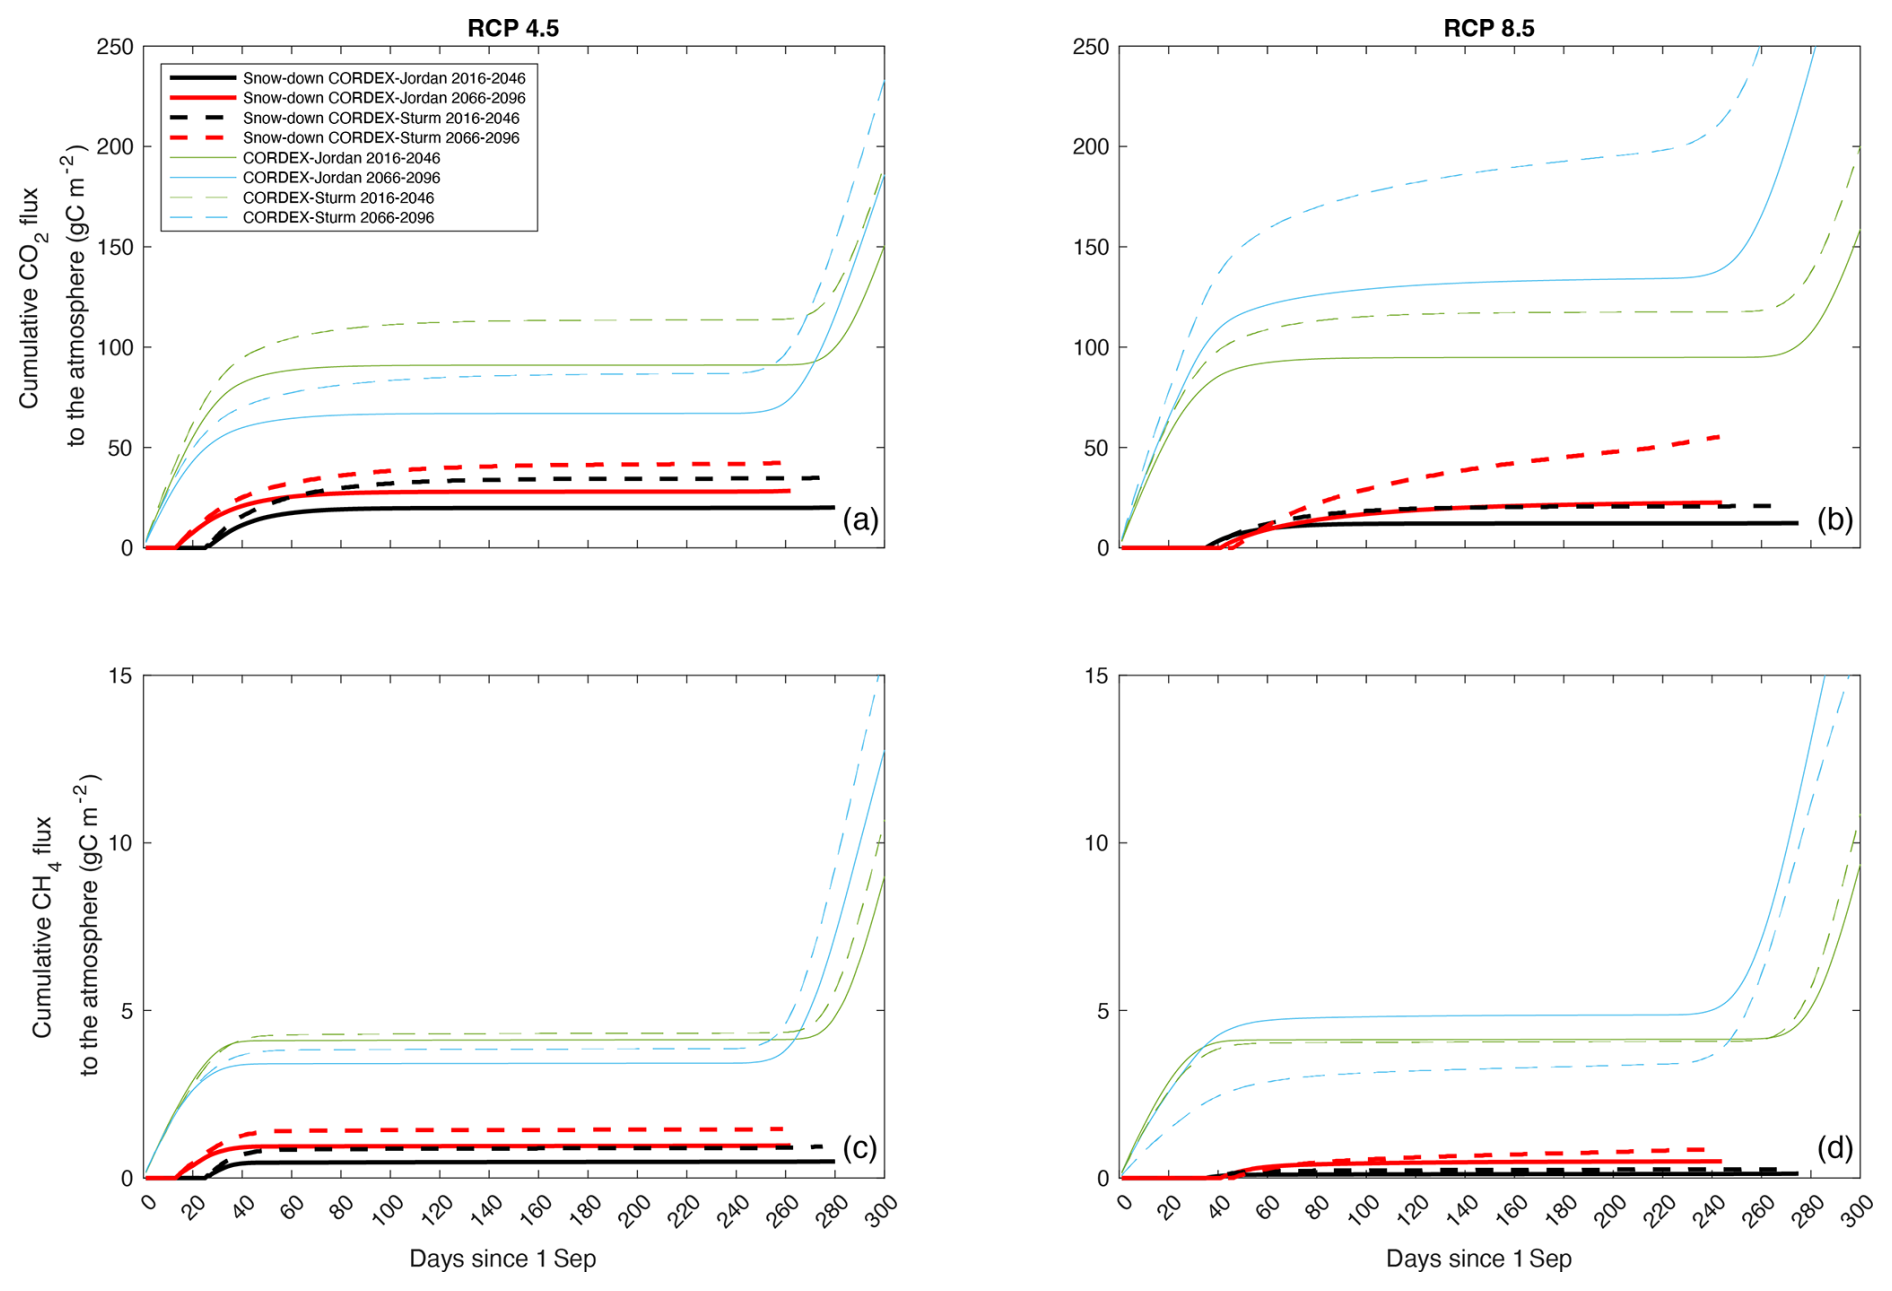
Figure D1The CLM5.0 simulated cumulative CO2 and CH4 flux to the atmosphere constrained by the snow-down period (red, black) and irrespective of snow (green, blue) over two 30-year time periods: 2016–2046 (black, green) and 2066–2096 (red, blue) under RCP 4.5 and RCP 8.5, for TVC, using the meteorological forcing from an ensemble of 33 RCM–GCM combinations (RCP 4.5 n = 6, RCP 8.5 n = 27). The solid lines show the median values from the CORDEX-Jordan ensemble and the dashed lines show the values for the CORDEX-Sturm ensemble. The variable plot line lengths are indicative of changes in the snow-season length.
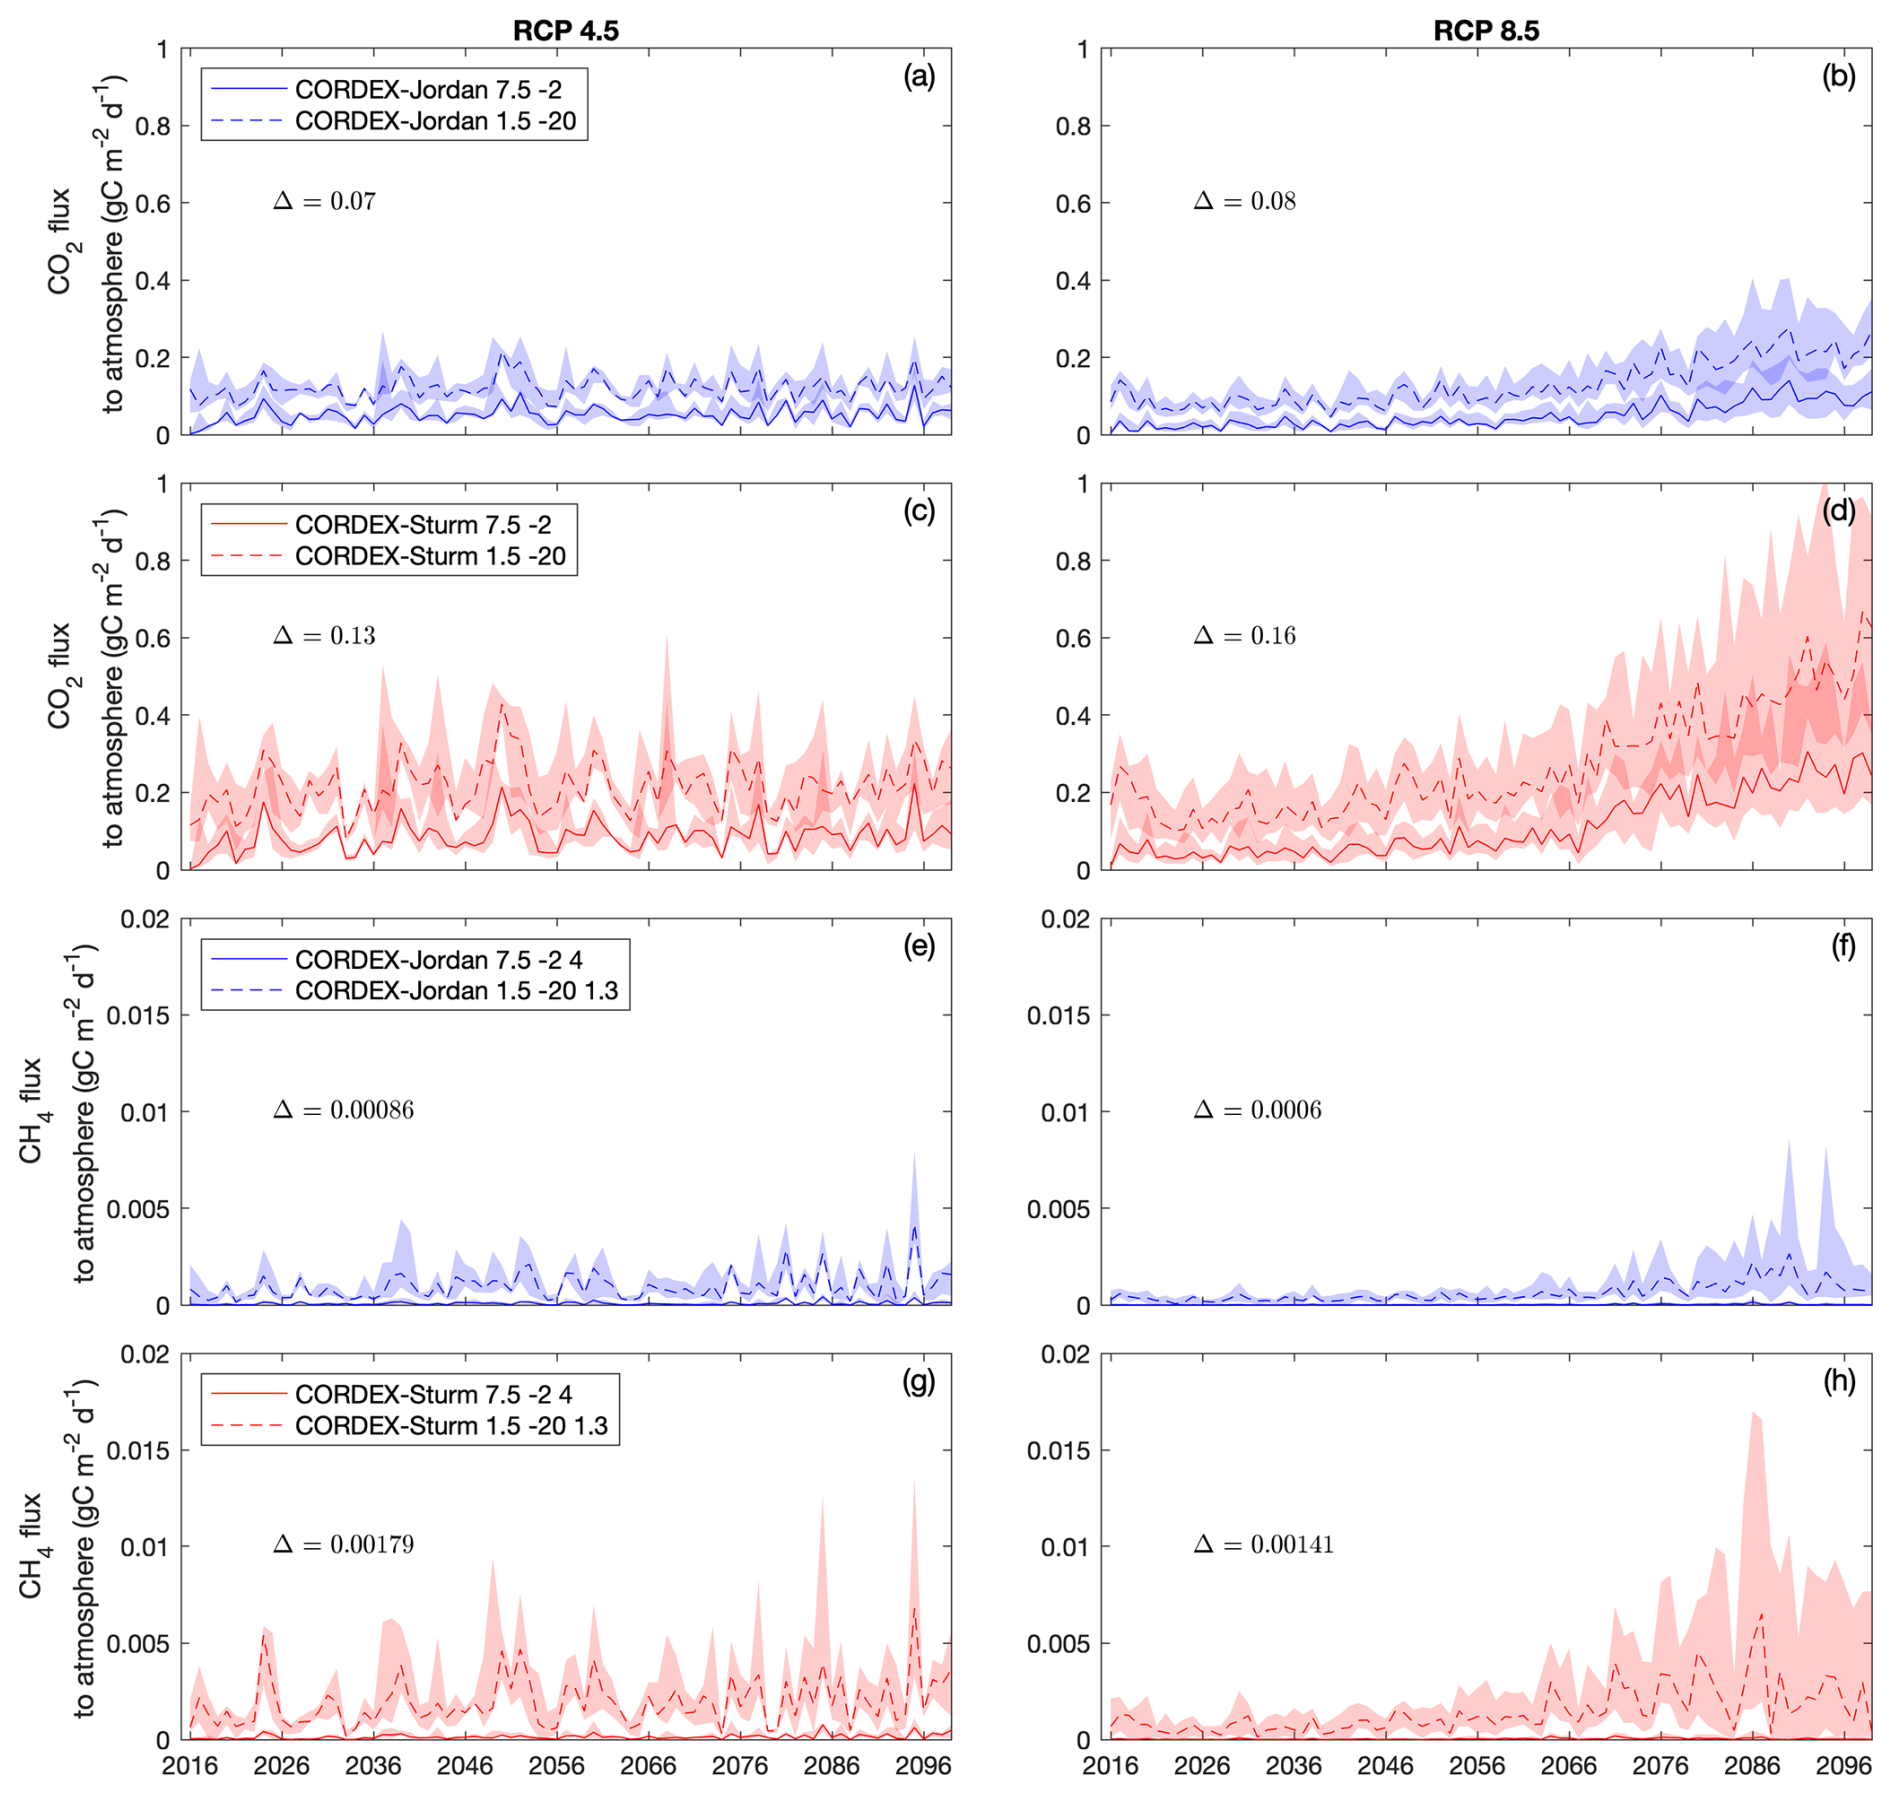
Figure E1The CLM5.0 simulated median SR for the winter season, comparing the CORDEX-Jordan (blue) ensemble with CORDEX-Sturm (red) for two RCP scenarios (RCP 4.5 n = 6, RCP 8.5 n = 27). The shaded areas represent the 75th and 25th percentiles and represent the CORDEX ensemble distribution. Each plot shows the extremes of Q10, Ψmin, and Q10ch4 from the chosen parameter values seen in Fig. C1, where the lower end Ψmin = −2, Q10 = 7.5, Q10ch4 = 4 suppresses carbon output and the upper end Ψmin = −20 MPa, Q10 = 1.5, Q10ch4 = 1.3 stimulates the carbon output. The average difference between the displayed parameters (solid versus dashed lines, Δ) is included on each subplot.
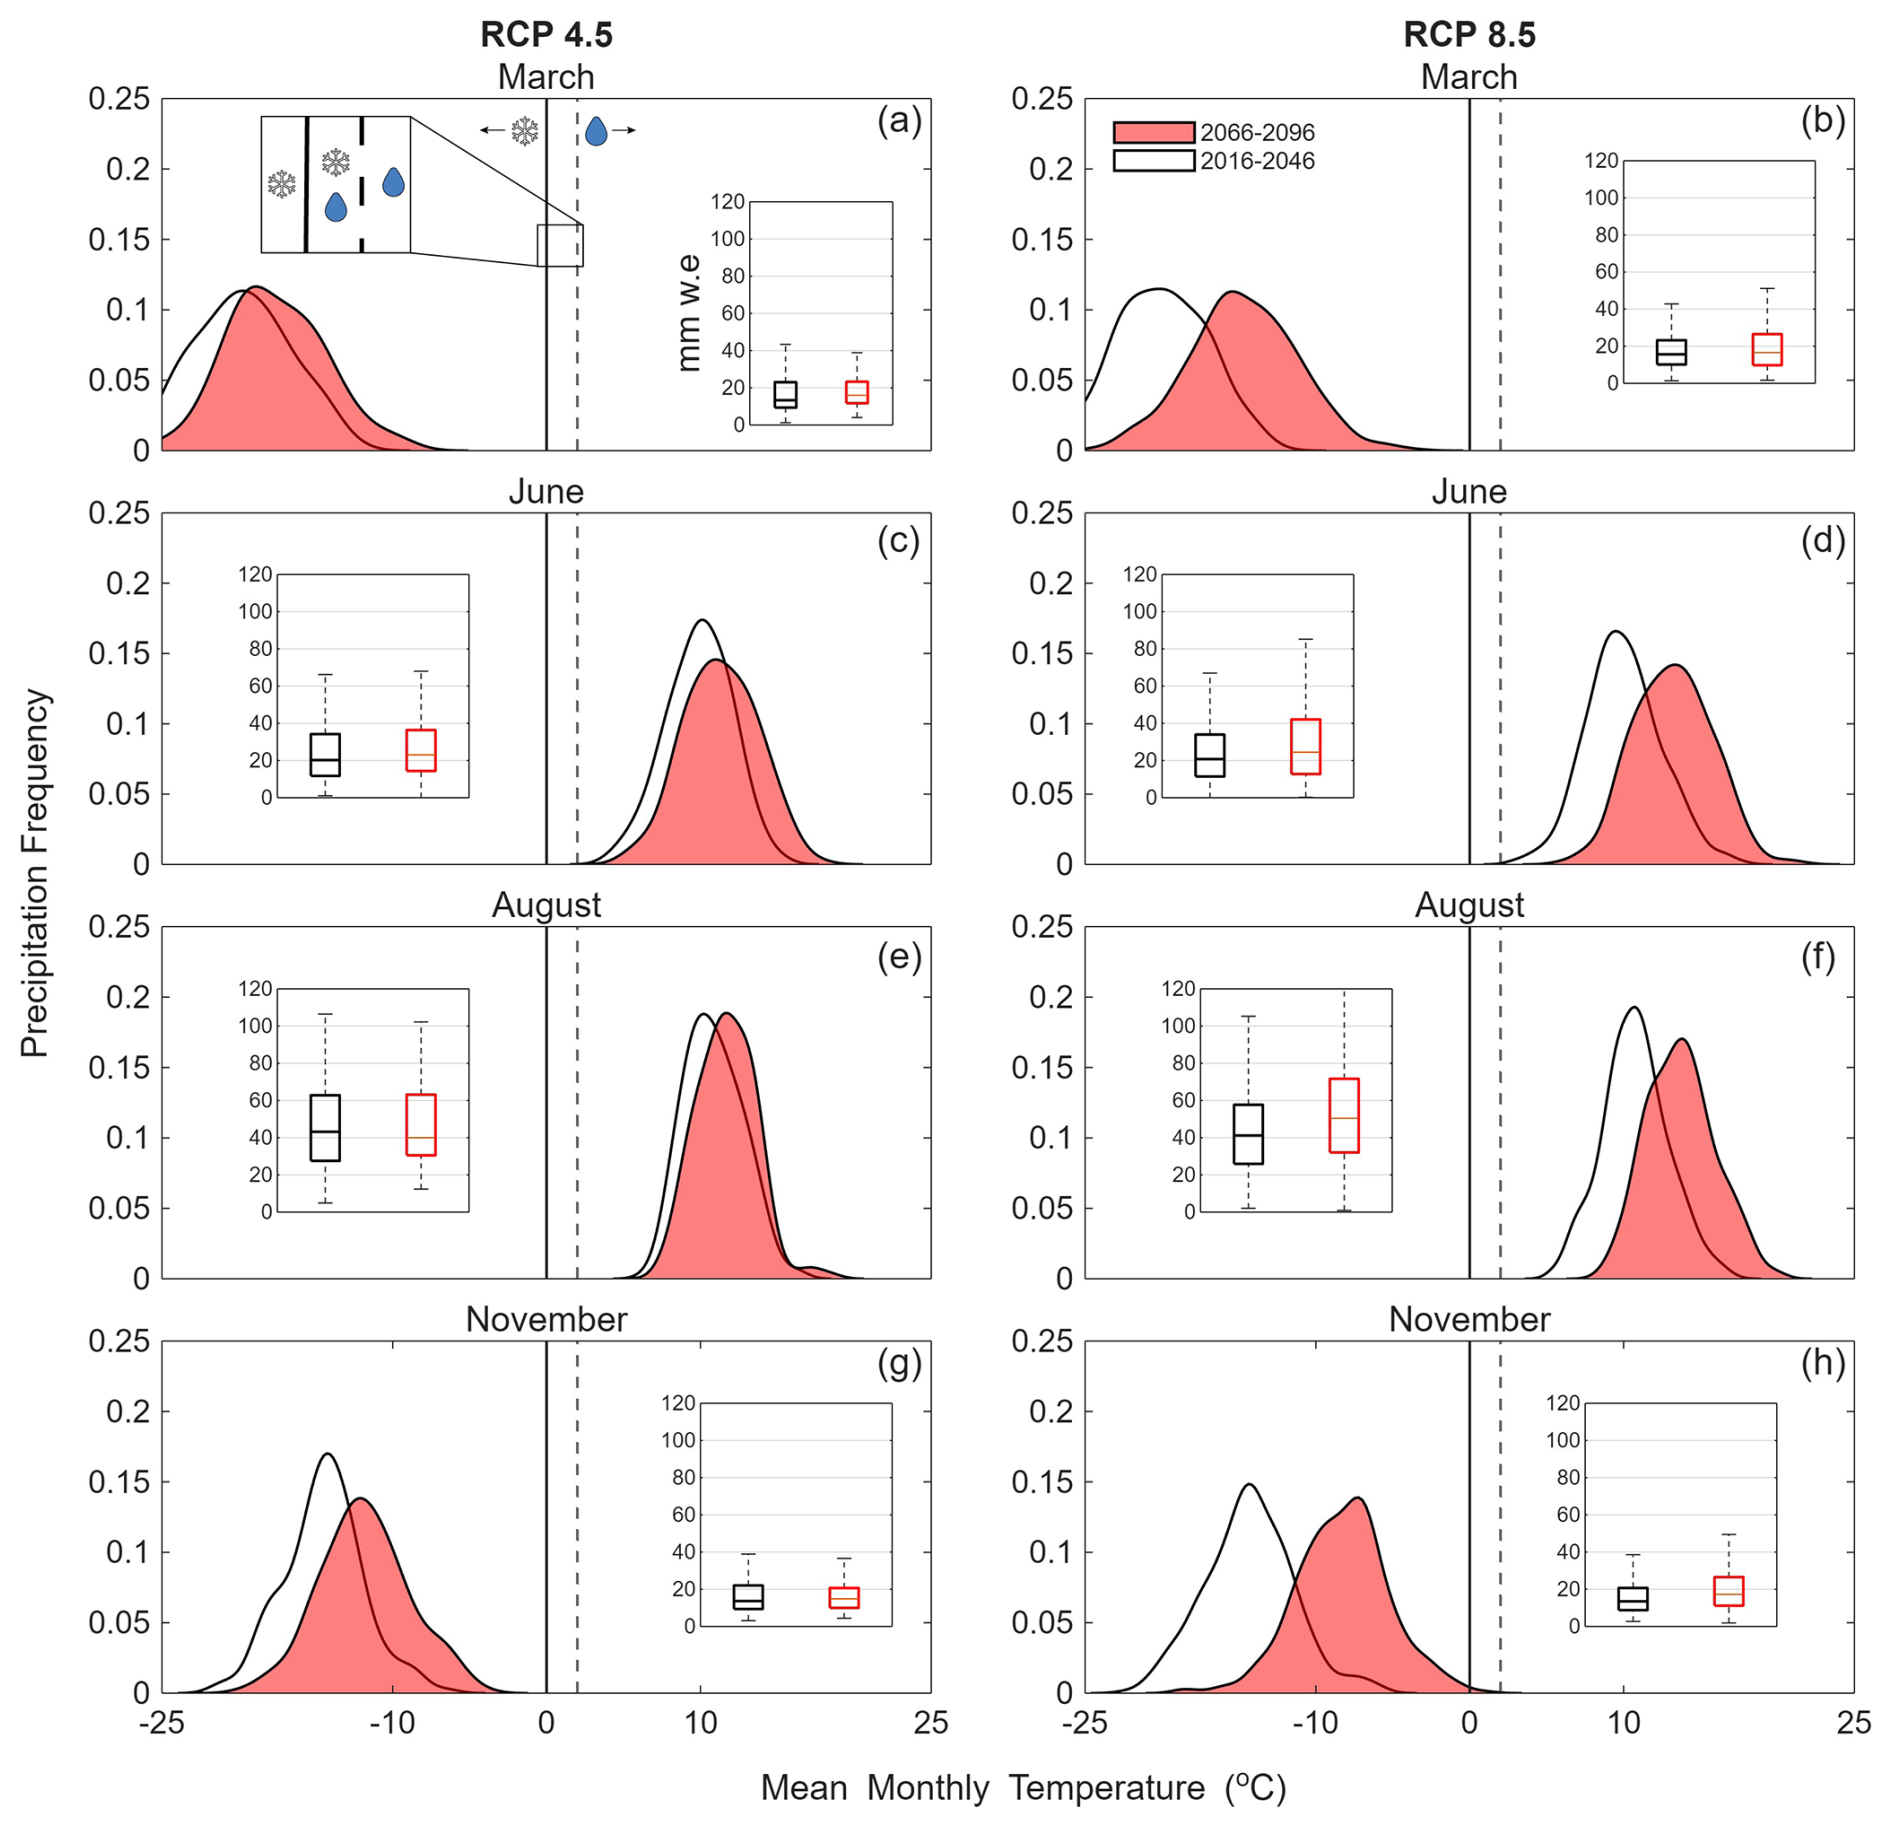
Figure F1The half-violin plots show the frequency distribution of precipitation events as a function of air temperature for TVC in March, June, August, and November under RCP 4.5 (a, c, e, g) and RCP 8.5 (b, d, f, h) over two 30-year time periods: from an ensemble of 33 NA-CORDEX GCM–GCM combinations (RCP 4.5 n = 6, RCP 8.5 n = 27). The white violins with black outlines represent 2016–2046 (black) and the red violins 2066–2096 (red) under RCP 4.5 and RCP 8.5, for TVC, using the meteorological data from an ensemble of 33 NA-CORDEX GCM–GCM combinations (RCP 4.5 n = 6, RCP 8.5 n = 27). The height of each violin represents the frequency of precipitation events at a given temperature. The solid and dashed black lines at 0 and 2 °C show the transitional temperatures between snow and rain, where CLM5.0 treats the transition in precipitation phase as a linear ramp. The inset boxplots show the monthly total precipitation for the two 30-year periods.
Code and data to produce figures are available at https://doi.org/10.5281/zenodo.17095509. The NA-CORDEX climate projections are available at https://doi.org/10.5281/zenodo.17112930.
Experimental design, CORDEX bias correction, CLM5.0 simulations, analysis, and draft preparation; JR, NR, LW, and AC. Supervision; NR and LW. All authors were involved in reviewing and editing prior to submission.
The contact author has declared that none of the authors has any competing interests.
Publisher's note: Copernicus Publications remains neutral with regard to jurisdictional claims made in the text, published maps, institutional affiliations, or any other geographical representation in this paper. While Copernicus Publications makes every effort to include appropriate place names, the final responsibility lies with the authors.
Johnny Rutherford was funded by a Research and Development Fund (RDF) Studentship from Northumbria University. The work was supported by a National Environmental Research Council (NERC) Seedcorn grant awarded to Nick Rutter and Leanne Wake (Carbon Emissions Under Arctic Snow (CEAS) project reference: NE/W003686/1). The authors thank Rosamond Tutton, Philip Marsh, Richard Essery, Robin Thorne, Gabriel Hould Gosselin, Branden Walker, Oliver Sonnentag, Jory Griffith, and Brampton Darkin for providing the field measurements required for CORDEX bias correction and thank Oliver Sonnentag and Bo Qu for advice on the approaches to process and bias-correct the CORDEX data. The authors thank Chris Derksen and Gabriel Hould Gosselin for providing comments on and edits to this paper. A raincloud plot function written by http://www.tomrmarshall.com (last access: 10 September 2025) was used to create the precipitation frequency plots shown in Fig. 2.
This research has been supported by the UK Research and Innovation, Natural Environment Research Council (grant no. NE/W003686/1).
This paper was edited by Paul Stoy and reviewed by Katharina Jentzsch and one anonymous referee.
Aalto, J., Karjalainen, O., Hjort, J., and Luoto, M.: Statistical forecasting of current and future circum-Arctic ground temperatures and active layer thickness, Geophys. Res. Lett., 45, 4889–4898, 2018.
AMAP: Snow, Water, Ice and Permafrost in the Arctic (SWIPA) 2017, Arctic Monitoring and Assessment Programme (AMAP), Oslo, Norway, xiv + 269 pp, ISBN 978-82-7971-101-8, 2017.
Andren, O. and Paustian, K.: Barley straw decomposition in the field: a comparison of models, Ecology, 68, 1190–1200, 1987.
Arndt, K. A., Lipson, D. A., Hashemi, J., Oechel, W. C., and Zona, D.: Snow melt stimulates ecosystem respiration in Arctic ecosystems, Glob. Change Biol., 26, 5042–5051, 2020.
Bigalke, S. and Walsh, J. E.: Future changes of snow in Alaska and the Arctic under stabilized global warming scenarios, Atmosphere, 13, 541, https://doi.org/10.3390/atmos13040541, 2022.
Bintanja, R. and Andry, O.: Towards a rain-dominated Arctic, Nat. Clim. Change, 7, 263–267, 2017.
Bliss, L. and Matveyeva, N.: Circumpolar arctic vegetation, Arctic Ecosystems in a Changing Climate: An Ecophysiological Perspective, Academic Press, San Diego, 59–89, https://doi.org/10.1016/B978-0-12-168250-7.50010-9, 1992.
Callaghan, T. V., Johansson, M., Brown, R. D., Groisman, P. Y., Labba, N., Radionov, V., Bradley, R. S., Blangy, S., Bulygina, O. N., Christensen, T. R., Colman, J. E., Essery, R. L. H., Forbes, B. C., Forchhammer, M. C., Golubev, V. N., Honrath, R. E., Juday, G. P., Meshcherskaya, A. V., Phoenix, G. K., Pomeroy, J., Rautio, A., Robinson, D. A., Schmidt, N. M., Serreze, M. C., Shevchenko, V. P., Shiklomanov, A. I., Shmakin, A. B., Sköld, P., Sturm, M., Woo, M.-K., and Wood, E. F.: Multiple Effects of Changes in Arctic Snow Cover, AMBIO, 40, 32–45, https://doi.org/10.1007/s13280-011-0213-x, 2011.
Cannon, A. J.: Multivariate quantile mapping bias correction: an N-dimensional probability density function transform for climate model simulations of multiple variables, Clim. Dynam., 50, 31–49, 2018.
Cannon, A. J., Alford, H., Shrestha, R. R., Kirchmeier-Young, M. C., and Najafi, M. R.: Canadian Large Ensembles Adjusted Dataset version 1 (CanLEADv1): Multivariate bias-corrected climate model outputs for terrestrial modelling and attribution studies in North America, Geoscience Data Journal, 9, 288–303, https://doi.org/10.1002/gdj3.142, 2022.
Chen, S., Wang, J., Zhang, T., and Hu, Z.: Climatic, soil, and vegetation controls of the temperature sensitivity (Q10) of soil respiration across terrestrial biomes, Global Ecology and Conservation, 22, e00955, ISSN 2351-9894, https://doi.org/10.1016/j.gecco.2020.e00955, 2020.
Christensen, J. H., Kanikicharla, K. K., Aldrian, E., An, S. I., Cavalcanti, I. F. A., de Castro, M., Dong, W., Goswami, P., Hall, A., and Kanyanga, J. K.: Climate phenomena and their relevance for future regional climate change, in: Climate change 2013 the physical science basis: Working group I contribution to the fifth assessment report of the intergovernmental panel on climate change, Cambridge University Press, 1217–1308, https://doi.org/10.1017/CBO9781107415324.028, 2013.
Cohen, J., Ye, H., and Jones, J.: Trends and variability in rain-on-snow events, Geophys. Res. Lett., 42, 7115–7122, https://doi.org/10.1002/2015gl065320, 2015.
Commane, R., Lindaas, J., Benmergui, J., Luus, K. A., Chang, R. Y.-W., Daube, B. C., Euskirchen, E. S., Henderson, J. M., Karion, A., and Miller, J. B.: Carbon dioxide sources from Alaska driven by increasing early winter respiration from Arctic tundra, P. Natl. Acad. Sci. USA, 114, 5361–5366, 2017.
Dutch, V. R., Rutter, N., Wake, L., Sandells, M., Derksen, C., Walker, B., Hould Gosselin, G., Sonnentag, O., Essery, R., Kelly, R., Marsh, P., King, J., and Boike, J.: Impact of measured and simulated tundra snowpack properties on heat transfer, The Cryosphere, 16, 4201–4222, https://doi.org/10.5194/tc-16-4201-2022, 2022.
Dutch, V. R., Rutter, N., Wake, L., Sonnentag, O., Hould Gosselin, G., Sandells, M., Derksen, C., Walker, B., Meyer, G., Essery, R., Kelly, R., Marsh, P., Boike, J., and Detto, M.: Simulating net ecosystem exchange under seasonal snow cover at an Arctic tundra site, Biogeosciences, 21, 825–841, https://doi.org/10.5194/bg-21-825-2024, 2024.
Ednie, M. and Smith, S.: Permafrost temperature data 2008–2014 from community based monitoring sites in Nunavut, Geological Survey of Canada, Open File, 7784, https://doi.org/10.4095/296705, 2015.
Elberling, B. and Brandt, K. K.: Uncoupling of microbial CO2 production and release in frozen soil and its implications for field studies of arctic C cycling, Soil Biol. Biochem., 35, 263–272, 2003.
Euskirchen, E., Bret-Harte, M., Shaver, G., Edgar, C., and Romanovsky, V.: Long-term release of carbon dioxide from arctic tundra ecosystems in Alaska, Ecosystems, 20, 960–974, 2017.
Fahnestock, J. T., Jones, M. H., and Welker, J. M.: Wintertime CO2 efflux from arctic soils: implications for annual carbon budgets, Global Biogeochem. Cy., 13, 775–779, 1999.
Fierer, N., Craine, J. M., McLauchlan, K., and Schimel, J. P.: Litter quality and the temperature sensitivity of decomposition, Ecology, 86, 320–326, 2005.
Grünberg, I. , Cable, B. , Antonova, S. , Lange, S. and Boike, J.: Soil temperature and thaw depth differences associated with tundra vegetation types at Trail Valley Creek, NWT, Canada , EGU General Assembly 2019, Vienna, 7 April 2019–12 April 2019, 2019.
Harr, R. D.: Some characteristics and consequences of snowmelt during rainfall in western Oregon, J. Hydrol., 53, 277–304, 1981.
Hugelius, G., Strauss, J., Zubrzycki, S., Harden, J. W., Schuur, E. A. G., Ping, C.-L., Schirrmeister, L., Grosse, G., Michaelson, G. J., Koven, C. D., O'Donnell, J. A., Elberling, B., Mishra, U., Camill, P., Yu, Z., Palmtag, J., and Kuhry, P.: Estimated stocks of circumpolar permafrost carbon with quantified uncertainty ranges and identified data gaps, Biogeosciences, 11, 6573–6593, https://doi.org/10.5194/bg-11-6573-2014, 2014.
Intergovernmental Panel on Climate, C.: Climate Change 2022 – Impacts, Adaptation and Vulnerability: Working Group II Contribution to the Sixth Assessment Report of the Intergovernmental Panel on Climate Change, Cambridge University Press, Cambridge, https://doi.org/10.1017/9781009325844, 2023.
Jordan, R.: A One-Dimensional Temperature Model for Snow Cover, Technical Documentation for SNTHERM, US Army Corps of Engineers, Special Report 91–16, 89, https://hdl.handle.net/11681/11677, 1991.
King, J., Derksen, C., Toose, P., Langlois, A., Larsen, C., Lemmetyinen, J., Marsh, P., Montpetit, B., Roy, A., and Rutter, N.: The influence of snow microstructure on dual-frequency radar measurements in a tundra environment, Remote Sens. Environ., 215, 242–254, 2018.
Kittler, F., Heimann, M., Kolle, O., Zimov, N., Zimov, S., and Göckede, M.: Long-term drainage reduces CO2 uptake and CH4 emissions in a Siberian permafrost ecosystem, Global Biogeochem. Cy., 31, 1704–1717, 2017.
Koven, C. D., Riley, W. J., and Stern, A.: Analysis of permafrost thermal dynamics and response to climate change in the CMIP5 Earth System Models, J. Climate, 26, 1877–1900, 2013.
Larson, E. J., Schiferl, L. D., Commane, R., Munger, J. W., Trugman, A. T., Ise, T., Euskirchen, E. S., Wofsy, S., and Moorcroft, P. M.: The changing carbon balance of tundra ecosystems: results from a vertically-resolved peatland biosphere model, Environ. Res. Lett., 17, 014019, https://doi.org/10.1088/1748-9326/ac4070, 2021.
Lawrence, D. M., Koven, C. D., Swenson, S. C., Riley, W. J., and Slater, A.: Permafrost thaw and resulting soil moisture changes regulate projected high-latitude CO2 and CH4 emissions, Environ. Res. Lett., 10, 094011, https://doi.org/10.1088/1748-9326/10/9/094011, 2015.
Lawrence, D. M., Fisher, R. A., Koven, C. D., Oleson, K. W., Swenson, S. C., Bonan, G., Collier, N., Ghimire, B., van Kampenhout, L., and Kennedy, D.: The Community Land Model version 5: Description of new features, benchmarking, and impact of forcing uncertainty, J. Adv. Model. Earth Sy., 11, 4245–4287, 2019.
Marsh, P., Onclin, C., and Neumann, N.: Water and energy fluxes in the lower Mackenzie Valley, 1994/95, Atmos. Ocean, 40, 245–256, 2002.
Mastepanov, M., Sigsgaard, C., Tagesson, T., Ström, L., Tamstorf, M. P., Lund, M., and Christensen, T. R.: Revisiting factors controlling methane emissions from high-Arctic tundra, Biogeosciences, 10, 5139–5158, https://doi.org/10.5194/bg-10-5139-2013, 2013.
Mazurkiewicz, A. B., Callery, D. G., and McDonnell, J. J.: Assessing the controls of the snow energy balance and water available for runoff in a rain-on-snow environment, J. Hydrol., 354, 1–14, 2008.
McCrystall, M. R., Stroeve, J., Serreze, M., Forbes, B. C., and Screen, J. A.: New climate models reveal faster and larger increases in Arctic precipitation than previously projected, Nat. Commun., 12, 6765, https://doi.org/10.1038/s41467-021-27031-y, 2021.
McGinnis, S. and Mearns, L.: Building a climate service for North America based on the NA-CORDEX data archive, Climate Services, 22, 100233, https://doi.org/10.1016/j.cliser.2021.100233, 2021.
Miner, K. R., Turetsky, M. R., Malina, E., Bartsch, A., Tamminen, J., McGuire, A. D., Fix, A., Sweeney, C., Elder, C. D., and Miller, C. E.: Permafrost carbon emissions in a changing Arctic, Nature Reviews Earth & Environment, 3, 55–67, 2022.
Mudryk, L., Santolaria-Otín, M., Krinner, G., Ménégoz, M., Derksen, C., Brutel-Vuilmet, C., Brady, M., and Essery, R.: Historical Northern Hemisphere snow cover trends and projected changes in the CMIP6 multi-model ensemble, The Cryosphere, 14, 2495–2514, https://doi.org/10.5194/tc-14-2495-2020, 2020.
Mudryk, L., Elias Chereque, A., Derksen, C., Luojus, K., and Decharme, B: Arctic Report Card 2021: Terrestrial Snow Cover, https://doi.org/10.25923/16xy-9h55, 2021.
Müller, J., Paudel, R., Shoemaker, C. A., Woodbury, J., Wang, Y., and Mahowald, N.: CH4 parameter estimation in CLM4.5bgc using surrogate global optimization, Geosci. Model Dev., 8, 3285–3310, https://doi.org/10.5194/gmd-8-3285-2015, 2015.
Natali, S. M., Watts, J. D., Rogers, B. M., Potter, S., Ludwig, S. M., Selbmann, A.-K., Sullivan, P. F., Abbott, B. W., Arndt, K. A., and Birch, L.: Large loss of CO2 in winter observed across the northern permafrost region, Nat. Clim. Change, 9, 852–857, 2019.
Pedron, S., Jespersen, R., Xu, X., Khazindar, Y., Welker, J., and Czimczik, C.: More snow accelerates legacy carbon emissions from Arctic permafrost, AGU Advances, 4, e2023AV000942, https://doi.org/10.1029/2023AV000942, 2023.
Pongracz, A., Wårlind, D., Miller, P. A., and Parmentier, F.-J. W.: Model simulations of arctic biogeochemistry and permafrost extent are highly sensitive to the implemented snow scheme in LPJ-GUESS, Biogeosciences, 18, 5767–5787, https://doi.org/10.5194/bg-18-5767-2021, 2021.
Quinton, W., Gray, D., and Marsh, P.: Subsurface drainage from hummock-covered hillslopes in the Arctic tundra, J. Hydrol., 237, 113–125, 2000.
Raz-Yaseef, N., Torn, M. S., Wu, Y., Billesbach, D. P., Liljedahl, A. K., Kneafsey, T. J., Romanovsky, V. E., Cook, D. R., and Wullschleger, S. D.: Large CO2 and CH4 emissions from polygonal tundra during spring thaw in northern Alaska, Geophys. Res. Lett., 44, 504–513, 2017.
Riley, W. J., Subin, Z. M., Lawrence, D. M., Swenson, S. C., Torn, M. S., Meng, L., Mahowald, N. M., and Hess, P.: Barriers to predicting changes in global terrestrial methane fluxes: analyses using CLM4Me, a methane biogeochemistry model integrated in CESM, Biogeosciences, 8, 1925–1953, https://doi.org/10.5194/bg-8-1925-2011, 2011.
Royer, A., Picard, G., Vargel, C., Langlois, A., Gouttevin, I., and Dumont, M.: Improved Simulation of Arctic Circumpolar Land Area Snow Properties and Soil Temperatures, Front. Earth Sci., 9, 515, https://doi.org/10.3389/feart.2021.685140, 2021.
Schaefer, K. and Jafarov, E.: A parameterization of respiration in frozen soils based on substrate availability, Biogeosciences, 13, 1991–2001, https://doi.org/10.5194/bg-13-1991-2016, 2016.
Schimel, J. P., Bilbrough, C., and Welker, J. M.: Increased snow depth affects microbial activity and nitrogen mineralization in two Arctic tundra communities, Soil Biol. Biochem., 36, 217–227, 2004.
Schimel, J. P., Fahnestock, J., Michaelson, G., Mikan, C., Ping, C.-L., Romanovsky, V. E., and Welker, J.: Cold-season production of CO2 in arctic soils: can laboratory and field estimates be reconciled through a simple modeling approach?, Arct. Antarct. Alp. Res., 38, 249–256, 2006.
Schuur, E. A., McGuire, A. D., Schädel, C., Grosse, G., Harden, J. W., Hayes, D. J., Hugelius, G., Koven, C. D., Kuhry, P., and Lawrence, D. M.: Climate change and the permafrost carbon feedback, Nature, 520, 171–179, 2015.
Serreze, M. C., Gustafson, J., Barrett, A. P., Druckenmiller, M. L., Fox, S., Voveris, J., Stroeve, J., Sheffield, B., Forbes, B. C., and Rasmus, S.: Arctic rain on snow events: bridging observations to understand environmental and livelihood impacts, Environ. Res. Lett., 16, 105009, https://doi.org/10.1088/1748-9326/ac269b, 2021.
Shogren, A. J., Zarnetske, J. P., Abbott, B. W., Iannucci, F., and Bowden, W. B.: We cannot shrug off the shoulder seasons: Addressing knowledge and data gaps in an Arctic headwater, Environ. Res. Lett., 15, 104027, https://doi.org/10.1088/1748-9326/ab9d3c, 2020.
Sturm, M., Holmgren, J., König, M., and Morris, K.: The thermal conductivity of seasonal snow, J. Glaciol., 43, 26–41, 1997.
Sturtevant, C. S., Oechel, W. C., Zona, D., Kim, Y., and Emerson, C. E.: Soil moisture control over autumn season methane flux, Arctic Coastal Plain of Alaska, Biogeosciences, 9, 1423–1440, https://doi.org/10.5194/bg-9-1423-2012, 2012.
Tao, J., Zhu, Q., Riley, W. J., and Neumann, R. B.: Improved ELMv1-ECA simulations of zero-curtain periods and cold-season CH4 and CO2 emissions at Alaskan Arctic tundra sites, The Cryosphere, 15, 5281–5307, https://doi.org/10.5194/tc-15-5281-2021, 2021.
Thompson, A., Kelly, R., and Marsh, P.: Spatial variability of snow at Trail Valley Creek, NWT. In 73rd Eastern Snow Conference, Columbus, Ohio, USA, 101–108, 2016.
Treat, C. C., Virkkala, A. M., Burke, E., Bruhwiler, L., Chatterjee, A., Fisher, J. B., Hashemi, J., Parmentier, F. J. W., Rogers, B. M., and Westermann, S.: Permafrost carbon: Progress on understanding stocks and fluxes across northern terrestrial ecosystems, J. Geophys. Res.-Biogeo., 129, e2023JG007638, https://doi.org/10.1029/2023JG007638, 2024.
Trenberth, K. E.: Atmospheric moisture residence times and cycling: Implications for rainfall rates and climate change, Climatic Change, 39, 667–694, 1998.
Tutton, R., Darkin, B., Essery, R., Griffith, J., Hould Gosselin, G., Marsh, P., Sonnentag, O., Thorne, R., and Walker, B.: A 885 hydro-meterological dataset from the taiga-tundra ecotone in the western Canadian Arctic: Trail Valley Creek, Northwest Territories [data set], Borealis, https://doi.org/10.5683/SP3/BXV4DE, 2024.
Voigt, C., Virkkala, A.-M., Hould Gosselin, G., Bennett, K. A., Black, T. A., Detto, M., Chevrier-Dion, C., Guggenberger, G., Hashmi, W., and Kohl, L.: Arctic soil methane sink increases with drier conditions and higher ecosystem respiration, Nat. Clim. Change, 13, 1095–1104, 2023.
Webb, E. E., Schuur, E. A., Natali, S. M., Oken, K. L., Bracho, R., Krapek, J. P., Risk, D., and Nickerson, N. R.: Increased wintertime CO2 loss as a result of sustained tundra warming, J. Geophys. Res.-Biogeo., 121, 249–265, 2016.
Welker, J., Fahnestock, J., and Jones, M.: Annual CO2 flux in dry and moist arctic tundra: field responses to increases in summer temperatures and winter snow depth, Climatic Change, 44, 139–150, 2000.
Wilcox, E. J., Keim, D., de Jong, T., Walker, B., Sonnentag, O., Sniderhan, A. E., Mann, P., and Marsh, P.: Tundra shrub expansion may amplify permafrost thaw by advancing snowmelt timing, Arctic Science, 5, 202–217, 2019.
Yan, D., Li, J., Pei, J., Cui, J., Nie, M., and Fang, C.: The temperature sensitivity of soil organic carbon decomposition is greater in subsoil than in topsoil during laboratory incubation, Sci. Rep., 7, 5181, 2017.
Zona, D., Gioli, B., Commane, R., Lindaas, J., Wofsy, S. C., Miller, C. E., Dinardo, S. J., Dengel, S., Sweeney, C., and Karion, A.: Cold season emissions dominate the Arctic tundra methane budget, P. Natl. Acad. Sci. USA, 113, 40–45, 2016.
- Abstract
- Introduction
- Methodology
- Results
- Discussion
- Conclusions
- Appendix A: NA-CORDEX future meteorology
- Appendix B: Zero-curtain duration
- Appendix C: CLM5.0 parameter assessment space
- Appendix D: Cumulative soil carbon emissions as constrained by “snow-down” and irrespective of snow
- Appendix E: Cumulative soil carbon emissions as constrained by “snow-down” and irrespective of snow
- Appendix F: Frequency distribution of precipitation events in March, June, August, and September 2016–2100
- Code and data availability
- Author contributions
- Competing interests
- Disclaimer
- Acknowledgements
- Financial support
- Review statement
- References