the Creative Commons Attribution 4.0 License.
the Creative Commons Attribution 4.0 License.
 | 29 Sep 2025
Effect of preceding integrated and organic farming on 15N recovery and the N balance, including emissions of NH3, N2O, and N2 and leaching of NO3−
Fawad Khan
Samuel Franco Luesma
Frederik Hartmann
Michael Dannenmann
Rainer Gasche
Clemens Scheer
Andreas Gattinger
Wiebke Niether
Elizabeth Gachibu Wangari
Ricky Mwangada Mwanake
Ralf Kiese
Ecological intensification strategies in agriculture, including organic fertilization and diversified crop rotations, aim to reduce nitrogen (N) losses to the environment. However, studies on N allocation and loss on adjacent sites with the same pedoclimatic conditions but different management histories, i.e. organic farming (OF) with frequent legume cultivation and occasional organic fertilizer input, compared to integrated farming (IF) with synthetic and organic fertilizers, have remained scarce. Understanding how these systems differ in their N dynamics is essential for improving nutrient management strategies, mitigating environmental impacts, and guiding sustainable agricultural practices. Here, we quantified field N losses (ammonia, nitrous oxide, dinitrogen, and nitrate leaching), total N balances, and 15N-labelled cattle slurry allocation to soil and plants of two adjacent sites over a 2-year cropping sequence. While IF had resulted in significantly higher pH and soil organic carbon and N content, the emissions of ammonia, nitrous oxide, and dinitrogen after cattle slurry application as well as nitrate leaching were not significantly different across the two farming techniques. Ammonia losses were low for all cultivation periods, indicating that drag hose application and manure incorporation successfully mitigate ammonia emissions. High 15N fertilizer recovery in plants and soil, along with a low share of unrecovered 15N, agreed well with the low directly measured N losses. On average, 15N recovery was lower for OF (85 % versus 93 % in IF), likely due to unaccounted N2 emissions, which could only be measured within 2 weeks after fertilizer application, but the high spatial variability of 15N recovery may have turned this difference insignificant. Significantly higher harvest biomass N for IF demonstrated that management history affected productivity through increased soil organic matter mineralization. Due to the higher productivity, the cumulative N balance across all cultivation periods was neutral within the limits of the measurement uncertainty for IF (−8 ± 15 kg N ha−1), indicating an optimized N management. For OF, the N balance across a single cultivation period ranged from −19 to 41 kg N ha−1; thus, the observations of a single cultivation period were inconclusive. The cumulative positive N balance (48 ± 14 kg N ha−1) across all cultivation periods for OF suggests that more frequent organic fertilizer additions could increase soil N (and carbon) stocks and finally improve yield. However, the positive N balance, coupled with lower 15N recovery for OF, also points to a higher likelihood of unaccounted N losses, which would, in turn, slow down the accumulation of soil N and C over time.
- Article
(9668 KB) - Full-text XML
- BibTeX
- EndNote


The excessive and inadequate use of nitrogen (N) fertilizers in agriculture has led to N pollution worldwide (Good and Beatty, 2011; Cárceles Rodríguez et al., 2022; Pomoni et al., 2023) since gaseous compounds such as ammonia (NH3), nitrous oxide (N2O), and nitric oxide (NO) are released from agricultural fields into the atmosphere, and dissolved nitrate () enters water bodies through leaching and surface runoff. Adverse effects of N loss to the environment include eutrophication, biodiversity loss, global warming, and air pollution (Liu et al., 2022; Abdo et al., 2022).
To reduce N losses, the 4R nutrient stewardship concept is one of the most prominent approaches providing advice on the right fertilizer source, at the right rate, at the right time, and at the right place (Bryla, 2011; Fixen, 2020; De Sousa and Moreira, 2024; Nigon, 2024). The adoption of this concept has led to improved nutrient use efficiency, increased crop yields, and reduced N losses (Surekha et al., 2016; Snyder, 2017; Costa et al., 2020). As a complementary strategy, legume cultivation is considered an “agro-ecological” intensification practice because it reduces reliance on external inputs, such as synthetic N fertilizers and associated fossil fuel consumption, due to their symbiotic N2 fixing ability. Simultaneously, it enhances biodiversity and improves soil fertility and their provision of nutrient-rich food (Reza and Sabau, 2022). Similarly, residue return and the combined use of organic and mineral fertilizers further enhance soil organic matter, improve soil structure, retain N in the soil, and increase N availability to plants (Gardner and Drinkwater, 2009; Iheshiulo et al., 2024; Khan et al., 2024). While these strategies offer clear benefits, studies on arable land that has been managed on the long term according to these practices and which assess balances, allocation, and losses of fertilizer N have remained scarce.
The allocation of N within the soil–plant system is commonly determined using the 15N tracing method, which utilizes fertilizers containing the rare isotope nitrogen-15 (Kramer et al., 2002; Heng et al., 2014; Chalk et al., 2015). This method has been successfully applied in arable and grassland systems (Kramer et al., 2002; Zhang et al., 2012; Quan et al., 2020; Pearsons et al., 2023; Dannenmann et al., 2024). A comprehensive meta-analysis by Gardner and Drinkwater (2009), which reviewed 217 field-scale 15N tracing studies, along with a recent global meta-analysis by Xu et al. (2024) of 79 studies on arable land, showed that the 15N tracing approach gives useful information on the ability of management practices to improve N retention and N-use efficiency. However, this method exclusively addresses the allocation of N in soil and plants while neglecting to account for N losses in the form of ammonia (NH3), nitrate (), nitrous oxide (N2O), and dinitrogen (N2). Nevertheless, such information is beneficial for fostering effective N management and providing an accurate assessment of N inputs and their environmental impacts (Zhou et al., 2016). Among the different N loss pathways, the emission of N2 is the least known since the huge background of atmospheric N2 complicates the determination of the – in comparison – small soil N2 emissions. Available methods for in situ measurement of N2 fluxes include natural abundance isotope approaches (Lewicka-Szczebak et al., 2017, 2020) and 15N labelling (Micucci et al., 2023). The 15N gas flux method (15NGF) is well established for quantifying N2 losses, and considering this loss pathway together with the more easily accessible pathways enhances our understanding of N allocation in agroecosystems (Kulkarni et al., 2017; Friedl et al., 2020; Dannenmann et al., 2024).
Previous 15N tracing studies have focused on mineral fertilizers, so there are only a few studies using 15N-labelled cattle slurry on arable land (Paul and Beauchamp, 1995; Buchen-Tschiskale et al., 2023). In addition, there is a lack of multi-year 15N tracing studies in current literature directly comparing adjacent farming sites with similar pedoclimatic conditions but different long-term management histories. Specifically, this study assesses how preceding management affects N balance and fertilizer N allocation by comparing sites with different management histories. On the organic farming site (OF), legumes had been cultivated frequently, and external N was only occasionally added in the form of cattle slurry, whereas a combination of synthetic and organic fertilizers had been used on the integrated farming site (IF).
In this context, the aims of this study were (i) to quantify in situ N losses (NH3, N2O, N2, and leaching); (ii) to determine 15N fertilizer recovery in soil and plant; (iii) to calculate field N balances; (iv) to compare the results of (i) to (iii) obtained from two adjacent sites (OF, IF); and (v) to relate the differences to the effect of management history on soil properties.
2.1 Study site management history and initial soil sampling
The study was conducted in Selters, Germany ( N, E; elevation 310 m a.s.l.), where the average annual temperature and precipitation amount are 9.3 °C and 655 mm, respectively. There are two adjacent sites, each approximately 1.0 ha in size, which were selected due to their differing long-term management histories, identical pedoclimatic conditions, and access to mains power. The organic farming (OF) site was managed organically for the past decade, with an emphasis on reducing external N inputs so that the majority of the N input is generated via legumes belowground biomass through symbiotic N2 fixation in the crop rotation. However, nitrogen inputs from symbiotic N2 fixation were not measured prior to our study. Therefore, these inputs are not included in the reported N input values. Periodically, N supply in OF was supplemented with organic cattle slurry (Khan et al., 2024; Table A1). The integrated farming (IF) site was managed using a combination of synthetic and organic fertilizers, aiming at increasing soil organic carbon (SOC) levels (Table A1). For the period 2012–2020, on average, IF received 410 and 184 , while OF received 200 and 23 (Table A1). The basic soil preparation with regular ploughing (20 cm plough depth) and seedbed preparation were the same at both sites.
To assess the differences in soil physicochemical properties resulting from historical management practices, a soil sampling campaign was carried out prior to the field trial at four randomly selected locations at OF and IF sites. At each location, a soil profile was uncovered and sampled at three depths (0–10, 10–30, and 30–60 cm). The physiochemical analyses included pH, SOC, total nitrogen (TN), soil organic carbon to total nitrogen ratio (C:N), bulk density (BD), and texture analysis. Soil pH was determined using a pH meter (Metrohm, Inolab 7310, wtw, Germany) after the soil samples were diluted in distilled water (1:5 soil to water, Dannenmann et al., 2006). To determine the SOC and TN content, soil samples were ground in a mixer mill (Retsch, MM301, Haan, Germany), sealed in a tin capsule, and subjected to isotope ratio mass spectrometry analysis (IRMS: Delta Plus XP; Thermo, Bremen, Germany) according to the protocols of Dannenmann et al. (2016) and Couto-Vázquez and Gonzalez-Prieto (2020). For BD, additional soil samples were collected using a soil core cutter with a volume of 100 cm3 and oven-dried at 105 °C for 24 h (Khan et al., 2020). For texture analysis, soil samples were randomly collected from 10 different locations in each site, pooled, sieved, air-dried, and analysed by a commercial laboratory (AGROLAB, Agrar GmbH, Sarstedt, Germany).
Due to different management histories, pH, SOC, and TN were significantly lower on OF, while bulk density was significantly higher for OF in 0 to 10 cm depth (Table 1). The soil of both sites has a silty loam texture with almost identical percentages of silt, sand, and clay.
Table 1Soil properties of initial sampling from the organic farming (OF) and integrated farming (IF) sites. All values are given as mean ± standard error (SE, n=4), except for C:N and texture analysis values (only the mean value). In the case of texture analysis, NA represents the samples that were not measured at the corresponding depth.
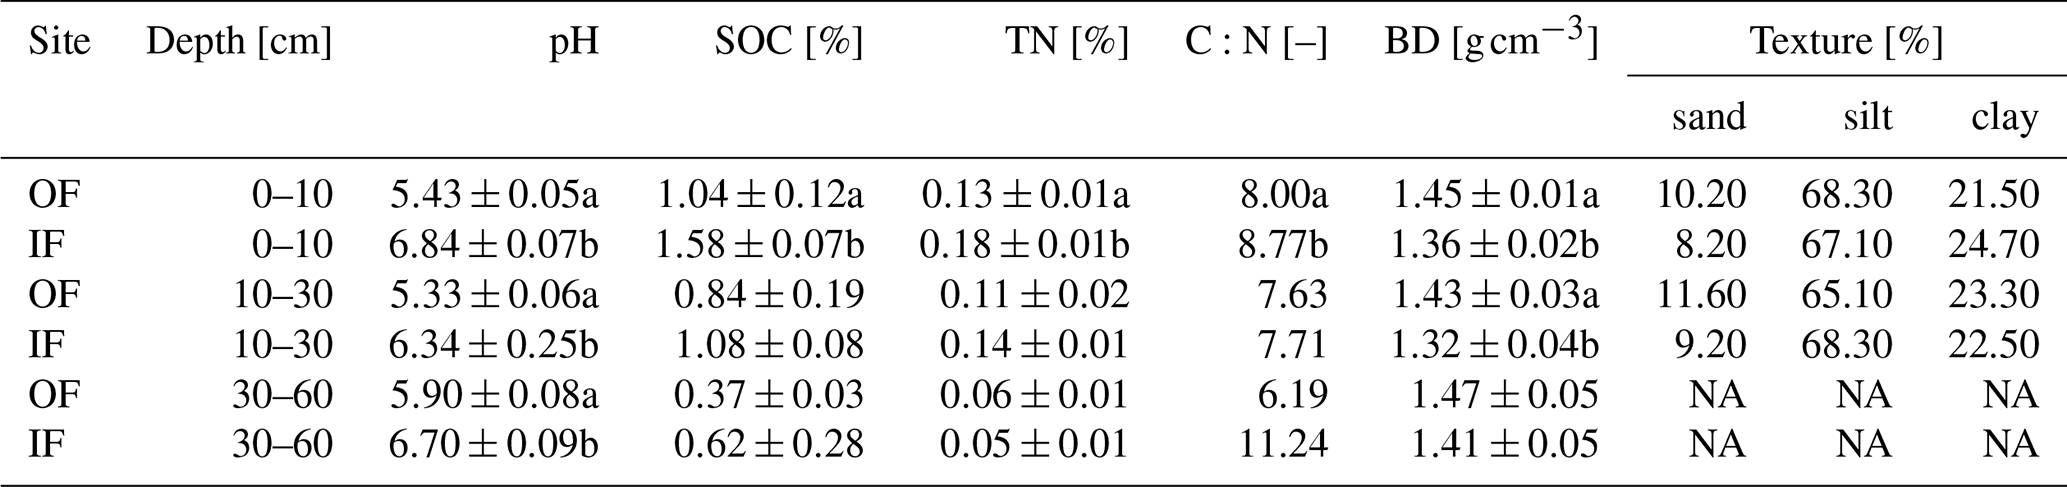
The letters a and b specify the significant difference (p<0.05) between OF and IF sites.
2.2 Agricultural management during field experiment
The trial period spanned from October 2020 to the end of September 2022, during which fertilizer amount, type, and crop cultivation were identical on both sites to avoid bias in N loss and allocation due to fertilizer amount. However, we acknowledge that this management homogenization may mask legacy effects and introduce potential biases in interpreting differences between sites. Using a seed drilling device, 300 kernels per square metre of green rye were sown at a depth of 3 cm with a row distance of 15 cm in October 2020. On 8 April, 25 m3 ha−1 (88 kg N ha−1, 750 kg C ha−1) of cattle slurry was applied as a top-dressing application for green rye using a drag hose. Green rye was harvested on 10 May 2021. On 31 May 2021, 20 m3 of cattle slurry (74.8 kg N ha−1, 600 kg C ha−1) was applied as a pre-sowing fertilization for silage maize. It was incorporated with one pass of a disc harrow followed by one pass of a rotary tiller. Subsequently, silage maize was sown at a plant density of 90 000 plants ha−1 with a row spacing of 75 cm. Silage maize was harvested on 30 September 2021. In October 2021, perennial ryegrass was seeded at both sites at a density of 45 kg ha−1 with 12.5 cm row spacing. On 29 March and 30 May 2022, cattle slurry was applied using a drag hose at a rate of 25 m3 (86 kg N ha−1) and 20 m3 (65 kg N ha−1), respectively. Perennial ryegrass was harvested on 28 May, 5 July, and 22 September 2022.
2.3 Experimental units and associated measurements
Since several parameters were quantified, an overview of the associated experimental units is given here (Fig. 1), while the detailed method is presented in the dedicated sections. Crop yield was determined on macroplots (4 m by 4 m), four replicates at each site. Dinitrogen and N2O emissions were measured on mesocosms (0.16 m diameter) with six mesocosms at each site. Recovery of 15N in soil and plants was measured on microplots (0.30 m by 0.75 m) with four replicates at each site. Ammonia emissions were determined using semi-open chambers (0.16 m diameter) with four replicates at each site, and leaching was determined using self-integrated accumulative (SIA) collectors which were buried at both sites in four locations in 1 m depth, with three replicates per location for each cultivation period.
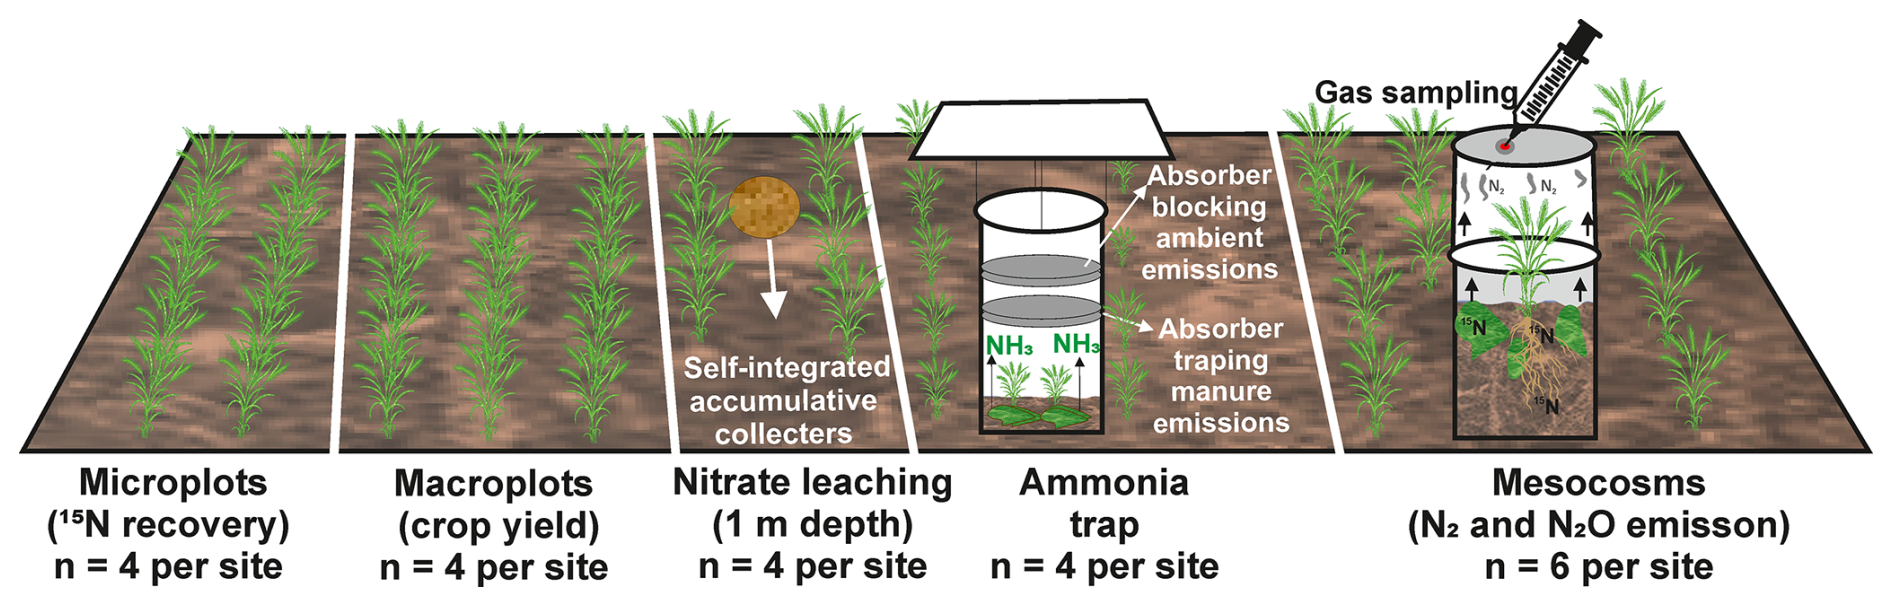
Figure 1Schematic representation of the experimental units and associated measurements to assess the N balance and fertilizer N allocation. Microplots were established to assess 15N recovery from soil and plants, macroplots to measure crop yield, self-integrated accumulative collectors (at 1 m depth) to monitor nitrate leaching, semi-open chambers with absorbers for ammonia, and mesocosms to quantify gaseous N emissions (N2 and N2O) through gas sampling. The experiment included four replicates per site for microplots, macroplots, nitrate leaching, and ammonia traps, as well as six replicates per site for mesocosms.
2.4 Crop biomass yield
At each harvest, aboveground biomass was harvested in each of the macroplots by harvesting the whole area using a plot harvester (Haldrup, 1.5 m harvesting width). Biomass dry matter was determined in subsamples from each macroplot by oven-drying at 60 °C for several days until a stable mass was reached. To determine total biomass N content, samples were milled and analysed using an elemental analyser (DIN/ISO 13878:1998, Elementar Analyser system GmbH, Langenselbold, Germany).
2.5 Determination of dinitrogen emissions from soil–plant mesocosms
To determine N2 emission, the 15N gas flux method (15NGF) was applied where N2 emission is calculated from the isotopic compositions of N2 in atmospheric background and in the headspace of a soil chamber that previously had received 15N-labelled fertilizer (Hauck et al., 1958; Mulvaney and Boast, 1986; Spott et al., 2006). The mesocosms were managed in the same manner as the field plots. To this end, six mesocosms from OF and IF were collected in steel cylinders (0.26 m height and 0.16 m diameter) a month before fertilization and buried in a trench at the site. For the target application rate of 88 kg N ha−1, cattle slurry was properly mixed with 15N– and 15N-urea to obtain an enrichment of 85 at. % (Table A2). The 15N-labelled cattle slurry was applied to each mesocosm during green rye cultivation, by simulating a drag hose application. In the silage maize cultivation period, the target application rate was 74.8 kg N ha−1, and labelled slurry was applied by mimicking drag hose application and incorporated into the soil using manual tillage, following the legal regulation in Germany. Subsequently, corn seeds were planted. In the same way, labelled cattle slurry, with 85 at. %, was prepared for the perennial ryegrass first (86 kg N ha−1) and second (65 kg N ha−1) application and applied by simulating a drag hose application.
For the N2 gas measurements, 0.16 m high chambers were tightly affixed to the mesocosms using a steel tension clasp, and gaseous samples were collected using a syringe directly after fixing the chamber and after 2 h chamber closure time. The syringe was flushed three times with chamber headspace air, and 20 mL was transferred to a pre-evacuated 12 mL Exetainer (Model 837 W, Labco Limited, United Kingdom) that had been flushed with helium gas three times. Gas samples were collected daily from day D1 to D7 and additionally on days D9, D11, D13, D21, and D28, following fertilization.
Gas samples were analysed using an isotope ratio mass spectrometer (Isoprime PrecisION, Elementar UK Ltd., Stockport, UK), coupled to an isoFLOW GHG GasBench (Elementar UK Ltd.). This setup allows for subsampling of gas volumes (30 µL) for 15N–N2 analysis by measuring 28, 29, and 30 and for analysis of 15N–N2O after cryogenic pre-concentration of N2O of the remaining vial content by measurement of 44, 45, and 46. Gas handling and preparation followed the protocol described in Arah (1997), Stevens and Laughlin (2001a), and Spott et al. (2006). In-run uncertainty, determined from repeated analysis of reference gases for isotope ratios r29, r30, r45, and r46, amounted to , , , and , respectively. At the enrichment of the fertilizer added to the mesocosms (85 at. %), this standard deviation values relate to 87 . The fraction of fertilizer-derived N2 was determined by calculating the ratio between the 15N atom excess percentage of the emitted N2 and the 15N atom excess percentage of the applied N fertilizer, following the procedure given in Yankelzon et al. (2024b).
2.6 Determination of ammonia losses
The measurement of NH3 emissions into the atmosphere was conducted using the semi-open chamber approach, as described by Jantalia et al. (2012), using polyvinyl chloride (PVC) cylinders containing two polyurethane foams. The foams were pre-soaked in 40 mL 1 M sulfuric acid solution containing 4 % () glycerol until they absorbed all the solution and were then placed inside the PVC cylinder on fixtures 5 and 20 cm above the ground. The top foam was used to protect the lower foam disc of NH3 deposition, while the bottom foam was used to detect NH3 emissions from soil fertilizer N application. Subsequently, the PVC cylinders were placed onto frames previously installed in the soil of OF and IF. Foam discs were exchanged at daily frequency during the first week after fertilization and every second day up to a maximum of 14 d of measurement after fertilization. The NH3 released was captured as on the acidified foams and subsequently extracted using 150 mL of 2 M potassium chloride. Extracts from the bottom foam discs were analysed for ammonium () using an indophenol colorimetry approach based on Kempers and Zweers (1986) and converted to an emission rate in –N by considering the duration of the exposition of the foam disc and the area of the chamber. The quantified NH3 emissions were considered in the 15N balance by calculating the share of volatilized N of the mineral N amount applied in slurry for each cultivation period.
2.7 Determination of nitrous oxide fluxes
Nitrous oxide emissions were determined simultaneously with the N2 emissions by sampling 15N-enriched soil–plant mesocosm headspace air into 10 mL vials by manual syringe sampling as described above for dinitrogen fluxes and subsequently determining the mixing ratio using gas chromatographic analysis. The flux was calculated from the change in N2O mixing ratio over time during chamber closure using Eq. (1):
where F is N2O flux (), p is the atmospheric pressure (N m−2), M is the molar mass of N2O–N (µg mol−1), h is chamber height (m), ΔCv is the change in volume mixing ratio (ppm), R is the ideal gas constant (), T is the temperature (K), Δt is the duration of the chamber closure (hours), and A (m2) is the surface area of the mesocosms. The obtained value was used to calculate the product ratio of denitrification by dividing F by the sum of F and the N2 flux.
2.8 Determination of nitrate leaching
Losses in the form of leaching were determined using the SIA method (self-integrating accumulators, TerrAquat-GmbH; Grahmann et al., 2018). SIAs are absorber materials that were installed at a depth of 1.0 m in an undisturbed soil section of both sites (OF, IF) and can, thus, collect nitrate during each cultivation period. In the laboratory, the bound was extracted from the SIAs using a concentrated 2 M potassium chloride solution, and the nitrate concentration in the extracts was measured using an indophenol colorimetry approach (Kempers and Zweers, 1986; Grahmann et al., 2018). Nitrate leaching was considered in the 15N balance by calculating the share of leached N of the N amount applied in the labelled slurry for each cultivation period, implicitly assuming that leaching is due to fertilizer application and occurs within one cultivation period.
2.9 15N fertilizer tracing on microplots
2.9.1 Preparation and application of 15N-labelled cattle slurry fertilizer
To determine 15N recovery in soil and plants, microplots were established by inserting four steel frames each (length × width × height: ; Table A2) into the soil at OF and IF. These microplots contained two rows of green rye in 2021, followed by one row of silage maize in 2021 and two rows of perennial ryegrass in 2022. For fertilization, cattle slurry was mixed with 15N– and 15N-urea to achieve an atomic enrichment of 10 at. %, and the 15N-labelled cattle slurry was applied manually, mimicking a drag hose fertilizer application. The amounts of cattle slurry, 15N salts, and Milli-Q water for production of spiked slurry were calculated based on slurry analysis and in a way that the total N content and amount of spiked slurry equalled that of the original slurry and that the total N amount was 88 kg N ha−1 for the green rye cultivation period. Similarly, 15N– and 15N-urea were properly mixed with cattle slurry to achieve a total N amount of 74.8 kg N ha−1 for the silage maize application. Following the legal regulation in Germany, the 15N-labelled cattle slurry was applied before planting silage maize and incorporated into the soil using a hoe. In a similar manner to green rye and silage maize, 15N-labelled cattle slurry was prepared for the perennial ryegrass cultivation period in 2022, yielding 86 and 65 kg N ha−1 for the initial and second application, respectively. The slurry was applied manually, simulating a drag hose application.
2.9.2 Calculation of 15N recovery in plants and soil
At the end of each cultivation period, all aboveground biomass was harvested from the microplots, and belowground biomass was separated from the soil in a vessel. On the date of the first and second perennial ryegrass harvest in 2022, only aboveground biomass was cut. Plant samples were dried at 60 °C for a week to reach a constant dry weight, after which they were crushed in a mixer mill (Retsch, MM301, Haan, Germany), and 2 mg samples were packed in tin capsules for determination of TN, SOC, and the 15N atom fraction using an isotopic ratio mass spectrometer (IRMS: Delta Plus XP; Thermo, Bremen, Germany). The recovery of 15N in plants was calculated from the 15N excess compared to natural abundance and the amount of 15N applied with the cattle slurry, with a detailed description being given in Dannenmann et al. (2016).
Similarly, the soil samples from each microplot (0.225 m2) were collected at different depths (0–10, 10–30, 30–60, and 60–90 cm). The soil samples were thoroughly homogenized, sieved (2 mm), and oven-dried at 60 °C until they reached a constant dry weight. After that, the soil samples were ground in a mixer mill (Retsch, MM301, Haan, Germany) and packed in tin capsules for measuring SOC, TN, and atom 15N fraction by elemental analysis coupled to mass spectrometry (Delta Plus XP; Thermo, Bremen, Germany). In analogy to the plant recovery, total soil recovery was calculated from the 15N excess compared to natural abundance and the amount of 15N applied with the cattle slurry (Dannenmann et al., 2016).
2.10 Nitrogen balance
The N balance was calculated to quantify the difference of N applied to the sites and lost from the sites (Eq. 2).
Here, Ninput refers to the N added through fertilizer, Ndeposition is N from atmospheric deposition (taken from the German Environmental Protection Agency), Nharvest accounts for N removed through crop harvest, and Nloss includes N lost via leaching as well gaseous losses in form of NH3, N2O, and N2. To calculate N deposition for specific crop periods, the annual deposition rate was divided by 365 d and scaled according to the duration (in days) of each crop cultivation period.
2.11 Data processing and statistical analysis
The total 15N recovery, losses, and N balance were calculated in the Microsoft Excel software program (Microsoft Office 2019, Microsoft, Seattle, WA, USA). The statistical package of the Social Sciences (SPSS version 27.0, IBM Crop., Armonk, NY, USA) was used for statistical analysis. Normality was tested using the Shapiro–Wilk test, and based on the result, either the sample t test or the Wilcoxon test was carried out to test significant differences at a 95 % confidence interval between the OF and IF sites. The soil recovery of 15N was calculated as the sum of the recoveries in different soil depths (0–10, 10–30, 30–60, and 60–90 cm). To calculate cumulative N2 and N2O emissions, a linear interpolation was made for the days where no measurement was conducted. Furthermore, OriginPro 2020b (OriginLab Corporation, Northampton, Massachusetts) was used for illustrations.
3.1 Crop yield
In the green rye cultivation period, significantly higher harvested aboveground biomass (AGB) and aboveground biomass N (AGB-N) were recorded for IF (Table 2). In contrast, OF showed significantly higher AGB and AGB-N in the silage maize cultivation period. During the perennial ryegrass cultivation period, the AGB and AGB-N were significantly higher for IF, and average IF values across the three crops were significantly higher for AGB-N (20 %) but not significantly higher for AGB (13 %; Table. 2).
Table 2Average aboveground biomass (AGB) and aboveground biomass N (AGB-N) with standard error (SE), expressed as absolute dry matter, were reported for the different cultivation periods in organic farming (OF) and integrated farming (IF).
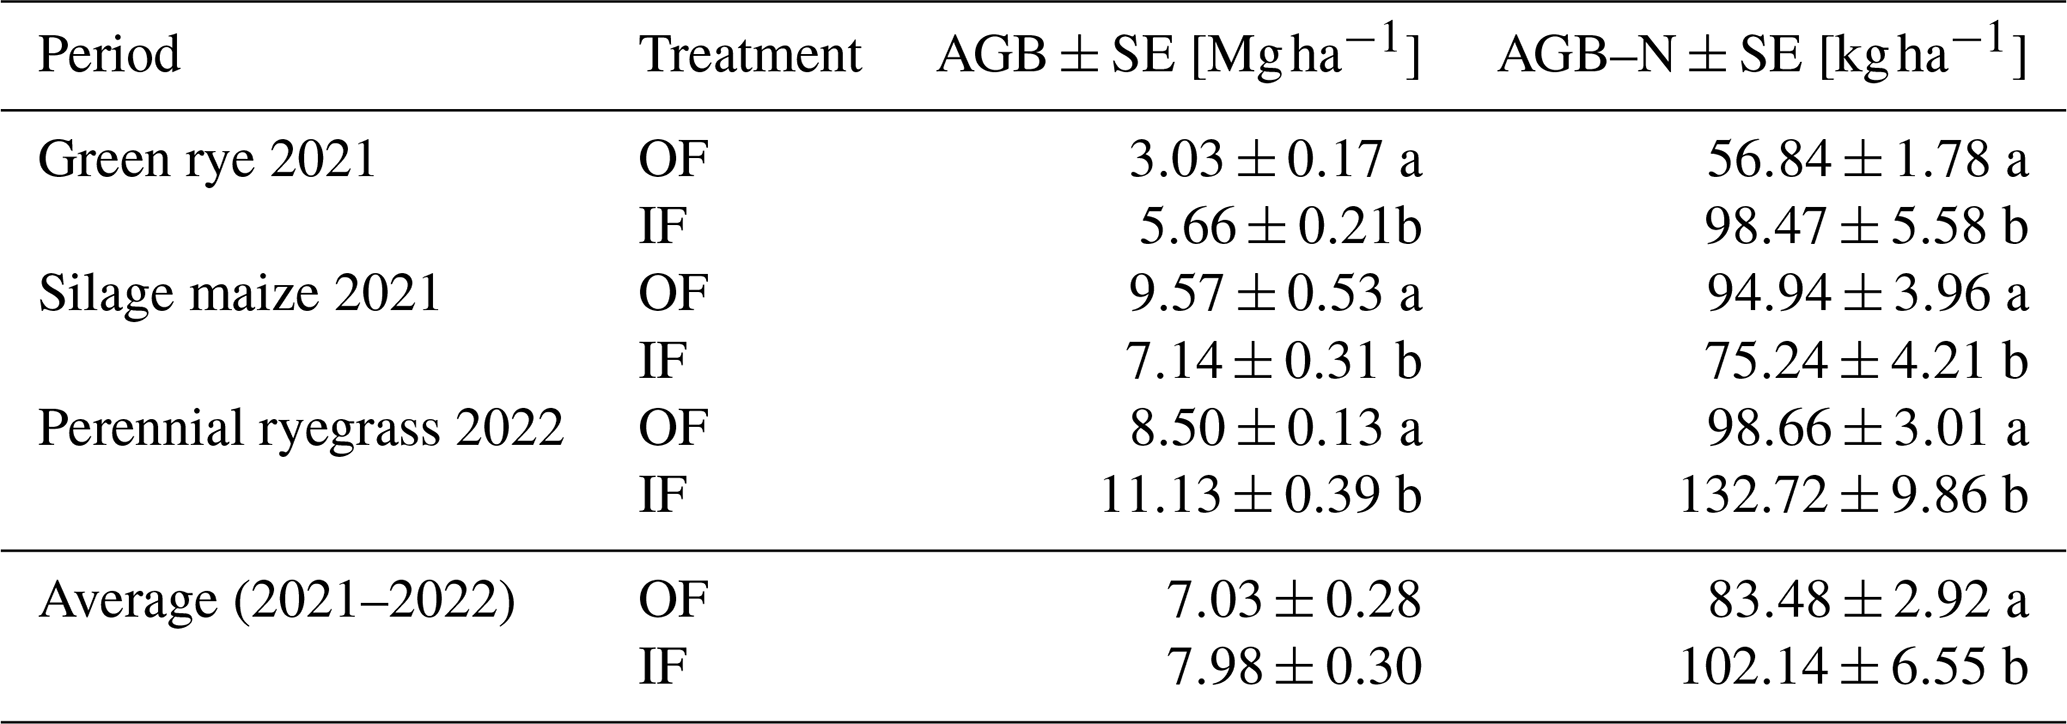
Lower-case letters (a, b) depict statistically significant differences (p<0.05).
3.2 Dinitrogen (N2) and nitrous oxide (N2O) emissions
Following 15N fertilizer applications, increased emissions of total N2 and fertilizer-derived N2 were observed within 2 weeks, with fertilizer-derived emissions accounting for 70 %, 63 %, and 76 % for OF and 80 %, 55 %, and 70 % for IF of the total emissions during the green rye, silage maize, and perennial ryegrass cultivation periods, respectively. There was no clear difference in total N2 flux levels between OF and IF, and flux rates ranged from close to 0 to 1065 (Figs. 2a–q and B1). In contrast, fluxes of total N2O and fertilizer-derived N2O for OF were higher after slurry application in the green rye and perennial ryegrass cultivation periods, compared to silage maize cultivation period. The fertilizer-derived N2O emissions accounted for 33 %, 38 %, and 33 % for OF and 29 %, 37 %, and 38 % for IF in the green rye, silage maize, and perennial ryegrass cultivation periods, respectively. However, no clear pattern of elevated total or fertilizer-derived N2O flux levels was observed for silage maize. Flux rates for total N2O were low with emissions peaks of approximately 40 in the green rye and silage maize periods and 94 after the first slurry application to perennial ryegrass (Fig. 2c–s), respectively.
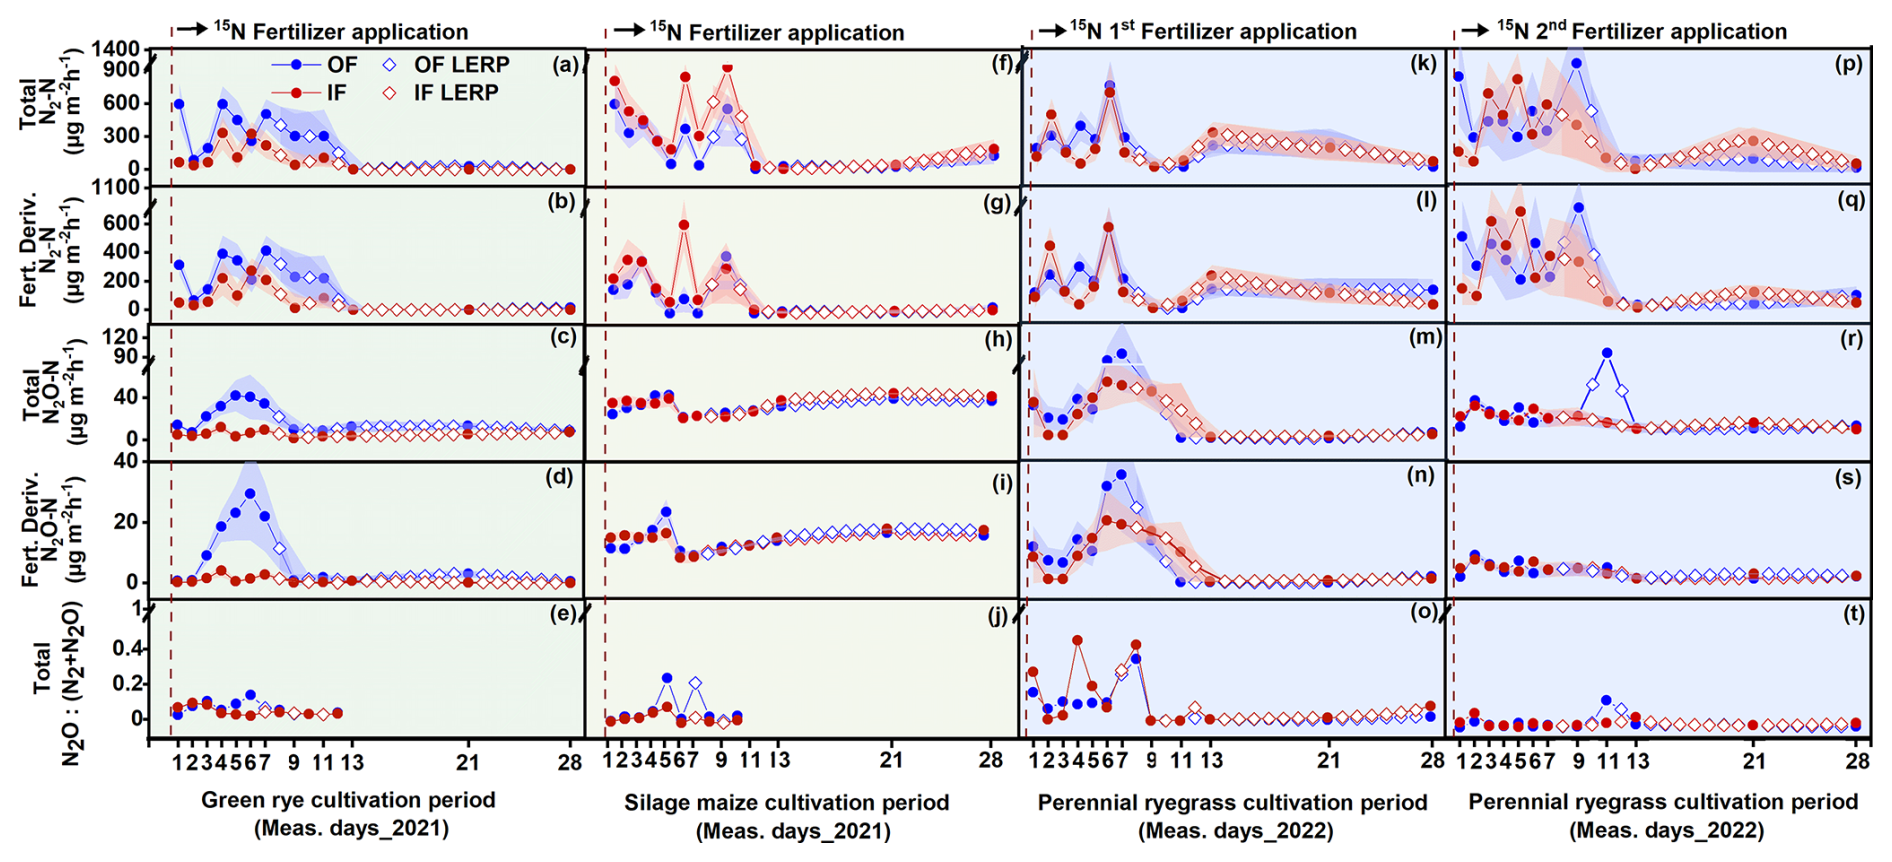
Figure 2Results of the 15N gas flux method using mesocosms. From top to bottom, the panels show total N2 flux, fertilizer-derived (fert. deriv.) N2 flux, total N2O flux, fertilizer-derived (fert. deriv.) N2O flux, and total ratio, following fertilizer application. Measurement periods for fertilization of green rye, silage maize, perennial ryegrass 1, and perennial ryegrass 2 are shown in subplots (a)–(e), (f)–(j), (k)–(o), and (p)–(t), which correspond to green rye, silage maize, the first perennial ryegrass application, and the second perennial ryegrass application, respectively. Filled circles and surrounding bands show mean values and standard errors for OF (blue) and IF (red). Linearly interpolated (LERP) values are marked by white-filled squares.
The ratio of total showed a similar progression over time for both sites, ranging from 0.01 to 0.45. Since the N2O and N2 flux levels were close to the detection limit from day 11 after fertilization, only values before this period were considered in green rye and silage maize cultivation periods (Fig. 2e and k). On average, across crops and sites, the was 0.14, and the median amounted to 0.03.
Cumulative total and fertilizer-derived N2 emissions over the green rye measurement period were significantly higher for OF (1.04 and 0.72 kg N ha−1) compared to IF (0.37 and 0.29 kg N ha−1; Figs. 3a and B1). Similarly, cumulative total and fertilizer-derived N2O emissions were significantly higher for OF (0.10 and 0.04 kg N ha−1) than for IF (0.04 and 0.01 kg N ha−1, Fig. 3a). During the silage maize cultivation period, cumulative total and fertilizer-derived N2 emissions were with 1.60 and 0.88 kg N ha−1 significantly higher for IF than for OF with 0.98 and 0.62 kg N ha−1 (Fig. 3b), respectively. For the same period, total N2O emissions were significantly different between the two sites (OF: 0.26 kg N ha−1, IF: 0.29 kg N ha−1; Fig. 3b). However, fertilizer-derived N2O emissions were not significantly different and amounted to 0.10 kg N ha−1 (Fig. 3b).
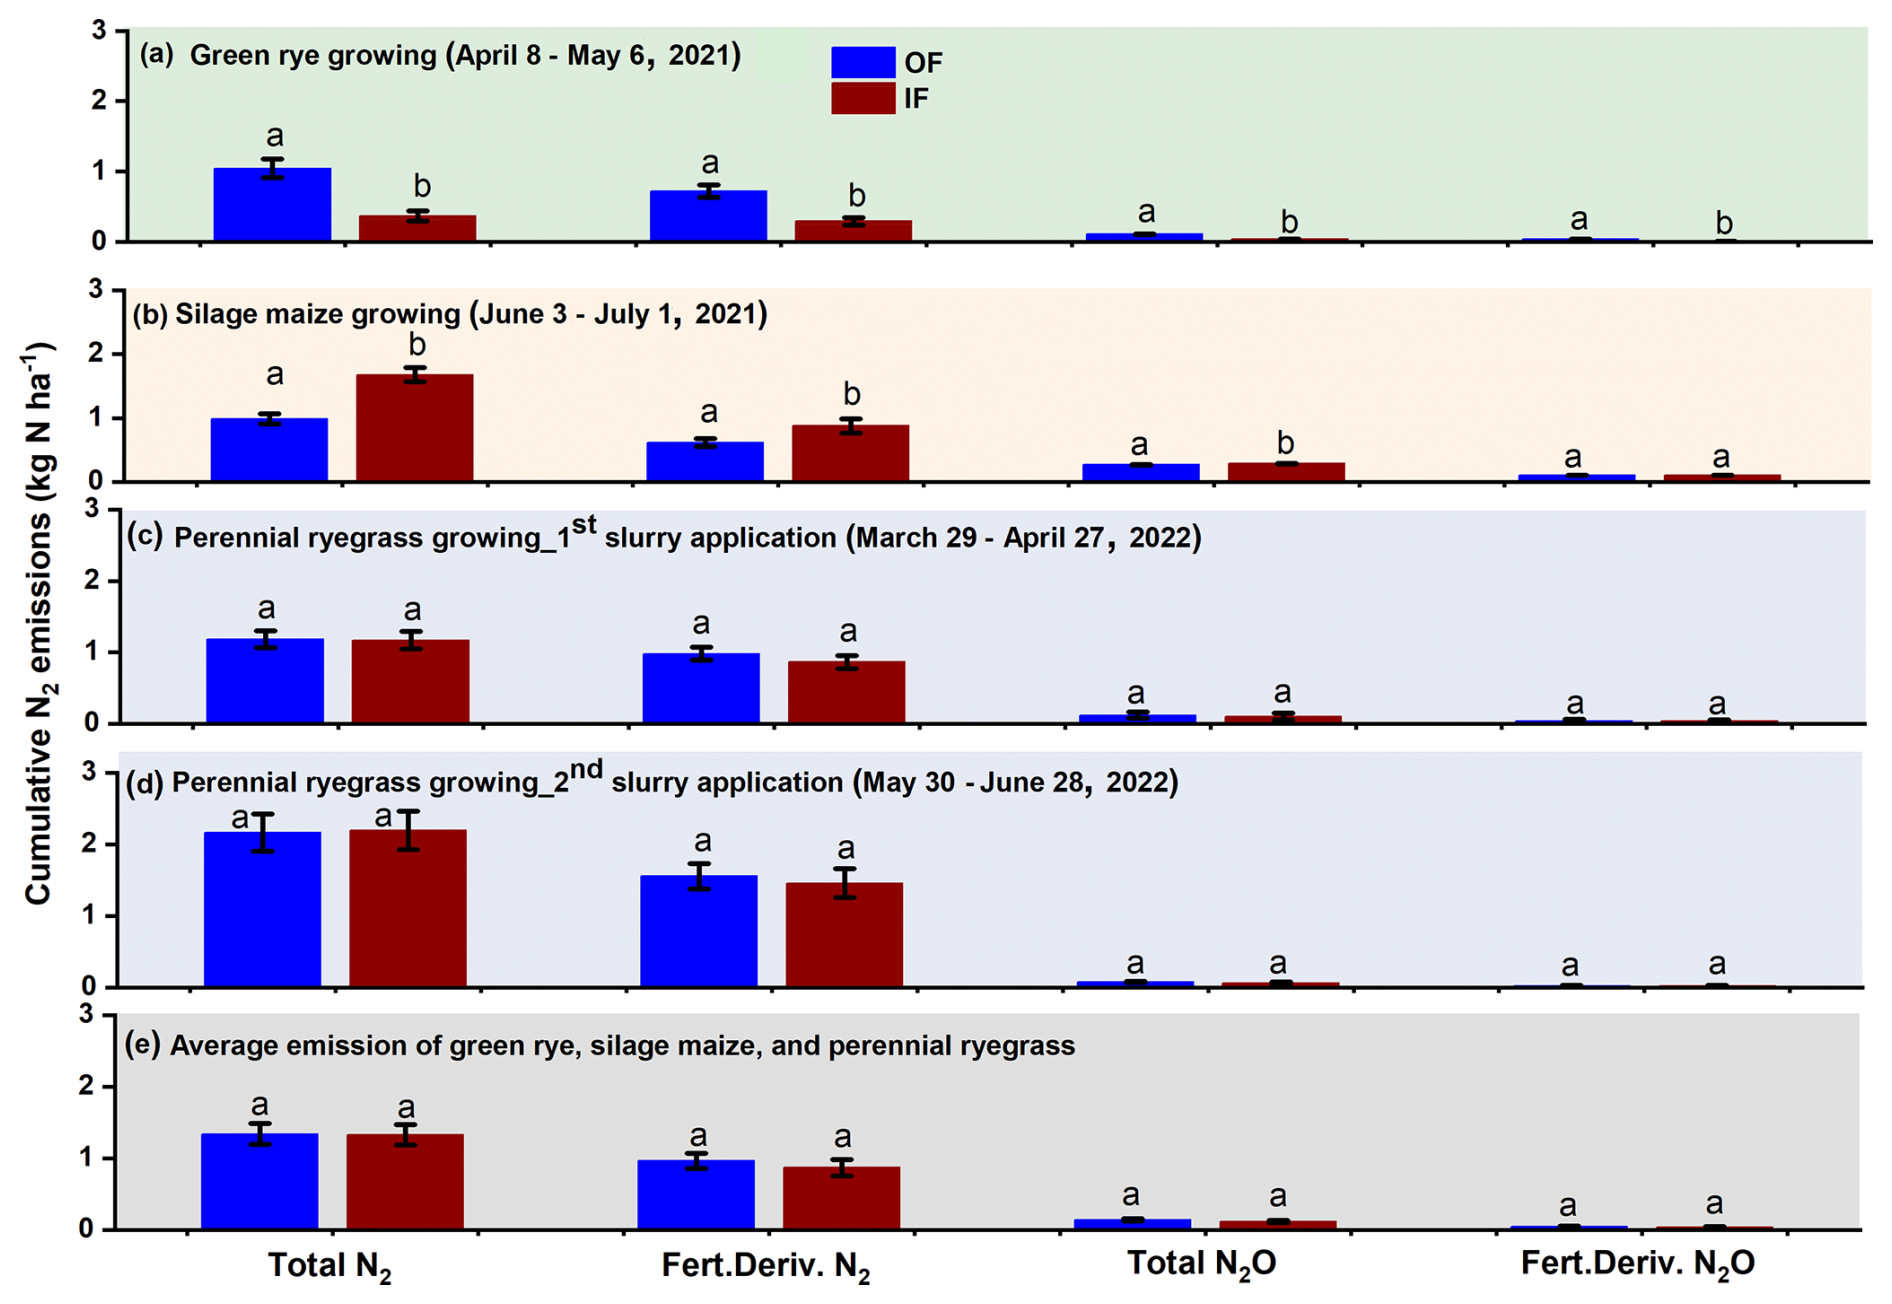
Figure 3Cumulative total and fertilizer-derived N2 and N2O emissions for a measurement period of 1 month during (a) green rye cultivation period, (b) silage maize cultivation period, (c) first perennial ryegrass 15N-labelled cattle slurry application, (d) second perennial ryegrass 15N-labelled cattle slurry application, and (e) average emissions across the crops. Bars with whiskers represent mean values and standard error, respectively.
After the first fertilizer application in the perennial ryegrass period, cumulative total and fertilizer-derived N2 emissions were not significantly different, with emissions values of 1.18 and 0.98 kg N ha−1 as well as 1.17 and 0.87 kg N ha−1 for OF and IF, respectively (Fig. 3c). Similarly, cumulative total (IF and OF: 0.11 kg N ha−1; Fig. 3c) and fertilizer-derived (IF and OF: 0.04 kg N ha−1) N2O were also not significantly different and comparable for both sites. After the second fertilization of perennial ryegrass, cumulative total (OF: 2.16, IF: 2.20 kg N ha−1; Fig. 3d) and fertilizer-derived (OF:1.55, IF: 1.46 kg N ha−1) N2 emissions were not significantly different, and N2O emissions were below 0.05 kg N ha−1 for both sites, with no significant differences observed (Fig. 3d). Average emission of total and fertilizer-derived N2 and N2O for both sites during the green rye, silage maize, and perennial ryegrass were comparable and not significantly different (Fig. 3e).
3.3 15N fertilizer recovery
Across the treatments and cultivation periods, total 15N fertilizer recovery considering plant, soil, and directly measured N loss pathways ranged from 84 % to 100 % (Fig. 4a–c, Table A3). The highest average recovery for all cultivation periods was typically found in soil (OF: 44 %, IF: 46 %; Fig. 4d), followed by slightly lower average recovery in plant above- and belowground biomass (OF: 33 %, IF: 39 %; Fig. 4d). Total N losses were dominated by NH3 (0.2 %–8 %), followed by nitrate leaching (0 %–5 %) and denitrification losses (0.3 %–4 %). Average 15N allocation in the microplots and to N loss pathways mostly did not greatly differ between IF and OF.
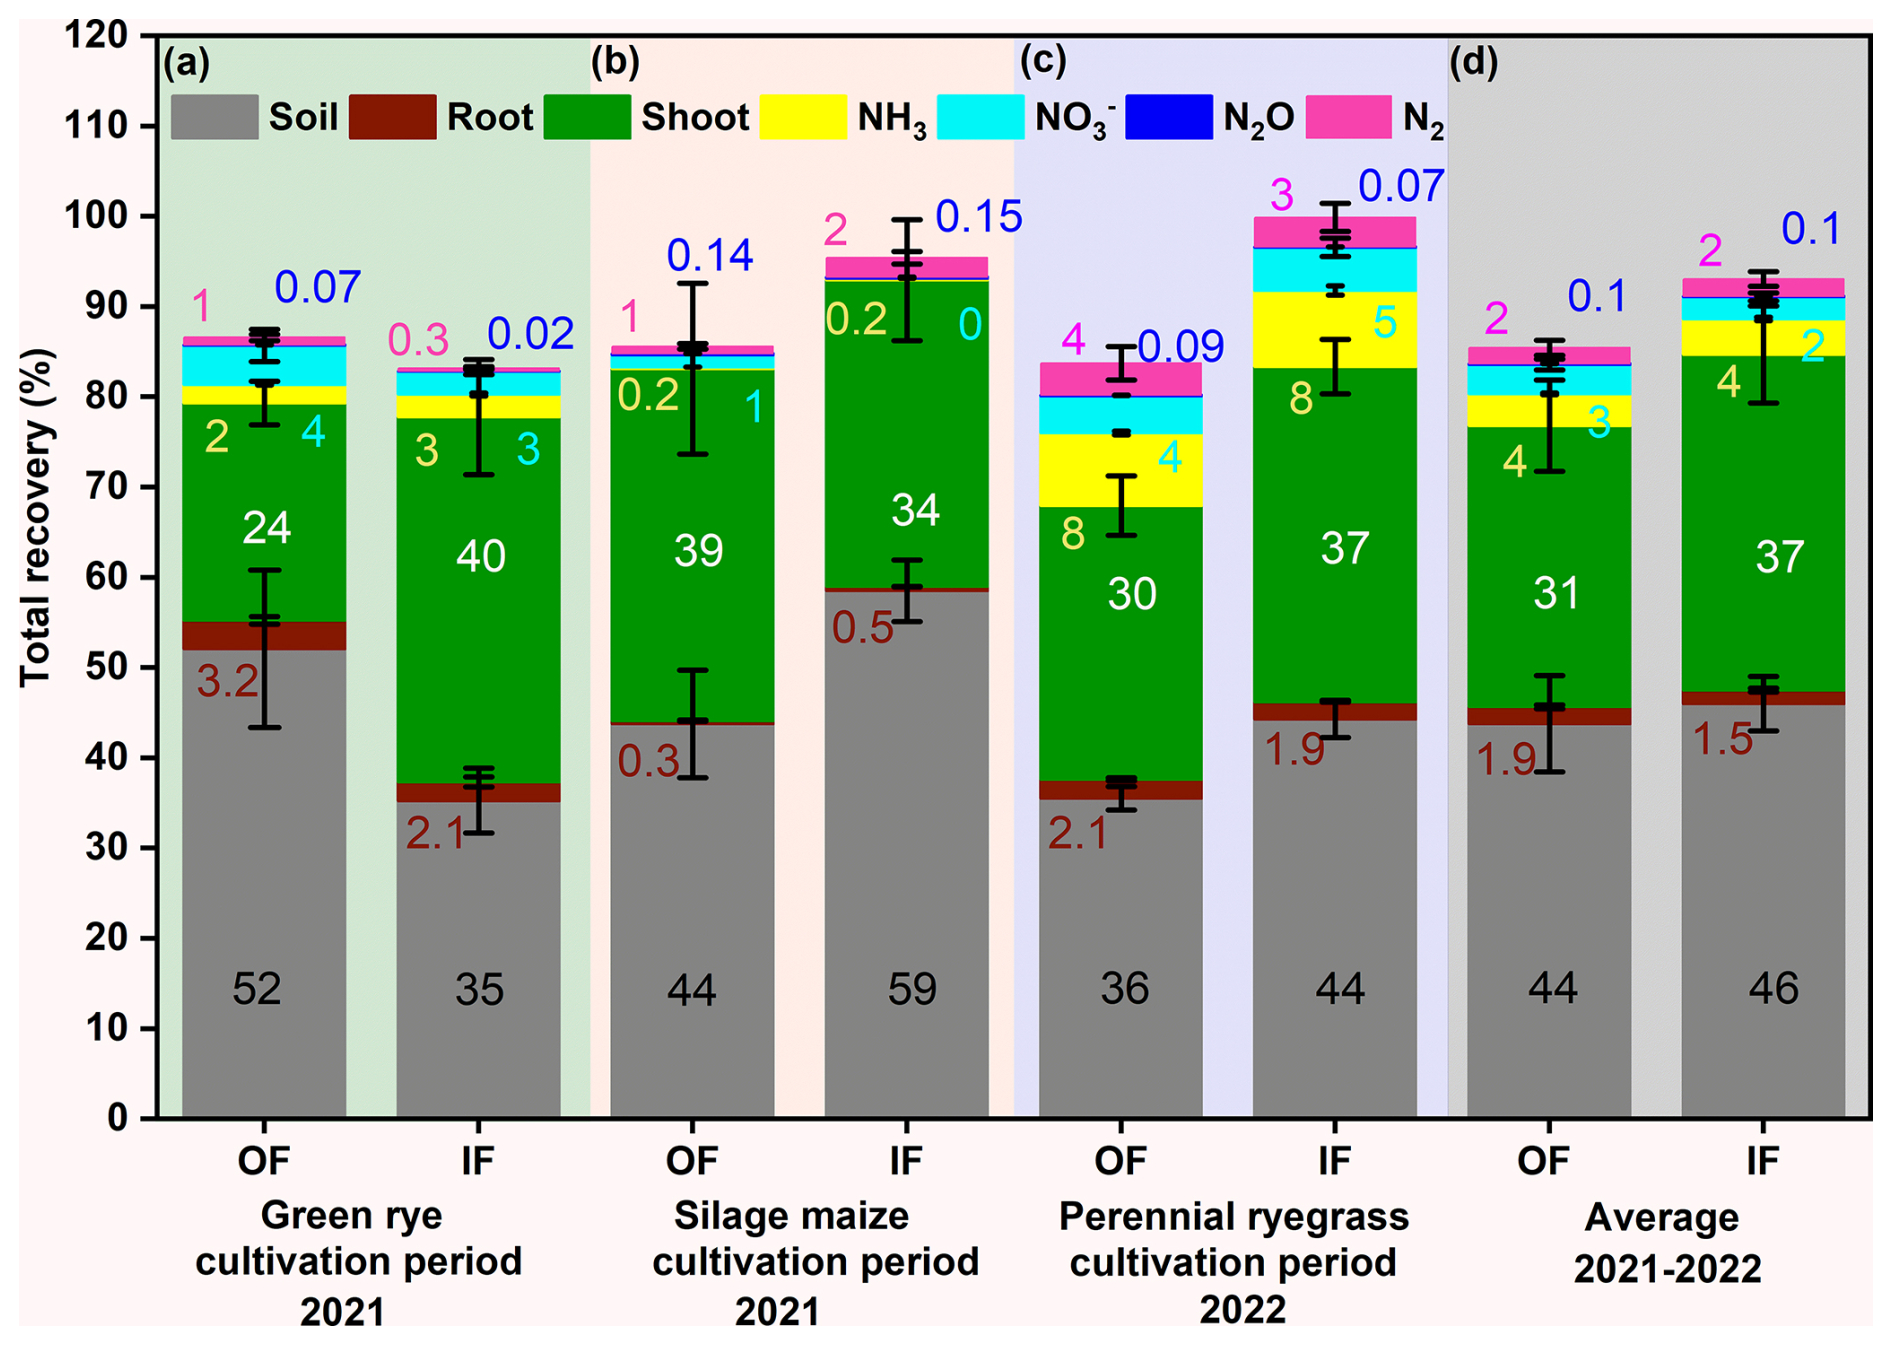
Figure 4Recovery of fertilizer 15N in soil (0–90 cm depth; grey), aboveground biomass (green), root (vine), ammonia (NH3, yellow), nitrous oxide (N2O, blue), dinitrogen (N2, magenta), and nitrate leaching (, cyan) for (a) green rye, (b) silage maize, (c) perennial ryegrass cultivation periods, and (d) average of all cultivation periods in the organic (OF) and integrated (IF) farming sites. Vertical bars represent mean values, and whiskers represent the standard error (SE) in percentages. All values are presented in rounded decimals to the nearest whole number.
During green rye cultivation, the 15N recovery in the soil was 52 % for OF and 35 % for IF, while during silage maize, it was 59 % for IF and 44 % for OF (Fig. 4a and b). For perennial ryegrass cultivation the soil 15N recovery was slightly higher for IF (44 %) than for OF (36 % Fig. 4c).
Recovery in the plant followed an opposite trend to soil recovery for green rye and maize; i.e. higher plant recovery was associated with lower soil recovery, except for perennial ryegrass, where both soil and plant recovery were higher for IF (Fig. 4a–c). Recovery from roots was nearly identical for both sites (OF, IF; Fig. 4a–d) across all cultivation periods and contributed only marginally to total plant recovery.
Ammonia emission accounted for 3 % and 2 % of total fertilizer application on IF and OF, respectively during the green rye cultivation period, was less than 1 % for silage maize cultivation, and amounted to 8 % for IF and OF during perennial ryegrass cultivation, with the no significant differences between both sites (Fig. 4a–c). Similarly, recovery in N2O was below 0.1 % for both OF and IF across all cultivation periods (Fig. 4a–d). Nitrate leaching was in the range of 0 % to 5 % for the different cultivation periods, but differences between sites were not significant (Fig. 4a–d).
The total 15N recovery considering soil, plant, and measured N loss components was comparable in the green rye (OF: 87 %, IF: 84 %; Fig. 4a), silage maize (OF: 86 %, IF: 95 %; Fig. 4b), and perennial ryegrass (OF: 84 % and IF: 100 %; Fig. 4c) cultivation periods. On average 15N recovery for all cultivation periods was 85 % for OF and 93 % for IF (Fig. 4d). The unrecovered portion of 15N was 13 % and 16 % in green rye, 14 % and 4 % in silage maize, and 17 % and 0.1 % in perennial ryegrass for OF and IF, respectively, with no significant differences (Table A3). The average unrecovered part of 15N for all cultivation periods was 15 % for OF and 7 % for IF (Table A3), both within the standard error range of 7 %–16 % and 8 %–11 %, respectively, and, thus, within the uncertainty of measurements.
3.4 Nitrogen balance
In green rye, silage maize, and perennial ryegrass cultivation, 88, 74.8, and 151 kg N ha−1 cattle slurry were applied. For green rye and perennial ryegrass, cattle slurry was applied as a top dressing in OF and IF (Fig. 5), while for silage maize the slurry was incorporated. Nitrogen deposition was 1.60 kg N ha−1 for green rye, 2.93 kg N ha−1 for silage maize, and 5.01 kg N ha−1 for perennial ryegrass (Fig. 5a–c), calculated based on data from the German Environmental Protection Agency. In accordance with the 15N recovery (Sect. 3.3), IF exhibited significantly higher plant N uptake (98 vs. 57 kg N ha−1 in OF; Fig. 5a) for green rye cultivation, while OF showed slightly higher N losses (7 vs. 5 kg N ha−1 in IF) combining NH3, N2O, N2, and leaching. Consequently, the N balance was positive for OF (26 ± 4 kg N ha−1; Fig. 5a), while IF had a small negative N balance (−14 ± 6 kg N ha−1) with the difference being significant.
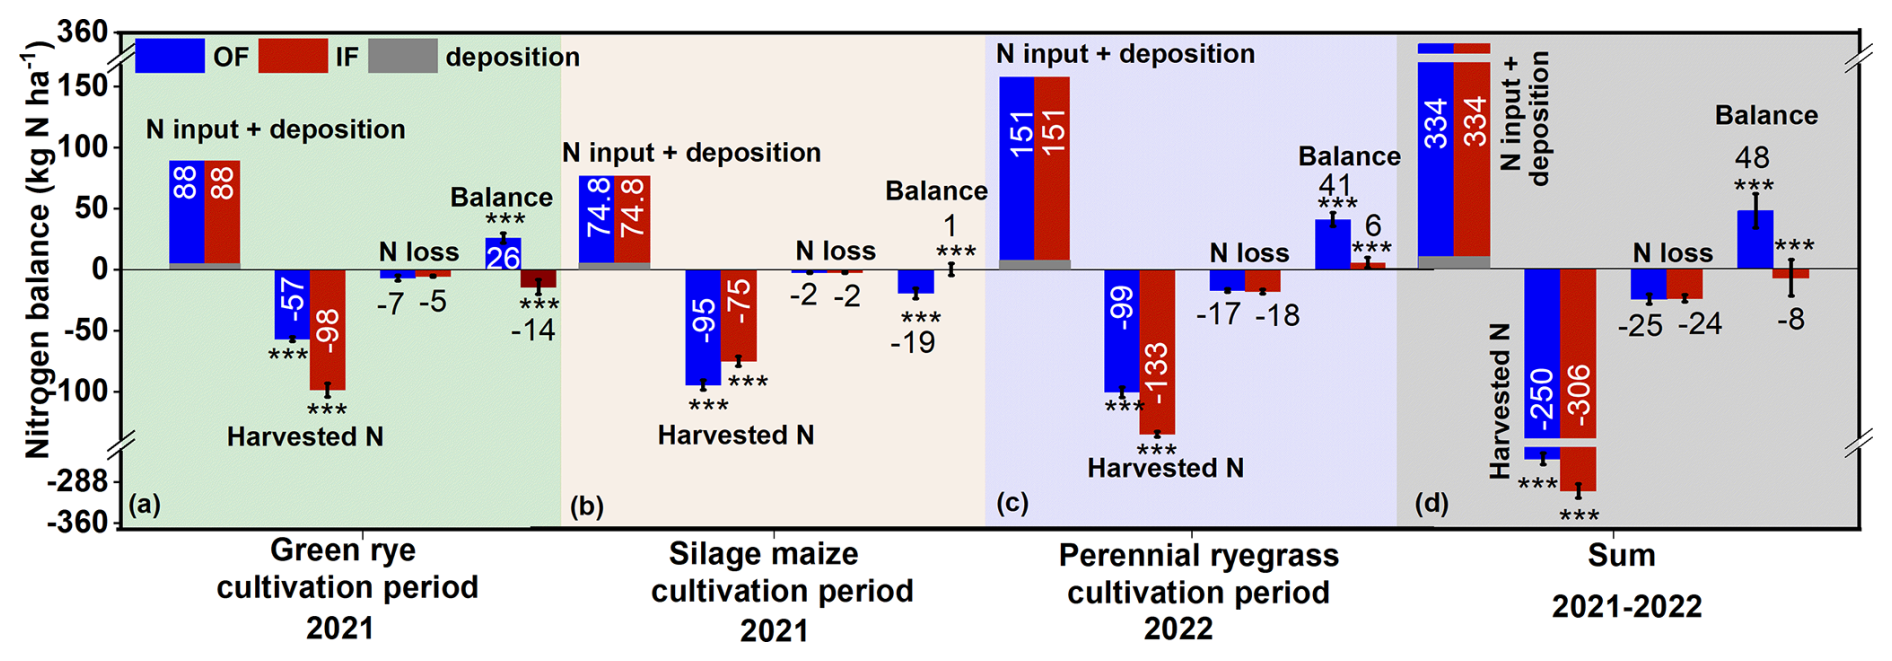
Figure 5Cultivation period N balance for (a) green rye, (b) silage maize, (c) perennial ryegrass, and (d) cumulative N balance for the years 2021 and 2022. N loss combines NH3, N2, N2O, and leaching. The bars with whiskers represent the mean ± standard error values. Organic farming (OF), integrated farming (IF), and soil N deposition are shown in dark blue, red, and grey colour bars, respectively.
In the silage maize cultivation period, OF showed with 95 kg N ha−1 significantly higher N in harvest than the 75 kg N ha−1 of IF (Fig. 5b). Since total N losses were minor compared to yield for both sites (2 kg N ha−1; Fig. 5b), this resulted in a small negative and positive N balance for OF and IF, respectively (−19 ± 4 and 1 ± 5 kg N ha−1), with the difference being significant. Harvest N export during the cultivation of perennial ryegrass was significantly higher for IF than for OF (133 ± 3 and 99 ± 4 kg N ha−1; Fig. 5c), with a comparable N loss for both sites. The N balance was significantly different for both sites, amounting to a surplus of 41 ± 6 for OF and 6 ± 4 kg N ha−1 for IF (Fig. 5c).
The cumulative harvested N across all cultivation periods of 2021–2022 showed that a significantly higher amount of N was exported from IF (306 ± 12 kg N ha−1; Fig. 5d) compared to OF (250 ± 10 kg N ha−1). In contrast, the cumulative N losses were almost similar and not significantly different (OF: 25, IF: 24 kg N ha−1). Consequently, the N surplus was significantly higher on OF (48 kg N ha−1; Fig. 5d), compared to IF, which had a small negative value (−8 kg N ha−1; Fig. 5d).
4.1 Gaseous N loss (ammonia, nitrous oxide, dinitrogen)
A recent summary of experiments on ammonia emissions after slurry application showed that NH3 loss amounted to 10 % to 47 % of ammoniacal N applied (Häni et al., 2018). The NH3 losses in our study were at the lower end of the observed range, with 2.4 % and 3.2 %, 0.2 % and 0.2 %, and 8.0 % and 8.4 % (Fig. 4, Table A3) for OF and IF, respectively, during green rye, silage maize, and perennial ryegrass cultivation periods. While the above range includes all spreading techniques, in this study manure was applied on every occasion using a technique known to significantly reduce NH3 emissions. The complete suppression of NH3 emission observed in the silage maize cultivation period was achieved through the immediate incorporation of the slurry. This agrees with studies observing reduction of NH3 emission after incorporation and confirms that slurry incorporation is among the most efficient NH3 mitigation methods if incorporation takes place promptly (Sommer and Hutchings, 2001; Dell et al., 2011; Sherman et al., 2022). Though manure was applied using the same drag hose applicator during green rye and perennial ryegrass cultivation, NH3 emissions were variable. Thus, other factors were responsible for the variability of emissions during green rye and perennial ryegrass cultivation periods. Ammonia emission depends among other factors on ammonium concentration at the manure surface, wind speed, precipitation, solar radiation, and temperature (Sommer and Hutchings, 2001). Consequently, the low temperature and light precipitation on the date of manure application to green rye reduced NH3 emissions compared to the perennial ryegrass cultivation period. This agrees with Ni et al. (2015), who reported reduced NH3 emissions following rainfall after fertilization, and the observation of higher NH3 emissions under warmer and more windy conditions (Sommer et al., 1993; Häni et al., 2018; Nyameasem et al., 2022; Bleizgys and Naujokienė, 2023). Ammonia emissions of the drag hose applications (green rye and perennial ryegrass) were much lower than in previous studies using similar trailing hose application methods, which reported emission rates of 16 %–45 % (Herr et al., 2019; Buchen-Tschiskale et al., 2023). Consequently, the low levels of NH3 emission in our study were due to efficient NH3 mitigation measures and the environmental conditions, while the different management histories did not have an effect on the emissions.
In contrast, cumulative N2 emissions were significantly different between OF and IF for the green rye and silage maize cultivation periods, with higher emissions under OF for green rye and under IF for silage maize. It is well established that pH has a distinct effect on N2O and N2 emissions since, at low pH, the synthesis of N2O reductase, the enzyme catalysing the reduction of N2O to N2, is inhibited (Russenes et al., 2016; Zhang et al., 2021). From this perspective, lower N2 emissions would be expected for OF, where the pH was significantly lower than that of IF (Table 1). However, this was only the case for silage maize cultivation, suggesting that other factors have contributed to the differences in cumulative N2 emission. One such factor could be the time elapsed since management homogenization. The same crop and fertilizer management were applied to both sites starting in October 2020, but legacy effects from the prior organic or integrated farming histories may still have influenced emissions, especially during the early cropping periods like green rye and silage maize. Over time, these legacy effects may have diminished, which could explain the lack of significant differences in N2 emissions observed during the later crop (perennial ryegrass). Similarly, crop-specific factors may have interacted with site history. Alternatively, lower plant N uptake on OF compared to IF in the green rye cultivation period may have led to a higher mineral N availability for microbial processes in the soil. Higher nitrate availability combined with the carbon sources of the organic fertilizer may have stimulated denitrification, particularly N2 production (Senbayram et al., 2012; Samad et al., 2016). In contrast, by the time of the perennial ryegrass phase, soil microbial communities and N cycling dynamics may have adjusted to the unified management, leading to more comparable emissions. Additionally, the relatively high N input applied during the experimental period compared to the historically low N input particularly under OF may have intensified the denitrification response, particularly in the early cropping periods. Thus, the complex interplay of historical management, time since management harmonization, crop type, and soil N cycle processes like plant N demand, the mineralization–immobilization cycle controlling N availability, and the effect of environmental conditions on the denitrification process (Butterbach-Bahl et al., 2002; Chen et al., 2019) led to variable N2 emissions from both sites.
As mentioned above, N2O and N2 fluxes are closely linked as both are produced and consumed in the process of denitrification, converting nitrate to nitrite, nitric oxide, nitrous oxide, and finally to N2 (Butterbach-Bahl and Dannenmann, 2011). For this reason, we expected to observe an increase in both N2O and N2 emission after fertilizer application as was reported by Häfner et al. (2021), Herr et al. (2019), and Bizimana et al. (2022). In this study, we observed a distinct N2 emission following every manure application event, but the N2O emission hardly increased for IF during green rye cultivation and for OF and IF during silage maize cultivation (Fig. 3, Table A3). The other N2O emission pulses were moderate with emission rates below 140 (Fig. 2). The lack of N2O peaks after fertilizer application was also observed by Buchen-Tschiskale et al. (2023) and Dannenmann et al. (2024) and can be explained by conditions conducive to full denitrification, i.e. low oxygen levels, high soil moisture, good availability of labile carbon sources, and high levels of mineral N (Smith and Arah, 1990; Morley et al., 2014; Rohe et al., 2021; Wang et al., 2021). Such conditions can result from the application of manure, which is a mixture of water, organic substances, and ammonium.
With regard to the magnitude of N2 emissions, few field studies have measured N2 emissions from cattle slurry application. The level of cumulative N2 emission in this study was between 0.36 and 2.19 kg N ha−1 (Fig. 3) for both sites, which is in the same range as the 1.3 to 2.20 kg N ha−1 reported by Buchen-Tschiskale et al. (2023) for an agricultural site receiving 71 kg N ha−1 of cattle slurry and the 0.52 to 0.78 kg N ha−1 for a grassland receiving 120 kg N ha−1 in the form of cattle slurry (Stevens and Laughlin, 2001b). Despite the amount of N2 loss quantified in this study agreeing with the past studies, the direct field measurement of N2 fluxes in addition to all other relevant loss pathways did not result in a closed 15N balance, with the average imbalance being 15 and 7 kg N ha−1 for OF and IF, respectively. While some part of the unrecovered 15N may be due to an underestimation of NH3 loss, N2 emissions may be underestimated as well (Yankelzon et al., 2024a). Heterogeneous 15N distribution in the microplot soil resulting from surface or slit application of the slurry and 15N2 diffusion and storage in subsoil layers contributes to the underestimation of N2 flux rates. These complications associated with 15N labelling were discussed in previous studies which indicate that fluxes may be underestimated by up to 30 %–50 % (Vanden Heuvel et al., 1988; Arah, 1997; Well et al., 2019a, b; Friedl et al., 2020; Micucci et al., 2023; Dannenmann et al., 2024). Even assuming a 50 % underestimation, N2 emissions after fertilization are in the range of 2 kg N ha−1, indicating that the method-inherent potential underestimation alone cannot close the N balance. However, the short coverage of the direct N2 measurements, which is due to the short period of time during which the isotopic enrichment of the N pool subject to denitrification is sufficiently high so that the N2 flux can be detected, may be an additional source for underestimation. Consequently, we cannot exclude that additional 15N in N2 is emitted in the months following fertilizer application, particularly during rewetting events or towards the end of the growing season when plants decrease their water uptake and water content increases, as observed by Almaraz et al. (2024).
At the same time, however, it must be recognized that the spatial variability of soil properties, environmental conditions, microbial activity, and plant growth leads to a large uncertainty in the determination of the 15N balance; therefore, the residual element of the balance may be at least partly due to this uncertainty. Thus, the apparent mismatch in the N budget may also be due to measurement uncertainties rather than actual N losses.
The ratio in this study ranged from 0.01 to 0.45 across both sites using different slurry application techniques. This aligns with the findings of Fangueiro et al. (2008), who incorporated cattle slurry fractions (solid and liquid) into the soil, observing that the ratio varied between 0.32 and 0.73. Similarly, Dannenmann et al. (2024) observed very low N2O emissions (0.1 kg N2O-N ha−1) from a drag hose cattle slurry application (97 kg N ha−1) under conditions favouring full denitrification, yielding a low ratio of 0.03.
4.2 Nitrate leaching
Nitrate leaching is influenced by several factors, such as nitrate concentration, soil texture, timing of manure application, meteorological conditions, and cropping system (Van Es et al., 2006; Maguire et al., 2011; Wangari et al., 2024). In this study, nitrate leaching rates ranged from 0 to 4 kg N ha−1, corresponding to 4 % and 3 %, 1 % and 0 %, and 4 % and 5 % of the applied –N (Fig. 4, Table A3) for OF and IF, respectively, during the green rye, silage maize, and perennial ryegrass cultivation periods. There was no significant difference between OF and IF, which indicates that management history had no impact on the leaching. The observed values are at the lower end of the range of 4–107 kg N ha−1 reported for arable cropping systems in a review article (Di and Cameron, 2002) and the IPCC-based model estimates reported by Eysholdt et al. (2022), averaging 23.1 kg N ha−1 for Germany during the reference period of 2014–2016. Similarly, comparable leaching values on medium-texture soil were reported by Buchen-Tschiskale et al. (2023), who observed average nitrate leaching of 4 % for trailing hose application or slurry injection of cattle slurry at an application rate of 71 kg N ha−1 for arable cropping systems. Thus, the medium soil texture of the sites in this study (Table 1) may have contributed to the observed low leaching rates.
Among the different crops, nitrate leaching was lowest for the silage maize cultivation period when manure was incorporated. While preceding studies indicated that incorporation or injection of slurry increases nitrate concentrations in the soil and increases the risk of N leaching, differences between application methods vanished at lower slurry manure application rates or if the application rate was close to N demand (Kramer et al., 2006; Maguire et al., 2011; Dannenmann et al., 2024). The latter was the case in this study since cumulative aboveground N uptake was close to the N application rate (75 % to 92 %; Fig. 5), which may have also caused the low N leaching rates of between 0–1 kg N ha−1. Low-nitrate leaching associated with cattle slurry application was also observed in a 4-year study on grassland with a trailing hose or cattle slurry injection of 80 kg N ha−1 (Kayser et al., 2015) and by Dannenmann et al. (2024), who reported negligible nitrate leaching (0.2 kg N ha−1) from the cattle slurry application of 97 kg N ha−1 to carbon-rich pre-alpine grassland soils where aboveground N uptake exceeded fertilization rate.
Overall, it must be noted that the exact travel time of at the site is unknown and could exceed the duration of a cultivation period. In addition, total nitrate instead of 15N- was determined in this study. Consequently, the observed nitrate leaching for the respective cultivation periods may include some contributions from preceding fertilizer applications, may not fully represent the leaching rate due to the most recent fertilizer application, and may overestimate the contribution of leaching to the 15N balance.
4.3 Recovery of 15N from soil and plants
In a single cultivation period, the recovery of 15N in plant biomass ranged from 24 %–39 % for OF and 34 %–40 % for IF, with averages of 31 % for OF and 37 % for IF (Fig. 4a–d). Soil 15N recovery over a single cultivation period showed a range of 36 %–52 % for OF and 35 %–59 % for IF, averaging 44 % for OF and 46 % for IF across all cultivation periods (Fig. 4a–d). To our knowledge, there are only a few studies that used 15N-labelled cattle slurry in field experiments on arable land, such as Jensen et al. (2000), who recovered 32 % of 15N in the aboveground biomass and 45 % in the soil for winter wheat. Similarly, Paul and Beauchamp (1995) reported an average recovery of 43 % of applied 15N-labelled cattle slurry in above- and belowground biomass of corn. In recent work, Frick et al. (2023) applied 15N-labelled cattle slurry (produced by feeding a heifer 15N-enriched ryegrass hay) to a grass–clover system and observed annual recovery rates of 17 %–22 % in plant biomass and 32 %–52 % in soil. Buchen-Tschiskale et al. (2023) recovered 32 %–47 % in soil, while plant recovery was between 25 %–33 % using different application techniques (drag hose and slit injection) for 15N-labelled cattle slurry to winter wheat, indicating that the recoveries of our study align well with published data.
Total soil and plant recoveries were highest during the silage maize cultivation period, where manure was incorporated into the soil. In contrast, recoveries of soil and plant were lower during the cultivation periods of green rye and perennial ryegrass, where manure application was performed using a drag hose system. Manure incorporation distributes N in the soil column, reduces surface N concentration and thus reduces NH3 volatilization, and facilitates microbial immobilization (Sørensen and Thomsen, 2005; Lyu et al., 2024), resulting in overall recoveries close to 100 %. While this trend was not significant in this study, Buchen-Tschiskale et al. (2023) observed significantly lower NH3 emissions and a significantly higher soil plus plant recovery (79 %) and overall recovery of 99 % for slit injection compared to trailing hose application (57 % and 78 %). Simultaneously, significantly lower NH3 emissions for the slit injection treatment in Buchen-Tschiskale et al. (2023) and the incorporation in this study must have resulted in higher availability of mineral N for soil microorganisms, which could lead to increased emission of N2O or N2. However, in both studies, N2O and N2 emissions were not significantly higher, demonstrating that reducing NH3 emissions does not necessarily result in pollution swapping from NH3 to N2O or N2 when microbes efficiently immobilize N and prevent direct stimulation of nitrification and denitrification, which produce N2O and N2. In general, there was a trend towards lower recoveries in soil and plant biomass for manure application using a drag hose, which means that other 15N loss pathways were more important. It is well established that the measurement of NH3 emission in the field has remained a challenge and is associated with large uncertainties (Loubet et al., 2018), suggesting that underestimation of NH3 emissions could explain this trend. However, since an overall recovery of close to 100 % was observed for treatments with NH3 emissions of 8 %, i.e. the perennial ryegrass cultivation period of this study and the slit injection treatment of Buchen-Tschiskale et al. (2023), a significant underestimation of NH3 emission seems unlikely since the underestimated NH3 emission would imply a recovery greater than 100 %. For the same reason, i.e. observation of approximately 100 % recovery for certain treatments, a systematic underestimation of leaching losses is also unlikely. The only measurements that do not cover the whole cultivation period are those of N2O and N2, suggesting that underestimation of these N losses due to coverage of measurements of only a fraction of the whole cultivation period could explain the unrecovered N losses. Since N2O emissions are approximately a factor of 10 lower than N2 emissions (Scheer et al., 2020), N2 emissions may have contributed the main part to the unrecovered losses. Assuming a background N2 emission rate of 87 , which is equivalent to an emission if measured isotope ratios are increased by 1 standard deviation compared to the background, 0.7, 2.5, and 3.7 kg N2-N ha−1 are released during green rye, maize, and ryegrass cultivation, respectively. Such a background emission together with slightly underestimated NH3 emissions could explain the unrecovered N2 losses for IF. Overall recovery for OF was close to or lower than that of IF, suggesting that for the OF, additional N2 was emitted during the cultivation period, which could be due to more frequent denitrification events caused by higher soil bulk density (Table 1; Luo et al., 2000; Hamonts et al., 2013). Furthermore, large error margins in soil and plant recovery rates, flux measurements, and spatial variation introduce uncertainty, indicating that some of the apparent losses may also be due to measurement limitations rather than actual N loss.
However, differences in recovery between OF and IF were not significant for single cultivation periods and the full study period. The different fertilizer application techniques, as well as the different crop types, affect the interannual variability of recovery rates, which complicates the detection of significant differences on the interannual scale. In contrast, this suggests for the different cultivation periods that the management history either did not affect the allocation of 15N to the different components of the 15N balance or that the differences are too subtle to be determined compared to the spatial variability of soil properties on this specific site and measurement uncertainty. The highest absolute uncertainties, which eventually also control the overall uncertainty of the recovery, were observed for 15N recovery in soil and plants. Though in this study, the area of the microplots was 0.225 m2, corresponding to approximately 30 kg of soil for the 0–10 cm layer, only few milligrams of finely ground soil are eventually used to determine the 15N enrichment. Consequently, the excavated soil and plants were carefully crushed and homogenized in mixing vessels, but the ball mills usually used to prepare the finely ground material are limited to 15 to 20 g of homogenized material. Since soil aggregates are not entirely destroyed during homogenization, samples transferred to the ball mill may still show distinct variability which conceals significant differences between sites. Obviously, increase of replicate amount or analysis of several subsamples (e.g. of soil of a given layer) could reduce the uncertainty but only by increasing the already high workload and costs by several factors. For this reason, our study shows that research into protocols aiming at reducing the uncertainty arising from incomplete sample homogenization to the measurement instrument uncertainty by including for instance mills with much larger sample capacities is required, especially since – to our knowledge – there is no publication on different homogenization and mixing protocols for 15N balances. Following the same line of argumentation, reduction in the uncertainty of the direct measurement of N balance components, i.e. losses through leaching, NH3, N2, and N2O emissions, could help resolve the difference more accurately. While recent advancements such as the improved 15N gas flux method (15NGF+) demonstrate potential for enhanced sensitivity in quantifying N2 emissions under field conditions (Eckei et al., 2025), such approaches are expensive and technically challenging, which will delay their use in studies targeting complete N balances. Since the same applies to significant reduction of uncertainty in determining leaching losses, NH3 volatilization, and N2O emissions, it appears like these loss pathways were not markedly influenced by management history given the current measurement frameworks.
4.4 Nitrogen balance and management history
Previous studies showed that intensive agricultural systems often experience substantial N losses through gaseous emissions and leaching, which can match or exceed crop N uptake (Ju et al., 2009; Zhou et al., 2016). In this study, cumulative N losses were not significantly different between OF and IF and can be classified as low since they amounted to approximately 8 % to 10 % of plant N uptake. This was due to a combination of the medium-textured soil attenuating leaching and the low NH3 loss resulting from efficient NH3 mitigation measures (see Sect. 4.1). In contrast, cumulative green rye and perennial ryegrass N uptake were significantly higher on IF than on OF. Thus, IF was more productive, particularly given that the lower yield during silage maize cultivation was likely due to delayed herbicide application in response to weather conditions.
Since crop rotation, fertilizer type, and fertilizer amount were the same during the 2-year experiment of this study, and climatic conditions were the same for the two adjacent sites during the historical management from 2012–2020, differences in soil properties due to management must have affected productivity. The comparison of initial sampling showed that OF soil was significantly more acidic (Table 1), likely due to repeated legumes cultivation in the crop rotation as legumes take up more cations than anions (Msimbira and Smith, 2020; Chaoui et al., 2023). Additionally, our results show that preceding management resulted in significantly higher average C and N content down to 30 cm for IF than for OF. On the one hand, the increased N application on IF during the preceding management of 2012 to 2020 (Table A1) likely boosted above- and belowground biomass production compared to OF, which resulted in higher C input through above- and belowground plant residues as well as root exudates on IF, which eventually increased SOC levels, in agreement with other long-term studies (Gai et al., 2018; Böhm et al., 2020). On the other hand, the significantly higher input of a combination of synthetic and organic fertilizers and returned crop residues on IF (Table A1) has contributed to SOC build-up and increased mineralization and microbial biomass (Ramirez et al., 2012; Dai et al., 2017; Tang et al., 2018; Marliah et al., 2020; Li et al., 2021; Peng et al., 2023; Khan et al., 2024). Consequently, the significantly higher yield can be related to improved supply of nutrients to the crops between fertilization events through higher mineralization of organic matter and probably improved water-holding capacity (Dai et al., 2017; Manns and Martin 2018; Khan et al., 2024). In conjunction with the N input through deposition and fertilizer, which was close to the N application rates for IF from 2012–2020 (average of 184 kg N ha−1; Table A1) and in accordance with the national fertilizer legislation for use of manure (170 ), the cumulative and single cultivation period N balances were neutral within the limits of the measurement uncertainty for IF (−8 ± 15; Fig. 5d). This indicates effective N management for IF, as a balanced plant N demand with N supply will prevent the mining of soil N and maintain soil N and C levels through the coupling of the N and C cycles (Zistl-Schlingmann et al., 2020). However, the N balances across single cultivation periods for OF ranged from −19 to 41 kg N ha−1, and the cumulative N balance for all cultivation periods was positive (48 ± 14 kg N ha−1; Fig. 5d). In a situation in which the boundary of the N balance is the agricultural field, and N loss pathways ( leaching, NH3, N2O, N2) were explicitly determined, a positive N balance indicates a surplus of N that remains on the field. In other words, this N is available for soil organic matter build-up, i.e. an increase in soil organic N stocks. This indicates that a more balanced fertilization approach compared to the management from 2012 to 2020 has the potential to restore C and N levels, which may increase the productivity of the site in the long term. However, since the C or N stock change cannot be determined on the timescale of 2 years (Küstermann et al., 2013) and – as discussed above – some N loss pathways do not cover the whole cultivation period and may, thus, be underestimated, it cannot be excluded that the positive N balance to some degree points towards unaccounted losses. Since positive N balances were observed for OF, where the 15N recovery also showed higher unrecovered shares, we assume that not the full N balance can be attributed to an increase in soil N stocks. In this context, it is noteworthy that crop N export and balance values from different cultivation periods align with findings from other studies (Thompson et al., 1987; Dell et al., 2011; Lin et al., 2016; Duncan et al., 2019), which applied cattle slurry using various techniques, including surface application and incorporation.
Furthermore, the annual variability in N balances of OF was also observed by other studies due to microbial N immobilization, soil environmental conditions, slurry application technique, crop N export, and the impact of historical management practices (De Jager et al., 2001; Dell et al., 2011; He et al., 2018; Chmelíková et al., 2021; Winkhart et al., 2022). This underscores the need for repeated N balance measurements and cumulative N balances to fully capture the effects of different N management practices on N dynamics, ultimately supporting the development of more sustainable agricultural practices. To improve our understanding of long-term nutrient cycling, future studies should explicitly address both the legacy effects of past management practices and the direct impacts of current interventions. Such research will be crucial for disentangling time-dependent effects and guiding the design of resilient and sustainable farming systems.
4.5 Impact of experimental homogenization of management on legacy effects
While the study aimed to investigate the legacy effects of organic farming (OF) and integrated farming (IF) systems on nitrogen cycling, it is important to recognize that both systems were managed identically during the experimental period (2021–2022). This homogenization of management practices, which included uniform crop rotations, tillage methods, and high cattle slurry application rates, may have limited the ability to draw direct comparisons between OF and IF systems in the experimental phase. As such, the observed differences in N cycling may be more reflective of past management legacies rather than current practices. Additionally, the timing of the crop assessments – green rye immediately after management homogenization and ryegrass 2 years later – could have further influenced the results, as the green rye was likely more influenced by previous management practices. Furthermore, the high rates of cattle slurry application, typical of IF systems but higher than those generally applied in OF systems, may have masked potential differences between the two systems in terms of nutrient cycling. Finally, the absence of legumes in the experimental crop rotations meant that their role in N cycling could only be inferred as a legacy effect, rather than being directly assessed. These factors should be considered when interpreting the findings, and future studies that include a more direct comparison of management systems with consistent practices and crop rotations, including legumes, would be valuable in further understanding the impacts of OF and IF on N cycling.
This study is the first to quantify fertilizer N balances, including directly measured emissions of N2, N2O, NH3, and leaching losses, as well as 15N balances and total N balances, over three consecutive cultivation periods (green rye, silage maize, and perennial ryegrass) as affected by legacy effects of integrated or organic farming systems under homogenized management conditions.
Ammonia losses were low due to efficient NH3 mitigation measures, soil texture, and fertilization close to plant N demand, resulting in low-nitrate leaching, irrespective of the management history. Emissions of N2O were negligible compared to the N balance, and average N2 emissions for all cultivation periods were not significantly different but could only be determined for 2 weeks after fertilizer application. Both OF and IF practices demonstrated minimal N losses, indicating that both approaches effectively mitigate N leaching and emissions when management is standardized.
Integrated farming increased productivity by improving plant N supply through higher soil organic matter and higher rates of mineralization, thereby maintaining a balanced N budget. The positive N balance of organic farming demonstrates that increased N input may result in soil N and C accumulation, potentially improving productivity on the long term. Consequently, a higher level of organic fertilizer additions or a higher share of residue returns for this specific, legume-cantered N management strategy may be beneficial with regard to productivity and soil fertility. Finally, this study demonstrates that multi-year 15N tracing and N balance studies are powerful tools to quantitatively assessing the environmental and agronomic impacts of different management strategies. Future studies that maintain distinct management systems during the experimental phase would help clarify the direct impacts of OF and IF on N dynamics under realistic farming conditions.
Table A1Annual C and N input of organic farming (OF) and integrated farming (IF) sites for the period 2012–2020, i.e. prior to the field experiment. All crops were mowed from both sites with same machinery. Crop residues were returned to the IF site but not to the OF site. Tillage to a depth of 20 cm was uniformly executed at both sites (OF, IF). In case of missing documentation, gaps were filled based on recommended and typical practice for the area and literature values.
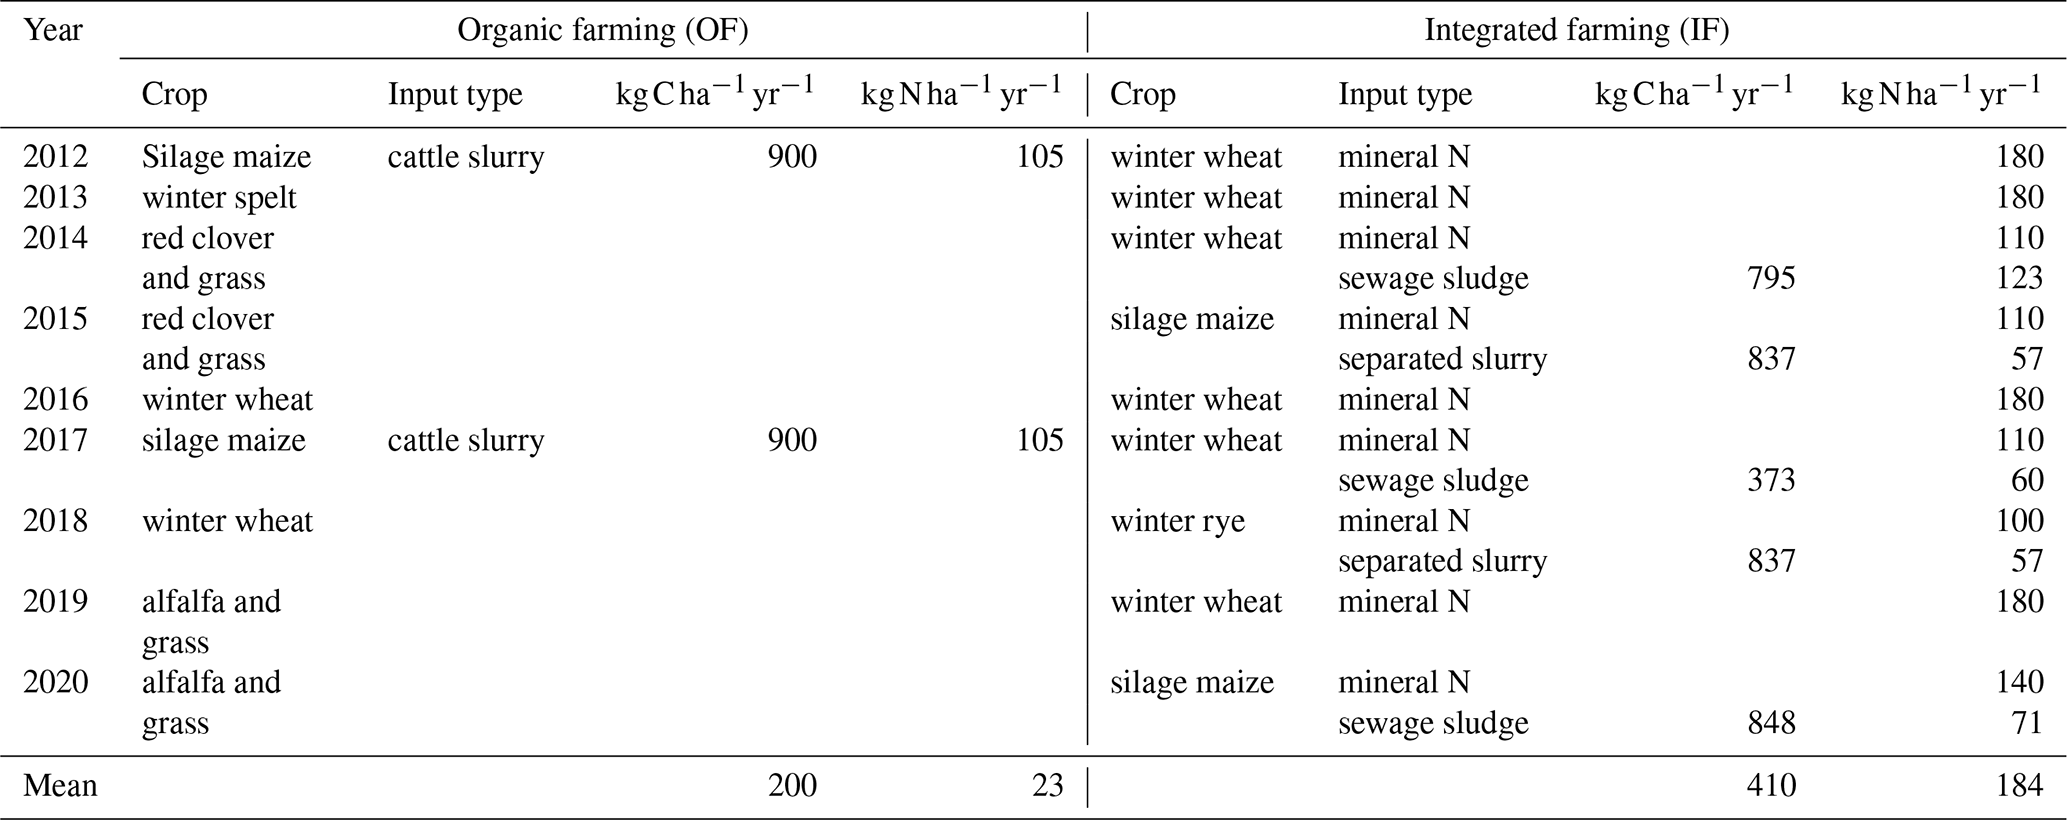
Table A2Preparation of the 15N-labelled manures for different cultivation periods.
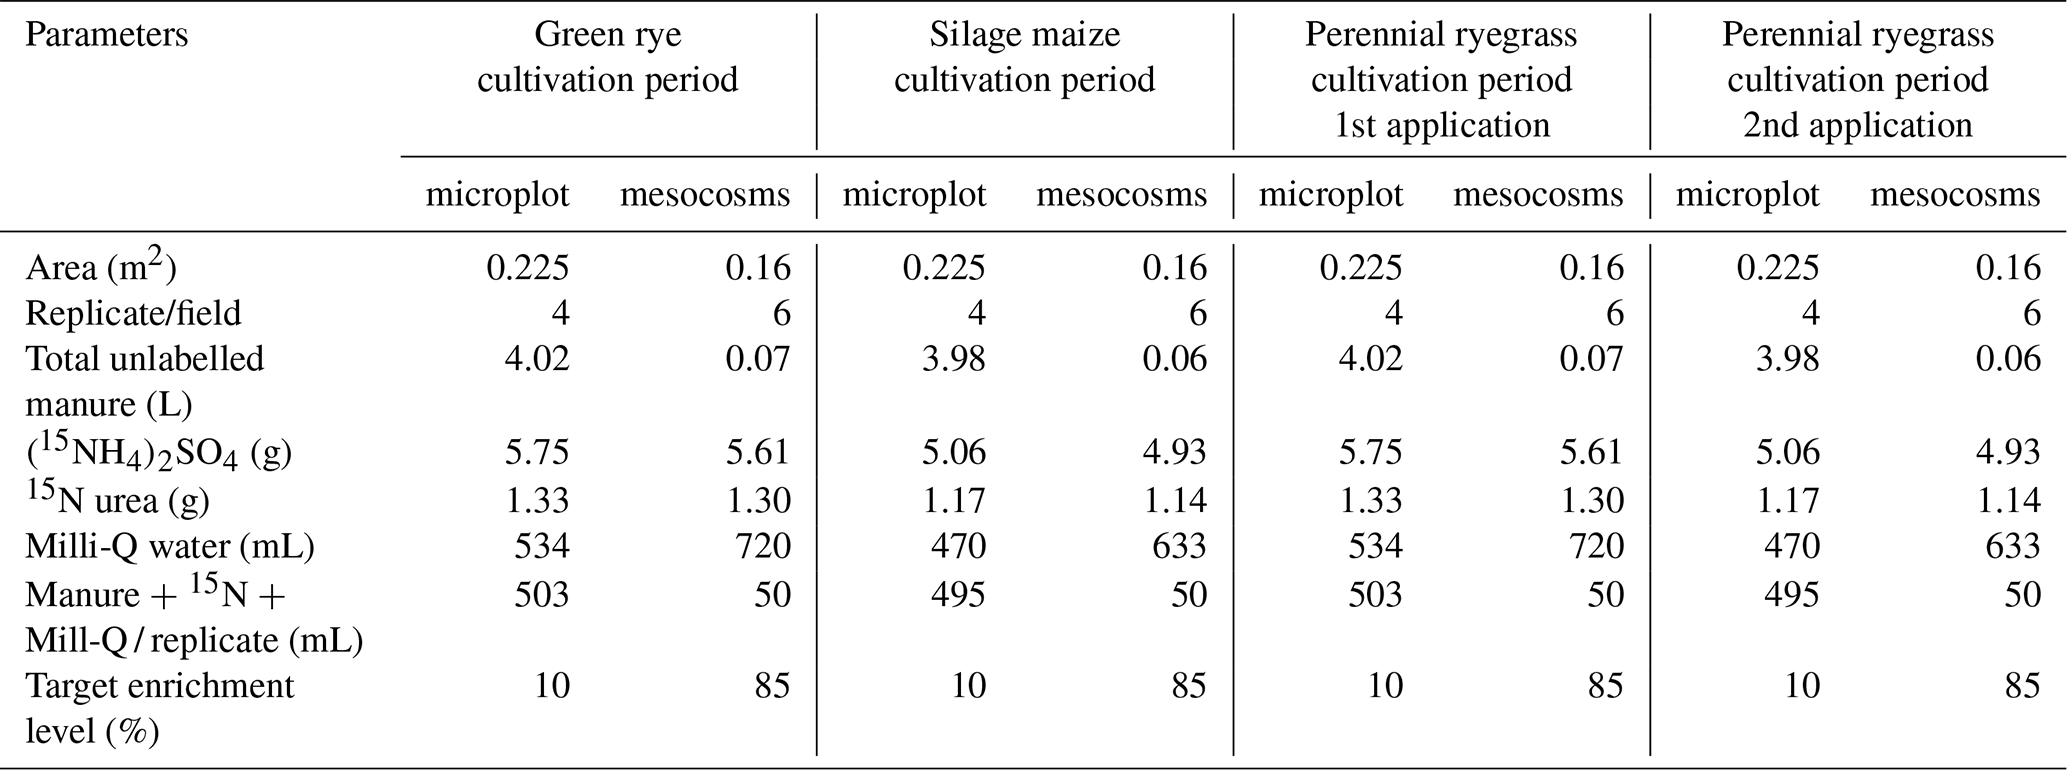
Table A3Fertilizer 15N input, 15N recovery, and unrecovered amounts in green rye, silage maize, and perennial ryegrass cultivation periods.
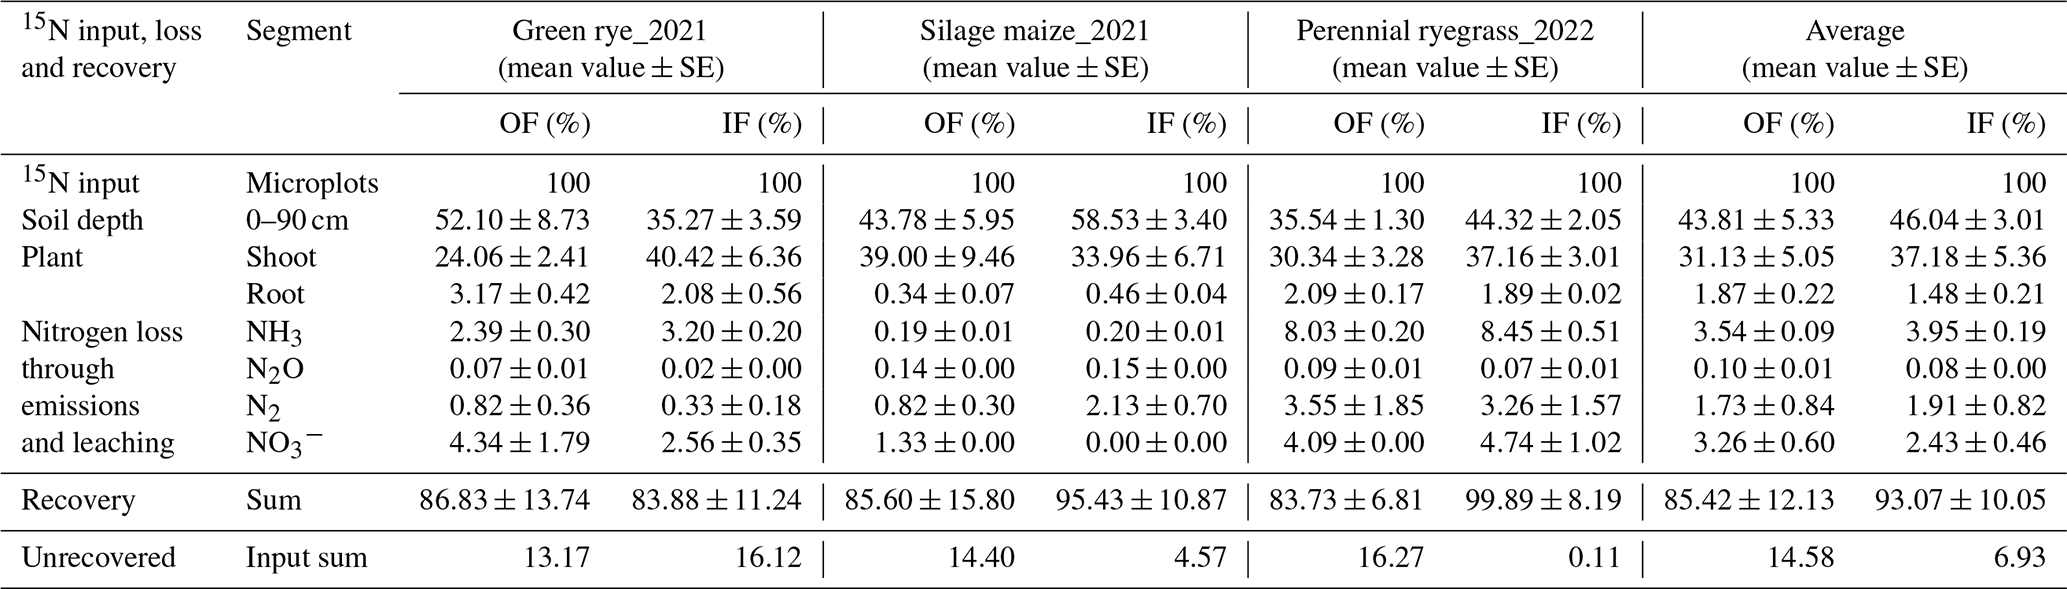
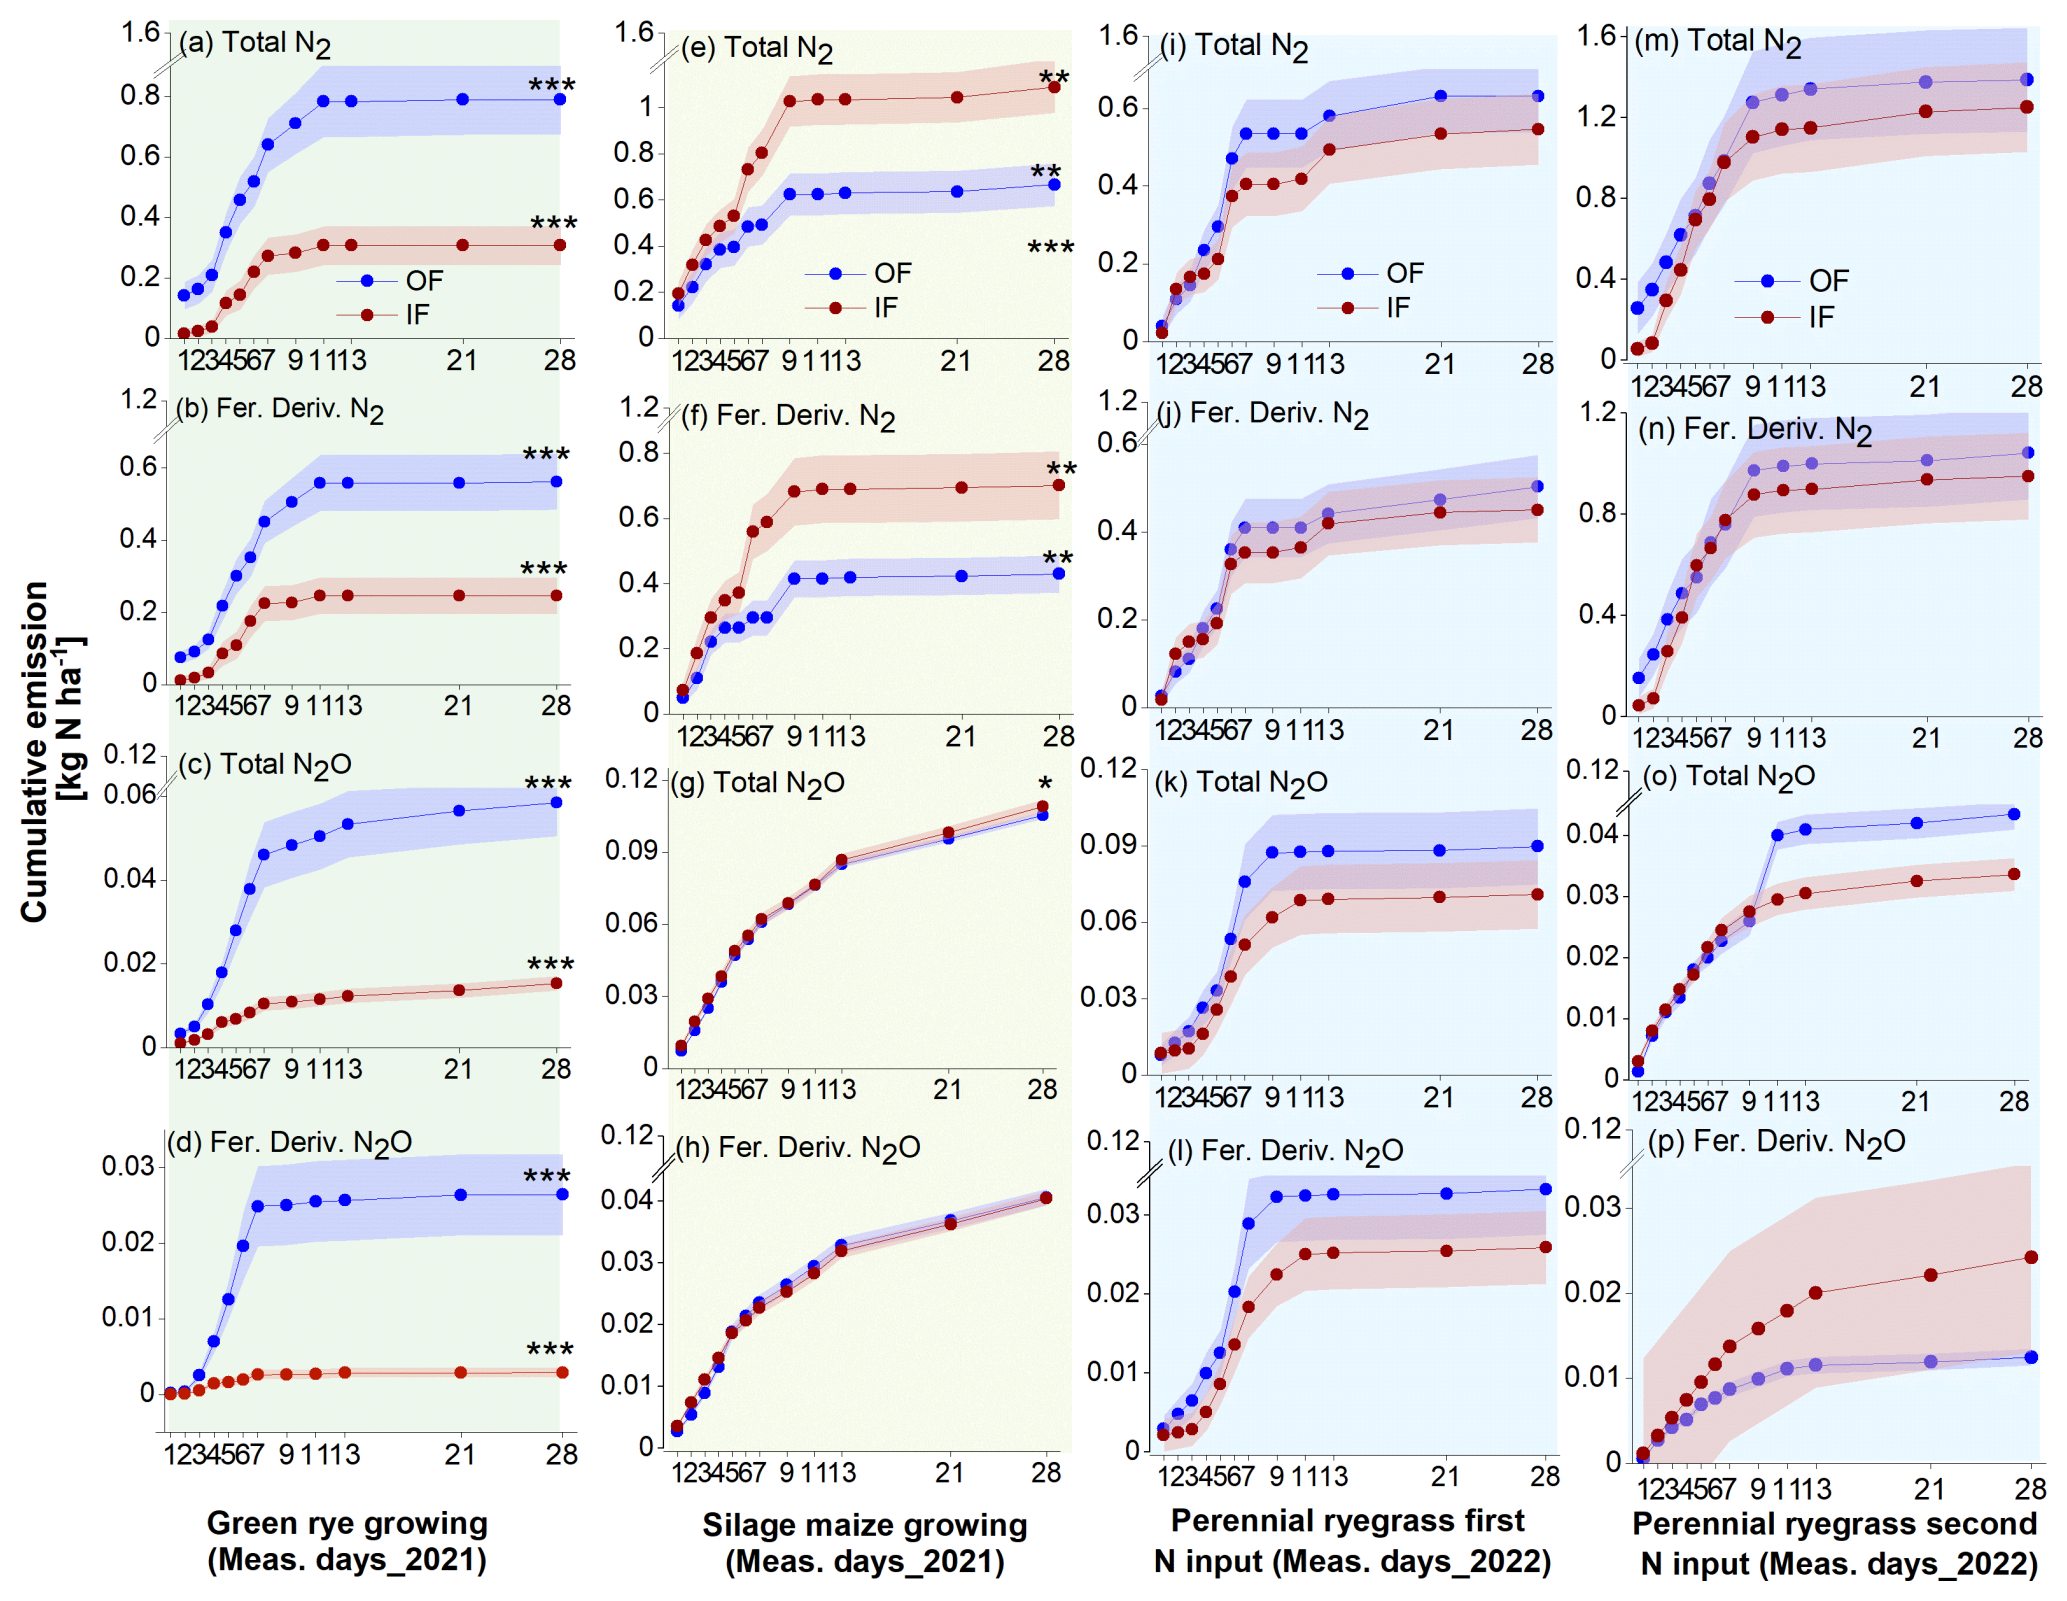
Figure B1The cumulative total and fertilizer-derived emissions of N2 and N2O across different cultivation periods. Subplots (a–d) depict the total N2, fertilizer-derived N2, total N2O, and fertilizer-derived N2O emissions, respectively, during the green rye cultivation period, and subplots (e–h) show the corresponding emissions for the silage maize cultivation period. For the perennial ryegrass cultivation period, subplots (i–l) illustrate emissions of total N2, fertilizer-derived N2, total N2O, and fertilizer-derived N2O emissions, respectively, following the first fertilizer application, while subplots (m–p) represent corresponding emissions after the second fertilizer application. Asterisks show significant differences (∗: p<0.05, : p<0.01, : p<0.001). Symbols and shading represent the mean values and the standard error, respectively. The background shading in light green, pale yellow, and light blue represents measurements during the green rye, silage maize, and perennial ryegrass cultivation periods, respectively.
The data used in this article are available from the Karlsruhe Institute of Technology, Garmisch-Partenkirchen, Germany, database. Currently, the dataset can be accessed upon request from the corresponding author and will be made open access upon the final publication of the article.
Conceptualization: FK carried out fieldwork and laboratory work, data analysis, and drafted the manuscript. SFL carried out fieldwork and laboratory work. FH carried out field management, data collection, and laboratory work. MD, CS, and RK supervised the experimental work, contributed to the study design, and revised the manuscript. RG supervised fieldwork. WN carried out the field management, collected data, and revised the manuscript. EGW and RMM helped in laboratory work. BW and AG acquired the funding and supervised and revised the manuscript.
The contact author has declared that none of the authors has any competing interests.
Publisher's note: Copernicus Publications remains neutral with regard to jurisdictional claims made in the text, published maps, institutional affiliations, or any other geographical representation in this paper. While Copernicus Publications makes every effort to include appropriate place names, the final responsibility lies with the authors.
The research was funded by the Federal Ministry of Nutrition and Agriculture (BMEL), Germany, with grant nos. 2220NR083A and 2220NR083B.
This research has been supported by the Bundesministerium für Ernährung und Landwirtschaft (grant nos. 2220NR083A and 2220NR083B).
The article processing charges for this open-access publication were covered by the Karlsruhe Institute of Technology (KIT).
This paper was edited by Edzo Veldkamp and reviewed by Eduardo Vázquez and one anonymous referee.
Abdo, A. I., Sun, D., Li, Y., Yang, J., Metwally, M. S., Abdel-Hamed, E. M. W., Wei, H., and Zhang, J.: Coupling the environmental impacts of reactive nitrogen losses and yield responses of staple crops in China, Front. Plant Sci., 13, 927935, https://doi.org/10.3389/fpls.2022.927935, 2022.
Almaraz, M., Wong, M. Y., Zhang, Y., and Silver, W. L.: Biotic regulation of nitrogen gas emissions in temperate agriculture, Biogeochemistry, 167, 1079–1087, https://doi.org/10.1007/s10533-024-01157-9, 2024.
Arah, J. R. M.: Apportioning nitrous oxide fluxes between nitrification and denitrification using gas-phase mass spectrometry, Soil Biol. Biochem., 29, 1295–1299, https://doi.org/10.1016/S0038-0717(97)00009-6, 1997.
Bizimana, F., Luo, J., Timilsina, A., Dong, W., Gaudel, G., Ding, K., Qin, S., and Hu, C.: Estimating field N2 emissions based on laboratory-quantified ratios and field-quantified N2O emissions, J. Soils Sediments, 22, 2196–2208, https://doi.org/10.1007/s11368-022-03212-0, 2022.
Bleizgys, R. and Naujokienė, V.: Ammonia emissions from cattle manure under variable moisture exchange between the manure and the environment, Agronomy, 13, 1555, https://doi.org/10.3390/agronomy13061555, 2023.
Böhm, H., Dauber, J., Dehler, M., Gallardo, D. A. A., de Witte, T., Fuß, R., Höppner, F., Langhof, M., Rinke, N., and Rodemann, B.: Fruchtfolgen mit und ohne Leguminosen: ein Review, J. Kulturpflanzen, 72, 489–509, https://doi.org/10.5073/JfK.2020.10-11.01, 2020.
Bryla, D. R.: Application of the “4R” nutrient stewardship concept to horticultural crops: Getting nutrients in the “right” place, HortTechnology, 21, 674–682, https://doi.org/10.21273/HORTTECH.21.6.674, 2011.
Buchen-Tschiskale, C., Well, R., and Flessa, H.: Tracing nitrogen transformations during spring development of winter wheat induced by 15N-labeled cattle slurry applied with different techniques, Sci. Total Environ., 871, 162061, https://doi.org/10.1016/j.scitotenv.2023.162061, 2023.
Butterbach-Bahl, K. and Dannenmann, M.: Denitrification and associated soil N2O emissions due to agricultural activities in a changing climate, Curr. Opin. Env. Sust., 3, 389–395, https://doi.org/10.1016/j.cosust.2011.08.004, 2011.
Butterbach-Bahl, K., Willibald, G., and Papen, H.: Soil core method for direct simultaneous determination of N2 and N2O emissions from forest soils, Plant Soil, 240, 105–116, https://doi.org/10.1023/A:1015870518723, 2002.
Cárceles Rodríguez, B., Durán-Zuazo, V. H., Soriano Rodríguez, M., García-Tejero, I. F., Gálvez Ruiz, B., and Cuadros Tavira, S.: Conservation agriculture as a sustainable system for soil health: A review, Soil Syst., 6, 87, https://doi.org/10.3390/soilsystems6040087, 2022.
Chalk, P. M., Craswell, E. T., Polidoro, J. C., and Chen, D.: Fate and efficiency of 15N-labelled slow- and controlled-release fertilizers, Nutr. Cycl. Agroecosys., 102, 167–178, https://doi.org/10.1007/s10705-015-9697-2, 2015.
Chaoui, R., Boudsocq, S., Taschen, E., Sentenac, H., Farissi, M., and Lazali, M.: Intercropping durum wheat and chickpea increases nutrient availability and use efficiency under low phosphorus soils, J. Plant Nutr., 46, 4125–4139, https://doi.org/10.1080/01904167.2023.2221677, 2023.
Chen, T., Oenema, O., Li, J., Misselbrook, T., Dong, W., Qin, S., Yuan, H., Li, X., and Hu, C.: Seasonal variations in N2 and N2O emissions from a wheat–maize cropping system, Biol. Fert. Soils, 55, 539–551, https://doi.org/10.1007/s00374-019-01373-8, 2019.
Chmelíková, L., Schmid, H., Anke, S., and Hülsbergen, K.-J.: Nitrogen-use efficiency of organic and conventional arable and dairy farming systems in Germany, Nutr. Cycl. Agroecosyst., 119, 337–354, https://doi.org/10.1007/s10705-021-10126-9, 2021.
Costa, C. M., da Costa, A. B. G., Theodoro, G. F., Difante, G. S., Gurgel, A. L. C., Santana, J. C. S., Camargo, F. C., and de Almeida, E. M.: The 4R management for nitrogen fertilization in tropical forage: A review, Aust. J. Crop Sci., 14, 1834–1837, https://doi.org/10.21475/ajcs.20.14.11.p2646, 2020.
Couto-Vázquez, A. and Gonzalez-Prieto, S. J.: Fate of 15N-fertilizers in the soil-plant system of a forage rotation under conservation and plough tillage, Soil Till. Res., 161, 10–18, https://doi.org/10.1016/j.still.2016.02.011, 2016.
Dai, S., Jing, W., Cheng, Y., Zhang, J., and Cai, Z.: Effects of long-term fertilization on soil gross N transformation rates and their implications, J. Integr. Agr., 16, 2863–2870, https://doi.org/10.1016/S2095-3119(17)61673-3, 2017.
Dannenmann, M., Gasche, R., Ledebuhr, A., and Papen, H.: Effects of forest management on soil N cycling in beech forests on calcareous soils, Plant Soil, 287, 279–300, https://doi.org/10.1007/s11104-006-9077-4, 2006.
Dannenmann, M., Bimüller, C., Gschwendtner, S., Leberecht, M., Tejedor, J., Bilela, S., Gasche, R., Hanewinkel, M., Baltensweiler, A., and Kögel-Knabner, I.: Climate change impairs nitrogen cycling in European beech forests, PLoS ONE, 11, e0158823, https://doi.org/10.1371/journal.pone.0158823, 2016.
Dannenmann, M., Yankelzon, I., Wähling, S., Ramm, E., Schreiber, M., Ostler, U., Schlingmann, M., Stange, C. F., Kiese, R., and Butterbach-Bahl, K.: Fates of slurry-nitrogen applied to mountain grasslands: the importance of dinitrogen emissions versus plant N uptake, Biol. Fert. Soils, 61, 455–468, https://doi.org/10.1007/s00374-024-01826-9, 2024.
De Jager, A., Onduru, D., Van Wijk, M. S., Vlaming, J., and Gachini, G. N.: Assessing sustainability of low-external-input farm management systems with the nutrient monitoring approach: a case study in Kenya, Agr. Syst., 69, 99–118, https://doi.org/10.1016/S0308-521X(01)00020-8, 2001.
De Sousa, R. N., and Moreira, L. A.: Plant Nutrition Optimization: Integrated Soil Management and Fertilization Practices, in Strategic Tillage and Soil Management – New Perspectives, IntechOpen, London, UK, University of São Paulo affiliation, CC BY 3.0, https://doi.org/10.5772/intechopen.114848, 2024.
Dell, C. J., Meisinger, J. J., and Beegle, D. B.: Subsurface application of manure slurries for conservation tillage and pasture soils and their impact on the nitrogen balance, J. Environ. Qual., 40, 352–361, https://doi.org/10.2134/jeq2010.0069, 2011.
Di, H. J. and Cameron, K. C.: Nitrate leaching in temperate agroecosystems: sources, factors and mitigating strategies, Nutr. Cycl. Agroecosyst., 64, 237–256, https://doi.org/10.1023/A:1021471531188, 2002.
Duncan, E. W., Kleinman, P. J. A., Beegle, D. B., and Dell, C. J.: Nitrogen cycling trade-offs with broadcasting and injecting dairy manure, Nutr. Cycl. Agroecosyst., 114, 57–70, https://doi.org/10.1007/s10705-019-09975-2, 2019.
Eckei, J., Well, R., Maier, M., Matson, A., Dittert, K., and Rummel, P. S.: Determining N2O and N2 fluxes in relation to winter wheat and sugar beet growth and development using the improved 15N gas flux method on the field scale, Biol. Fert. Soils, 61, 489–505, https://doi.org/10.1007/s00374-024-01806-z 2025.
Eysholdt, M., Kunkel, R., Rösemann, C., Wendland, F., Wolters, T., Zinnbauer, M., and Fuß, R.: A model-based estimate of nitrate leaching in Germany for GHG reporting, J. Plant Nutr. Soil Sci., 185, 465–478, https://doi.org/10.1002/jpln.202200119 , 2022
Fangueiro, D., Pereira, J., Chadwick, D., Coutinho, J., Moreira, N., and Trindade, H.: Laboratory assessment of the effect of cattle slurry pre-treatment on organic N degradation after soil application and N2O and N2 emissions, Nutr. Cycl. Agroecosyst., 80, 107–120, https://doi.org/10.1007/s10705-007-9124-4, 2008.
Fixen, P. E.: A brief account of the genesis of 4R nutrient stewardship, Agron. J., 112, 4511–4518, https://doi.org/10.1002/agj2.20315, 2020.
Frick, H., Oberson, A., Cormann, M., Wettstein, H.-R., Frossard, E., and Bünemann, E. K.: Similar distribution of 15N labeled cattle slurry and mineral fertilizer in soil after one year, Nutr. Cycl. Agroecosyst., 125, 153–169, https://doi.org/10.1007/s10705-022-10205-5, 2023.
Friedl, J., Scheer, C., Rowlings, D. W., Deltedesco, E., Gorfer, M., De Rosa, D., Grace, P. R., Müller, C., and Keiblinger, K. M.: Effect of the nitrification inhibitor 3,4-dimethylpyrazole phosphate (DMPP) on N-turnover, the N2O reductase-gene nosZ and N2O:N2 partitioning from agricultural soils, Sci. Rep., 10, 2399, https://doi.org/10.1038/s41598-020-59249-z, 2020.
Gai, X., Liu, H., Liu, J., Zhai, L., Yang, B., Wu, S., Ren, T., Lei, Q., and Wang, H.: Long-term benefits of combining chemical fertilizer and manure applications on crop yields and soil carbon and nitrogen stocks in North China Plain, Agr. Water Manage., 208, 384–392, https://doi.org/10.1016/j.agwat.2018.07.002, 2018.
Gardner, J. B. and Drinkwater, L. E.: The fate of nitrogen in grain cropping systems: A meta-analysis of 15N field experiments, Ecol. Appl., 19, 2167–2184, https://doi.org/10.1890/08-1122.1, 2009.
Good, A. G. and Beatty, P. H.: Fertilizing nature: a tragedy of excess in the commons, PLoS Biol., 9, e1001124, https://doi.org/10.1371/journal.pbio.1001124, 2011.
Grahmann, K., Verhulst, N., Palomino, L. M., Bischoff, W.-A., Govaerts, B., and Buerkert, A.: Ion exchange resin samplers to estimate nitrate leaching from a furrow irrigated wheat-maize cropping system under different tillage-straw systems, Soil Till. Res., 175, 91–100, https://doi.org/10.1016/j.still.2017.08.013, 2018.
Häfner, F., Ruser, R., Claß-Mahler, I., and Möller, K.: Field application of organic fertilizers triggers N2O emissions from the soil N pool as indicated by 15N-labeled digestates, Front. Sustain. Food Syst., 4, 614349, https://doi.org/10.3389/fsufs.2020.614349, 2021.
Hamonts, K., Balaine, N., Moltchanova, E., Beare, M., Thomas, S., Wakelin, S. A., O'Callaghan, M., Condron, L. M., and Clough, T. J.: Influence of soil bulk density and matric potential on microbial dynamics, inorganic N transformations, N2O and N2 fluxes following urea deposition, Soil Biol. Biochem., 65, 1–11, https://doi.org/10.1016/j.soilbio.2013.05.006, 2013.
Häni, C., Flechard, C., Neftel, A., Sintermann, J., and Kupper, T.: Accounting for field-scale dry deposition in backward Lagrangian stochastic dispersion modelling of NH3 emissions, Atmosphere-Basel, 9, 146, https://doi.org/10.3390/atmos9040146, 2018.
Hauck, R. D., Melsted, S. W., and Yankwich, P. E.: Use of N-isotope distribution in nitrogen gas in the study of denitrification, Soil Sci., 86, 287–291, 1958.
He, W., Jiang, R., He, P., Yang, J., Zhou, W., Ma, J., and Liu, Y.: Estimating soil nitrogen balance at regional scale in China's croplands from 1984 to 2014, Agr. Syst., 167, 125–135, https://doi.org/10.1016/j.agsy.2018.09.002, 2018.
Heng, L. K., Sakadevan, K., Dercon, G., and Nguyen, M. L.: International Symposium on Managing Soils for Food Security and Climate Change Adaptation and Mitigation, Food Agric. Organ. U.N., Rome, 331–348, https://agris.fao.org/search/en/providers/122621/records/6473afa513d110e4e7a93220 (last access: 18 September 2025), 2014.
Herr, C., Mannheim, T., Müller, T., and Ruser, R.: Effect of cattle slurry application techniques on N2O and NH3 emissions from a loamy soil, J. Plant Nutr. Soil Sc., 182, 964–979, https://doi.org/10.1002/jpln.201800376, 2019.
Iheshiulo, E. M.-A., Larney, F. J., Hernandez-Ramirez, G., St. Luce, M., Chau, H. W., and Liu, K.: Crop rotations influence soil hydraulic and physical quality under no-till crop management, Agr. Ecosyst. Environ., 14, 1774, https://doi.org/10.1016/j.agee.2023.108820, 2024.
Jantalia, C. P., Halvorson, A. D., Follett, R. F., Rodrigues Alves, B. J., Polidoro, J. C., and Urquiaga, S.: Nitrogen source effects on ammonia volatilization as measured with semi-static chambers, Agron. J., 104, 1595–1603, https://doi.org/10.2134/agronj2012.0210, 2012.
Jensen, L. S., Pedersen, I. S., Hansen, T. B., and Nielsen, N. E.: Turnover and fate of 15N-labelled cattle slurry ammonium-N applied in the autumn to winter wheat, Eur. J. Agron., 12, 23–35, https://doi.org/10.1016/S1161-0301(99)00040-4, 2000.
Ju, X.-T., Xing, G.-X., Chen, X.-P., Zhang, S.-L., Zhang, L.-J., Liu, X.-J., Cui, Z.-L., Yin, B., Christie, P., and Zhu, Z.-L.: Reducing environmental risk by improving N management in intensive Chinese agricultural systems, P. Natl. Acad. Sci. USA, 106, 3041–3046, https://doi.org/10.1073/pnas.0813417106, 2009.
Kayser, M., Breitsameter, L., Benke, M., and Isselstein, J.: Nitrate leaching is not controlled by the slurry application technique in productive grassland on organic–sandy soil, Agron. Sustain. Dev., 35, 213–223, https://doi.org/10.1007/s13593-014-0220-y, 2015.
Kempers, A. J. and Zweers, A.: Ammonium determination in soil extracts by the salicylate method, Commun. Soil Sci. Plan., 17, 715–723, 1986.
Khan, F., Basak, J. K., Jaihuni, M., Lee, D. H., Lee, J. H., and Kim, H. T.: Forced aerated poultry compost effects on soil physicochemical properties and lettuce plant growth, J. Biosyst. Eng., 45, 104–116, https://doi.org/10.1007/s42853-020-00050-1, 2020.
Khan, F., Franco, S., Ulrich, M., Rainer, D., Andreas, G., Hartmann, F., Tobisch, B., Kiese, R., and Wolf, B.: Integrated rather than organic farming history facilitates soil nitrogen turnover and N2O reduction in a green rye–silage maize cropping sequence, Biol. Fert. Soils, 61, 27–41, https://doi.org/10.1007/s00374-024-01865-2, 2024.
Kramer, A. W., Doane, T. A., Horwath, W. R., and van Kessel, C.: Short-term nitrogen-15 recovery vs. long-term total soil N gains in conventional and alternative cropping systems, Soil Biol. Biochem., 34, 43–50, https://doi.org/10.1016/S0038-0717(01)00149-3, 2002.
Kramer, S. B., Reganold, J. P., Glover, J. D., Bohannan, B. J. M., and Mooney, H. A.: Reduced nitrate leaching and enhanced denitrifier activity and efficiency in organically fertilized soils, P. Natl. Acad. Sci. USA, 103, 4522–4527, https://doi.org/10.1073/pnas.0600359103, 2006.
Kulkarni, M. V., Yavitt, J. B., and Groffman, P. M.: Rapid conversion of added nitrate to nitrous oxide and dinitrogen in northern forest soil, Geomicrobiol. J., 34, 670–676, https://doi.org/10.1080/01490451.2016.1238981, 2017.
Küstermann, B., Munch, J. C., and Hülsbergen, K.-J.: Effects of soil tillage and fertilization on resource efficiency and greenhouse gas emissions in a long-term field experiment in Southern Germany, Eur. J. Agron., 49, 61–73, https://doi.org/10.1016/j.eja.2013.02.012, 2013.
Lewicka-Szczebak, D., Augustin, J., Giesemann, A., and Well, R.: Quantifying N2O reduction to N2 based on N2O isotopocules – validation with independent methods (helium incubation and 15N gas flux method), Biogeosciences, 14, 711–732, https://doi.org/10.5194/bg-14-711-2017, 2017.
Lewicka-Szczebak, D., Lewicki, M. P., and Well, R.: N2O isotope approaches for source partitioning of N2O production and estimation of N2O reduction – validation with the 15N gas-flux method in laboratory and field studies, Biogeosciences, 17, 5513–5537, https://doi.org/10.5194/bg-17-5513-2020, 2020.
Li, Z., Reichel, R., Xu, Z., Vereecken, H., and Brüggemann, N.: Return of crop residues to arable land stimulates N2O emission but mitigates leaching: a meta-analysis, Agron. Sustain. Dev., 41, 66, https://doi.org/10.1007/s13593-021-00715-x, 2021.
Lin, H.-C., Huber, J. A., Gerl, G., and Hülsbergen, K.-J.: Nitrogen balances and nitrogen-use efficiency of different organic and conventional farming systems, Nutr. Cycl. Agroecosys., 105, 1–23, https://doi.org/10.1007/s10705-016-9770-5, 2016.
Liu, L., Xu, W., Lu, X., Zhong, B., Guo, Y., Lu, X., Zhao, Y., He, W., Wang, S., and Zhang, X.: Exploring global changes in agricultural ammonia emissions and their contribution to nitrogen deposition since 1980, P. Natl. Acad. Sci. USA, 119, e2121998119, https://doi.org/10.1073/pnas.2121998119, 2022.
Loubet, B., Carozzi, M., Voylokov, P., Cohan, J.-P., Trochard, R., and Génermont, S.: Evaluation of a new inference method for estimating ammonia volatilisation from multiple agronomic plots, Biogeosciences, 15, 3439–3460, https://doi.org/10.5194/bg-15-3439-2018, 2018.
Luo, J., Tillman, R. W., and Ball, P. R.: Nitrogen loss through denitrification in a soil under pasture in New Zealand, Soil Biol. Biochem., 32, 497–509, https://doi.org/10.1016/S0038-0717(99)00179-0, 2000.
Lyu, H., Li, Y., Wang, Y., Wang, P., Shang, Y., Yang, X., Wang, F., and Yu, A.: Drive soil nitrogen transformation and improve crop nitrogen absorption and utilization – a review of green manure applications, Front. Plant Sci., 14, 1305600, https://doi.org/10.3389/fpls.2023.1305600, 2024.
Maguire, R. O., Kleinman, P. J. A., Dell, C. J., Beegle, D. B., Brandt, R. C., McGrath, J. M., and Ketterings, Q. M.: Manure application technology in reduced tillage and forage systems: a review, J. Environ. Qual., 40, 292–301, https://doi.org/10.2134/jeq2009.0228, 2011.
Manns, H. R. and Martin, R. C.: Cropping system yield stability in response to plant diversity and soil organic carbon in temperate ecosystems, Agroecol. Sust. Food, 42, 724–750, https://doi.org/10.1080/21683565.2017.1423529, 2018.
Marliah, A., Anhar, A., and Hayati, E.: Combine organic and inorganic fertilizer increases yield of cucumber (Cucumis sativus L.), IOP C. Ser. Earth Env., 425, 012075, https://doi.org/10.1088/1755-1315/425/1/012075, 2020.
Micucci, G., Sgouridis, F., McNamara, N. P., Krause, S., Lynch, I., Roos, F., Well, R., and Ullah, S.: The 15N-Gas flux method for quantifying denitrification in soil: Current progress and future directions, Soil Biol. Biochem., 184, 109108, https://doi.org/10.1016/j.soilbio.2023.109108, 2023.
Morley, N. J., Richardson, D. J., and Baggs, E. M.: Substrate induced denitrification over or underestimates shifts in soil N2/N2O ratios, PLoS ONE, 9, e108144, https://doi.org/10.1371/journal.pone.0108144, 2014.
Msimbira, L. A. and Smith, D. L.: The roles of plant growth promoting microbes in enhancing plant tolerance to acidity and alkalinity stresses, Front. Sustain. Food Syst., 4, 106, https://doi.org/10.3389/fsufs.2020.00106, 2020.
Mulvaney, R. L. and Boast, C. W.: Equations for determination of nitrogen-15 labelled dinitrogen and nitrous oxide by mass spectrometry, Soil Sci. Soc. Am. J., 50, 360–363, https://doi.org/10.2136/sssaj1986.03615995005000020021x, 1986.
Ni, K., Köster, J. R., Seidel, A., and Pacholski, A.: Field measurement of ammonia emissions after nitrogen fertilization – A comparison between micrometeorological and chamber methods, Eur. J. Agron., 71, 115–122, https://doi.org/10.1016/j.eja.2015.09.006, 2015.
Nigon, L. L.: Integrating enhanced-efficiency fertilizers in 4R nutrient management, Crops Soils, 57, 32–37, https://doi.org/10.1002/crso.20329, 2024.
Nyameasem, J. K., Zutz, M., Kluß, C., Huf, M. T., Essich, C., Buchen-Tschiskale, C., Ruser, R., Flessa, H., Olfs, H.-W., Taube, F., and Reinsch, T.: Impact of cattle slurry application methods on ammonia losses and grassland nitrogen use efficiency, Environ. Pollut., 315, 120302, https://doi.org/10.1016/j.envpol.2022.120302, 2022.
Paul, J. W. and Beauchamp, E. G.: Availability of manure slurry ammonium for corn using 15N-labelled (NH4)2SO4, Can. J. Soil Sci., 75, 35–42, 1995.
Pearsons, K. A., Omondi, E. C., Zinati, G., Smith, A., and Rui, Y.: A tale of two systems: Does reducing tillage affect soil health differently in long-term, side-by-side conventional and organic agricultural systems?, Soil Till. Res., 226, 105562, https://doi.org/10.1016/j.still.2022.105562, 2023.
Peng, G., Zhang, T., Lei, X., Cui, X., Lu, Y., Fan, P., Long, S., Huang, J., Gao, J., and Zhang, Z.: Improvement of soil fertility and rice yield after long-term application of cow manure combined with inorganic fertilizers, J. Integr. Agr., 7, 2221–2232, https://doi.org/10.1016/j.jia.2023.02.037, 2023.
Pomoni, D. I., Koukou, M. K., Vrachopoulos, M. G., and Vasiliadis, L.: A review of hydroponics and conventional agriculture based on energy and water consumption, environmental impact, and land use, Energies, 16, 1690, https://doi.org/10.3390/en16041690, 2023.
Quan, Z., Li, S., Zhang, X., Zhu, F., Li, P., Sheng, R., Chen, X., Zhang, L.-M., He, J.-Z., and Wei, W.: Fertilizer nitrogen use efficiency and fates in maize cropping systems across China: Field 15N tracer studies, Soil Till. Res., 197, 104498, https://doi.org/10.1016/j.still.2019.104498, 2020.
Ramirez, K. S., Craine, J. M., and Fierer, N.: Consistent effects of nitrogen amendments on soil microbial communities and processes across biomes, Glob. Change Biol., 18, 1918–1927, https://doi.org/10.1111/j.1365-2486.2012.02639.x, 2012.
Reza, M. S. and Sabau, G.: Impact of climate change on crop production and food security in Newfoundland and Labrador, Canada, J. Agric. Food Res., 8, 100405, https://doi.org/10.1016/j.jafr.2022.100405, 2022.
Rohe, L., Apelt, B., Vogel, H.-J., Well, R., Wu, G.-M., and Schlüter, S.: Denitrification in soil as a function of oxygen availability at the microscale, Biogeosciences, 18, 1185–1201, https://doi.org/10.5194/bg-18-1185-2021, 2021.
Russenes, A. L., Korsaeth, A., Bakken, L. R., and Dörsch, P.: Spatial variation in soil pH controls off-season N2O emission in an agricultural soil, Soil Biol. Biochem., 99, 36–46, https://doi.org/10.1016/j.soilbio.2016.04.019, 2016.
Samad, M. S., Bakken, L. R., Nadeem, S., Clough, T. J., de Klein, C. A. M., Richards, K. G., Lanigan, G. J., and Morales, S. E.: High-resolution denitrification kinetics in pasture soils link N2O emissions to pH, and denitrification to C mineralization, PLoS ONE, 11, e0151713, https://doi.org/10.1371/journal.pone.0151713, 2016.
Scheer, C., Wassmann, R., Butterbach-Bahl, K., Lamers, J. P. A., and Martius, C.: The role of N2O and N2 emissions in nitrogen cycling in agroecosystems, Agr. Ecosyst. Environ., 293, 106848, https://doi.org/10.1016/j.cosust.2020.07.005, 2020.
Senbayram, M., Chen, R., Budai, A., Bakken, L., and Dittert, K.: N2O emission and the product ratio of denitrification as controlled by available carbon substrates and nitrate concentrations, Agr. Ecosyst. Environ., 147, 4–12, https://doi.org/10.1016/j.agee.2011.06.022, 2012.
Sherman, J., Young, E., Jokela, W., and Kieke, B.: Manure application timing and incorporation effects on ammonia and greenhouse gas emissions in corn, Agriculture, 12, 1952, https://doi.org/10.3390/agriculture12111952, 2022.
Smith, K. A. and Arah, J. R. M.: Losses of nitrogen by denitrification and emissions of nitrogen oxides from soils, Soil Res., 28, 95–120, 1990.
Snyder, C. S.: Enhanced nitrogen fertiliser technologies support the “4R” concept to optimise crop production and minimise environmental losses, Soil Res., 55, 463–472, https://doi.org/10.1071/sr16335, 2017.
Sommer, S. G. and Hutchings, N. J.: Ammonia emission from field applied manure and its reduction, Eur. J. Agron., 15, 1–15, https://doi.org/10.1016/S1161-0301(01)00112-5, 2001.
Sommer, S. G., Christensen, B. T., Nielsen, N. E., and Schjorring, J. K.: Ammonia volatilization during storage of cattle and pig slurry: Effect of surface cover, J. Agr. Sci., 117, 91–100, 1993.
Sørensen, P. and Thomsen, I. K.: Separation of pig slurry and plant utilization and loss of nitrogen-15-labeled slurry nitrogen, Soil Sci. Soc. Am. J., 69, 1644–1651, https://doi.org/10.2136/sssaj2004.0365, 2005.
Spott, O., Russow, R., Apelt, B., and Stange, C. F.: A 15N-aided artificial atmosphere gas flow technique for online determination of soil N2 release using the zeolite Köstrolith SX6®, Rapid Commun. Mass Sp., 20, 3267–3274, https://doi.org/10.1002/rcm.2722, 2006.
Stevens, R. J. and Laughlin, R. J.: Cattle slurry affects nitrous oxide and dinitrogen emissions from fertilizer nitrate, Soil Sci. Soc. Am. J., 65, 1307–1314, https://doi.org/10.2136/sssaj2001.6541307x, 2001a.
Stevens, R. J. and Laughlin, R. J.: Lowering the detection limit for dinitrogen using the enrichment of nitrous oxide, Soil Biol. Biochem., 33, 1287–1289, https://doi.org/10.1016/S0038-0717(01)00036-0, 2001b.
Surekha, K., Kumar, R. M., Nagendra, V., Sailaja, N., and Satyanarayana, T.: 4R nitrogen management for sustainable rice production, Better Crop, 10, 16–19, 2016.
Tang, H., Xiao, X., Tang, W., Li, C., Wang, K., Li, W., Cheng, K., and Pan, X.: Long-term effects of NPK fertilizers and organic manures on soil organic carbon and carbon management index under a double-cropping rice system in Southern China, Soil Till. Res., 49, 1976–1989, https://doi.org/10.1016/j.still.2016.10.005, 2018.
Thompson, R. B., Ryden, J. C., and Lockyer, D. R.: Fate of nitrogen in cattle slurry following surface application or injection to grassland, J. Soil Sci., 38, 689–700, https://doi.org/10.1111/j.1365-2389.1987.tb02166.x, 1987.
Van Es, H. M., Sogbedji, J. M., and Schindelbeck, R. R.: Effect of manure application timing, crop, and soil type on nitrate leaching, J. Environ. Qual., 35, 670–679, https://doi.org/10.2134/jeq2005.0192, 2006.
Vanden Heuvel, R. M., Mulvaney, R. L., and Hoeft, R. G.: Evaluation of nitrogen-15 tracer techniques for direct measurement of denitrification in soil: II. Simulation studies, Soil Sci. Soc. Am. J., 52, 1322–1326, 1988.
Wang, C., Amon, B., Schulz, K., and Mehdi, B.: Factors that influence nitrous oxide emissions from agricultural soils as well as their representation in simulation models: a review, Agronomy, 11, 770, https://doi.org/10.3390/agronomy11040770, 2021.
Wangari, G., Mwanake, R. M., Houska, T., Kraus, D., Kikowatz, H.-M., Wolf, B., Gettel, G. M., Breuer, L., Ambus, P., Kiese, R., and Butterbach-Bahl, K.: Spatial-temporal patterns of foliar and bulk soil 15N isotopic signatures across a heterogeneous landscape: Linkages to soil N status, nitrate leaching, and N2O fluxes, Soil Biol. Biochem., 199, 109609, https://doi.org/10.1016/j.soilbio.2024.109609, 2024.
Well, R., Burkart, S., Giesemann, A., Grosz, B., Köster, J. R., and Lewicka-Szczebak, D.: Improvement of the 15N gas flux method for in situ measurement of soil denitrification and its product stoichiometry, Rapid Commun. Mass Sp., 33, 437–448, https://doi.org/10.1002/rcm.8363, 2019a.
Well, R., Maier, M., Lewicka-Szczebak, D., Köster, J.-R., and Ruoss, N.: Underestimation of denitrification rates from field application of the 15N gas flux method and its correction by gas diffusion modelling, Biogeosciences, 16, 2233–2246, https://doi.org/10.5194/bg-16-2233-2019, 2019b.
Winkhart, F., Mösl, T., Schmid, H., and Hülsbergen, K.-J.: Effects of organic maize cropping systems on nitrogen balances and nitrous oxide emissions, Agriculture, 12, 907, https://doi.org/10.3390/agriculture12070907, 2022.
Xu, C., Zhu, H., Liu, H., Ji, C., Yuan, J., Li, G., Wang, J., and Zhang, Y.: Patterns of crop-specific fertilizer-nitrogen losses and opportunities for sustainable mitigation: A quantitative overview of 15N-tracing studies, Soil Ecol. Lett., 6, 230206, https://doi.org/10.1007/s42832-023-0206-2, 2024.
Yankelzon, I., Schilling, L., Butterbach-Bahl, K., Gasche, R., Han, J., Hartl, L., Kepp, J., Matson, A., Ostler, U., Scheer, C., Schneider, K., Tenspolde, A., Well, R., Wolf, B., Wrage-Moennig, N., and Dannenmann, M.: Lysimeter-based full fertilizer 15N balances corroborate direct dinitrogen emission measurements using the 15N gas flow method, Biol. Fert. Soils, 61, 437–454, https://doi.org/10.1007/s00374-024-01801-4, 2024a.
Yankelzon, I., Willibald, G., Dannenmann, M., Malique, F., Ostler, U., Scheer, C., and Butterbach-Bahl, K.: A new incubation system to simultaneously measure N2 as well as N2O and CO2 fluxes from plant-soil mesocosms, Biol. Fert. Soils, 61, 1–19, https://doi.org/10.1007/s00374-024-01809-w, 2024b.
Zhang, J. B., Zhu, T. B., Cai, Z. C., Qin, S. W., and Müller, C.: Effects of long-term repeated mineral and organic fertilizer applications on soil nitrogen transformations, Eur. J. Soil Sci., 63, 75–85, https://doi.org/10.1111/j.1365-2389.2011.01410.x, 2012.
Zhang, Y., Zhao, J., Huang, X., Cheng, Y., Cai, Z., Zhang, J., and Müller, C.: Microbial pathways account for the pH effect on soil N2O production, Eur. J. Soil Biol., 106, 103337, https://doi.org/10.1016/j.ejsobi.2021.103337, 2021.
Zhou, M., Zhu, B., Brüggemann, N., Dannenmann, M., Wang, Y., and Butterbach-Bahl, K.: Sustaining crop productivity while reducing environmental nitrogen losses in the subtropical wheat-maize cropping systems: A comprehensive case study of nitrogen cycling and balance, Agr. Ecosyst. Environ., 231, 1–14, https://doi.org/10.1016/j.agee.2016.06.022, 2016.
Zistl-Schlingmann, M., Kwatcho Kengdo, S., Kiese, R., and Dannenmann, M.: Management intensity controls nitrogen-use-efficiency and flows in grasslands – a 15N tracing experiment, Agronomy, 10, 606, https://doi.org/10.3390/agronomy10040606, 2020.