the Creative Commons Attribution 4.0 License.
the Creative Commons Attribution 4.0 License.
 | 01 Oct 2025
Adaptation of methane-oxidizing bacteria to environmental changes: implications for coastal methane dynamics
Tim R. de Groot
Julia C. Engelmann
Pierre Ramond
Julia Dorigo
Judith van Bleijswijk
Global warming induces alterations in ocean temperature regimes, as well as in precipitation patterns. This leads to shifts in water column properties, which will increasingly impact coastal ecosystems. These changes may have profound implications for microbial communities such as methane-oxidizing bacteria (MOBs), which play a critical role in regulating methane fluxes and ecosystem dynamics. In this study, we investigate the resilience and adaptability of aerobic MOBs in response to changing environmental conditions. Microcosm incubations with waters from the North Sea and the Wadden Sea collected across different seasons and adjusted for methane availability, temperature, and salinity were used to assess how these factors shape MOB community structure and functional capacity. Our results reveal an increase in the relative abundance of MOBs to up to 57 % in experiments with elevated methane concentrations, highlighting the primary role of methane availability in MOB community development. Temperature and salinity variations, on the other hand, exerted lesser effects on MOB composition and relative abundance. A strong effect on MOB community development was furthermore caused by the origin of the inoculum (location and season). Our results thus suggest a functional redundancy in the variable pools of microbial inocula, enabling multiple MOB clades to cope with drastic changes in environmental parameters. The adaptability of MOB communities is key to understanding their role in mitigating methane emissions from coastal regions in a future ocean with potentially elevated methane and temperature and variable salinity levels.
- Article
(2118 KB) - Full-text XML
-
Supplement
(605 KB) - BibTeX
- EndNote


The impacts of global warming are anticipated to manifest in rising water temperatures and shifts in precipitation patterns, leading to fluctuations in salinity levels in the coastal ocean (Masson-Delmotte et al., 2021). Marine heatwaves are projected to increase in frequency, potentially exacerbated by factors such as ocean acidification and hypoxia (Collins et al., 2019). Elevated temperatures can accelerate methanogenesis in sediments, consequently increasing methane (CH4) availability in both oxic surface sediments and the water column. Once methane escapes to the atmosphere, it acts as a potent greenhouse gas (Etminan et al., 2016). While the majority of atmospheric methane originates from anthropogenic and natural, terrestrial sources (including inland aquatic systems), the coastal ocean is an important source of methane to the atmosphere too (Weber et al., 2019; Saunois et al., 2025). Yet, methane serves as the primary carbon source for aerobic methane-oxidizing bacteria (MOBs; Hanson and Hanson, 1996), which constitute the final sink for methane before its release from the ocean into the atmosphere (Reeburgh, 2007; Steinle et al., 2015; Mao et al., 2022; de Groot et al., 2024). Alterations in methane availability thus substantially influence MOB community dynamics and their ability to retain methane in sediments and the water column in future ocean scenarios (Reeburgh, 2007; Crespo-Medina et al., 2014; Knief, 2015; de Groot et al., 2024).
Canonical aerobic methane oxidation (MOx) involves two main steps: methane is firstly converted into methanol by methane monooxygenases and then is further oxidized to formaldehyde and finally to CO2 via either the ribulose monophosphate (RuMP) or the Serine pathway (Hanson and Hanson, 1996; Reeburgh, 2007):
Two primary groups of MOBs were classified: the first are type-I and type-X MOBs, and these consist of taxa from the phylum Gammaproteobacteria (Hanson and Hanson, 1996; Dedysh and Knief, 2018; Kalyuzhnaya et al., 2019). The second group, type-II MOBs, is composed of Alphaproteobacteria (Hanson and Hanson, 1996; Dedysh and Knief, 2018; Kalyuzhnaya et al., 2019; Haque et al., 2020). In addition, some members of the phylum Verrucomicrobiota (also referred to as type-III MOBs; Dedysh and Knief, 2018) can mediate MOx (Pol et al., 2007). A distinct group, Candidatus Methylomirabilis, expresses the canonical MOx pathway but uniquely converts nitric oxide into oxygen and nitrogen before oxidizing methane (Ettwig et al., 2009, 2010).
In marine ecosystems, the most important MOBs are type-I MOBs, represented by taxa such as Methylococcus and Methylomonas; these are generally more dominant than type-II MOBs such as Methylocystis and Methylosinus (Hanson and Hanson, 1996; He et al., 2012; Knief, 2015; Steinle et al., 2016). The specific mechanisms driving the selection between type-I and type-II MOBs remain unclear. Nevertheless, it has been suggested that type-I MOBs are better adapted to low methane levels, while type-II MOBs may thrive in environments with high methane concentrations (Hanson and Hanson, 1996). This hypothesis is supported by recent environmental observations (Henckel et al., 2000; Macalady et al., 2002; Bodelier and Laanbroek, 2004; Kessler et al., 2011; He et al., 2012). However, this scenario likely applies to environments already characterized by high methane concentrations. Knief and Dunfield (2005) found that type-II MOBs (belonging to Methylocystaceae) demonstrated a higher potential for remaining active at low methane levels.
In addition to methane concentrations, the availability of copper and iron, essential components in the reaction centres of the soluble and particulate methane monooxygenase (sMMO and pMMO), respectively, may also influence enzyme expression and activity and, consequently, the community structure of MOBs. For instance, under copper limitation, pMMO expression has been found to decrease compared to sMMO (Murrell, 2010).
Other bacterial strains have been classified as potential MOBs due to their close genetic resemblance to canonical MOBs and/or apparent MOx activity. However, their status as obligate or facultative MOBs and/or their potential syntrophic associations with MOBs often remain ambiguous. For instance, a Methyloceanibacter strain expresses sMMO and was found to mediate MOx, while other strains exhibit alternative metabolic behaviours (Vekeman et al., 2016). Also, some MOBs belonging to the family Beijerinckiaceae were found to metabolize C compounds other than methane (Knief, 2015; Kox et al., 2019; Haque et al., 2020).
The detection and quantification of MOBs in marine environments are challenging due to their typically low abundance and the absence of reliable, MOB-specific molecular markers (Tavormina et al., 2011; Knief, 2015). For example, pMMO primers were found to miss a substantial fraction of methanotrophs (Tavormina et al., 2011; Ghashghavi et al., 2017). Incubation-based methods, on the other hand, offer means for enriching MOBs, allowing us to identify potentially novel MOBs and to determine their ecological roles and metabolic capabilities (Ho et al., 2014, 2018; Li et al., 2021). However, inherent “bottle effects” (Zobell, 1943; Herlemann et al., 2019) may result in the preferential selection of MOBs that are not representative of the original MOB population. Bottle effects arise from (slight) differences between incubation conditions and environmental parameters in situ, e.g. differences in macronutrient (i.e. methane) and micronutrient levels (e.g. trace metals), as well as physicochemical parameters such as temperature and salinity (Ho et al., 2018; de Groot et al., 2023; Zhang et al., 2023). Also, (small) differences in the microbial community of the inoculate caused by stochastic processes during sampling and aliquoting can affect the abundance, presence, or absence of rare organisms disproportionately, adding to bottle effects. Nevertheless, such approaches hold great promise in identifying MOBs across ecosystems.
The future ocean will undoubtedly be impacted by climate change, but the potential of the ocean's microbiome for adaptation to changing methane dynamics remains unconstrained. In this study, we conducted in vitro microcosm experiments with coastal waters to investigate how MOB communities respond to variations in methane availability, temperature, and salinity levels. We also aimed to assess whether these environmental factors or the origin of the microbial inoculum select for distinct communities and whether environmental MOB communities exhibit functional redundancy.
The composition of methanotrophic microbes was investigated in microcosms, which were inoculated with concentrated microbial biomass obtained from the water column. The North Sea inocula originated from two water depths and two seasons, while the Wadden Sea inocula originated from one water depth and four seasons. We adjusted physicochemical parameters (CH4 availability and temperature in incubation setups with both North Sea and Wadden Sea inocula and salinity in Wadden Sea incubations only), and the microbial communities in the different incubations were compared to each other, as well as to the microbial communities in the original environmental samples.
2.1 Site description and sampling
In the North Sea, particulate organic matter (POM) suspended in the water column was collected at depths of 10 and 35 m during two research cruises with RV Pelagia, conducted in summer and late autumn, respectively (de Groot et al, 2024). Samples were obtained every 4 h using McLane in situ pumps (WTS-LV) equipped with glass fibre filters (142 mm, 0.3 µm nominal mesh size, Advantec MFS), with approximately 100 L of seawater being continuously filtered during each sampling event. A total of 24 environmental samples (12 from each depth) were collected in summer, and 22 samples (11 from each depth) were collected in autumn.
Similarly, POM suspended in the water column of the Wadden Sea was collected during cruises with RV Navicula across different seasons: winter, spring, summer, and autumn (de Groot et al., 2023). Sampling was conducted every 4 h at 1 and 3 m depths, except during summer when POM was only collected from 1 m depth. Glass fibre filters (142 mm, 0.3 µm nominal mesh size, Advantec MFS) or polycarbonate filters (142 mm, 0.22 µm nominal pore size, Sterlitech) were used for filtration of 3 L of sea water per sampling event. A total of 25 water column samples were collected in winter, spring, and autumn, while 12 samples were collected in summer.
Following filtration, filters were cut into halves. One half was stored at −80 °C for molecular analysis of the original microbial community (de Groot et al., 2023, 2024), while the other half was combined with local seawater in a 5 L canister to concentrate microbial biomass (referred to as “filter soup”). The filter soups thus contained an enrichment of water column microbes: the concentration was roughly 1:100 for the North Sea and 1:10 for the Wadden Sea. The filter soup was maintained at 4 °C without additional methane amendment and was used for setting up lab incubations (see Sect. 2.2).
During each Wadden Sea cruise, we also collected surface sediments with a box corer at the same site where we collected water column samples (de Groot et al., 2023). Four subsamples of the sediment surface were scraped off with sterile spatulas and frozen at −20 °C until DNA extraction (sediment subsamples were processed individually). Similarly, sediment samples were recovered from the North Sea (de Groot et al., 2024).
2.2 Lab incubations
The impact of methane levels, temperature, and salinity on the structure of MOB communities was investigated in microcosms with North Sea or Wadden Sea inoculae, which were established in triplicate for each parameter. For this, we removed the filter halves from the filter soup canister and placed them on aluminium foil. Immediately, the filter surface (with remaining microbes) was scraped off with a flamed razor blade, and the remaining filter material was discarded. After all filters were scraped off, the filter soup was homogenized by stirring and shaking. Then, 60 mL of filter soup was dispensed into 160 mL borosilicate glass bottles. These bottles were sealed with black butyl stoppers and crimp-top sealed before adjusting the headspace methane concentrations, salinity levels, and temperature. All bottles were kept standing during incubations and manipulations to avoid contact of the aqueous phase with the stoppers as this can have adverse effects on methanotrophs (Niemann et al., 2015).
For both North Sea and Wadden Sea incubations, standard conditions consisted of 5 % methane in the headspace gas phase, a temperature of 25 °C, and in situ salinity levels for the North Sea of 35 psu and of either 15 or 35 psu (according to the season; see below) for the Wadden Sea incubations (Table 1). Variations from these standard conditions included incubations with methane concentrations of 0.1 % and 1 % in the headspace at 25 °C and incubations at different temperatures (15 and 30 °C) with 5 % headspace methane. In total, the number of incubation setups with filter soup from the North Sea was 31 (summer) and 36 (autumn). For setups using Wadden Sea water, the total number of incubations was 24 each for winter, spring, summer, and autumn.
Table 1Setup of microcosm incubations from North Sea (NS) and Wadden Sea (WS) samples. All microcosms were set up in triplicates. Note: standard conditions are defined as 25 °C, 5 % headspace methane, and a salinity level of 35 psu (NS). In the WS, baseline salinity levels were 20 psu for autumn (A) and winter (W) and 30 psu for spring (Sp) and summer (Su). For NS incubations, salinity was not a variable parameter. Please note that n/a denotes not applicable.
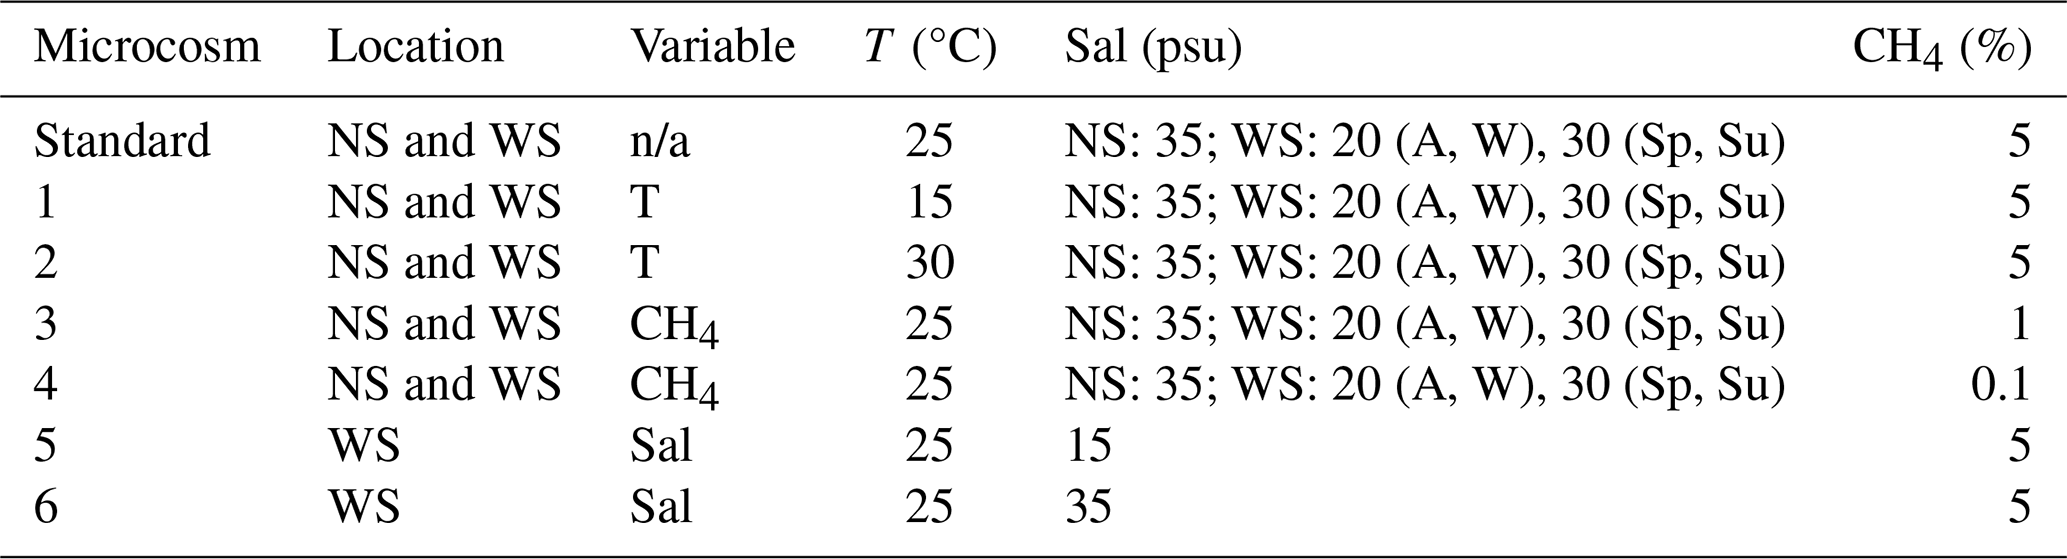
The higher number of incubations for the Wadden Sea is due to the additional treatments applied, which were designed to explore the effects of different salinity levels (15 and 35 psu) at 25 °C. The Wadden Sea salinity can change rapidly due to evaporation, precipitation, and runoff (de Groot et al., 2023). Initially, the salinity of the Wadden Sea inoculum was measured and adjusted with Milli-Q water to establish baseline salinities of 30 psu for summer and spring samples and 20 psu for winter and autumn samples, closely reflecting in situ salinity conditions (de Groot et al., 2023). Separately, filtered Wadden Sea water (0.3 µm nominal mesh size, Advantec MFS) was subjected to controlled evaporation by boiling on a heater plate until a salinity of 100 psu was reached. To achieve the desired final salinity levels of 15 and 35 psu in a total volume of 60 mL, we mixed specific volumes of brine, Milli-Q water, and inoculum as follows: for a final salinity of 35 psu in spring and summer incubations, 16.5 mL of 100 psu brine was first mixed with 28.5 mL of Milli-Q water and then with 15 mL of the 30 psu inoculum. Similarly, for autumn and winter incubations, 18 mL of 100 psu brine, 27 mL of Milli-Q water, and 15 mL of the 20 psu inoculum were mixed. For a final salinity of 15 psu in spring and summer incubations, 4.5 mL of 100 psu brine, 40.5 mL of Milli-Q, and 15 mL of the 30 psu inoculum were mixed, while, for autumn and winter, 6 mL of 100 psu brine, 39 mL of Milli-Q water, and 15 mL of 20 psu inoculum were mixed.
After all incubations were set up, triplicates of microcosms were amended with 5 % methane and immediately terminated at time point zero (t0) to serve as reference points for comparing the community composition at final time points (tn). Note that only single incubations were set up for North Sea summer t0. Headspace methane concentrations were monitored weekly within each incubation using gas chromatography with flame ionization detection as described previously (de Groot et al., 2023). Oxygen concentrations were monitored in one replicate of selected treatments using a PyroScience PICO-O2 meter and OXSP5-SUB sensor spots. Oxygen concentrations never dropped below 53 % saturation (Tables S1 and S2 in the Supplement). Concentrations of other electron acceptors, as well as nutrients, were not measured. Once headspace methane concentrations were at least 10 % lower than the initial methane level (typically after 25 to 84 d of incubations; see Tables S1 and S2), incubations were terminated by opening the vials and filtering the liquid phase over a glass fibre filter (25 mm, 0.3 µm nominal mesh size, Advantec MFS). The filter was then stored at −80 °C for microbial community analysis.
2.3 DNA extraction and 16S rRNA gene amplicon library preparation
DNA was extracted from particulate organic matter collected on filters and sediment core tops using the DNeasy PowerSoil Pro Kit (Qiagen). DNA extracts were stored at −20 °C until further analysis. SSU V4–V5 region amplification was performed in triplicate in a mix of Phusion polymerase (0.25 µL), 5X HF PCR buffer (5 µL), BSA (20 mg mL−1: 1 µL), the universal primer pair 515F (CCGYCAATTYMTTTRAGTTT; Parada et al., 2016) and 926R (GTGYCAGCMGCCGCGGTAA; Quince et al., 2011) targeting the V4 and V5 hypervariable regions (concentration of both primers was 10 µM, 1.5 µL added), dNTPs (deoxynucleotide triphosphates; 2.5 µM; 2 µL), DNA extract (1 µL), and PCR water (12.75 µL). The PCR programme consisted of 5 min initial DNA denaturation at 98 °C, followed by 26 cycles of 98 °C for 10 s, 58 °C for 20 s, 72 °C for 30 s, and a final elongation of 72 °C for 10 min; after this, complete samples were stored at 5 °C. The 16S rRNA products (∼ 400 bp including unique Golay barcodes on forward and reverse primers) were gel purified, and further library preparation, pooling, and Illumina MiSeq 2 × 300 sequencing were done as described previously (Vaksmaa et al., 2021).
The newly obtained 16S rRNA gene amplicon sequences from incubation experiments and environmental samples (ENA project no. PRJEB85600) were analysed collectively with previously published sequences from the North Sea and Wadden Sea cruises (PRJEB76184; de Groot et al., 2024). All analyses were performed collectively using the NIOZ in-house pipeline Cascabel (Abdala Asbun et al., 2020). In short, prior to amplicon sequence variant (ASV) identification, reads were truncated to 260 and 200 bp for forward and reverse reads, respectively. ASV designation was done using DADA2 v.1.19.1 (Callahan et al., 2016). Identification by consensus across samples was used to identify chimeras, and sequence variants identified as chimeric were removed. Taxonomies were assigned using DADA2's native implementation of the naïve Bayesian classifier method RDP using the Silva v138.1 release as a reference database and a minimum bootstrap value of 50. MOBs were identified based on the taxonomic classifications as reviewed previously (Dedysh and Knief, 2018; Kalyuzhnaya et al., 2019; Haque et al., 2020; see Table S1). That is, we considered all genera of the families Methylomonadacea, Methylococcaceae, and Methylohalobiaceae and selected genera of the families Beijerinckiaceae, Methyloligellaceae, Methylacidiphilaceae, and Methylomirabilaceae as MOBs.
2.4 Bioinformatics and statistical analysis
2.4.1 Preprocessing of microbial abundance data
ASVs that were taxonomically annotated to originate from organelles, i.e. chloroplast or mitochondrial DNA, were removed from the ASV table. ASVs without annotation at the domain level and ASVs annotated as eukaryotic sequences were also removed. After inspecting negative control samples, we subtracted two counts from each ASV in each sample to account for spurious counts caused by contamination. Singletons – that is, ASVs with an abundance lower than 2 – were excluded from further analyses. We further removed ASVs annotated as common skin microbiome genera: Enhydrobacter, Cutibacterium, Staphylococcus, Pseudomonas, Acinetobacter, Corynebacterium, Listeria, Staphylococcus, Escherichia-Shigella, and members of the family Neisseriaceae. The final dataset consists of 27 012 ASVs in 318 samples with a sequencing depth of 58 690 (mean) or 41 805 (median) counts per sample.
2.4.2 Nonparametric multidimensional scaling (NMDS)
ASV read counts from incubation and environmental samples were first square root transformed and then standardized with double Wisconsin transformation. To reduce clustering artefacts caused by ASVs with excessive zero values, we included only ASVs that were present (non-zero values) in ≥ 5 % of the samples, thereby minimizing the influence of rare or sporadically observed ASVs. A Bray–Curtis dissimilarity matrix was then calculated based on the transformed and filtered abundance data, quantifying the dissimilarities in microbial community composition between samples (“vegdist” function from R package “vegan”). Nonparametric multidimensional scaling (NMDS) analysis was performed on the Bray–Curtis dissimilarity matrix using the metaMDS function from the vegan package version 2.6–6.1 (Dixon, 2003). The resulting plot (Fig. 3) represents the samples as points in a two-dimensional coordinate space where the distances between points reflect the extent of dissimilarity in terms of bacterial community composition, resembling true dissimilarities as closely as possible. A second NMDS was performed on a subset of ASVs classified as MOBs (Fig. 4). For this analysis, we included only ASVs annotated at the genus level. We kept the relative abundances (Wisconsin-standardized counts) of MOB ASVs that were computed based on the whole community so that the dissimilarity also takes into account the differences in the variability of the total relative abundance of MOBs in the microbial community across samples. The stress values of these two NMDS ranged between 0.09 and 0.16, suggesting that most of the Bray–Curtis dissimilarity could be represented in a two-dimensional ordination plot.
2.4.3 Differential abundance analysis
ASV counts were summed up at the genus level for differential abundance analysis. ASVs that could not be classified at the genus level were clustered at the most specific taxonomic level available. Differential abundance analysis was then conducted using the “DESeq2” package version 1.38.1 (Love et al., 2014) within R. After adding a pseudo-count of 1, dispersions were estimated using the “local” fit type. The generalized linear model (glm) included methane (0.1 %, 1 %, 5 %), season (WS: spring, summer, autumn, winter; NS: summer, autumn), temperature (15, 25, 30 °C), and salinity (WS only: 15, 20, 30, and 35 psu). Generalized linear models were computed and analysed separately for the Wadden Sea and North Sea to account for differences in the experimental design. Differential abundance across incubation conditions was tested with the Wald significance test and using the t distribution as the null model. DESeq2 tests the null hypothesis that changes of a given parameter (e.g. methane availability) do not lead to changes in microbial community structure. We tested the different incubation settings against 0.1 % as a reference level for methane, 15 °C for temperature, and summer for the seasons. Methane levels in t0 samples were set to 0.1 % as this approximately reflects the in situ conditions. Log2 fold changes were moderated with the “ashr” method (Stephens, 2017), and the false-discovery rate (FDR) was used to adjust p values for multiple testing. We then selected MOB genera and the family Methylomonadaceae (Methylomonadaceae ASVs without genus taxonomy assignment; see Table S1) for downstream analyses. The base mean indicates the average abundance of a genus across all incubation samples, including t0 samples. Further analyses focused on MOBs with a base mean value of at least 10. Genera with an FDR (adjusted p value) of less than 0.05 were considered to be significantly different in their abundance across conditions.
3.1 General patterns in MOB diversity and abundance
The diversity and abundance of MOBs in incubations subjected to varying abiotic conditions (Figs. 1 and 2) were compared both among treatments and against the original environmental samples (Figs. S1 and S2). MOBs were consistently detected in environmental seawater samples, except in the North Sea surface waters during summer (de Groot et al., 2024) and at several time points during spring in the Wadden Sea. In total, we identified eight MOB genera and additional members of the Methylomonadaceae and Methylacidiphilaceaeae that we could not assign to the genus level (Figs. S1 and S2). MOBs were also consistently observed at the beginning and end of all incubation experiments regardless of the origin of the inocula (i.e. water depth, season, or sampling area) and incubation conditions (Figs. 1 and 2). In total, we identified 12 different MOB genera in incubation experiments (all present in the Wadden Sea and eight present in the North Sea incubations) and additional members of the Methylomonadaceae that we could not assign to the genus level. However, substantial differences were observed in the community composition and abundance of MOB genera. While this was, in some cases, consistent for distinct conditions, we also found notable variation between replicates in other instances (Figs. 1 and 2), as described below. Furthermore, we frequently detected high abundances of MOB groups at the end of the incubations that were below the detection limit at t0.
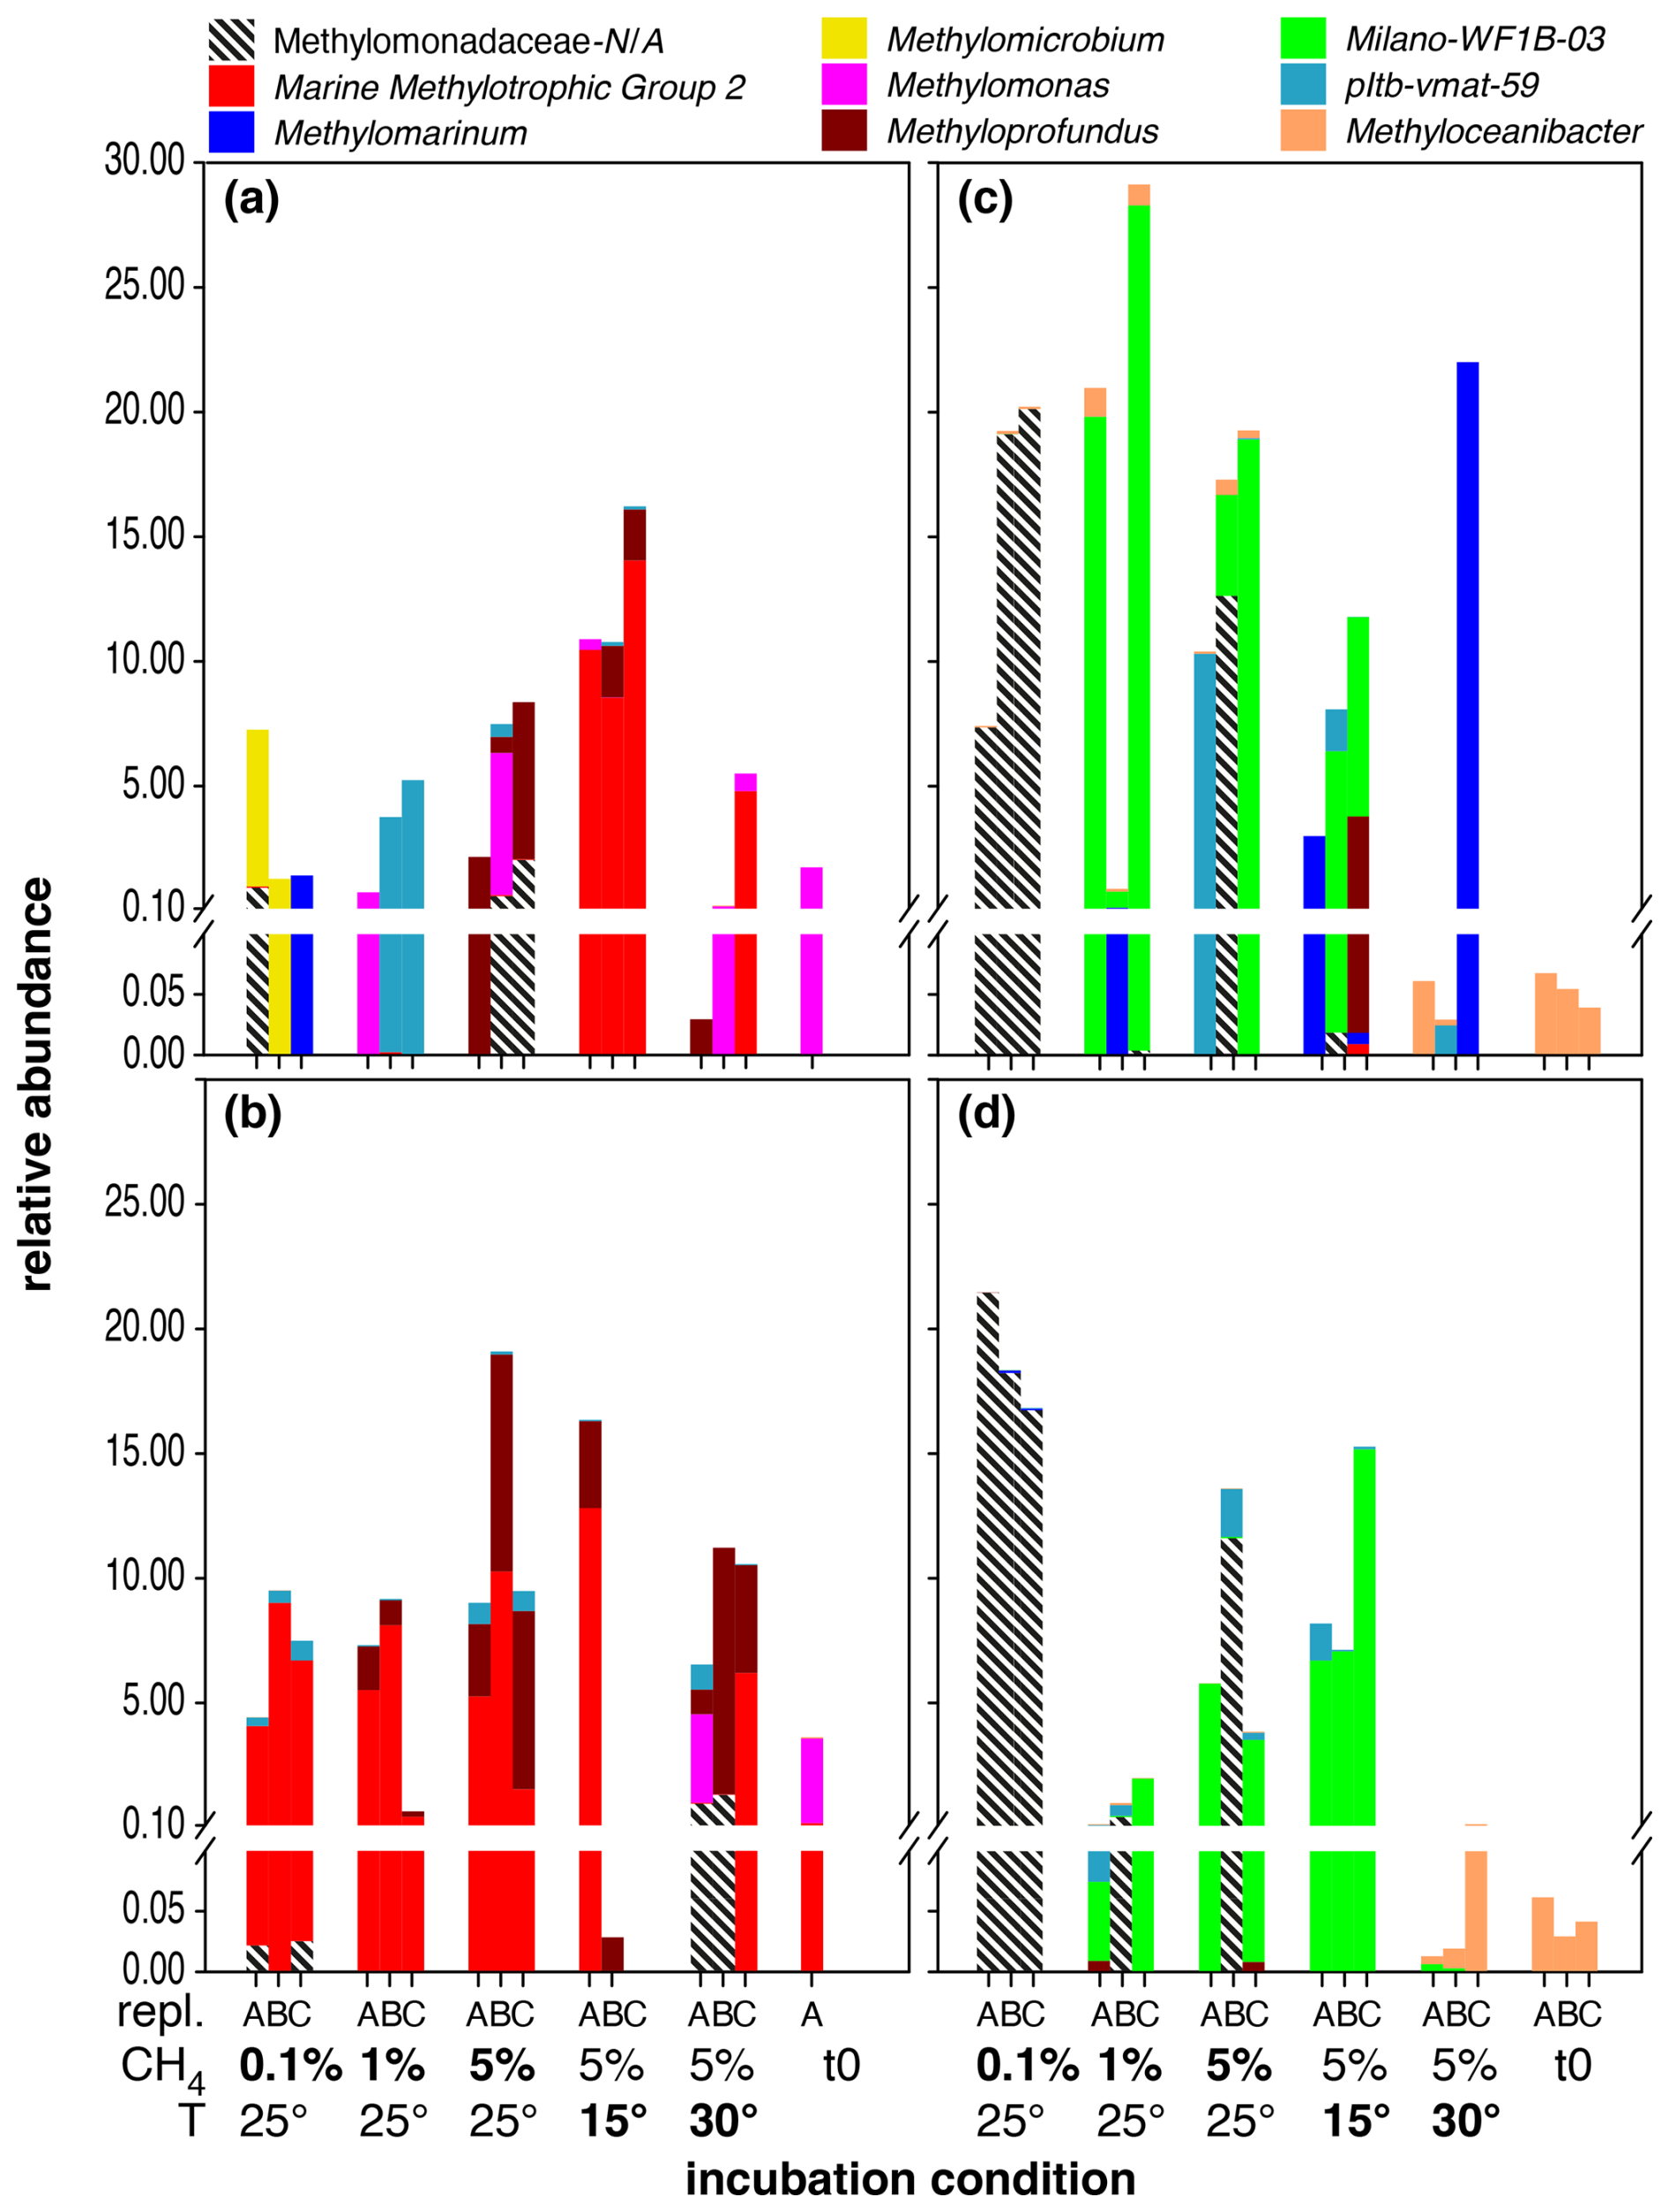
Figure 1Distribution of MOB genera in microcosm incubations with North Sea inocula sampled during summer at depths of 10 m (a) and 35 m (b), as well as during autumn at 10 m (c) and 35 m water depth (d). Each set of bars represents microcosm incubations conducted in triplicate (labelled A, B, C) under varying conditions, as indicated on the x axis: starting conditions (t0), methane head space concentrations (%), and temperature (°C). Baseline conditions were set to methane headspace concentrations at 5 % and temperature at 25 °C. Salinity was 35 psu in all incubations. All deviations in methane headspace concentrations or temperature are indicated in bold-face type. Note that sequence abundances in the sub-percent range should be interpreted with caution and considered only in terms of presence or absence due to the stochastic variation inherent in 16S rRNA gene amplicon sequencing and PCR amplification. The figure is intended for colour viewing.
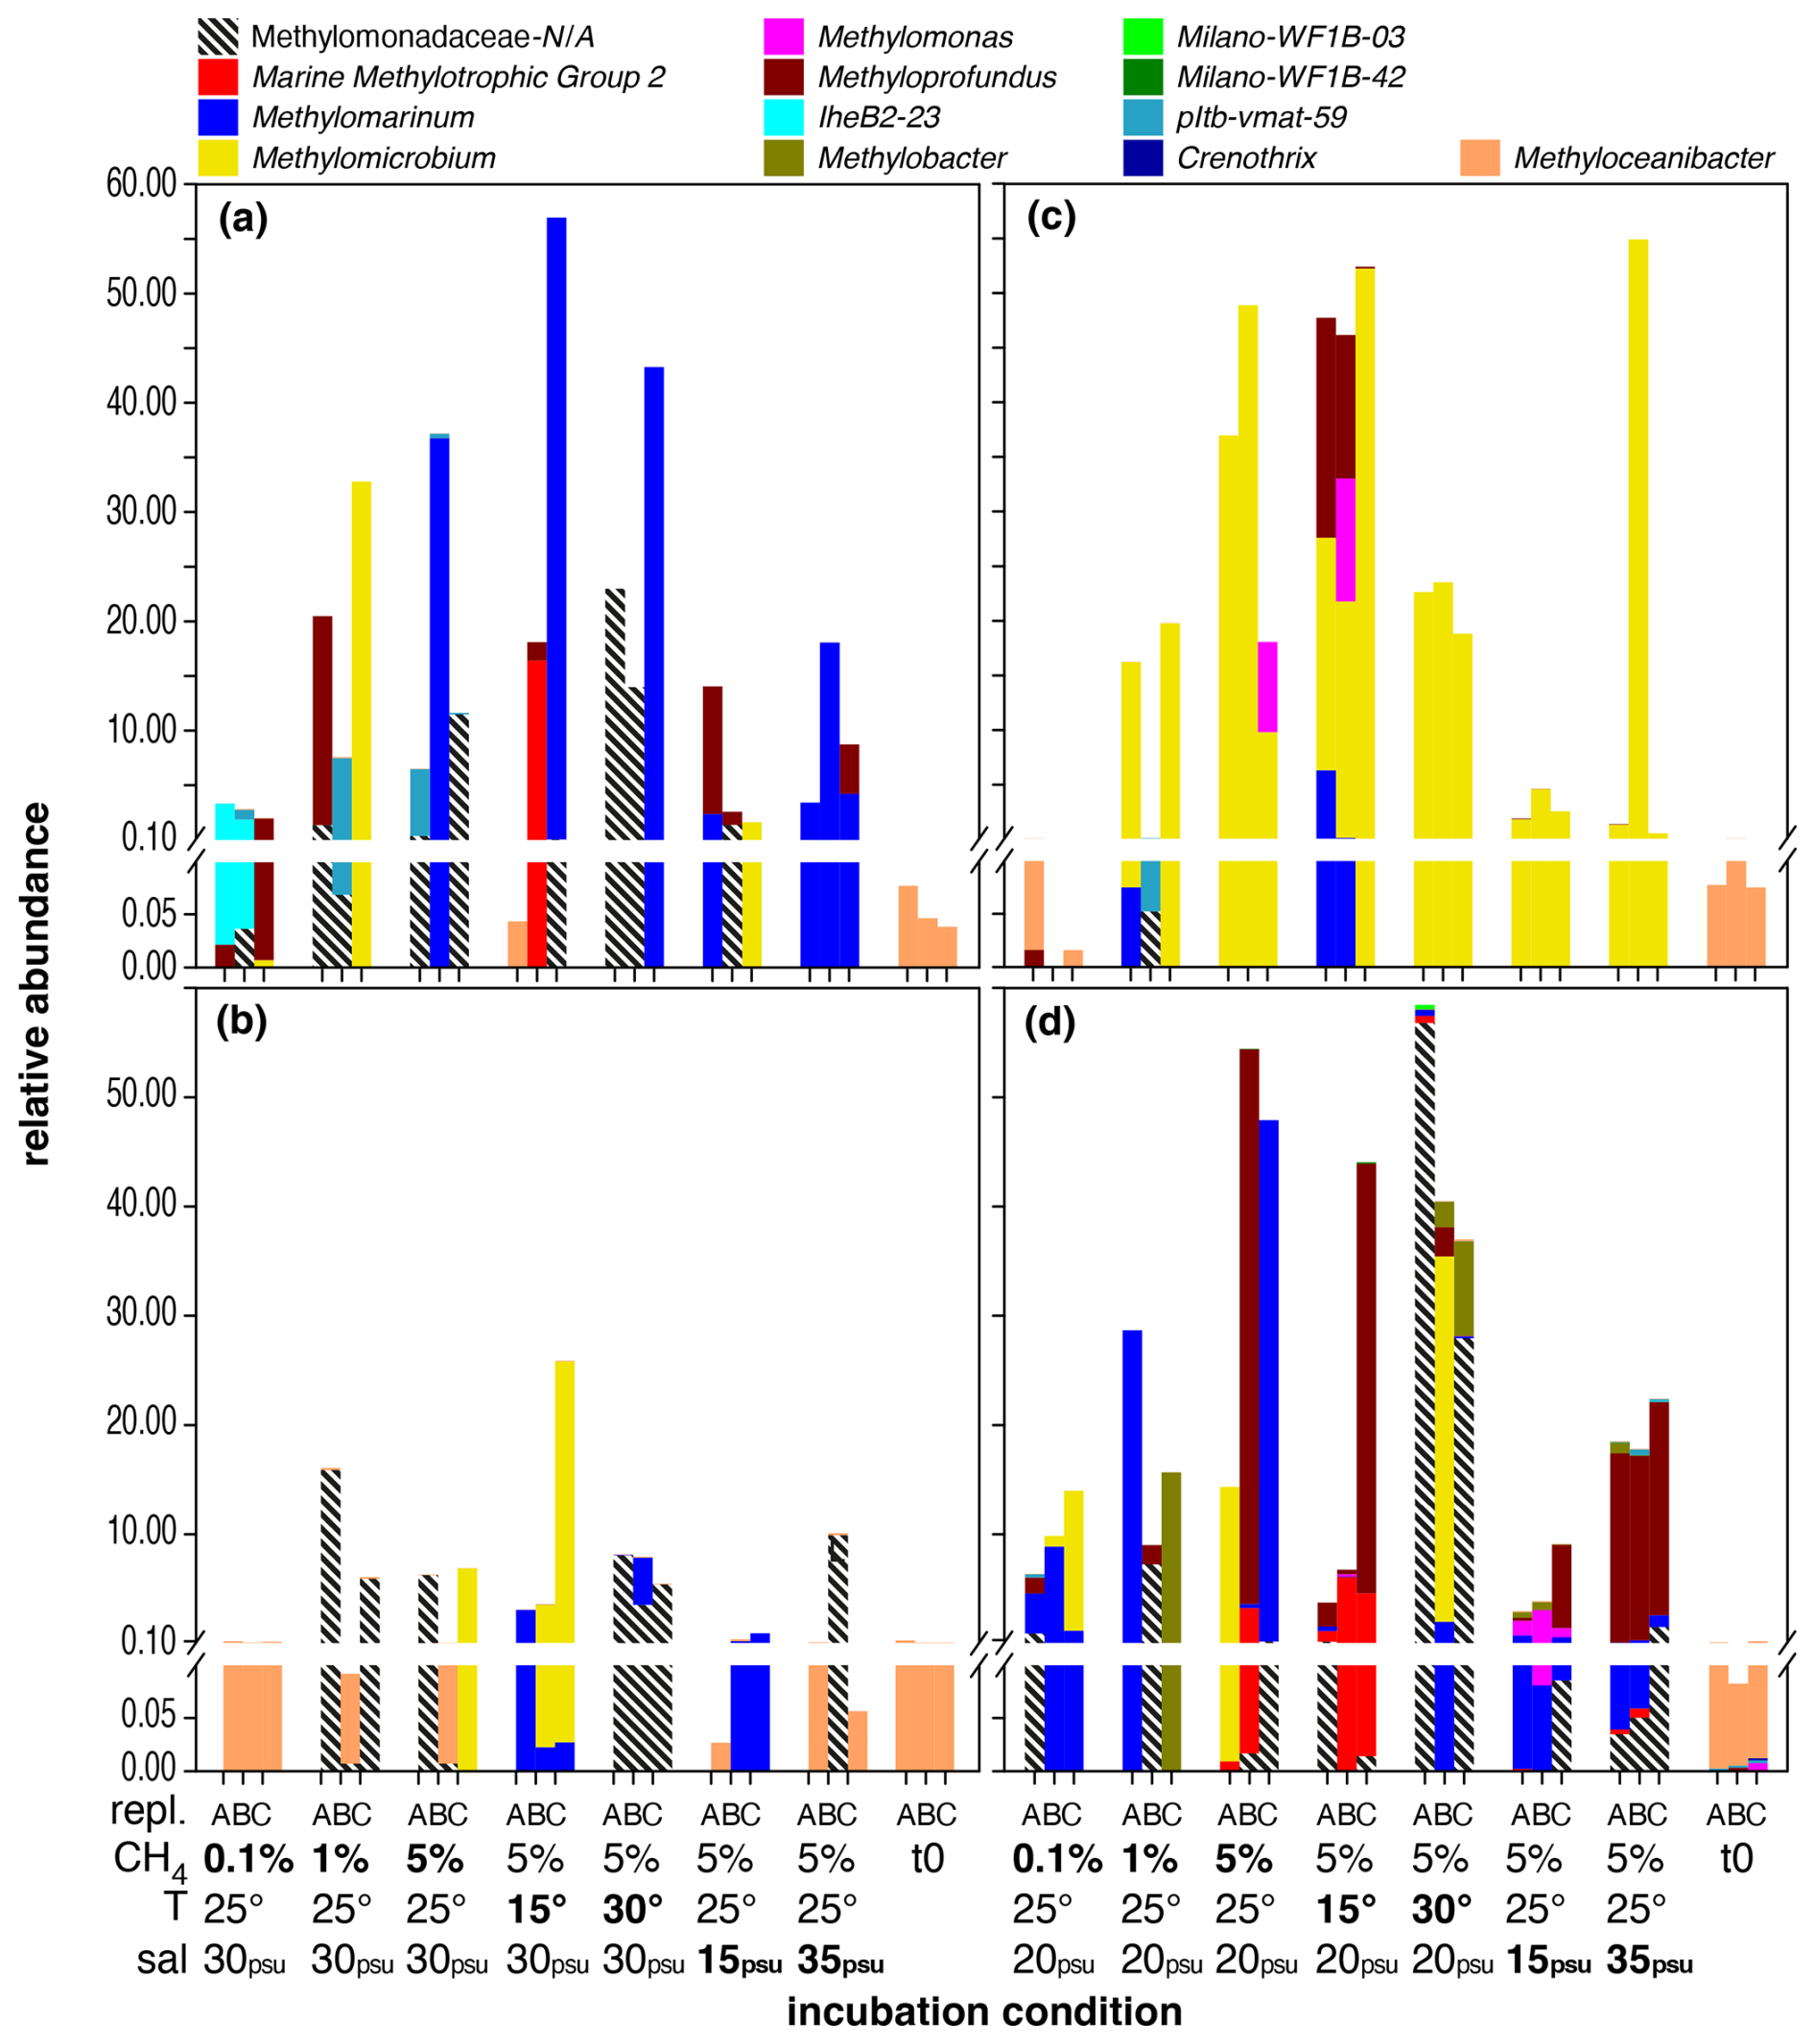
Figure 2Distribution of MOB genera in microcosm incubations with Wadden Sea inocula sampled in spring (a), summer (b), autumn (c), and winter (d). Each set of bars represents microcosm incubations conducted in triplicate (labelled A, B, C) under varying conditions, as indicated on the x axis: starting conditions (t0), methane head space concentrations (%), temperature (°C), and salinity (psu). Baseline conditions were 5 % methane headspace concentrations, 25 °C, and 30 psu (spring, summer) or 20 psu salinity (autumn, winter). All deviations in methane headspace concentration, temperature, or salinity are indicated in bold-face type. Note that sequence abundances in the sub-percent range should be interpreted with caution and considered only in terms of presence or absence due to the stochastic variation inherent in 16S rRNA gene amplicon sequencing and PCR amplification. The figure is intended for colour viewing.
3.2 North Sea
3.2.1 Diversity and abundance of methanotrophs in microcosms
Summer
Methanotrophs in the inoculum from the North Sea sampling (t0 incubations) in summer and at 35 m water depth were predominantly composed of type-I MOBs of the Methylomonas genus, with minor admixtures of Marine Methylotrophic Group 2 (MMG2) (Fig. 1). In these incubations, MMG2 was the most dominant group independent of incubation conditions. Nevertheless, we also detected elevated levels of Methyloprofundus in incubations with higher methane levels (5 % at 25, 15, and 30 °C). MOB diversity was generally higher in incubations with a surface inoculum. In contrast to deep waters, MMG2 was dominant in incubations carried out at higher methane levels (5 %) but only at 15 and 30 °C. Surface incubations carried out at low methane levels (0.1 %) were heterogenous and dominated by either Methylomicrobium or Methylomarinum, while incubations at 1 % headspace methane levels were dominated by either Methylomonas or members of the pltb-vmat-59 group. At higher methane levels (5 %) and at 25 °C, samples were dominated by either Methyloprofundus or Methylomonas. Methyloceanibacter was the only (potential) type-II MOB detected, more frequently in deep-water samples but generally at very low relative abundances of typically < 10−4, though this group was dominant in the original water column samples (Fig. S1).
Autumn
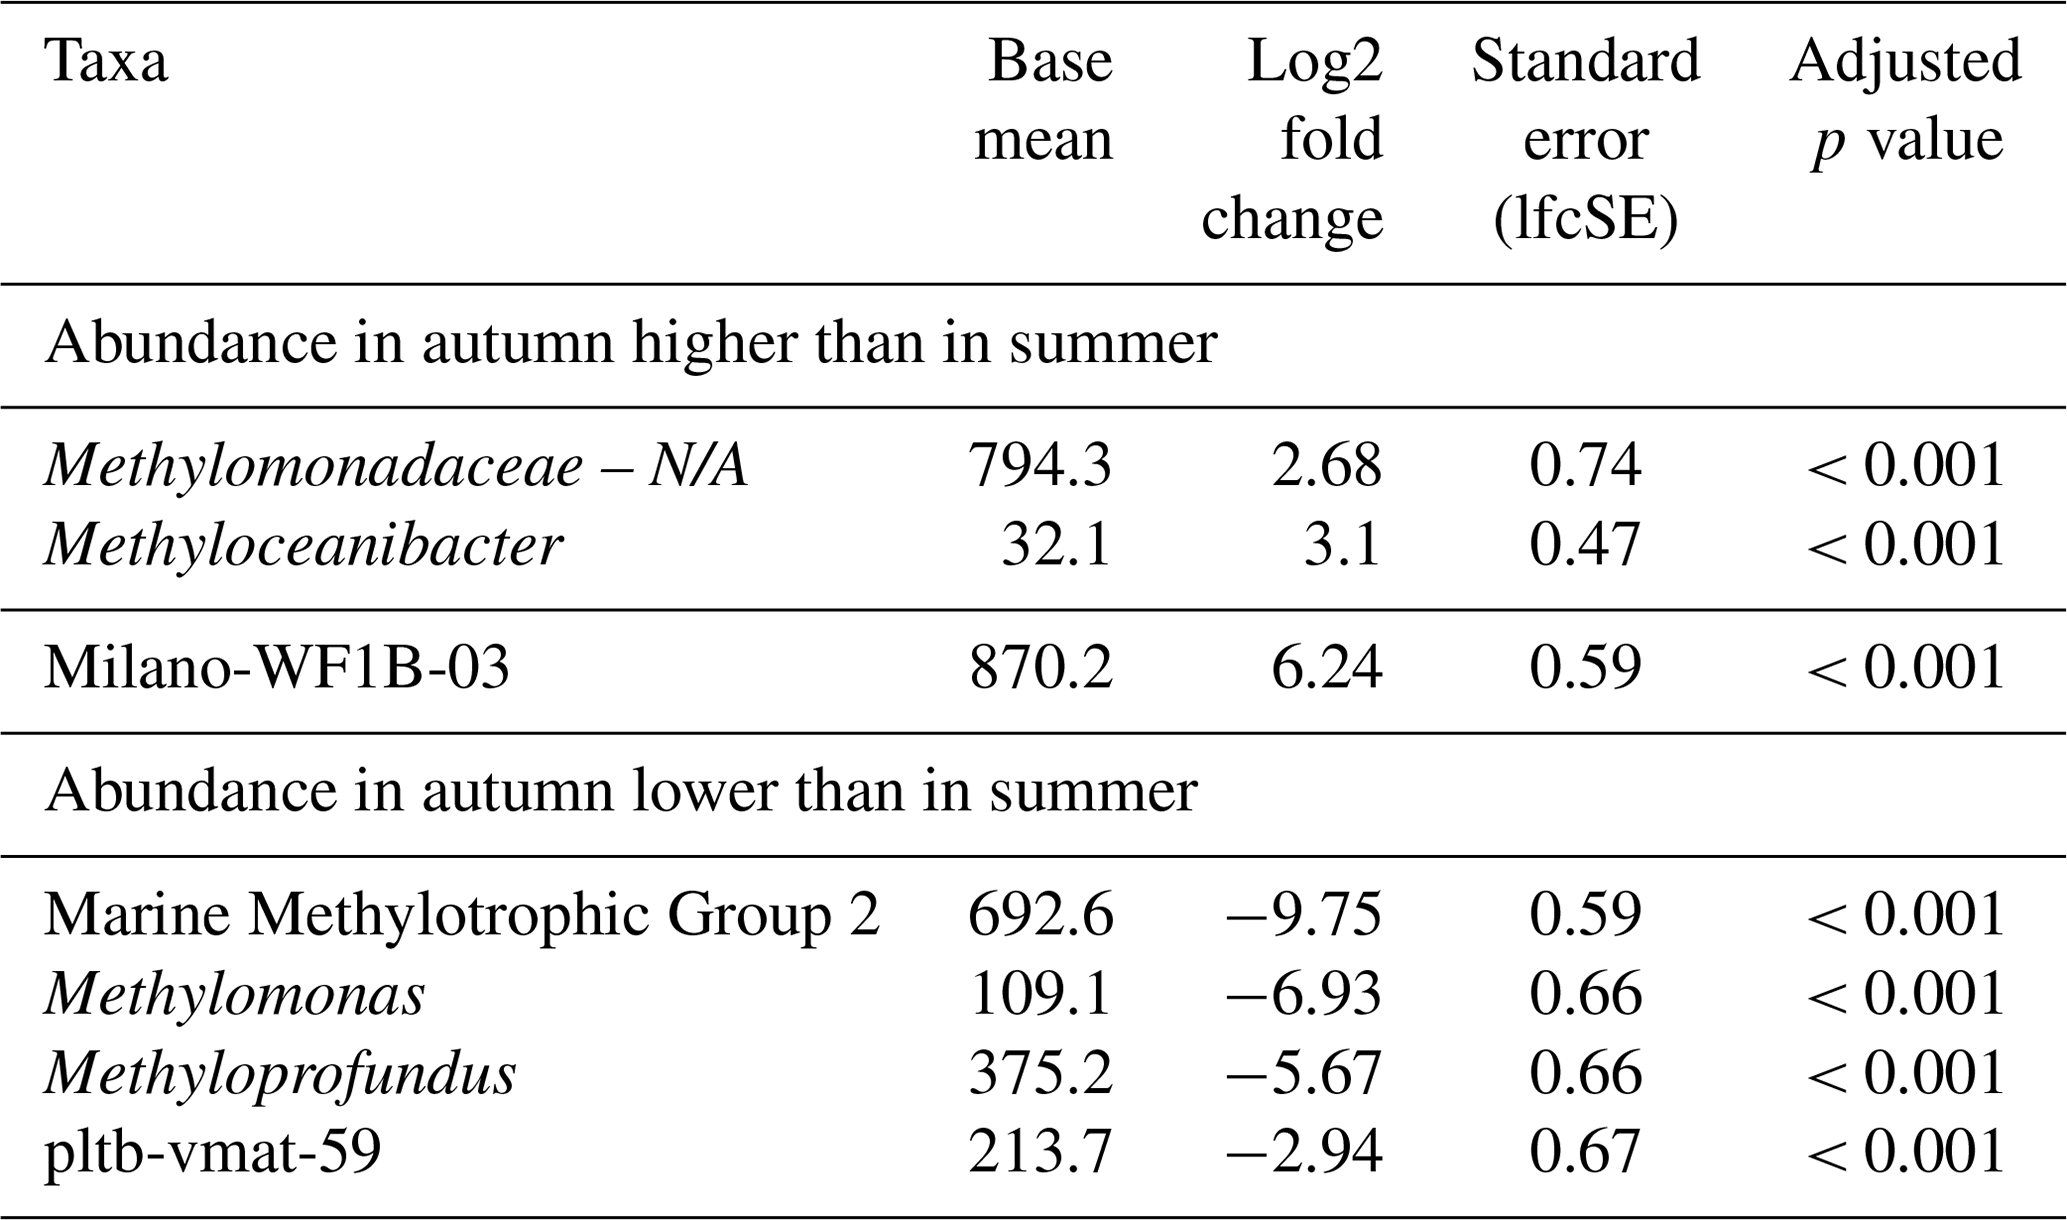
The composition of the MOB community in microcosms with inocula from the autumn sampling campaign was notably different when compared to summer (Fig. 1, Table 2). All t0 incubations only contained Methyloceanibacter as the sole potential MOB, though its abundance was low, ranging between 0.05 % and 0.1 %. Furthermore, we found high abundances of unassigned Methylomonadaceae that predominated incubations form both water depths with 0.1 % methane headspace levels. Unassigned Methylomonadaceae also dominated single replicates in incubations with 5 % methane headspace levels at 15 °C. However, the other replicates at these conditions were dominated by members of the Milano-WF1B-03 group (35 m water depth) or Milano-WF1B-03 together with pltb-vmat-59 (10 m water depth). In incubations with deep-water inocula, Milano-WF1B-03 was also predominant in incubations with 5 % methane headspace concentrations; at the surface, only two replicates of these incubation conditions were dominated by Milano-WF1B-03, while Methylomarinum and Methyloprofundus were important genera too. Methylomarinum also dominated one replicate of incubations at 30 °C and 5 % methane with surface water inocula, while the remaining two replicates were dominated by members of the pltb-vmat-59 group or Methyloceanibacter. Methyloceanibacter was also dominant in incubations at 30 °C and 5 % methane with a deep-water inoculum. In general, abundances of unidentified Methylomonadaceae, Methyloceanibacter, and Milano-WF1B-03 were higher in autumn when compared to summer, while MMG2, Methylomonas, Methyloprofundus, and pltb-vmat-59 were less abundant (Table 2).
Table 2Differential abundance of MOB genera in incubations with North Sea inocula from autumn and summer samples. “Standard error (lfcSE)” denotes the standard error of the log2 fold change estimate. “Adjusted p values” indicates the false-discovery rate. Log2 fold changes indicate abundance differences between incubations with inocula from autumn and summer. The base mean refers to the mean normalized count as provided by DESeq2. Please note that N/A denotes not assigned.
3.2.2 Effects of methane concentrations and temperature on methanotroph communities in microcosms
Methane
MOB variability within treatments was high across incubations with different methane levels. MOB abundances were typically higher at higher methane concentrations and incubation temperatures < 30 °C (Figs. 1 and S3, Table 3). The lower MOB abundance in incubations at 30 °C was especially pronounced in incubations with an inoculum from 35 m water depth recovered in autumn (Fig. 1). However, no distinct MOB group consistently dominated across all water depths and seasons at a specific methane headspace level.
Table 3Differential abundance of methanotrophs in incubations with North Sea inocula, comparing the effects of different headspace methane concentrations independent of the season. Log2 fold changes indicate abundance differences between incubations with varying methane levels. The base mean refers to the mean normalized count as provided by DESeq2. Please note that N/A denotes not assigned.
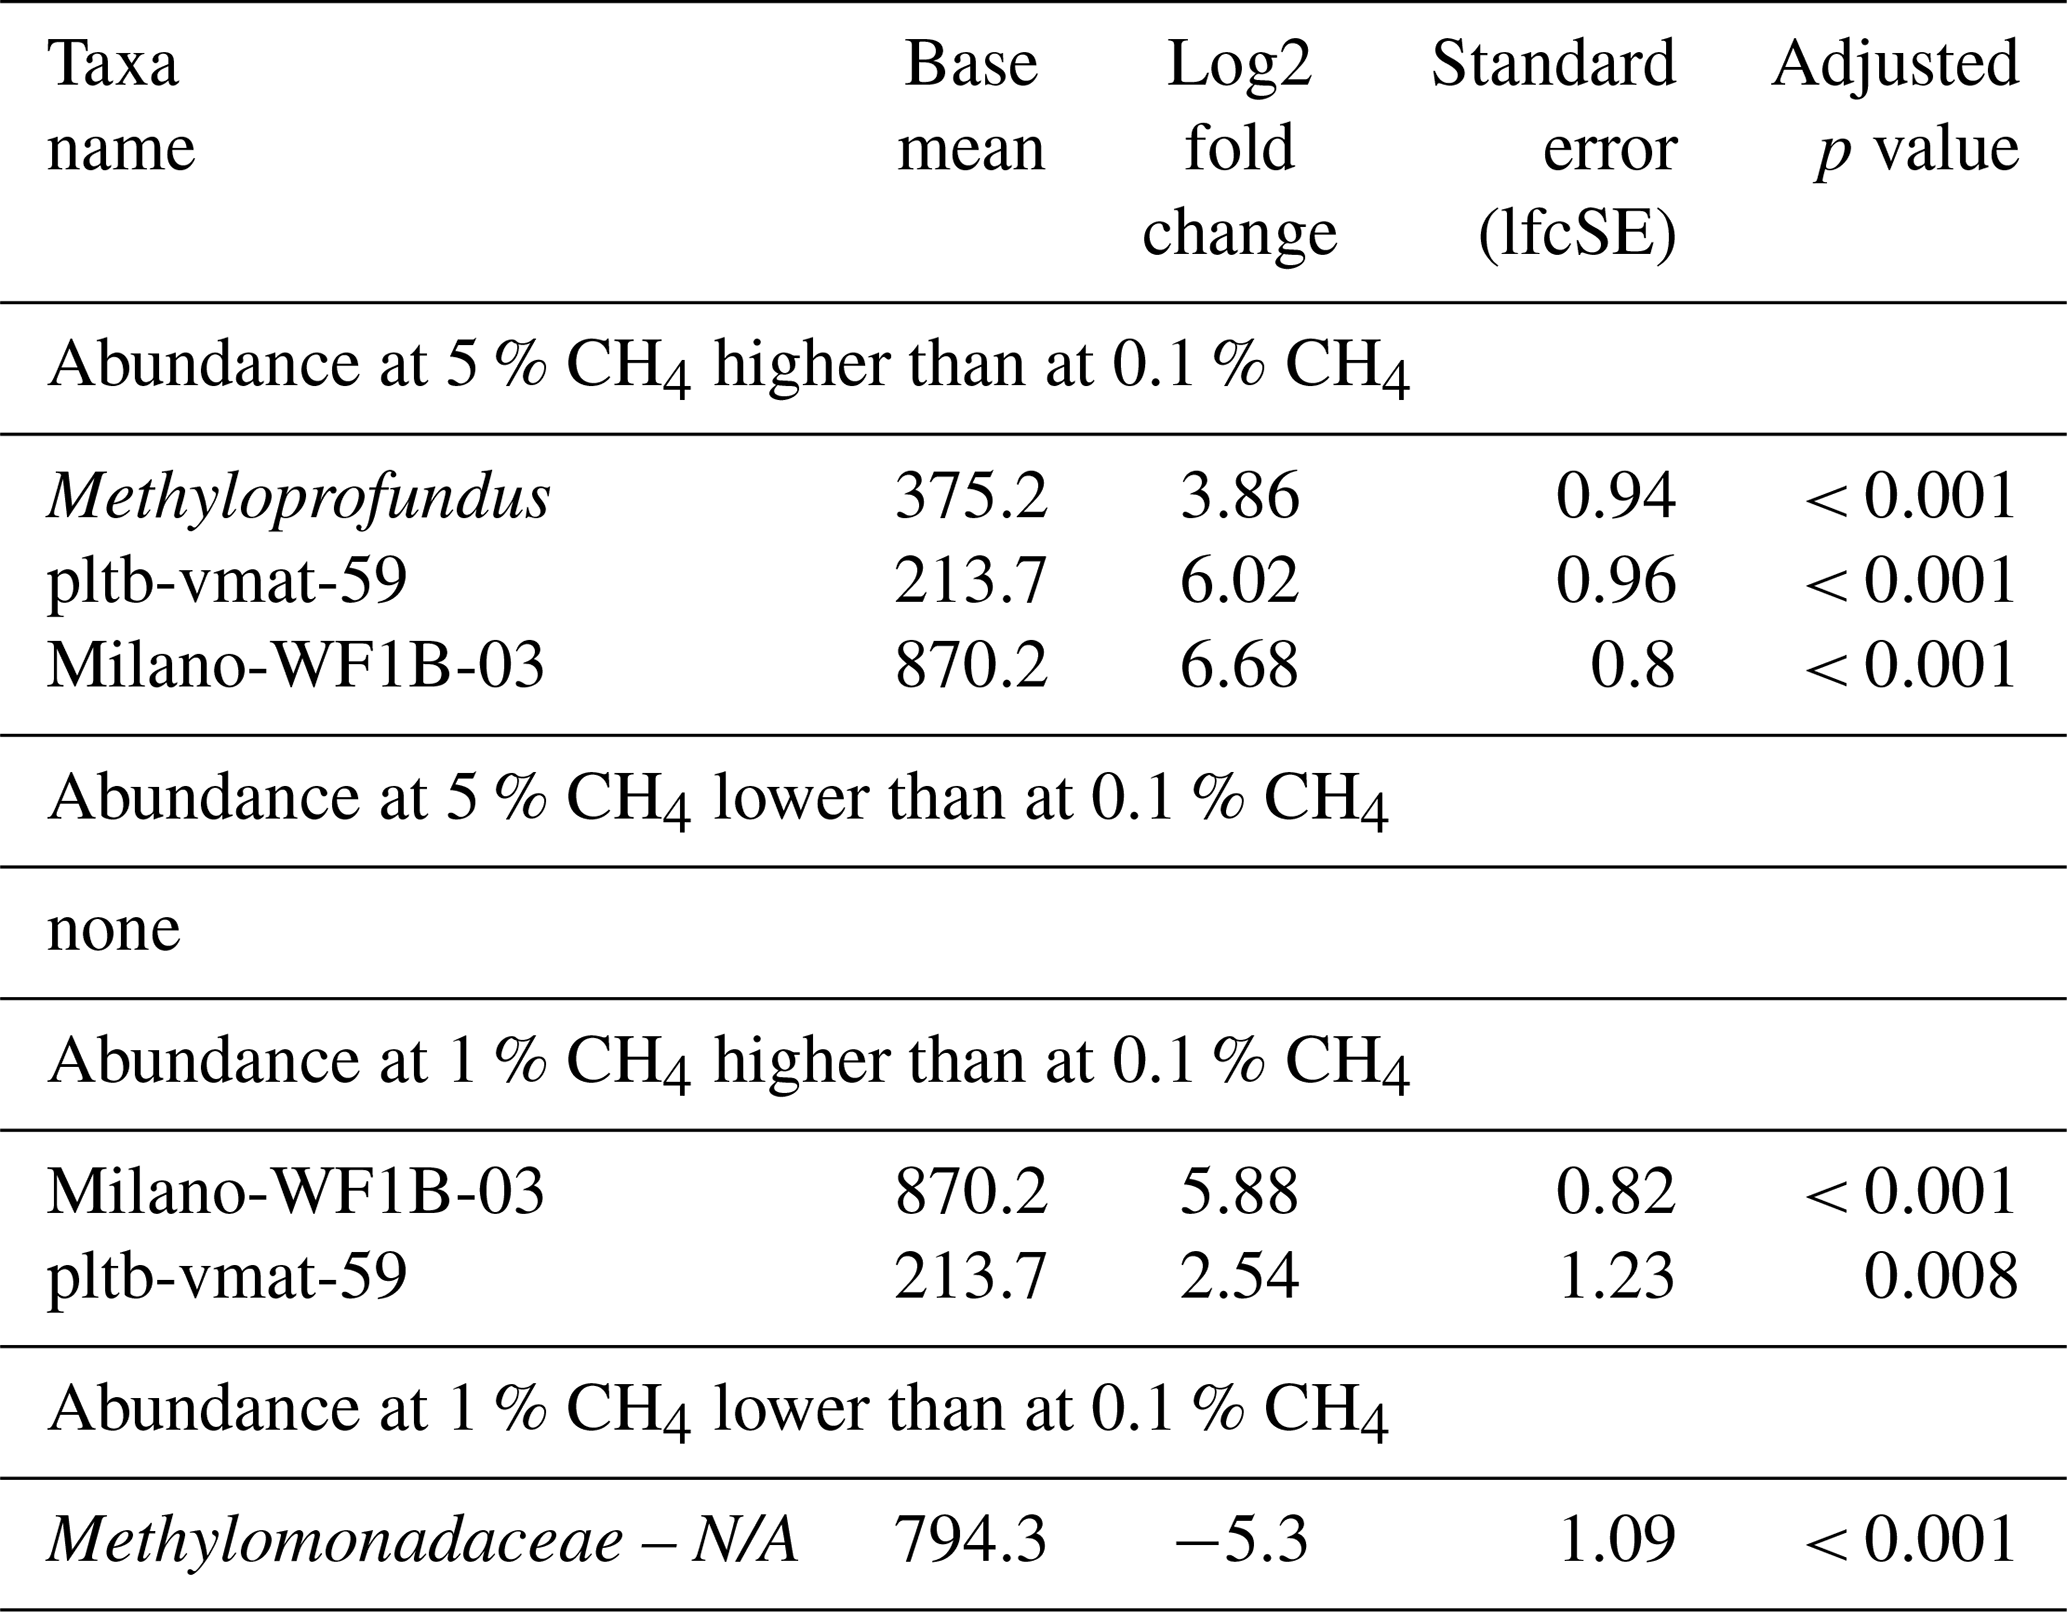
Analysis of differential MOB abundance revealed significant changes in methanotroph populations in response to varying methane concentrations (Table 3). For instance, abundances of pltb-vmat-59 and Milano-WF1B-03 were substantially higher at both 1 % and 5 % when compared to 0.1 % headspace methane levels. In contrast, the abundance of unassigned Methylomonadaceae was lower at 1 % when compared to 0.1 % headspace methane levels.
Temperature
Differential abundance analysis revealed that four distinct MOB genera were significantly affected by temperature (Table 4); however, the effect of temperature on MOBs was highly variable. MOBs generally exhibited lower abundances in incubations at 30 °C, particularly in samples collected in autumn, contrasting with the high abundances of MOBs in incubations at 15 and 25 °C using the same inoculum (Fig. 1). For instance, Methyloprofundus was higher in abundance at 15 °C when compared to 25 and 30 °C (Table 4). In contrast, potential MOBs belonging to the (potential) type-II genus Methyloceanibacter showed generally higher abundances at higher incubation temperatures. However, no distinct MOB group consistently dominated across all water depths and seasons at a specific incubation temperature.
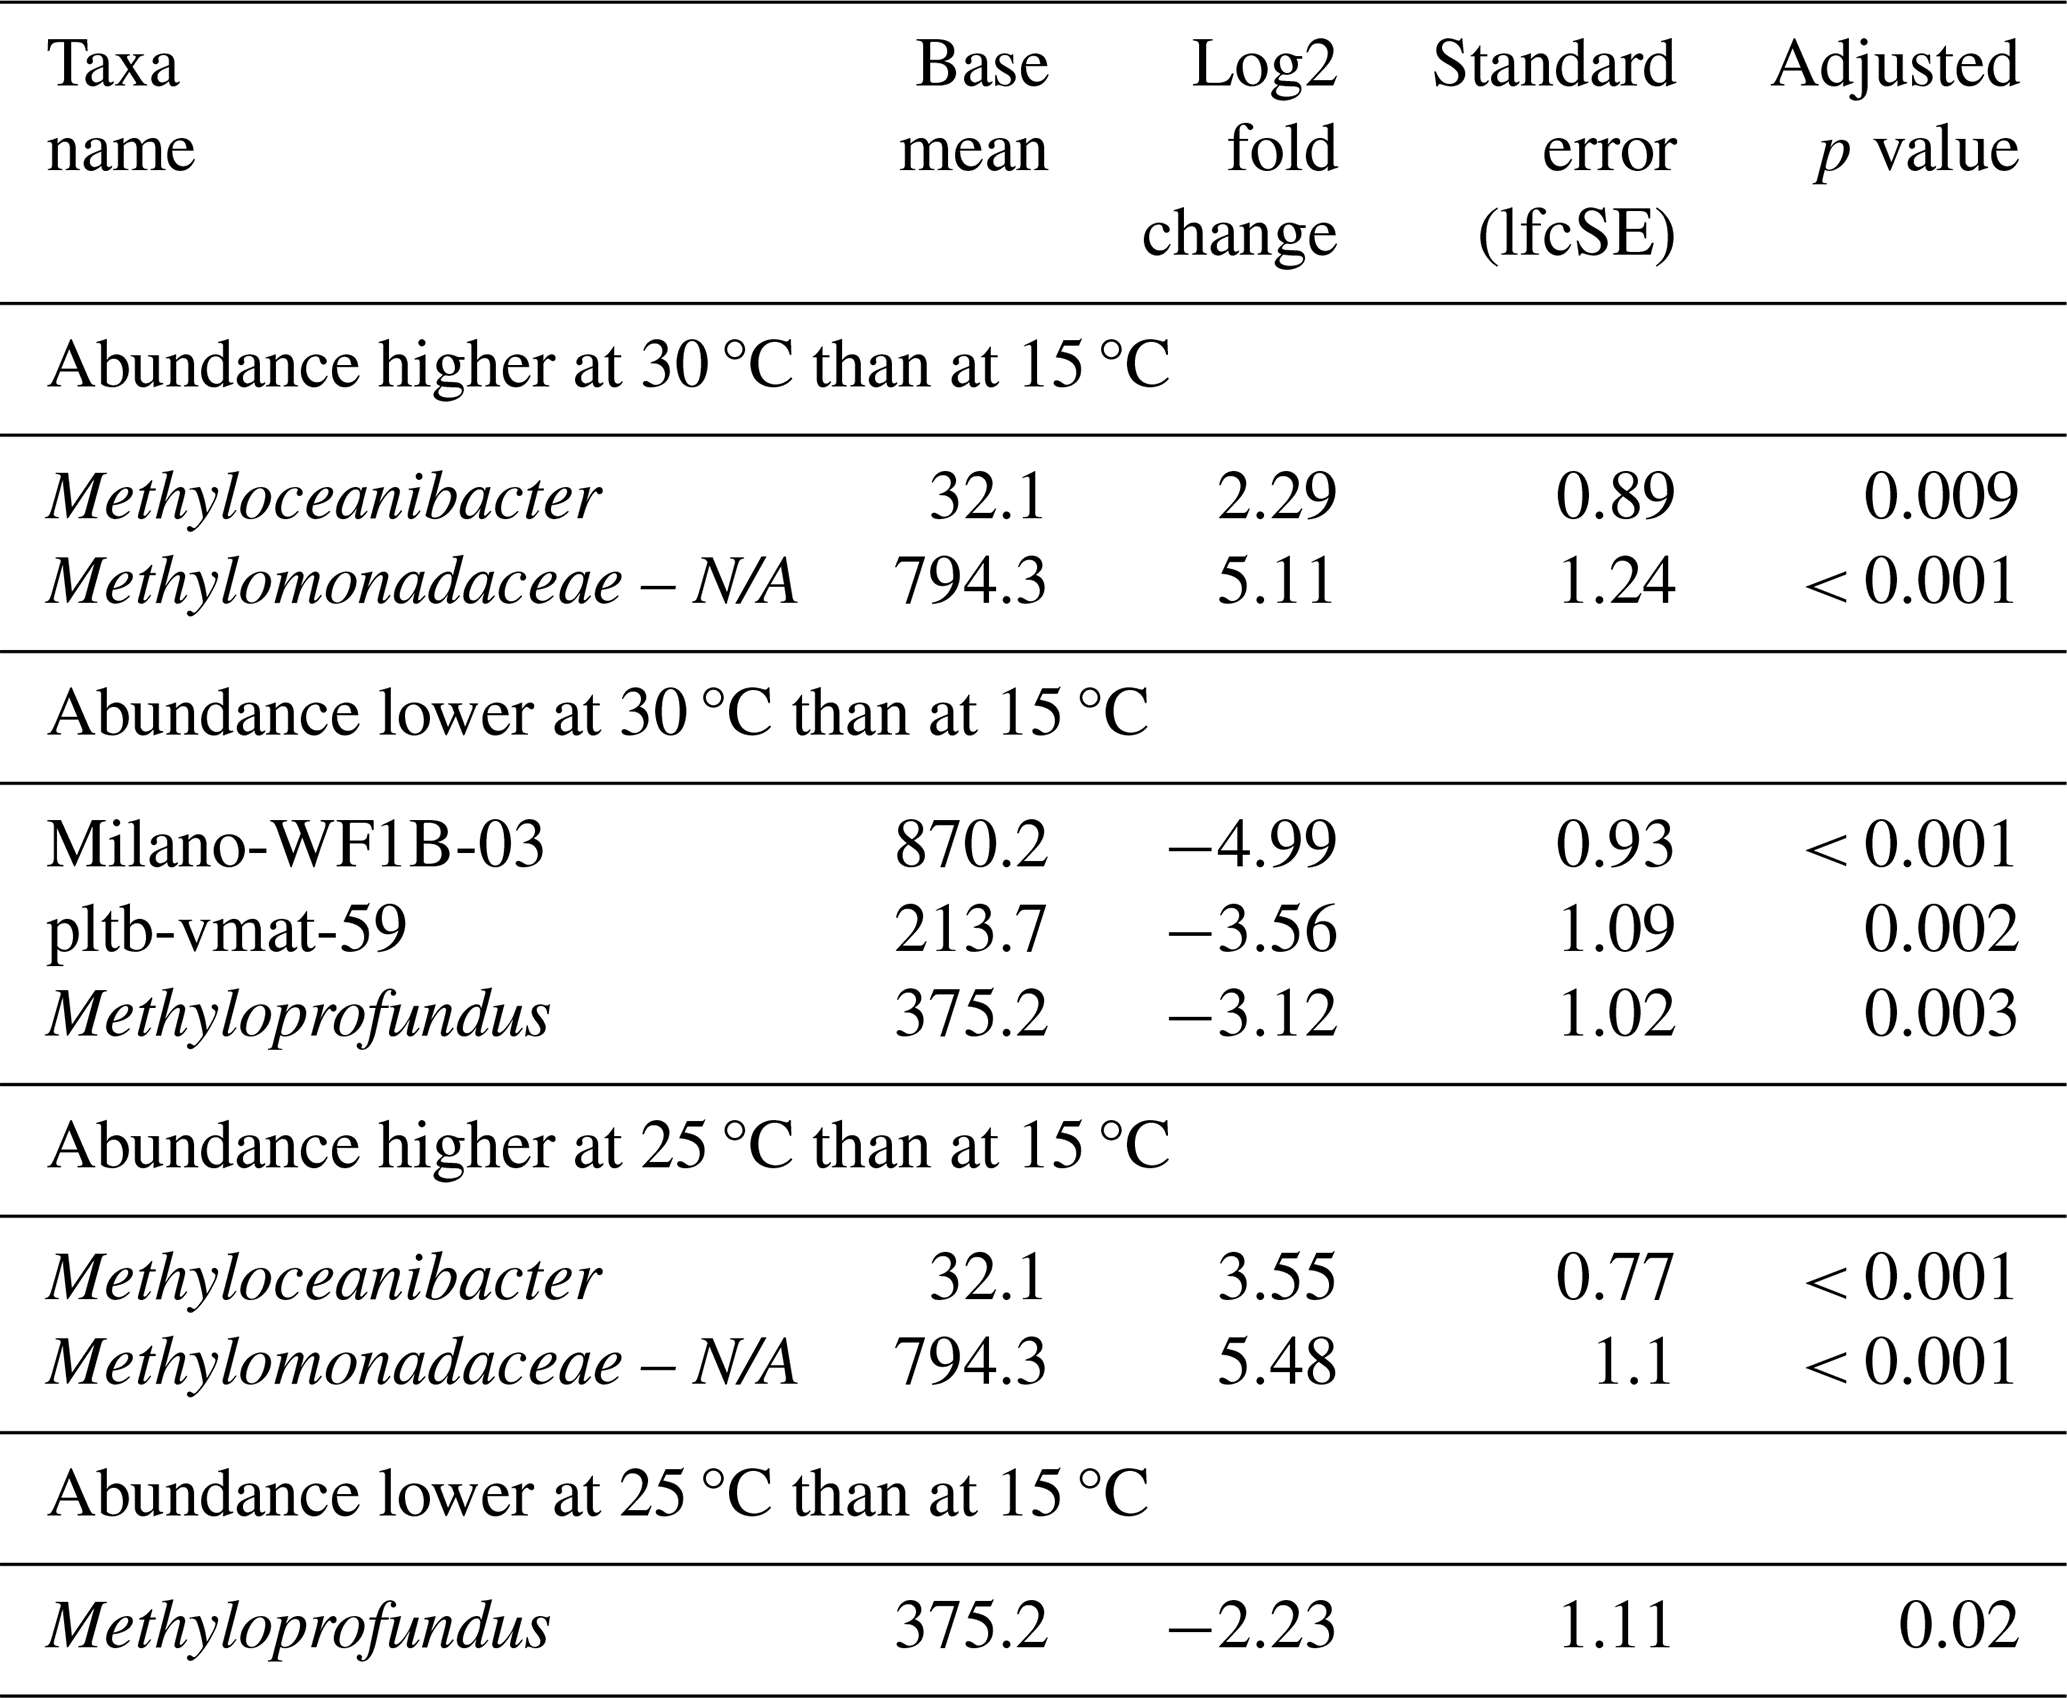
Table 4Differential abundance of genera associated with methanotrophs due to different incubation temperatures. Incubations were started with microbial biomass from the North Sea seawater inoculum. Log2 fold changes indicate abundance differences between incubations at different temperatures. The base mean refers to the mean normalized count as provided by DESeq2. Please note that N/A denotes not assigned.
3.3 Wadden Sea
Diversity and abundance of methanotrophs in microcosms
Spring
The MOB community in the spring inoculum was predominantly composed of the potential MOB genus Methyloceanibacter at the beginning of the incubation (t0). Independently of season, this pattern was found in all inocula from the Wadden Sea, and Methyloceanibacter was also a dominant MOB group in the original water column and in sediment samples (Fig. S2). In contrast to the North Sea incubations, Wadden Sea spring incubations were more variable among replicates and contained a higher degree of unassigned Methylomonadaceae. Only incubations with 35 psu salinity (and 5 % methane in the headspace, incubated at 25 °C) showed a high abundance of Methylomarinum. Methylomarinum was also dominant in one replicate of all other incubations with 5 % methane in the headspace. Other dominant groups in at least one replicate were IheB2-23, Methyloprofundus, Methylomicrobium, pltb-vmat-59, MMG2, and unassigned Methylomonadaceae.
Summer
In contrast to spring, summer incubations showed a higher degree of consistency between replicates. Methyloceanibacter did, in addition to t0, also dominate incubations with 0.1 % methane in the headspace. Methylomicrobium dominated two replicates in incubations with 15 psu salinity and one in incubations with 5 % methane in the headspace. Methylomarinum was dominant in two replicates in incubations with 15 psu salinity. Unassigned Methylomonadaceae comprised the majority of MOB in all replicates of incubations conducted at 30 °C and dominated one or two replicates of incubations with 1 % or 5 % methane in the headspace and those conducted at salinity levels of 35 psu.
Autumn
Incubations from autumn were often dominated by Methylomicrobium and Methylomarinum or unassigned Methylomonadaceae. Similarly to spring, incubations with 0.1 % methane in the headspace were also dominated by Methyloceanibacter (though overall abundance was low with < 0.001).
Winter
Similarly to spring, winter incubations were more variable among replicates and contained a higher degree of unassigned Methylomonadaceae. Only incubations with 35 psu salinity (and 5 % methane in the headspace, incubated at 25 °C) showed a dominance of Methyloprofundus. Other important MOB groups dominating one or two replicates were Methylomarinum, Methylomicrobium, Methylobacter, MMG2, or Methylomonas.
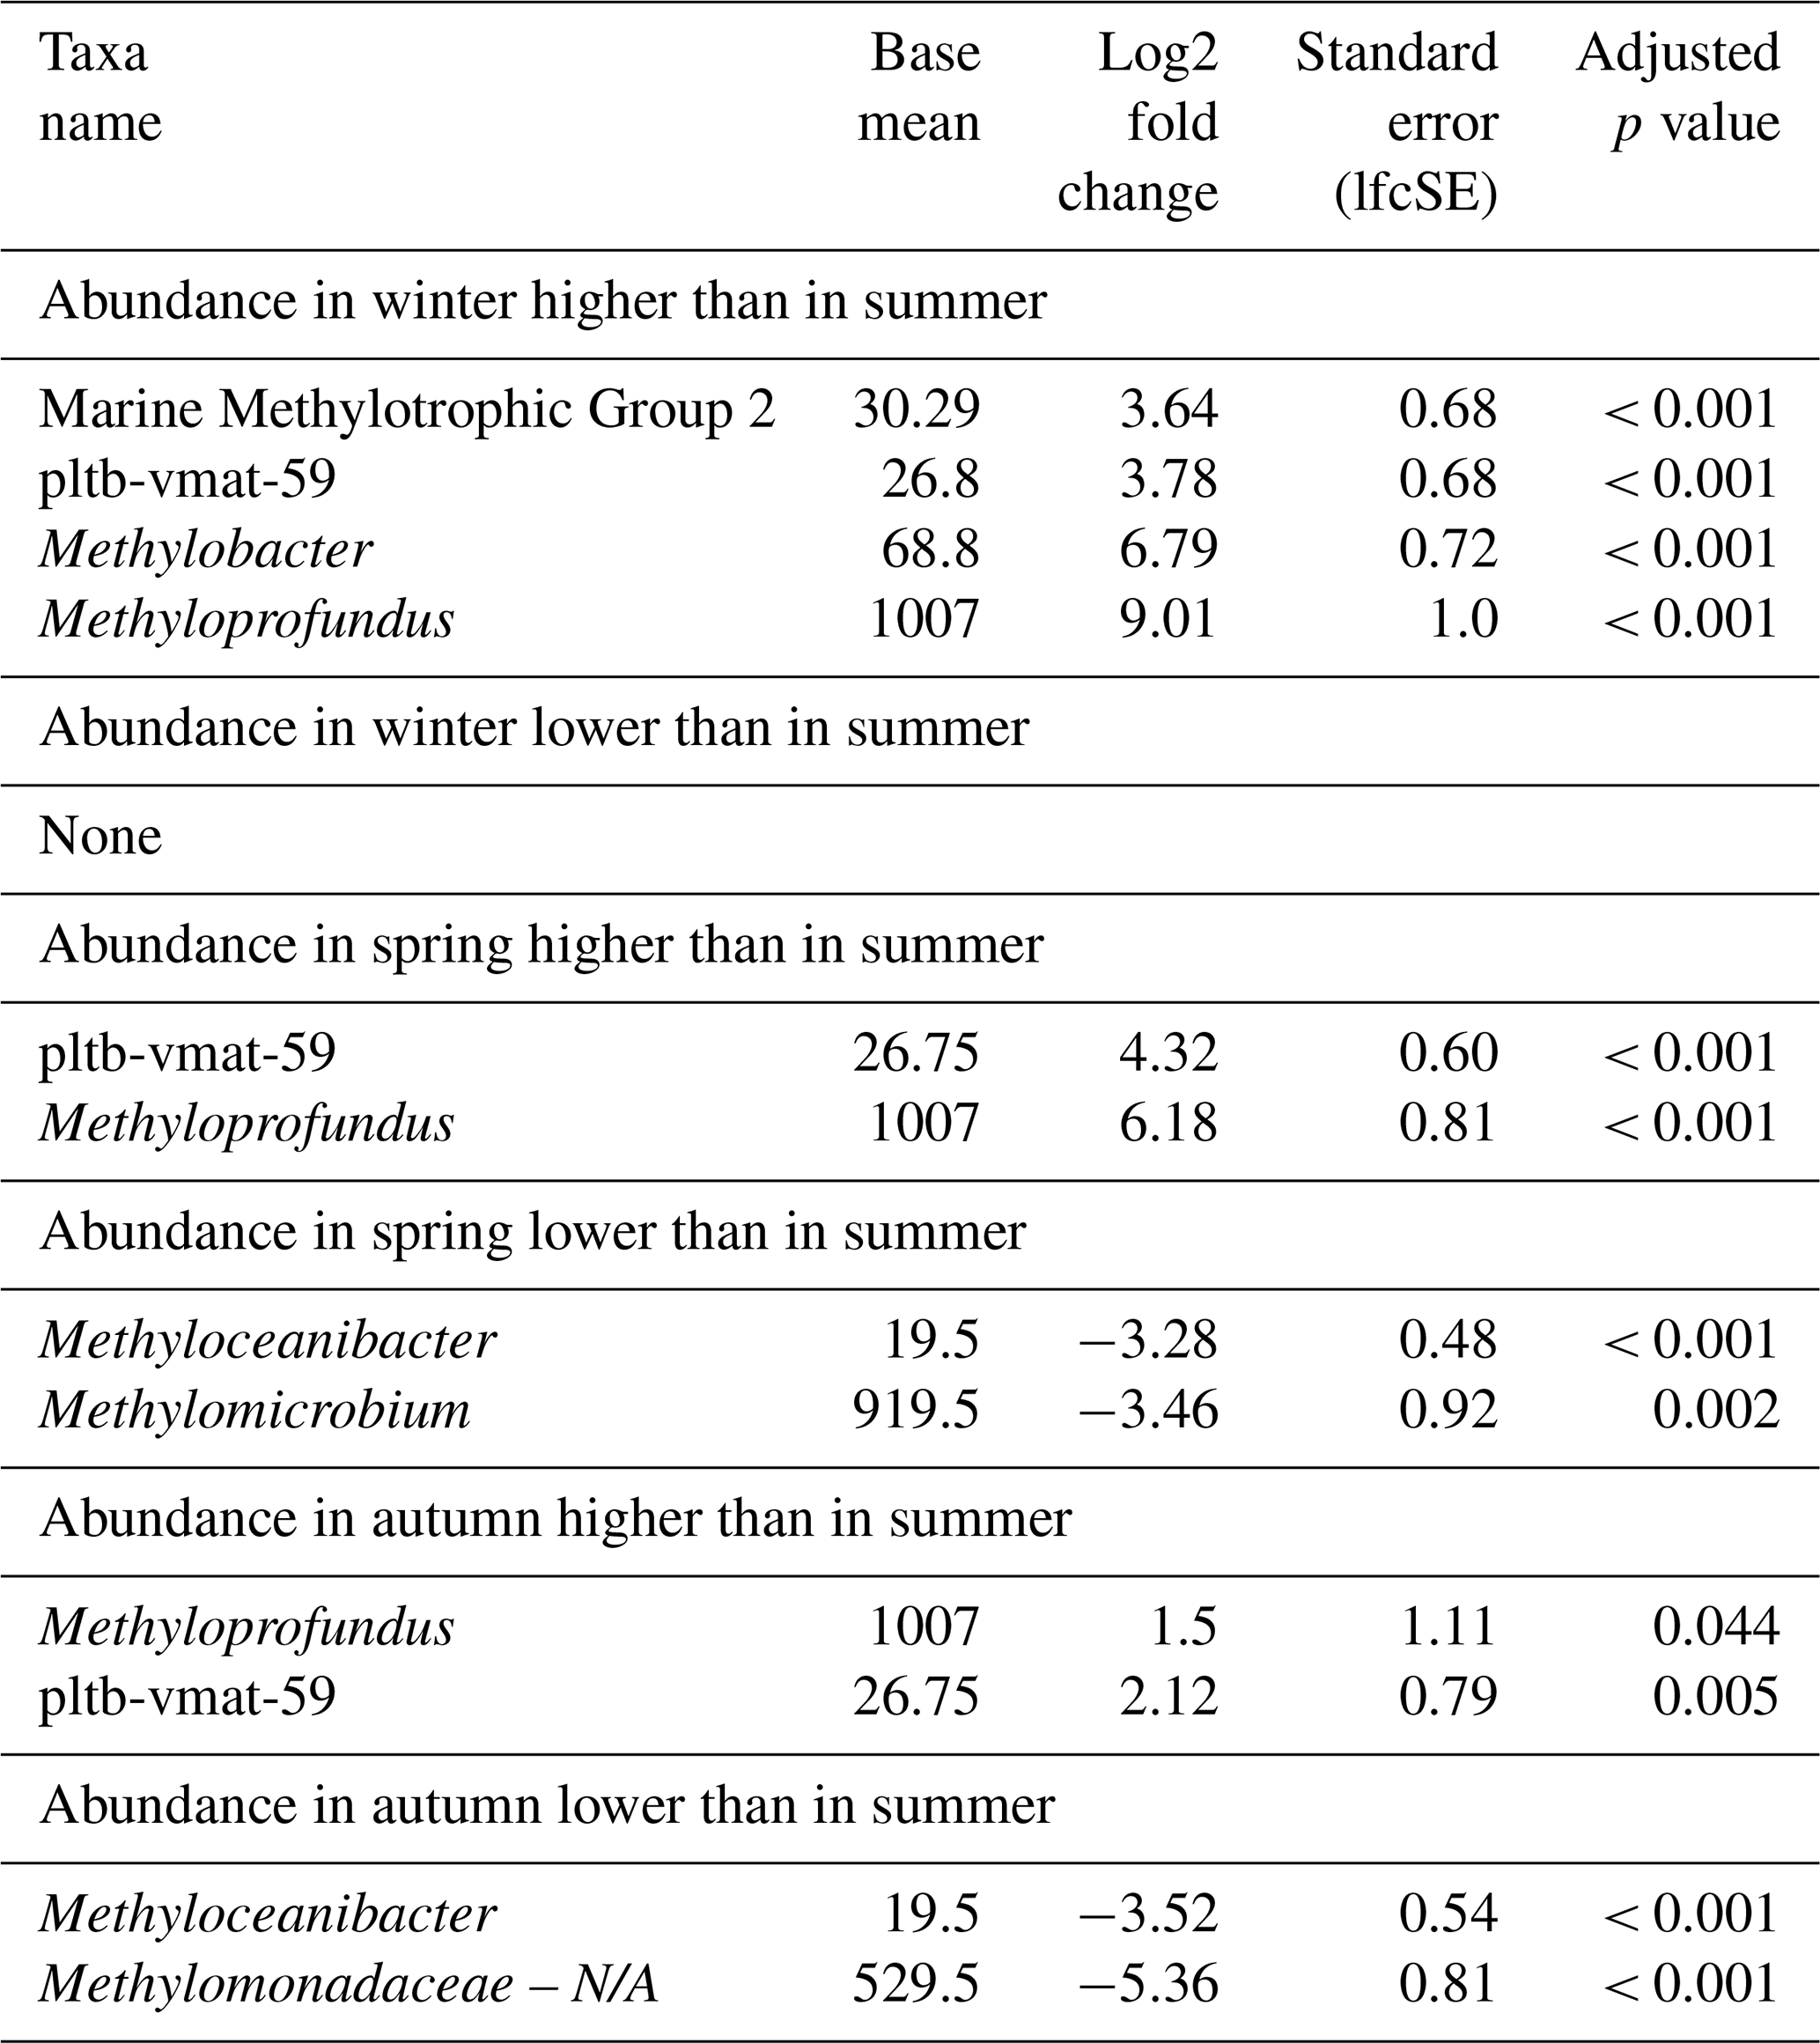
Seasonal variations were further investigated by means of differential abundance analysis (Table 5). These highlighted significant increases in certain MOB genera in incubations with inocula from colder conditions (winter and spring) compared to those from summer, namely Methyloprofundus and pltb-vmat-59. Members of the MMG2 and Methylobacter genera were elevated in abundance only in spring when compared to summer. MOB abundances in winter incubations showed the strongest differences compared to summer incubations, displaying the highest number of more abundant MOB genera and the highest log2 fold changes. Although autumn incubations were dominated by Methylomicrobium, its abundance was not significantly higher in autumn than in summer incubations. Only Methyloprofundus and pltb-vmat-59 were significantly more abundant in autumn than in summer but with lower log2 fold changes than between winter and summer. With the exception of MMG2, autumn incubations exhibited high abundances of the dominant genera found in both summer and winter incubations. Similarly, spring incubations showed microbial abundance profiles that were intermediate between winter and summer.
Table 5Differential abundance of methanotrophs in incubations of Wadden Sea seawater inoculum generated during summer, autumn, winter, and spring. Log2 fold changes indicate abundance differences between incubations with inocula from spring, summer, autumn, and winter. The base mean refers to the mean normalized count as provided by DESeq2. Please note that N/A denotes not assigned.
Methane
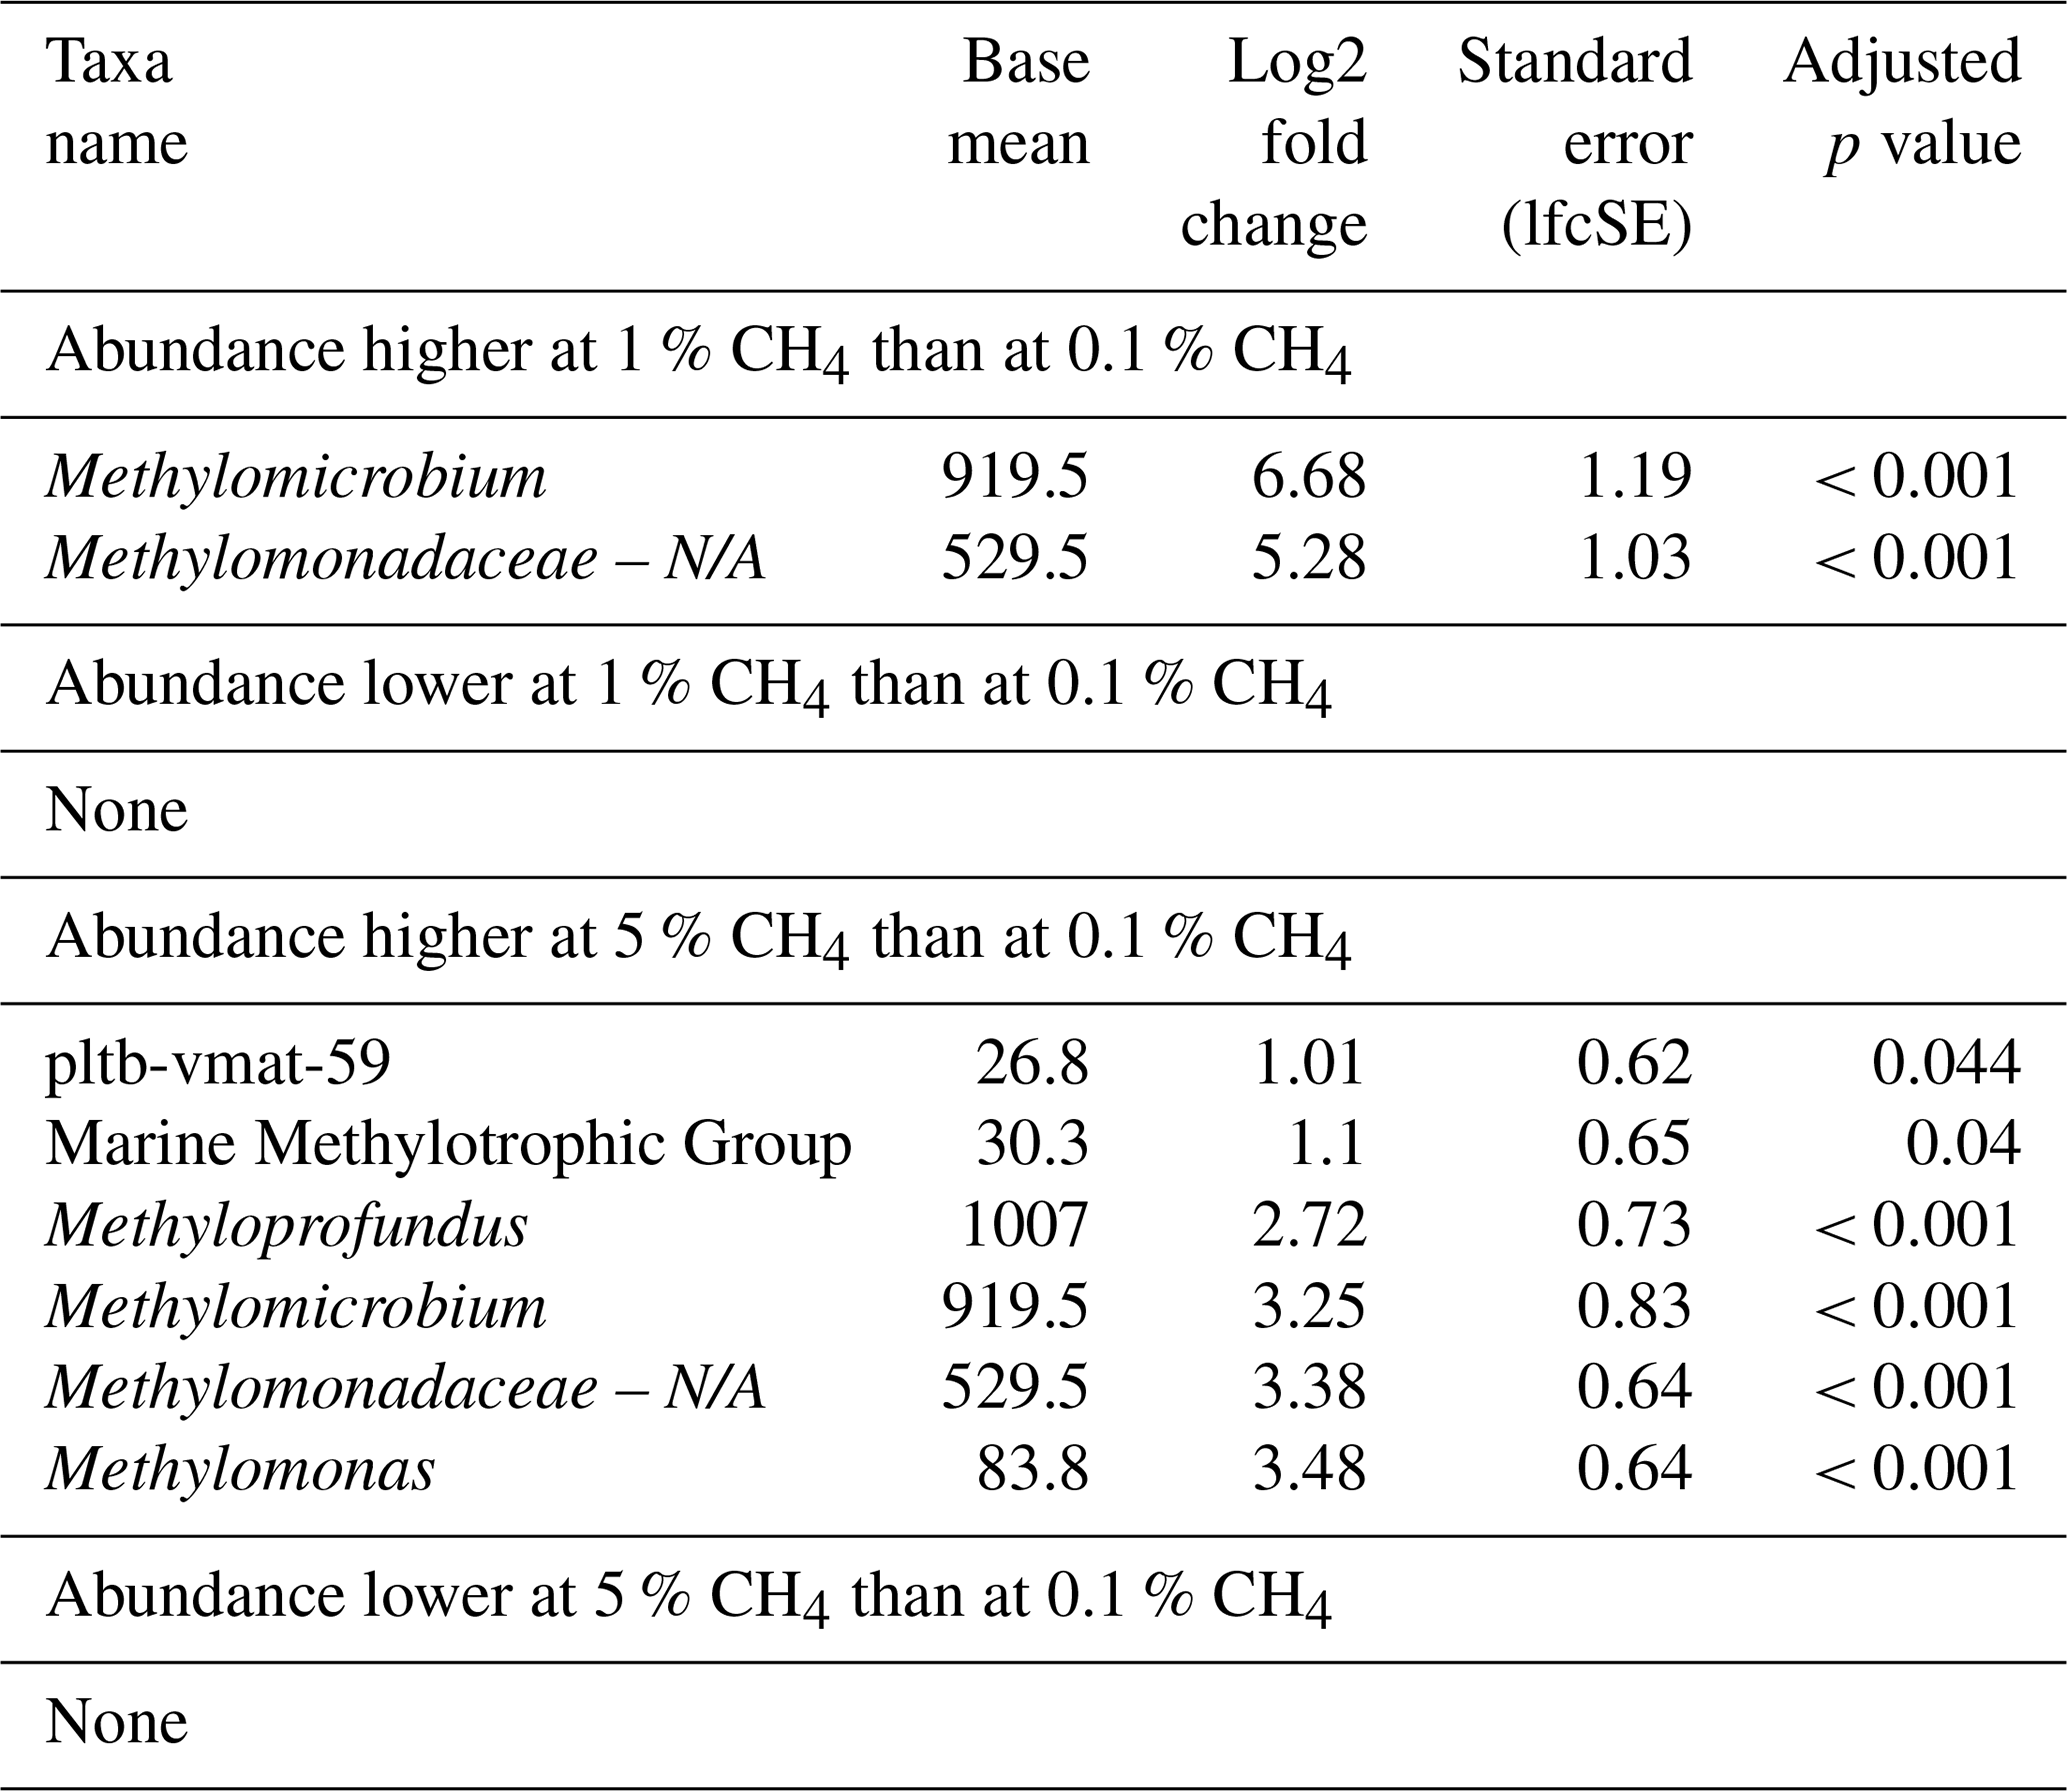
The relative abundance of MOBs roughly reflected methane concentrations during incubations, independently of season, though overall MOB abundances were lowest in summer incubations. The impact of elevated headspace methane concentrations (5 %) had a more pronounced effect on MOB community structure, resulting in a broader range of MOBs exhibiting higher abundance compared to lower methane levels of 0.1 % (Fig. S3). This included pltb-vmat-59, MMG2, Methyloprofundus, Methylomicrobium, and Methylomonas (Table 6, Fig. S3). However, just as for North Sea incubations, no single MOB genus dominated incubations at specific headspace methane levels across all seasons (Fig. 2).
Table 6Differential abundance of methanotrophs at varying headspace methane concentrations in incubations inoculated with microbial biomass from the Wadden Sea. Log2 fold changes indicate abundance differences between incubations with varying methane levels. The base mean refers to the mean normalized count as provided by DESeq2. Please note that N/A denotes not assigned.
Temperature
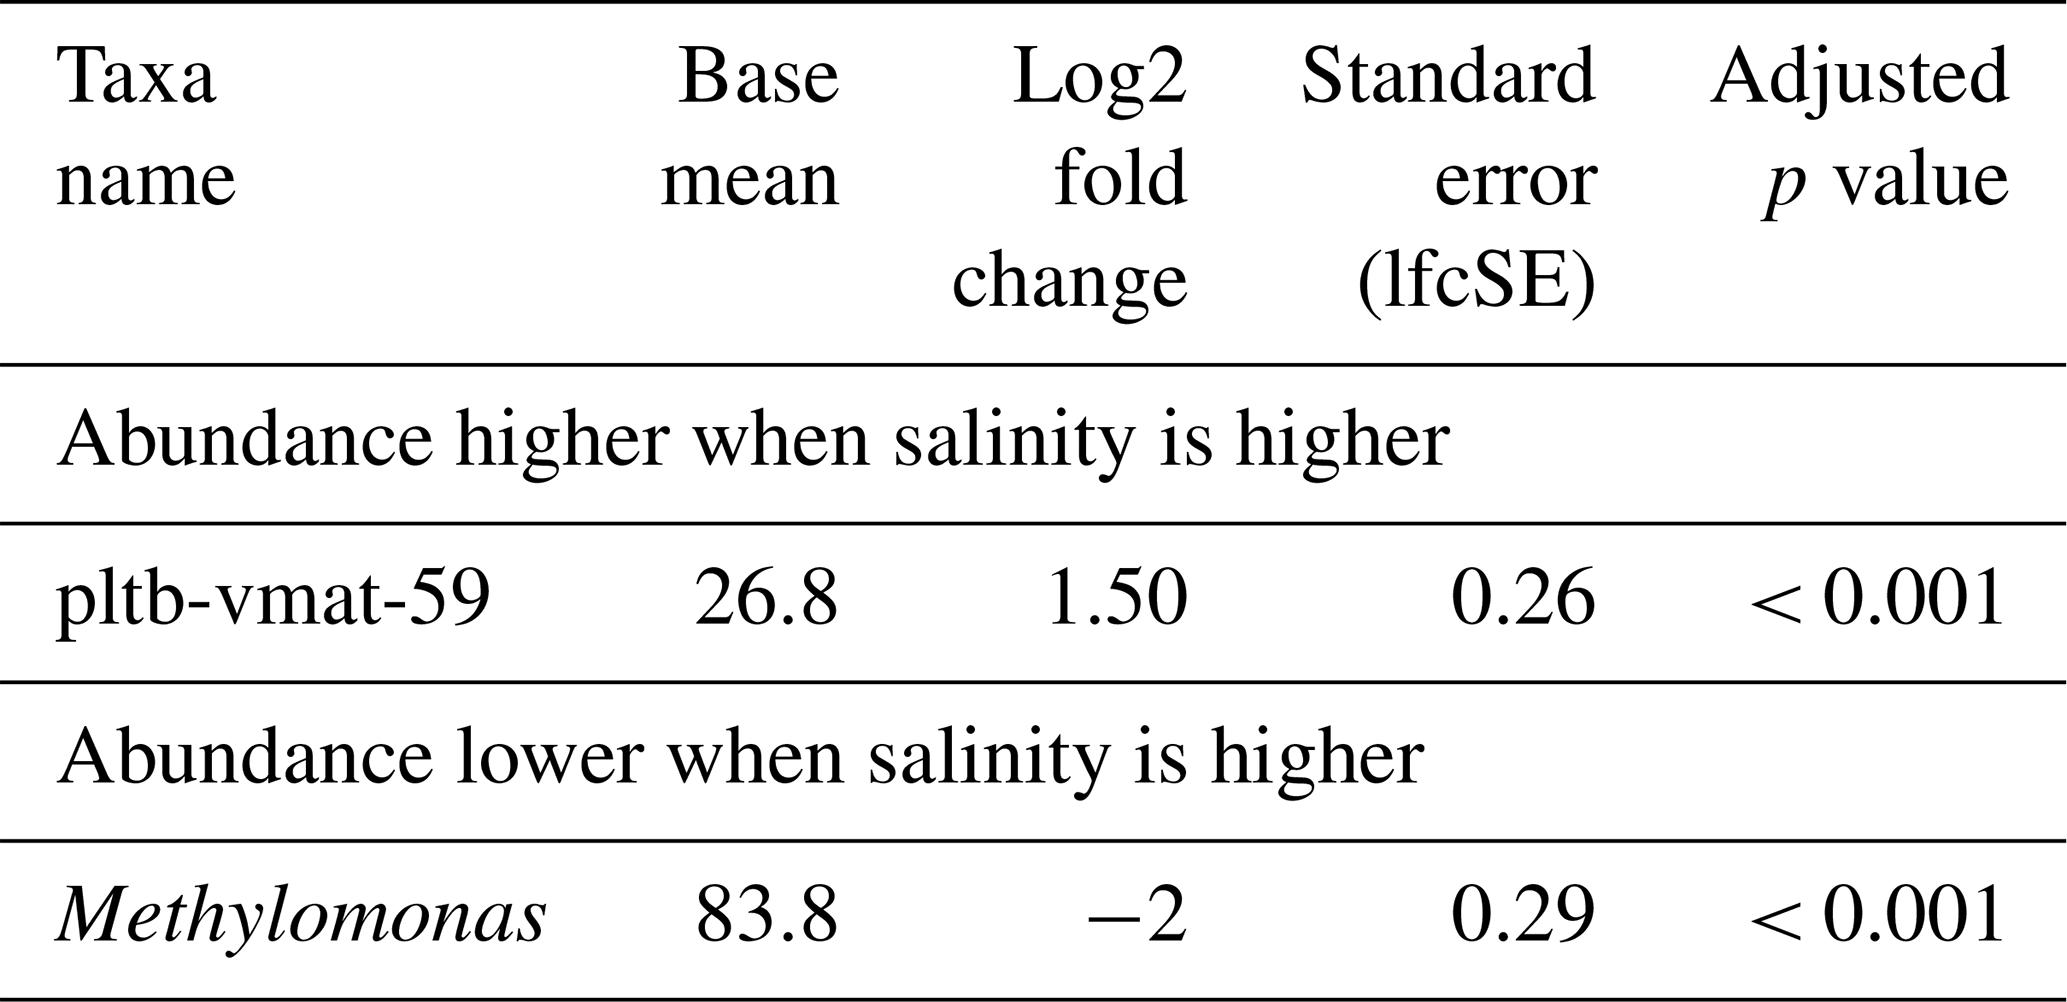
Similarly to the North Sea incubations, no distinct MOB group consistently dominated across all seasons at a specific incubation temperature. Differential abundance analysis (Table 7) showed that, at 30 °C, compared to at 15 °C, several MOB genera were less abundant, including Methyloprofundus, MMG2, Methylomicrobium, and Methylomonas. Conversely, unassigned Methylomonadaceae showed a higher abundance at 30 °C than at 15 °C. At 25 °C, compared to at 15 °C, we observed a similar pattern. The MOB genera MMG2, Methyloprofundus, and Methylomicrobium were less abundant at higher temperatures.
Table 7Differential abundance of methanotrophs due to incubation temperature in incubations of Wadden Sea inoculum taken during four different seasons. Log2 fold changes indicate abundance differences between incubations at different temperatures. The base mean refers to the mean normalized count as provided by DESeq2. Please note that N/A denotes not assigned.
Salinity
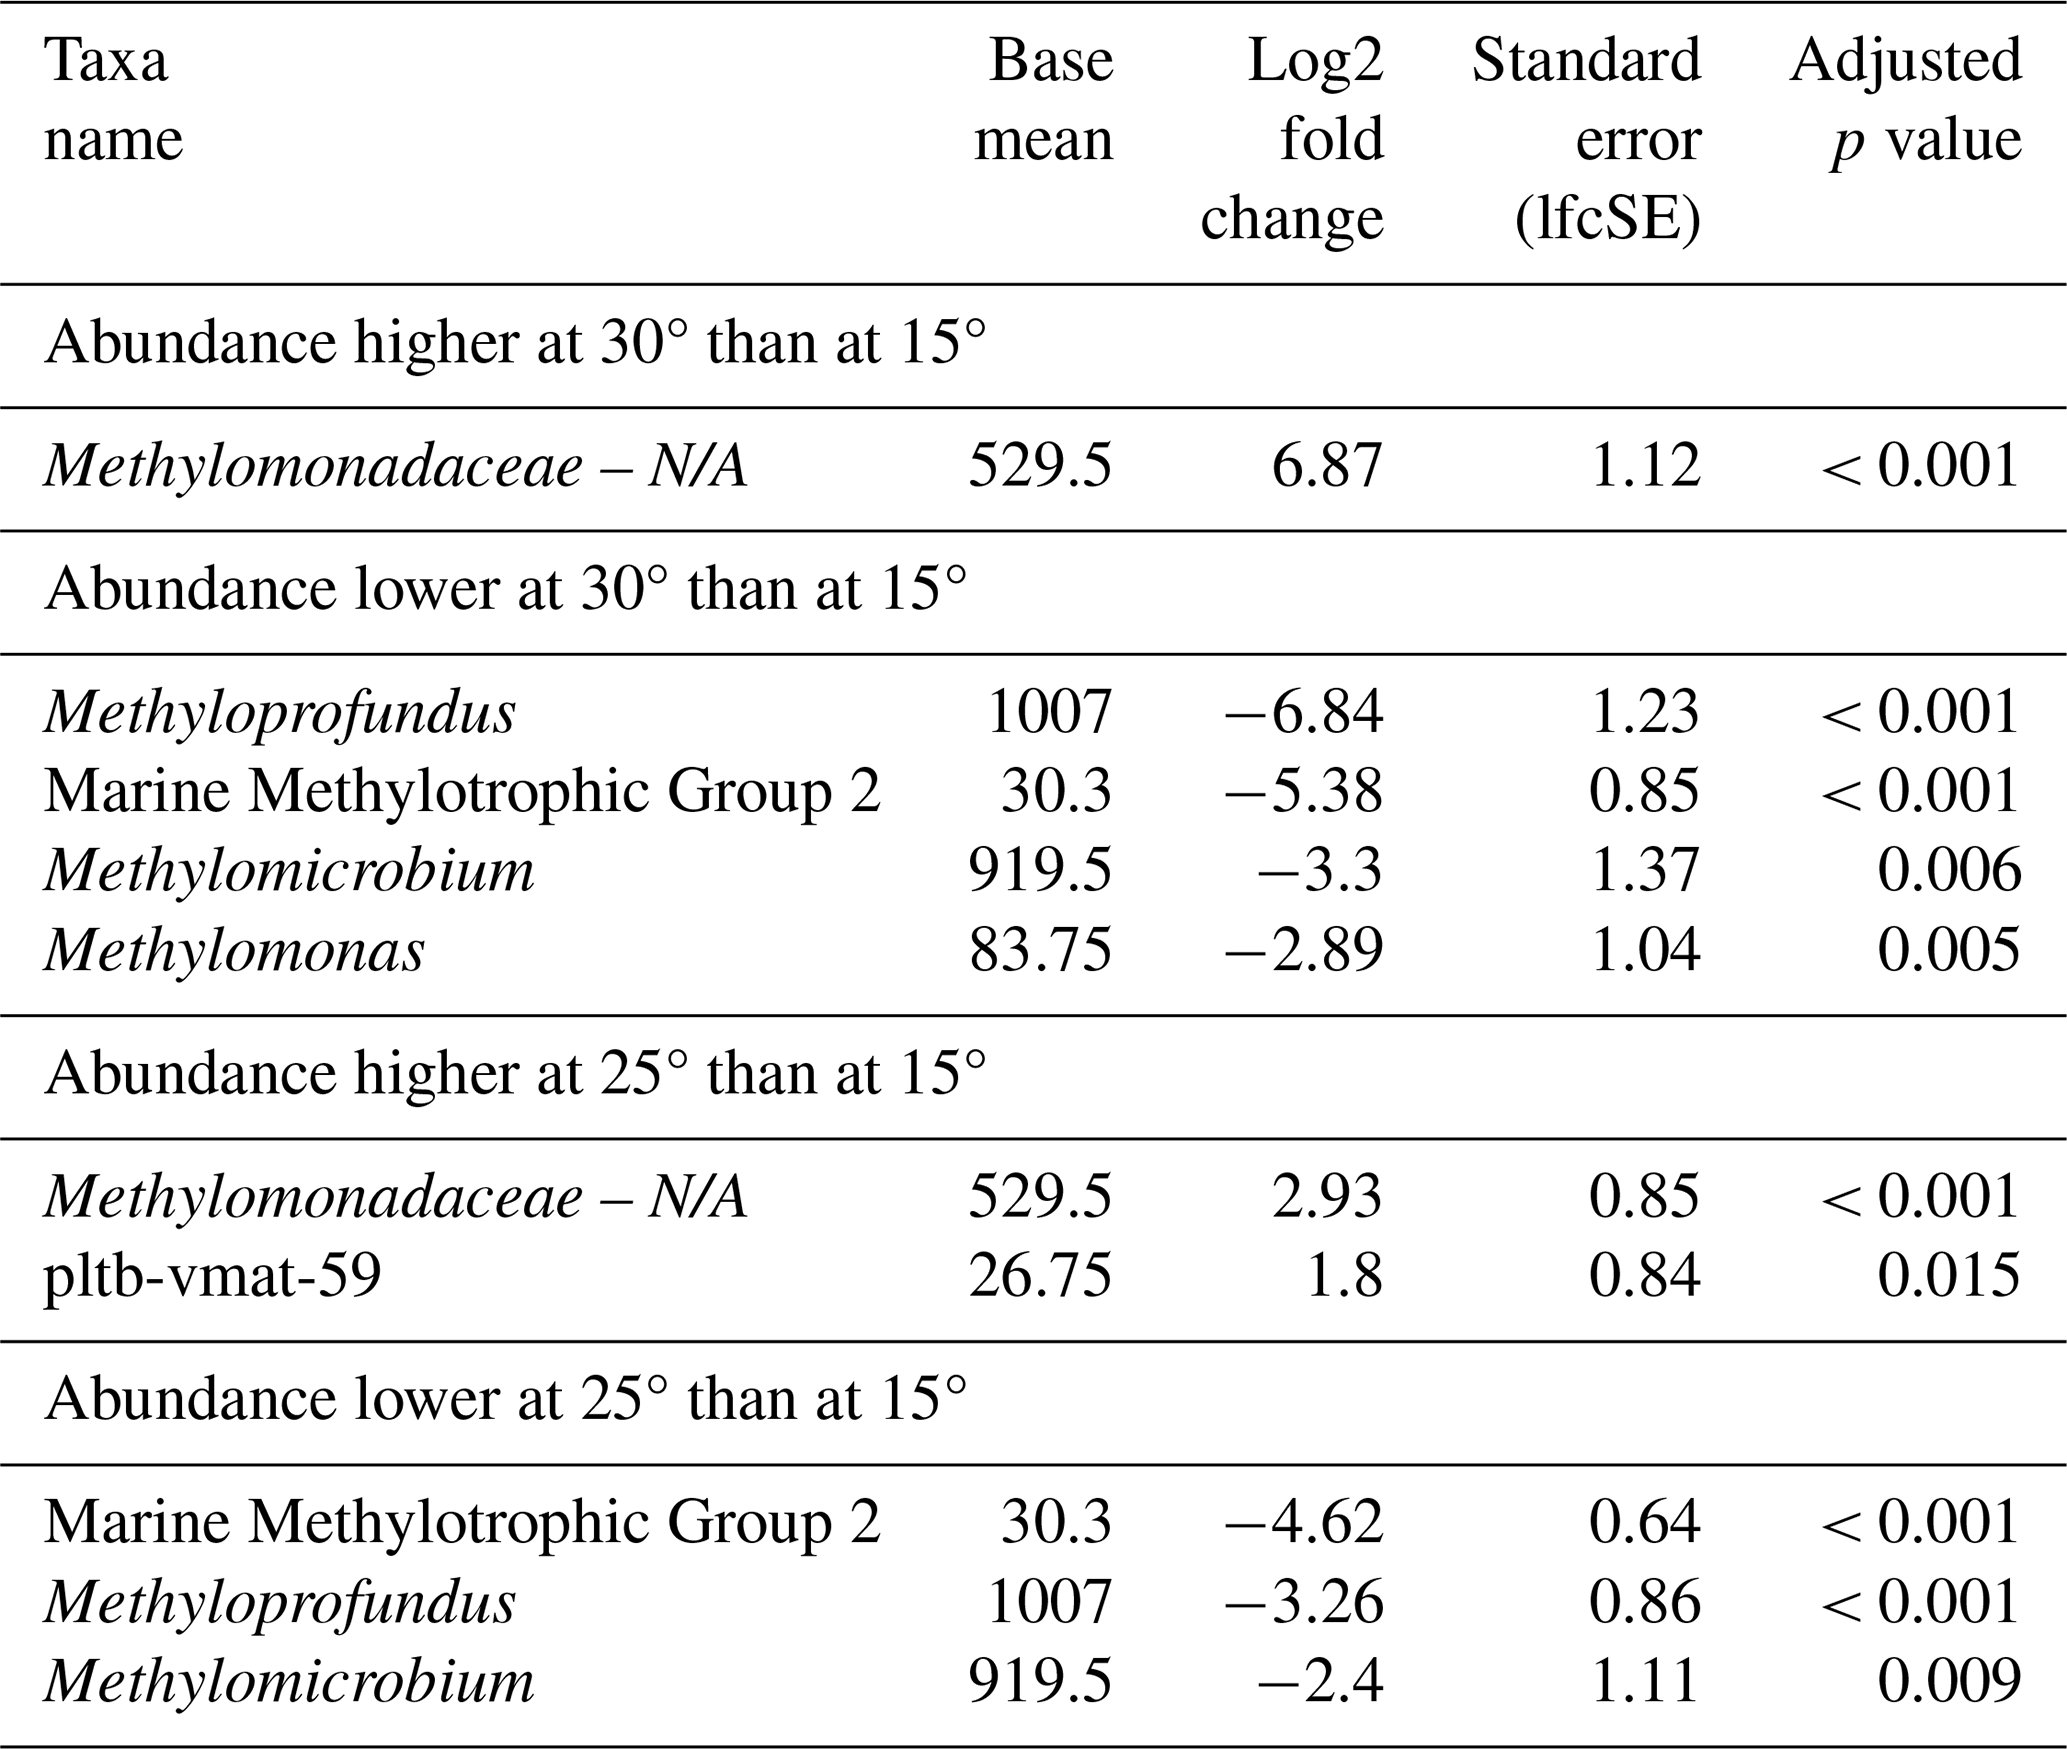
Just as for methane concentrations and temperature, we did not find a distinct MOB group consistently dominating across all seasons at a specific salinity. However, MOB abundance was generally higher at baseline incubation conditions, i.e. 5 % methane, 25 °C, and salinity levels of 30 psu (spring and summer) or 25 psu (autumn and winter), but was typically lower at either higher or lower salinity. Any of the groups (or combination of groups) dominating incubations at lower or higher salinity also contributed substantially to the MOB community in other incubations. For example, Methylomarinum was predominant in all replicates with 35 psu from spring, but the group was also found in incubations with elevated and decreased temperature (i.e. 15 and 30 °C). Also, differential abundance analysis (Table 8) only identified two genera, namely pltb-vmat-59 and Methylomonas, that were, respectively, positively and negatively affected by salinity.
Table 8Differential abundance of methanotrophs due to differences in salinity in incubations of Wadden Sea inoculum taken during four different seasons. Log2 fold changes indicate abundance differences between incubations at different salinity levels. The base mean refers to the mean normalized count as provided by DESeq2.
3.4 Comparison with environmental data
Environmental methanotrophs in the North Sea water column were predominantly composed of Methyloceanibacter, with minor contributions from pltb-vmat-59 (Fig. S1). However, the relative abundance of reads classified as MOB was low (< 0.03 %); in fact, MOBs were not detected in surface waters during summer. In contrast, sediments contained a higher relative abundance of MOB reads (up to 4.5 %) and showed a greater MOB diversity, primarily dominated by Methyloceanibacter and Methyloprofundus.
In the Wadden Sea, environmental MOBs in the water column were also dominated by Methyloceanibacter, again at low relative abundances. Sediments from the Wadden Sea showed higher MOB abundances as well, with Methyloceanibacter as the dominant genus and with minor contributions from pltb-vmat-59, Methylomarinum, and the Marine Methylotrophic Group 2.
Most environmental sediment-derived MOBs from both the North Sea and the Wadden Sea were also found in the microcosm incubations (Figs. 1 and 2), with exceptions. For example, Methylomicrobium was not detected in North Sea sediments but appeared in microcosms, while plw-20 was found in sediments but not detected in incubations. Similarly, Methylomicrobium was below the detection limit in Wadden Sea sediments but became dominant in the corresponding microcosms.
3.4.1 Total bacterial community
Non-metric multidimensional scaling (NMDS) analysis showed that microbial communities from Wadden Sea and North Sea water column incubations were remarkably distinct (Fig. 3) and clearly segregated from environmental water column and sediment microbiomes published previously (de Groot et al., 2024). Notably, t0 incubations more closely resembled their environmental counterparts in the NMDS plot than the remaining incubation samples (t0 samples mostly cluster in between environmental and incubation samples).
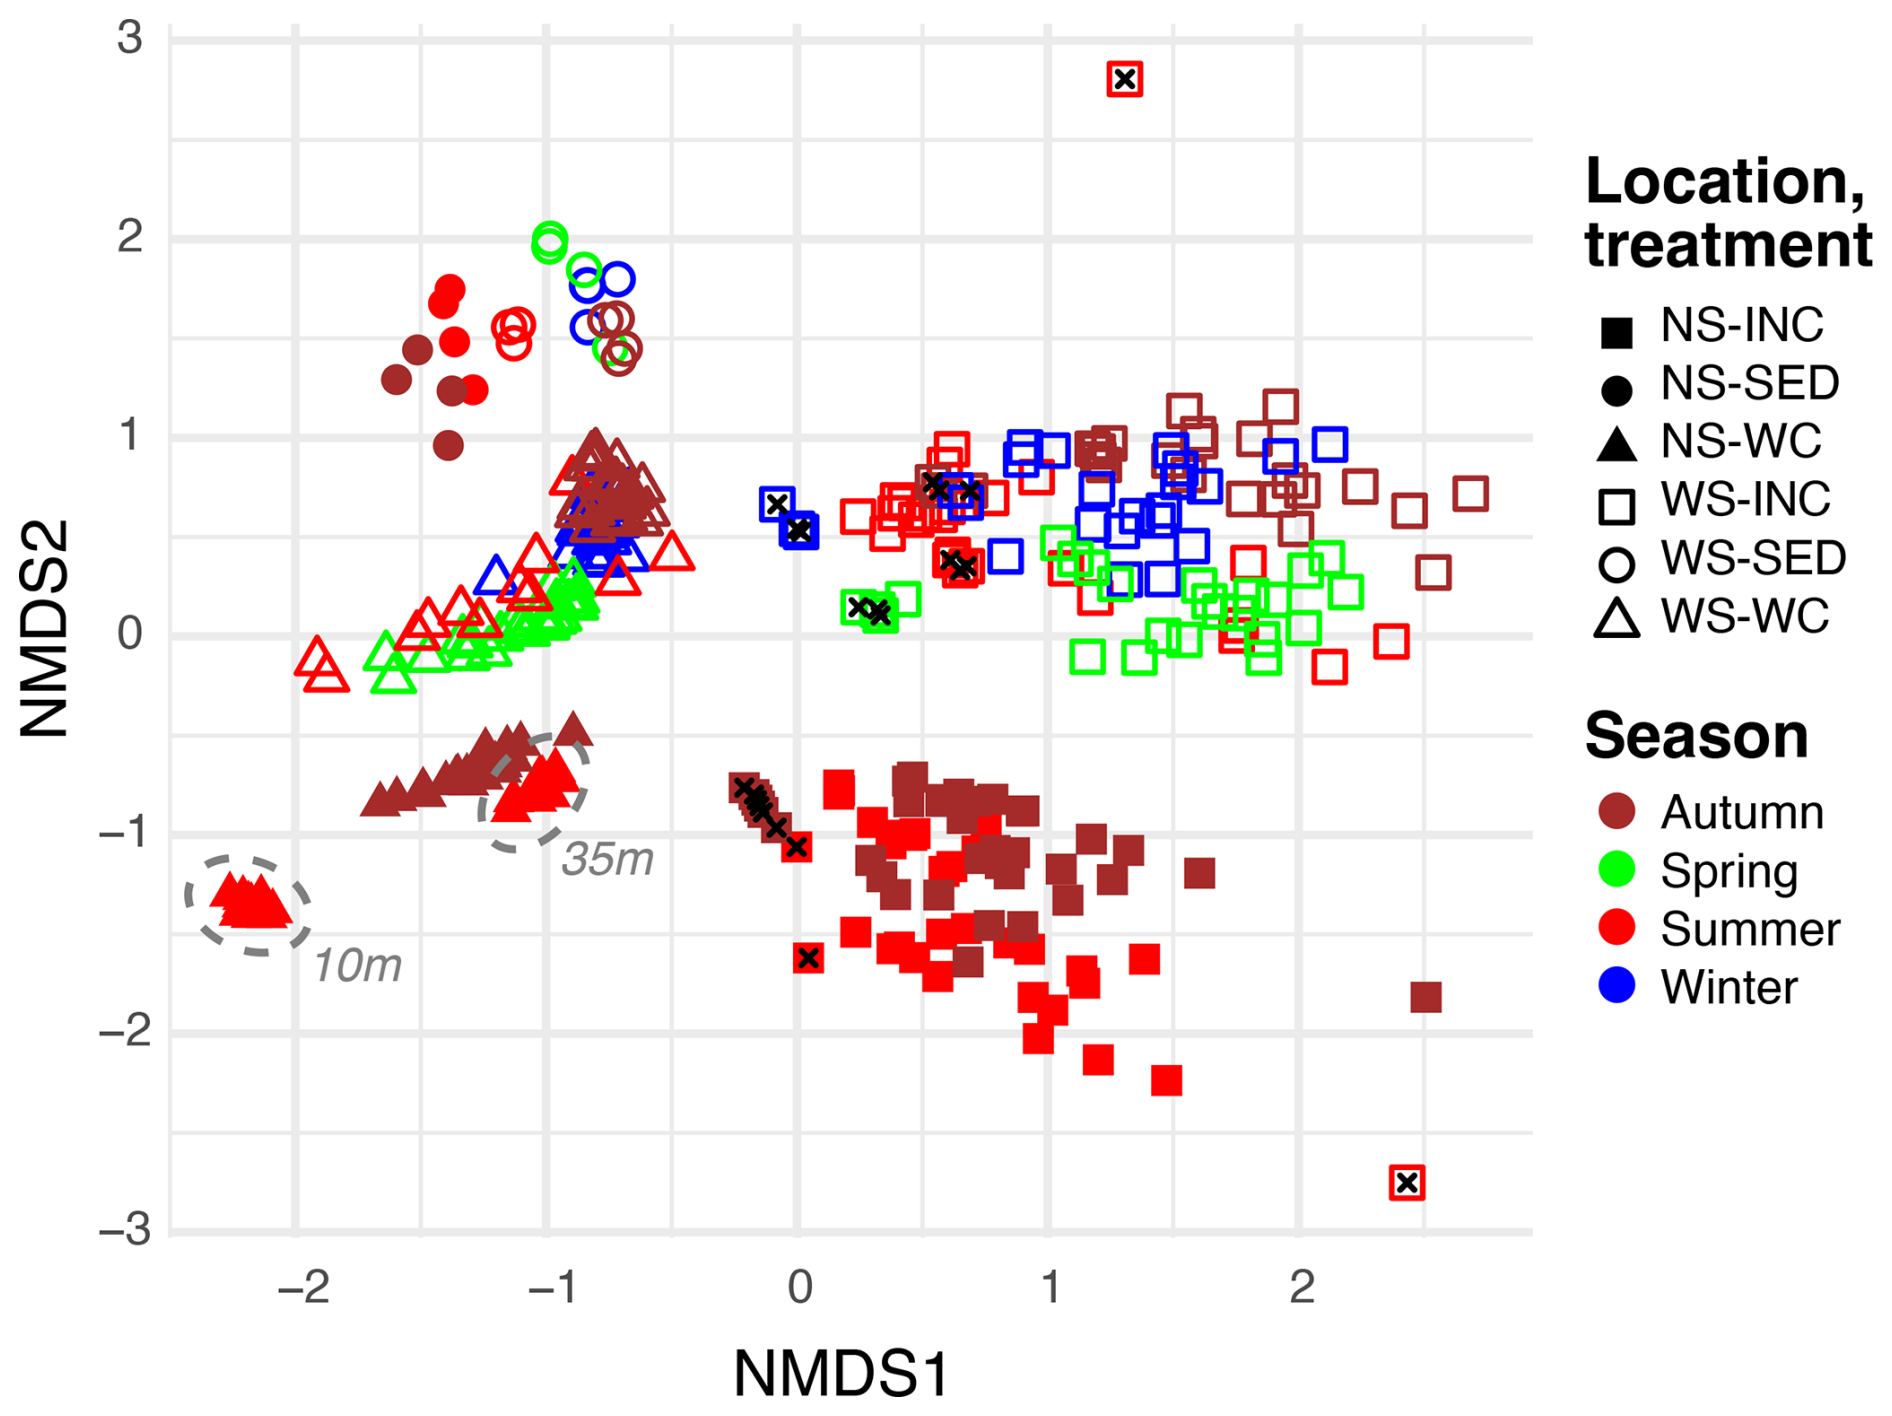
Figure 3Non-metric multidimensional scaling (NMDS, stress = 0.16) plot of microbial taxa in environmental water column (WC) and sediment samples (SED), as well as incubated (INC) water column samples from the North Sea (NS) for summer and autumn and from the Wadden Sea (WS) for winter, spring, summer, and autumn. Samples taken at the start of the incubations are indicated with a black cross, and the water depth of environmental communities for summer is highlighted by a dashed grey line.
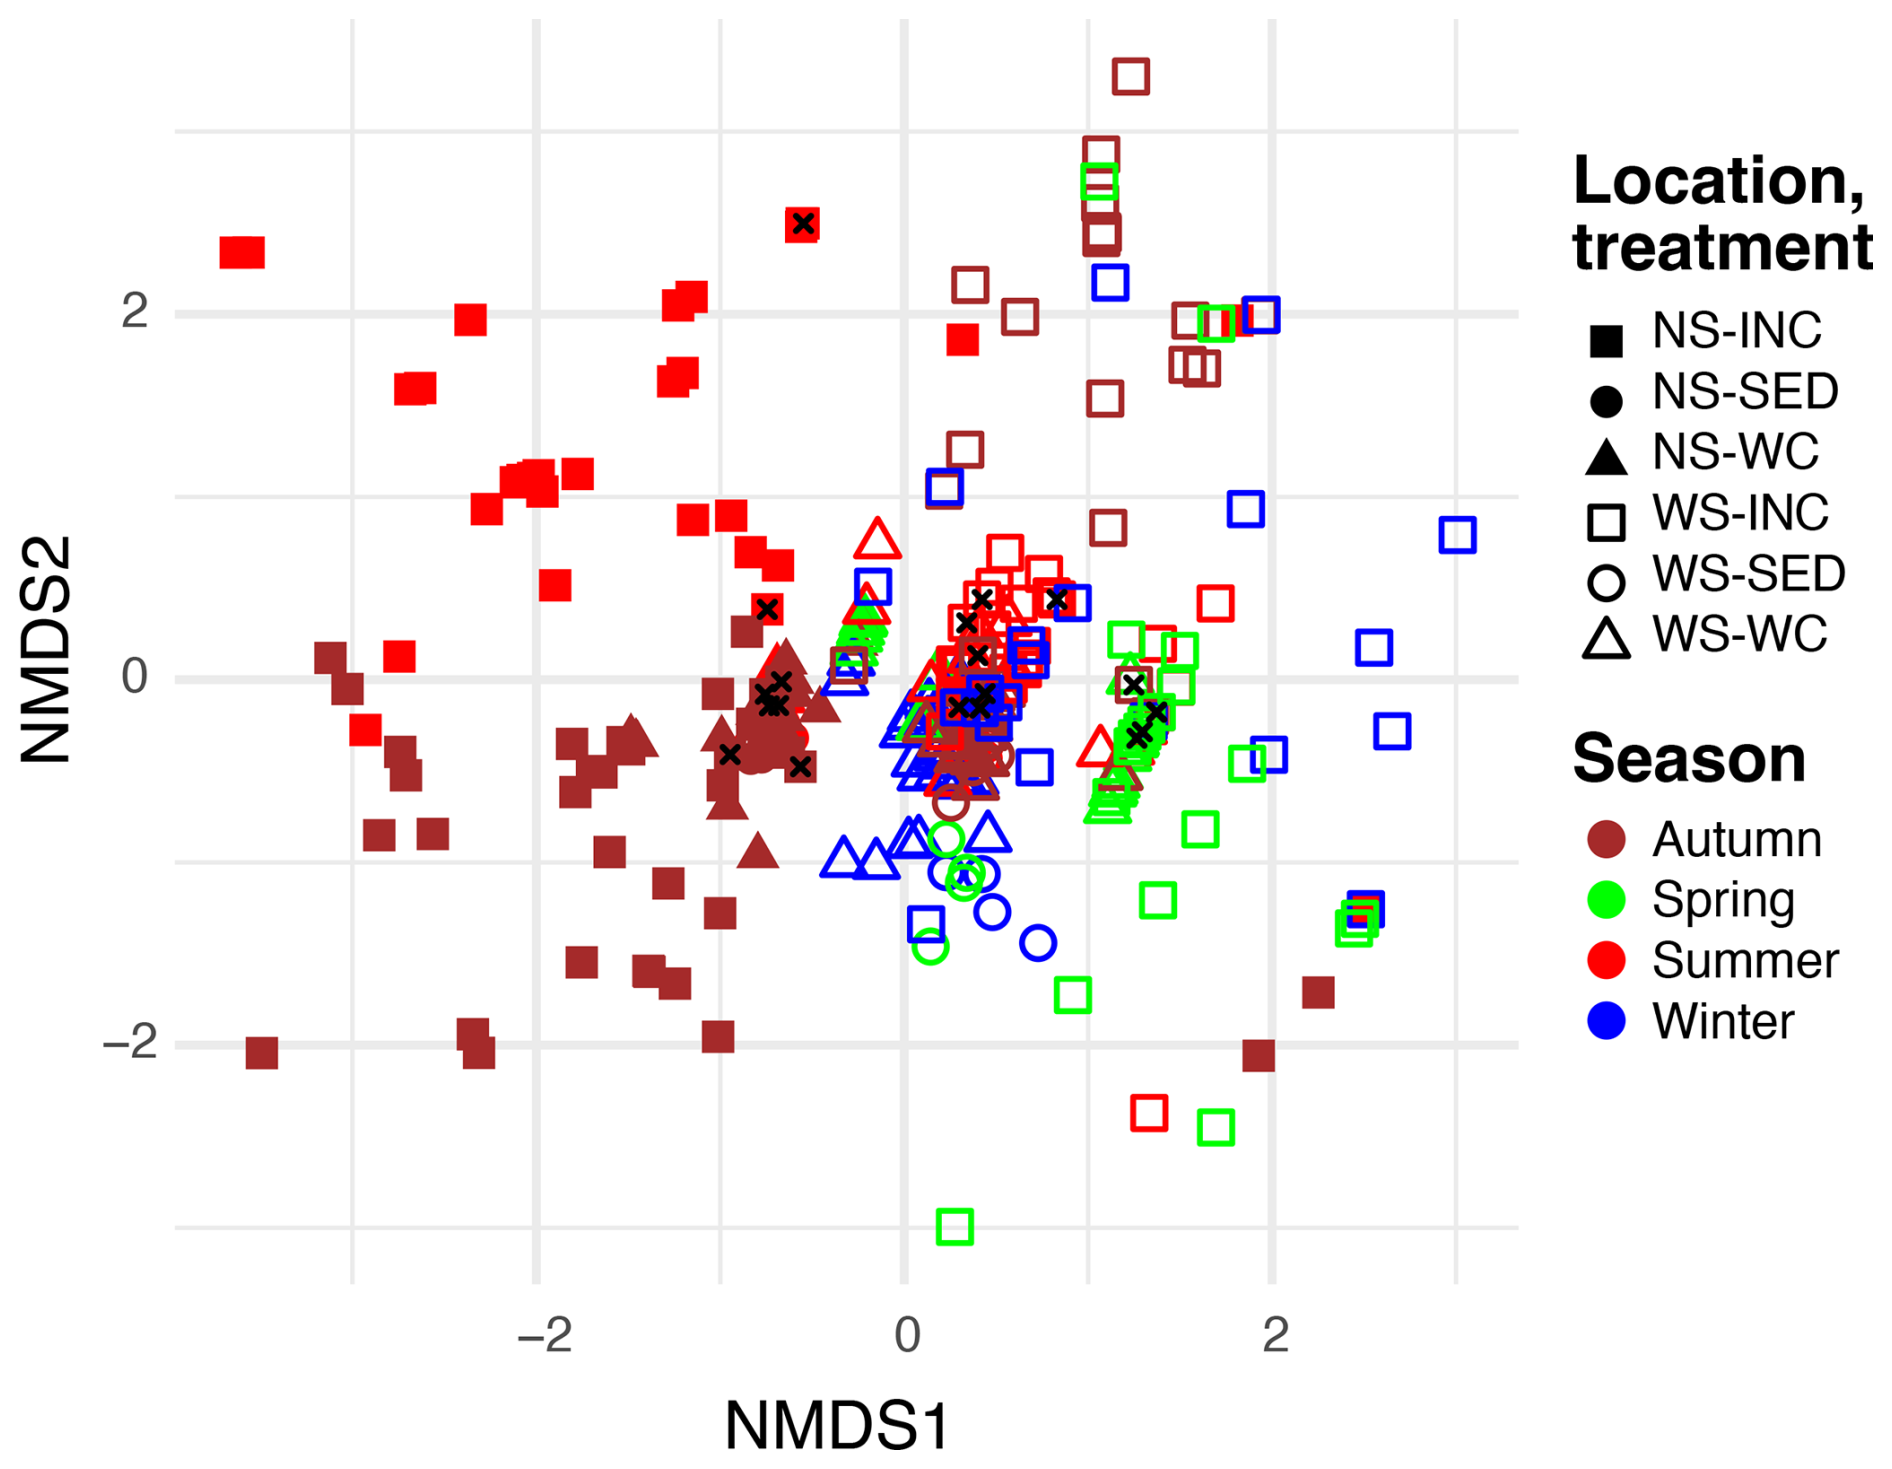
Figure 4Non-metric multidimensional scaling (NMDS, stress = 0.09) plot of methane-oxidizing bacteria (MOBs) in environmental water column (WC) and sediment samples (SED), as well as incubated (INC) water column samples from the North Sea (NS) for summer and autumn and from the Wadden Sea (WS) for winter, spring, summer, and autumn. Samples taken at the start of the incubation are indicated with a black cross.
Sediments from both locations formed distinct clusters located on the side of the environmental water column samples considering the horizontal NMDS axis and appeared to be more similar to the Wadden Sea samples than to the North Sea samples on the vertical axis. The location of the sediment samples thus seems to have a smaller effect than the location of the water column samples. The environmental water column samples from the Wadden Sea and North Sea were, furthermore, clustered by season, and depth-related differences were apparent for the North Sea summer samples too. While the NMDS analysis revealed slight seasonal differences for North Sea incubations, such differences were less apparent for Wadden Sea incubations.
3.4.2 MOB community variability
A second NMDS analysis focused solely on MOB genera, including only ASVs assigned to the genus level (Fig. 4). Similarly to the NMDS analysis of the total bacterial community, this MOB-focused NMDS revealed a segregation between North Sea and Wadden Sea incubations (horizontal axis), with seasonal differences that are particularly apparent for the North Sea and less pronounced for the Wadden Sea. The MOB community of all environmental samples (both water column and sediment) clustered tightly near the origin. The MOB community in the t0 samples of our incubation experiments also clustered near the environmental samples at the origin of Fig. 4, while incubation samples displayed variation from these by scattering further away from the origin.
Understanding how MOB communities adapt to environmental changes is crucial for predicting their role in coastal ecosystems amidst climate change. Our study explores the development of MOB communities in microcosms with inoculate from North Sea and Wadden Sea waters collected during different seasons and incubated at various methane concentrations, temperatures, and salinity levels. These factors are critical environmental variables influencing MOB community structure. We chose experimental conditions to investigate MOB communities in a future, likely warmer coastal ocean, i.e. conditions reflecting rather drastic changes in water column temperature and CH4 availability. In the area south of the Dogger Bank (North Sea), in situ temperature typically remains below 20 °C in summer and around 5 °C in winter (Greenwood et al., 2010; de Groot et al., 2024). Wadden Sea temperatures can exceed North Sea values but generally stay below 25 °C (de Groot et al., 2023). Methane headspace concentrations of 0.1 %, 1 %, and 5 % (equivalent to ∼ 1, 11, and 53 µM at 25 °C and 30 psu) are on the high end compared to natural conditions, where in situ concentrations are typically < 2 µM (North Sea) and < 0.2 µM (Wadden Sea) at present (de Groot et al., 2023, 2024). Salinity was adjusted only in Wadden Sea incubations to reflect natural variability; for North Sea samples, salinity remained unchanged as substantial shifts are unlikely in more offshore waters.
4.1 MOB community adaptation and incubation effects
Our investigations reveal a clear distinction between incubations from the North Sea and the Wadden Sea inoculates at both the level of the whole microbial community (Fig. 3) and within the MOB community (Fig. 4). This distinction is apparently independent of sampling time or how environmental parameters were experimentally changed during the incubation period. Additionally, we found a disparity in the apparent MOB community composition in environmental samples when compared to microcosms at t0. The original MOB community in environmental samples (water column and sediments) from the North Sea and Wadden Sea comprised predominantly Methyloceanibacter, with lesser contributions from MMG2, Methyloprofundus, Crenothrix, and Methylomarinum (Figs. S1 and S2). At t0, Methyloceanibacter was also present (except in the summertime North Sea inocula), but other canonical MOB genera such as MMG2 and Methylomonas only contributed minimally to the MOB community (Figs. 1 and 2). Furthermore, MMG2 and Methylomonas comprised the majority of MOBs in incubations with North Sea waters collected during summertime, though Methylomonas was not detected in the original, environmental North Sea samples (Fig. S1). The apparent scarcity and observed diversity of canonical MOBs in the environmental samples and at the beginning of the incubation (t0) are likely to be related to the detection limit of the molecular methods used here, which was apparently not sufficient to capture rare microbial communities. Nevertheless, as the incubations progressed under manipulated environmental conditions, the initially undetectable MOB communities thrived and, in many cases, became the most abundant microbial groups (Figs. S1, S2, 1, and 2). This successful enrichment of MOB communities from various ecosystems, including different seasons, depths, and locations, highlights the adaptability and resilience of these microorganisms to diverse environmental conditions. By subjecting natural environmental microbial communities to a range of different conditions such as variations in methane concentration, temperature, and salinity, we were able to observe how these parameters shape community composition, favouring microorganisms that are best suited to thrive under specific conditions.
Differences observed in the community composition among individual replicates under the same incubation conditions can be partially attributed to what is commonly referred to as the “bottle effect” (Zobell, 1943; Massana et al., 2001; Calvo-Díaz et al., 2011). This phenomenon describes the variation between replicates of the same inoculum, resulting in divergent community compositions over time. The “bottle effect” arises from micro-variations in in vitro conditions and stochastic processes, leading to slight disparities in cell numbers and compositions among replicates of the same inoculum. These subtle variations can substantially influence the growth rates of individual microorganisms. Moreover, stochastic effects play a crucial role in driving community development within microcosms (Haro-Moreno et al., 2019). This is evidenced by instances where three replicates yield three distinct communities, as observed in the case of MOB communities incubated at 15 °C with Wadden Sea winter inoculum (Fig. 2). The exact relationship between such stochastic effects and the initial microbial community composition in each individual inoculum added to the bottles, as well as the extent to which slight variations in growth and death rates contribute to the observed results, remains speculative (Hammes et al., 2010; Kalenitchenko et al., 2021; Debray et al., 2022). Despite these challenges, our incubations successfully enriched natural MOB communities from various ecosystems.
4.2 MOBs in the environment and the influence of environmental parameters
The versatility of MOBs across ecosystems underscores the wide range of conditions in which MOBs may perform methane oxidation, thereby reducing methane liberation from various ecosystems to the atmosphere (Knief, 2015; Bodelier et al., 2019). While type-I MOBs seemingly dominate aquatic environments, both type-I and type-II MOBs inhabit terrestrial systems. In these terrestrial environments, MOBs can exhibit biogeographic patterns that are influenced by abiotic factors, such as temperature, pH, and moisture levels (Knief, 2015; Bodelier et al., 2019). It seems logical that abiotic factors such as methane levels shape marine MOB community composition too. For instance, Milano-WF1B-03 is prevalent in temperate and Arctic marine environments, thriving in methane-rich habitats like cold seeps (Mau et al., 2020; Gründger et al., 2021; Sert et al., 2023; Broman et al., 2024). Our study corroborates this, with Milano-WF1B-03 flourishing in microcosms with high methane concentrations and a North Sea inoculum (Fig. 1). Similarly, Methyloprofundus, common in marine sediments (Tavormina et al., 2015), dominates at high methane concentrations but also seems to become more dominant at elevated temperatures (Gründger et al., 2021; Hirayama et al., 2022; Sert et al., 2023). Type-I MOB genera like Methylomicrobium and Methylomarinum thrive across various regions globally, with Methylomicrobium being particularly successful in high-salinity environments, as observed in Wadden Sea incubations in autumn (Jensen et al., 2008; Yu et al., 2018; Bodelier et al., 2019; Gründger et al., 2021). Similarly to the findings of Knief and Dunfield (2005), our results of high abundances of type-I MOBs at high headspace methane levels do not corroborate results from other systems where a dominance of type-II MOBs is typically associated with high methane levels (Henckel et al., 2000; Macalady et al., 2002; Bodelier and Laanbroek, 2004; Kessler et al., 2011; He et al., 2012, Steinle et al., 2016). However, we cannot rule out that our incubations might have become depleted in copper or other essential (micro)nutrients for type-II MOBs (Murrell, 2010).
Our study underscores the influence of environmental parameters on MOB community dynamics, with methane availability emerging as a primary factor shaping microbial community composition (Hanson and Hanson, 1996; Sherry et al., 2016; Li et al., 2021; Yao et al., 2022). While temperature and salinity surprisingly exert less apparent effects, higher methane concentrations led to more diverse and abundant MOB communities (Mau et al., 2013; James et al., 2016; Sherry et al., 2016; Li et al., 2019). Notably, no single MOB group dominated our incubations with high methane conditions, as evidenced by contrasting community compositions in different seasons and locations. For example, in incubations with 5 % methane, the MOB community was dominated by Methyloprofundus and MMG2 in the North Sea in summer, while Milano-WF1B-03 dominated North Sea autumn incubations, which is contrasted by a Methylomicrobium dominance in the Wadden Sea incubations in autumn. Despite being numerically rare when compared to other microbes, active methane-oxidizing strains within MOB communities play a crucial role in overall methane consumption (Bodelier et al., 2013). These findings underscore the importance of microbial diversity and traits in regulating global methane budgets and ecosystem functions, emphasizing the need for further research in this field.
4.3 The origin effect
MOB community composition in incubation samples was strongly dependent on the season in which they were taken. For example, the North Sea summer incubations were dominated by Methyloprofundus and MMG2, while the autumn incubations were dominated by Milano-WF1B-03 and other unassigned Methylomonadacea (Fig. 1). All known genera of the Methylomonadaceae are MOBs; hence, it seems not to be unlikely that the unidentified Methylomonadaceae comprises (potentially novel) MOBs too. Though we found some variations when comparing surface and bottom waters, the seasonal effect on these incubations was more pronounced. Also, the Wadden Sea incubations showed a clustering of samples by season (rather than with respect to the manipulated conditions; Fig. 2); however, these samples were more variable, and clusters of samples from different seasons overlapped, while they were more distinct and overlapped only slightly for the North Sea. While our results show that the microbial community in the incubations with adjusted abiotic factors (CH4 availability, temperature, and salinity) changed during incubation or when compared to the original environmental sample (both for the entire microbial community and for MOBs alone), we still observed clustering of communities linked to the origin of the inoculum. This clustering was associated with geographic location, water column vs. sediment source, and season, and was visible in both the MOB fraction and the overall microbial community (Figs. 3 and 4).
The composition of the initial inoculum and the environmental conditions to which microbes in the inoculum were exposed apparently exert a profound influence on community development. This origin effect is seemingly influenced by factors such as geographic location and seasonal variations, which coincide with important gradients in environmental conditions (see previous section). Speculating on the true MOB community composition in the collected inocula is challenging due to the limitations of detecting rare community members with DNA-sequence-based approaches resulting from, for example, sampling bias, stochastic effects during sample processing, and sequencing depth (Leray and Knowlton, 2017; Shirazi et al., 2021). The prevalence of Methyloceanibacter as the dominant genus in our environmental samples and at t0 suggests their potential survival, even if undetected by sequencing (Takeuchi et al., 2019, 2021). Despite relatively uniform MOB community patterns observed across origins (environmental water column), the persistent differences with location and season likely indicate distinct initial MOB communities. Our incubations indicate functional redundancy within the variable pool of MOBs, enabling multiple members to cope with drastic changes in environmental parameters such as methane availability, temperature, and salinity. Stochastic effects and historical contingencies may, in addition to the abiotic effect and the origin of a sample, determine which individual member of a functionally redundant group dominates the community after a certain incubation period (Kalenitchenko et al., 2021; Ramond et al., 2024).
In this study, we investigated shifts in the community composition of MOBs in controlled microcosm experiments using water column inocula collected from the North Sea and Wadden Sea during different seasons. Our findings reveal distinct differences primarily driven by the origin of the inoculant, particularly evident in experiments with methane amendments. Interestingly, variations in temperature and salinity exerted a lesser influence on MOB community structure compared to methane availability. These results highlight the remarkable functional redundancy within the MOB microbiome of the coastal ocean, contributing to its resilience and adaptability to environmental changes. Our study suggests that multiple MOBs possess the capacity to occupy ecological niches characterized by high methane levels, elevated temperatures, and variable salinity levels, providing insights into potential future scenarios in ocean ecosystems.
All data and scripts, as well as the parameter settings of the Cascabel pipeline, will be archived and made publicly available in the DAS database (https://doi.org/10.25850/nioz/7b.b.6h, Niemann and Engelmann, 2025, see the Supplement for details). Sequence data for this study have been deposited in the European Nucleotide Archive (ENA) under project nos. PRJEB85600 (https://www.ebi.ac.uk/ena/browser/view/PRJEB85600, last access: 23 September 2025, incubation experiments) and PRJEB76184 (https://www.ebi.ac.uk/ena/browser/view/PRJEB76184, last access: 23 September 2025, environmental sequences from the North Sea and Wadden Sea expeditions).
The supplement related to this article is available online at https://doi.org/10.5194/bg-22-5173-2025-supplement.
This study was conceptualized and designed by TRdG and HN. The incubation experiments were conducted by TRdG and JD. The bioinformatic analyses were performed by TRdG, PR, JCE, JvB, and HN. The research was supervised by JCE and HN. All of the authors contributed to writing and revising the paper.
At least one of the (co-)authors is a member of the editorial board of Biogeosciences. The peer-review process was guided by an independent editor, and the authors also have no other competing interests to declare.
Publisher’s note: Copernicus Publications remains neutral with regard to jurisdictional claims made in the text, published maps, institutional affiliations, or any other geographical representation in this paper. While Copernicus Publications makes every effort to include appropriate place names, the final responsibility lies with the authors.
We are grateful for the support provided by the captains and crews of RV Pelagia and RV Navicula. We extend further gratitude to the technical team of the molecular ecology laboratories at NIOZ – specifically Maartje Brouwer, Sanne Vreugdenhil, Harry Witte, Wietse Reitsma, and Alejandro Abdala Asbun – for their instrumental support, which was vital to the success of this study.
This paper was edited by Mark Lever and reviewed by two anonymous referees.
Abdala Asbun, A., Besseling, M. A., Balzano, S., Van Bleijswijk, J. D. L., Witte, H. J., Villanueva, L., and Engelmann, J. C.: Cascabel: A Scalable and Versatile Amplicon Sequence Data Analysis Pipeline Delivering Reproducible and Documented Results, Front. Genet., 11, 489357, https://doi.org/10.3389/fgene.2020.489357, 2020.
Bodelier, P. L. and Laanbroek, H. J.: Nitrogen as a regulatory factor of methane oxidation in soils and sediments, FEMS Microbiol. Ecol., 47, 265–277, https://doi.org/10.1016/S0168-6496(03)00304-0, 2004.
Bodelier, P. L. E., Meima-Franke, M., Hordijk, C. A., Steenbergh, A. K., Hefting, M. M., Bodrossy, L., Von Bergen, M., and Seifert, J.: Microbial minorities modulate methane consumption through niche partitioning, ISME J., 7, 2214–2228, 2013.
Bodelier, P. L. E., Pérez, G., Veraart, A. J., and Krause, S. M. B.: Methanotroph Ecology, Environmental Distribution and Functioning, in: Methanotrophs: Microbiology Fundamentals and Biotechnological Applications, edited by: Lee, E. Y., Springer International Publishing, 1–38, https://doi.org/10.1007/978-3-030-23261-0_1, 2019.
Broman, E., Olsson, M., Maciute, A., Donald, D., Humborg, C., Norkko, A., Jilbert, T., Bonaglia, S., and Nascimento, F. J. A.: Biotic interactions between benthic infauna and aerobic methanotrophs mediate methane fluxes from coastal sediments, ISME J., 18, https://doi.org/10.1093/ismejo/wrae013, 2024.
Callahan, B. J., Mcmurdie, P. J., Rosen, M. J., Han, A. W., Johnson, A. J. A., and Holmes, S. P.: DADA2: High-resolution sample inference from Illumina amplicon data, Nat. Methods, 13, 581–583, 2016.
Calvo-Díaz, A., Díaz-Pérez, L., Suárez, L.Á., Morán, X.a.G., Teira, E., and Marañón, E.: Decrease in the Autotrophic-to-Heterotrophic Biomass Ratio of Picoplankton in Oligotrophic Marine Waters Due to Bottle Enclosure, Appl. Environ. Microb., 77, 5739–5746, 2011.
Collins, M., Sutherland, M., Bouwer, L., Cheong, S.-M., Frolicher, T., Descombes, H. J., Roxy, M. K., Losada, I., Mcinnes, K., and Ratter, B.: Extremes, abrupt changes and managing risk, in: IPCC Special Report on the Ocean and Cryosphere in a Changing Climate eddited by: Pörtner, H.-O., Roberts, D. C., Masson-Delmotte, V., Zhai, P., Tignor, M., Poloczanska, E., Mintenbeck, K., Alegría, A., Nicolai, M., Okem, A., Petzold, J., Rama, B., and Weyer, N. M., Cambridge University Press, Cambridge, UK and New York, NY, USA, https://doi.org/10.1017/9781009157964.001, 2019.
Crespo-Medina, M., Meile, C. D., Hunter, K. S., Diercks, A. R., Asper, V. L., Orphan, V. J., Tavormina, P. L., Nigro, L. M., Battles, J. J., Chanton, J. P., Shiller, A. M., Joung, D. J., Amon, R. M. W., Bracco, A., Montoya, J. P., Villareal, T. A., Wood, A. M., and Joye, S. B.: The rise and fall of methanotrophy following a deepwater oil-well blowout, Nat. Geosci., 7, 423–427, 2014.
Debray, R., Herbert, R. A., Jaffe, A. L., Crits-Christoph, A., Power, M. E., and Koskella, B.: Priority effects in microbiome assembly, Nat. Rev. Microbiol., 20, 109–121, https://doi.org/10.1038/s41579-021-00604-w, 2022.
Dedysh, S. N. and Knief, C.: Diversity and Phylogeny of Described Aerobic Methanotrophs, in: Methane Biocatalysis: Paving the Way to Sustainability, edited by: Kalyuzhnaya, M. G. and Xing, X.-H., Springer International Publishing, https://doi.org/10.1007/978-3-319-74866-5_2, 2018.
de Groot, T. R., Mol, A. M., Mesdag, K., Ramond, P., Ndhlovu, R., Engelmann, J. C., Röckmann, T., and Niemann, H.: Diel and seasonal methane dynamics in the shallow and turbulent Wadden Sea, Biogeosciences, 20, 3857–3872, https://doi.org/10.5194/bg-20-3857-2023, 2023.
de Groot, T. R., Menoud, M., van Bleijswijk, J., van Leeuwen, S. M., van der Molen, J., Hernando-Morales, V., Czerski, H., Maazallahi, H., Walter, S., Rush, D., Röckmann, T., and Niemann, H.: Tidal and seasonal influence on cold seep activity and methanotroph efficiency in the North Sea, Commun. Earth Environ., 5, 368, https://doi.org/10.1038/s43247-024-01483-8, 2024.
Dixon, P.: VEGAN, a package of R functions for community ecology, J. Veg. Sci., 14, 927–930, 2003.
Ettwig, K. F., Alen, T. V., Pas-Schoonen, K. T. V. D., Jetten, M. S. M., and Strous, M.: Enrichment and Molecular Detection of Denitrifying Methanotrophic Bacteria of the NC10 Phylum, Appl. Environ. Microb., 75, 3656–3662, 2009.
Etminan, M., Myhre, G., Highwood, E. J., and Shine, K. P.: Radiative forcing of carbon dioxide, methane, and nitrous oxide: A significant revision of the methane radiative forcing, Geophys. Res. Lett., 43, 12614–12623, https://doi.org/10.1002/2016gl071930, 2016.
Ettwig, K. F., Butler, M. K., Paslier, D. L., Pelletier, E., Mangenot, S., Kuypers, M. M. M., Schreiber, F., Dutilh, B. E., Zedelius, J., Beer, D. de, Gloerich, J., Wessels, H., Alen, T. van, Luesken, F., Wu, M. L., Pas-Schoonen, K. T. van de, Camp, H. den, Janssen-Megens, E. M., Francoijs, K. J., Stunnenberg, H., Weissenbach, J., Jetten, M. S. M., and Strous, M.: Nitrite-driven anaerobic methane oxidation by oxygenic bacteria, Nature, 464, 543–548, https://doi.org/10.1038/nature08883, 2010.
Ghashghavi, M., Jetten, M. S. M., and Lüke, C.: Survey of methanotrophic diversity in various ecosystems by degenerate methane monooxygenase gene primers, AMB Express 7, 162, https://doi.org/10.1186/s13568-017-0466-2, 2017.
Greenwood, N., Parker, E. R., Fernand, L., Sivyer, D. B., Weston, K., Painting, S. J., Kröger, S., Forster, R. M., Lees, H. E., Mills, D. K., and Laane, R. W. P. M.: Detection of low bottom water oxygen concentrations in the North Sea; implications for monitoring and assessment of ecosystem health, Biogeosciences, 7, 1357–1373, https://doi.org/10.5194/bg-7-1357-2010, 2010.
Gründger, F., Probandt, D., Knittel, K., Carrier, V., Kalenitchenko, D., Silyakova, A., Serov, P., Ferré, B., Svenning, M. M., and Niemann, H.: Seasonal shifts of microbial methane oxidation in Arctic shelf waters above gas seeps, Limnol. Oceanogr., 66, 1896–1914, 2021.
Hammes, F., Vital, M., and Egli, T.: Critical Evaluation of the Volumetric “Bottle Effect” on Microbial Batch Growth. Appl. Environ. Microb. 76, 1278–1281, 2010.
Hanson, R. S. and Hanson, T. E.: Methanotrophic Bacteria, Microbiol. Rev., 60, https://doi.org/10.1128/mr.60.2.439-471.1996 1996.
Haque, M. F. U., Xu, H.-J., Murrell, J. C., and Crombie, A.: Facultative methanotrophs – diversity, genetics, molecular ecology and biotechnological potential: a mini-review, Microbiology, 166, 894–908, 2020.
Haro-Moreno, J. M., Rodriguez-Valera, F., and López-Pérez, M.: Prokaryotic Population Dynamics and Viral Predation in a Marine Succession Experiment Using Metagenomics, Front. Microbiol., 10, https://doi.org/10.3389/fmicb.2019.02926, 2019.
He, R., Wooller, M. J., Pohlman, J. W., Quensen, J., Tiedje, J. M., and Leigh, M. B.: Shifts in Identity and Activity of Methanotrophs in Arctic Lake Sediments in Response to Temperature Changes. Appl. Environ. Microb., 78, 4715–4723, 2012.
Henckel, T., Jäckel, U., Schnell, S., and Conrad, R.: Molecular analyses of novel methanotrophic communities in forest soil that oxidize atmospheric methane, Appl. Environ. Microb., 66, 1801–1808, 2000.
Herlemann, D. P. R., Markert, S., Meeske, C., Andersson, A. F., Bruijn, I. de, Hentschker, C., Unfried, F., Becher, D., Jürgens, K., and Schweder, T.: Individual Physiological Adaptations Enable Selected Bacterial Taxa To Prevail during Long-Term Incubations, Appl. Environ. Microb., 85, https://doi.org/10.1128/aem.00825-19, 2019.
Hirayama, H., Takaki, Y., Abe, M., Imachi, H., Ikuta, T., Miyazaki, J., Tasumi, E., Uematsu, K., Tame, A., Tsuda, M., Tanaka, K., Matsui, Y., Watanabe, H. K., Yamamoto, H., and Takai, K.: Multispecies Populations of Methanotrophic Methyloprofundus and Cultivation of a Likely Dominant Species from the Iheya North Deep-Sea Hydrothermal Field, Appl. Environ. Microb., 88, doi.org/10.1128/aem.00758-21 2022.
Ho, A., De Roy, K., Thas, O., De Neve, J., Hoefman, S., Vandamme, P., Heylen, K., and Boon, N.: The more, the merrier: heterotroph richness stimulates methanotrophic activity, ISME J., 8, 1945–1948, 2014.
Ho, A., Mo, Y., Lee, H. J., Sauheitl, L., Jia, Z., and Horn, M. A.: Effect of salt stress on aerobic methane oxidation and associated methanotrophs; a microcosm study of a natural community from a non-saline environment, Soil Biol. Biochem., 125, 210–214, 2018.
James, R.H., Bousquet, P., Bussmann, I., Haeckel, M., Kipfer, R., Leifer, I., Niemann, H., Ostrovsky, I., Piskozub, J., Rehder, G., Treude, T., Vielstädte, L., and Greinert, J.: Effects of climate change on methane emissions from seafloor sediments in the Arctic Ocean: A review, Limnol. Oceanogr., 61, https://doi.org/10.1002/lno.10307, 2016.
Jensen, S., Neufeld, J. D., Birkeland, N.-K., Hovland, M., and Murrell, J. C.: Methane assimilation and trophic interactions with marine Methylomicrobium in deep-water coral reef sediment off the coast of Norway, FEMS Microbiol. Ecol., 66, 320–330, 2008.
Kalenitchenko, D., Peru, E., and Galand, P. E.: Historical contingency impacts on community assembly and ecosystem function in chemosynthetic marine ecosystems, Sci. Rep., 11, 13994, https://doi.org/10.1038/s41598-021-92613-1, 2021.
Kalyuzhnaya, M. G., Gomez, O. A., and Murrell, J. C.: The Methane-Oxidizing Bacteria (Methanotrophs), in: Taxonomy, Genomics and Ecophysiology of Hydrocarbon-Degrading Microbes, edited by: Mcgenity, T. J., Springer International Publishing, 245–278, ISBN 978-3-319-60053-6, https://doi.org/10.1007/978-3-319-60053-6_10-1, 2019.
Kessler, J. D., Valentine, D. L., Redmond, M. C., Du, M., Chan, E. W., Mendes, S. D., Quiroz, E. W., Villanueva, C. J., Shusta, S. S., Werra, L. M., Yvon-Lewis, S. A., and Weber, T. C.: A Persistent Oxygen Anomaly Reveals the Fate of Spilled Methane in the Deep Gulf of Mexico, Science, 331, 312–315, 2011.
Knief, C.: Diversity and Habitat Preferences of Cultivated and Uncultivated Aerobic Methanotrophic Bacteria Evaluated Based on pmoA as Molecular Marker, Front. Microbiol., 6, https://doi.org/10.3389/fmicb.2015.01346, 2015.
Knief, C. and Dunfield, P. F.: Response and adaptation of different methanotrophic bacteria to low methane mixing ratios, Environ. Microbiol., 7, 1307–1317, https://doi.org/10.1111/j.1462-2920.2005.00814.x, 2005.
Kox, M. A. R., Haque, M. F. U., Alen, T. A. V., Crombie, A. T., Jetten, M. S. M., Camp, H. J. M. O. D., Dedysh, S. N., Kessel, M. A. H. J. V., and Murrell, J. C.: Complete Genome Sequence of the Aerobic Facultative Methanotroph Methylocella tundrae Strain T4, Microbiol. Resour. Announc., 8, https://doi.org/10.1128/mra.00286-19, 2019.
Leray, M. and Knowlton, N.: Random sampling causes the low reproducibility of rare eukaryotic OTUs in Illumina COI metabarcoding, PeerJ, 5, https://doi.org/10.7717/peerj.3006, 2017.
Li, J., Liu, C., He, X., Santosh, M., Hu, G., Sun, Z., Li, Y., Meng, Q., and Ning, F.: Aerobic microbial oxidation of hydrocarbon gases: Implications for oil and gas exploration, Mar. Petrol. Geol., 103, 76–86, 2019.
Li, J., Xu, X., Liu, C., Wu, N., Sun, Z., He, X., and Chen, Y.: Active Methanotrophs and Their Response to Temperature in Marine Environments: An Experimental Study, J. Mar. Sci. Eng., 9, https://doi.org/10.3390/jmse9111261, 2021.
Love, M. I., Huber, W., and Anders, S.: Moderated estimation of fold change and dispersion for RNA-seq data with DESeq2, Genome Biol., 15, https://doi.org/10.1186/s13059-014-0550-8, 2014.
Macalady, J. L., Mcmillan, A. M., Dickens, A. F., Tyler, S. C., and Scow, K. M.: Population dynamics of type I and II methanotrophic bacteria in rice soils, Environ. Microbiol., 4, 148–157, 2002.
Mao, S.-H., Zhang, H.-H., Zhuang, G.-C., Li, X.-J., Liu, Q., Zhou, Z., Wang, W.-L., Li, C.-Y., Lu, K.-Y., Liu, X.-T., Montgomery, A., Joye, S. B., Zhang, Y.-Z., and Yang, G.-P.: Aerobic oxidation of methane significantly reduces global diffusive methane emissions from shallow marine waters, Nat. Commun., 13, https://doi.org/10.1038/s41467-022-35082-y, 2022.
Massana, R., Pedrüs![]() aliό, Carlos, Casamayor, E. O., and Gasol, J. M.: Changes in marine bacterioplankton phylogenetic composition during incubations designed to measure biogeochemically significant parameters, Limnol. Oceanogr., 46, 1181–1188, 2001.
aliό, Carlos, Casamayor, E. O., and Gasol, J. M.: Changes in marine bacterioplankton phylogenetic composition during incubations designed to measure biogeochemically significant parameters, Limnol. Oceanogr., 46, 1181–1188, 2001.
Masson-Delmotte, V., Zhai, P., Pirani, A., Connors, S. L., Péan, C., Berger, S., Caud, N., Chen, Y., Goldfarb, L., Gomis, M. I., Huang, M., Leitzell, K., Lonnoy, E., Matthews, J. B. R., Maycock, T. K., Waterfield, T., Yelekçi, O., Yu, R., Zhou, B.: IPCC, 2021: Climate Change 2021: The Physical Science Basis. Contribution of Working Group I to the Sixth Assessment Report of the Intergovernmental Panel on Climate Change, Cambridge University press, 2391 pp., https://doi.org/10.1017/9781009157896, 2021.
Mau, S., Blees, J., Helmke, E., Niemann, H., and Damm, E.: Vertical distribution of methane oxidation and methanotrophic response to elevated methane concentrations in stratified waters of the Arctic fjord Storfjorden (Svalbard, Norway), Biogeosciences, 10, 6267–6278, https://doi.org/10.5194/bg-10-6267-2013, 2013.
Mau, S., Tu, T.-H., Becker, M., Dos Santos Ferreira, C., Chen, J.-N., Lin, L.-H., Wang, P.-L., Lin, S., and Bohrmann, G.: Methane Seeps and Independent Methane Plumes in the South China Sea Offshore Taiwan, Front. Mar. Sci., 7, https://doi.org/10.3389/fmars.2020.00543, 2020.
Murrell, J. C.: The Aerobic Methane Oxidizing Bacteria (Methanotrophs), in: Handbook of Hydrocarbon and Lipid Microbiology, eddited by: Timmis, K. N., Springer, Berlin, 4699 pp., https://doi.org/10.1007/978-3-540-77587-4_143, 2010.
Niemann, H. and Engelmann, J.: Adaptation of methane oxidising bacteria to environmental changes: implications for coastal methane dynamics – data and scripts, V1, NIOZ [data set] and [code], https://doi.org/10.25850/nioz/7b.b.6h, 2025.
Niemann, H., Steinle, L., Blees, J., Bussmann, I., Treude, T., Krause, S., Elvert, M., and Lehmann, M. F.: Toxic effects of lab-grade butyl rubber stoppers on aerobic methane oxidation, Limnology Oceanogr Methods, 13, 40–52, https://doi.org/10.1002/lom3.10005, 2015.
Pol, A., Heijmans, K., Harhangi, H. R., Tedesco, D., Jetten, M. S. M., and Op Den Camp, H. J. M.: Methanotrophy below pH 1 by a new Verrucomicrobia species, Nature, 450, 874–878, 2007.
Parada, A. E., Needham, D. M., and Fuhrman, J. A.: Every base matters: assessing small subunit rRNA primers for marine microbiomes with mock communities, time series and global field samples, Environ. Microbiol., 18, 1403–1414, https://doi.org/10.1111/1462-2920.13023, 2016.
Quince, C., Lanzen, A., Davenport, R. J., and Turnbaugh, P. J.: Removing noise from pyrosequenced amplicons, BMC Bioinformatics, 12, doi.org/10.1186/1471-2105-12-38, 2011.
Ramond, P., Galand, P. E., and Logares, R.: Microbial functional diversity and redundancy: moving forward, FEMS Microbiol. Rev., https://doi.org/10.1093/femsre/fuae031, 2024.
Reeburgh, W. S.: Oceanic Methane Biogeochemistry, Chem. Rev., 107, 486–513, 2007.
Saunois, M., Martinez, A., Poulter, B., Zhang, Z., Raymond, P. A., Regnier, P., Canadell, J. G., Jackson, R. B., Patra, P. K., Bousquet, P., Ciais, P., Dlugokencky, E. J., Lan, X., Allen, G. H., Bastviken, D., Beerling, D. J., Belikov, D. A., Blake, D. R., Castaldi, S., Crippa, M., Deemer, B. R., Dennison, F., Etiope, G., Gedney, N., Höglund-Isaksson, L., Holgerson, M. A., Hopcroft, P. O., Hugelius, G., Ito, A., Jain, A. K., Janardanan, R., Johnson, M. S., Kleinen, T., Krummel, P. B., Lauerwald, R., Li, T., Liu, X., McDonald, K. C., Melton, J. R., Mühle, J., Müller, J., Murguia-Flores, F., Niwa, Y., Noce, S., Pan, S., Parker, R. J., Peng, C., Ramonet, M., Riley, W. J., Rocher-Ros, G., Rosentreter, J. A., Sasakawa, M., Segers, A., Smith, S. J., Stanley, E. H., Thanwerdas, J., Tian, H., Tsuruta, A., Tubiello, F. N., Weber, T. S., Werf, G. R. van der, Worthy, D. E. J., Xi, Y., Yoshida, Y., Zhang, W., Zheng, B., Zhu, Q., Zhu, Q., and Zhuang, Q.: Global Methane Budget 2000–2020, Earth Syst. Sci. Data, 17, 1873–1958, https://doi.org/10.5194/essd-17-1873-2025, 2025.
Sert, M. F., Schweitzer, H. D., De Groot, T. R., Kekäläinen, T., Jänis, J., Bernstein, H. C., Ferré, B., Gründger, F., Kalenitchenko, D., and Niemann, H.: Elevated methane alters dissolved organic matter composition in the Arctic Ocean cold seeps, Front. Earth Sci., 11, https://doi.org/10.3389/feart.2023.1290882, 2023.
Sherry, A., Osborne, K. A., Sidgwick, F. R., Gray, N. D., and Talbot, H. M.: A temperate river estuary is a sink for methanotrophs adapted to extremes of pH, temperature and salinity, Env. Microbiol. Rep., 8, 122–131, 2016.
Shirazi, S., Meyer, R. S., and Shapiro, B.: Revisiting the effect of PCR replication and sequencing depth on biodiversity metrics in environmental DNA metabarcoding, Ecol. Evol., 11, 15766–15779, https://doi.org/10.1002/ece3.8239, 2021.
Steinle, L., Graves, C. A., Treude, T., Ferre, B., Biastoch, A., Bussmann, I., Berndt, C., Krastel, S., James, R. H., Behrens, E., Boning, C. W., Greinert, J., Sapart, C.-J., Scheinert, M., Sommer, S., Lehmann, M. F., and Niemann, H.: Water column methanotrophy controlled by a rapid oceanographic switch, Nat. Geosci., 8, 378–382, https://doi.org/10.1038/ngeo2420, 2015.
Steinle, L., Schmidt, M., Bryant, L., Haeckel, M., Linke, P., Sommer, S., Zopfi, J., Lehmann, M. F., Treude, T., and Niemannn, H.: Linked sediment and water-column methanotrophy at a man-made gas blowout in the North Sea: Implications for methane budgeting in seasonally stratified shallow seas, Limnol. Oceanogr., 61, 367–386, 2016.
Stephens, M.: False discovery rates: a new deal, Biostat. (Oxf., Engl.), 18, 275–294, https://doi.org/10.1093/biostatistics/kxw041, 2017.
Takeuchi, M., Ozaki, H., Hiraoka, S., Kamagata, Y., Sakata, S., Yoshioka, H., and Iwasaki, W.: Possible cross-feeding pathway of facultative methylotroph Methyloceanibacter caenitepidi Gela4 on methanotroph Methylocaldum marinum S8, PloS One, 14, https://doi.org/10.1371/journal.pone.0213535, 2019.
Takeuchi, M., Ozaki, H., Hiraoka, S., Kamagata, Y., Sakata, S., Yoshioka, H., and Iwasaki, W.: Correction: Possible cross-feeding pathway of facultative methylotroph Methyloceanibacter caenitepidi Gela4 on methanotroph Methylocaldum marinum S8, PloS One, 16, https://doi.org/10.1371/journal.pone.0251538, 2021.
Tavormina, P. L., Orphan, V. J., Kalyuzhnaya, M. G., Jetten, M. S., and Klotz, M. G.: A novel family of functional operons encoding methane/ammonia monooxygenase-related proteins in gammaproteobacterial methanotrophs, Env. Microbiol. Rep., 3, https://doi.org/10.1111/j.1758-2229.2010.00192.x, 2011.
Tavormina, P. L., Hatzenpichler, R., McGlynn, S., Chadwick, G., Dawson, K. S., Connon, S. A., and Orphan, V. J.: Methyloprofundus sedimenti gen. nov., sp. nov., an obligate methanotroph from ocean sediment belonging to the `deep sea-1' clade of marine methanotrophs, Int. J. Syst. Evol. Microbiol., 65, 251–259, https://doi.org/10.1099/ijs.0.062927-0, 2015.
Vaksmaa, A., Knittel, K., Abdala Asbun, A., Goudriaan, M., Ellrott, A., Witte, H. J., Vollmer, I., Meirer, F., Lott, C., Weber, M., Engelmann, J. C., and Niemann, H.: Microbial Communities on Plastic Polymers in the Mediterranean Sea, Front. Microbiol., 12, https://doi.org/10.3389/fmicb.2021.673553, 2021.
Vekeman, B., Kerckhof, F.-M., Cremers, G., De Vos, P., Vandamme, P., Boon, N., Op Den Camp, H. J. M., and Heylen, K.: New Methyloceanibacter diversity from North Sea sediments includes methanotroph containing solely the soluble methane monooxygenase, Environ. Microbiol., 18, 4523–4536, 2016.
Weber, T., Wiseman, N. A., and Kock, A.: Global ocean methane emissions dominated by shallow coastal waters, Nat. Commun., 10, https://doi.org/10.1038/s41467-019-12541-7, 2019.
Yao, X., Wang, J., and Hu, B.: How methanotrophs respond to pH: A review of ecophysiology, Front. Microbiol., 13, https://doi.org/10.3389/fmicb.2022.1034164, 2022.
Yu, W.-J., Lee, J.-W., Nguyen, N.-L., Rhee, S.-K., and Park, S.-J.: The characteristics and comparative analysis of methanotrophs reveal genomic insights into Methylomicrobium sp. enriched from marine sediments, Syst. Appl. Microbiol., 41, 415–426, 2018.
Zhang, S., Yan, L., Cao, J., Wang, K., Luo, Y., Hu, H., Wang, L., Yu, R., Pan, B., Yu, K., Zhao, J., and Bao, Z.: Salinity significantly affects methane oxidation and methanotrophic community in Inner Mongolia lake sediments, Front. Microbiol., 13, https://doi.org/10.3389/fmicb.2022.1067017, 2023
Zobell, C. E.: The effect of solid surfaces upon bacterial activity, J. Bacteriol., 46, 39–56, 1943.