the Creative Commons Attribution 4.0 License.
the Creative Commons Attribution 4.0 License.
 | 08 Oct 2025
Aquatic metabolism influences temporal variations of water carbon and atmospheric carbon dioxide fluxes in a temperate salt marsh
Jérémy Mayen
Pierre Polsenaere
Aurore Regaudie de Gioux
Jonathan Deborde
Karine Collin
Yoann Le Merrer
Élodie Foucault
Vincent Ouisse
Laurent André
Marie Arnaud
Pierre Kostyrka
Éric Lamaud
Gwenaël Abril
Philippe Souchu
Salt marshes are blue carbon (C) ecosystems characterized by intense atmospheric CO2 uptake and C sequestration but also by organic and inorganic C exports through the tide. However, uncertainties about the main biotic factors controlling these vertical and horizontal C fluxes imply studying terrestrial and aquatic metabolisms simultaneously at small timescales (diurnal and tidal) to distinguish their contributions to net ecosystem CO2 exchange (NEE). In a temperate salt marsh, four sampling 24 h cycles were performed to measure all water C biogeochemical parameters (including CO2 partial pressures, pCO2), nutrients, and aquatic metabolism simultaneously to NEE from high tide during marsh immersion (imported coastal waters influenced by the continental shelf) to low tide during marsh emersion (exported channel waters influenced by the marsh drainage). At high tide, water CO2 oversaturation (water pCO2 > air pCO2) due to marsh aquatic heterotrophy and CO2-concentrated water inputs from the coastal end-member induced water–air CO2 emissions during marsh immersion. At low tide, water pCO2 in the channel were also mainly controlled by the marsh aquatic metabolism, inducing a water CO2 oversaturation in winter due to dominant heterotrophy and a water CO2 undersaturation in spring and summer due to dominant autotrophy. In winter, the greatest increases in dissolved inorganic carbon (DIC; from 2354 to 3963 µmol kg−1), total alkalinity (TA; from 2508 to 4016 µmol kg−1) and dissolved inorganic nitrogen (DIN; from 27.7 to 68.4 µM) were measured simultaneously during low tide at night, probably due to intense aerobic/anaerobic microbial respiration of organic matter in channel waters and/or sediments resulting in the greatest water pCO2 increase (from 533 to 1461 ppmv). On the contrary, in spring and summer, large water pCO2 decreases (down to 83 ppmv) and dissolved organic carbon (DOC) increases (up to 1040 µM) from high to low tide could be related to intense autochthonous and allochthonous marsh primary production, including benthic microalgae, phytoplankton and macroalgae. This study suggests that the horizontal exchanges of coastal waters with the salt marsh significantly modify water C dynamics and associated water CO2 sink/source state in the channel due to an intense marsh metabolism (production and respiration). At the daily scale, plant and phytoplankton metabolism rates played a major and a minor role, respectively, in the marsh CO2 sink measured by atmospheric eddy covariance at the ecosystem scale (NEE), even during immersion where emerged plants located on the highest marsh levels can maintain a low CO2 uptake, despite aquatic heterotrophy and associated water–air CO2 emissions.
- Article
(5275 KB) - Full-text XML
-
Supplement
(850 KB) - BibTeX
- EndNote


Atmospheric CO2 emissions as a result of anthropogenic activities have strongly modified the biogeochemical equilibrium of the global carbon (C) cycle, favouring global warming and sea-level rise (Friedlingstein et al., 2023). Significant amounts of anthropogenic CO2 have been taken up by marine environments via CO2 solubilization in seawater and phytoplankton photosynthesis. However, uncertainties yet remain about the redistribution of these CO2 fluxes and associated processes, particularly in the vegetated coastal systems such as salt marshes (Bauer et al., 2013; Cai, 2011). Indeed, salt marshes are among the most productive ecosystems in the biosphere, with net ecosystem production (NEP) rates of 382 (Alongi, 2020) and 448 (Wang et al., 2024), which means they act as significant CO2 sinks (Cai, 2011). A part of marsh primary production (∼8 %) can be buried in sediments as “blue carbon” (Chmura et al., 2003; Song et al., 2023), helping to offset anthropogenic CO2 emissions. Blue carbon burial rates in vegetated coastal systems such as salt marshes (), mangroves () and seagrass beds () are among the highest on Earth and thus significantly contribute (per surface unit) to the global carbon cycle in comparison to terrestrial ecosystems (Adame et al., 2024; Mcleod et al., 2011). The majority of marsh primary production (>70 %) is respired and exported out of the system through horizontal and vertical carbon fluxes whose dynamics strongly depend on seasonal, diurnal and tidal rhythms (Nakamura et al., 2024; Song et al., 2023; Wang et al., 2016). Various respiration processes in marsh sediments and waters produce and export large quantities of dissolved inorganic carbon (DIC) and total alkalinity (TA) by tides, thus influencing in turn partial pressures of CO2 (pCO2) or, more generally, the carbonate system of tidal waters (Reithmaier et al., 2023; Santos et al., 2021; Wang et al., 2016) and the carbon balance of downstream coastal systems (Bauer et al., 2013; Cai, 2011). The second pathway for marsh carbon loss is atmospheric CO2 emissions from emerged and immersed marsh respiration (Song et al., 2023). Consequently, the strong heterogeneity of horizontal and vertical carbon fluxes in salt marshes, caused by seasonal, diurnal and tidal rhythms (Song et al., 2023; Wang et al., 2018), requires simultaneous integrative measurements of net ecosystem CO2 exchanges (NEEs) and organic and inorganic carbon in tidal waters to better evaluate all marsh carbon processes and fluxes at the various temporal and spatial scales.
In terrestrial ecosystems, NEE measured by atmospheric eddy covariance (EC) generally corresponds to NEP (Chapin et al., 2006; Kowalski et al., 2003). However, in salt marshes, the latter relationship is more complex, and NEE does not fully correspond to NEP since lateral DIC exports are not recorded by EC measurements, especially during flood and ebb tides (Mayen et al., 2024; Wang et al., 2018). During marsh emersion, NEE mainly occurs at the soil–atmosphere interface, implying a strong contribution from benthic NEP (plants and sediments) to atmospheric CO2 exchanges (Forbrich and Giblin, 2015; Schäfer et al., 2014). For example, in a French vegetated salt marsh, high rates of primary production and respiration induced a yearly CO2 uptake during daytime emersion () and a yearly CO2 emission during night-time emersion (; Mayen et al., 2024). In addition, microphytobenthos (MPB) in sediments, composed of benthic microalgae, can migrate to the surface of muddy sediments during daytime emersion to use photosynthetically active radiation and contribute to benthic NEP (Migné et al., 2007; Xi et al., 2019). Conversely, emerged sediments can also behave as a net CO2 source towards the atmosphere, especially during the non-growing season, mainly due to the predominant microbial decomposition of soil organic matter (Gong et al., 2023). During marsh immersion, advected coastal waters create a physical barrier between benthic and atmospheric compartments, which strongly influences NEE (Chapin et al., 2006; Mayen et al., 2024). In this situation, NEE combines cumulated contributions from benthic NEP, planktonic NEP and horizontal carbon exchanges through the tide. In addition, during immersion, organic carbon produced at emersion can be transferred to the water column and contribute to planktonic NEP, such as MPB (Polsenaere et al., 2012; Savelli et al., 2019). The shallowness of coastal environments can simultaneously favour both high primary production rates of planktonic communities due to significant light penetration in water (Gazeau et al., 2004) and strong sediment–water DIC effluxes (Gong et al., 2023; Wang et al., 2016; Wang and Cai, 2004). Previous studies in salt marshes highlight water–air CO2 emissions during immersion due to heterotrophic metabolism in tidal waters (Song et al., 2023; Wang et al., 2018). However, few studies show the contribution of water CO2 and planktonic communities to marsh metabolic fluxes measured by EC at the ecosystem scale. Therefore, it is important to study more precisely the whole marsh metabolism, integrating terrestrial and aquatic compartments at the different spatiotemporal scales and pinpointing their respective contributions to net ecosystem CO2 exchanges (sink/source) to better take into account salt marshes in regional and global carbon balances.
In a temperate salt marsh, this present study focuses on aquatic metabolism influence on water carbon dynamics and net ecosystem CO2 exchanges at small timescales (diurnal and tidal) during the four seasons. The main aims of this paper are (1) to highlight the biotic and abiotic controlling factors on water carbon variations, in particular water pCO2, (2) to study the metabolic status of planktonic communities in the marsh as CO2 sink or source and (3) to identify the contribution of the water pCO2 signature and planktonic/water column metabolism to NEE. For this purpose, we performed four seasonal 24 h cycles (continuous samplings for 24 h) measuring relevant water biogeochemical parameters (pCO2, organic and inorganic carbon and nutrients), planktonic metabolism and water–air CO2 fluxes at a single point in the main channel of the salt marsh connected to the upstream salt ponds and downstream continental shelf. The novelty of this study was to look for the aquatic metabolism contribution to water carbon dynamics and water–air CO2 fluxes, using in situ carbon samplings over seasonal 24 h cycles simultaneously with continuous ecosystem CO2 exchange measurements (NEE) by atmospheric eddy covariance.
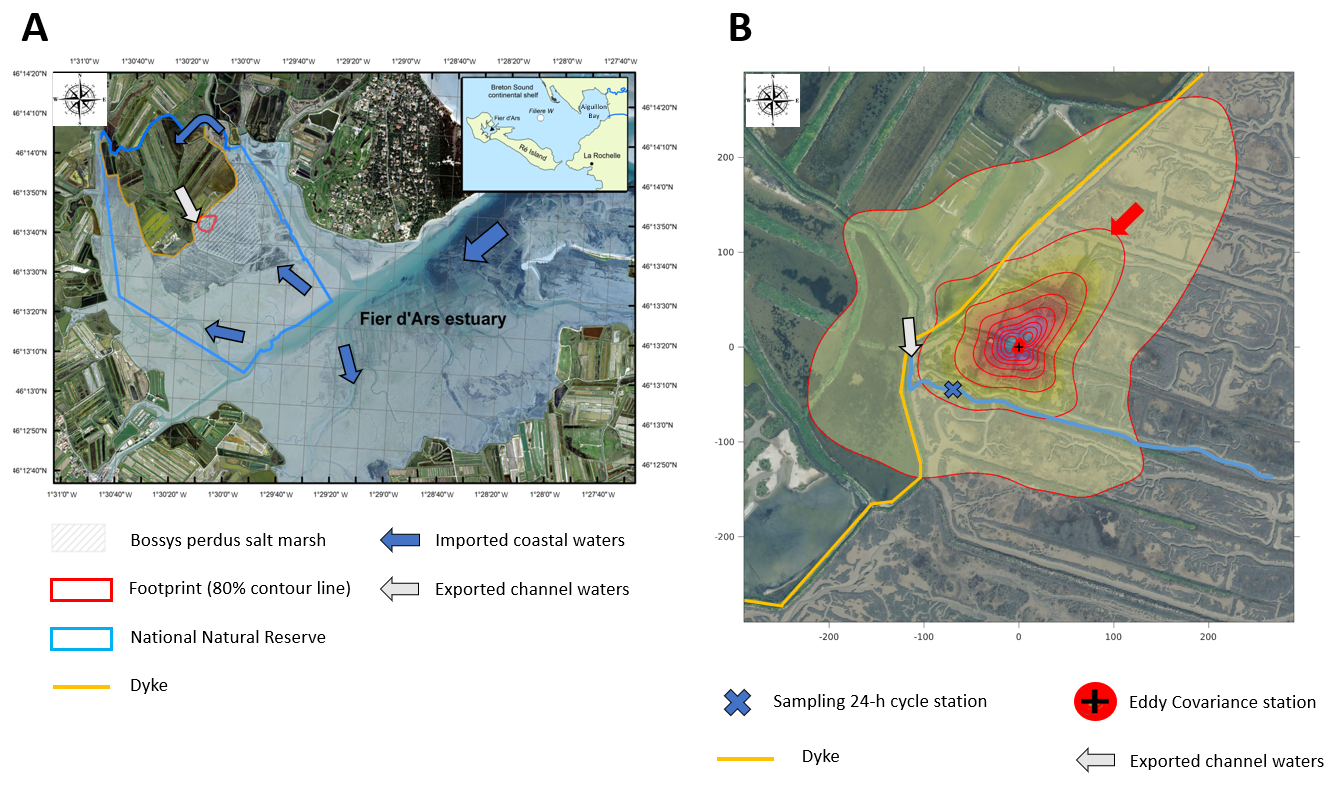
Figure 1(a) The Bossys perdus salt marsh, located on the French Atlantic coast on Ré Island within the National Natural Reserve. This tidal salt marsh is connected to the downstream Fier d'Ars estuary (tidally immersed areas represented in light blue) and upstream artificial salt marshes (i.e. salt ponds). The dyke (yellow line) separates the terrestrial and maritime marsh areas. Blue arrows represent coastal water inputs from the estuary and the continental shelf at high tide (tidal marsh flooding and salt pond supplying), and grey arrows represent exported waters at low tide from salt ponds to the estuary through the main studied channel. The studied footprint area (80 % contour line) of the Bossys perdus marsh is indicated (red line). (b) The location and setup of the eddy covariance system in the Bossys perdus salt marsh at low tide (marsh emersion) and its associated footprints averaged over the year 2021. The red arrow indicates the studied footprint contour line encompassing the water sampling location (blue cross). Information from georeferenced IGN (Institut national de l'information géographique et forestière) orthogonal images (IGN, 2019).
2.1 Study site
The Bossys perdus salt marsh is a vegetated intertidal wetland (52.5 ha) located along the French Atlantic coast on Ré Island (Fig. 1a). The salt marsh is located within the Fier d'Ars tidal estuary which receives coastal waters from the Breton Sound continental shelf during high-tide periods (Fig. 1a). This intercommunication enables (1) the immersion of the estuarine intertidal zone (including the studied salt marsh) and (2) the water supply for artificial salt marshes (i.e. salt ponds) upstream of the dyke. Water residence times in the salt ponds vary from a few hours to a fortnight depending on seasonal management practice. Generally, macroalgae blooms (Ulva spp.) colonize salt ponds from April to October each year (Mayen et al., 2023). After intensive land use (salt harvesting and oyster farming), the Bossys perdus salt marsh is now protected within a National Natural Reserve to restore its natural hydrodynamics and vegetation while conserving the site's specific typology due to past human activities (channel networks, humps and dykes; Fig. 1b) (Mayen et al., 2024). Two different substrata can be found in the soil of the salt marsh, with sand-dominated sediments at the bottom and mud-dominated sediments at the top (transition depth of 33 cm). In the muddy section, dry bulk density and organic carbon content were and 1.78±0.19 %, respectively (Amann et al., 2024). The salt marsh is subject to semi-diurnal tides originating on the continental shelf, allowing its immersion through channels differently in space, time and frequency depending on tidal periods. At high tide (HT), imported coastal waters gradually fill the sampling channel (Fig. 1b) and immerse the salt marsh at variable water heights depending on the tidal amplitudes and meteorological conditions. Due to the site's specific typology, the lowest marsh levels (mudflats and S. maritima) were quickly immersed (south), whereas the whole marsh immersion (all muds and plants) only occurred 0.75 h later at the highest water heights (Mayen et al., 2024). At low tide (LT), the channel empties and the salt marsh is emerged and exposed to the atmosphere. During this time, water remaining at the bottom of the channel comes from (i) the Bossys perdus marsh drainage process by tidal pumping and (ii) the water flow from the upstream salt ponds to the downstream estuary (Fig. 1b) at low water-height situations (0.50 m maximum depth; see Fig. S1 in Mayen et al., 2024) and fluctuates seasonally according to meteorological conditions and pond management (Mayen et al., 2023).
2.2 Sampling strategy and field samplings
At a single point in the main channel of the salt marsh (Fig. 1b), four seasonal 24 h cycles were performed from March to December 2021 (Fig. 2). For each 24 h cycle, our sampling strategy consisted of simultaneously measuring water biogeochemical parameters, planktonic metabolism and water–air CO2 fluxes at diurnal (daytime and night-time) and tidal (from high to low tide and all tidal phases in between) scales through discrete samplings and continuous real-time measurements. At this station, samplings of subsurface water were performed continuously every 1 or 2 h over the four 24 h cycles (n=13 over C1-winter, n=15 over C2-spring and C3-summer and n=16 over C4-fall), encompassing a large variation in water heights (Hw): from the channel bottom at low tide (Hw=0.5 m) to the full marsh immersion at high tide (Hw>2.5 m) with all tidal intermediate situations in between (Figs. 2 and S1 in the Supplement). When repeated across seasons, it allows one to sample the full tidal range and hence the heterogeneity of the tidal height, residence time and water mixing. These discrete samplings allowed the analysis of photosynthetic pigments (Chl a), carbonate system parameters (TA), nutrients (, , , DIP and DSi) and organic matter parameters (DOC, POC and PON) (Table 1). Water samples were collected using a 5 L glass bottle, directly filtered in the field and conditioned for chemical analysis in the laboratory. For organic matter, the sampling equipment was pre-washed with HCl 10 % (for 12 h), rinsed with deionized water and dried (Lorrain et al., 2003). The glassware and GF/F filters were pre-combusted (for 4 h at 450 °C). For planktonic metabolism measurements, water samples were collected every 6 h during each 24 h cycle (n=4) successively at low tide (LT; water remaining at the channel bottom) and high tide (HT; water flooding mostly at the marsh surface). At HT, when the marsh is fully flooded, horizontal homogenization of water masses occurs, due to surface water flows induced by complex tidal circulation and wind action. In addition, partial pressure of CO2 (pCO2), temperature, salinity and dissolved oxygen (DO) were measured every 10 min in subsurface waters using in situ probes. These measurements were also performed at the same frequency in the 4 d before each 24 h cycle. Thus, the successive hourly sampling over 24 h at LT during marsh emersion (exported channel waters influenced by the marsh) and at HT during marsh immersion (imported coastal waters influenced by the continental shelf) during both the day and night allowed us to take into account all carbon temporal variabilities (LT/Day, HT/Day, LT/Night, HT/Night; Fig. 2).
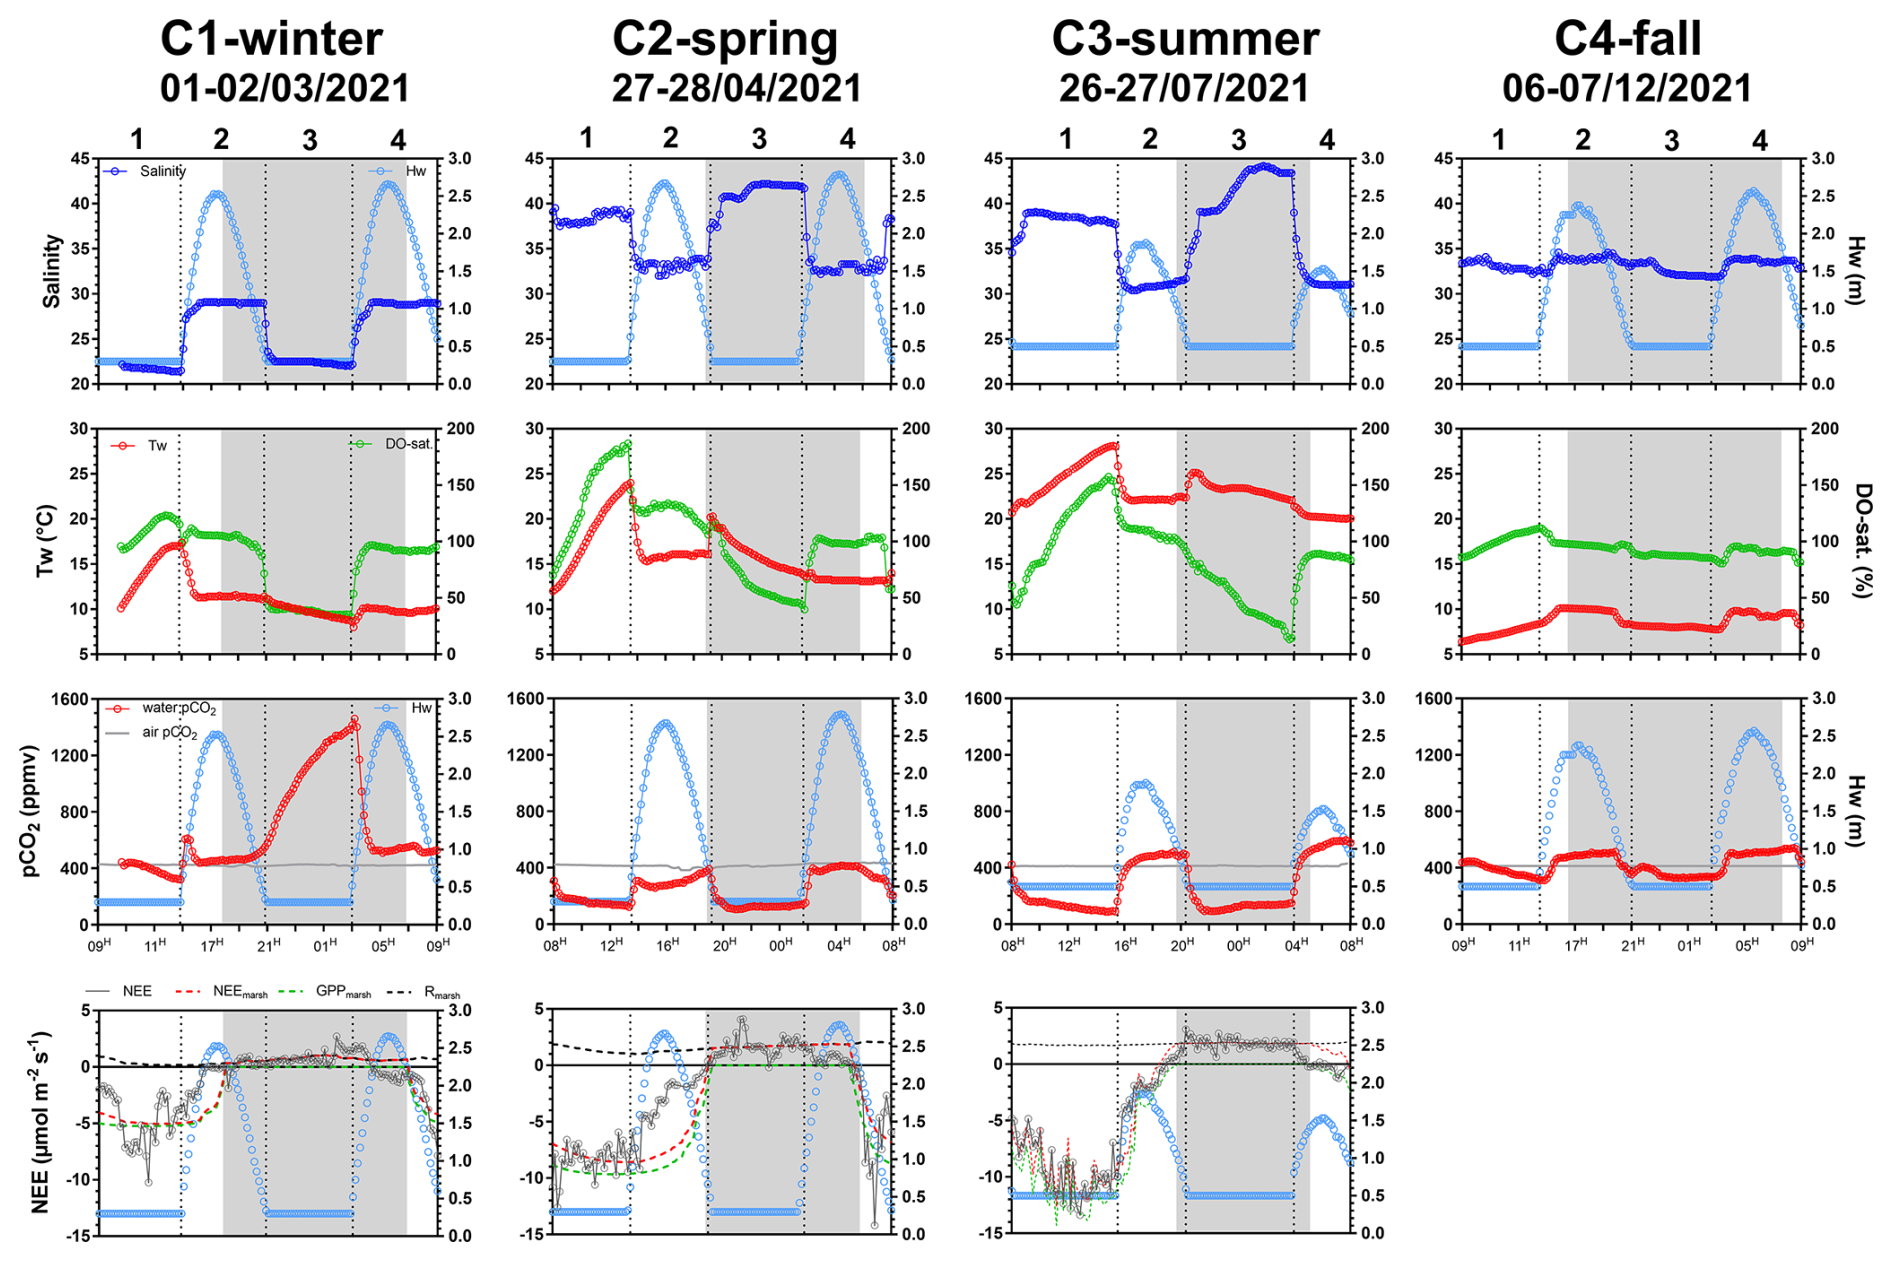
Figure 2Temporal variations of biogeochemical parameters measured during the four seasonal 24 h cycles: salinity, water height (Hw, m), water temperature (Tw; ° C), DO saturation level (DO-sat.; %), water pCO2 (ppmv), air pCO2 (ppm) and NEE fluxes (). Estimated NEEmarsh, GPPmarsh and Rmarsh fluxes () are presented simultaneously with measured NEE fluxes. All parameters were measured or estimated every 10 min during each 24 h cycle. Daytime periods (white areas) and night-time periods (grey areas) were separated into atmospheric PAR>10 and atmospheric , respectively. No variation in Hw (Hw=0.50 m) corresponds to low tide, and an increase/decrease in Hw () corresponds to high tide (flooding/ebbing). Vertical dotted lines distinguish low-tide day (LT/Day, 1), high-tide day (HT/Day, 2), low-tide night (LT/Night, 3) and high-tide night (HT/Night, 4). Each graduation of the x axis corresponds to 2 h in universal time.
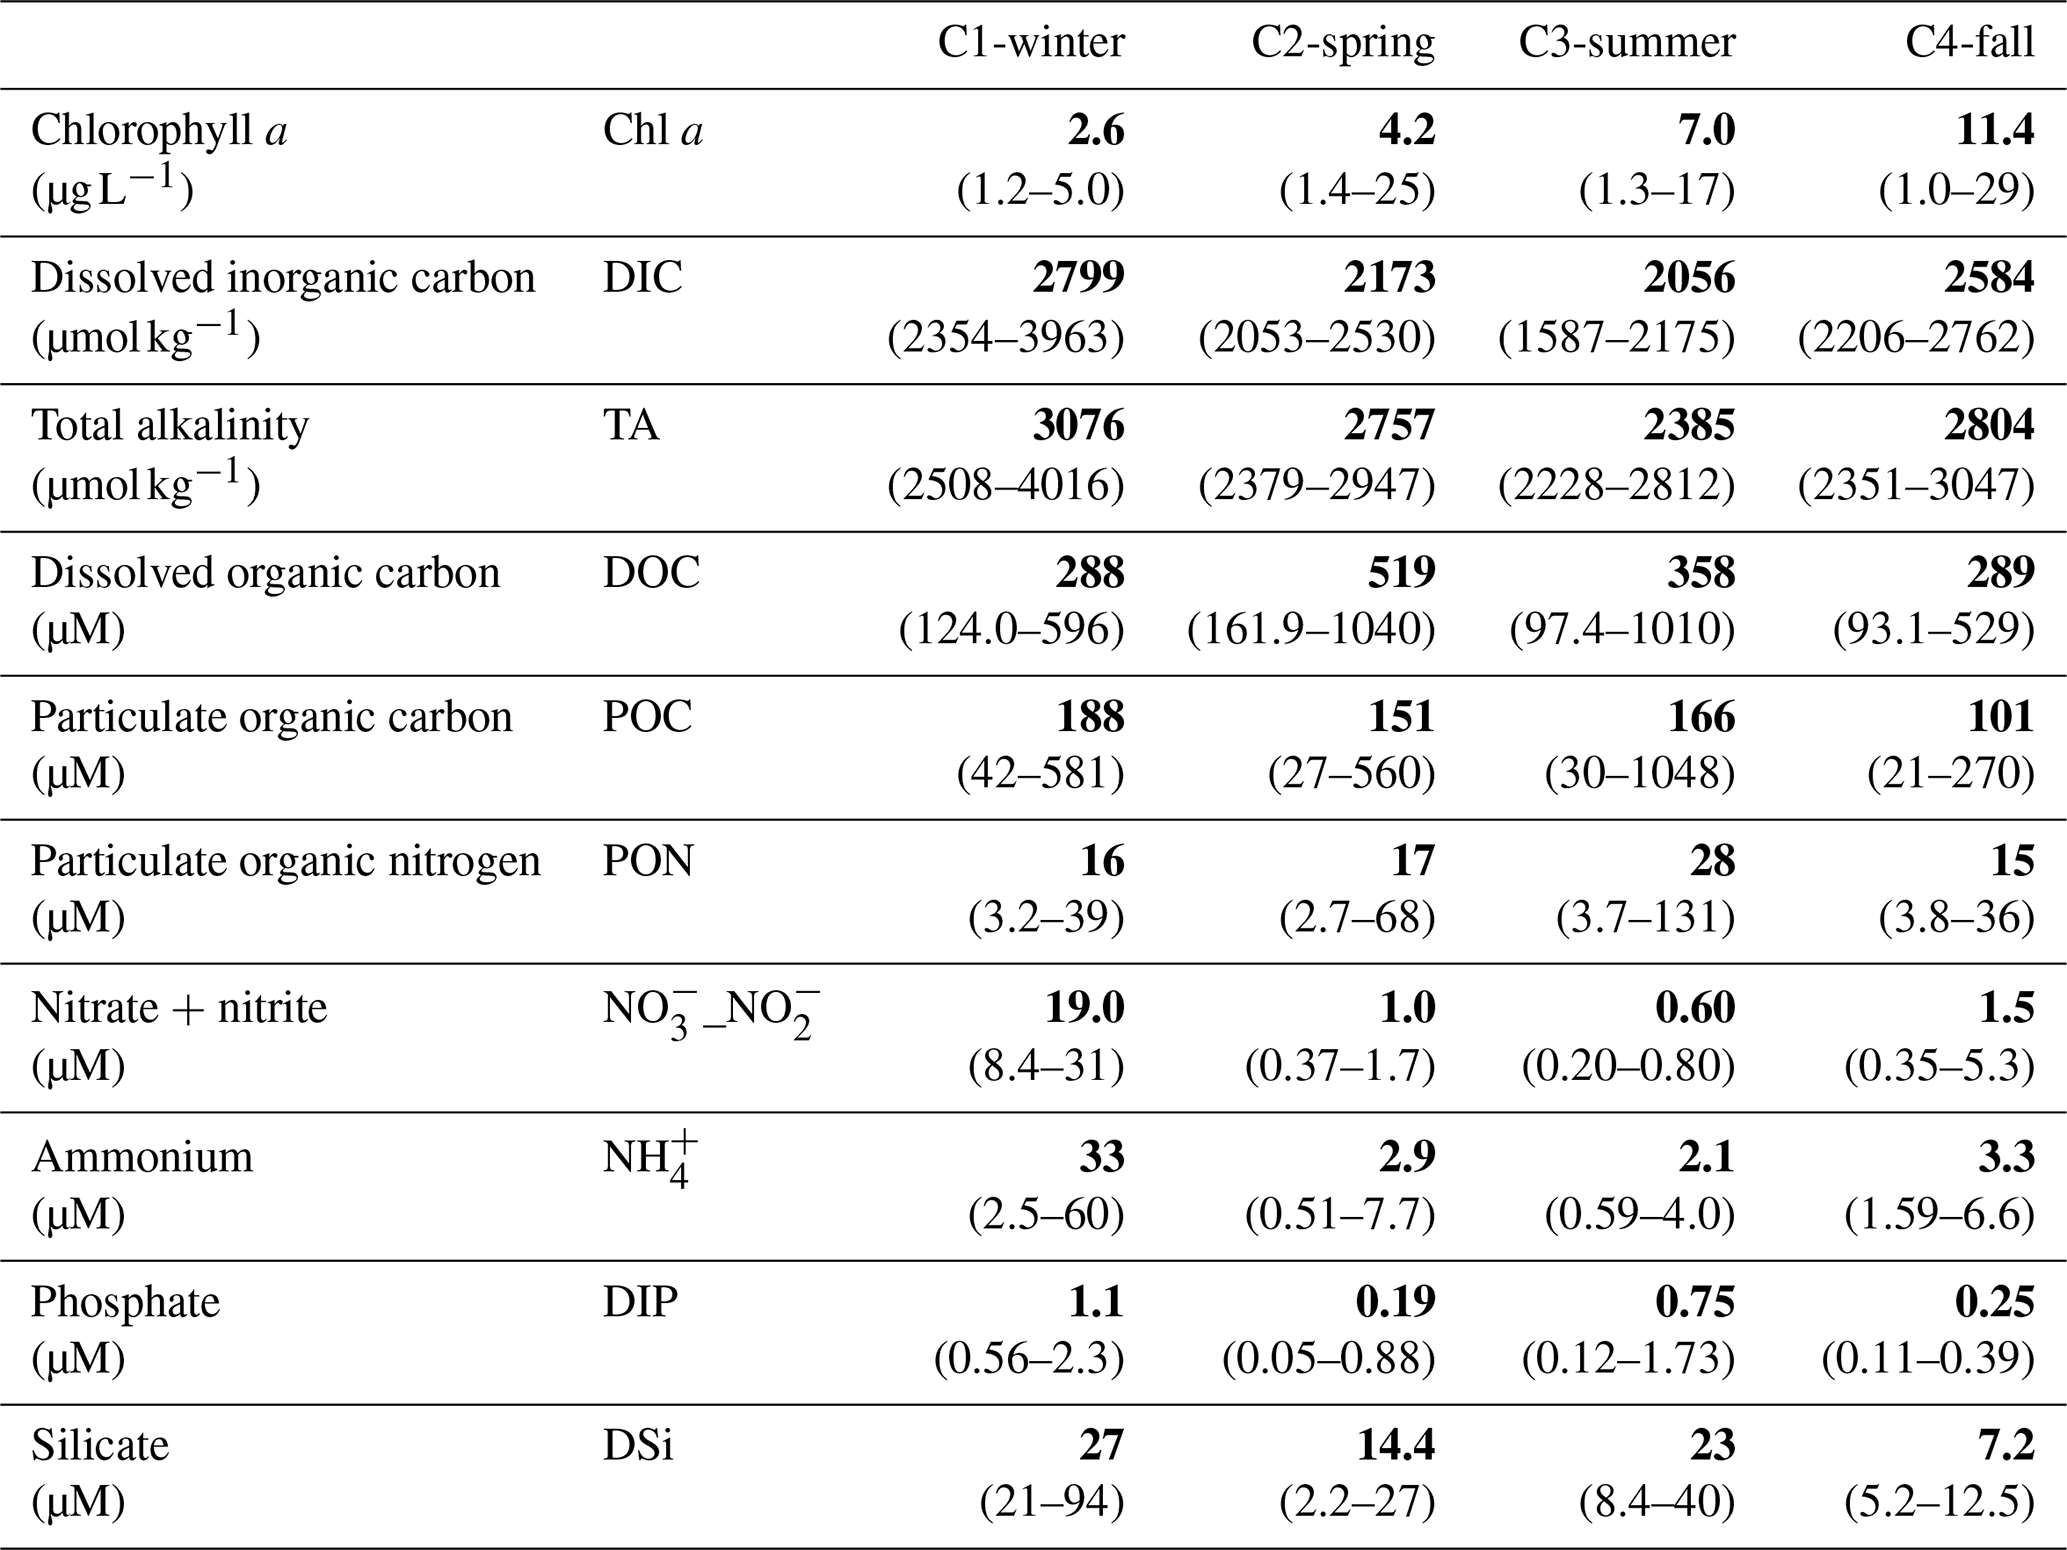
Table 1Medians (in bold) and associated ranges (min–max in parentheses) of water biogeochemical parameters measured from hourly sampling during the four seasonal 24 h cycles (n=13 over C1-winter, n=15 over C2-spring and C3-summer and n=16 over C4-fall; see Fig. S1 to view data from the hourly samplings).
2.3 Continuous parameters
2.3.1 Water pCO2 measurements and associated physicochemical parameters
In each season, a C-sense™ pCO2 probe (Turner Designs, USA) and an EXO2 multiparameter probe (YSI Inc., USA) were deployed in the sampling channel to continuously measure (every 10 min) in situ biogeochemical parameters over 5 d. The measurement range of the C-sense™ probe was 0–2000 ppmv, with an absolute accuracy of 60 ppmv (3 % of the full scale). A water pCO2 correction was applied, taking into account total dissolved gas pressure and atmospheric pressure during calibration (Mayen et al., 2023). The EXO2 probe was used to measure water temperature (±0.1 °C), salinity (±0.2 salinity unit), DO concentration () and DO saturation level (±1 %). At the same time, water height (±0.3 m) was measured every 10 min by an STPS probe (NKE Instrumentation, France). Water height (Hw), measured at one location in the channel relative to the mean sea level, was used to distinguish LT periods with a constant water height (Hw=0.50 m) and HT periods with increases (flood tide) and decreases (ebb tide) in water height (; Fig. 2).
2.3.2 Atmospheric eddy covariance and footprint
Over the year 2021, and simultaneously to our water samplings, an atmospheric eddy covariance (EC) system (model EC150, Campbell Scientific Inc., Logan, USA) was deployed in the salt marsh (Fig. 1b). The EC system continuously measured net ecosystem CO2 exchange (NEE, ) within the annual averaged footprint (80 % contour line, 12 069 m2). EC data were recorded at a frequency of 20 Hz and averaged every 10 min over each 24 h cycle except for during C4-fall when no EC measurement was possible due to anemometer maintenance. Photosynthetically active radiation (PAR, ), air temperature (Ta, °C), relative humidity (RH, %) and cumulative precipitation (rainfall, mm) were also recorded simultaneously with NEE. Daytime and night-time were separated into PAR>10 and , respectively (Fig. 2). The set of EC sensors, footprint estimation, EC data processing, quality control and the gap-filling model are fully described by Mayen et al. (2024). A habitat-covering map showed that the studied footprint was occupied mainly by halophytic plants including Halimione portulacoides (37 %), Spartina maritima (22 %) and Suaeda vera (7 %), whereas mudflats and channels occupied 34 % of the footprint area (Mayen et al., 2024). H. portulacoides and S. vera are evergreen plants throughout the year, whereas the growing season for S. maritima was shorter (from spring to late summer). During winter and fall, S. maritima persists only in the form of rhizomes, and its low metabolism could induce a lower marsh CO2 uptake rate (Mayen et al., 2024). At the ecosystem scale, NEE<0 represents a marsh CO2 uptake (atmospheric sink), and NEE>0 represents a marsh CO2 emission (atmospheric source). To study marsh metabolism related to photosynthesis and respiration processes, NEE was partitioned during LT periods into marsh gross primary production (GPPmarsh) and marsh respiration (Rmarsh), respectively (Kowalski et al., 2003; Wei et al., 2020). In this study, NEE corresponds to net ecosystem CO2 exchange measured continuously by EC, whereas NEEmarsh (GPPmarsh – Rmarsh) corresponds to net marsh metabolic fluxes estimated continuously and solely at the emerged soil–air interface without immersion (Mayen et al., 2024).
2.4 Analytical procedures
2.4.1 Discrete parameters
For dissolved inorganic nitrogen () and phosphorus (), 300 mL water samples were pre-filtered through cellulose acetate membrane filters (Minisart Sartorius © 0.45 µm pore size) directly after sampling and stored at −20 °C pending analysis. For dissolved silicate (), 100 mL filtered water samples were stored at 4 °C pending analysis. Samples were analysed using an auto-analyser (Seal Analytical AA3) following standard protocols (Aminot and Kérouel, 2007). Nitrate and nitrite were analysed together and grouped as _. The limits of quantification were 0.4 µM for DSi, 0.2 µM for _ and 0.05 µM for DIP and . Measurement uncertainties were 4 % for DSi and 8 % for _, and DIP and were obtained from certified reference material comparisons in interlaboratory studies (Dutch Accreditation Council, ISO 17043:2010). Total alkalinity (TA) analyses were performed using an automatic titration system (Titroline 7000 from SI Analytics) using HCl 0.01 N on 25 g of filtered samples (Dickson et al., 2007). The equivalent point for TA measurement was calculated by linearizing the Gran function (Gran, 1952). Measurements were compared to certified reference material (CRM, provided by Andrew Dickson from Scripps Institution of Oceanography). The maximal precision level was ±0.44 %.
For dissolved organic carbon (DOC), 50 mL water samples were filtered through pre-combusted GF/F filters (Whatman® Nuclepore™, 0.7 µm pore size) in opaque vials using a glass syringe. First, the total carbon concentration was measured using the 680 °C combustion catalytic oxidation method on a TOC meter (Shimadzu TOCLCPH/CPN™). Moreover, by acidifying the sample (HCl, pH<3.0), inorganic carbon was converted to CO2 and measured using an infrared gas analyser (Shimadzu TOC-LCPH/CPN™). DOC concentrations were then calculated by the difference between total carbon and inorganic carbon concentrations. For particulate organic carbon (POC) and nitrogen (PON), 30–200 mL water samples were carefully filtered through pre-combusted GF/F filters (Whatman® Nuclepore™). The filters were dried (12 h at 60 °C), enclosed in clean glass vials, stored in the dark and protected from humidity pending analysis (Lorrain et al., 2003). After the removal of carbonates with phosphoric acid, the filters were treated using a CHN element analyser (Thermo Fisher Scientific, Waltham, USA) to measure POC and PON concentrations following Aminot and Kérouel (2004). The analysis of POC stable isotope ratios (δ13C-POC) was performed using an Elemental Analyser Isotope Ratio Mass Spectrometer (EA-IRMS: Thermo Flash HT/EA and Delta V Advantage) following Razanamahandry et al. (2025).
Phytoplankton biomass was estimated through Chl a concentrations. Water samples (30–200 mL) were filtered through GF/F filters (Whatman® Nuclepore™) and stored at −20 °C pending analysis. Chl a was extracted in 10 mL of 90 % acetone in the dark at 4 °C for 12 h and analysed by monochromatic spectrophotometry (Aminot and Kérouel, 2004). Microphytoplankton (>20 µm) abundance and community diversity were assessed using an inverted microscope (ZEISS, Axio Observer). Water samples of 1000 mL were fixed with a Lugol iodine solution (2 %) and stored in the dark at 4 °C. Samples were carefully homogenized before settling in a 10 mL subsample for 12 h in Hydro-Bios counting chambers (Utermöhl, 1958). The limit of quantification was 100 cells L−1. To measure bacterial and phytoplanktonic abundances by flow cytometry, 2 mL water samples were fixed with glutaraldehyde (0.25 % final concentration; Sigma-Aldrich) and stored at −80 °C until analysis. Enumeration was carried out using a flow cytometer (NovoCyte, Agilent Technologies).
2.4.2 Planktonic metabolism
To measure planktonic net ecosystem production (NEPpk), planktonic gross primary production (GPPpk) and planktonic respiration (Rpk), 5 L water samples were pre-filtrated through 100 µm pores to remove large grazers, large particles or large phytoplankton colonies. The latter were carefully siphoned into fifteen 125 mL narrow-mouth Winkler glass bottles with a silicon tube to avoid air oxygen bubbles. Water samples were protected from solar irradiation during the filling of the bottles. Five replicate bottles were used to determine the initial oxygen concentrations, and five transparent “light” and five opaque “dark” replicate bottles were incubated for 6 h in the surface water of the sampling channel under in situ temperature and PAR to measure changes in oxygen concentration linked to planktonic metabolism (Carpenter, 1965; Carritt and Carpenter, 1966). The dissolved oxygen concentration was measured using the spectrophotometric Winkler approach, which shows a standard deviation of 0.45 % for inter-repeatability and 0.73 % for reproducibility close to 250 µmol L−1 (Labasque et al., 2004). NEPpk and Rpk rates were calculated from changes in dissolved oxygen concentrations relative to the initial oxygen concentrations after the in situ incubation of samples under light and dark conditions, respectively. GPPpk rates were then calculated following the mass balance equation . Metabolism experiments failed and yielded negative Rpk rates at low tide in the day during winter only. Here, NEPpk>0 represents a net planktonic autotrophy, and NEPpk<0 represents a net planktonic heterotrophy. In order to convert planktonic metabolism rates from oxygen to carbon, we used an average photosynthetic quotient (PQ=1.3) from similar coastal systems and a typical respiratory quotient (RQ=1.0) as used in most studies (Caffrey, 2004; Gazeau et al., 2004; Laws, 1991; Wielgat-Rychert et al., 2017). Results were expressed in volumetric rate (). At each HT, the integrated NEPpk rate () was estimated from the volumetric NEPpk rate and the water height above the marsh to compare planktonic aquatic metabolism with total aquatic metabolism and water–air CO2 fluxes (see below). For each 24 h cycle, a daily C balance () was obtained by considering the four NEPpk rates measured every 6 h at LT and HT successively.
2.5 Data processing
In this study, dissolved inorganic carbon (DIC; Table 1) concentrations were calculated from measured salinity, temperature, DSi, DIP, water pCO2 and TA, using the carbonic acid constant from Mehrbach et al. (1973) (as modified by Dickson and Millero (1987)), the KHSO4 constant from Dickson (1990) and the borate acidity constant from Lee et al. (2010). The CO2 system calculation program (CO2SYS, version 2.1.) performed these calculations (Lewis and Wallace, 1998). Over the 24 h cycles, water–air CO2 fluxes and total aquatic metabolism were simultaneously estimated at each HT during the highest immersion levels with limited horizontal exchanges (for 2 h over C1-winter and C3-summer and for 3.5 h over C2-spring and C4-fall).
2.5.1 Water–air CO2 fluxes (FCO2)
Diffusive CO2 fluxes (FCO2, ) at the water–air interface were estimated during HT periods as follows (Mayen et al., 2023):
where k (cm h−1) is the CO2 gas transfer velocity and α () is the CO2 solubility coefficient in saltwater (Weiss, 1974). Water pCO2 (ppmv) was measured by the C-sense™ probe, while air pCO2 (ppm) was measured by the EC station at a height of 3.15 m. FCO2>0 (i.e. water pCO2 > air pCO2) indicates a CO2 source from water to atmosphere, and FCO2 <0 (i.e. water pCO2 < air pCO2) indicates an atmosphere CO2 sink by the water column. We used the k-wind parametrization of Van Dam et al. (2019), which is a coefficient specific to shallow and microtidal estuaries but can be adapted to salt marsh systems (Song et al., 2023). Currently, there is no consensus on the k value parameterization in shallow coastal systems, such as salt marshes, mainly because k depends on several drivers acting at the same time: wind, current, water depth, friction at the bottom, heating and cooling. In this study, we used the k parameterization of Van Dam et al. (2019) as a function of wind speed, which was determined from concomitant pCO2 and FCO2 eddy covariance data in an estuarine system with characteristics very similar to our study site. The gas transfer coefficient, normalized to a Schmidt number of 600 (k600) and obtained from Van Dam et al. (2019), was converted to the CO2 transfer velocity according to in situ temperature and salinity (k or k660) following Jähne et al. (1987).
2.5.2 Net ecosystem production of water column (NEPtot)
NEPtot was calculated by considering the changes in DIC concentrations between two discrete samplings during the highest marsh immersion levels and corrected for CaCO3 production/dissolution and water–air CO2 flux as follows (Cotovicz et al., 2021; Longhini et al., 2015):
where nDIC1 and nDIC2 are DIC concentrations (mmol kg−1) normalized to salinity between two samplings, nTA1 and nTA2 are TA concentrations (mmol kg−1) normalized to salinity between two samplings, ρ is the water density (kg m−3), d is the water depth (m), Δt is the time interval (h) between the two discrete samplings and FCO2 is the water–air CO2 flux (). NEPtot>0 indicates a dominant aquatic autotrophy, and NEPtot<0 indicates a dominant aquatic heterotrophy. NEPtot estimated total aquatic metabolism (the whole aquatic community and benthic processes), whereas NEPpk studied planktonic aquatic metabolism only (<100 µm).
2.6 Data analysis and statistical tools
For each 24 h cycle, a linear regression between TA and DIC, normalized to a constant salinity (nTA and nDIC, respectively), was performed to highlight the dominant biogeochemical processes affecting DIC and TA (Borges et al., 2003; Saderne et al., 2019). Over each 24 h cycle, large salinity ranges were measured and DIC and TA were normalized according to Friis et al. (2003) with a daily salinity mean (25.0, 36.7, 36.0 and 33.2 in C1-winter, C2-spring, C3-summer and C4-fall, respectively) to limit evaporation and dilution processes on these parameters (Koné and Borges, 2008; Saderne et al., 2019).
The data from the discrete samplings over the year were not normally distributed (Shapiro–Wilk tests, p<0.05). Thus, non-parametric comparisons, including the Mann–Whitney and Kruskal–Wallis tests, were carried out with a 0.05 level of significance. A Dunn's test was used to perform a post-hoc multiple comparison of the Kruskal–Wallis test to detect significant differences between groups. Multiple factor variance analyses were performed using all discrete sampling data over the year (n=59) to test the contribution of seasonal, diurnal and tidal factors on water biogeochemical parameters. The seasonal factor assesses variability between the 24 h cycles, the tidal factor assesses variability between high tide and low tide and the diurnal factor assesses variability between daytime and night-time. Parameters that did not respect a normal distribution were transformed into log 10(x) or log 10(x+1) for variance analysis. To assess the influence of biological drivers on water pCO2, we performed a pairwise Spearman's correlation analysis from hourly water samples during the four 24 h cycles (n=59).
3.1 Meteorological and environmental settings
Air temperature (Ta) averaged over our 24 h cycles were within the standard deviations of 3-year seasonal means (continuous measurements during three full seasons), although C1-winter was significantly warmer (+2.1 °C) and C4-fall was significantly colder (−2.4 °C) than the seasonal reference period (Mann–Whitney tests, p<0.05) (Table S1 in the Supplement). C3-summer was the warmest period, whereas C1-winter and C4-fall were the coldest periods with similar thermal conditions. The full seasonal range in solar radiation was captured over the 24 h cycles; however, C1-winter was brighter and C4-fall was less bright than the seasonal reference period (Table S1). C2-spring and C3-summer were the brightest periods with similar daytime PAR values. On average, in C2-spring and C3-summer, wind speeds were similar to the seasonal reference periods, whereas in C1-winter, wind speeds were lower (Table S1). In C1-winter, winds came from the north-east, while in C2-spring and C3-summer, higher wind rotations were recorded with mainly westerly winds. The driest and wettest periods were C2-spring and C4-fall, respectively, associated with the lowest and the highest 7 d cumulative rainfall. Globally, the 24 h cycles can be characterized by different meteorological conditions based on light, temperature and humidity.
In 2021, the salinity of coastal waters was measured bimonthly at a marine station in the continental shelf (Filiere W; Fig. 1a) and ranged from 27.6 (winter) to 34.8 (summer). At the salt marsh, salinity measured at high tide was very similar to coastal waters, while salinity measured at low tide showed stronger seasonal variations, ranging from 21.4 (C1-winter) to 44.2 (C3-summer; Fig. 2). The daily duration of high tides (i.e. marsh immersion) was 8 h d−1 over C1-winter and C3-summer (lowest tidal ranges) and 10 h d−1 over C2-spring and C4-fall (highest tidal ranges; Fig. 2). Water temperatures (Tw) varied between 6.4 °C (C4-fall) and 28.1 °C (C3-summer). Similarly, large amplitudes of DO and water pCO2 were measured over the 24 h cycles with DO-sat, ranging between 13 % (C3-summer) and 187 % (C2-spring) and pCO2 ranging between 83 ppmv (C3-summer) and 1461 ppmv (C1-winter). For each variable, these extreme values were measured at low tide in channel waters between the day (LT/Day) and the night (LT/Night; Fig. 2).
3.2 Temporal variations of water pCO2 and water–air CO2 fluxes
For each 24 h cycle, the average water pCO2 value was within the standard deviation of the 5 d seasonal mean computed from continuous measurements done at each season right before the 24 h cycle samplings (Table S2 in the Supplement). On average, at the seasonal scale, water pCO2 values were higher than air pCO2 values (water oversaturation) over C1-winter and C4-fall (669±327 and 422±73 ppmv, respectively) and the opposite (water pCO2 < air pCO2; water undersaturation) was recorded over C2-spring and C3-summer (239±105 and 271±182 ppmv, respectively). Water pCO2 differed significantly between each 24 h cycle (Kruskal–Wallis test, p<0.0001), except between C2-spring and C3-summer (Dunn's test, p=0.16).
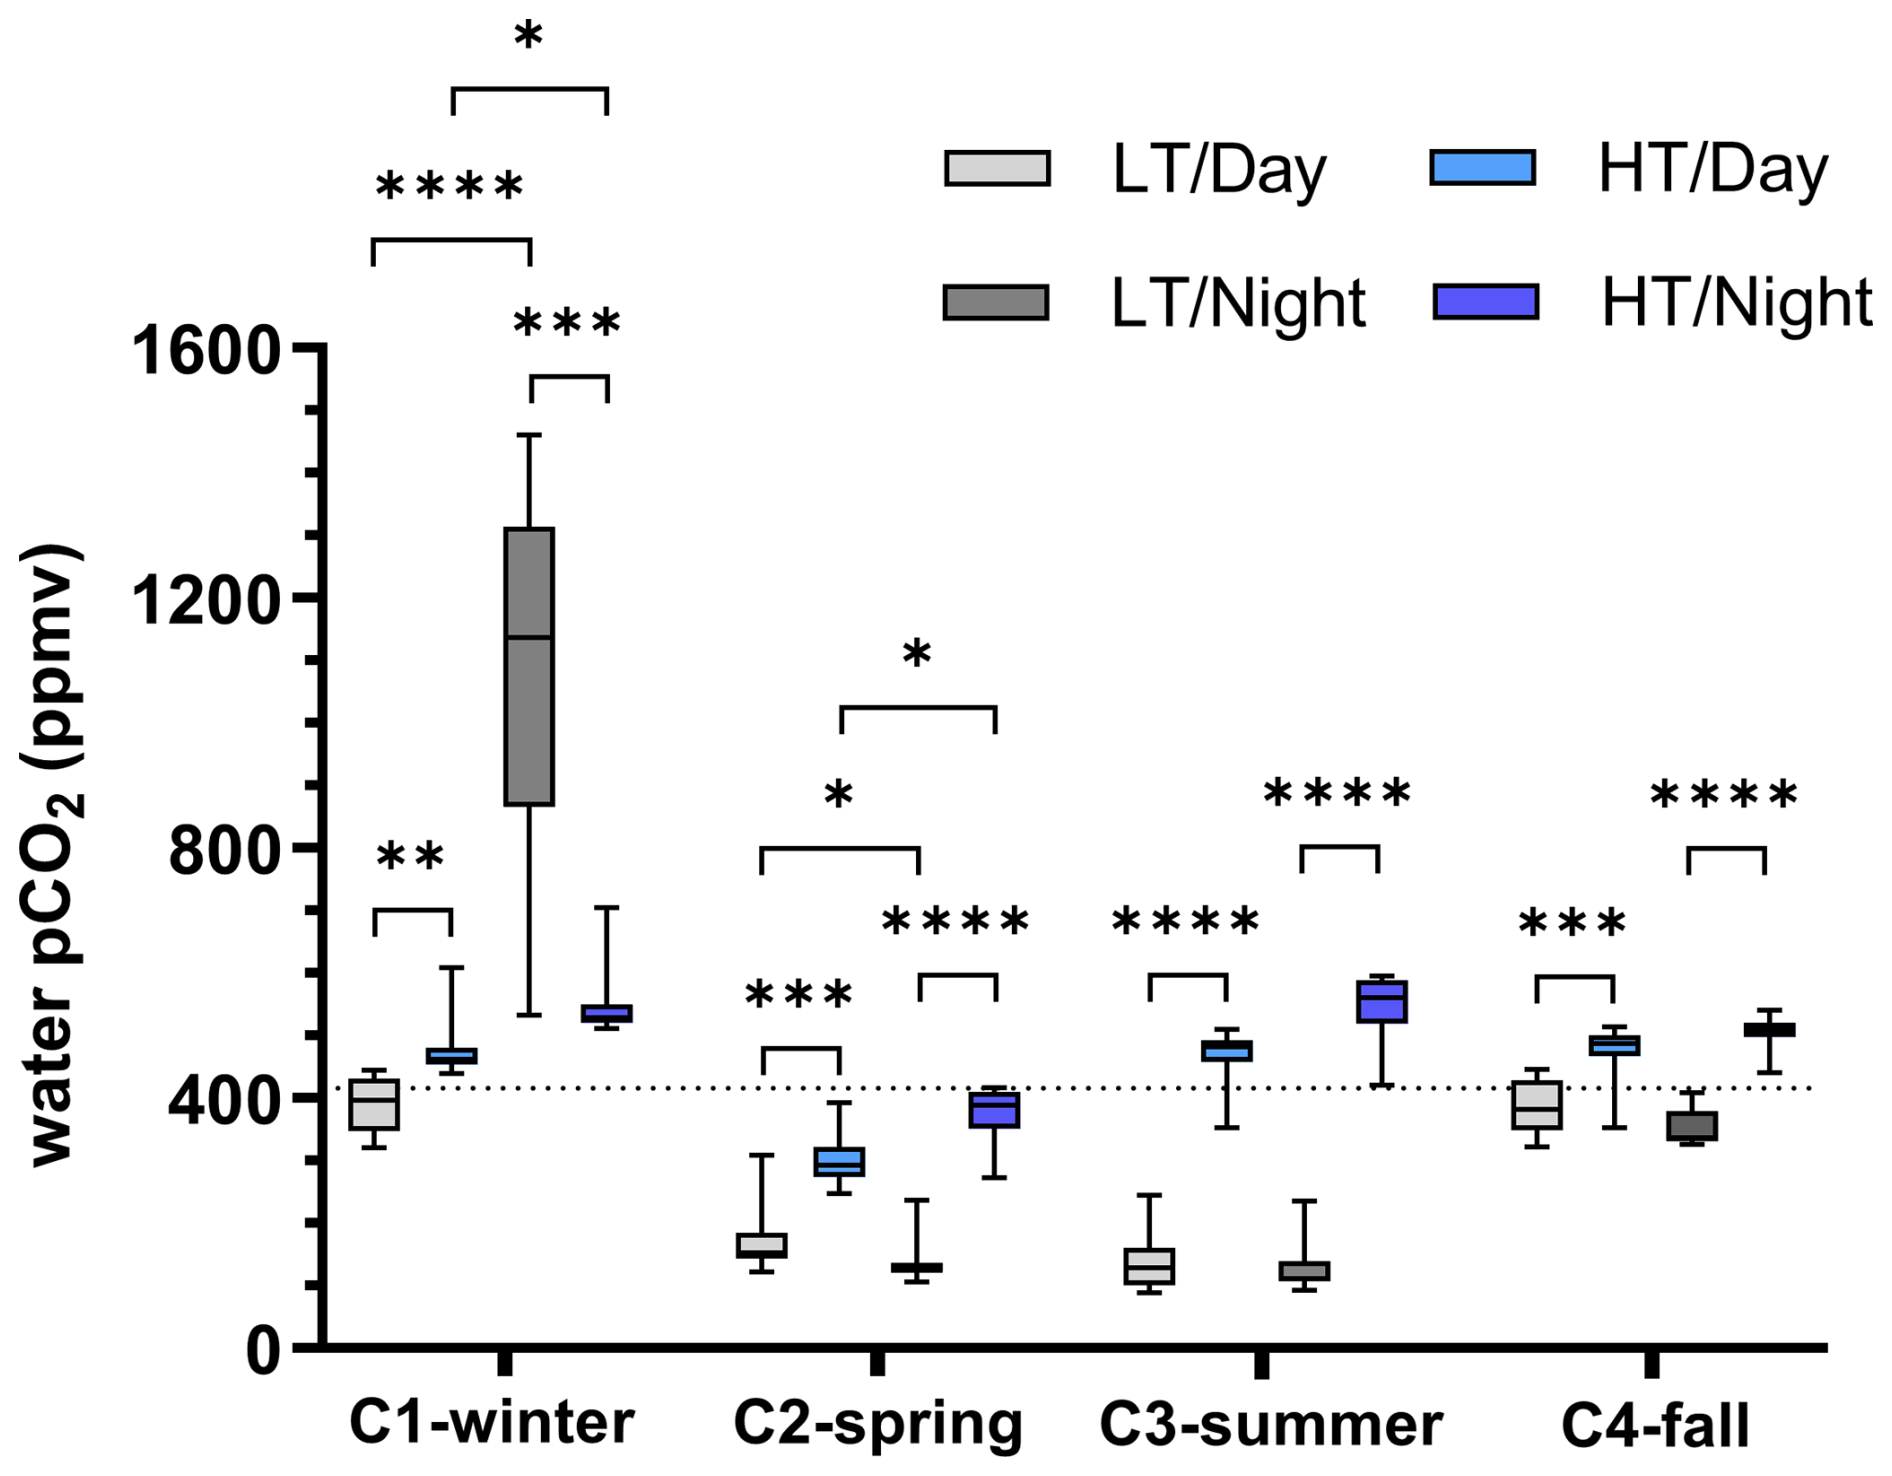
Figure 3Boxplot distribution of water pCO2 variations measured every 10 min at diurnal/tidal scales during each seasonal 24 h cycle (n=36 for each boxplot). The dotted horizontal line corresponds to air pCO2 measured by the EC station and averaged over the four 24 h cycles (416 ppm). Asterisks designate significant differences at diurnal/tidal scales ( p<0.0001, p<0.001, p<0.01, ∗ p<0.05; the absence of asterisks means no significant difference p>0.05). LT/Day: low-tide day; HT/Day: high-tide day; LT/Night: low-tide night; HT/Night: high-tide night. Low-tide and high-tide periods were separated into Hw (water height) =0.50 m and , respectively, in the sampling channel (see Fig. 2 for further details).
Water pCO2 varied strongly in each 24 h cycle according to the diurnal and tidal scales with, in general, (1) daytime pCO2 decreases and night-time pCO2 increases and (2) lower pCO2 values at low tide than at high tide whatever the diurnal scale (except in winter; Fig. 2). Over C1-winter, the largest diurnal/tidal water pCO2 variation was recorded, ranging from 321 ppmv at LT/Day (CO2 undersaturation period) to 1461 ppmv at LT/Night (CO2 oversaturation period; Fig. 3). Over C2-spring and C3-summer at low tide (LT/Day and LT/Night), water was strongly undersaturated in CO2, whereas at high tide (HT/Day and HT/Night), water was slightly undersaturated in CO2 in C2-spring and slightly oversaturated in CO2 in C3-summer (Fig. 3). Finally, over C4-fall, the lowest diurnal/tidal variation was recorded (from 311 to 541 ppmv) associated with slight water CO2 undersaturation at low tide and slight water CO2 oversaturation at high tide (Fig. 3). For each 24 h cycle, significant differences in water pCO2 were highlighted at the diurnal/tidal scales (Kruskal–Wallis tests, p<0.0001; Fig. 3), except between LT/Day and LT/Night and between HT/Day and HT/Night over both C3-summer (Dunn's tests, p=0.90 and p=0.60, respectively) and C4-fall (Dunn's tests, p=0.21 and p=0.07, respectively). For all pCO2 values measured over the year (n=570), the variance analysis highlighted a significant effect of seasonal (F=194.6, p<0.0001) and tidal (F=243.6, p<0.0001) factors on log 10(pCO2) but no significant diurnal effect (F=0.9, p=0.33). During high-tide periods, mean water–air FCO2 from water pCO2 was estimated to be 0.25±0.16 (source), (sink), 0.36±0.14 (source) and 0.47±0.10 (source) over C1-winter, C2-spring, C3-summer and C4-fall, respectively (Table 2). Significant seasonal variations in water–air FCO2 were recorded between the 24 h cycles (Kruskal–Wallis test, p<0.0001).
3.3 Planktonic biomass, abundance and metabolism
Chl a concentration medians increased from C1-winter to C4-fall (Table 1). Over C1-winter, Chl a varied independently of water height, whereas during the other 24 h cycles, higher Chl a concentrations were recorded at low tide than at high tide (Figs. 4 and S1). Over the 24 h cycles, microphytoplankton (>20 µm) was composed mainly of pennate diatoms (except in C3-summer when a dinoflagellate bloom occurred) with an abundance increase from high to low tide over both C2-spring and C3-summer (Fig. 4a). For smaller cells (<20 µm), nanophytoplankton was more abundant at low tide than at high tide (except over C1-winter), while picophytoplankton was more abundant at low tide during C2-spring only (Fig. 4b). Higher planktonic bacteria abundances were also recorded at low tide with highest and lowest tidal variations occurring during C2-spring/C3-summer and C1-winter/C4-fall, respectively (Fig. 4c).
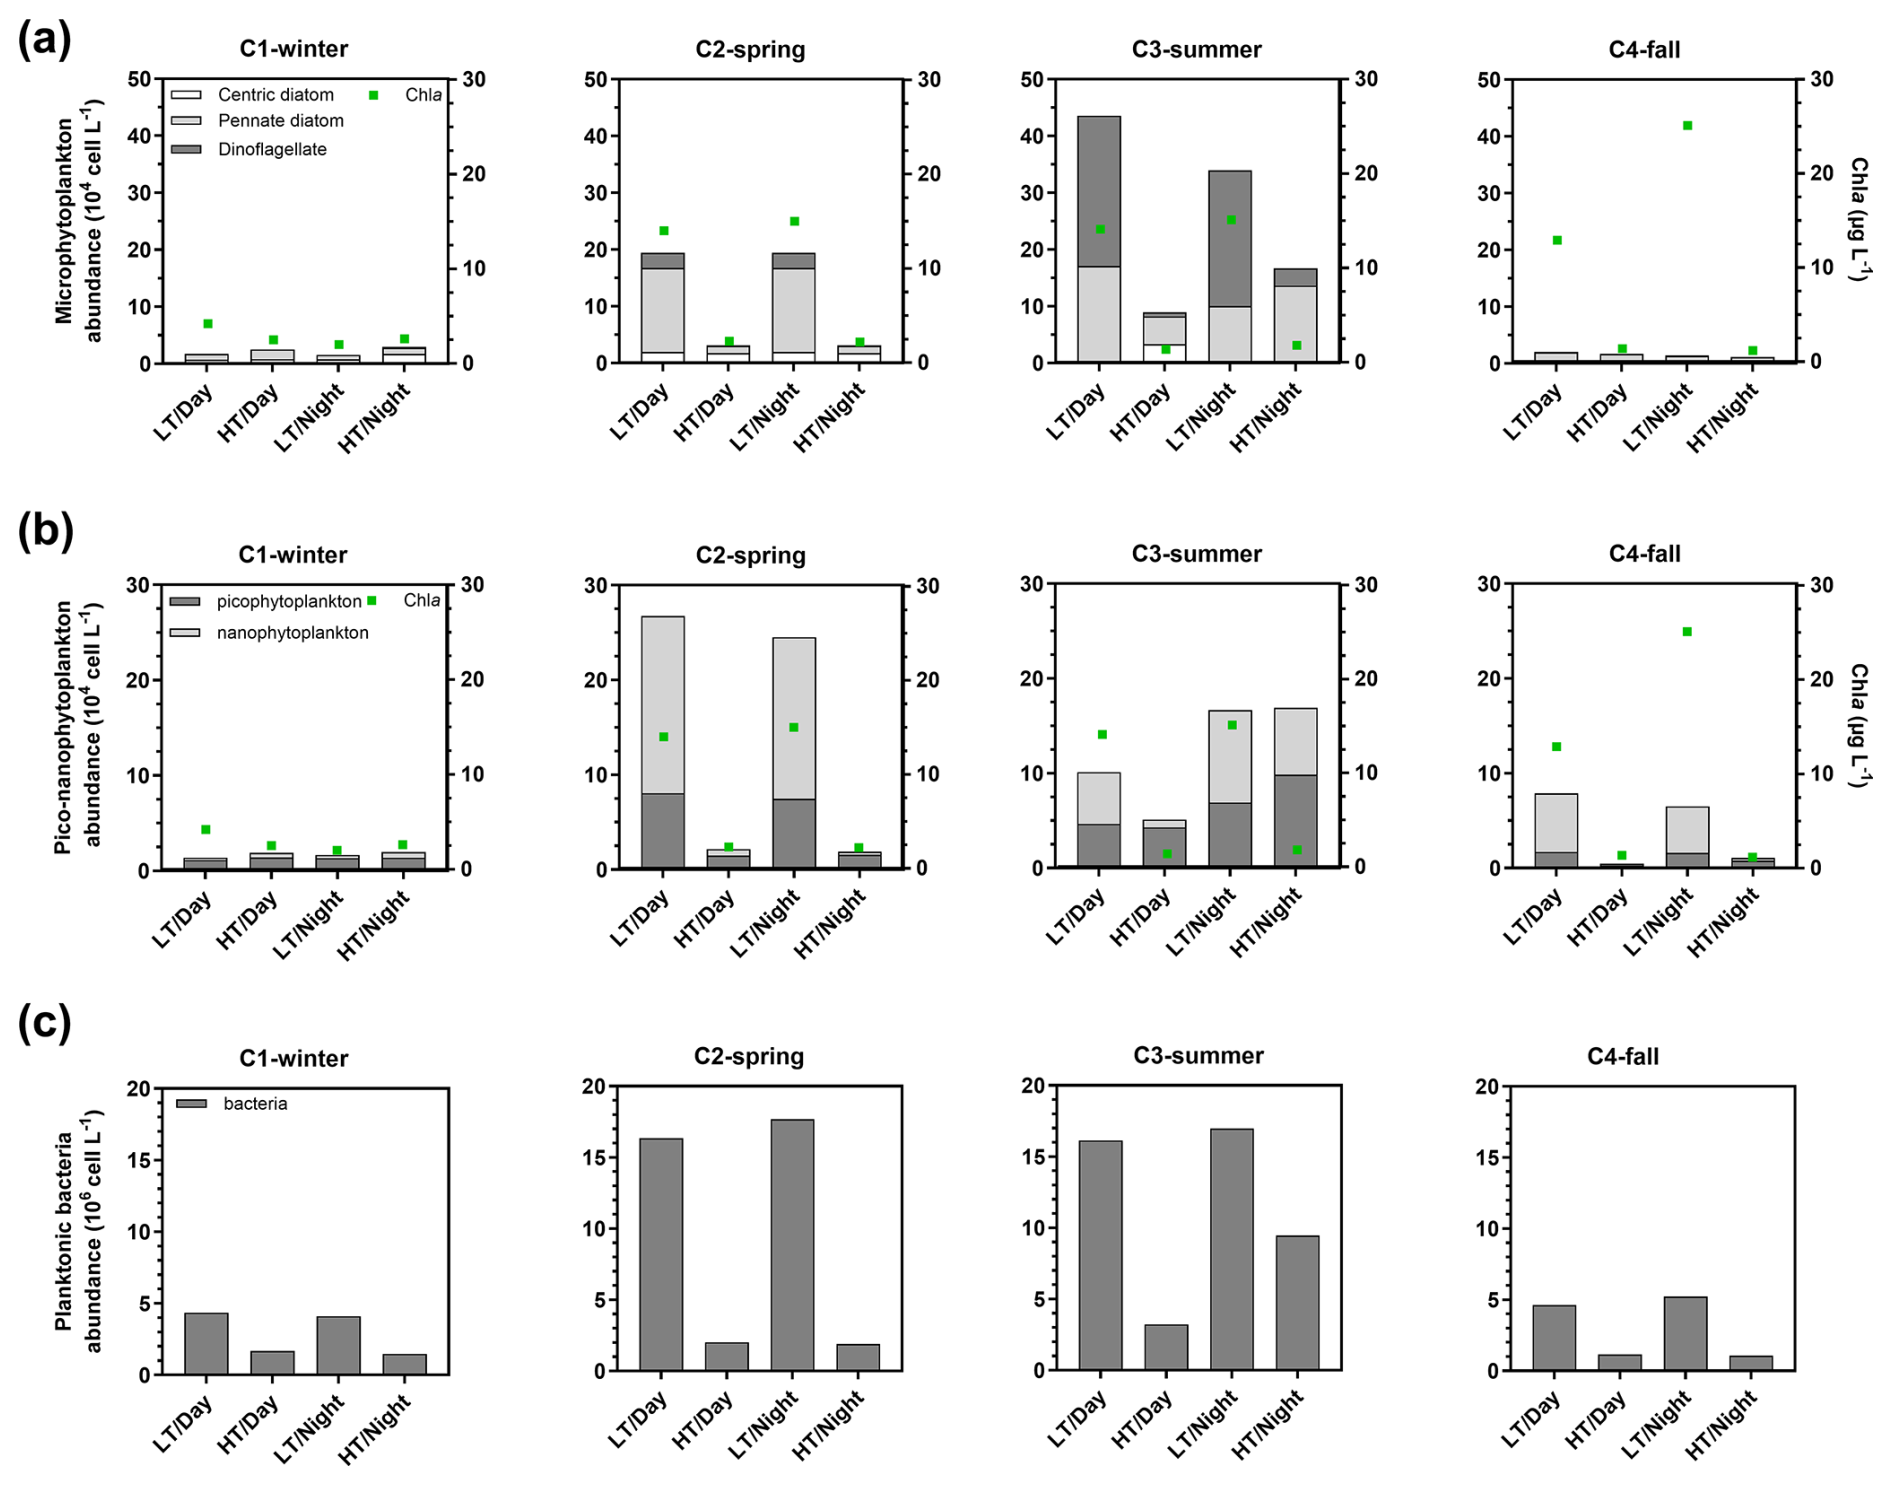
Figure 4Abundance of microphytoplankton (a; 104 cell L−1), pico-nanophytoplankton (b; 104 cell L−1) and total planktonic bacteria (106 cell L−1) sampled at diurnal/tidal scales during each seasonal 24 h cycle simultaneously to measurements of planktonic aquatic metabolism (NEPpk). Contrary to the water biogeochemical parameters sampled every 1 or 2 h over the 24 h cycles, planktonic communities were sampled every 6 h: once in each period of LT/Day, HT/Day, LT/Night and HT/Night (n=4). For each phytoplankton sampling period, the Chl a concentration median was added in green. Microphytoplankton was separated into centric diatoms, pennate diatoms and dinoflagellates. LT/Day: low-tide day; HT/Day: high-tide day; LT/Night: low-tide night; HT/Night: high-tide night.
Over the 24 h cycles, NEPpk rates varied strongly according to light (daytime vs. night-time) and water height (low tide vs. high tide). Generally, the sampled planktonic communities were autotrophic (NEPpk>0) during daytime and heterotrophic (NEPpk<0) during night-time, irrespective of water height (Fig. 5a). However, a stronger planktonic metabolism (production and respiration) was systematically recorded at low tide than at high tide (Fig. 5a and b). At low tide, daytime NEPpk rates ranged from 0.54±0.10 (C4-LT/Day) to (C2-LT/Day), while night-time NEPpk rates ranged from (C1-LT/Night) to (C3-LT/Night). The highest Rpk and GPPpk rates were recorded at low tide, especially during C2-LT/Day and C3-LT/Day (Fig. 5b and c). Across all measured rates (n=16), Rpk was significantly related to bacteria abundance (R2=0.50, p<0.05) but not to Chl a concentrations (p=0.14; data not shown).
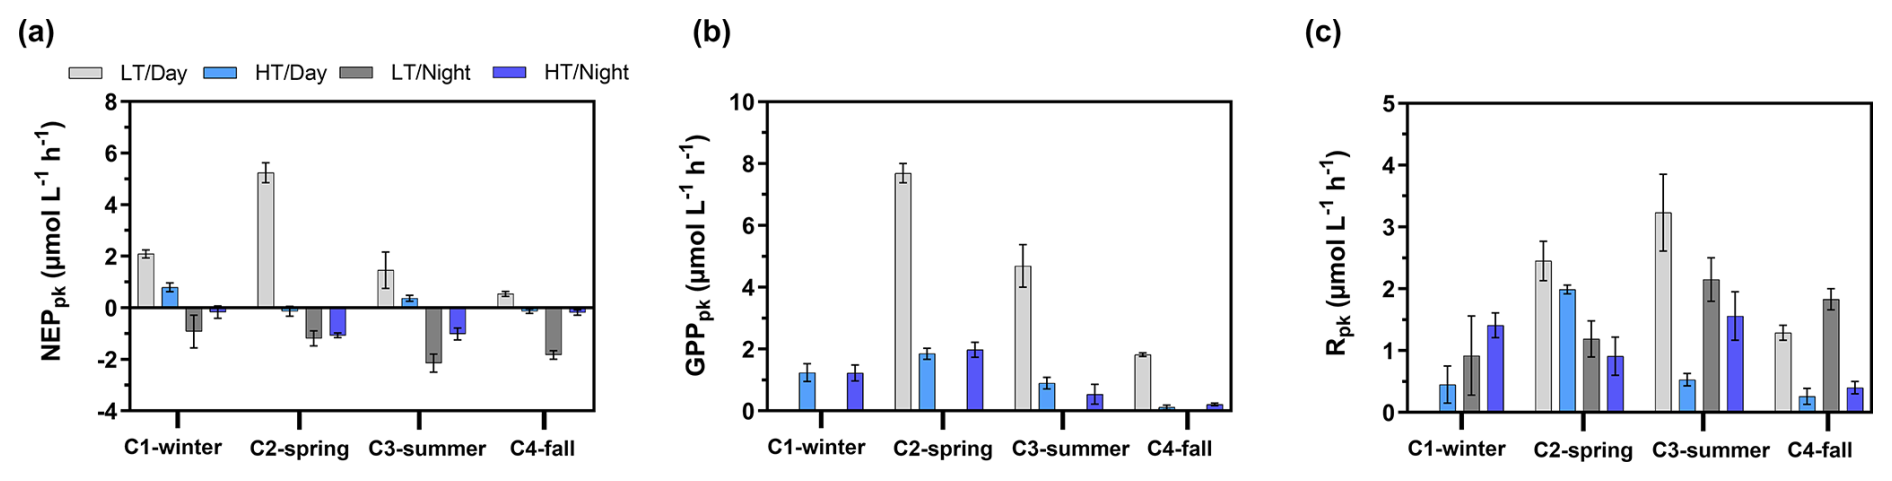
Figure 5Planktonic aquatic metabolism and associated standard errors measured at diurnal/tidal scales during each seasonal 24 h cycle: (a) planktonic net ecosystem production (NEPpk), (b) planktonic respiration (Rpk) and (c) planktonic gross primary production (GPPpk). All metabolic rates are expressed in . NEPpk>0 corresponds to a planktonic autotrophy (CO2 sink in water), and NEPpk<0 corresponds to a planktonic heterotrophy (CO2 source in water). LT/Day: low-tide day; HT/Day: high-tide day; LT/Night: low-tide night; HT/Night: high-tide night.
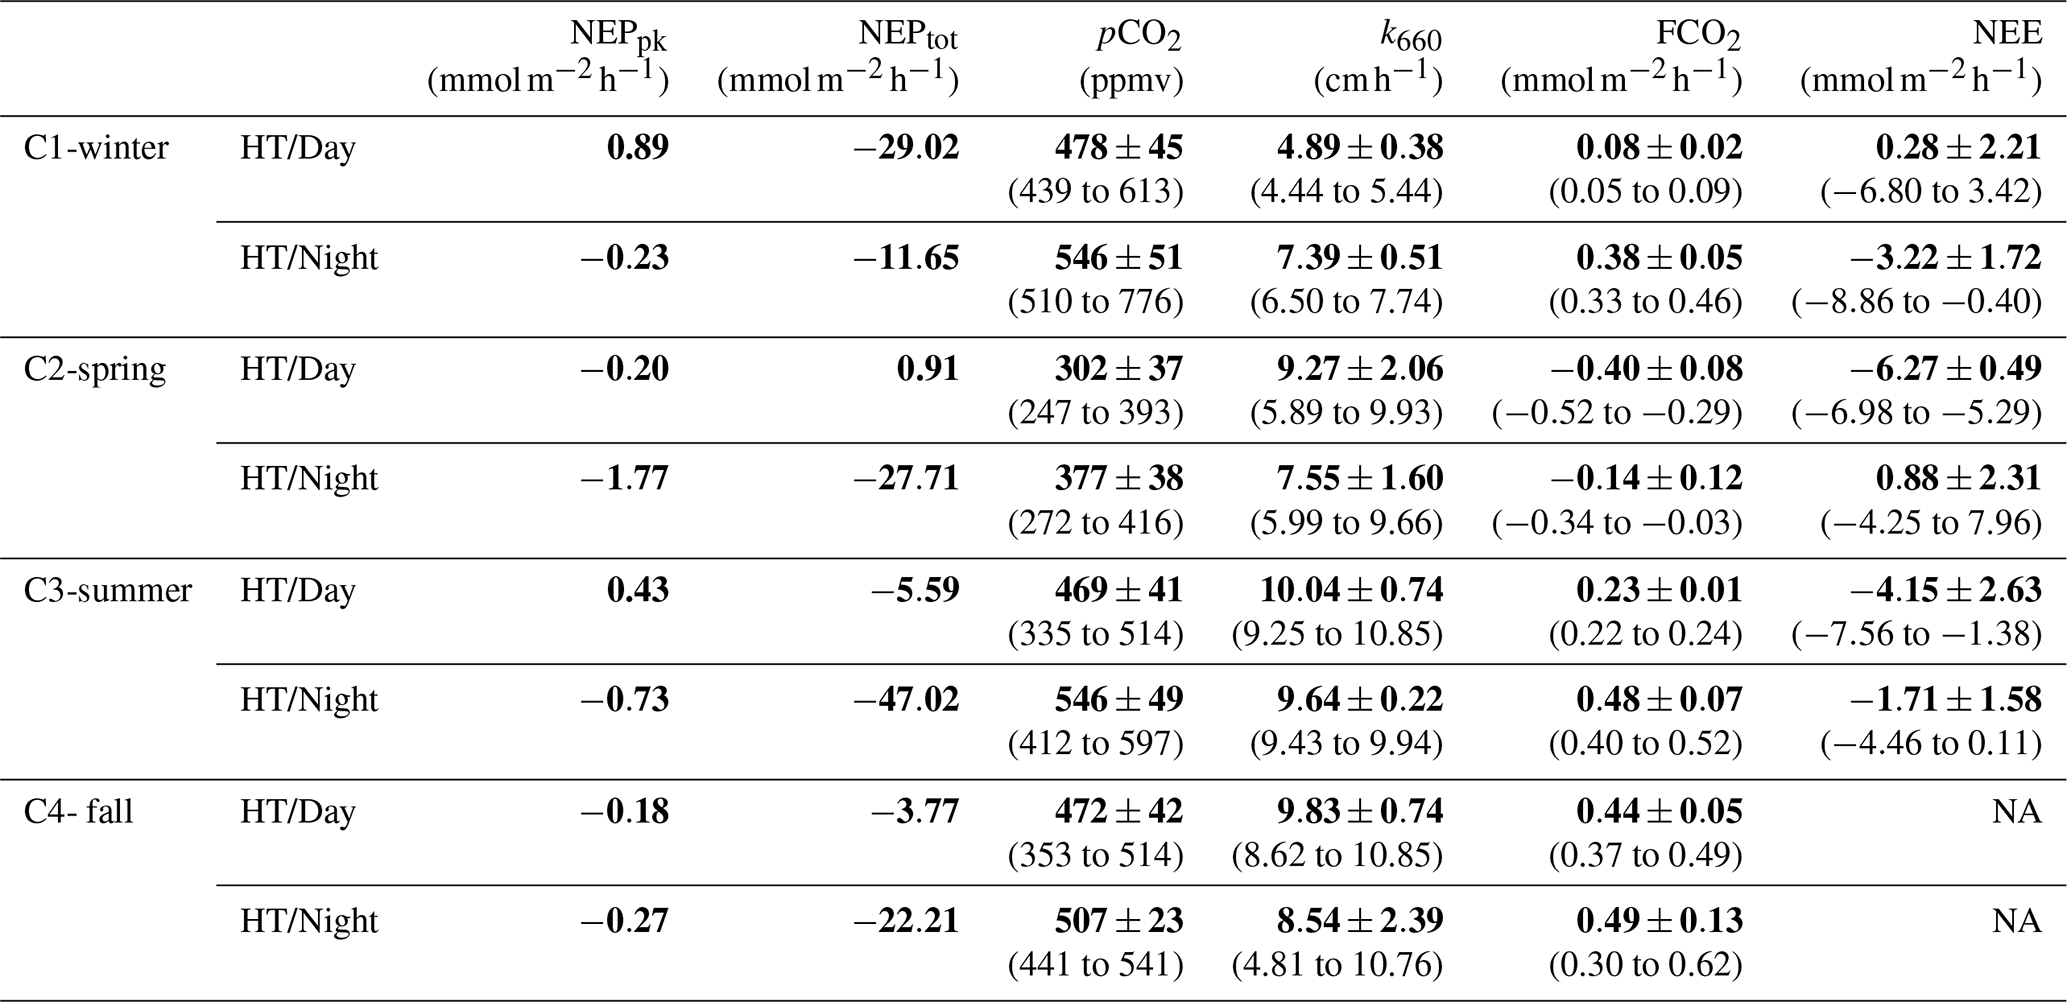
At each high tide, planktonic aquatic metabolism (NEPpk) was compared simultaneously to total aquatic metabolism (NEPtot) (Table 2). The planktonic community was net autotrophic at C1-HT/Day and C3-HT/Day (NEPpk=0.89 and 0.43 mmol, respectively), while the total aquatic community was net autotrophic at C2-HT/Day only (). Generally, NEPpk rates were weaker than NEPtot rates, and similar metabolic status (autotrophy vs. heterotrophy) were recorded except over C1-C2-C3-HT/Day (Table 2).
Table 2Diurnal comparison of planktonic aquatic metabolism (NEPpk) and total aquatic metabolism (NEPtot) during each high tide (HT/Day vs. HT/Night). Simultaneously, water pCO2 measured by the C-sense™ probe, water–air CO2 fluxes (FCO2) estimated from water pCO2 and net ecosystem CO2 exchanges (NEEs) measured by EC were recorded (means and SD in bold, ranges in parentheses) and related to aquatic metabolism. Positive and negative NEPpk and NEPtot rates correspond to an autotrophy and a heterotrophy in water, respectively, whereas positive and negative FCO2 and NEE fluxes correspond to a source and a sink of CO2, respectively. Wind directions measured by EC are ESE over C1-winter, WNW and NNW over C2-spring and WNW over C3-summer. The CO2 transfer velocity (k660) obtained from Van Dam et al. (2019) were recorded. NA: not available.
3.4 Carbon and nutrient temporal variations
DIC and TA concentrations followed similar seasonal and tidal variations with decreases from C1-winter to C3-summer (Table 1) and increases from high to low tide (Figs. 6a and S1). Over the 24 h cycles, DIC and TA varied strongly according to salinity (i.e. tidal scale), especially during C1-winter, where the highest DIC and TA concentrations were recorded at low tide at night (Fig. 6a). Moreover, a significant linear relationship between salinity-normalized TA (nTA) and salinity-normalized DIC (nDIC) was found over each 24 h cycle, with slopes ranging from 0.35 in C2-spring (R2=0.51, n=12, p<0.01) to 1.22 in C4-fall (R2=0.99, n=16, p<0.001; Fig. 6b).
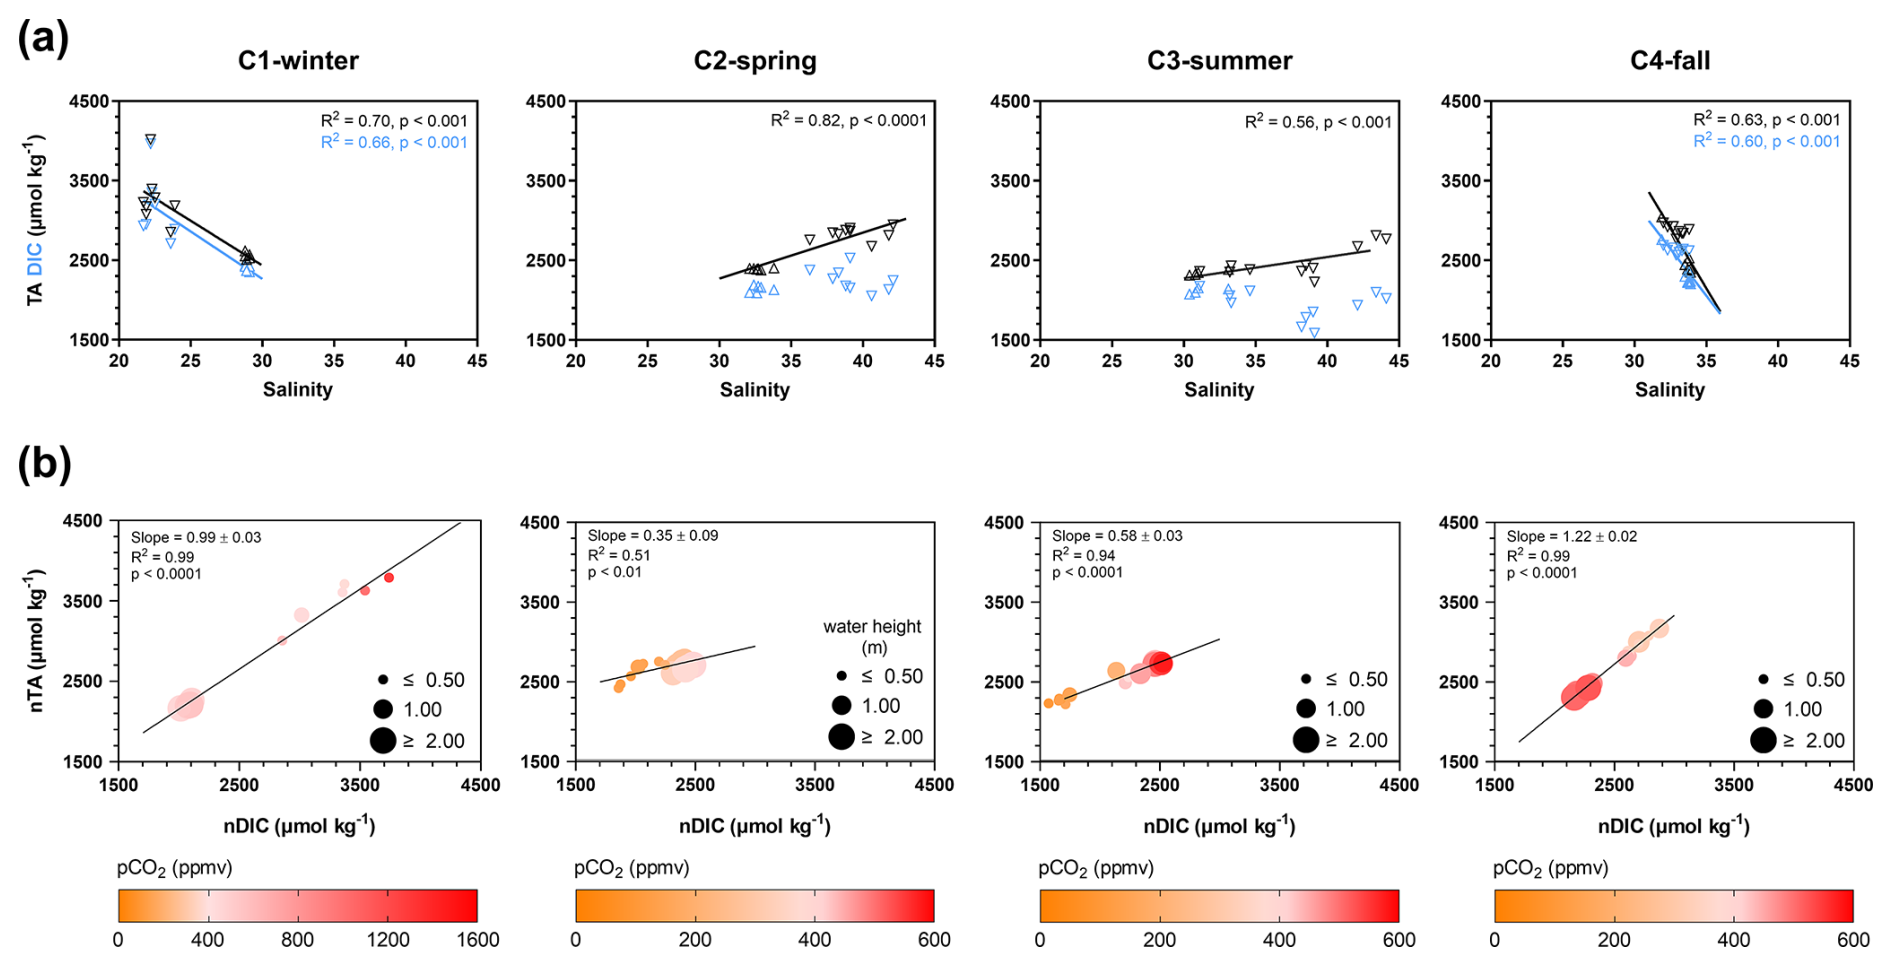
Figure 6(a) Cross-correlation plots of TA (black triangles) and DIC (blue triangles) concentrations vs. salinity values for each seasonal 24 h cycle. Downward triangles correspond to low tide (LT), and upward triangles correspond to high tide (HT). Salinity values at HT were similar between the 24 h cycles, but salinity values at LT strongly differed between the 24 h cycles. (b) Significant linear regressions between normalized TA (nTA) and normalized DIC (nDIC) for each seasonal 24 h cycle. nTA and nDIC data were calculated from Friis et al. (2003) with a mean salinity value for all samples (see the “Materials and methods” section). Water pCO2 levels (ppmv) are represented by a colour gradient, whereas water heights (m) are represented by a size gradient. Only the significant linear regressions (p<0.05) are shown. See Fig. S1 to view data from the hourly samplings.
Organic carbon also varied significantly at the seasonal scale (Kruskal–Wallis tests, p<0.05), with the highest POC and DOC concentrations recorded over C1-winter and C2-spring, respectively (Table 1). At the tidal scale, the highest concentrations were recorded at low tide and the lowest at high tide (Figs. 7a, b and S1). For example, during C2-spring, POC and DOC medians ranged from 40 to 231 µM and from 199 to 873 µM, respectively, from high to low tide. Systematically, large increases in carbon were recorded from high to low tide with (1) DIC increases predominating over C1-winter and C4-fall and (2) DOC increases predominating over C2-spring and C3-summer (Fig. 7a and b). Over all 24 h cycles, POC : PON ratios at low tide varied between 6 and 8 (except in C1-winter when the highest POC : PON ratios were recorded; Fig. 7c). A large seasonal amplitude of POC : Chl a ratios was recorded with the highest and lowest ratios recorded at low tide over C1-winter () and C4-fall (), respectively (Fig. 7d). Over C2-spring, lower POC : Chl a ratios were recorded at low tide than at high tide, whereas over C3-summer, the opposite was observed.
Nutrients also varied significantly between seasons (Kruskal–Wallis tests, p<0.05), with a strong decrease in _ and concentrations from C1-winter to C2-spring. DIP and DSi concentrations also decreased from C1-winter to C2-spring before increasing towards C3-summer (Table 1). On a shorter timescale (hourly sampling; Fig. S1), significantly higher concentrations of , DSi and DIP were recorded at low tide than at high tide (Mann–Whitney tests, p<0.05) no matter the diurnal scale, especially (1) over C1-winter for (Fig. 7f), (2) over C2-spring and C3-summer for DSi (Fig. 7g) and (3) over C1-winter and C3-summer for DIP (Fig. 7h) where the greatest amplitudes were recorded. Conversely, _ concentrations were significantly lower at low tide than at high tide (Mann–Whitney tests, p<0.05), especially over C1-winter (Fig. 7e).
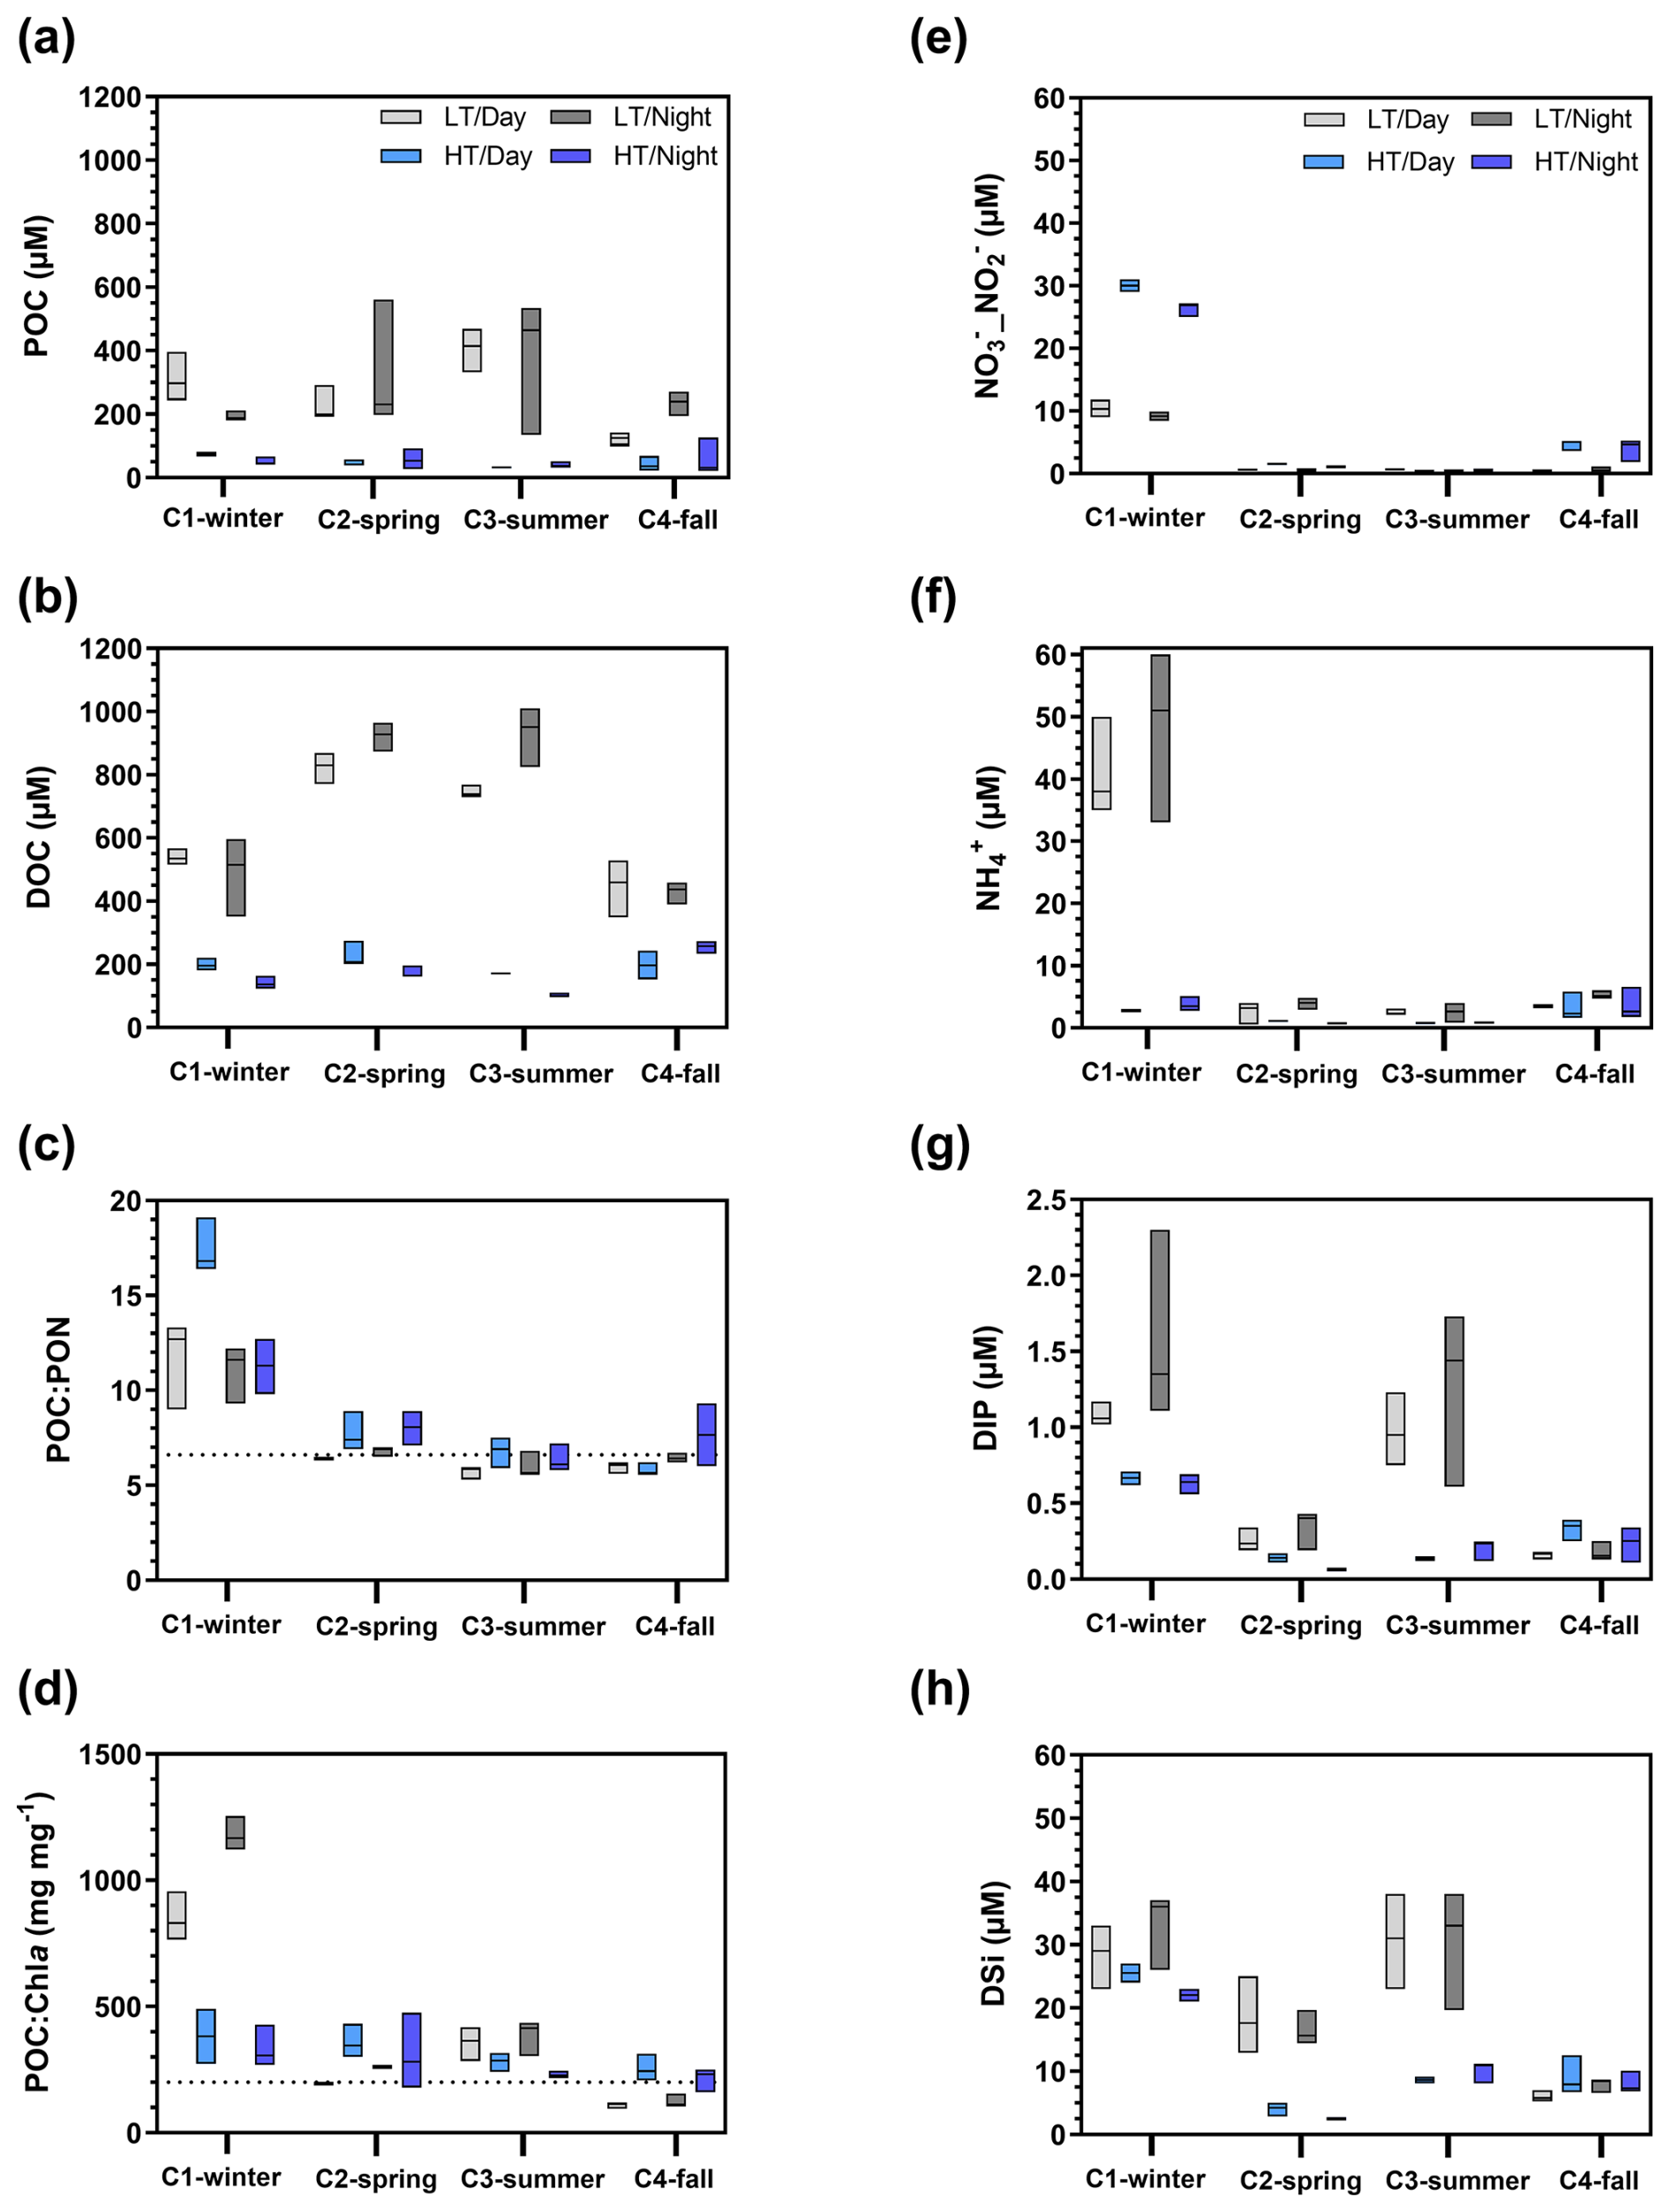
Figure 7Boxplot distribution of water biogeochemical parameters measured from hourly sampling during the seasonal 24 h cycles: (a) POC, (b) DOC, (c) POC : PON molar ratio, (d) POC : Chl a mass ratio and (e–h) nutrients. The dotted horizontal line in (c) corresponds to the Redfield ratio (i.e. theoretical molar ratio for plankton; POC : PON = 6.6 µmol µmol−1) (Redfield, 1958). The dotted horizontal line in (d) characterizes particulate organic matter as either autotrophic (POC : Chl a , dominance of “fresh” living phytoplankton) or heterotrophic (POC : Chl a , dominance of detrital organic material) (Savoye et al., 2003). LT/Day: low-tide day; HT/Day: high-tide day; LT/Night: low-tide night; HT/Night: high-tide night. Low-tide and high-tide periods were separated into Hw=0.50 m and , respectively, in the sampling channel. See Fig. S1 to view data from the hourly samplings.
3.5 Correlations and multiple factor variance analysis
In all discrete samplings over the year (n=59), DOC and Chl a displayed a strong negative correlations with water pCO2, whereas DIC and _ showed weak positive correlations with water pCO2 (Table 3). Organic carbon (POC and DOC) was positively correlated with Chl a, whereas _ was negatively correlated with Chl a. Increases in from high to low tide were strongly and positively correlated with TA and DIC (Table 3), especially over C1-winter (Fig. S1). Variance analyses of dissolved inorganic matter showed that TA, and DSi were much more explained by tides than by seasons, whereas the opposite was found for _ and DIC (Table S3 in the Supplement). Regarding dissolved organic matter, DOC was mainly controlled by tides (weak seasonal influence), whereas for particulate organic matter, POC was solely controlled by the tidal factor (Table S3). The diurnal factor did not significantly explain variance in measured biogeochemical parameters (except for DIP) but significantly affected the carbonate system parameters (DIC, TA and pCO2) over C1-winter only.
Table 3Spearman's rank correlations of water biogeochemical parameters recorded from hourly water samples during the four 24 h cycles (n=59).
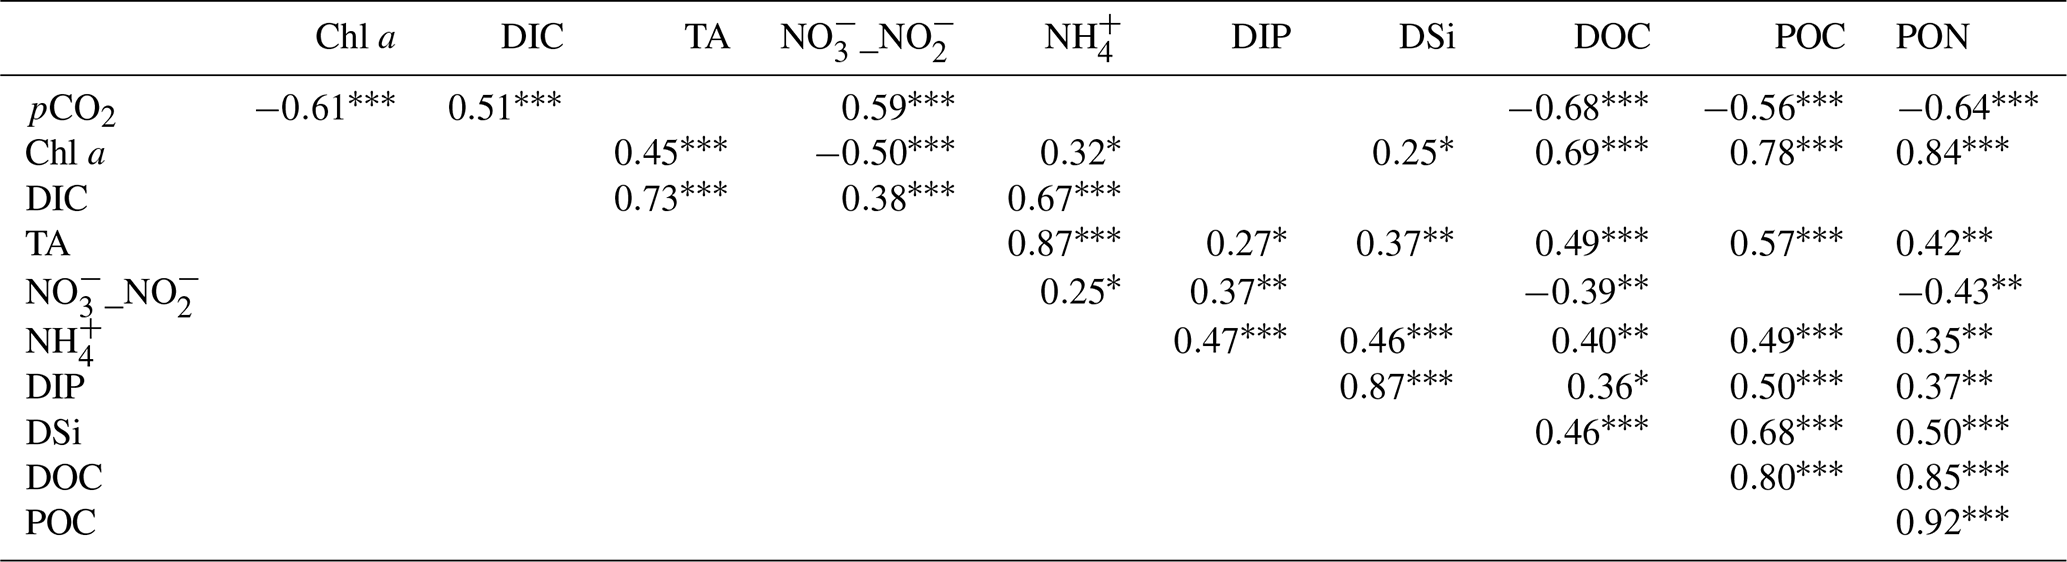
Asterisks designate significant correlations ( p<0.001, p<0.01, ∗ p<0.05; the absence of asterisks means no significant difference p>0.05).
3.6 Net ecosystem CO2 exchanges (NEEs) and daily C balances
Significant seasonal variations in measured NEE were highlighted between each 24 h cycle (Kruskal–Wallis test, p<0.001). On average, the highest and lowest marsh atmospheric CO2 sinks within the footprint were measured over C3-summer () and C1-winter (), respectively (Fig. 2). Over the 24 h cycles, the highest CO2 uptake and CO2 emission were recorded at low tides during daytime and night-time, respectively, associated with a major influence of marsh metabolism at the soil–air interface (i.e. measured NEE=estimated NEEmarsh; Fig. 2). During each high-tide period, immersion strongly disrupted NEE, although, in general, no change in the marsh CO2 sink/source status was noted (Fig. 2). For instance, at HT/Day, significant differences were recorded between measured NEE and estimated NEEmarsh over C1-winter and C2-spring (Wilcoxon tests, p<0.05), when tides decreased net marsh CO2 uptake by 80 % and 68 %, respectively (Fig. 2). However, no significant difference between measured NEE and estimated NEEmarsh was recorded over C3-summer at HT/Day (Wilcoxon test, p=0.41; NEE=NEEmarsh), although water CO2 oversaturation was measured at this time (553±40 ppmv; Fig. 2). At HT/Night, lower marsh CO2 emissions (NEE) were measured in comparison to estimated NEEmarsh (Wilcoxon tests, p<0.05), even inducing a switch from source to sink over C1-winter, although water CO2 oversaturation was measured over the same time (533±12 ppmv).
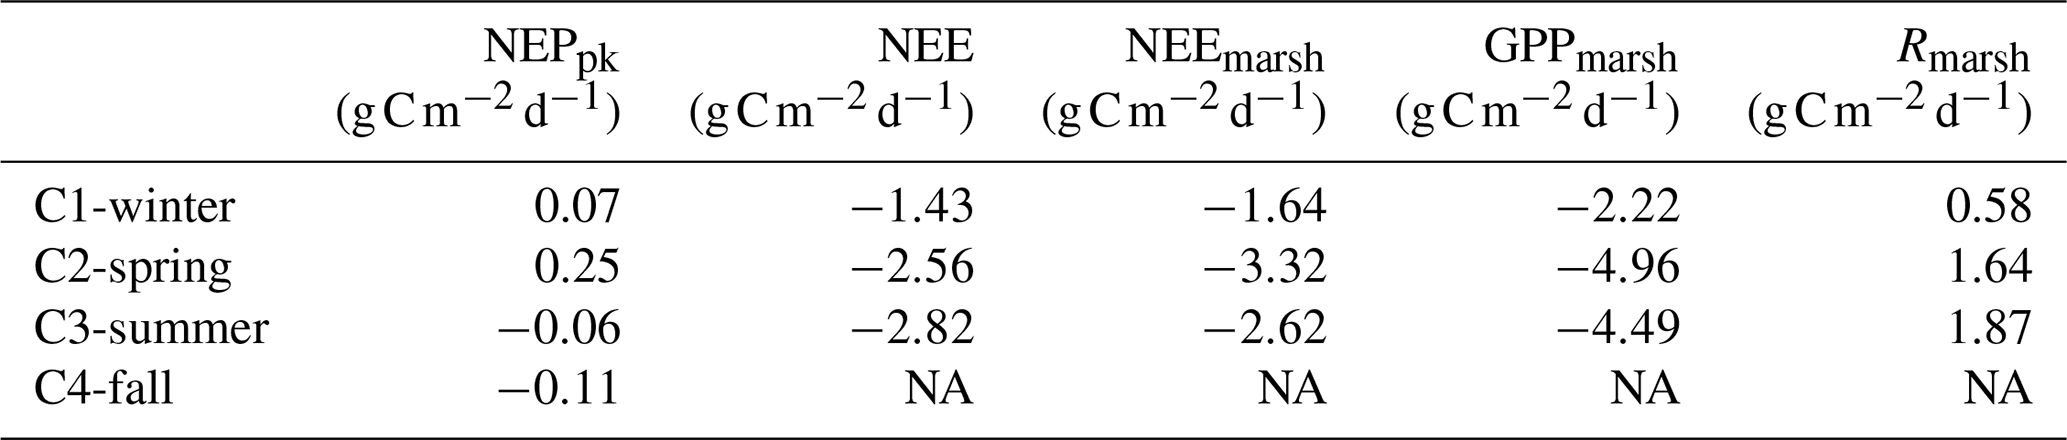
Over the 24 h cycles, daily C balances of planktonic aquatic metabolism (NEPpk) ranged from 0.25 (C2-spring; autotrophy) to (C4-fall; heterotrophy), while daily C balances of the integrative salt marsh within the footprint (NEE) ranged from −1.43 (C1-winter; C sink) to (C3-summer; C sink) (Table 4). Daily C balances from estimated NEEmarsh, considering only the marsh metabolism at the soil–air interface, ranged from −1.64 (C1-winter) to (C2-spring). The highest GPPmarsh rates were recorded over C2-spring and those of Rmarsh over C3-summer. At emersion, a significant proportion of the marsh primary production (GPPmarsh) was respired and released as atmospheric CO2 (Rmarsh) over the 24 h cycles (Rmarsh:GPPmarsh of 26 %, 33 % and 42 % over C1-winter, C2-spring and C3-summer, respectively; Table 4).
Table 4Daily C balances () of NEPpk rates (planktonic metabolism); NEE fluxes (marsh atmospheric CO2 exchanges); and NEEmarsh, GPPmarsh and Rmarsh fluxes (marsh metabolic fluxes at the benthic interface) during the four seasonal 24 h cycles. For NEPpk rates, positive C balances correspond to a planktonic autotrophy (net C sink in water), and negative C balances correspond to a planktonic heterotrophy (net C source in water). For marsh atmospheric CO2 exchanges with immersion (NEE) and without immersion (NEEmarsh), negative C balances correspond to an atmospheric C uptake by the marsh. NA: not available.
4.1 Temporal variations of water pCO2 in salt marshes
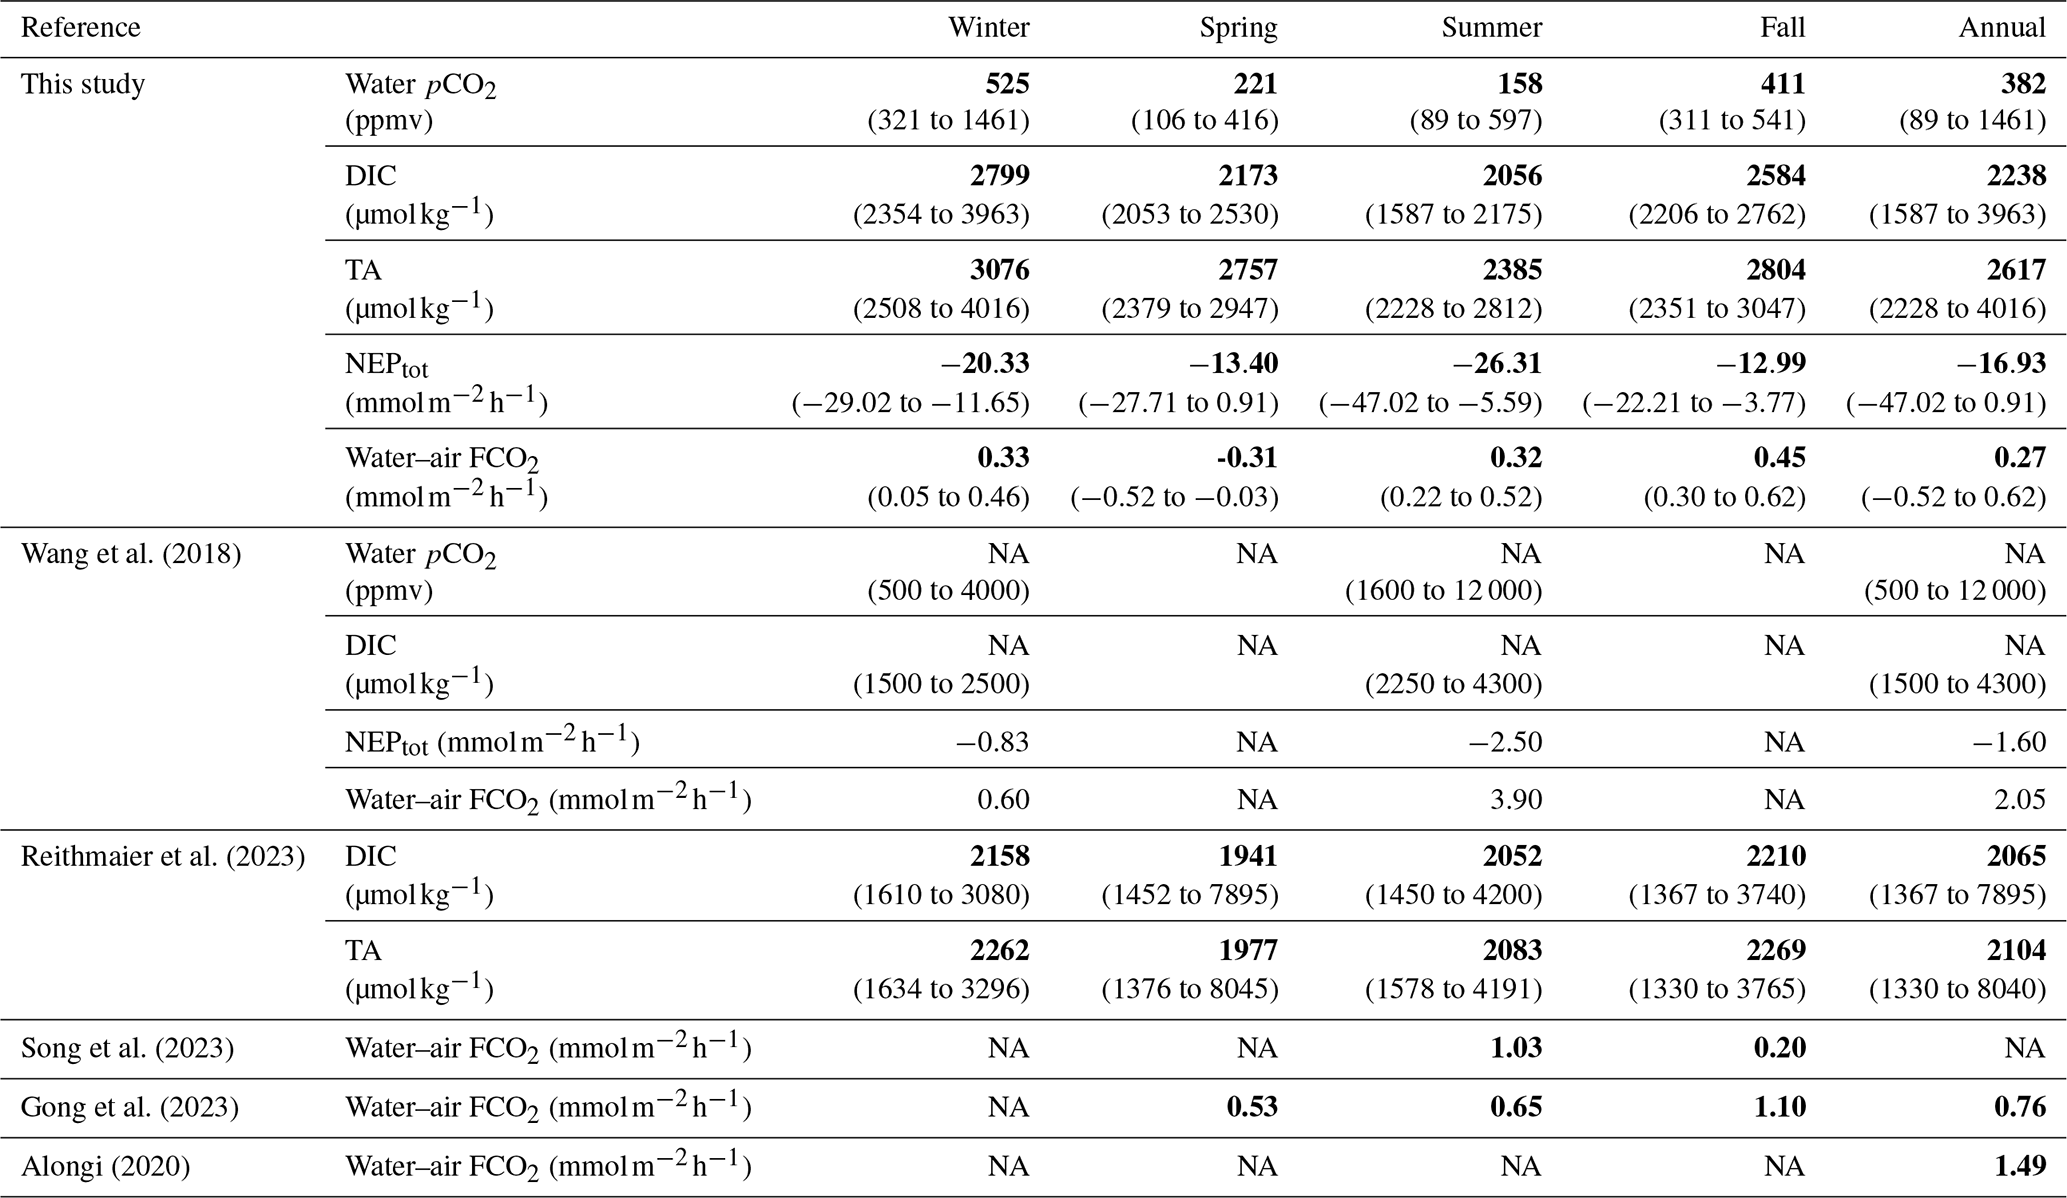
The four sampling 24 h cycles done at the different seasons and tidal phases showed large and significant temporal variations in carbon biogeochemical parameters, especially in water pCO2 (Table 5). As an illustration, we observed a maximal seasonal pCO2 amplitude of 430 ppmv (on average between two 24 h cycles) and a maximal tidal pCO2 variation of 1140 ppmv (between the high and low tide over a 24 h cycle). During high tide, during both the day and night, imported coastal waters were oversaturated in CO2, inducing atmospheric emissions during marsh immersion (except in spring; Table 2). Indeed, Mayen et al. (2023) confirmed that the coastal end-member (i.e. the continental shelf) behaved as a CO2 source, especially in winter during the highest river water flows from Aiguillon Bay. Thus, coastal waters imported to the studied salt marsh could degas the excess of terrestrially derived CO2 into the atmosphere (Fig. 8b). In the studied salt marsh, strong water pCO2 variations were then recorded from high to low tide due to more intense biological activity (production and respiration) at low tide in channel waters than at high tide in more buffered coastal waters, as shown elsewhere by Wang et al. (2018). At low tide in winter, the net marsh autotrophy during the day induced a small channel water pCO2 decrease, whereas the net marsh heterotrophy during the night induced a large channel water pCO2 increase. In contrast, during spring and summer, the intense autotrophy in channel waters induced the lowest pCO2 values during both the day and night (Fig. 2). Thus, during transient tidal phases, lateral exchanges with adjacent down- and upstream waters instantaneously produced intense channel water pCO2 variations, leading to (1) increases during flood tides (i.e. channel filling) in response to CO2-oversaturated coastal waters imported from the continental shelf and (2) decreases during ebb tides (i.e. channel emptying) in response to CO2-depleted marsh waters exported from salt ponds (Mayen et al., 2023), along with autochthonous metabolic processes (production and respiration) during these tidal periods (Fig. 8a). Similarly, the tidal water pCO2 variations observed over each seasonal 24 h cycle were also confirmed during the longer in situ measurement periods up to 5 d, encompassing our 24 h samplings. These intense tidal variations confirmed that water mixing processes occurring in the channel induced large changes in carbonate chemistry, mainly related to contrasted coastal and marsh end-members (Fig. 8). Our results also confirmed the substantial contribution of biological activity to water inorganic carbon pool at small timescales in salt marshes (Gong et al., 2023; Wang et al., 2016), especially water pCO2 (Song et al., 2023; Wang et al., 2018). Other studies in coastal wetlands (seagrasses, mangroves and salt marshes) show strong tidal control in inorganic carbon but, unlike our results, the highest pCO2 values were measured systematically at low tide, irrespective of day or night (Polsenaere et al., 2022 for tidal bays, Song et al., 2023 for salt marshes and Cabral et al., 2024 for mangroves). The organic carbon mineralization in sediments followed by the efflux of CO2-oversaturated pore waters to the water column by tidal pumping generally resulted in large water pCO2 increases at low tide (Borges et al., 2003; Burgos et al., 2018). Within a salt marsh-estuary coastal system (USA), water pCO2 in summer varied from 1600 ppmv (high tide) to 12 000 ppmv (low tide) (Table 5; Wang et al., 2018). Thus, horizontal exchanges of coastal waters with salt marshes strongly modify the water CO2 sink/source status due to a strong marsh metabolism (production and respiration).
Table 5Seasonal/annual comparison of water inorganic carbon dynamics (pCO2 in ppmv, DIC and TA in µmol kg−1), total aquatic metabolism (NEPtot in mmol) and water–air CO2 fluxes (FCO2 in ) between the Bossys perdus salt marsh (this study, France) and other similar temperate salt marsh systems in the literature. Median values are indicated in bold, and tidal range values are indicated in parentheses (min–max). NA: not available.
4.2 Marsh primary producer metabolism influence on water pCO2 and DOC
During daytime high tides, total aquatic metabolism was strongly heterotrophic (NEPtot<0) in winter, summer and fall, indicating a weak photosynthesis of immersed marsh plants and marine phytoplankton (Table 2 and Fig. 8b). However, during transient tidal phases from high to low tide, the large water pCO2 decreases and DOC concentration increases, especially in spring (−54 % and +77 %, respectively) and summer (−71 % and +85 %, respectively), could be related to a strong autochthonous and allochthonous marsh primary production (Fig. 8a). Indeed, a large part of inorganic carbon seemed to be fixed by primary producer photosynthesis (negative correlation between Chl a and water pCO2) including mainly phytoplankton, benthic microalgae and macroalgae, processed by metabolic processes and then exported from/to channel waters as organic carbon (negative correlation between DOC and water pCO2).
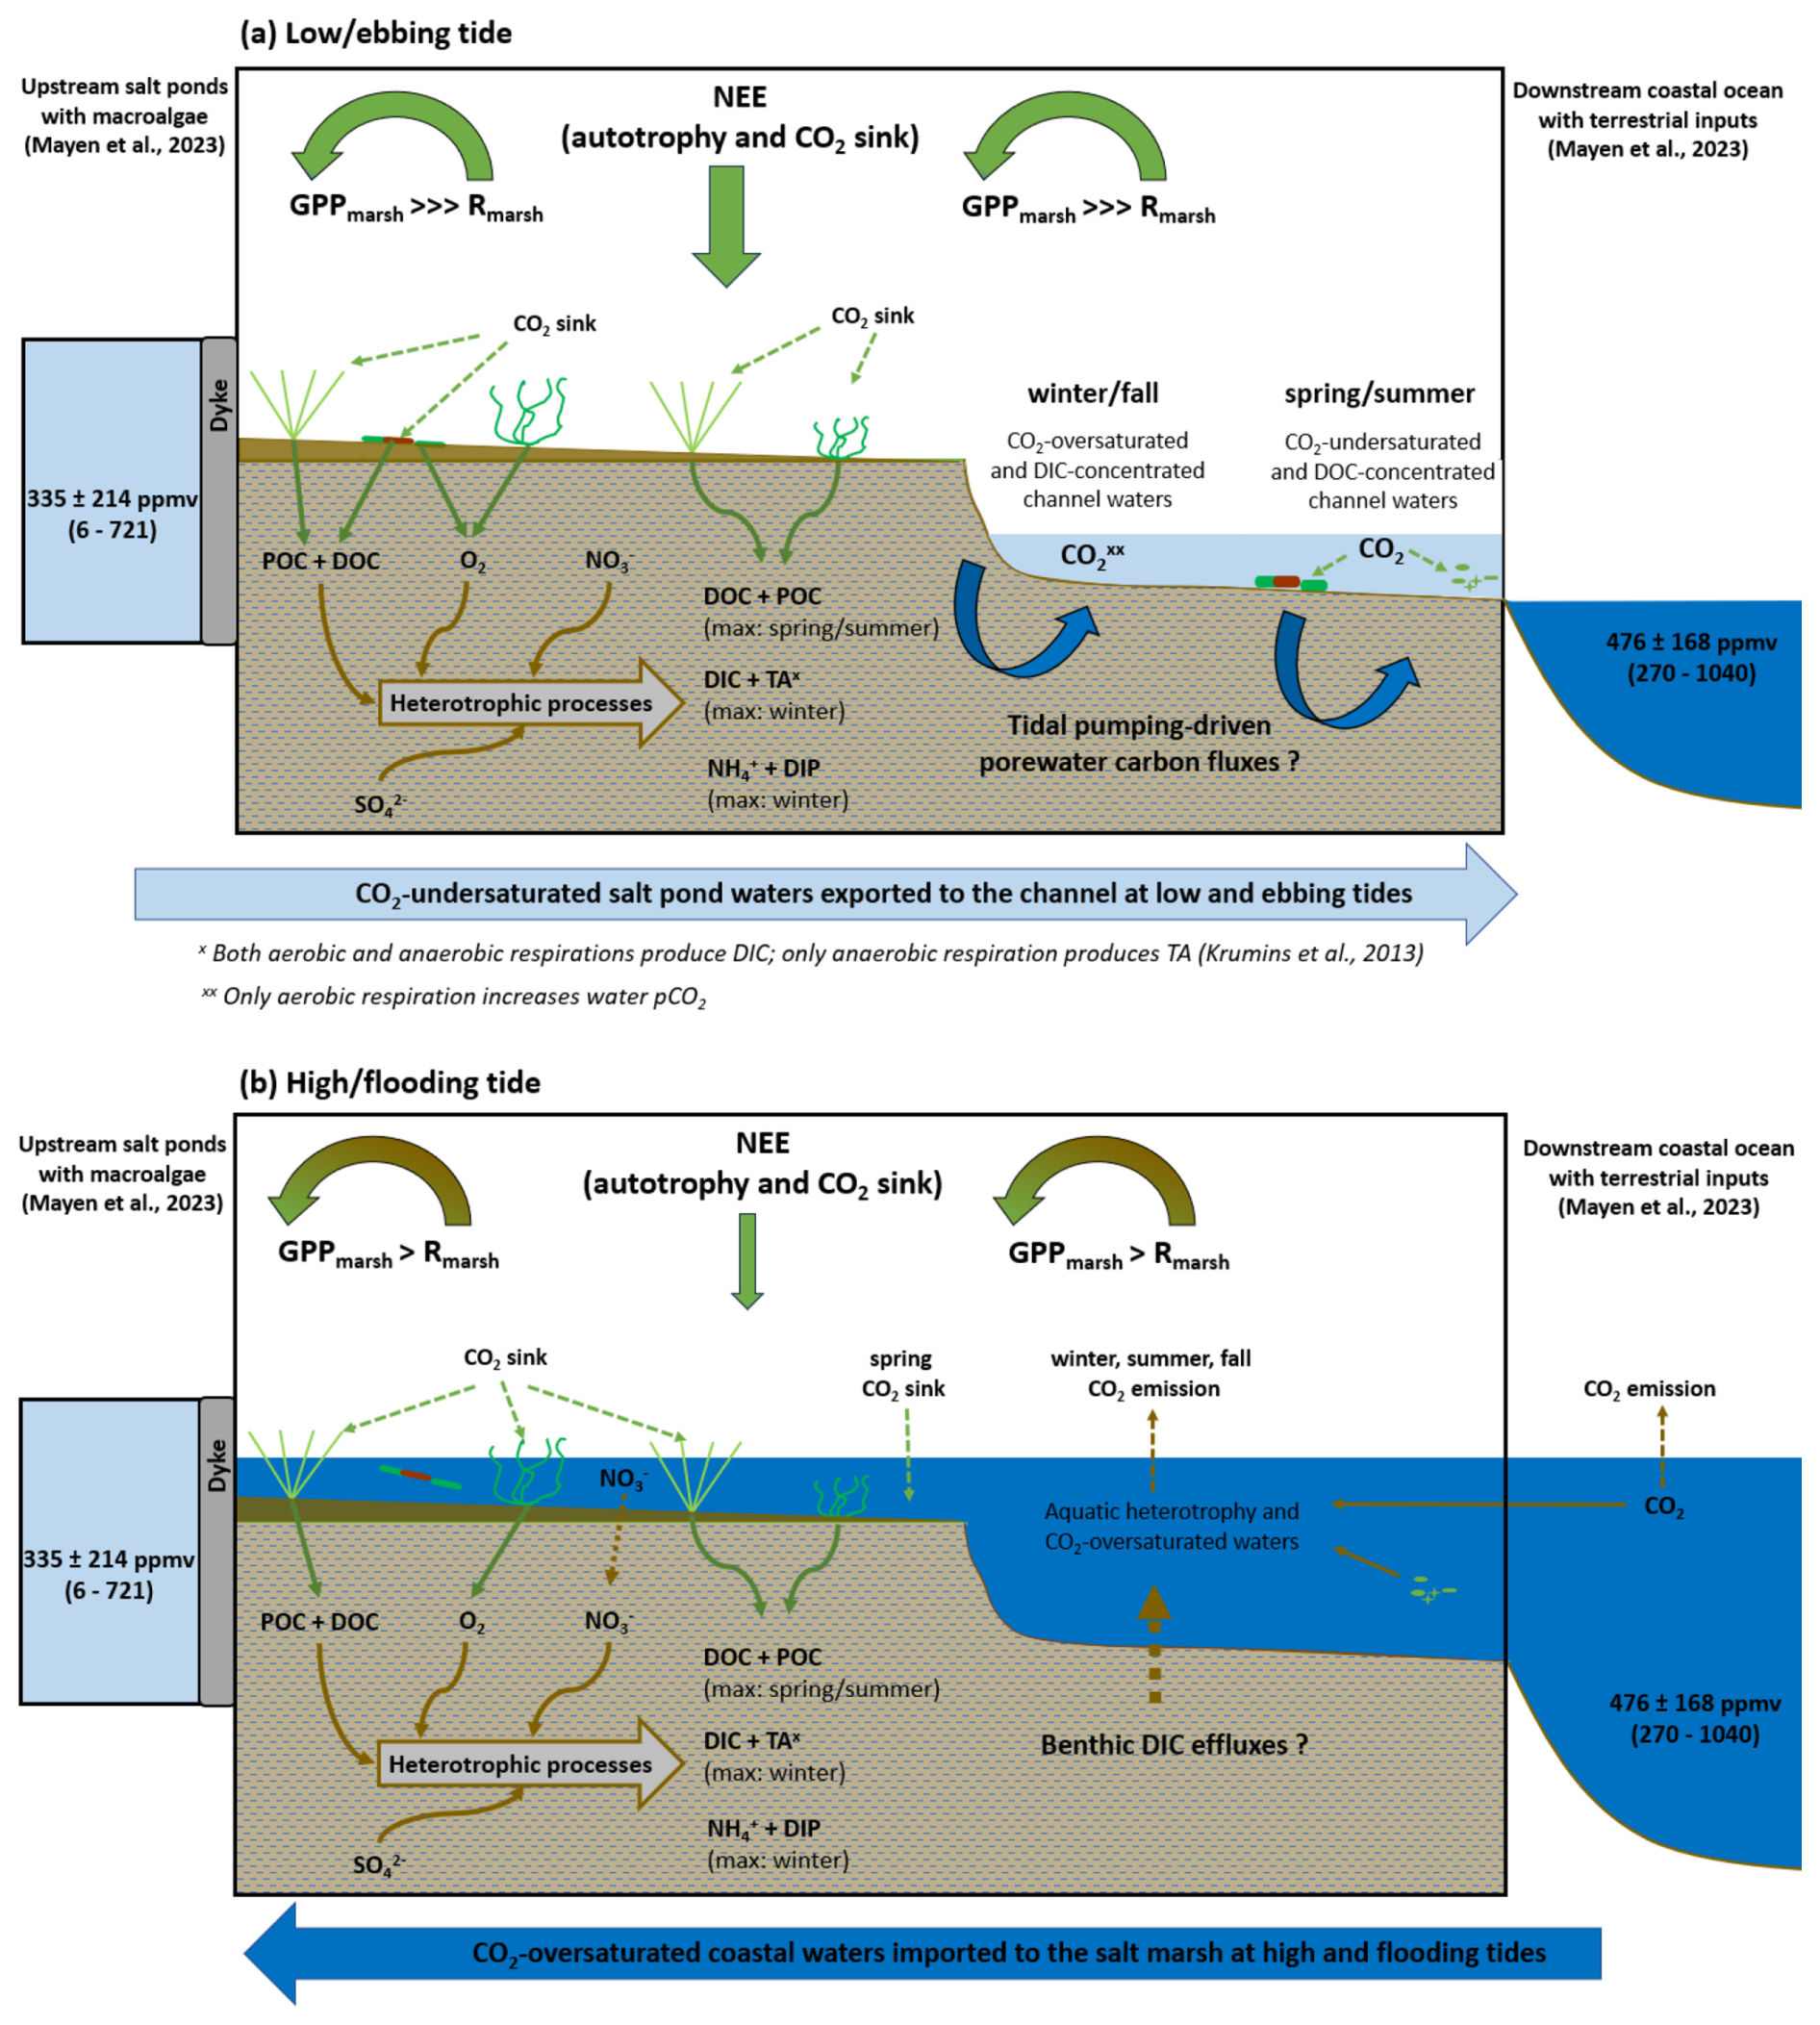
Figure 8Water inorganic carbon dynamics and atmospheric CO2 fluxes at the studied salt marsh at two contrasted tidal periods: (a) low and ebbing tides (marsh emersion and channel waters coming from autochthonous pore water drainage processes by tidal pumping and allochthonous water flow from upstream salt ponds) and (b) high and flooding tides (marsh immersion by downstream coastal waters). Green arrows indicate photosynthesis, while brown arrows indicate heterotrophic processes. Dotted lines correspond to vertical carbon fluxes at the sediment–water and water–air interfaces by diffusion. Large half-circle arrows represent the net balance between GPPmarsh and Rmarsh fluxes measured by atmospheric eddy covariance inside the footprint, while large vertical arrows represent net ecosystem CO2 exchanges (NEEs). During low and ebbing tides (a), the intense autotrophy of emerged plants and benthic microalgae induces the largest marsh CO2 sink at the ecosystem scale with weak influence of channel water CO2 fluxes. During high and flooding tides (b), GPP of emerged plants located on the highest marsh areas maintain a net marsh CO2 sink at the ecosystem scale despite large Reco fluxes from coastal waters (water–air CO2 source). At high tide, negative NEPtot rates in the water column correspond to aquatic heterotrophy (net DIC increases). Question marks correspond to uncertainties regarding the contribution of (a) pore water advection to the channel by tidal pumping during low and ebbing tides (pore waters enriched in DIC, TA and nutrients in winter and pore waters enriched in DOC and depleted in CO2 in spring) and (b) benthic DIC effluxes from sediments to the water column by diffusion during high and flooding tides. The black frame at each situation (a, b) delimits the studied salt marsh through the one-point sampling location in relationship with upstream and downstream end-members previously studied (Mayen et al., 2023, 2024).
During the 24 h cycles, the large phytoplankton abundance increases from high to low tide, especially in spring and summer (Fig. 4), indicated a development of planktonic communities in the salt marsh under nutrient-rich conditions and low water levels. At low tide (except in winter), POC : PON ratios were close to the Redfield value (Redfield, 1958), suggesting living phytoplanktonic biomass in channel waters. Moreover, phytoplankton was highlighted as the dominant carbon source at low tide using POC stable isotope ratios (δ13C of , and in spring, summer and fall, respectively; unpublished data) according to Gearing et al., (1988). In the sampled planktonic communities, high abundances of pennate diatoms in spring and summer indicated the presence of resuspended benthic microalgae mats (microphytobenthos) whose strong autotrophic metabolism could promote the lowest water pCO2 measured in the channel (Fig. 2), as observed elsewhere (Polsenaere et al., 2022). At low tide, these planktonic communities behaved as a CO2 sink during the daytime and as a CO2 source during the night-time (Fig. 5a). During the daytime low tide, the highest planktonic CO2 uptake (NEPpk>0) was recorded in spring (high PAR and temperate Tw) through a significant autotrophic activity of pennate diatoms and nanophytoplankton, whereas the decrease in planktonic CO2 uptake towards summer (high PAR and Tw) was concomitant to higher temperatures, promoting community respiration and, more generally, dominant heterotrophic processes (Fig. 5b). Moreover, in summer, the dinoflagellate bloom observed at low tide could also induce a lower planktonic CO2 uptake in summer than in spring since some species are known to be mixotrophic or even heterotrophic (Jeong et al., 2010; Stoecker, 1999). Thus, planktonic metabolism at low tide could significantly influence channel water pCO2 variations, especially in spring and summer, inducing large water CO2 undersaturations (Fig. 3). The planktonic community in channel waters was an important source of DOC (positive correlation between Chl a and DOC), produced through extracellular releases that commonly account for 5 %–30 % of their primary production (Karl et al., 1998) or through phytoplankton cell lysis, which can be an important process occurring under physiological stress conditions in summer such as nutrient limitation (Van Boekel et al., 1992). In our salt marsh, pennate diatoms and nanophytoplankton as fast-growing primary producers could release high labile DOC (De Brouwer and Stal, 2001; Morelle et al., 2022), which could then be degraded quickly to CO2 by bacterial remineralization (Oakes and Eyre, 2014). Indeed, DOC can also come from heterotrophic degradation of organic matter in the sediments (positive correlation between and DOC) and be transferred to channel waters by tidal pumping during the ebbing tide (Fig. 8).
In spring and summer at low tide, the strong daytime increases (up to 190 %) and night-time decreases (down to 10 %) of DO in channel waters (Fig. 2) could indicate intense biological activity of allochthonous aquatic macroalgae and/or autochthonous benthic microalgae which have higher rates of production and respiration than phytoplankton per unit area (Borum and Sand-Jensen, 1996; Hill et al., 2015). The fast-growing macroalgae recorded in the upstream salt ponds induced and maintained large water CO2 undersaturation at both day and night, especially during warm and bright periods, inducing low diurnal variations of water pCO2 (Mayen et al., 2023). Thus, these allochthonous macroalgae could also largely contribute to the large CO2 uptake and DOC production recorded in the sampling channel that receives all upstream salt pond waters at low and ebb tides (Fig. 8). Previous studies have reported that macroalgae primary production favours tidal DOC export, a part of which can be sequestered in the ocean interior or alike (Hill et al., 2015; Krause-Jensen and Duarte, 2016; Raven, 2018).
Finally, the strong primary production of emerged plants, especially in spring and summer (high daytime GPPmarsh rates; Fig. 2) and confirmed by Mayen et al. (2024) could also induce DOC production through above-ground and belowground litter loss and root exudations (Kristensen and Alongi, 2006; Schiebel et al., 2018), then be exported to surface waters by tidal pumping (Santos et al., 2019), resulting in the highest DOC concentrations at low tide (Fig. 7). Most of the DOC leached from marsh plants, like Spartina maritima, is labile and biodegradable through bacterial activity, especially polysaccharides. However, because of its long residence time, lignin-derived DOC is a potentially important source of recalcitrant humic substances in marsh-influenced waters (Arnaud et al., 2024; Moran and Hodson, 1990; Wang et al., 2014). Thus, over our spring and summer 24 h cycles, the CO2-depleted and DOC-concentrated water exports from high to low tide could highlight the major role of autochthonous and allochthonous marsh primary production in all compartments (terrestrial and aquatic) in the coastal carbon cycle. However, in some cases, it is difficult to distinguish the relative contribution of allochthonous and autochthonous metabolic processes to water carbon dynamics recorded in the channel as both process origins are involved (Fig. 8). Contrary to our study, Santos at al. (2021) indicated large DIC and DOC outwelling from salt marshes over all seasons; this could indicate lower aquatic heterotrophy and higher aquatic autotrophy at our studied marsh, especially in spring and summer, allowing simultaneously large CO2 uptake and DOC production.
4.3 Marsh aquatic respiration as DIC source
Large tidal variations of DIC and TA were recorded along the salinity gradient (Fig. 6a), confirming a strong control of water mixing processes occurring in the channel on the carbonate chemistry (Reithmaier et al., 2023). However, the slope of this relationship was negative in C1-winter/C4-fall and positive in C2-spring/C3-summer due to a seasonal shift in channel salinity. More precisely, in the upstream salt ponds supplying the studied marsh channel during low tide, large seasonal variations of salinity exist due to different meteorological conditions and water management, causing low salinity in winter/fall due to salt water dilution by rain and high salinity in spring/summer due to salt water evaporation through heat (Mayen et al., 2023). Due to this complexity, salinity could be a less straightforward tracer of water mixing processes in such salt marsh systems. During high tide (marsh immersion), total aquatic metabolism was heterotroph (NEPtot<0) during both the day and the night (except in spring during the day), inducing net DIC and pCO2 increases in water (Table 2 and Fig. 8b). At the same time, the low contribution of planktonic aquatic metabolism (NEPpk) to total aquatic metabolism (NEPtot) suggested a major influence of benthic respiration processes on the water inorganic carbon pool. Previous studies in intertidal wetlands have shown that benthic respiration produces strong sediment-to-water DIC fluxes through diffusion during immersion, inducing water CO2 oversaturation (Table 5) (Gong et al., 2023; Song et al., 2023).
During low tide (marsh emersion), the largest DIC and TA increases were measured in channel waters, especially in winter, highlighting the strong control of tidal forcing on water carbonate chemistry (Fig. 8a). In similar salt marsh systems, the same tidal DIC pattern was recorded over all seasons, with the highest concentrations at low tide and the lowest ones at high tide (Table 5). In most intertidal systems, such as salt marshes and mangroves, intense respiration processes occur in water-saturated muddy sediments, resulting in high DIC and TA concentrations in surface waters, especially at low tide through pore water exports driven by the tide (Nakamura et al., 2024; Reithmaier et al., 2023). In winter, during low autotrophic activity of S. maritima (Mayen et al., 2024), the highest POC : PON and POC : Chl a ratios measured at low tide (Fig. 7) suggested predominant detrital organic matter from decaying vegetation (Savoye et al., 2003). The high POC-δ13C values measured in winter at low tide (; unpublished data) confirm the presence of terrestrial C4 plants in channel waters, like S. maritima (Amann et al., 2024). The impermeable muddy sediment section at the benthic interface, saturated in pore waters and enriched in plant-derived organic matter, constitute an energy source for heterotrophic microbial activity, inducing, in turn, the largest increase of DIC and pCO2 measured at low tide at night (up to 3963 µmol kg−1 and 1461 ppmv, respectively; Fig. 6b). During this period, DIC increased faster than TA until reaching very close concentrations (Table 1). This could indicate that most of the carbonate ions () in channel waters were converted into bicarbonate ions () through the large addition of CO2 and H+ from marsh respiration processes, such that carbonate species in the exported channel waters mostly consisted of and dissolved CO2. In mangroves, Cabral et al. (2024) also confirmed a strong control of tidal forcing in water pCO2 dynamics with the highest values recorded at low tide during the highest tidal amplitudes. In addition, in our case, the strong DIP and increases from high to low tide could confirm the microbial respiration of organic matter in marsh sediments and, in turn, the lateral export of DIC from pore waters to channel waters by tidal pumping (Fig. 8a), as observed in other tidal systems (Cabral et al., 2024; Deborde et al., 2008; Santos et al., 2019). As coastal sediments are anoxic from the first millimetres (Wiebe et al., 1981), anaerobic respiration can be the dominant metabolic process in salt marshes, allowing DIC and TA outwelling (Reithmaier et al., 2023; Wang et al., 2016). In winter and fall, the nTA : nDIC regression slope (Fig. 6b) suggests a major contribution of sulfate reduction to DIC and TA additions according to theoretical stoichiometric ratios (Krumins et al., 2013). As sulfates are abundant in coastal waters, sulfate reduction is considered to be among the most important organic carbon mineralization pathways in salt marshes (Santos et al., 2021; Reithmaier et al., 2023; Wang et al., 2018). However, nutrient variations over our 24 h cycles could highlight other anaerobic processes, particularly at the benthic interface, involving DIC and TA production in channel waters. In winter at high tide, we recorded the highest concentrations of _ in coastal waters derived from riverine inputs (Belin et al., 2021). Over this 24 h cycle, the large _ decrease (sink) from high to low tide was significantly related to the large increase (source) (R2=0.90, p<0.001). This strong relationship could highlight a dissimilatory nitrate reduction to ammonium (DNRA) in sediments, which is known to be an important metabolic process in salt marshes producing DIC and TA (Giblin et al., 2013; Hopkinson and Giblin, 2008). In low winter autotrophy conditions, _ was not consumed by primary producers and could diffuse through sediments during immersion (Boynton et al., 2018), where it could be reduced to by DNRA (Koop-Jakobsen and Giblin, 2010) before diffusing to channel waters through tidal pumping (Zheng et al., 2016). Direct measurements of anaerobic processes at the benthic interface, such as sulfate reduction and DNRA, should be assessed to confirm the significance of these metabolic processes in the winter DIC production at the studied site.
In spring and summer, lower tidal variations of DIC and TA were measured (Fig. 6a). Contrary to winter and fall, the low-tide periods in spring and summer were associated with the lowest nDIC and nTA values simultaneously with the lowest water pCO2 (Fig. 6b), indicating high primary production and low anaerobic respiration in the marsh channel. The regression lines between nTA and nDIC were significant, but the slopes were lower than the theoretical stoichiometric ratios of denitrification and sulfate reduction (Krumins et al., 2013). It could confirm that aerobic respiration and photosynthesis took place during these productive seasons and contributed mainly to DIC variations. However, in summer at low tide, the highest planktonic respiration (Rpk) associated with high POC : Chl a ratios () and POC : PON ratios close to the Redfield value could suggest a large contribution of detrital phytoplanktonic biomass to DIC, DIP and DSi increases at the benthic interface, especially at night (Borawska et al., 2022; Boynton et al., 2018). However, this summer aquatic/benthic respiration in the channel was probably counterbalanced by the more intense autochthonous/allochthonous primary production (benthic microalgae and macroalgae), allowing it to maintain large water CO2 undersaturation at low tide (see Sect. 4.2). In this salt marsh, a shift from plant-decomposed organic matter in winter to labile fresh phytoplankton in spring/summer occurred.
4.4 Influence of aquatic and benthic metabolisms on NEE
For an integrative study of the planktonic community contribution to marsh CO2 uptake within the EC footprint, net daily C balances were computed from planktonic aquatic metabolism (NEPpk) and net ecosystem CO2 exchanges (NEEs), including both high- and low-tide periods (Table 4). Over our 24 h cycles, planktonic metabolism was net autotrophic in winter and spring due to higher daytime CO2 uptake than night-time CO2 source in waters, whereas it was net heterotrophic in summer and fall due to lower daytime CO2 uptake than night-time CO2 source. Simultaneously, in each season, NEE measurements indicated a more intense autotrophy of the whole salt marsh at the ecosystem scale (Mayen et al., 2024), allowing a large atmospheric C uptake with a major contribution from emerged marsh plants (NEEmarsh) and a minor one from planktonic communities (NEPpk; Table 4). In spring, immersion reduced marsh C uptake () despite planktonic autotrophy, whereas in summer, immersion slightly increased marsh C uptake () despite planktonic heterotrophy. Therefore, during our 24 h cycles, the study could indicate overall a low contribution of planktonic communities to marsh atmospheric C balances at the ecosystem scale, accounting for up to 10 % in spring. Moreover, NEE partitioning into GPPmarsh and Rmarsh at low tide allowed us to study the influence of benthic metabolism on marsh uptake/emission fluxes. Within our footprint, the low Rmarsh:GPPmarsh ratio in winter (i.e. 0.26) suggested a weak influence of detrital organic matter respiration at the benthic interface and associated ecosystem respiration on marsh C uptake at the ecosystem scale. On the contrary, the higher Rmarsh:GPPmarsh ratio in summer (i.e. 0.42) could indicate a significant negative contribution of ecosystem respiration to marsh C uptake (Table 4). In an intertidal wetland (China), Gong et al. (2023) showed that microbial respiration increased DIC in sediments at low tide and induced high atmospheric CO2 emissions from emerged sediments ().
During high tide, downstream coastal waters immersed the salt marsh (mudflats and plants) and quickly disrupted NEE since water created a physical barrier between the soil and the atmosphere, limiting CO2 diffusion (Mayen et al., 2024; Polsenaere et al., 2012). In our study, water–air CO2 fluxes estimated from water pCO2 could be compared to NEE measured simultaneously by EC to go further into the contribution of aquatic metabolism to uptake/emission fluxes at the ecosystem scale (Table 2 and Fig. 8). During the highest immersion levels of plants (winter and spring), total aquatic metabolism and associated water–air CO2 fluxes significantly influenced the overall marsh CO2 exchanges within the footprint. Indeed, during daytime immersion in winter, aquatic heterotrophy (NEPtot<0) and associated water CO2 oversaturation (water–air source) strongly reduced marsh CO2 uptake measured by EC (NEE≠NEEmarsh; Fig. 2), whereas in spring, aquatic autotrophy (NEPtot>0) and associated water CO2 undersaturation (water–air sink) could maintain a weak marsh CO2 uptake measured by EC associated with a low GPPmarsh from S. vera on the highest marsh levels (Fig. 2). On the contrary, during the lowest immersion levels of plants (summer), aquatic heterotrophy (NEPtot<0) and associated water CO2 oversaturation (water–air source) did not significantly influence marsh CO2 uptake (NEE=NEEmarsh; Fig. 2), which was mainly controlled by emerged plants (S. vera) more represented during this marsh situation. During the night-time, tidal immersion completely suppressed marsh CO2 emissions from ecosystem respiration (plants and sediments), even causing a change in NEE flux direction from source to sink in winter despite aquatic heterotrophy and water CO2 oversaturation (Table 2). This weak night-time CO2 uptake measured by EC during marsh immersion, as described in Mayen et al. (2024), could suggest important spatial water mass variations. Indeed, CO2 undersaturated waters not measured at our single CO2 sensor location but coming with the flood tide in the footprint could be related to coastal phytoplankton bloom development downstream of the marsh and influence NEE, as observed in a tidal bay nearby (Polsenaere et al., 2012). At our marsh, in spring 2022, an atmospheric CO2 sink was recorded during night-time immersion and could be related to a centric diatom bloom () seen a few days earlier in the downstream shelf waters (Belin et al., 2021). In general, besides these specific events, NEE at high tide remained strongly controlled by marsh vegetation, since emerged plants located on the highest levels can maintain daytime and night-time atmospheric CO2 uptake or emission, respectively, even in the presence of coastal water oversaturated or undersaturated in CO2.
Over the seasonal 24 h cycles, water pCO2 dynamics were partly controlled by tidal forcing, generating intense variations in channel waters during transient tidal phases due to contrasted end-members (coastal water CO2 oversaturation vs. marsh water CO2 undersaturation). Generally, at high tide, the CO2-concentrated coastal water input associated with the net DIC increase from aquatic/benthic heterotrophy generated water CO2 oversaturation (water pCO2 > air pCO2) during immersion. These water–air CO2 emissions were able to reduce marsh CO2 uptake measured by EC at the ecosystem scale during the highest water heights only, when mostly plants were immersed. Moreover, the physical barrier created by the water column between the marsh and the atmosphere limited CO2 diffusion to plants. From high to low tide, the salt marsh acted as a source of DIC, TA and , especially in winter, related to intense anaerobic respiration processes in waters and sediments inducing a significant increase in water pCO2. On the contrary, in spring and summer, intense autochthonous and allochthonous primary production, including phytoplankton, benthic microalgae and macroalgae, caused the lowest water pCO2 in the channel during both the day and night, coupled with high DOC production. The spring/summer phytoplanktonic bloom measured in channel waters and the associated aquatic autotrophy led to CO2-depleted water exportations downstream. However, at the daily scale, planktonic metabolism did not play a significant role in the marsh atmospheric CO2 balance measured by EC at the ecosystem scale (within the footprint). These results highlight the fact that horizontal exchanges of coastal waters occurring at small timescales (diurnal and tidal) in salt marshes can significantly influence water carbon dynamics and associated atmospheric CO2 fluxes over these dynamic blue carbon ecosystems and need to be specifically addressed and taken into account in regional and global coastal carbon study and balance.
In this study, the same diurnal/tidal synchronism (low and high tides at the same period of the day) was adopted during each 24 h cycle. However, due to the strong intraseasonal variability of meteorological (temperature, light, humidity, wind) and tidal (water level and immersion time) parameters, production and respiration rates in the marsh could strongly change from day to day and influence the marsh carbon cycle differently. Thus, several 24 h cycles per season with different meteorological and tidal conditions would allow us to better take into account all carbon temporal variabilities and to truly extrapolate (at the seasonal scale) our results to carbon dynamics in salt marshes. Direct measurements of benthic respiration processes and associated fluxes at different locations along the salt pond–salt marsh–continental shelf continuum could better constrain the contribution of autochthonous metabolic processes in the channel DIC production in comparison with allochthonous processes/inputs. Finally, lateral carbon exchanges and fluxes between marsh and end-member waters along with carbon sequestration rates should be put together with other measured fluxes at exchange interfaces and compartments to propose a first regional carbon budget of the studied tidal marsh and discussed among other regional and global carbon cycles.
All raw data can be provided by the corresponding authors upon request.
The supplement related to this article is available online at https://doi.org/10.5194/bg-22-5387-2025-supplement.
PP, ARdG, PS and JM designed the study. PP, ARdG and PS obtained the funding acquisition. JM, PP and JD performed the water sampling and measurements over all 24 h cycles, with ARdG, MA and PK occasionally participating in the fieldwork. JM, KC, YLM and ÉF performed the laboratory work. JM investigated and processed the data. PP, PS, ARdG, LA, VO and ÉL provided resources for data analysis. JM, PP, ARdG, PS and GA validated the data. JM made the graphics, wrote the draft and reviewed the paper. JM, PP, ARdG, PS and GA led the review process, assisted by MA, VO and JD.
The contact author has declared that none of the authors has any competing interests.
Publisher's note: Copernicus Publications remains neutral with regard to jurisdictional claims made in the text, published maps, institutional affiliations, or any other geographical representation in this paper. While Copernicus Publications makes every effort to include appropriate place names, the final responsibility lies with the authors.
We thank Ifremer (the French Research Institute for Exploitation of the Sea) for financing the PhD thesis (2020–2024) of Jérémy Mayen. We are grateful to Philippe Geairon (Ifremer) and Bénédicte Dubillot (LIENSs) for their help in the field. We thank our Ifremer colleagues for their laboratory work (Olivier Pierre-Duplessix, Anne Schmitt, Clarisse Hubert and Marie Latimier). Also, we thank Steven Bouillon and Yannick Stroobandt (KU Leuven) for isotope analysis. We are very grateful to the RNN staff (Julien Gernigon and Jean-Christophe Lemesle; Ligue pour la Protection des Oiseaux) for their partnership, their resources, their help in the field and associated experiment planning and authorization. We thank Alice Mellor (Ifremer) for proofreading the English and correcting the English content. This work is a contribution of Jérémy Mayen's PhD thesis, the CNRS-INSU LEFE-DYCIDEMAIM project (DYnamique du Carbone aux Interfaces D'Échange des MArais tIdaux teMpérés) and the ANR-PAMPAS project (Agence Nationale de la Recherche “évolution de l'identité PAtrimoniale des Marais des Pertuis charentais en réponse à l'Aléa de Submersion marine”, ANR-18-CE32-0006). Our grateful acknowledgements also go to the three anonymous reviewers for their constructive comments and suggestions. We also thank Jack Middelburg (Biogeosciences associate editor) for the final review of the paper.
This research has been supported by the Agence Nationale de la Recherche (grant no. ANR-18-CE32-0006) and the Centre National de Recherche Scientifique (CNRS, AO 2021 LEFE-EC2CO, no number).
This paper was edited by Jack Middelburg and reviewed by three anonymous referees.
Adame, M. F., Cormier, N., Taillardat, P., Iram, N., Rovai, A., Sloey, T. M., Yando, E. S., Blanco-Libreros, J. F., Arnaud, M., Jennerjahn, T., Lovelock, C. E., Friess, D., Reithmaier, G. M. S., Buelow, C. A., Muhammad-Nor, S. M., Twilley, R. R., and Ribeiro, R. A.: Deconstructing the mangrove carbon cycle: Gains, transformation, and losses, Ecosphere, 15, e4806, https://doi.org/10.1002/ecs2.4806, 2024.
Alongi, D. M.: Carbon Balance in Salt Marsh and Mangrove Ecosystems: A Global Synthesis, JMSE, 8, 767, https://doi.org/10.3390/jmse8100767, 2020.
Amann, B., Chaumillon, E., Bertin, X., Pignon-Mussaud, C., Marie-Claire, M.-C., Dupuy, C., Nathalie, L., and Sabine, S.: Understanding sediment and carbon accumulation in macrotidal minerogenic saltmarshes for climate resilience, Geomorphology, 467, 109465, https://doi.org/10.1016/j.geomorph.2024.109465, 2024.
Aminot, A. and Kérouel, R.: Hydrologie des écosystèmes marins: paramètres et analyses, Editions Quae, Versailles, France, ISBN 2-84433-133-5, 2004.
Aminot, A. and Kérouel, R.: Dosage automatique des nutriments dans les eaux marines: méthodes en flux continu, Editions Ifremer, méthodes d'analyse en milieu marin, 188 pp., ISBN-13 978-2-7592-0023-8, 2007.
Arnaud, M., Bakhos, M., Rumpel, C., Dignac, M.-F., Bottinelli, N., Norby, R. J., Geairon, P., Deborde, J., Kostyrka, P., Gernigon, J., Lemesle, J.-C., and Polsenaere, P.: Salt marsh litter decomposition varies more by litter type than by extent of sea-level inundation, Commun. Earth Environ., 5, 686, https://doi.org/10.1038/s43247-024-01855-0, 2024.
Bauer, J. E., Cai, W.-J., Raymond, P. A., Bianchi, T. S., Hopkinson, C. S., and Regnier, P. A. G.: The changing carbon cycle of the coastal ocean, Nature, 504, 61–70, https://doi.org/10.1038/nature12857, 2013.
Belin, C., Soudant, D., and Amzil, Z.: Three decades of data on phytoplankton and phycotoxins on the French coast: Lessons from REPHY and REPHYTOX, Harmful Algae, 102, 101733, https://doi.org/10.1016/j.hal.2019.101733, 2021.
Borawska, Z., Szymczycha, B., Silberberger, M. J., Koziorowska-Makuch, K., Szczepanek, M., and Kędra, M.: Benthic fluxes of dissolved silica are an important component of the marine Si cycle in the coastal zone, Estuar. Coast. Shelf S., 273, 107880, https://doi.org/10.1016/j.ecss.2022.107880, 2022.
Borges, A. V., Djenidi, S., Lacroix, G., Théate, J., Delille, B., and Frankignoulle, M.: Atmospheric CO2 flux from mangrove surrounding waters, Geophys. Res. Lett., 30, 2003GL017143, https://doi.org/10.1029/2003GL017143, 2003.
Borum, J. and Sand-Jensen, K.: Is Total Primary Production in Shallow Coastal Marine Waters Stimulated by Nitrogen Loading?, Oikos, 76, 406, https://doi.org/10.2307/3546213, 1996.
Boynton, W. R., Ceballos, M. A. C., Bailey, E. M., Hodgkins, C. L. S., Humphrey, J. L., and Testa, J. M.: Oxygen and Nutrient Exchanges at the Sediment-Water Interface: a Global Synthesis and Critique of Estuarine and Coastal Data, Estuar. Coast., 41, 301–333, https://doi.org/10.1007/s12237-017-0275-5, 2018.
Burgos, M., Ortega, T., and Forja, J.: Carbon Dioxide and Methane Dynamics in Three Coastal Systems of Cadiz Bay (SW Spain), Estuar. Coast., 41, 1069–1088, https://doi.org/10.1007/s12237-017-0330-2, 2018.
Cabral, A., Yau, Y. Y. Y., Reithmaier, G. M. S., Cotovicz, L. C., Barreira, J., Broström, G., Viana, B., Fonseca, A. L., and Santos, I. R.: Tidally driven porewater exchange and diel cycles control CO2 fluxes in mangroves on local and global scales, Geochim. Cosmochim. Ac., 374, 121–135, https://doi.org/10.1016/j.gca.2024.04.020, 2024.
Caffrey, J. M.: Factors controlling net ecosystem metabolism in US estuaries, Estuaries, 27, 90–101, https://doi.org/10.1007/BF02803563, 2004.
Cai, W.-J.: Estuarine and Coastal Ocean Carbon Paradox: CO2 Sinks or Sites of Terrestrial Carbon Incineration?, Annu. Rev. Mar. Sci., 3, 123–145, https://doi.org/10.1146/annurev-marine-120709-142723, 2011.
Carpenter, J. H.: The accuracy of the Winkler method for dissolved oxygen analysis, Limnol. Oceanogr., 10, 135–140, 1965.
Carrit, D. E. and Carpenter, J. H.: Comparison and evaluation of currently employed modifications of the Winkler method for determining dissolved oxygen in sea-water, J. Mar. Res., 24, 286–318, 1966.
Chapin, F. S., Woodwell, G. M., Randerson, J. T., Rastetter, E. B., Lovett, G. M., Baldocchi, D. D., Clark, D. A., Harmon, M. E., Schimel, D. S., Valentini, R., Wirth, C., Aber, J. D., Cole, J. J., Goulden, M. L., Harden, J. W., Heimann, M., Howarth, R. W., Matson, P. A., McGuire, A. D., Melillo, J. M., Mooney, H. A., Neff, J. C., Houghton, R. A., Pace, M. L., Ryan, M. G., Running, S. W., Sala, O. E., Schlesinger, W. H., and Schulze, E.-D.: Reconciling Carbon-cycle Concepts, Terminology, and Methods, Ecosystems, 9, 1041–1050, https://doi.org/10.1007/s10021-005-0105-7, 2006.
Chmura, G. L., Anisfeld, S. C., Cahoon, D. R., and Lynch, J. C.: Global carbon sequestration in tidal, saline wetland soils, Global Biogeochem. Cy., 17, 2002GB001917, https://doi.org/10.1029/2002GB001917, 2003.
Cotovicz, L. C., Knoppers, B. A., Régis, C. R., Tremmel, D., Costa-Santos, S., and Abril, G.: Eutrophication overcoming carbonate precipitation in a tropical hypersaline coastal lagoon acting as a CO2 sink (Araruama Lagoon, SE Brazil), Biogeochemistry, 156, 231–254, https://doi.org/10.1007/s10533-021-00842-3, 2021.
De Brouwer, J. and Stal, L.: Short-term dynamics in microphytobenthos distribution and associated extracellular carbohydrates in surface sediments of an intertidal mudflat, Mar. Ecol. Prog. Ser., 218, 33–44, https://doi.org/10.3354/meps218033, 2001.
Deborde, J., Anschutz, P., Auby, I., Glé, C., Commarieu, M.-V., Maurer, D., Lecroart, P., and Abril, G.: Role of tidal pumping on nutrient cycling in a temperate lagoon (Arcachon Bay, France), Mar. Chem., 109, 98–114, https://doi.org/10.1016/j.marchem.2007.12.007, 2008.
Dickson, A. G.: Standard potential of the reaction: , and the standard acidity constant of the ion HSO4 – in synthetic sea water from 273.15 to 318.15 K, J. Chem. Thermodyn., 22, 113–127, 1990.
Dickson, A. G. and Millero, F. J.: A comparison of the equilibrium constants for the dissociation of carbonic acid in seawater media, Deep-Sea Res., 34, 1733–1743, 1987.
Dickson, A. G., Sabine, C. L., and Christian, J. R. (Eds.): Guide to best practices for ocean CO2 measurements, North Pacific Marine Science Organization, 3rd edn., Sidney, British Columbia, https://www.oceanbestpractices.net/handle/11329/249 (last access: 22 May 2019), 2007.
Forbrich, I. and Giblin, A. E.: Marsh-atmosphere CO2 exchange in a New England salt marsh, J. Geophys. Res.-Biogeo., 120, 1825–1838, https://doi.org/10.1002/2015JG003044, 2015.
Friedlingstein, P., O'Sullivan, M., Jones, M. W., Andrew, R. M., Bakker, D. C. E., Hauck, J., Landschützer, P., Le Quéré, C., Luijkx, I. T., Peters, G. P., Peters, W., Pongratz, J., Schwingshackl, C., Sitch, S., Canadell, J. G., Ciais, P., Jackson, R. B., Alin, S. R., Anthoni, P., Barbero, L., Bates, N. R., Becker, M., Bellouin, N., Decharme, B., Bopp, L., Brasika, I. B. M., Cadule, P., Chamberlain, M. A., Chandra, N., Chau, T.-T.-T., Chevallier, F., Chini, L. P., Cronin, M., Dou, X., Enyo, K., Evans, W., Falk, S., Feely, R. A., Feng, L., Ford, D. J., Gasser, T., Ghattas, J., Gkritzalis, T., Grassi, G., Gregor, L., Gruber, N., Gürses, Ö., Harris, I., Hefner, M., Heinke, J., Houghton, R. A., Hurtt, G. C., Iida, Y., Ilyina, T., Jacobson, A. R., Jain, A., Jarníková, T., Jersild, A., Jiang, F., Jin, Z., Joos, F., Kato, E., Keeling, R. F., Kennedy, D., Klein Goldewijk, K., Knauer, J., Korsbakken, J. I., Körtzinger, A., Lan, X., Lefèvre, N., Li, H., Liu, J., Liu, Z., Ma, L., Marland, G., Mayot, N., McGuire, P. C., McKinley, G. A., Meyer, G., Morgan, E. J., Munro, D. R., Nakaoka, S.-I., Niwa, Y., O'Brien, K. M., Olsen, A., Omar, A. M., Ono, T., Paulsen, M., Pierrot, D., Pocock, K., Poulter, B., Powis, C. M., Rehder, G., Resplandy, L., Robertson, E., Rödenbeck, C., Rosan, T. M., Schwinger, J., Séférian, R., Smallman, T. L., Smith, S. M., Sospedra-Alfonso, R., Sun, Q., Sutton, A. J., Sweeney, C., Takao, S., Tans, P. P., Tian, H., Tilbrook, B., Tsujino, H., Tubiello, F., van der Werf, G. R., van Ooijen, E., Wanninkhof, R., Watanabe, M., Wimart-Rousseau, C., Yang, D., Yang, X., Yuan, W., Yue, X., Zaehle, S., Zeng, J., and Zheng, B.: Global Carbon Budget 2023, Earth Syst. Sci. Data, 15, 5301–5369, https://doi.org/10.5194/essd-15-5301-2023, 2023.
Friis, K., Körtzinger, A., and Wallace, D. W. R.: The salinity normalization of marine inorganic carbon chemistry data, Geophys. Res. Lett., 30, 2002GL015898, https://doi.org/10.1029/2002GL015898, 2003.
Gazeau, F., Smith, S. V., Gentili, B., Frankignoulle, M., and Gattuso, J.-P.: The European coastal zone: characterization and first assessment of ecosystem metabolism, Estuar. Coast. Shelf S., 60, 673–694, https://doi.org/10.1016/j.ecss.2004.03.007, 2004.
Giblin, A., Tobias, C., Song, B., Weston, N., Banta, G., and Rivera-Monroy, V.: The Importance of Dissimilatory Nitrate Reduction to Ammonium (DNRA) in the Nitrogen Cycle of Coastal Ecosystems, Oceanography, 26, 124–131, https://doi.org/10.5670/oceanog.2013.54, 2013.
Gearing, J. N.: The use of stable isotope ratios of tracing the nearshore-offshore exchange of organic matter, in: Coastal-offshore ecosystem interactions, edited by: Jansson, B.-O., Springer-Verlag, Berlin, 69–101, 1988.
Gran, G.: Determination of the equivalence point in potentiometric titrations Part II, Analyst, 77, 661–671, https://doi.org/10.1039/AN9527700661, 1952.
Gong, J.-C., Li, B.-H., Hu, J.-W., Ding, X.-J., Liu, C.-Y., and Yang, G.-P.: Tidal effects on carbon dioxide emission dynamics in intertidal wetland sediments, Environ. Res., 238, 117110, https://doi.org/10.1016/j.envres.2023.117110, 2023.
Hill, R., Bellgrove, A., Macreadie, P. I., Petrou, K., Beardall, J., Steven, A., and Ralph, P. J.: Can macroalgae contribute to blue carbon? An Australian perspective: Can macroalgae contribute to blue carbon?, Limnol. Oceanogr., 60, 1689–1706, https://doi.org/10.1002/lno.10128, 2015.
Hopkinson, C. S. and Giblin, A. E.: Nitrogen Dynamics of Coastal Salt Marshes, in: Nitrogen in the Marine Environment, Elsevier, 991–1036, https://doi.org/10.1016/B978-0-12-372522-6.00022-0, 2008.
Jähne, B., Münnich, K. O., Bösinger, R., Dutzi, A., Huber, W., and Libner, P.: On the parameters influencing air-water gas exchange, J. Geophys. Res., 92, 1937–1949, https://doi.org/10.1029/JC092iC02p01937, 1987.
Jeong, H. J., Yoo, Y. D., Kim, J. S., Seong, K. A., Kang, N. S., and Kim, T. H.: Growth, feeding and ecological roles of the mixotrophic and heterotrophic dinoflagellates in marine planktonic food webs, Ocean Sci. J., 45, 65–91, https://doi.org/10.1007/s12601-010-0007-2, 2010.
Karl, D. M., Hebel, D. V., Björkman, K., and Letelier, R. M.: The role of dissolved organic matter release in the productivity of the oligotrophic North Pacific Ocean, Limnol. Oceanogr., 43, 1270–1286, https://doi.org/10.4319/lo.1998.43.6.1270, 1998.
Koné, Y. J.-M. and Borges, A. V.: Dissolved inorganic carbon dynamics in the waters surrounding forested mangroves of the Ca Mau Province (Vietnam), Estuar. Coast. Shelf S., 77, 409–421, https://doi.org/10.1016/j.ecss.2007.10.001, 2008.
Koop-Jakobsen, K. and Giblin, A. E.: The effect of increased nitrate loading on nitrate reduction via denitrification and DNRA in salt marsh sediments, Limnol. Oceanogr., 55, 789–802, https://doi.org/10.4319/lo.2010.55.2.0789, 2010.
Kowalski, S., Sartore, M., Burlett, R., Berbigier, P., and Loustau, D.: The annual carbon budget of a French pine forest (Pinus pinaster) following harvest: Annual Carbon Budget of a Pine Forest after Harvest, Glob. Change Biol., 9, 1051–1065, https://doi.org/10.1046/j.1365-2486.2003.00627.x, 2003.
Krause-Jensen, D. and Duarte, C. M.: Substantial role of macroalgae in marine carbon sequestration, Nat. Geosci., 9, 737–742, https://doi.org/10.1038/ngeo2790, 2016.
Kristensen, E. and Alongi, D. M.: Control by fiddler crabs (Uca vocans) and plant roots (Avicennia marina) on carbon, iron, and sulfur biogeochemistry in mangrove sediment, Limnol. Oceanogr., 51, 1557–1571, https://doi.org/10.4319/lo.2006.51.4.1557, 2006.
Krumins, V., Gehlen, M., Arndt, S., Van Cappellen, P., and Regnier, P.: Dissolved inorganic carbon and alkalinity fluxes from coastal marine sediments: model estimates for different shelf environments and sensitivity to global change, Biogeosciences, 10, 371–398, https://doi.org/10.5194/bg-10-371-2013, 2013.
Labasque, T., Chaumery, C., Aminot, A., and Kergoat, G.: Spectrophotometric Winkler determination of dissolved oxygen: re-examination of critical factors and reliability, Mar. Chem., 88, 53–60, https://doi.org/10.1016/j.marchem.2004.03.004, 2004.
Laws, E. A.: Photosynthetic quotients, new production and net community production in the open ocean, Deep-Sea Res. Pt. I, 38, 143–167, https://doi.org/10.1016/0198-0149(91)90059-O, 1991.
Lee, K., Kim, T. W., Byrne, R. H., Millero, F. J., Feely, R. A., and Liu, Y. M.: The universal ratio of boron to chlorinity for the North Pacific and North Atlantic oceans, Geochim. Cosmochim. Ac., 74, 1801–1811, https://doi.org/10.1016/j.gca.2009.12.027, 2010.
Lewis, E. and Wallace, D.: Program developed for CO2 system calculations. Carbon dioxide information analysis center, Oak Ridge National Laboratory, https://doi.org/10.2172/639712, 1998.
Longhini, C. M., Souza, M. F. L., and Silva, A. M.: Net ecosystem production, calcification and CO2 fluxes on a reef flat in Northeastern Brazil, Estuar. Coast. Shelf S., 166, 13–23, https://doi.org/10.1016/j.ecss.2014.12.034, 2015.
Lorrain, A., Savoye, N., Chauvaud, L., Paulet, Y.-M., and Naulet, N.: Decarbonation and preservation method for the analysis of organic C and N contents and stable isotope ratios of low-carbonated suspended particulate material, Anal. Chim. Acta, 491, 125–133, https://doi.org/10.1016/S0003-2670(03)00815-8, 2003.
Mayen, J., Polsenaere, P., Regaudie De Gioux, A., Dupuy, C., Vagner, M., Lemesle, J.-C., Poitevin, B., and Souchu, P.: Influence of typology and management practices on water pCO2 and atmospheric CO2 fluxes over two temperate shelf–estuary–marsh water continuums, Regional Studies in Marine Science, 67, 103209, https://doi.org/10.1016/j.rsma.2023.103209, 2023.
Mayen, J., Polsenaere, P., Lamaud, É., Arnaud, M., Kostyrka, P., Bonnefond, J.-M., Geairon, P., Gernigon, J., Chassagne, R., Lacoue-Labarthe, T., Regaudie de Gioux, A., and Souchu, P.: Atmospheric CO2 exchanges measured by eddy covariance over a temperate salt marsh and influence of environmental controlling factors, Biogeosciences, 21, 993–1016, https://doi.org/10.5194/bg-21-993-2024, 2024.
Mcleod, E., Chmura, G. L., Bouillon, S., Salm, R., Björk, M., Duarte, C. M., Lovelock, C. E., Schlesinger, W. H., and Silliman, B. R.: A blueprint for blue carbon: toward an improved understanding of the role of vegetated coastal habitats in sequestering CO2, Front. Ecol. Environ., 9, 552–560, https://doi.org/10.1890/110004, 2011.
Mehrbach, C., Culberson, C. H., Hawley, J. E., Pytkowicz, R. M.: Measurement of the Apparent Dissociation Constants of Carbonic Acid in Seawater at Atmospheric Pressure, Limnol. Oceanogr., 18, 897–907, 1973.
Migné, A., Gévaert, F., Créach, A., Spilmont, N., Chevalier, E., and Davoult, D.: Photosynthetic activity of intertidal microphytobenthic communities during emersion: in situ measurements of chlorophyll fluorescence (PAM) and CO2 flux (IRGA)1, J. Phycol., 43, 864–873, https://doi.org/10.1111/j.1529-8817.2007.00379.x, 2007.
Moran, M. and Hodson, R.: Contributions of degrading Spartina alterniflora lignocellulose to the dissolved organic carbon pool of a salt marsh, Mar. Ecol. Prog. Ser., 62, 161–168, https://doi.org/10.3354/meps062161, 1990.
Morelle, J., Roose-Amsaleg, C., and Laverman, A. M.: Microphytobenthos as a source of labile organic matter for denitrifying microbes, Estuar. Coast. Shelf S., 275, 108006, https://doi.org/10.1016/j.ecss.2022.108006, 2022.
Nakamura, W., Phyo Thet Naing, Watanabe, K., Tokoro, T., Gempei, K., Endo, T., Kuwae, T., and Sasaki, J.: Changes in DIC/TA ratio by tidal asymmetry control pCO2 over a spring-neap tidal cycle in a subtropical mangrove forest in Japan, Geochem. J., 58, 28–45, https://doi.org/10.2343/geochemj.gj24003, 2024.
Oakes, J. M. and Eyre, B. D.: Transformation and fate of microphytobenthos carbon in subtropical, intertidal sediments: potential for long-term carbon retention revealed by 13C-labeling, Biogeosciences, 11, 1927–1940, https://doi.org/10.5194/bg-11-1927-2014, 2014.
Polsenaere, P., Lamaud, E., Lafon, V., Bonnefond, J.-M., Bretel, P., Delille, B., Deborde, J., Loustau, D., and Abril, G.: Spatial and temporal CO2 exchanges measured by Eddy Covariance over a temperate intertidal flat and their relationships to net ecosystem production, Biogeosciences, 9, 249–268, https://doi.org/10.5194/bg-9-249-2012, 2012.
Polsenaere, P., Delille, B., Poirier, D., Charbonnier, C., Deborde, J., Mouret, A., and Abril, G.: Seasonal, Diurnal, and Tidal Variations of Dissolved Inorganic Carbon and pCO2 in Surface Waters of a Temperate Coastal Lagoon (Arcachon, SW France), Estuar. Coast., https://doi.org/10.1007/s12237-022-01121-6, 2022.
Raven, J.: Blue carbon: past, present and future, with emphasis on macroalgae, Biol. Letters, 14, 20180336, https://doi.org/10.1098/rsbl.2018.0336, 2018.
Razanamahandry, V. F., Borges, A. V., Brosens, L., Morana, C., Razafimbelo, T., Rafolisy, T., Govers, G., and Bouillon, S.: Biogeochemical functioning of Lake Alaotra (Madagascar): a reset of aquatic carbon sources along the land–ocean aquatic continuum, Biogeosciences, 22, 2403–2424, https://doi.org/10.5194/bg-22-2403-2025, 2025.
Reithmaier, G. M. S., Cabral, A., Akhand, A., Bogard, M. J., Borges, A. V., Bouillon, S., Burdige, D. J., Call, M., Chen, N., Chen, X., Cotovicz, L. C., Eagle, M. J., Kristensen, E., Kroeger, K. D., Lu, Z., Maher, D. T., Pérez-Lloréns, J. L., Ray, R., Taillardat, P., Tamborski, J. J., Upstill-Goddard, R. C., Wang, F., Wang, Z. A., Xiao, K., Yau, Y. Y. Y., and Santos, I. R.: Carbonate chemistry and carbon sequestration driven by inorganic carbon outwelling from mangroves and saltmarshes, Nat. Commun., 14, 8196, https://doi.org/10.1038/s41467-023-44037-w, 2023.
Redfield, A. C.: The biological control of chemical factors in the environment, Am. Sci., 46, 205–221, 1958.
Saderne, V., Baldry, K., Anton, A., Agustí, S., and Duarte, C. M.: Characterization of the CO2 System in a Coral Reef, a Seagrass Meadow, and a Mangrove Forest in the Central Red Sea, JGR Oceans, 124, 7513–7528, https://doi.org/10.1029/2019JC015266, 2019.
Santos, I. R., Maher, D. T., Larkin, R., Webb, J. R., and Sanders, C. J.: Carbon outwelling and outgassing vs. burial in an estuarine tidal creek surrounded by mangrove and saltmarsh wetlands, Limnol. Oceanogr., 64, 996–1013, https://doi.org/10.1002/lno.11090, 2019.
Santos, I. R., Burdige, D. J., Jennerjahn, T. C., Bouillon, S., Cabral, A., Serrano, O., Wernberg, T., Filbee-Dexter, K., Guimond, J. A., and Tamborski, J. J.: The renaissance of Odum's outwelling hypothesis in “Blue Carbon” science, Estuar. Coast. Shelf S., 255, 107361, https://doi.org/10.1016/j.ecss.2021.107361, 2021.
Savelli, R., Bertin, X., Orvain, F., Gernez, P., Dale, A., Coulombier, T., Pineau, P., Lachaussée, N., Polsenaere, P., Dupuy, C., and Le Fouest, V.: Impact of Chronic and Massive Resuspension Mechanisms on the Microphytobenthos Dynamics in a Temperate Intertidal Mudflat, J. Geophys. Res.-Biogeo., 124, 3752–3777, https://doi.org/10.1029/2019JG005369, 2019.
Savoye, N., Aminot, A., Tréguer, P., Fontugne, M., Naulet, N., and Kérouel, R.: Dynamics of particulate organic matter d15N and d13C during spring phytoplankton blooms in a macrotidal ecosystem (Bay of Seine, France), Mar. Ecol. Prog. Ser., 255, 27–41, https://doi.org/10.3354/meps255027, 2003.
Schäfer, K. V. R., Tripathee, R., Artigas, F., Morin, T. H., and Bohrer, G.: Carbon dioxide fluxes of an urban tidal marsh in the Hudson-Raritan estuary: Carbon dioxide fluxes of an wetland, J. Geophys. Res.-Biogeo., 119, 2065–2081, https://doi.org/10.1002/2014JG002703, 2014.
Schiebel, H. N., Gardner, G. B., Wang, X., Peri, F., and Chen, R. F.: Seasonal Export of Dissolved Organic Matter from a New England Salt Marsh, J. Coastal Res., 344, 939–954, https://doi.org/10.2112/JCOASTRES-D-16-00196.1, 2018.
Song, S., Wang, Z. A., Kroeger, K. D., Eagle, M., Chu, S. N., and Ge, J.: High-frequency variability of carbon dioxide fluxes in tidal water over a temperate salt marsh, Limnol. Oceanogr., lno.12409, https://doi.org/10.1002/lno.12409, 2023.
Stoecker, D. K.: Mixotrophy among Dinoflagellates, J. Eukaryot. Microbiol., 46, 397–401, https://doi.org/10.1111/j.1550-7408.1999.tb04619.x, 1999.
Utermöhl, H.: Zur vervollkommnung der quantitativen phytoplankton methodik, Mitteilungen-Internationale Vereiningung fur Limnologie, 9, 1–38, 1958.
Van Boekel, W., Hansen, F., Riegman, R., and Bak, R.: Lysis-induced decline of a Phaeocystis spring bloom and coupling with the microbial foodweb, Mar. Ecol. Prog. Ser., 81, 269–276, https://doi.org/10.3354/meps081269, 1992.
Van Dam, B. R., Edson, J. B., and Tobias, C.: Parameterizing Air-Water Gas Exchange in the Shallow, Microtidal New River Estuary, JGR Biogeosciences, 124, 2351–2363, https://doi.org/10.1029/2018JG004908, 2019.
Wang, J., Yu, G., Han, L., Yao, Y., Sun, M., and Yan, Z.: Ecosystem carbon exchange across China's coastal wetlands: Spatial patterns, mechanisms, and magnitudes, Agr. Forest Meteorol., 345, 109859, https://doi.org/10.1016/j.agrformet.2023.109859, 2024.
Wang, S. R., Di Iorio, D., Cai, W., and Hopkinson, C. S.: Inorganic carbon and oxygen dynamics in a marsh-dominated estuary, Limnol. Oceanogr., 63, 47–71, https://doi.org/10.1002/lno.10614, 2018.
Wang, X., Chen, R. F., Cable, J. E., and Cherrier, J.: Leaching and microbial degradation of dissolved organic matter from salt marsh plants and seagrasses, Aquat. Sci., 76, 595–609, https://doi.org/10.1007/s00027-014-0357-4, 2014.
Wang, Z. A. and Cai, W.-J.: Carbon dioxide degassing and inorganic carbon export from a marsh-dominated estuary (the Duplin River): A marsh CO2 pump, Limnol. Oceanogr., 49, 341–354, https://doi.org/10.4319/lo.2004.49.2.0341, 2004.
Wang, Z. A., Kroeger, K. D., Ganju, N. K., Gonneea, M. E., and Chu, S. N.: Intertidal salt marshes as an important source of inorganic carbon to the coastal ocean, Limnol. Oceanogr., 61, 1916–1931, https://doi.org/10.1002/lno.10347, 2016.
Wei, S., Han, G., Jia, X., Song, W., Chu, X., He, W., Xia, J., and Wu, H.: Tidal effects on ecosystem CO2 exchange at multiple timescales in a salt marsh in the Yellow River Delta, Estuar. Coast. Shelf S., 238, 106727, https://doi.org/10.1016/j.ecss.2020.106727, 2020.
Wiebe, W. J., Christian, R. R., Hansen, J. A., King, G., Sherr, B., and Skyring, G.: Anaerobic respiration and fermentation, in: The ecology of a salt marsh, edited by: Pomeroy, L. R. and Wiegert, R. G., Springer-Verlag, New-York, 137–159, 1981.
Wielgat-Rychert, M., Rychert, K., Witek, Z., and Zalewski, M.: Calculation of the photosynthetic quotient (PQ) in the Gulf of Gdansk (Southern Baltic) Baltic Coastal Zone, J. Ecol. Protec. Coast, 21, 51–60, https://bcz.upsl.edu.pl/index.php/1/article/view/300 (last access: 29 February 2024), 2017.
Weiss, R. F.: Carbon dioxide in water and seawater: the solubility of a non-ideal gas, Mar. Chem. 2, 203–215, https://doi.org/10.1016/0304-4203(74)90015-2, 1974.
Xi, M., Zhang, X., Kong, F., Li, Y., Sui, X., and Wang, X.: CO2 exchange under different vegetation covers in a coastal wetland of Jiaozhou Bay, China, Ecol. Eng., 137, 26–33, https://doi.org/10.1016/j.ecoleng.2018.12.025, 2019.
Zheng, Y., Hou, L., Liu, M., Liu, Z., Li, X., Lin, X., Yin, G., Gao, J., Yu, C., Wang, R., and Jiang, X.: Tidal pumping facilitates dissimilatory nitrate reduction in intertidal marshes, Sci. Rep., 6, 21338, https://doi.org/10.1038/srep21338, 2016.