the Creative Commons Attribution 4.0 License.
the Creative Commons Attribution 4.0 License.
 | 10 Oct 2025
Long-term nitrogen fertilization alters microbial respiration sensitivity to temperature and moisture, potentially enhancing soil carbon retention in a boreal Scots pine forest
Aleksi Lehtonen
Stefano Manzoni
Elisa Bruni
Petr Baldrian
Etienne Richy
Bartosz Adamczyk
Bertrand Guenet
Raisa Mäkipää
Nutrient availability affects microbial respiration kinetics; their sensitivities to environmental conditions; and, thus, the soil organic carbon (SOC) stocks. We examined long-term nitrogen (N) addition effects on soil heterotrophic respiration (Rh), methane (CH4) oxidation, and nitrous oxide (N2O) emissions in an N-limited boreal Scots pine (Pinus sylvestris) forest in central Finland. Measurements included the following (in both control and N-fertilized plots): long-term tree biomass monitoring (1960–2020); soil organic carbon (SOC) monitoring in 2023; monthly aboveground litterfall monitoring (2021–2023); biweekly CO2, CH4, and N2O fluxes during the 2021–2023 growing seasons; and quarter-hourly recordings of soil temperature (T) and soil water content (SWC). We assessed mean greenhouse gas (GHG) flux differences and Rh dependence on T and SWC using polynomial and nonlinear regression models.
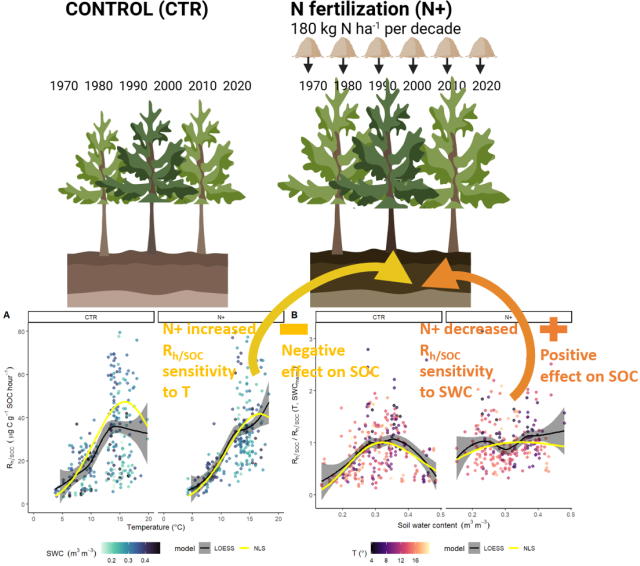
Tree biomass, litterfall, and SOC increased with long-term N fertilization. However, N fertilization also significantly increased mean Rh, reduced CH4 oxidation slightly, and modestly raised N2O emissions. SOC-normalized Rh () did not significantly differ between treatments, yet relationships between and T and SWC diverged with fertilization. In control plots, peaked at 15.8 °C, whereas it peaked at 16.8 °C in N-fertilized plots. Under N fertilization conditions, was weakly SWC-dependent, contrasting with a distinct humped SWC response enhancing annual in control plots. Annually, N-fertilized plots respired 10.3 % of SOC (±0.3 SE, standard error), compared to 12.2 % (±0.5 SE) in control plots, suggesting that N fertilization promoted SOC retention. Consequently, N fertilization reduced average annual net CO2 emissions by 345.4 (±73.6 SE) , while the combined effects on CH4 and N2O fluxes and the production energy of N fertilizer contributed a minor CO2-equivalent increase of 17.7 (±0.5 SE) .
In conclusion, long-term N fertilization in boreal forests could reduce the global warming potential of soil GHG emissions, mainly by slowing and altering its responses to T and SWC, thereby enhancing SOC sequestration in addition to the increased tree biomass carbon sink.
- Article
(2739 KB) - Full-text XML
-
Supplement
(741 KB) - BibTeX
- EndNote


Vegetation growth in boreal forests is primarily constrained by temperature (Jarvis and Linder, 2000) and soil nutrient availability, particularly nitrogen (N) (Näsholm et al., 1998; Högberg et al., 2017). Atmospheric N deposition or fertilization can enhance tree biomass growth (Lupi et al., 2013; Saarsalmi and Mälkönen, 2001; Sponseller et al., 2016) and increase soil carbon (C) sequestration by promoting productivity and litter inputs while also reducing decomposition rates (Janssens et al., 2010; Marshall et al., 2021; Smolander et al., 1994). This increased C storage in both tree biomass and soil after N fertilization could be seen as a positive feedback effect on the ecosystem C balance in Northern Hemisphere forests (Hyvönen et al., 2008; Mäkipää et al., 2023). However, the effects of N fertilization on organic matter (OM) decomposition and the net balance of greenhouse gas (GHG) emissions (CO2, CH4, and N2O) are less well understood and equally critical for assessing the forest C balance and its global warming potential. N fertilization may reduce soil CO2 emissions (Janssens et al., 2010), due to enhanced microbial carbon use efficiency (CUE) (Manzoni et al., 2012b, 2017) and decreased need for N mining from organic matter (Craine et al., 2007). It may also increase N2O emissions, due to greater soil N availability (Högberg et al., 2017; Öquist et al., 2024), and potentially alter CH4 uptake, by either increasing N availability for CH4-oxidizing microbes or by competing with NH4 for reduction (Öquist et al., 2024). Because these soil processes could alter the forest C balance, thereby offsetting the enhanced tree C sink, they could potentially convert the ecosystem into a net C source. Thus, evaluating the feedback of N fertilization on forest climate mitigation potential requires consideration of impacts on both tree growth and OM decomposition. Moreover, full accounting of GHG emissions should include emissions associated with N fertilizer production (Osorio-Tejada et al., 2022).
The soil C balance in boreal forests, which is a dynamic balance between C input from litterfall and CO2 emissions from OM decomposition, is influenced by temperature (T), soil water content (SWC), nutrient status, and vegetation composition (DeLuca and Boisvenue, 2012) – all factors sensitive to forest management (Mäkipää et al., 2023; Mayer et al., 2020). For example, N fertilization enhances soil N availability, promoting plant growth and litterfall (C input) while also potentially reducing OM decomposition due to the increased CUE of N-limited microbial decomposers (Manzoni et al., 2017). These effects, alongside T and SWC controls, can be integrated into soil C models (Zhang et al., 2018a). Moreover, changes in microbial community structure (e.g., activity, CUE, and biodiversity; Khurana et al., 2023) induced by fertilization can affect decomposition dynamics and influence soil microbial respiration dependencies on T and SWC. For example, shifts in respiration responses to temperature due to N fertilization may attenuate CO2 emissions under warming scenarios (Chen et al., 2024; Wei et al., 2017). Although the effects of N addition on moisture dependency remain understudied, interactions between T and SWC are critical for forecasting respiration responses (Pallandt et al., 2022; Sierra et al., 2017, 2015).
Empirically derived relationships between soil respiration and T and SWC are widely used in soil C models to adjust decomposition rate constants (Luo et al., 2016), yet differences in SWC responses (Sierra et al., 2015) contribute to projection uncertainties (Falloon et al., 2011). Boreal forest soils with higher nutrient levels and water availability often have underestimated SOC stocks in model projections (Dalsgaard et al., 2016; Ťupek et al., 2016). Moreover, SWC response curves vary with soil properties like porosity, clay content, and OM fraction (Moyano et al., 2013, 2012) and may also be influenced by the soil N status. Given the significant spatial variability in SOC within forest sites (Muukkonen et al., 2009) and the measurement uncertainty over time (Ortiz et al., 2013), assessing changes in the T and SWC dependencies of soil CO2 emissions after long-term N fertilization and applying them over multiple years could clarify the SOC sink/source dynamics.
In southern boreal regions, Scots pine forests on well-drained, often N-poor mineral soils have soil CO2 emissions that range from 1 to 3 , accounting for 70 %–91 % of total ecosystem respiration (Ťupek et al., 2008; Uri et al., 2022) and its global warming potential (GWP). Although CH4 and N2O have a higher GWP than CO2 (27 and 273 times over a 100-year horizon, respectively; IPCC, 2023), the soil generally acts as a small CH4 sink, and N2O emissions are negligible in these N-limited soils (Machacova et al., 2016; Matson et al., 2009; Pihlatie et al., 2007; Siljanen et al., 2020; Ťupek et al., 2015).
In this study, we investigated the effects of long-term N fertilization on soil CO2, CH4, and N2O fluxes and SOC stocks in a boreal Scots pine forest. We hypothesized the following:
- i.
Increased soil nitrogen availability would enhance soil organic carbon (SOC) accumulation and heterotrophic respiration (Rh) due to greater biomass growth and litter inputs, while SOC-normalized Rh () would decline due to reduced microbial nitrogen mining.
- ii.
Nitrogen fertilization would alter CH4 oxidation and increase N2O emissions compared to N-limited soils, reflecting shifts in microbial activity and substrate availability.
2.1 Study site and N fertilization
The Karstula forest study site is in central Finland (62°54′43.343′′ N, 24°34′16.021′′ E) (Fig. 1) and is dominated by Pinus sylvestris (Scots pine) with an understory comprising Vaccinium myrtillus, V. vitis-idaea, Empetrum nigrum, Calluna vulgaris, and various boreal mosses and lichens. Established on a low-fertility sandy podzol, the site corresponds to the Calluna (CT) and Vaccinium vitis-idaea (VT) types in the Finnish classification system (Cajander, 1949). Nitrogen (N) fertilization has been applied here since 1960, with 180 kg N ha−1 of potassium nitrate applied every decade until 2020.
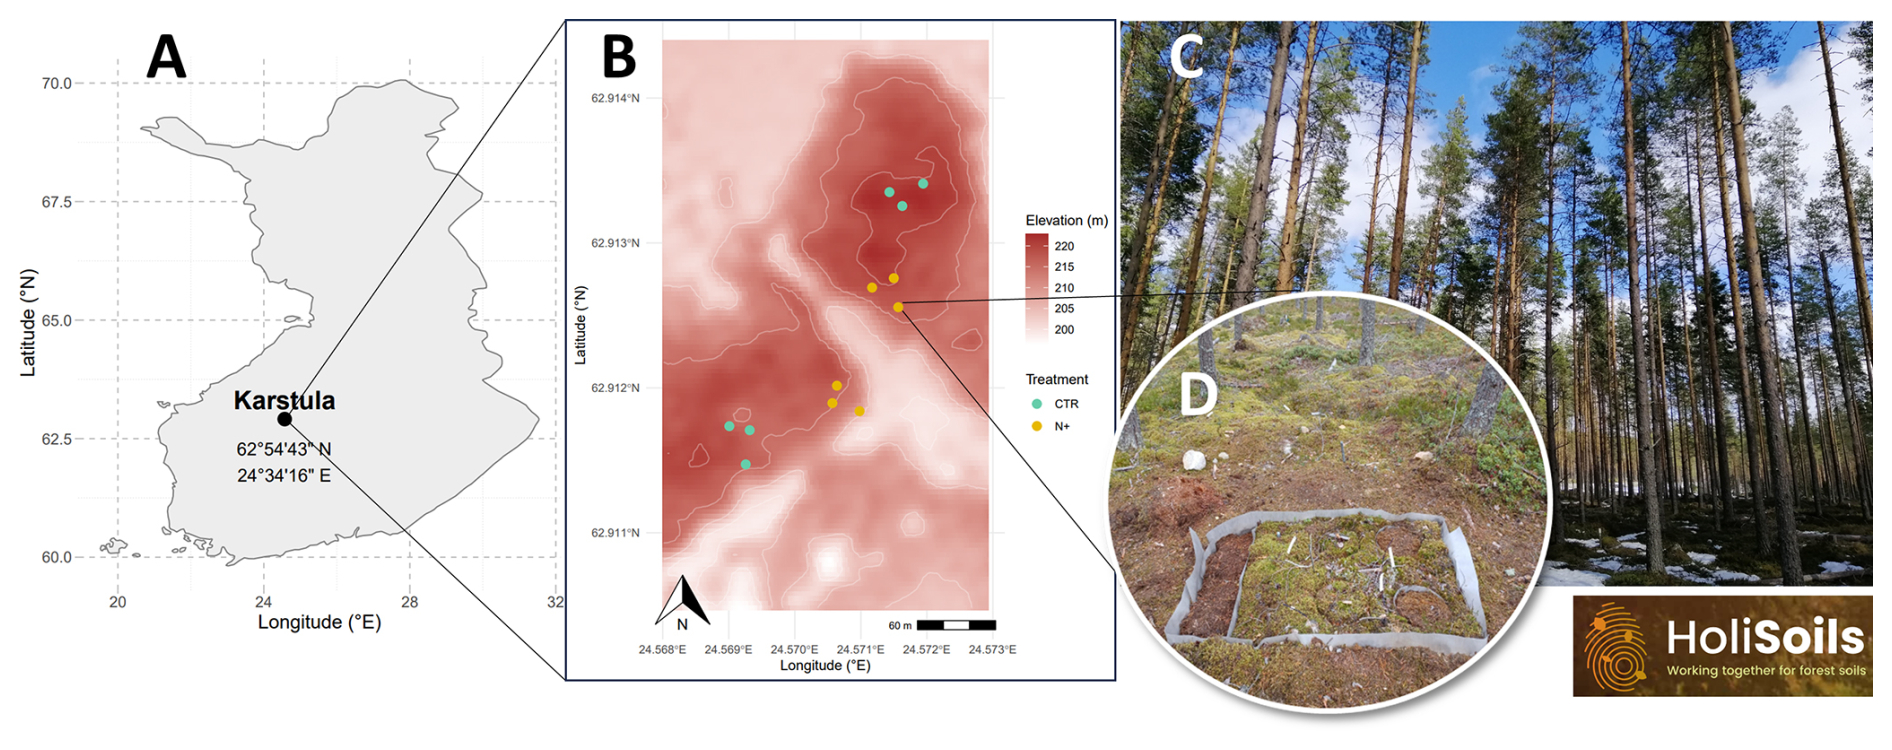
Figure 1Geographical location of the Karstula forest study site in Finland (a); topographical variation in the study site and the location of treatment (control – CTR; N-fertilized – N+) plots (b); photograph of the forest stand (c); and one of six 2 m×1 m forest floor plot groups, each with four subplots used for measuring soil greenhouse gases, soil organic C, and soil temperature and moisture following the installation of a root-exclusion fabric (d).
The stand underwent thinning in 1990 and 2015. To maintain comparable management across fertilization treatments, both CTR and N-fertilized (N+) plots were thinned in 1990 with similar intensity (∼20 %) and again in 2015 (with nearly identical intensity), reducing basal area by 36.7 % (CTR) and 40.1 % (N+), following the Finnish silvicultural guidelines (Tapio, https://www.tapio.fi, last access: 7 October 2025).
2.2 Field measurements
2.2.1 Tree inventory and litterfall
Measurements of tree diameter (at 1.3 m height), total height, and crown-base height were conducted at 10-year intervals from 1960 to 2010 and every 5 years thereafter. The breast-height diameter (d1.3) of all trees has been measured using a caliper (±1 mm precision) once per decade since 1960, as well as after the 2015 thinning. Additionally, in a permanent subset of trees representing various size categories, tree height and crown-base height have been recorded using a hypsometer (precision ∼0.5–1 m). Mortality and thinning-related removals were recorded, and tree biomass was calculated using biomass expansion models (Repola, 2009). Litterfall rates were estimated using compartment-specific turnover rates (Lehtonen et al., 2016). From May 2021 to October 2023, litter (needles, twigs, and cones) was collected monthly during the growing season using 0.8 m mesh collectors and subsequently sorted and weighed.
2.2.2 Soil organic carbon (SOC) stock
Soil sampling was performed in June 2023 in control and N-fertilized plots (n=6 each) using a 58 mm diameter corer. Samples were stratified by layer, separating humus from mineral soil, which was sampled in 10 cm increments to a depth of 30 cm. Samples from each layer were composited across two subsites with differing rock content. Samples were dried, weighed, and sieved, and C and N contents were analyzed using dry combustion (LECO TruMac CN, LECO Corporation, St. Joseph, MI, USA). Stoniness was assessed in the field using rod penetration (Eriksson and Holmgren, 1996) and corrected for rock fragment content following Poeplau et al. (2017).
2.2.3 Soil greenhouse gas (GHG) fluxes, temperature, and moisture
Soil GHG fluxes (CO2, CH4, and N2O) were measured biweekly during the growing seasons of 2021–2023 (spanning from 20 May to 16 August in 2021, from 5 May to 3 November in 2022, and from 10 May to 10 October in 2023). In May 2021, three 1 m×2 m trenched areas were established per treatment. Each trench was lined with water-permeable geotextile to prevent root ingrowth, thereby isolating heterotrophic respiration (Rh) from autotrophic sources (Ťupek et al., 2019). Measurements were taken from 12 plots (6 per treatment; Fig. 1b). Two plot pairs (2 cm2×706 cm2) were used to account for local heterogeneity in soil and microtopography within each trenched area (1 m2), while three trenched areas per treatment were used to capture spatial heterogeneity at the site level (Fig. 1d). Plots in each pair were located 30 cm apart (Fig. 1c), and CTR and N+ pairs were on average 122 m apart (Fig. 1b).
Gas fluxes were measured using a nontransparent 21.7 L dynamic chamber (30 cm in diameter and height) equipped with a fan and connected to a LI-COR LI-7810 CH4CO2H2O or LI-7820 N2OH2O trace gas analyzer (LI-COR, Lincoln, NE, USA). Gas concentrations were recorded every second for 3 min, and linearity was monitored visually during the measurements to accept only fluxes with increasing trends in CO2 concentration evolution. Fluxes were calculated from the stable portion of the data (Zhao, 2019). Rh values () were normalized to SOC content and expressed as a C fraction of SOC per hour (). The CH4 and N2O concentrations were also measured during 3 min intervals with 5 s averaging at a 0.25 ppb precision for CH4 and a 0.20 ppb precision for N2O. The minimum detectable flux of measurements estimated using the formula by Parkin et al. (2012) was 0.0238 for CH4 and 0.0524 for N2O.
Soil temperature (T) and volumetric soil moisture (SWC) at 5 cm depth were continuously monitored with Soil Scout Oy sensors, which have been recording data at 15 min intervals since June 2021. T and SWC were matched with flux data using the timestamp.
2.3 Data analysis
All data analyses and visualizations were conducted using R software (R Core Team, 2024). The full dataset and the R code for producing the analysis and results described below are available on Zenodo (Ťupek et al., 2024; Ťupek, 2024). A one-way ANOVA was employed to test the effect of N fertilization on greenhouse gas (GHG) fluxes. As the data were collected at a relatively low temporal frequency (biweekly), the degree of temporal autocorrelation was substantially lower than in high-frequency (e.g., hourly) automated measurements. Therefore, no additional correction for autocorrelation was applied. The independence assumption of the ANOVA was considered reasonably met under these conditions.
Two regression approaches were used to characterize the dependency of on T and SWC: (i) local polynomial regression (LOESS), to assess the functional form of dependencies on combined T and SWC () separately for the N-fertilized (N+) and control (CTR) plots, and (ii) nonlinear least-squares (NLS) regression, guided by LOESS to identify suitable mathematical forms. The LOESS and NLS models for dependency on SWC alone were compared using ratios normalized by .
In approach (ii), the combined T and SWC dependency of was modeled by multiplying a Gaussian T function as described in Tuomi et al. (2008) with a Ricker function for SWC (Bolker, 2008):
where β1 and β2 are parameters controlling the exponential T response, parameter a determines the initial slope and rescales the whole function, exponent b describes the post-optimal decline, and exponent c modulates the sharpness of the peak of the SWC response.
Model performance was assessed using the proportion of explained variance (R2), root-mean-square error (RMSE), mean bias error (MBE), and mean absolute error (MAE) derived from model residuals. Model robustness was further evaluated with 10-fold cross-validation (Kuhn, 2008).
Once the parameters of the T and SWC response were determined, the NLS regression was used to extrapolate to continuous hourly data and to upscale to the annual level. Annual CH4 and N2O fluxes were estimated by scaling the treatment-specific mean hourly flux values without considering T and SWC effects. The global warming potential (GWP) was calculated using the AR6 GWP-100 values (27 for CH4 and 273 for N2O) (IPCC, 2023). As flux data were unavailable for the November–March period, the CH4 and N2O annual estimates are limited to the extrapolation of the conditions in April–October, during which fluxes are generally higher.
The emissions associated with fertilizer production were accounted for according to Osorio-Tejada et al. (2022). We estimated the CO2 emissions associated with six nitrogen fertilization events, which occurred once per decade between 1960 and 2020. The applied nitrogen fertilization rate was 180 kg N ha−1 per event. Converting this to ammonia (NH3) using the molecular weight ratio of NH3 to N () resulted in an estimated 218.86 kg NH3 ha−1 per fertilization event. Given an emission factor of 2.96 kg CO2 per kg NH3, this corresponds to 647.93 kg CO2 ha−1 per event. Over six fertilization events spanning 60 years, the annualized CO2 emission was calculated as 64.79 , equivalent to approximately 6.5 .
3.1 N fertilization enhanced tree biomass, litterfall, and SOC
N fertilization led to increased tree stand biomass and litterfall in N+ compared to CTR plots. Despite reductions following thinning events, tree biomass was highest in 2014 for both treatments (9 kg C m−2 in N+ and 7 kg C m−2 in CTR), decreasing to 6 and 5 kg C m−2, respectively, by 2020 due to thinning in 2015 (Fig. 2a). This thinning led to peak litter input in 2015 (1.5 kg C m−2 in N+ and 1 kg C m−2 in CTR), which then stabilized around 0.6 and 0.5 kg C m−2 due to the presence of fewer trees (Fig. 2a). The litter fraction accounted for 16 % of N+ and 14 % of CTR biomass in 2015, falling to 10 % for both by 2020. Monthly litterfall, including needles, branches, and cones, was significantly higher in N+ (25.1 g m−2 per month) than in CTR (14.3 g m−2 per month) plots from 2021 to 2023 (Fig. 2b). SOC tended to be higher under N fertilization, from 4.9 kg C m−2 in CTR to 5.6 kg C m−2 in N+, but the difference was not statistically significant (Fig. 2c).
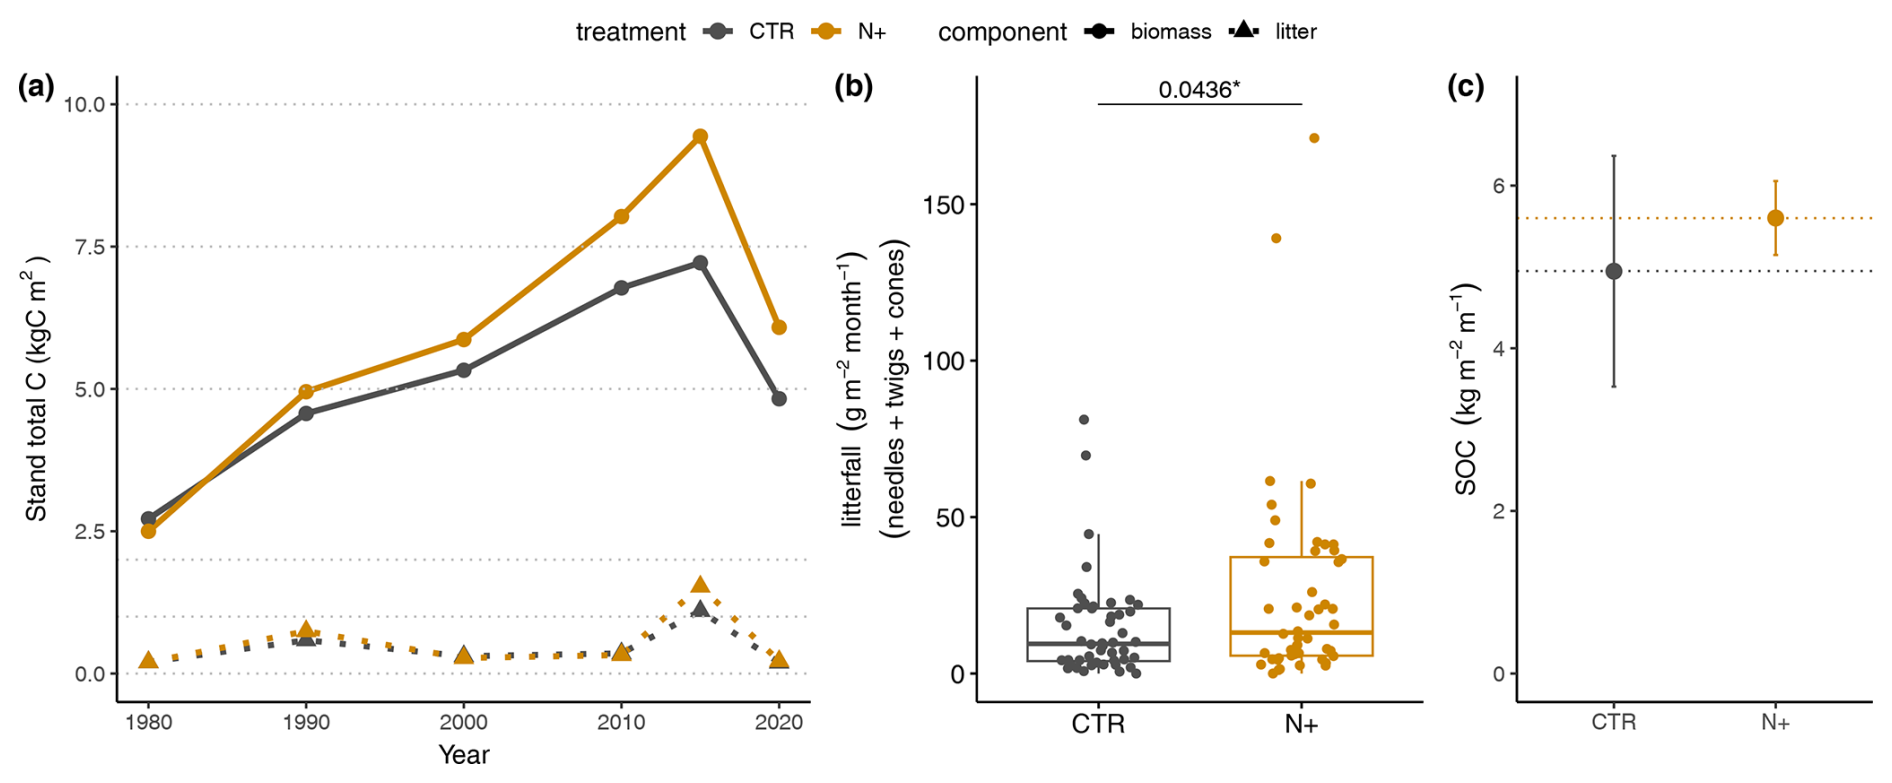
Figure 2Biomass, litterfall, and SOC in control (CTR) and N-fertilized (N+) stands. (a) Estimated tree biomass and litterfall from 1980–2020 forest tree stand inventory measurements. (b) Monthly litterfall from July 2021 to October 2023 (box plot shows median, quartiles, and outliers). (c) SOC stock over 1 m depth in 2023 (error bars indicate minimum and maximum values across replicates).
3.2 N fertilization effects on mean CO2, CH4, and N2O fluxes but not on SOC-normalized CO2
Pairwise ANOVA showed that mean annual soil microbial respiration Rh () was significantly higher in N+ (0.58±0.01 SE, standard error) than in CTR (0.46±0.01 SE) plots (F value of 15.96, degrees of freedom of 449, and p value of ; Fig. 3a). However, Rh normalized by SOC () did not differ significantly between N+ (28.3±1.1 SE) and CTR (28.6±1.1 SE) plots (Fig. 3b).
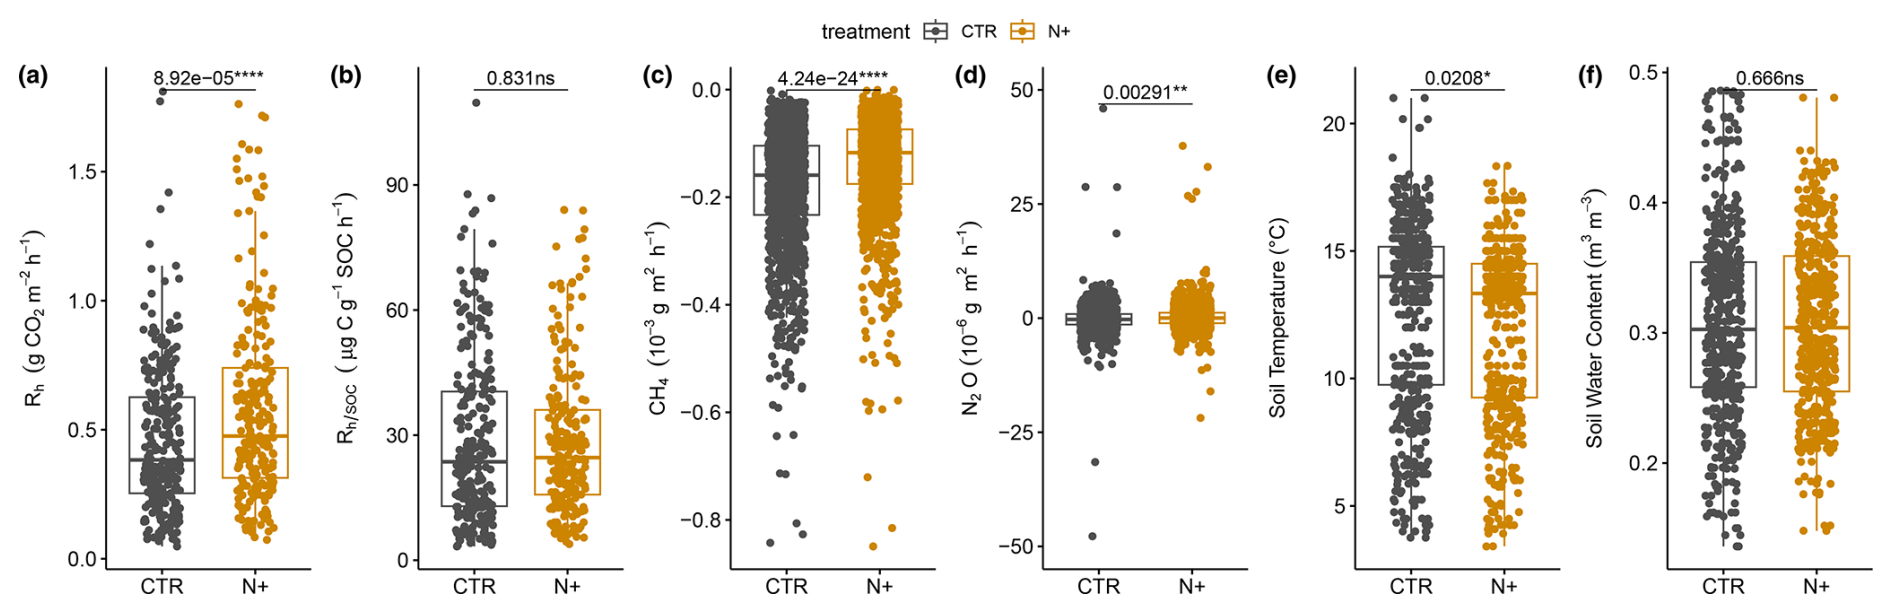
Figure 3Soil (a) heterotrophic respiration (Rh, ), (b) Rh normalized by SOC (; ), (c) net CH4 flux (), (d) net N2O flux (), (e) soil temperature (T, °C), and (f) soil volumetric water content (SWC, m3 m−3) for N+ and CTR plots in the 2021, 2022, and 2023 field campaigns.
CH4 oxidation was slower in N+ ( SE ) than in CTR ( SE ) plots (Fig. 3c), with annual CH4 oxidation rates of in CTR and in N+ plots. Mean net N2O exchange was significantly lower than zero in CTR plots ( SE ), whereas it was positive in N+ plots (0.22±0.06 SE ), resulting in a mean annual difference of 4.17 between treatments (Fig. 3d). The method detection limits were smaller than the SE of mean CH4 and N2O fluxes.
Average T at 5 cm depth was higher in CTR (12.6±0.17 SE °C) than in N+ (12.0±0.16 SE °C) (Fig. 3e), while SWC at 5 cm depth (0.31 m3 m−3) did not differ significantly between treatments (Fig. 3f). Mean annual T was 5.92±0.18 SE °C in CTR plots and 5.83±0.17 SE °C in N+ plots, with an annual SWC of 0.31±0.002 SE m3 m−3 for both (Fig. S1 in the Supplement). Soil T increased rapidly after snowmelt in April, with cooler summer conditions in 2022 than in 2021 and 2023. SWC ranged from 0.07 to 0.42 m3 m−3, dropping below 0.2 m3 m−3 during drought conditions in summer 2021 (Figs. S1 and S2 in the Supplement). Rh showed sensitivity to T and SWC, rising with warmer conditions and declining in dry periods, before recovering after rewetting events (Fig. S2). However, this pattern was more pronounced in CTR than in N+ plots. Part of the variation in soil moisture between CTR and N+ plots (located on average 122 m apart) could be attributed to the measured topsoil humus layer being affected by microscale variations in vertical and lateral water flows due to microtopography (Fig. 1b).
3.3 N fertilization altered dependencies on T and SWC
LOESS and NLS regression models showed similar dependencies on T and SWC (Fig. 4a and b). In CTR and N+, NLS models indicated a T optimum at 15.8 and 16.8 °C, respectively, above which decomposition was limited by dry soil conditions. Thus, in CTR at T values below the optimum rose more steeply compared to N+ plots (Fig. 4a).
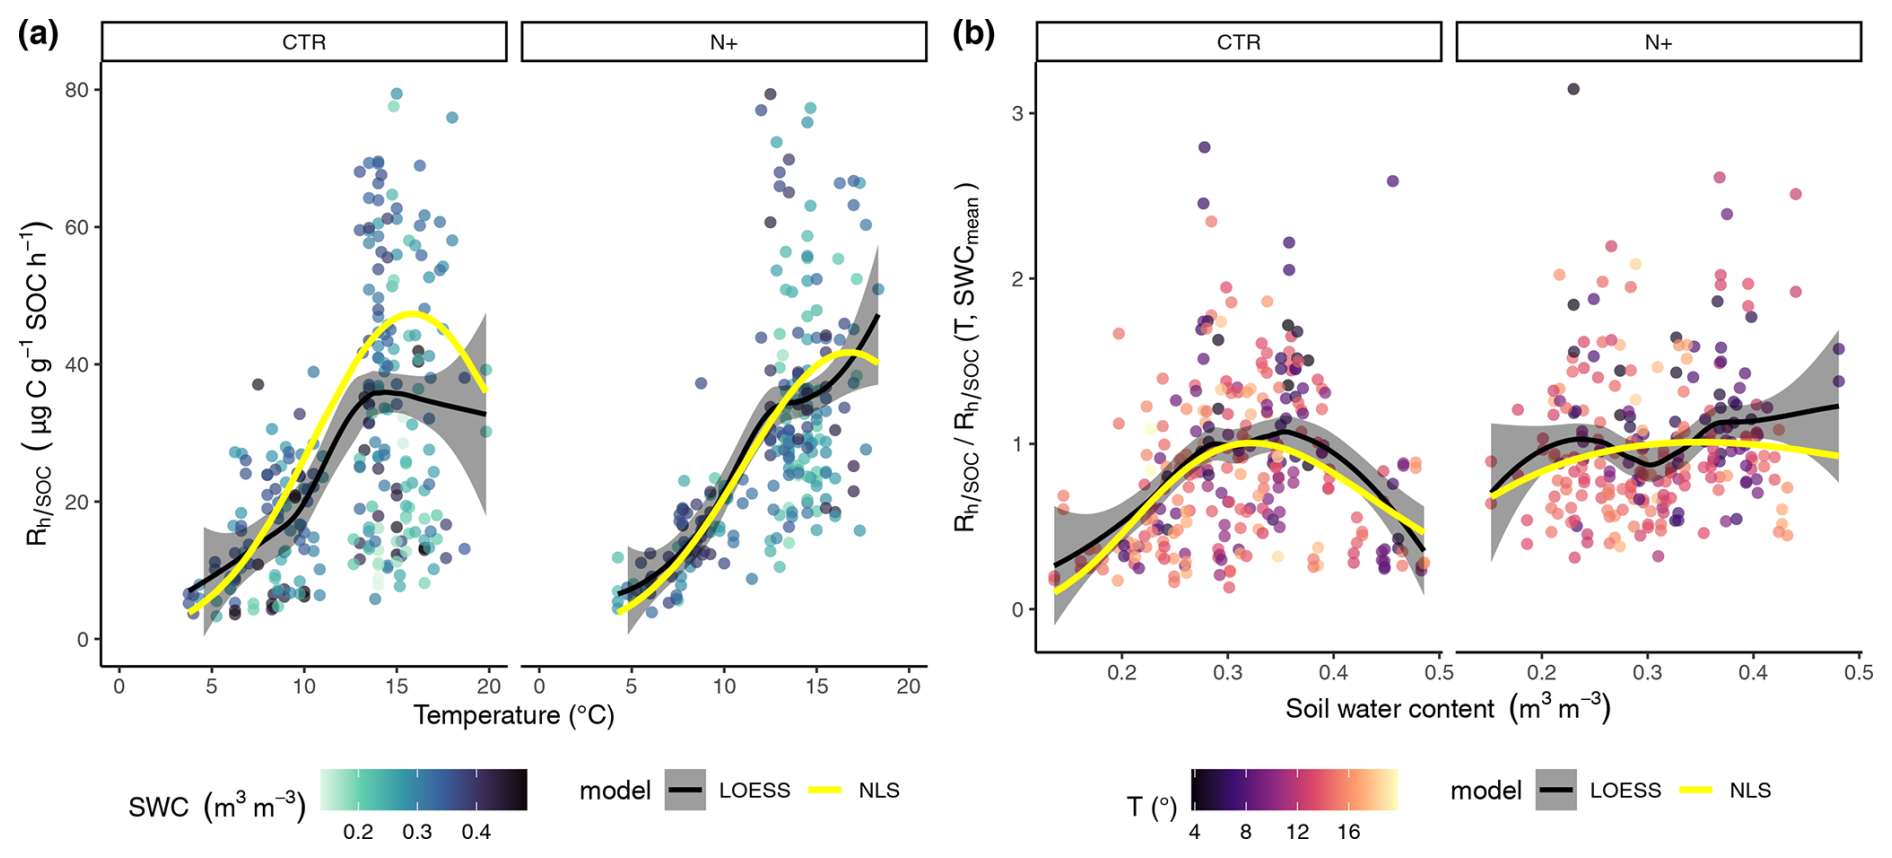
Figure 4(a) Dependence of soil microbial respiration normalized by soil organic carbon (, ) on soil temperature at 5 cm depth (T, °C). (b) Ratio of measured to modeled (T, SWCmean) as a function of volumetric water content (SWC, m3 m−3) at 5 cm depth. Panels display results separately for control (CTR) and N-fertilized (N+) plots. The shading of turquoise points in panel (a) reflects varying SWC, while the shading of red points in panel (b) corresponds to variation in T. Black lines indicate local polynomial regression (LOESS) fits, with gray ribbons showing the 95 % confidence intervals; yellow lines represent nonlinear least-squares (NLS) regression model fits. The NLS lines in panel (a) are modeled as (T, SWCmean), whereas and in panel (b), they are modeled as .
The revealed an SWC optimum in CTR, while the –SWC dependency was less pronounced in N+ plots (Fig. 4b). The was maximized at in CTR and at in N+, and it declined more steeply in CTR plots under both drier and wetter conditions compared with N+ plots.
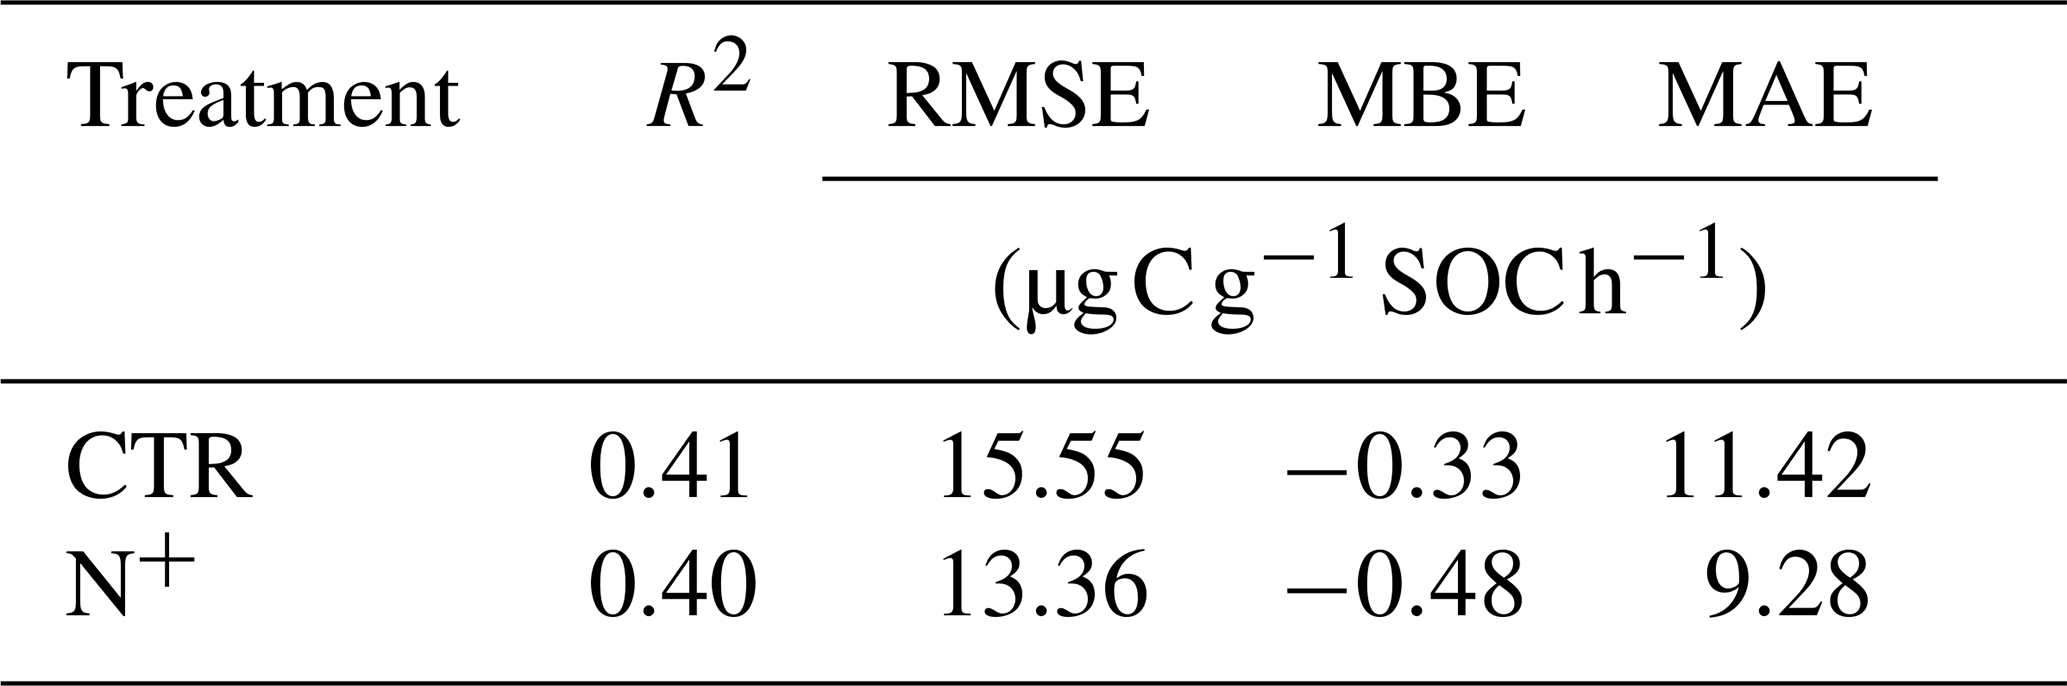
Parameters and fit statistics for the NLS regression model are provided in Tables 1 and 2. In CTR, the Ricker power parameter c significantly differed from 1, indicating suppressed respiration under nonoptimal SWC conditions. The model parameters describing functional dependencies on soil moisture were statistically different from 0 for CTR but not for N+ (Table 1). While not statistically different from 0 in N+ plots, a c value near 1 suggests a relatively flat response of to SWC. In contrast, a high c value (≈8, p<0.001) in CTR plots indicates a peaked moisture response, supporting a stronger effect of moisture limitation on decomposition under ambient conditions (Table 1). Neither the CTR nor N+ models showed bias (Table 2 and Table S1 in the Supplement). NLS model fit metrics showed that the R2, RMSE, MBE, and MAE values were comparable between CTR and N+ models (Table 2). RMSE and MAE for NLS models fell within the range of standard deviations from 10-fold cross-validation (Table S1). The model accuracy was generally higher in N+ than in CTR plots (Table 2).
Table 1Parameter estimates with the standard error (SE) and p values for combined temperature and SWC models (Eq. 1: , and c).
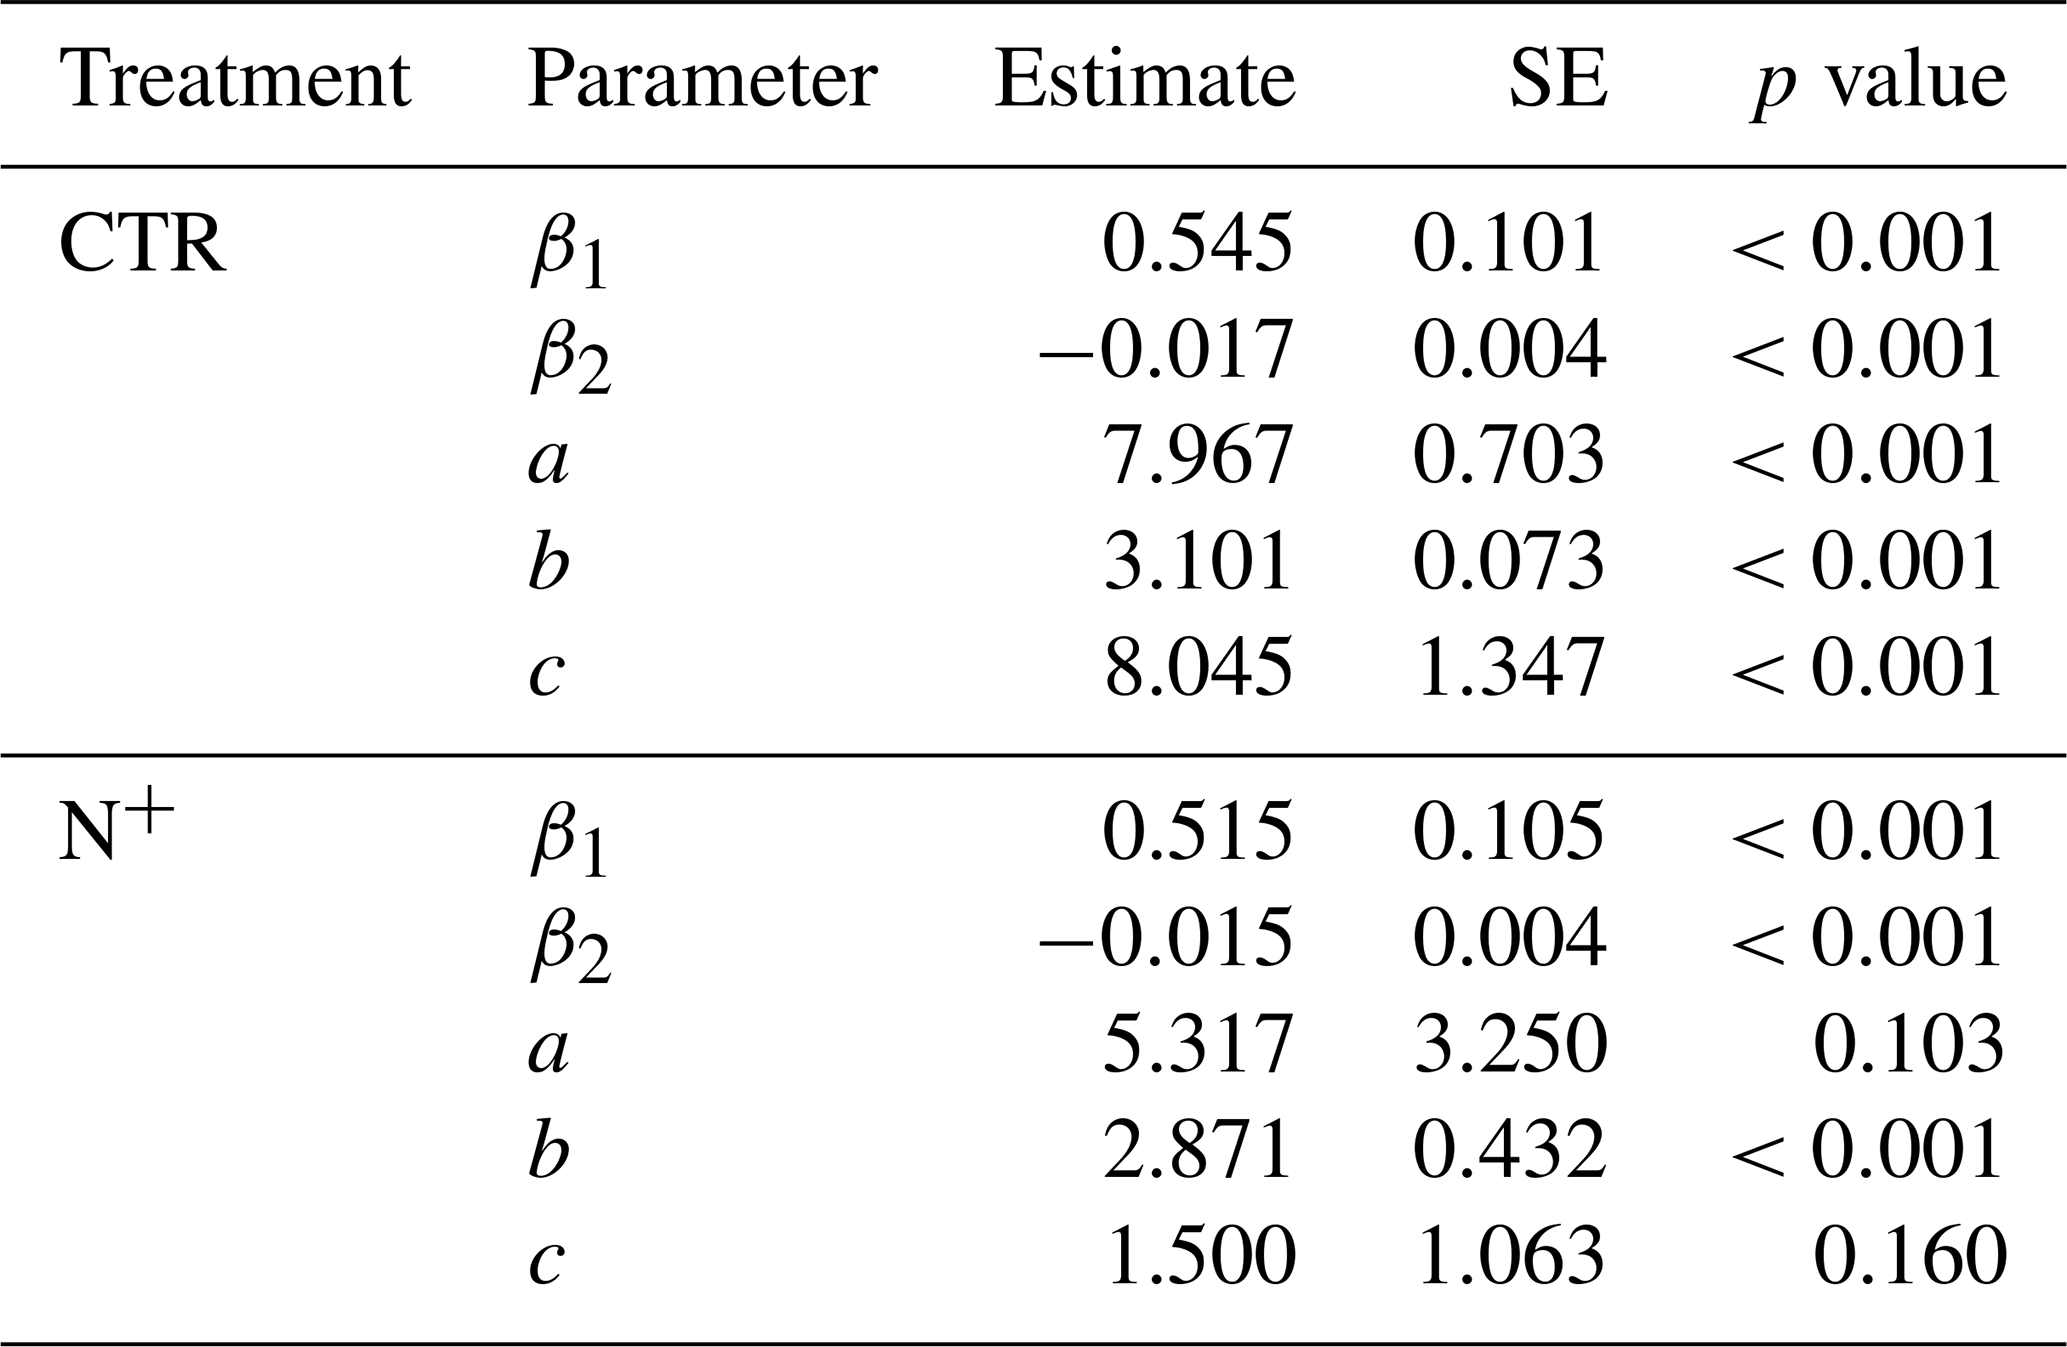
Table 2Goodness-of-fit statistics for NLS models based on combined temperature and moisture (Eq. 1): proportion of explained variance (R2), root-mean-square error (RMSE), mean bias error (MBE), and mean absolute error (MAE) (all in ).
3.4 Seasonal and annual differences in between CTR and N+ plots
During the winter, daily model predictions of remained consistent across CTR and N+ treatments, with little variation due to low soil temperatures (Fig. 5a). However, in the summer, with temperatures above 5 °C, modeled with the function (T, SWC) displayed marked differences between CTR plots and N+ plots. In CTR plots, the modeled values were generally higher than in the N+ plots, except during a brief drought period in 2021, when modeled values were lower.
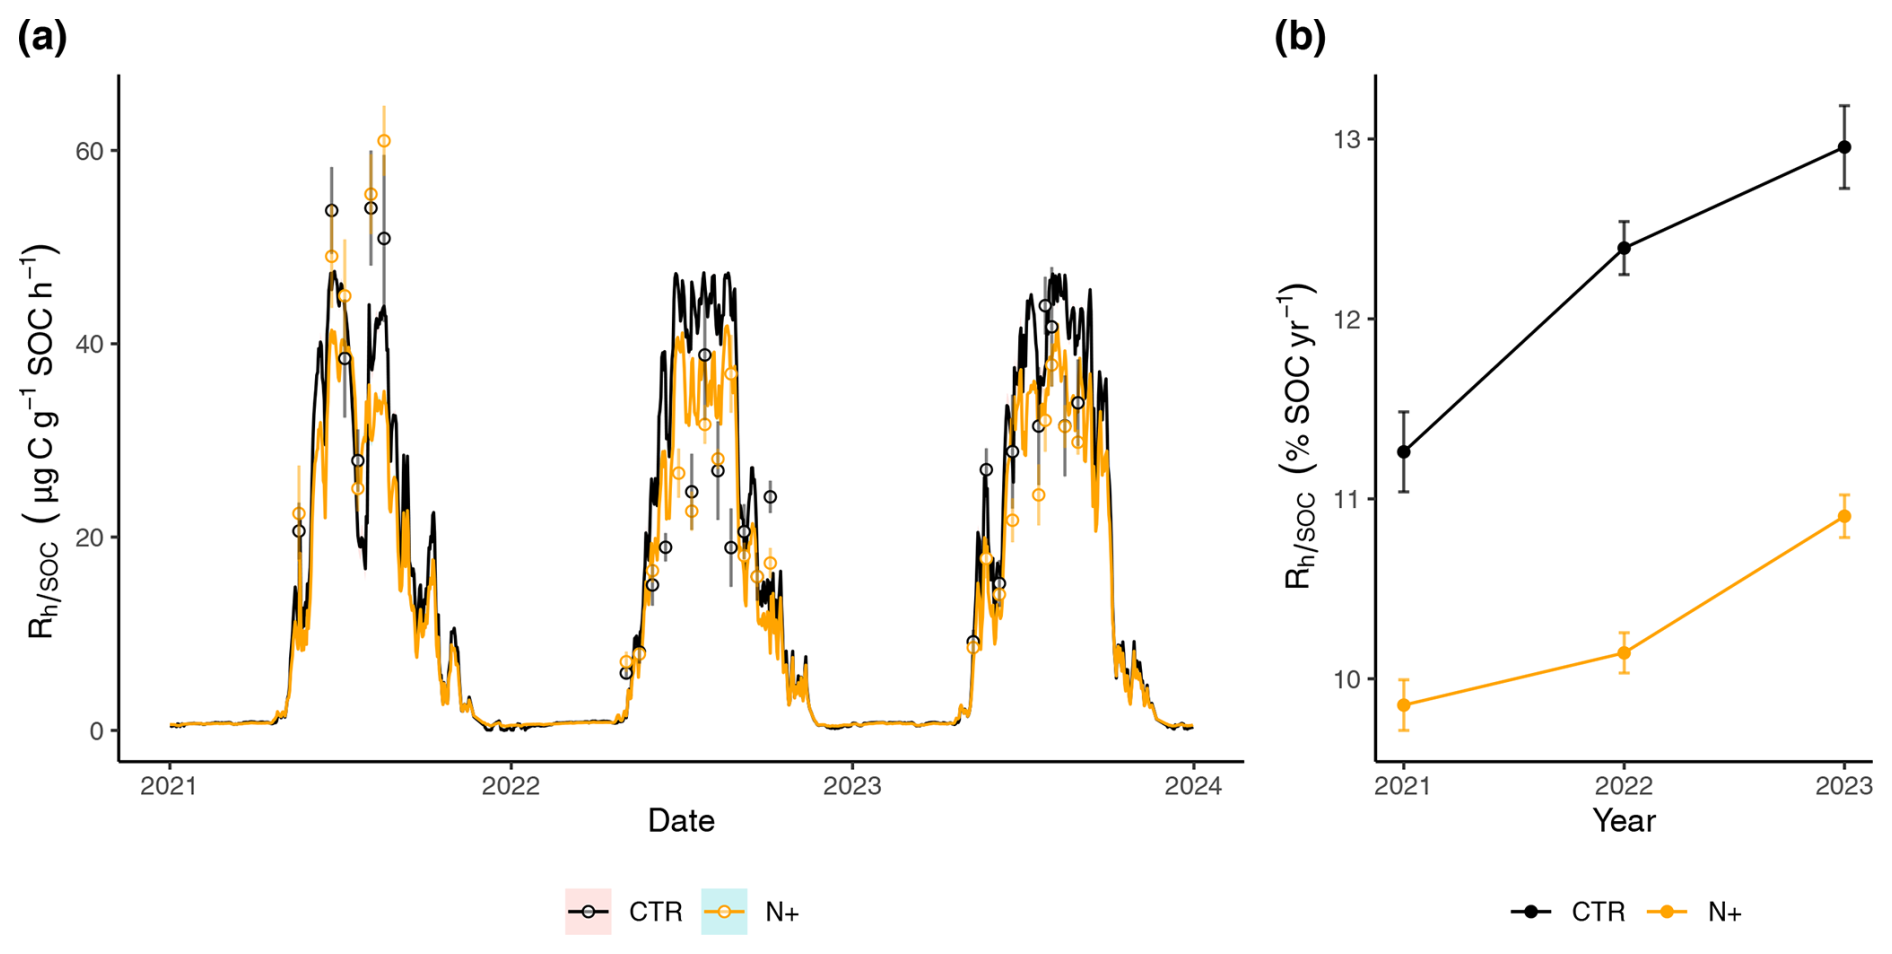
Figure 5(a) Time series of daily mean () in CTR and N+ plots, with measurements shown as points (error bars indicate SE) and model estimates as lines (ribbons indicate SE). (b) Annual (% SOC per year) in CTR and N+ plots.
3.5 Annual GWP reduction in relation to N addition
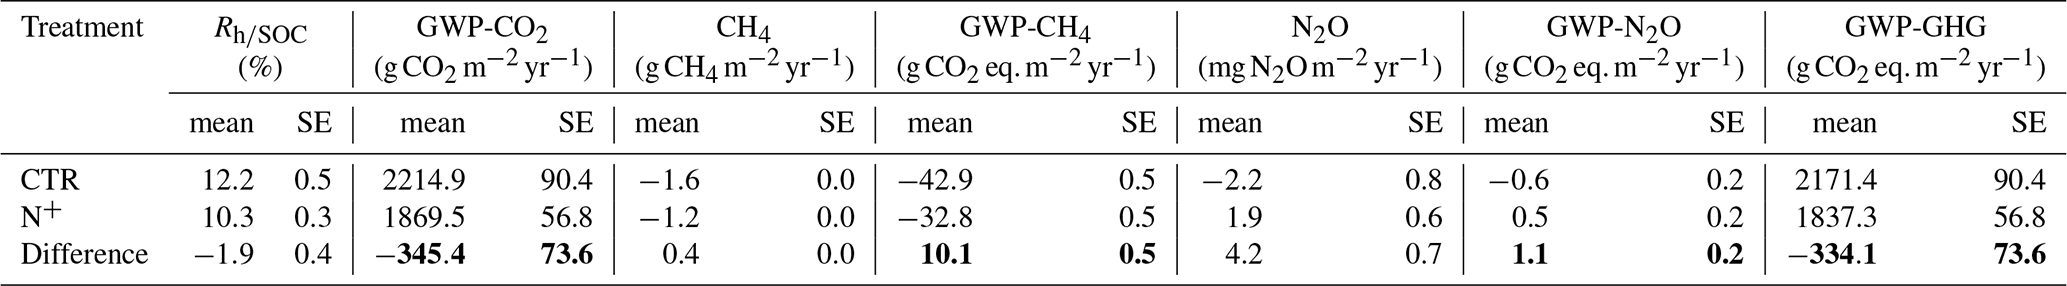
As a result of the generally lower and less variable daily in N+ plots, the annual (expressed as the percentage of SOC respired per year) in N+ was also consistently lower than in CTR (Fig. 5b). Annual rates ranged from 9.85 (±0.14 SE) to 12.95 (±0.23 SE) % and increased during the 2021–2023 period (Fig. 5b). On average, (T, SWC) values were 1.90 (±0.41 SE) % higher in control (CTR) plots compared to N-fertilized (N+) plots. This result suggests that, despite increased litter inputs in N+ plots due to enhanced tree growth, the relative decomposition rate per unit SOC remained unchanged or declined in fertilized plots, potentially favoring greater SOC retention. The difference in modeled Rh (calculated as (T, SWC) × SOC) between CTR and N+ plots corresponds to a reduction of −345.4 (±73.6 SE) in heterotrophic CO2 emissions (Table 3). This potential reduction in CO2 emissions outweighed the GWP associated with increased N2O emissions (), reduced CH4 uptake (), and fertilizer production emissions (6.5 ). Overall, the net GWP balance suggests an annual reduction of −327.6 (±73.6 SE) attributable to N fertilization.
Table 3Annual global warming potential (GWP) reduction by long-term N fertilization in a boreal Scots pine forest with the contribution of individual greenhouse gas (GHG) fluxes (microbial respiration normalized by soil organic carbon stock , CH4 net oxidation, and N2O flux net exchange) evaluated as the difference between control (CTR) and N-fertilized (N+) plots. Minus values indicate net GWP reduction. The AR6 GWP-100 values of 27 for CH4 and 273 for N2O were used for the calculation of CO2 equivalents (IPCC, 2023). SE values were calculated considering variations across replicates and years together. Total GWP differences are marked in bold.
Our results show that nitrogen (N) fertilization significantly increased tree stand biomass and litterfall in N+ plots compared to CTR plots (Fig. 2a), aligning with previous studies demonstrating enhanced forest productivity with N addition (Hyvönen et al., 2008). The tree biomass reduction from 2014 to 2020 was due to thinning in 2015 and affected the organic inputs to soil. Thinning corresponded to a litter input peak, with N+ plots showing higher litterfall than CTR. This difference was confirmed by the aboveground litterfall measurements during 2021–2023 (25.1 g m−2 per month in N+ vs. 14.3 g m−2 per month in CTR) (Fig. 2b). Consistently with biomass and litterfall, soil organic carbon (SOC) increased under N fertilization, reaching 5.6 kg C m−2 in N+ compared to 4.9 kg C m−2 in CTR by 2023 (Fig. 2c), indicating enhanced SOC retention due to reduced microbial respiration (Janssens et al., 2010) alongside aboveground carbon storage in the fertilized stands.
Differences in carbon stocks between treatments prevented one from drawing conclusions on soil organic matter decomposition rates solely based on the observed increase in heterotrophic respiration (Rh) under N fertilization (Fig. 3) and required the normalization of respiration by SOC (). When considering normalized respiration, we found a reduction in the annual ratio, rather than an absolute decrease in Rh, with fertilization (Fig. 5b). Normalizing respiration by SOC provides a meaningful way to interpret respiration rates relative to carbon availability, especially when comparing treatments with differing SOC stocks. Although this normalization does not fully resolve the issue of Rh dependence on the amount of SOC, it has been widely adopted in field and incubation studies as well as in soil carbon models (e.g., Tuomi et al., 2008; Davidson et al., 2012; Curiel Yuste et al., 2007; García-Angulo et al., 2020). Nonetheless, should be interpreted with caution, as it does not capture underlying microbial mechanisms such as enzyme kinetics or community structure, which introduce nonlinearities in the decomposition kinetics. While normalizing Rh by SOC as a proxy for the decomposition rate constant assumes a linear relation between decomposition rate and SOC, in the absence of microbial process data, it serves as a useful, although imperfect, indicator of decomposition rates.
Although, the daily measured mean values were not statistically different between CTR and N+, the responded to N fertilization with reduced sensitivity to soil moisture (Fig. 4), suggesting a potential mechanism (e.g., substrate shifts) for enhanced carbon retention in fertilized plots. However, the slightly increased sensitivity of microbial respiration to temperature at higher values in N-fertilized plots (Fig. 4a) may indicate a risk of accelerated carbon loss under warming conditions in the fertilized soils compared to controls. This dual response to long-term N fertilization, as discussed in detail in following, highlights the need to consider both moisture and temperature responses in models predicting boreal forest soil carbon dynamics in the context of long-term atmospheric N deposition, fertilization, and climate change.
4.1 Response of soil heterotrophic respiration to N fertilization
The meta-analysis of Rh responses to N fertilization in temperate and boreal forests reported a 15 % average decrease in heterotrophic CO2 emissions (Janssens et al., 2010). However, the wide range of responses of heterotrophic CO2 emissions following N fertilization, spanning from a 57 % decrease to a 63 % increase, encompasses the 26 % increase in mean soil heterotrophic respiration (Rh) from 2021 to 2023 observed here (Fig. 3a). Limiting Rh by N fertilization in low-productivity forests (Janssens et al., 2010) may relate to low litter quality, as observed in our study's Calluna- and Vaccinium vitis idaea-type Scots pine forest.
However, a higher litter amount due to higher biomass production and thinning in fertilized (N+) than in control (CTR) plots (Fig. 2a and b) may support increased Rh in N+. Although thinning effects on boreal Scots pine Rh are generally modest (Aun et al., 2021), larger inputs of higher-quality litter from harvest residues in N+ plots, including fine roots, needles, and branches, likely stimulated Rh (Liski et al., 2006; Zhang et al., 2018). This enhanced carbon availability, along with increased soil nitrogen concentrations and stimulated microbial activity and biopolymer degradation capabilities, explains the observed increase in Rh under N fertilization (Fig. 3). Additionally, we observed a decline in phosphorus concentrations in N-fertilized plots compared to unfertilized plots, probably due to microorganisms mining for phosphorus to sustain their increased activity (Richy et al., 2024).
Despite the significant increase in daily measured Rh, the daily measured SOC-normalized heterotrophic respiration () did not differ significantly between CTR and N+ plots; however, at the annual scale, differed. This suggests that increased Rh with N addition originated more from higher litter input and SOC rather than an enhanced microbial decomposition rates (Fig. 3b). The Rh responses to N in Sweden's Rosinedalsheden Scots pine forest also showed variability, with differing results based on plot size and SOC pool similarity (Hasselquist et al., 2012; Marshall et al., 2021). Using hourly (Curiel Yuste et al., 2007; Shahbaz et al., 2022) may better capture decomposition rate differences than Rh alone; however, hourly-scale responses to N fertilization may still be obscured by fine-scale spatial and temporal variations in soil temperature and moisture (Figs. 3 and S2), primary drivers of (Curiel Yuste et al., 2007; Shahbaz et al., 2022). For example, our biweekly measurements of showed similar means for CTR and N+ plots, but annual means differed (Fig. 5), reflecting differences in temperature and moisture distribution and differences in functional dependencies to temperature and moisture between treatments (Figs. 4, S1, and S2 ).
4.2 Shifts in Rh dependency on soil environmental conditions with N addition
Earth system models often relate Rh to T and SWC, but they commonly ignore how the soil N status could modulate such T and SWC responses (Falloon et al., 2011; Sierra et al., 2015). Here, we observed that N fertilization modified the dependency on both T and SWC, with a sharper increase in with temperature in N+ plots relative to CTR plots. Unlike CTR plots, where declined at temperatures above 15 °C, N+ plots maintained elevated values under high temperatures (Fig. 4a), which is in line with Chen et al. (2024) and may indicate a higher risk of increased CO2 emissions from accumulated SOC in warming climates. This increased at high temperature in response to N addition could be attributed to shifts in substrate composition, where N fertilization enhances the decomposition of labile, C-rich litter (high N availability increases C demand by microbes) and suppresses the decomposition of N-rich organic matter with high lignin content (due to decreased N demand) (Berg and Matzner, 1997; Bonner et al., 2019; Janssens et al., 2010; Wu et al., 2023). Furthermore, our study site exhibited increased Mn peroxidase activity following long-term N addition, indicating enhanced microbial degradation of polyphenolic compounds (Richy et al., 2024). Thus, shifts in litter quality, specifically C and N ratios, likely contribute to divergent Rh responses to temperature (Robinson et al., 2020).
Moisture also plays a pivotal role in Rh sensitivity to temperature (Robinson et al., 2020) and in modifying soil respiration rates, especially under N fertilization and drought conditions (Nair et al., 2024). In our N-fertilized plots, was largely independent of soil moisture, in contrast to the expected humped response of to SWC in CTR plots (Fig. 4b). This variation in SWC response suggests potential microbial adaptation to moisture availability (Lennon et al., 2012) and changes in soil physical properties influencing O2 and solute diffusivity (Huang et al., 2023; Moyano et al., 2013). However, the lack of significance of the moisture shape parameter c in the N-fertilized treatment (Table 1) reflected both variability in the data and the absence of a distinct moisture optimum. The contrast between the flat response to moisture in N+ and the clear peaked moisture response in CTR not only highlights potential treatment-related shifts in environmental sensitivity but also underscores the need to interpret model-based extrapolations with caution. The observed differences between CTR and N+ plots could imply that N status or fertilization-induced changes in soil properties influence the sensitivity of organic matter decomposition to moisture. Soil moisture influences microbial carbon use efficiency (CUE) by affecting substrate accessibility and physiological stress (Manzoni et al., 2012a), with a lower CUE observed in dry soils (Butcher et al., 2020; Ullah et al., 2021). However, in our study, differences in CUE could not be directly inferred from our data, as microbial process measurements were not conducted. Additionally, accelerated decomposition following soil rewetting, commonly referred to as the “Birch effect”, has been linked to increased short-term N availability (Jarvis et al., 2007). However, prolonged N addition may impose a phosphorus limitation on decomposition (Richy et al., 2024).
Simulating based on both temperature and moisture inputs showed that models relying solely on temperature underestimate for initially N-limited boreal forest soils (Fig. 5). Thus, current soil C models could integrate both temperature and moisture dependencies in their environmental modifiers of decomposition rates, as well as considering variations in the SWC response under differing N statuses to improve SOC accuracy in fertile soils (Ťupek et al., 2016). For example, the CENTURY model (Parton et al., 1987), which considers the topsoil N content and its effect on the fine-litter C ratio, predicts a slight increase in simulated SOC stocks (Ťupek et al., 2016), whereas other models like the Yasso model (Tuomi et al., 2011) do not account for soil N. However, by restricting topsoil N effects solely to CUE or decomposition rates (Zhang et al., 2018), current models lack the ability to capture the influence of N-driven variations in temperature and moisture modifiers. This limitation highlights the need to re-evaluate the scaling of decomposition with N to better account for the differential respiration sensitivities observed in this study (Fig. 4). Incorporating nonlinear nitrogen effects on temperature and soil moisture modifiers depends on the model's structure. In soil carbon-only models like Yasso, updating these modifiers with a larger dataset that includes nitrogen deposition gradients and soil organic carbon stocks could improve performance. Conversely, in soil carbon–nitrogen models that already account for SOC–N interactions, existing functional relationships should be re-evaluated, considering their interactions with environmental modifiers.
4.3 Implications for climate change mitigation
Annually, N-fertilized plots respired 10.3 % of SOC (±0.3 SE), compared to 12.2 % (±0.5 SE) in CTR plots. Although the difference was derived from the modeled values, the lower respiration rate in fertilized plots suggests a potential increase in microbial CUE, which may contribute to long-term SOC accumulation. Despite the winter fluxes not being directly measured, modeled values under low soil temperatures (<5 °C) were close to zero for both treatments due to the strong temperature limitation observed in measured data. As a result, differences in winter contributed minimally to annual estimates and are unlikely to have significantly biased treatment comparisons. This 1.90 (±0.41 SE) % reduction in annual SOC loss due to N addition corresponds to an average of 345.4 (±73.6 SE) . The combined effect of reduced methane (CH4) oxidation and a slight shift in nitrous oxide (N2O) from a sink to an emitter, comparable to Maljanen et al. (2006) and equivalent to 8.7 , did not negate this positive mitigation potential and agreed with Öquist et al. (2024). The Haber–Bosch process required for N2-to-NH3 conversion has an associated emission cost of approximately 2.96 kg CO2-eq per kg NH3 (Osorio-Tejada et al., 2022), which would reduce our calculated mitigation potential by about 6.5 . Consequently, the average mitigation potential for N fertilization in our forest soil study is estimated at SE (equivalent to 0.89±0.2 SE ). The estimated net GHG mitigation of based on model outputs from a 3-year period provides a first-order approximation. However, this estimate does not fully capture the climate impact of fertilization, as it does not account for longer-term dynamics or potential off-site C and N losses, such as leaching, indirect emissions, or biodiversity-related feedback. Therefore, broader system-level assessments over longer timescales are needed to confirm these findings. While these findings apply to a nutrient-poor boreal ecosystem, extrapolation to similar stands with similar climate – or, particularly, to other ecosystems – should be done with caution. For example, Saarsalmi et al. (2014) showed that N fertilization stimulated mean annual production (more in nutrient-poor pine stands and less in spruce stands with a higher nutrient status). Schulte-Uebbing et al. (2022) demonstrated that N addition enhanced biomass carbon sequestration primarily in boreal regions, while having negative effects in tropical forests.
Although our experimental design allowed exploratory insights into N fertilization effects, caution is needed in extrapolating beyond this site. While results represent a case study, they reveal that an increased soil N status after long-term N fertilization in boreal Scots pine ecosystems can alter the dependency of C decomposition on temperature and moisture. The results also suggest a net reduction in soil GHG emissions with long-term N fertilization, indicating that N fertilization in our boreal Scots pine forest not only enhanced tree biomass but may also have acted as a viable forest management strategy for climate change mitigation.
The complete dataset on GHG fluxes, soil temperature and moisture, tree biomass and litter production, and soil carbon stocks is archived and available on Zenodo (https://doi.org/10.5281/zenodo.13952779, Ťupek et al., 2024). The R scripts supporting replication of the study results is also openly available on Zenodo (https://doi.org/10.5281/zenodo.14101489, Ťupek, 2024).
The supplement related to this article is available online at https://doi.org/10.5194/bg-22-5497-2025-supplement.
BŤ, AL, and RM designed the hypothesis and experimental design. RM and AL arranged research funding and oversaw project management. BŤ contributed to data collection and carried out the analysis. BŤ prepared the manuscript with contributions from all co-authors.
At least one of the (co-)authors is a member of the editorial board of Biogeosciences. The peer-review process was guided by an independent editor, and the authors also have no other competing interests to declare.
Publisher's note: Copernicus Publications remains neutral with regard to jurisdictional claims made in the text, published maps, institutional affiliations, or any other geographical representation in this paper. While Copernicus Publications makes every effort to include appropriate place names, the final responsibility lies with the authors.
The study was conducted within the framework of the HoliSoils (Holistic management practices, modelling and monitoring for European forest soils) project, funded by the European Union's Horizon 2020 Research and Innovation program. This study was carried out with affiliation to the UNITE Flagship, funded by the Research Council of Finland. We thank our field team, led by Petri Salovaara, for collecting high-quality measurements. We also thank Mikko Kukkola and Hannu Ilvesniemi for the tree biomass monitoring data. We used BioRender to design the “Graphical abstract”. We appreciate the constructive comments from Marleen Pallandt and the referees.
This research has been supported by the EU Horizon 2020 (grant no. 101000289) and the Research Council of Finland (grant no. 357909).
This paper was edited by Kees Jan van Groenigen and reviewed by three anonymous referees.
Aun, K., Kukumägi, M., Varik, M., Becker, H., Aosaar, J., Uri, M., Morozov, G., Buht, M., and Uri, V.: Short-term effect of thinning on the carbon budget of young and middle-aged Scots pine (Pinus sylvestris L.) stands, Forest Ecol. Manag., 492, 119241, https://doi.org/10.1016/j.foreco.2021.119241, 2021.
Berg, B. and Matzner, E.: Effect of N deposition on decomposition of plant litter and soil organic matter in forest systems, Environ. Rev., 5, 1–25, https://doi.org/10.1139/a96-017, 1997.
Bolker, B. M.: Ecological Models and Data in R, Princeton University Press, https://doi.org/10.1515/9781400840908, 2008.
Bonner, M. T. L., Castro, D., Schneider, A. N., Sundström, G., Hurry, V., Street, N. R., and Näsholm, T.: Why does nitrogen addition to forest soils inhibit decomposition?, Soil Biol. Biochem., 137, 107570, https://doi.org/10.1016/j.soilbio.2019.107570, 2019.
Butcher, K. R., Nasto, M. K., Norton, J. M., and Stark, J. M.: Physical mechanisms for soil moisture effects on microbial carbon-use efficiency in a sandy loam soil in the western United States, Soil Biol. Biochem., 150, 107969, https://doi.org/10.1016/j.soilbio.2020.107969, 2020.
Cajander, A. K.: Forest types and their significance, Acta Forestalia Fennica, 56, 7395, https://doi.org/10.14214/aff.7395, 1949.
Chen, C., Pei, J., Li, B., Fang, C., Nie, M., and Li, J.: Nutrient Addition Enhances the Temperature Sensitivity of Soil Carbon Decomposition Across Forest Ecosystems, Glob. Change Biol. 30, e17543, https://doi.org/10.1111/gcb.17543, 2024.
Curiel Yuste, J., Baldocchi, D. D., Gershenson, A., Goldstein, A., Misson, L., and Wong, S.: Microbial soil respiration and its dependency on carbon inputs, soil temperature and moisture, Glob. Change Biol., 13, 2018–2035, https://doi.org/10.1111/j.1365-2486.2007.01415.x, 2007.
Craine, J. M., Morrow, C., and Fierer, N.: Microbial nitrogen limitation increases decomposition, Ecology, 88, 2105–2113, https://doi.org/10.1890/06-1847.1, 2007.
Dalsgaard, L., Lange, H., Strand, L. T., Callesen, I., Borgen, S. K., Liski, J., and Astrup, R.: Underestimation of boreal forest soil carbon stocks related to soil classification and drainage, Can. J. Forest Res., 46, 1413–1425, https://doi.org/10.1139/cjfr-2015-0466, 2016.
Davidson, E. A., Samanta, S., Caramori, S. S., and Savage, K.: The Dual Arrhenius and Michaelis–Menten kinetics model for decomposition of soil organic matter at hourly to seasonal time scales, Global Change Biology, 18, 371–384, https://doi.org/10.1111/j.1365-2486.2011.02546.x, 2012.
DeLuca, T. H. and Boisvenue, C.: Boreal forest soil carbon: distribution, function and modelling, Forestry, 85, 161–184, https://doi.org/10.1093/forestry/cps003, 2012.
Eriksson, C. P. and Holmgren, P.: Estimating stone and boulder content in forest soils – evaluating the potential of surface penetration methods, CATENA, 28, 121–134, https://doi.org/10.1016/S0341-8162(96)00031-8, 1996.
Falloon, P., Jones, C. D., Ades, M., and Paul, K.: Direct soil moisture controls of future global soil carbon changes: An important source of uncertainty, Global Biogeochem. Cy., 25, GB3010, https://doi.org/10.1029/2010GB003938, 2011.
García-Angulo, D., Hereş, A.-M., Fernández-López, M., Flores, O., Sanz, M. J., Rey, A., Valladares, F., and Curiel Yuste, J.: Holm Oak Decline and Mortality Exacerbates Drought Effects on Soil Biogeochemical Cycling and Soil Microbial Communities across a Climatic Gradient, Soil Biol. Biochem., 149, https://doi.org/10.1016/j.soilbio.2020.107921, 2020.
Hasselquist, N. J., Metcalfe, D. B., and Högberg, P.: Contrasting effects of low and high nitrogen additions on soil CO2 flux components and ectomycorrhizal fungal sporocarp production in a boreal forest, Glob. Change Biol., 18, 3596–3605, https://doi.org/10.1111/j.1365-2486.2012.02788.x, 2012.
Högberg, P., Näsholm, T., Franklin, O., and Högberg, M. N.: Tamm Review: On the nature of the nitrogen limitation to plant growth in Fennoscandian boreal forests, Forest Ecol. Manag., 403, 161–185, https://doi.org/10.1016/j.foreco.2017.04.045, 2017.
Huang, Z., Liu, Y., Huang, P., Li, Z., and Zhang, X.: A new concept for modelling the moisture dependence of heterotrophic soil respiration, Soil Biol. Biochem., 185, 109147, https://doi.org/10.1016/j.soilbio.2023.109147, 2023.
Hyvönen, R., Persson, T., Andersson, S., Olsson, B., Ågren, G. I., and Linder, S.: Impact of long-term nitrogen addition on carbon stocks in trees and soils in Northern Europe, Biogeochemistry, 89, 121–137, https://doi.org/10.1007/s10533-007-9121-3, 2008.
Intergovernmental Panel On Climate Change (IPCC): Climate Change 2021 – The Physical Science Basis: Working Group I Contribution to the Sixth Assessment Report of the Intergovernmental Panel on Climate Change, 1st edn., Cambridge University Press, https://doi.org/10.1017/9781009157896, 2023.
Janssens, I. A., Dieleman, W., Luyssaert, S., Subke, J.-A., Reichstein, M., Ceulemans, R., Ciais, P., Dolman, A. J., Grace, J., Matteucci, G., Papale, D., Piao, S. L., Schulze, E.-D., Tang, J., and Law, B. E.: Reduction of forest soil respiration in response to nitrogen deposition, Nat. Geosci., 3, 315–322, https://doi.org/10.1038/ngeo844, 2010.
Jarvis, P. and Linder, S.: Constraints to growth of boreal forests, Nature, 405, 904–905, https://doi.org/10.1038/35016154, 2000.
Jarvis, P., Rey, A., Petsikos, C., Wingate, L., Rayment, M., Pereira, J., Banza, J., David, J., Miglietta, F., Borghetti, M., Manca, G., and Valentini, R.: Drying and wetting of Mediterranean soils stimulates decomposition and carbon dioxide emission: The “Birch effect”, Tree Physiol., 27, 929–940, https://doi.org/10.1093/treephys/27.7.929, 2007.
Khurana, S., Abramoff, R., Bruni, E., Dondini, M., Ťupek, B., Guenet, B., Lehtonen, A., and Manzoni, S.: Interactive effects of microbial functional diversity and carbon availability on decomposition – A theoretical exploration, Ecol. Model., 486, 110507, https://doi.org/10.1016/j.ecolmodel.2023.110507, 2023.
Kuhn, M.: Building predictive models in R using the caret package, J. Stat. Softw., 28, 1–26, https://doi.org/10.18637/jss.v028.i05, 2008.
Lehtonen, A., Linkosalo, T., Peltoniemi, M., Sievänen, R., Mäkipää, R., Tamminen, P., Salemaa, M., Nieminen, T., Ťupek, B., Heikkinen, J., and Komarov, A.: Forest soil carbon stock estimates in a nationwide inventory: evaluating performance of the ROMULv and Yasso07 models in Finland, Geosci. Model Dev., 9, 4169–4183, https://doi.org/10.5194/gmd-9-4169-2016, 2016.
Lennon, J. T., Aanderud, Z. T., Lehmkuhl, B. K., and Schoolmaster Jr., D. R.: Mapping the niche space of soil microorganisms using taxonomy and traits, Ecology, 93, 1867–1879, https://doi.org/10.1890/11-1745.1, 2012.
Liski, J., Lehtonen, A., Palosuo, T., Peltoniemi, M., Eggers, T., Muukkonen, P., and Mäkipää, R.: Carbon accumulation in Finland's forests 1922–2004 – An estimate obtained by combination of forest inventory data with modelling of biomass, litter, and soil, Ann. For. Sci., 63, 687–697, https://doi.org/10.1051/forest:2006049, 2006.
Luo, Y., Ahlström, A., Allison, S. D., Batjes, N. H., Brovkin, V., Carvalhais, N., Chappell, A., Ciais, P., Davidson, E. A., Finzi, A., Georgiou, K., Guenet, B., Hararuk, O., Harden, J. W., He, Y., Hopkins, F., Jiang, L., Koven, C., Jackson, R. B., Jones, C. D., Lara, M. J., Liang, J., McGuire, A. D., Parton, W., Peng, C., Randerson, J. T., Salazar, A., Sierra, C. A., Smith, M. J., Tian, H., Todd-Brown, K. E. O., Torn, M., Groenigen, K. J. van, Wang, Y. P., West, T. O., Wei, Y., Wieder, W. R., Xia, J., Xu, X., and Zhou, T.: Toward more realistic projections of soil carbon dynamics by Earth system models, Global Biogeochem. Cy., 30, 40–56, https://doi.org/10.1002/2015GB005239, 2016.
Lupi, C., Morin, H., Deslauriers, A., Rossi, S., and Houle, D.: Role of soil nitrogen for the conifers of the boreal forest: A critical review, Int. J. Plant Soil Sci., 155–189, https://doi.org/10.9734/IJPSS/2013/4233, 2013.
Machacova, K., Bäck, J., Vanhatalo, A., Halmeenmäki, E., Kolari, P., Mammarella, I., Pumpanen, J., Acosta, M., Urban, O., and Pihlatie, M.: Pinus sylvestris as a missing source of nitrous oxide and methane in boreal forest, Sci. Rep., 6, 23410, https://doi.org/10.1038/srep23410, 2016.
Mäkipää, R., Abramoff, R., Adamczyk, B., Baldy, V., Biryol, C., Bosela, M., Casals, P., Yuste, J. C., Dondini, M., Filipek, S., Garcia-Pausas, J., Gros, R., G”om”oryov'a, E., Hashimoto, S., Hassegawa, M., Immonen, P., Laiho, R., Li, H., Li, Q., Luyssaert, S., Menival, C., Mori, T., Naudts, K., Santonja, M., Smolander, A., Toriyama, J., Ťupek, B., Ubeda, X., Verkerk, P. J., and Lehtonen, A.: How does management affect soil C sequestration and greenhouse gas fluxes in boreal and temperate forests? – A review, Forest Ecol. Manag., 529, 120637, https://doi.org/10.1016/j.foreco.2022.120637, 2023.
Manzoni, S., Schimel, J. P., and Porporato, A.: Responses of soil microbial communities to water stress: Results from a meta-analysis, Ecology, 93, 930–938, https://doi.org/10.1890/11-0026.1, 2012a.
Manzoni, S., Taylor, P., Richter, A., Porporato, A., and Ågren, G. I.: Environmental and stoichiometric controls on microbial carbon-use efficiency in soils, New Phytol., 196, 79–91, https://doi.org/10.1111/j.1469-8137.2012.04225.x, 2012b.
Manzoni, S., Čapek, P., Mooshammer, M., Lindahl, B. D., Richter, A., and Šantrůčková, H.: Optimal metabolic regulation along resource stoichiometry gradients, Ecol. Lett., 20, 1182–1191, https://doi.org/10.1111/ele.12815, 2017.
Maljanen, M., Jokinen, H., Saari, A., Strömmer, R., and Martikainen, P. J.: Methane and nitrous oxide fluxes, and carbon dioxide production in boreal forest soil fertilized with wood ash and nitrogen, Soil Use Manage., 22, 151–157, https://doi.org/10.1111/j.1475-2743.2006.00029.x, 2006.
Marshall, J. D., Peichl, M., Tarvainen, L., Lim, H., Lundmark, T., Näsholm, T., Öquist, M., and Linder, S.: A carbon-budget approach shows that reduced decomposition causes the nitrogen-induced increase in soil carbon in a boreal forest, Forest Ecol. Manag., 502, 119750, https://doi.org/10.1016/j.foreco.2021.119750, 2021.
Matson, A., Pennock, D., and Bedard-Haughn, A.: Methane and nitrous oxide emissions from mature forest stands in the boreal forest, Saskatchewan, Canada, Forest Ecol. Manag., 258, 1073–1083, https://doi.org/10.1016/j.foreco.2009.05.034, 2009.
Mayer, M., Prescott, C. E., Abaker, W. E. A., Augusto, L., Cécillon, L., Ferreira, G. W. D., James, J., Jandl, R., Katzensteiner, K., Laclau, J.-P., Laganière, J., Nouvellon, Y., Paré, D., Stanturf, J. A., Vanguelova, E. I., and Vesterdal, L.: Tamm Review: Influence of forest management activities on soil organic carbon stocks: A knowledge synthesis, Forest Ecol. Manag., 466, 118127, https://doi.org/10.1016/j.foreco.2020.118127, 2020.
Moyano, F. E., Manzoni, S., and Chenu, C.: Responses of soil heterotrophic respiration to moisture availability: An exploration of processes and models, Soil Biol. Biochem., 59, 72–85, https://doi.org/10.1016/j.soilbio.2013.01.002, 2013.
Moyano, F. E., Vasilyeva, N., Bouckaert, L., Cook, F., Craine, J., Curiel Yuste, J., Don, A., Epron, D., Formanek, P., Franzluebbers, A., Ilstedt, U., Kätterer, T., Orchard, V., Reichstein, M., Rey, A., Ruamps, L., Subke, J.-A., Thomsen, I. K., and Chenu, C.: The moisture response of soil heterotrophic respiration: interaction with soil properties, Biogeosciences, 9, 1173–1182, https://doi.org/10.5194/bg-9-1173-2012, 2012.
Muukkonen, P., Häkkinen, M., and Mäkipää, R.: Spatial variation in soil carbon in the organic layer of managed boreal forest soil – implications for sampling design, Environ. Monit. Assess., 158, 67–76, https://doi.org/10.1007/s10661-008-0565-2, 2009.
Nair, R., Luo, Y., El-Madany, T., Rolo, V., Pacheco-Labrador, J., Caldararu, S., Morris, K. A., Schrumpf, M., Carrara, A., Moreno, G., Reichstein, M., and Migliavacca, M.: Nitrogen availability and summer drought, but not N : P imbalance, drive carbon use efficiency of a Mediterranean tree-grass ecosystem, Glob. Change Biol., 30, e17486, https://doi.org/10.1111/gcb.17486, 2024.
Näsholm, T., Ekblad, A., Nordin, A., Giesler, R., Högberg, M., and Högberg, P.: Boreal forest plants take up organic nitrogen, Nature, 392, 914–916, https://doi.org/10.1038/31921, 1998.
Öquist, M. G., He, H., Bortolazzi, A., Nilsson, M. B., Rodeghiero, M., Tognetti, R., Ventura, M., and Egnell, G.: Nitrogen fertilization increases N2O emission but does not offset the reduced radiative forcing caused by the increased carbon uptake in boreal forests, Forest Ecol. Manag., 556, 121739, https://doi.org/10.1016/j.foreco.2024.121739, 2024.
Ortiz, C. A., Liski, J., Gärdenäs, A. I., Lehtonen, A., Lundblad, M., Stendahl, J., Ågren, G. I., and Karltun, E.: Soil organic carbon stock changes in Swedish forest soils – A comparison of uncertainties and their sources through a national inventory and two simulation models, Ecol. Model., 251, 221–231, https://doi.org/10.1016/j.ecolmodel.2012.12.017, 2013.
Osorio-Tejada, J., Tran, N. N., and Hessel, V.: Techno-environmental assessment of small-scale Haber-Bosch and plasma-assisted ammonia supply chains, Sci. Total Environ., 826, 154162, https://doi.org/10.1016/j.scitotenv.2022.154162, 2022.
Pallandt, M., Ahrens, B., Koirala, S., Lange, H., Reichstein, M., Schrumpf, M., and Zaehle, S.: Vertically Divergent Responses of SOC Decomposition to Soil Moisture in a Changing Climate, J. Geophys. Res.: Biogeosci., 127, e2021JG006684, https://doi.org/10.1029/2021JG006684, 2022.
Parkin, T. B., Venterea, R. T., and Hargreaves, S. K.: Calculating the detection limits of chamber-based soil greenhouse gas flux measurements, J. Environ. Qual. 41, 705–715, https://doi.org/10.2134/jeq2011.0394, 2012.
Pihlatie, M., Pumpanen, J., Rinne, J., Ilvesniemi, H., Simojoki, A., Hari, P., and Vesala, T.: Gas concentration driven fluxes of nitrous oxide and carbon dioxide in boreal forest soil, Tellus B, 59, 458–469, https://doi.org/10.1111/j.1600-0889.2007.00278.x, 2007.
Parton, W. J., Schimel, D. S., Cole, C. V., and Ojima, D. S.: Analysis of factors controlling soil organic matter levels in Great Plains grasslands, Soil Sci. Soc. Am. J., 51, 1173–1179, https://doi.org/10.2136/sssaj1987.03615995005100050015x, 1987.
Poeplau, C., Vos, C., and Don, A.: Soil organic carbon stocks are systematically overestimated by misuse of the parameters bulk density and rock fragment content, SOIL, 3, 61–66, https://doi.org/10.5194/soil-3-61-2017, 2017.
R Core Team: R: A Language and Environment for Statistical Computing, R Foundation for Statistical Computing, Vienna, Austria, https://www.R-project.org/ (last acces: 7 October 2025), 2024.
Repola, J.: Biomass equations for Scots pine and Norway spruce in Finland, Silva Fenn., 43, https://doi.org/10.14214/sf.184, 2009.
Richy, E., Fort, T., Odriozola, I., Kohout, P., Barbi, F., Martinovic, T., Ťupek, B., Adamczyk, B., Lehtonen, A., Mäkipää, R., and Baldrian, P.: Phosphorus limitation promotes soil carbon storage in a boreal forest exposed to long-term nitrogen fertilization, Glob. Change Biol., 30, e17516, https://doi.org/10.1111/gcb.17516, 2024.
Robinson, J. M., Barker, S. L. L., Arcus, V. L., McNally, S. R., and Schipper, L. A.: Contrasting temperature responses of soil respiration derived from soil organic matter and added plant litter, Biogeochemistry, 150, 45–59, https://doi.org/10.1007/s10533-020-00686-3, 2020.
Saarsalmi, A. and Mälkönen, E.: Forest Fertilization Research in Finland: A Literature Review, Scandinavian J. Forest Res.-Jpn., 16, 514–535, https://doi.org/10.1080/02827580152699358, 2001.
Saarsalmi, A., Tamminen, P., and Kukkola, M.: Effects of long-term fertilisation on soil properties in Scots pine and Norway spruce stands, Silva Fennica, 48, 989, https://doi.org/10.14214/sf.989, 2014.
Schulte-Uebbing, L. F., Ros, G. H., and de Vries, W.: Experimental evidence shows minor contribution of nitrogen deposition to global forest carbon sequestration, Glob. Change Biol. 28, 899–917, https://doi.org/10.1111/gcb.15960, 2022.
Shahbaz, M., Bengtson, P., Mertes, J. R., Kulessa, B., and Kljun, N.: Spatial heterogeneity of soil carbon exchanges and their drivers in a boreal forest, Sci. Total Environ., 831, 154876, https://doi.org/10.1016/j.scitotenv.2022.154876, 2022.
Sierra, C. A., Malghani, S., and Loescher, H. W.: Interactions among temperature, moisture, and oxygen concentrations in controlling decomposition rates in a boreal forest soil, Biogeosciences, 14, 703–710, https://doi.org/10.5194/bg-14-703-2017, 2017.
Sierra, C. A., Trumbore, S. E., Davidson, E. A., Vicca, S., and Janssens, I. A.: Sensitivity of decomposition rates of soil organic matter with respect to simultaneous changes in temperature and moisture, J. Adv. Model. Earth Sy., 7, 335–356, https://doi.org/10.1002/2014MS000358, 2015.
Siljanen, H. M. P., Welti, N., Voigt, C., Heiskanen, J., Biasi, C., and Martikainen, P. J.: Atmospheric impact of nitrous oxide uptake by boreal forest soils can be comparable to that of methane uptake, Plant Soil, 454, 121–138, https://doi.org/10.1007/s11104-020-04638-6, 2020.
Smolander, A., Kurka, A., Kitunen, V., and Mälkönen, E.: Microbial biomass C and N, and respiratory activity in soil of repeatedly limed and N- and P-fertilized Norway spruce stands, Soil Biol. Biochem., 26, 957–962, https://doi.org/10.1016/0038-0717(94)90109-0, 1994.
Sponseller, R. A., Gundale, M. J., Futter, M., Ring, E., Nordin, A., Näsholm, T., and Laudon, H.: Nitrogen dynamics in managed boreal forests: Recent advances and future research directions, Ambio, 45, 175–187, https://doi.org/10.1007/s13280-015-0755-4, 2016.
Tuomi, M., Vanhala, P., Karhu, K., Fritze, H., and Liski, J.: Heterotrophic soil respiration – Comparison of different models describing its temperature dependence, Ecol. Model., 211, 182–190, https://doi.org/10.1016/j.ecolmodel.2007.09.003, 2008.
Tuomi, M., Laiho, R., Repo, A., and Liski, J.: Wood decomposition model for boreal forests, Ecol. Model., 222, 709–718, https://doi.org/10.1016/j.ecolmodel.2010.10.025, 2011.
Ťupek, B., Launiainen, S., Peltoniemi, M., Sievänen, R., Perttunen, J., Kulmala, L., Penttilä, T., Lindroos, A.-J., Hashimoto, S., and Lehtonen, A.: Evaluating CENTURY and Yasso soil carbon models for CO2 emissions and organic carbon stocks of boreal forest soil with Bayesian multi-model inference, European Journal of Soil Science, 70, 847–858, https://doi.org/10.1111/ejss.12805, 2019.
Ťupek, B.: R script: Reduced microbial respiration sensitivity to soil moisture following long-term N fertilization enhances soil carbon retention in a boreal Scots pine forest, (Version 1), Zenodo [code], https://doi.org/10.5281/zenodo.14101489, 2024.
Ťupek, B., Minkkinen, K., Kolari, P., Starr, M., Chan, T., Alm, J., Vesala, T., and Nikinmaa, E.: Forest floor versus ecosystem CO2 exchange along boreal ecotone between upland forest and lowland mire, Tellus B, 60, 153–166, https://doi.org/10.1111/j.1600-0889.2007.00328.x, 2008.
Ťupek, B., Minkkinen, K., Pumpanen, J., Vesala, T., and Nikinmaa, E.: CH4 and N2O dynamics in the boreal forest–mire ecotone, Biogeosciences, 12, 281–297, https://doi.org/10.5194/bg-12-281-2015, 2015.
Ťupek, B., Ortiz, C. A., Hashimoto, S., Stendahl, J., Dahlgren, J., Karltun, E., and Lehtonen, A.: Underestimation of boreal soil carbon stocks by mathematical soil carbon models linked to soil nutrient status, Biogeosciences, 13, 4439–4459, https://doi.org/10.5194/bg-13-4439-2016, 2016.
Ťupek, B., Lehtonen, A., Mäkipää, R., and Salovaara, P.: Soil and understory CO2 respiration, CH4, and N2O fluxes, tree biomass and litter, and soil carbon stock after a long-term N fertilization of a Scots pine forest in Finland, Zenodo [data set], https://doi.org/10.5281/zenodo.13952779, 2024.
Ullah, M. R., Carrillo, Y., and Dijkstra, F. A.: Drought-induced and seasonal variation in carbon use efficiency is associated with fungi:bacteria ratio and enzyme production in a grassland ecosystem, Soil Biol. Biochem., 155, 108159, https://doi.org/10.1016/j.soilbio.2021.108159, 2021.
Uri, V., Kukumägi, M., Aosaar, J., Varik, M., Becker, H., Aun, K., Lõhmus, K., Soosaar, K., Astover, A., Uri, M., Buht, M., Sepaste, A., and Padari, A.: The dynamics of the carbon storage and fluxes in Scots pine (Pinus sylvestris) chronosequence, Sci. Total Environ., 817, 152973, https://doi.org/10.1016/j.scitotenv.2022.152973, 2022.
Wei, H., Chen, X., He, J., Zhang, J., and Shen, W.: Exogenous Nitrogen Addition Reduced the Temperature Sensitivity of Microbial Respiration without Altering the Microbial Community Composition, Front. Microbiol., 8, https://doi.org/10.3389/fmicb.2017.02382, 2017.
Wu, J., Zhang, H., Cheng, X., and Liu, G.: Nitrogen addition stimulates litter decomposition rate: From the perspective of the combined effect of soil environment and litter quality, Soil Biol. Biochem., 179, 108992, https://doi.org/10.1016/j.soilbio.2023.108992, 2023.
Zhang, H., Goll, D. S., Manzoni, S., Ciais, P., Guenet, B., and Huang, Y.: Modeling the effects of litter stoichiometry and soil mineral N availability on soil organic matter formation using CENTURY-CUE (v1.0), Geosci. Model Dev., 11, 4779–4796, https://doi.org/10.5194/gmd-11-4779-2018, 2018a.
Zhang, X., Guan, D., Li, W., Sun, D., Jin, C., Yuan, F., Wang, A., and Wu, J.: The effects of forest thinning on soil carbon stocks and dynamics: A meta-analysis, Forest Ecol. Manag., 429, 36–43, https://doi.org/10.1016/j.foreco.2018.06.027, 2018b.
Zhao, J.: FluxCalR: a R package for calculating CO2 and CH4 fluxes from static chambers, Journal of Open Source Software, 4, 1751, https://doi.org/10.21105/joss.01751, 2019.