the Creative Commons Attribution 4.0 License.
the Creative Commons Attribution 4.0 License.
 | 14 Oct 2025
N transformations in nitrate-rich groundwaters: combined isotope and microbial approach
Mikk Espenberg
Reinhard Well
Michał Bucha
Marta Jakubiak
Ülo Mander
Mariusz-Orion Jędrysek
Dominika Lewicka-Szczebak
This study explores nitrogen transformations in groundwater from an agricultural area utilizing organic fertilizer (wastewater from yeast production) by integrating isotope analysis, microbial gene abundance, and the isotope FRactionation And Mixing Evaluation (FRAME) model to trace and quantify nitrogen cycling pathways. Groundwater samples with elevated nitrate concentrations were subjected to controlled laboratory incubations with application of a novel low-level 15N tracing strategy to investigate microbial processes. Isotope analyses of nitrate, nitrite, and nitrous oxide (N2O), coupled with microbial gene quantification via quantitative polymerase chain reaction (qPCR), revealed a shift from archaeal-driven nitrification to bacterial denitrification in post-incubation suboxic conditions, stimulated by glucose addition. FRAME modelling further identified bacterial denitrification as the dominant pathway of N2O production, which was supported by increased nosZI, nirK, and nirS gene abundance and observed isotope effects.
Simultaneously with the intensive nitrate reduction, it was observed that the majority of nitrite is likely produced through nitrification processes linked to dissolved organic nitrogen (DON) oxidation. Nitrate reduction had a minor contribution to the total nitrite pool. The results demonstrate the efficacy of integrating multi-compound isotope studies and microbial analyses to unravel nitrogen cycling mechanisms. This approach provides a robust framework for addressing nitrogen pollution in groundwater systems and improving water quality management strategies.
- Article
(6153 KB) - Full-text XML
-
Supplement
(797 KB) - BibTeX
- EndNote


Nitrogen (N) is an essential nutrient for plant growth and global food production, forming a key component of nucleic acids and proteins. Although synthetic N fertilizers containing nitrate (NO) and/or ammonium (NH) have greatly influenced agricultural yields, their excessive use has significantly disrupted the N cycle, leading to NO leaching in groundwater, emission of ammonia (NH3), and gaseous forms of nitrogen oxides (nitric oxide (NO), nitrous oxide (N2O), nitrogen dioxide (NO2)), which are of environmental concern (Sainju et al., 2020). These N compounds contribute to eutrophication of surface waters, groundwater quality degradation, and the greenhouse effect, with N2O intensifying global warming and ozone depletion (Butterbach-Bahl et al., 2013). Controlling NO levels in aquatic systems presents substantial environmental challenges, particularly in groundwater, due to the complexity of differentiating between its anthropogenic sources – such as fertilizer runoff, waste from livestock manure, and industrial wastewater discharges – and natural processes, including soil organic matter mineralization, precipitation, and biological nitrogen fixation by microorganisms. Moreover, nitrite (NO), a transient intermediate in the nitrogen cycle, can accumulate under certain environmental conditions and pose significant environmental and health risks, such as methemoglobinemia (blue baby syndrome) in infants and the formation of carcinogenic nitrosamines (Ward et al., 2018). Further, elevated NO levels in water bodies and agricultural soils can be toxic to aquatic life and humans, underscoring the importance of monitoring NO alongside NO in groundwater systems. Hence, a better understanding of N cycling is crucial for developing effective solutions to environmental problems (Rütting et al., 2018).
Diverse microbial communities, including nitrogen-fixing bacteria, archaea, anammox bacteria, nitrifiers, and denitrifiers, drive key N transformations, regulating its availability and mobility in ecosystems. N undergoes complex transformation processes like nitrification, denitrification, anammox, mineralization, and immobilization (Deb et al., 2024), which regulate N availability to plants and influence its movement in agricultural and natural systems. Biological fixation converts atmospheric nitrogen (N2) into bioavailable forms, while nitrification involves the microbial oxidation of NH to NO via NO. Denitrification reduces NO to N2 through the intermediates NO, NO, and N2O. Depending on environmental conditions, this reduction may be incomplete, leading to N2O emissions. Moreover, anammox and feammox processes convert NH and NO to N2 (Ding et al., 2022; Einsiedl et al., 2020). These processes are interconnected and influenced by environmental conditions, making it challenging to differentiate between the sources and pathways of N transformations (Nikolenko et al., 2018).
Stable isotope studies help in tracing N sources and transformations through isotopic signatures such as δ15N and δ18O in NO, NO, NH, and N2O (including 15N site preference in the linear N2O molecule (δ15NSP)) (Denk et al., 2017; Deb et al., 2024). However, limitations arise due to overlapping ranges of different isotope sources or difficulty in the distinction between isotope fractionation processes and mixing. To overcome such limitations and enhance interpretations based on stable isotope studies, a multi-compound analysis approach can be applied (Well et al., 2012; Deb et al., 2024). Such an approach provides a broader perspective on N cycle processes by examining multiple N compounds; e.g. in denitrification, δ15N and δ18O analysis of NO helps identify substrates, while NO and N2O analyses provide insight into intermediate products. However, since the range of natural isotope variations is relatively narrow, even analyses of multiple compounds may provide ambiguous results. The 15N tracing technique allows the precise tracking of artificially added N in the environment (Müller et al., 2004) but is spatially and temporally limited and disrupts natural abundance isotope studies (Buchen-Tschiskale et al., 2023; Well et al., 2019), which are easily and universally applicable in unmodified environmental conditions. A major drawback of traditional 15N tracing methods is the necessary sacrifice of other isotope tracers, such as O isotope signatures and site preference values of N2O, which cannot be accurately determined when high 15N additions are applied. This research introduces a novel approach using low-level 15N labelling, where a minimal amount of 15N-labelled substrate is added to slightly increase δ15N values (up to ca. 100 ‰–200 ‰) of a single substrate while maintaining natural abundance levels. This ensures that isotope fractionation remains relevant and that standard measurement methods for all isotope signatures can still be applied. If the level of the applied 15N labelling exceeds the natural variability of N sources and isotope fractionation effects, this approach enables a clear distinction between substrates involved in N transformations. It also allows for precise tracing of the path of N from the substrate to the product while simultaneously utilizing or determining isotope fractionation factors. In consequence, such low-labelling experiments are directly relevant and comparable to field conditions. Moreover, the needed addition of N to the system is minimal, which allows us to avoid the effect of additional fertilization of the system under study.
While stable isotope analysis provides valuable insights into nitrogen pathways, its interpretation is often complicated by overlapping fractionation effects (Deb et al., 2024). To refine process identification, microbiological approaches can be applied. Functional characterization of genes encoding key enzymes in N metabolism provides insights into the genetic potential for specific transformations (Levy-Booth et al., 2014), while microbial community structure analysis helps elucidate the physiological activities and ecological roles of microbes in driving N transformations, and quantitative polymerase chain reaction (qPCR) enables the quantification of particular genes and hence assessment of their microbial activity (Espenberg et al., 2018; Rohe et al., 2020). Together, these approaches contribute to a comprehensive understanding of N cycling processes.
However, these microbiological methods only reveal the potential for microbial species to participate in nitrogen cycling rather than directly quantifying transformation rates. The detection of functional genes or gene expression does not confirm whether a process is actively occurring at a given time or its relative contribution within a system (Espenberg et al., 2018; Rohe et al., 2020). Thus, combining stable isotope data with microbiological analyses enhances the precision of nitrogen flux assessments in groundwater, offering a robust framework for tracing, quantifying, and characterizing nitrogen transformations in complex environmental systems. The integration of isotopic and microbial techniques for partitioning N cycle processes has so far provided valuable insights into N2O source apportioning (Masta et al., 2024).
Here we combine isotope studies, applying a novel low-labelling technique and multi-compound isotope analyses, with microbiological analyses using quantitative PCR (qPCR), which identifies and quantifies key genes involved in N processes. This aims at a better understanding of the occurring N transformations and enhancing the precision of nitrogen flux assessments in groundwater.
2.1 Experimental site
Experiments were conducted from the groundwaters collected in an agricultural area near Wołczyn, Poland, approximately 80 km north of Wrocław. On these crop fields, wastewater from a yeast factory is applied as a natural fertilizer, containing 300 mg L−1 of total nitrogen (TN) and 835 mg L−1 of total potassium (TP). While this approach supports agricultural production by reducing reliance on synthetic fertilizers, it is likely to have a significant impact on groundwater quality, especially by increasing N and P loads. Preliminary sampling from piezometers in the study area, conducted in July 2023, revealed nitrate concentrations exceeding 80 mg L−1 in the groundwater, raising concerns about elevated nitrate levels as they exceed the norms for drinking water of 50 mg L−1. Figure 1 illustrates the study area of our experiment, highlighting the locations of the piezometers used for groundwater sampling.
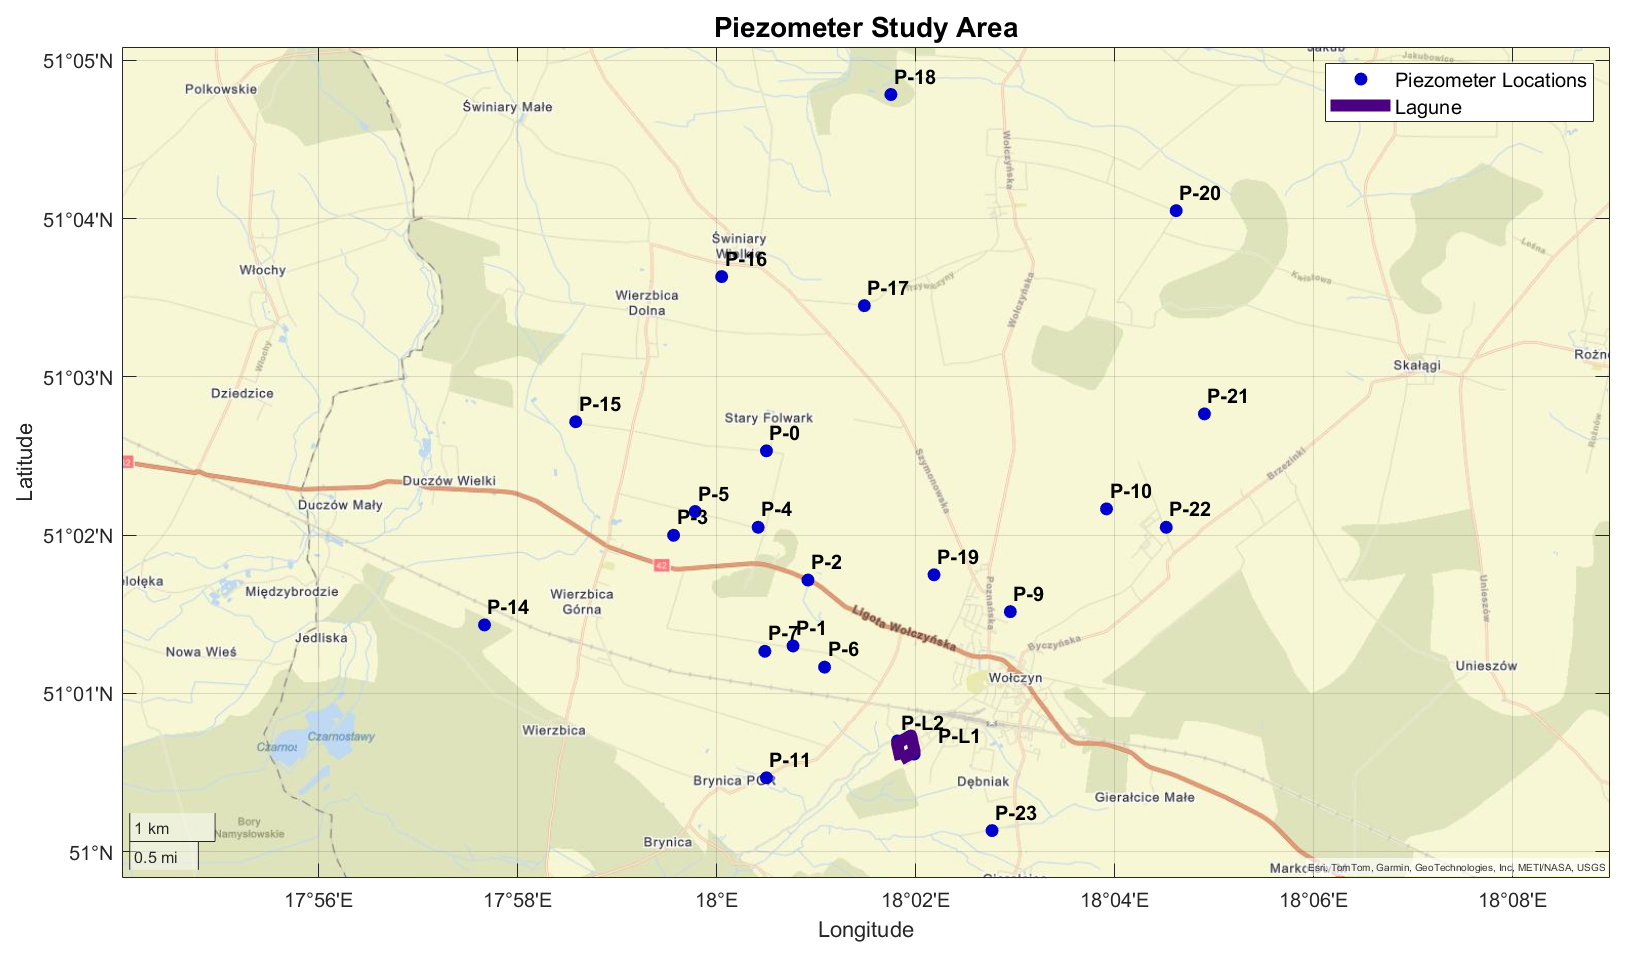
Figure 1Piezometers used in the study area near Wołczyn, Poland. The purple-marked area indicates the lagoon for yeast production sewage storage. (Base map: © OpenStreetMap contributors. Figure created using MATLAB geobasemap with custom GPS data.)
The aquifer under study is the top first groundwater horizon, connected to surface waters and composed of sand–gravel formations of the Neogene–Quaternary, hydraulically separated from the underlying Triassic horizon by shale layers. The water table has an unconfined character and varying depths from 1.5 to 18.7 m below surface (Olichwer et al., 2012). The thickness of the aquifer ranges from 4.5 to 31.9 m. The redox potential of the sampled groundwaters varies from 213 to 345 mV and the dissolved O2 concentration from 2.2 to 4.3 mg dm−3. These values indicate lower O2 content when compared to saturated conditions (ca. 10 mg dm−3) but slightly higher-than-typical denitrification-favouring conditions (below 2 mg dm−3) (Wolters et al., 2022). The dissolved O2 range provided here reflects typical suboxic conditions in this aquifer system, as reported in previous field campaigns in the Wołczyn region (Olichwer et al., 2012). In the present study, individual dissolved O2 concentrations were not systematically recorded for each piezometer due to unexpected problems, and thus, the cited range serves as a general background representation of aquifer conditions.
2.2 Water sampling
Groundwater samples from 23 piezometers in the study area were pumped out at varying depths during the field sampling campaign on 5 September 2023 (Table S1). Subsequently, water from four selected piezometers (P-7, P-16, P-20, P-23) with high nitrate concentrations was used for laboratory incubation studies to evaluate potential N transformation processes and to identify the isotope effects associated with them. Although P-0 and P-3 also exhibited comparably high nitrate concentration levels, they were excluded from the incubation experiments due to limited water availability at the time of sampling.
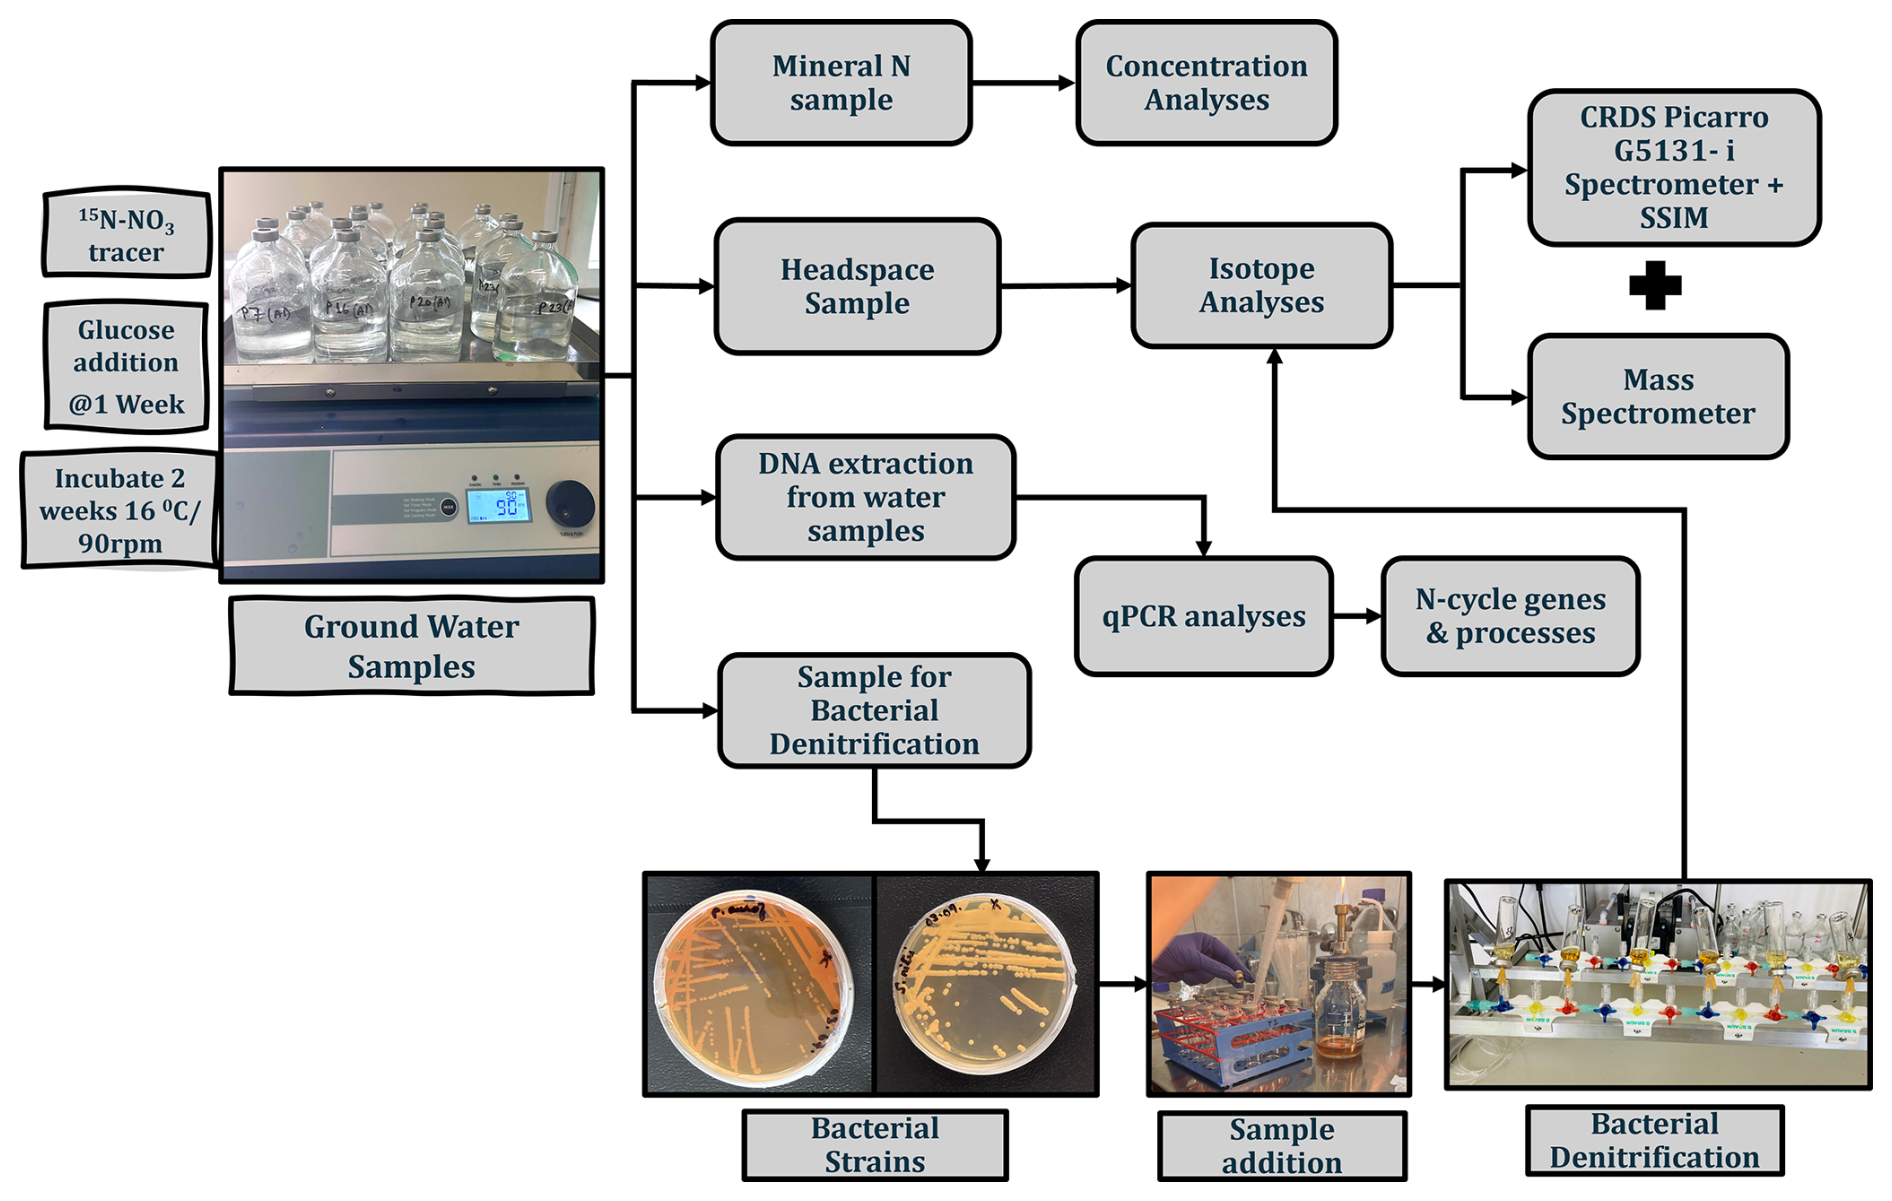
Figure 2Experimental setup for microbial analyses (qPCR, groundwater incubation) and isotopic analysis. The scheme illustrates the workflow for analysing groundwater samples, including incubation with the 15N–NO tracer, bacterial denitrification, DNA extraction, concentration analyses, and isotope measurements using a cavity ring-down spectroscopy (CRDS) Picarro G5131-i spectrometer and mass spectrometer.
For inorganic N concentration and isotopic analyses, all groundwater samples were filtered using 0.45 µm filters. For NO and NH analysis, 50 mL of the filtered sample was collected in a Falcon tube, which was stored frozen until further analysis. For NO analysis, an additional 50 mL of the sample was collected in a separate Falcon tube, where, after filtering, 1 mL of 2 M KOH was added to raise the pH to 10–12, inhibiting NO reduction. The samples were then stored at 4 °C until further analysis. It is essential to analyse these samples as soon as possible after collection to prevent microbial degradation and ensure data integrity.
The field groundwater samples were immediately transported to the laboratory in an ice-cooled box. For the laboratory incubation studies, 2 L of groundwater from selected piezometers was collected into sterile bottles and immediately sealed for a series of laboratory experiments and stored frozen until further analysis. Further, for the later incubation studies (as described in Sect. 2.2), the water samples (600 mL from each incubated piezometer) were filtered using sterile 0.45 µm filters for the further microbial analyses after the 3-week incubation period (Fig. 2).
2.3 Laboratory incubation of groundwater samples
Laboratory incubation studies were conducted with groundwater samples from four selected piezometers (P, abbreviation for piezometer: P-7, P-16, P-20, and P-23) with high NO concentrations to investigate natural NO reduction and identify favourable conditions for denitrification. Due to restricted water availability in some piezometers, where the aquifer was quickly pumped out and the water amount required for the further incubations (min 1500 mL) could not be collected, some potentially interesting piezometers were omitted. This was the case for e.g. P-0 and P-3, where, despite high NO concentrations, the incubations were not possible due to water gain that was too little.
A volume of 150 mL of groundwater from each piezometer was transferred into sterile 250 mL flasks, with each sample prepared in four replicates along with sterile controls. Sterile samples were produced by filtering the groundwater through 0.45 µm filters followed by the addition of 2 mL of HgCl2 to inhibit microbial activity. These sterile samples served as controls for comparison with active treatments. The incubation flasks with groundwater samples were flushed with N2 gas for 15 min at a flow rate of 60–70 mL min−1 and 0.6 bar to create suboxic conditions with an O2 content similar to that of the studied aquifer. The final O2 concentration in the headspace was about 5 %, which corresponds to the dissolved O2 content in water of 2.1 mg L−1 (Table S2). The pH of the samples, approximately 6.5 for each, was maintained without any adjustments. Prior to incubation, a low amount of 15N- and NO-labelled tracer was added to each sample based on its initial nitrate concentration, resulting in at % 15N (atom percent 15N) of 0.4296 %–0.4700 %, slightly exceeding the natural abundance (0.366 %), to trace N transformation pathways. The target δ15N value of final NO was 200 ‰. A stock solution was prepared by dissolving 12.1429 mg of Na15NO3 (99 % 15N) in 50 mL of water. From this, 1 mL was added to samples P-7, P-16, and P-20, while 2 mL was added to P-23. The added volume of the 15N-labelled tracer solution was adjusted according to the nitrate concentration in each sample to achieve a comparable level of isotopic enrichment across all samples while minimizing alteration to the natural isotopic composition. Further, 1 mL of glucose, equivalent to the addition of 616 mg of C, was added as an additional carbon source after 1 week of incubation to additionally stimulate microbial activity and enhance denitrification. All samples were incubated in dark conditions for 3 weeks at 16 °C with agitation at 90 rpm. Inorganic N compounds in incubated samples were analysed at the beginning, after 1 week of incubation before glucose addition, and at the end of the experiment for their concentration (Sect. 2.4) and isotope signatures (Sect. 2.5). The gas headspace samples were collected every second day and analysed for N2O and CO2 concentrations and N2O isotope signatures (Sect. 2.6).
2.4 Inorganic nitrogen analyses (NO, NO, NH) using a colorimetric method
For the analysis of NO, NO, and NH concentrations, groundwater samples were filtered using 0.45 µm filters and measured with the Slandi LF300 photometer (Slandi Sp. z o.o., Michałowice, Poland), a versatile instrument for water and wastewater analysis across wavelengths ranging from 380 to 810 nm. For our analysis, wavelengths of 520, 560, and 610 nm were selected for NO, NO, and NH concentrations, respectively, with detection limits of 0.1–50.0 mg L−1 for NO, 0.02–1.0 mg L−1 for NO, and 0.01–5.00 mg L−1 for NH. Following a standardized protocol, specific reagents were added to the samples, allowing the reactions to develop colour, and the concentrations were then measured photometrically.
2.5 Inorganic nitrogen isotope analyses
To trace microbial N transformation processes in the groundwater samples, inorganic N isotope analyses were performed with the specific bacterial strains Pseudomonas aureofaciens for NO and Stenotrophomonas nitritireducens for NO isotopes. These strains carry out denitrification with N2O as the end product, as they lack the N2O reductase gene (Böhlke et al., 2007; Sigman et al., 2001). The detailed laboratory protocol encompassing the preparation and handling of the bacterial species, along with sample addition and isotope analysis, is available in a previous publication (Deb and Lewicka-Szczebak, 2024). Gas samples were transferred from the headspace to previously evacuated Exetainer vials (Labco Limited, Ceredigion, UK), diluted and analysed for isotope values δ15N and δ18O values of N2O using mass spectrometry (Thermo Scientific, MAT 253 Plus mass spectrometer combined with GasBench and Precon) in the Laboratory of Isotope Geology and Geoecology at the University of Wrocław, Poland.
The denitrifier method using Pseudomonas aureofaciens enabled isotope analysis of NO at concentrations as low as 40 nmol NO L−1 (Stock et al., 2020; Deb and Lewicka-Szczebak, 2024), while using Stenotrophomonas nitritireducens allowed for NO analysis at concentrations as low as 150 nmol NO L−1 (Deb and Lewicka-Szczebak, 2025).
The isotope analyses of NH could not be performed due to mostly very low NH concentrations, below the detection limit of the isotope NH analysis.
2.6 Gas headspace analyses
Headspace samples were periodically collected to measure N2O, CO2, and O2 concentrations and N2O isotope signatures, providing insights into nitrate reduction and denitrification processes under controlled suboxic conditions. The samples of 25 mL of headspace gas were collected each second day into pre-evacuated 12 mL Labco Exetainers (1 bar overpressure). The sampled gas volume was replaced with pure N2 gas. The headspace samples were analysed on the gas chromatograph Shimadzu GC Nexis 2030, equipped with a barrier discharge ionization detector (BID) and thermal conductivity detector (TCD) for O2, CO2, and N2O concentrations (Bucha et al., 2025). The N2O gas was analysed for δ15N, δ18O, and δ15NSP (difference between δ15N values between the central and terminal positions of N in the linear N2O molecule) using cavity ring-down spectroscopy (CRDS) by the Picarro G5131-i spectrometer, equipped with a small sample injection module (SSIM) and connected to an SRI autosampler (Eckhardt et al., unpublished), in the Laboratory of Isotope Geology and Geoecology at the University of Wrocław. The isotope analytical limit was about 300 ppb N2O. At this ambient concentration, the measurement precision was better than 0.5 ‰ for δ15N and δ18O and better than 1 ‰ for δ15NSP. Since this is a newly developed measurement technique, the controlled measurements for selected sampling points were performed at the Thünen Institute, Braunschweig, Germany, applying mass spectrometry (MS) (Thermo Scientific, five collector Delta V mass spectrometers combined with Trace GC and Precon) (Lewicka-Szczebak et al., 2020). After applying proper corrections to the CRDS technique (Harris et al., 2020) and isotope normalization with the same sets of standards (two isotope standards for normalization: DASIMs 16 and 17, Well et al., 2024; and at least three standards of different N2O concentrations), the results between both approaches showed good repeatability within up to a 2 ‰ difference for δ15N and δ18O and up to a 4 ‰ difference for δ15NSP, which fits within a typical reasonable range for comparing measurements with different techniques (Mohn et al., 2014). For sterile samples (with HgCl2 addition), the CRDS technique gave erroneous results; thus only MS results were accepted.
The N2O isotope results were evaluated using the isotope FRactionation And Mixing Evaluation (FRAME) modelling software (Lewicki, 2025, https://malewick.github.io/frame/) to identify N2O production pathways and quantify N2O reduction to N2 (Lewicki et al., 2022).
2.7 DNA extraction and qPCR analyses for the field and experimental samples
For DNA extraction, the groundwater samples were filtered using sterile 0.45 µm mixed cellulose ester (MCE) membrane filters. The filters were stored at −80 °C for subsequent analysis. DNA was extracted from 250 mg of water filters using the DNeasy® PowerSoil® Pro Kit (Qiagen, Germany), following the manufacturer's protocol with one modification: samples were homogenized using a Precellys 24 homogenizer (Bertin Technologies, France) at 5000 rpm for 20 s. The DNA concentration and quality were assessed using a TECAN Infinite M200 spectrophotometer, and the extracted DNA was stored at −20 °C for further microbial analysis.
Quantitative polymerase chain reaction (qPCR) was used to quantify the bacterial and archaeal 16S rRNA genes, as well as the abundances of genes involved in denitrification (nirS, nirK, nosZI, and nosZII), nitrification (bacterial, archaeal, and complete ammonia oxidation (comammox), amoA), nitrogen fixation (nifH), and dissimilatory nitrate reduction to ammonium (DNRA; nrfA). qPCR reactions were performed using a Rotor-Gene Q thermocycler (Qiagen, Germany). The 10 µL reaction mixture consisted of 1 µL of extracted DNA, forward and reverse gene-specific primers, 5 µL of Maxima SYBR Green Master mix reagent (Thermo Fisher Scientific, Waltham, MA, USA), and Milli-Q water. Each sample was amplified in duplicate, with DNA-free negative control samples included in every run. The thermal cycling conditions and primers used are detailed in Table S3 (Espenberg et al., 2024). qPCR results were analysed using Rotor-Gene® Q software v.2.0.2 (Qiagen) and LinRegPCR v.2020.2 (the Netherlands). The number of gene copies was calculated based on standard curve ranges (Espenberg et al., 2018; Kuusemets et al., 2024) and expressed as gene copies per mL of water (copies mL−1). DNA extraction and qPCR analysis were conducted in the Department of Geography at the University of Tartu, Estonia.
3.1 Dissolved inorganic N compounds
3.1.1 Inorganic nitrogen (NO, NO, NH) content and isotope signatures of initial field groundwater samples
Initial field samples were measured for inorganic N to determine NO, NO, and NH concentrations and identify piezometers with the highest nitrate levels, which were then selected for laboratory incubation studies. While field measurements provided baseline reference concentrations of NO, NO, and NH, the laboratory incubation samples revealed significant changes in these concentrations over the incubation period, highlighting N transformation processes under controlled conditions.
Initial field samples before the start of incubation showed NO concentration from 0.2 mg N L−1 to 89.5 mg N L−1, NO concentration from 0.02 to 0.4 mg N L−1, and NH concentration from 0.02 to 17.95 mg N L−1 (Table S1). The four samples with especially high nitrate concentration levels, ranging from 32.8 to 89.9 mg N L−1, have been selected for further incubation studies (Table S1). These samples showed a very low NH concentration. Only a few piezometers showed higher NH contents, which were associated with low NO levels, rather low dissolved organic N (DON), and high dissolved organic C (DOC) (Table S1).
NO concentration was determined in 23 samples and NO in 22, with one sample below the detection limit for NO (Table S1). However, out of these 23 samples, isotope analysis of δ15N and δ18O could be performed on only 12 samples, while δ15N and δ18O could be analysed for 7 samples only (Table S1) due to the detection limit of the applied methods for isotopic analysis. The NH isotopic signature was not determined because of very low concentrations that were mostly below the detection limit for the isotope analysis. All the isotope results are presented in the following figures in the framework of literature data for typical nitrate sources and denitrifying processes (Fig. 3a) and typical ammonium sources and nitrifying N transformation processes (Fig. 3b) after Deb et al. (2024). Such a visual presentation is applied for better identification of possible N sources and N transformations.
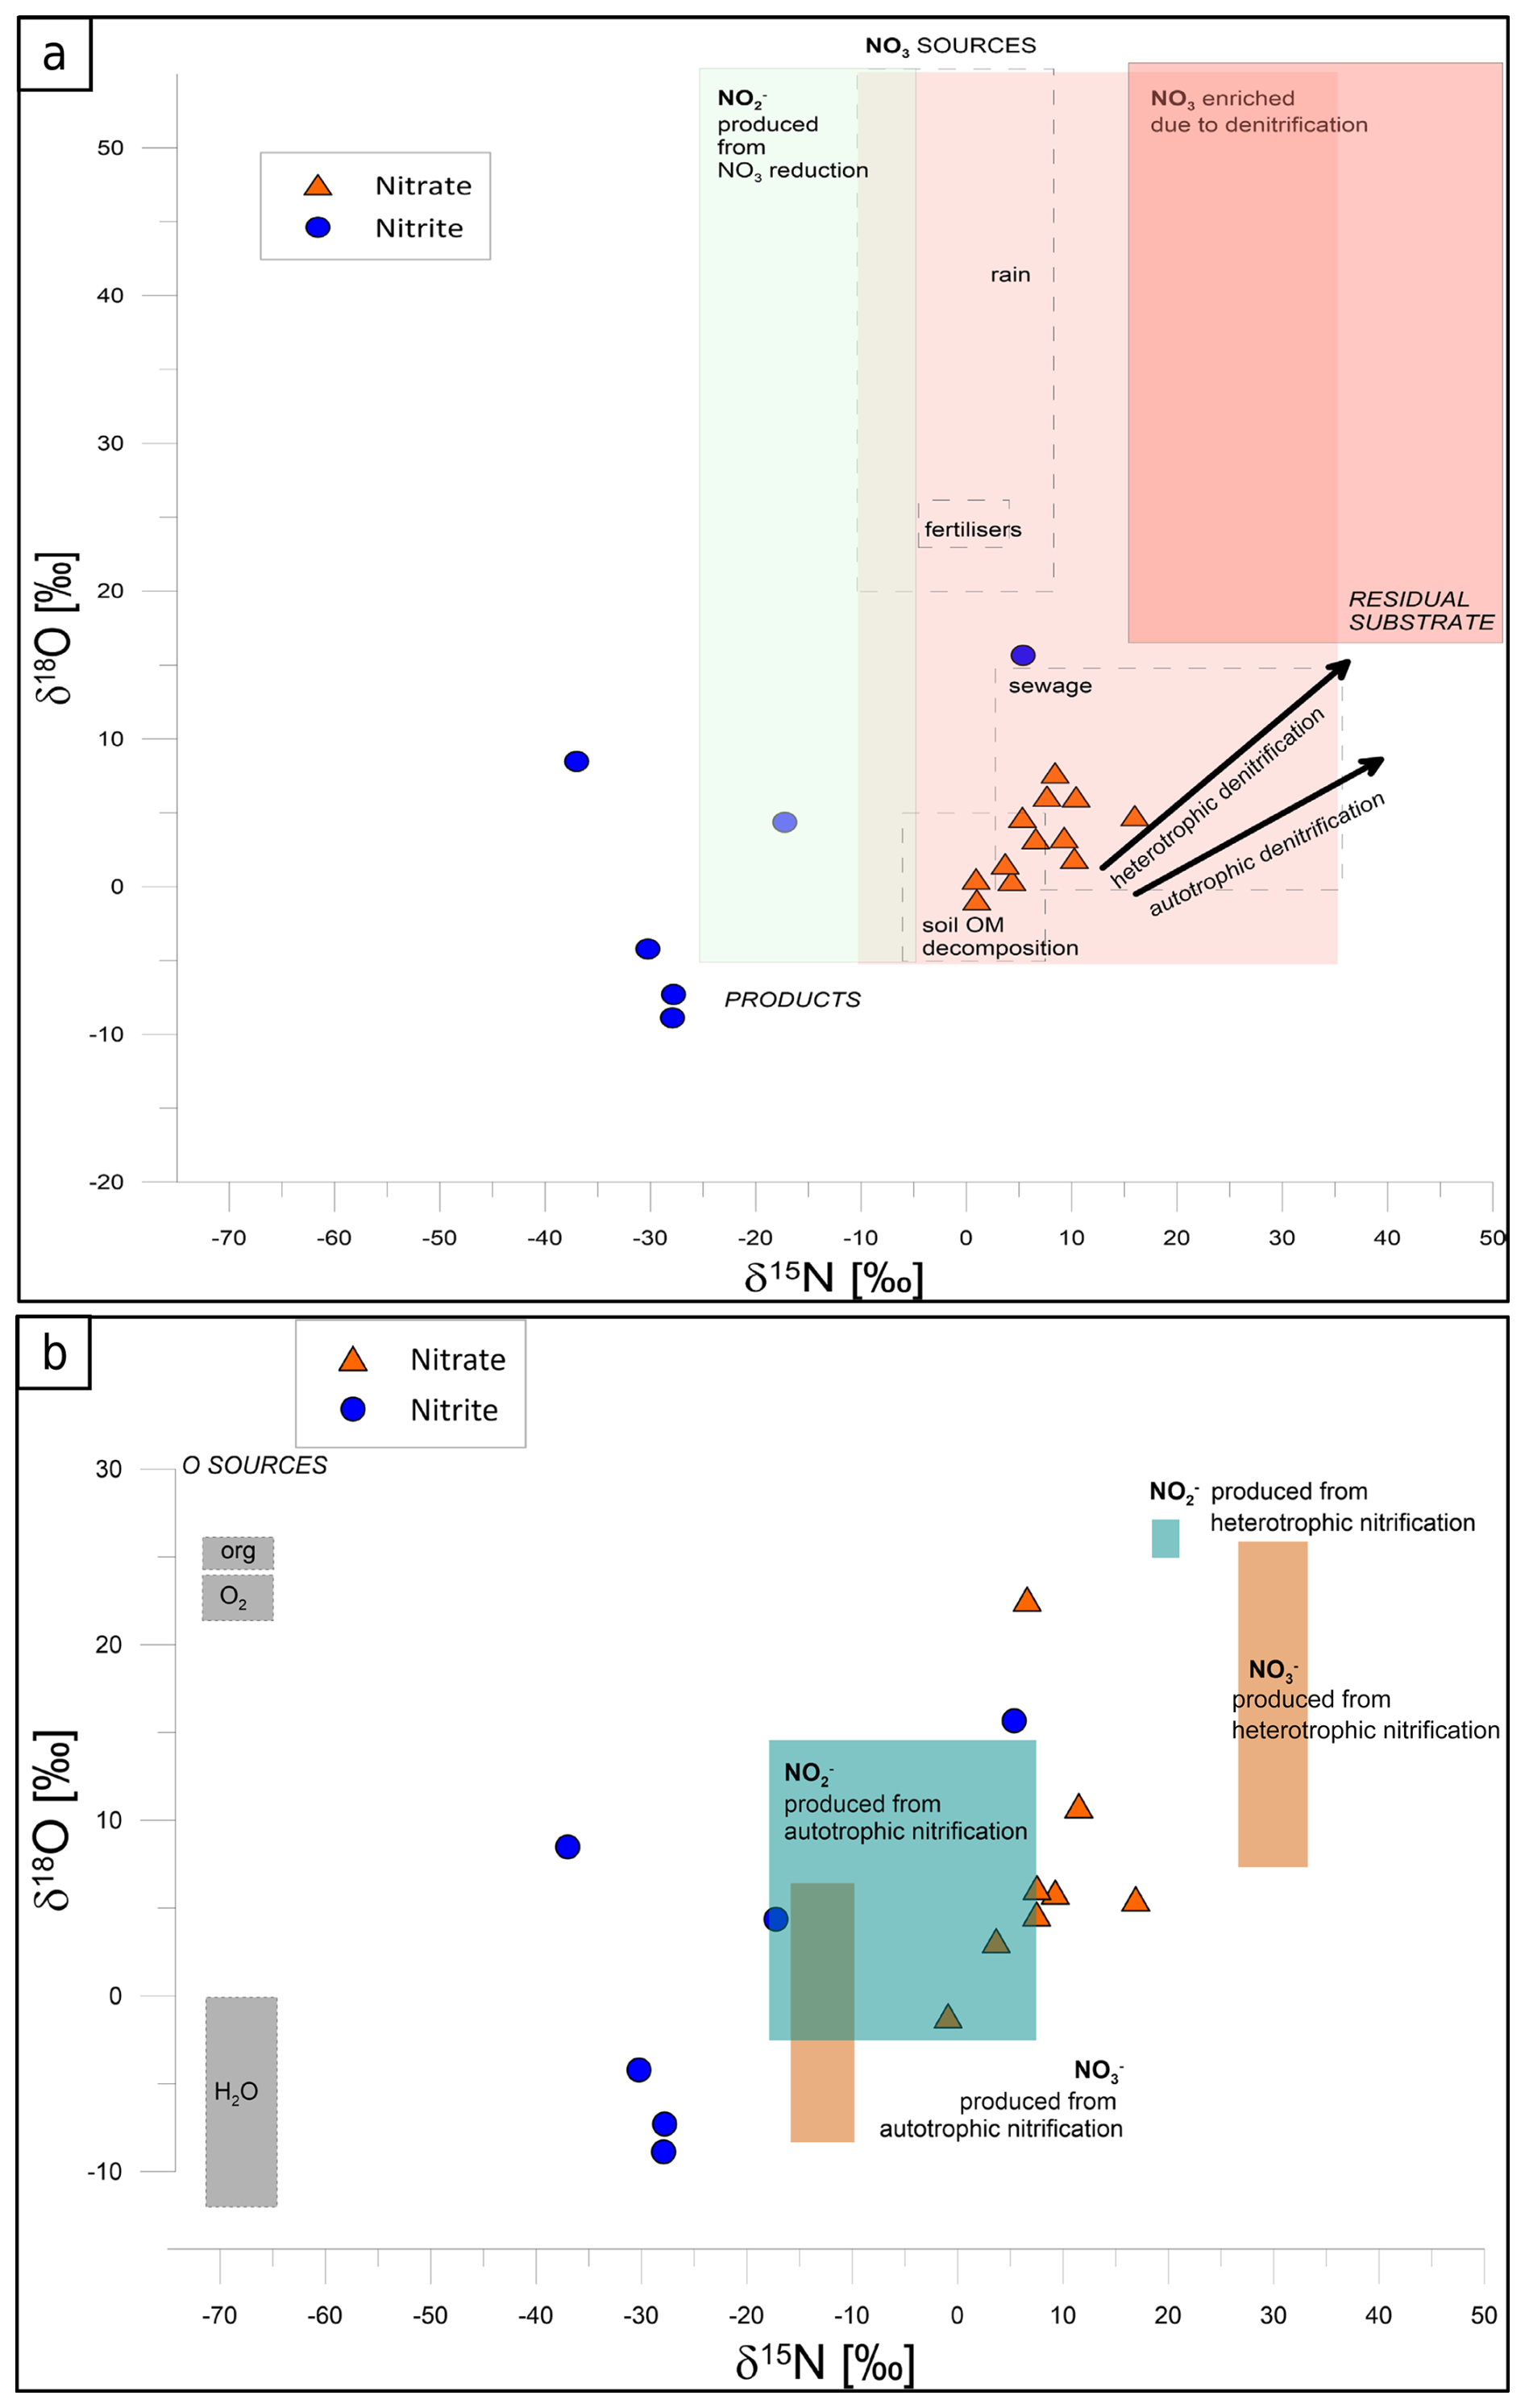
Figure 3The isotope signatures of NO (orange triangles) and NO (blue circles) in field groundwater samples, presented with the literature data for particular N sources and isotope effects for main N transformations, with respect to denitrification processes (a) and nitrification nitrite and nitrate sources (b). The literature data are shown as boxes after Deb et al. (2024). In (a), NO sources (light pink rectangles) include rain, fertilizers, sewage, and soil organic matter, while products (light green rectangle) include NO, formed during NO reduction. Residual NO enriched through denitrification is represented with the red rectangle. Arrows depict typical isotope effects associated with autotrophic and heterotrophic processes. In (b), isotopic characteristics of NO (blue-green rectangles) and NO (light orange rectangles) originating from autotrophic and heterotrophic nitrification are shown. Grey rectangles illustrate possible oxygen sources (O2 and H2O) used during nitrifying oxidation processes.
In Fig. 3a the light-pink-shaded zone reflects NO contributions from different sources, such as fertilizers, sewage, and soil organic matter decomposition, with minimal microbial transformation. The red-shaded “residual substrate” zone indicates the product of advanced denitrification, i.e. residual nitrate enriched in 15N and 18O due to preferential reduction in light isotopes. The correlation between δ18O and δ15N values of nitrate is typical of isotope enrichment due to heterotrophic denitrification, leading to 18O- and 15N-enriched residual NO. The light-green-shaded area represents NO produced from NO reduction during partial denitrification, an intermediate step in denitrification. The isotopic patterns also differentiate between autotrophic and heterotrophic denitrification. Samples aligning with autotrophic denitrification indicate the reduction in NO coupled with the oxidation of inorganic compounds like sulfur or hydrogen, resulting in a slower rate of isotopic fractionation and less pronounced enrichment in δ15N and δ18O (Cui et al., 2019; Hu et al., 2024). In contrast, samples reflecting heterotrophic denitrification show rapid isotopic fractionation due to the use of organic carbon as the electron donor, leading to greater enrichment of δ15N and δ18O in the residual nitrate (Deb et al., 2024).
In this study, NO samples (orange triangles, Fig. 3a) are located in the area typical of NO originating from organic matter decomposition and sewage sources. NO samples (blue circles, Fig. 3a) are mostly shifted towards lower δ15N values, with the expected isotope effect typical of denitrification NO reduction to NO, with isotopically depleted NO due to the preferential reduction in light isotopes (14N and 16O). δ18O values are similar to or lower than the respective NO source, which may indicate additional incorporation of water into the formed NO.
Figure 3b illustrates the isotopic composition of nitrate (NO) and nitrite (NO) in groundwater samples in regard to possible nitrification processes. Autotrophic nitrification, with NO produced from NH or organic nitrogen, is characterized by lower δ15N and δ18O values, while heterotrophic nitrification contributes to NO and NO production with distinct isotopic enrichment from organic nitrogen compounds.
In this study, NO samples (orange triangles, Fig. 3b) are located between values typical of NO production from autotrophic and heterotrophic nitrification. The observed correlation might be a mixture of these two NO origins. However, from the NO samples (blue circles, Fig. 3b), only two points indicate typical values for autotrophic nitrification, whereas others show much lower δ15N values.
3.1.2 Inorganic nitrogen (NO, NO, NH) content and isotope signatures during incubation
During the first phase (before glucose addition), NO concentrations decreased significantly across all samples (a decrease of 14 to 33 mg L−1 N was noted, Fig. 4a). Concurrently, NO concentrations increased significantly, reaching around 3.7 to 13.5 mg L−1 N (Fig. 4a). In the second phase (after glucose addition), NO concentrations continued to decrease in all samples (further decrease of 6.2 to 47.6 mg L−1 N compared to the day 7 sample, Fig. 4a), while NO levels further increased for most samples, reaching 4.7 to 13.5 mg L−1 N. NH concentrations were very low from 0 to 0.2 mg L−1 N) and remained largely unchanged throughout the incubation period.
Further, the isotopic signatures of nitrate (δ15N and δ18O) and nitrite (δ15N and δ18O) were analysed in water samples during laboratory incubation (Fig. 4b). δ15N shows much higher values compared to the initial field samples (Fig. 3) due to the low addition of the 15N–NO tracer. The preparation of the tracer solution and the amount of tracer addition were calculated to attain ca. 100 ‰–200 ‰ as the final δ15N value. However, due to different initial NO concentrations and precisions of the low amount of tracer addition, our final δ15N after tracer addition is variable for each of the four incubated samples, from approximately 100 ‰ for P-23 to over 300 ‰ for P-20 (Fig. 4b). However, these different final values were taken into account in all calculations and modelling so that the differences did not impact the data interpretation. All calculations were applied individually for each incubated water sample, and individual δ15N values were accepted as the incubation starting point for each of the four water samples.
δ15N and δ18O increase significantly during the first phase of incubation and remain quite stable during the second incubation phase across all samples. δ15N shows slight variability across all samples, with values ranging from approximately −50 ‰ to 0 ‰, which are hence much lower than the respective δ15N values. δ18O shows dynamic variations without very consistent trends, reflecting the complexity of microbial and environmental interactions affecting nitrite transformation. Interestingly, there is a very clear pattern for P-7, P-16, and P-20, with significant δ18O enrichment for the second sampling (7 d) and further depletion for the third sampling (14 d) (Fig. 4b).
In the sterile treatment, the NO reduction is even faster than in other samples, while the isotope signatures are very stable, showing only negligible isotope enrichment. NO concentrations stay low and do not exceed 0.3 mg N L−1. NH concentrations increase during the incubation, reaching up to 4 mg N L−1, which is much higher than those observed for non-sterile samples.
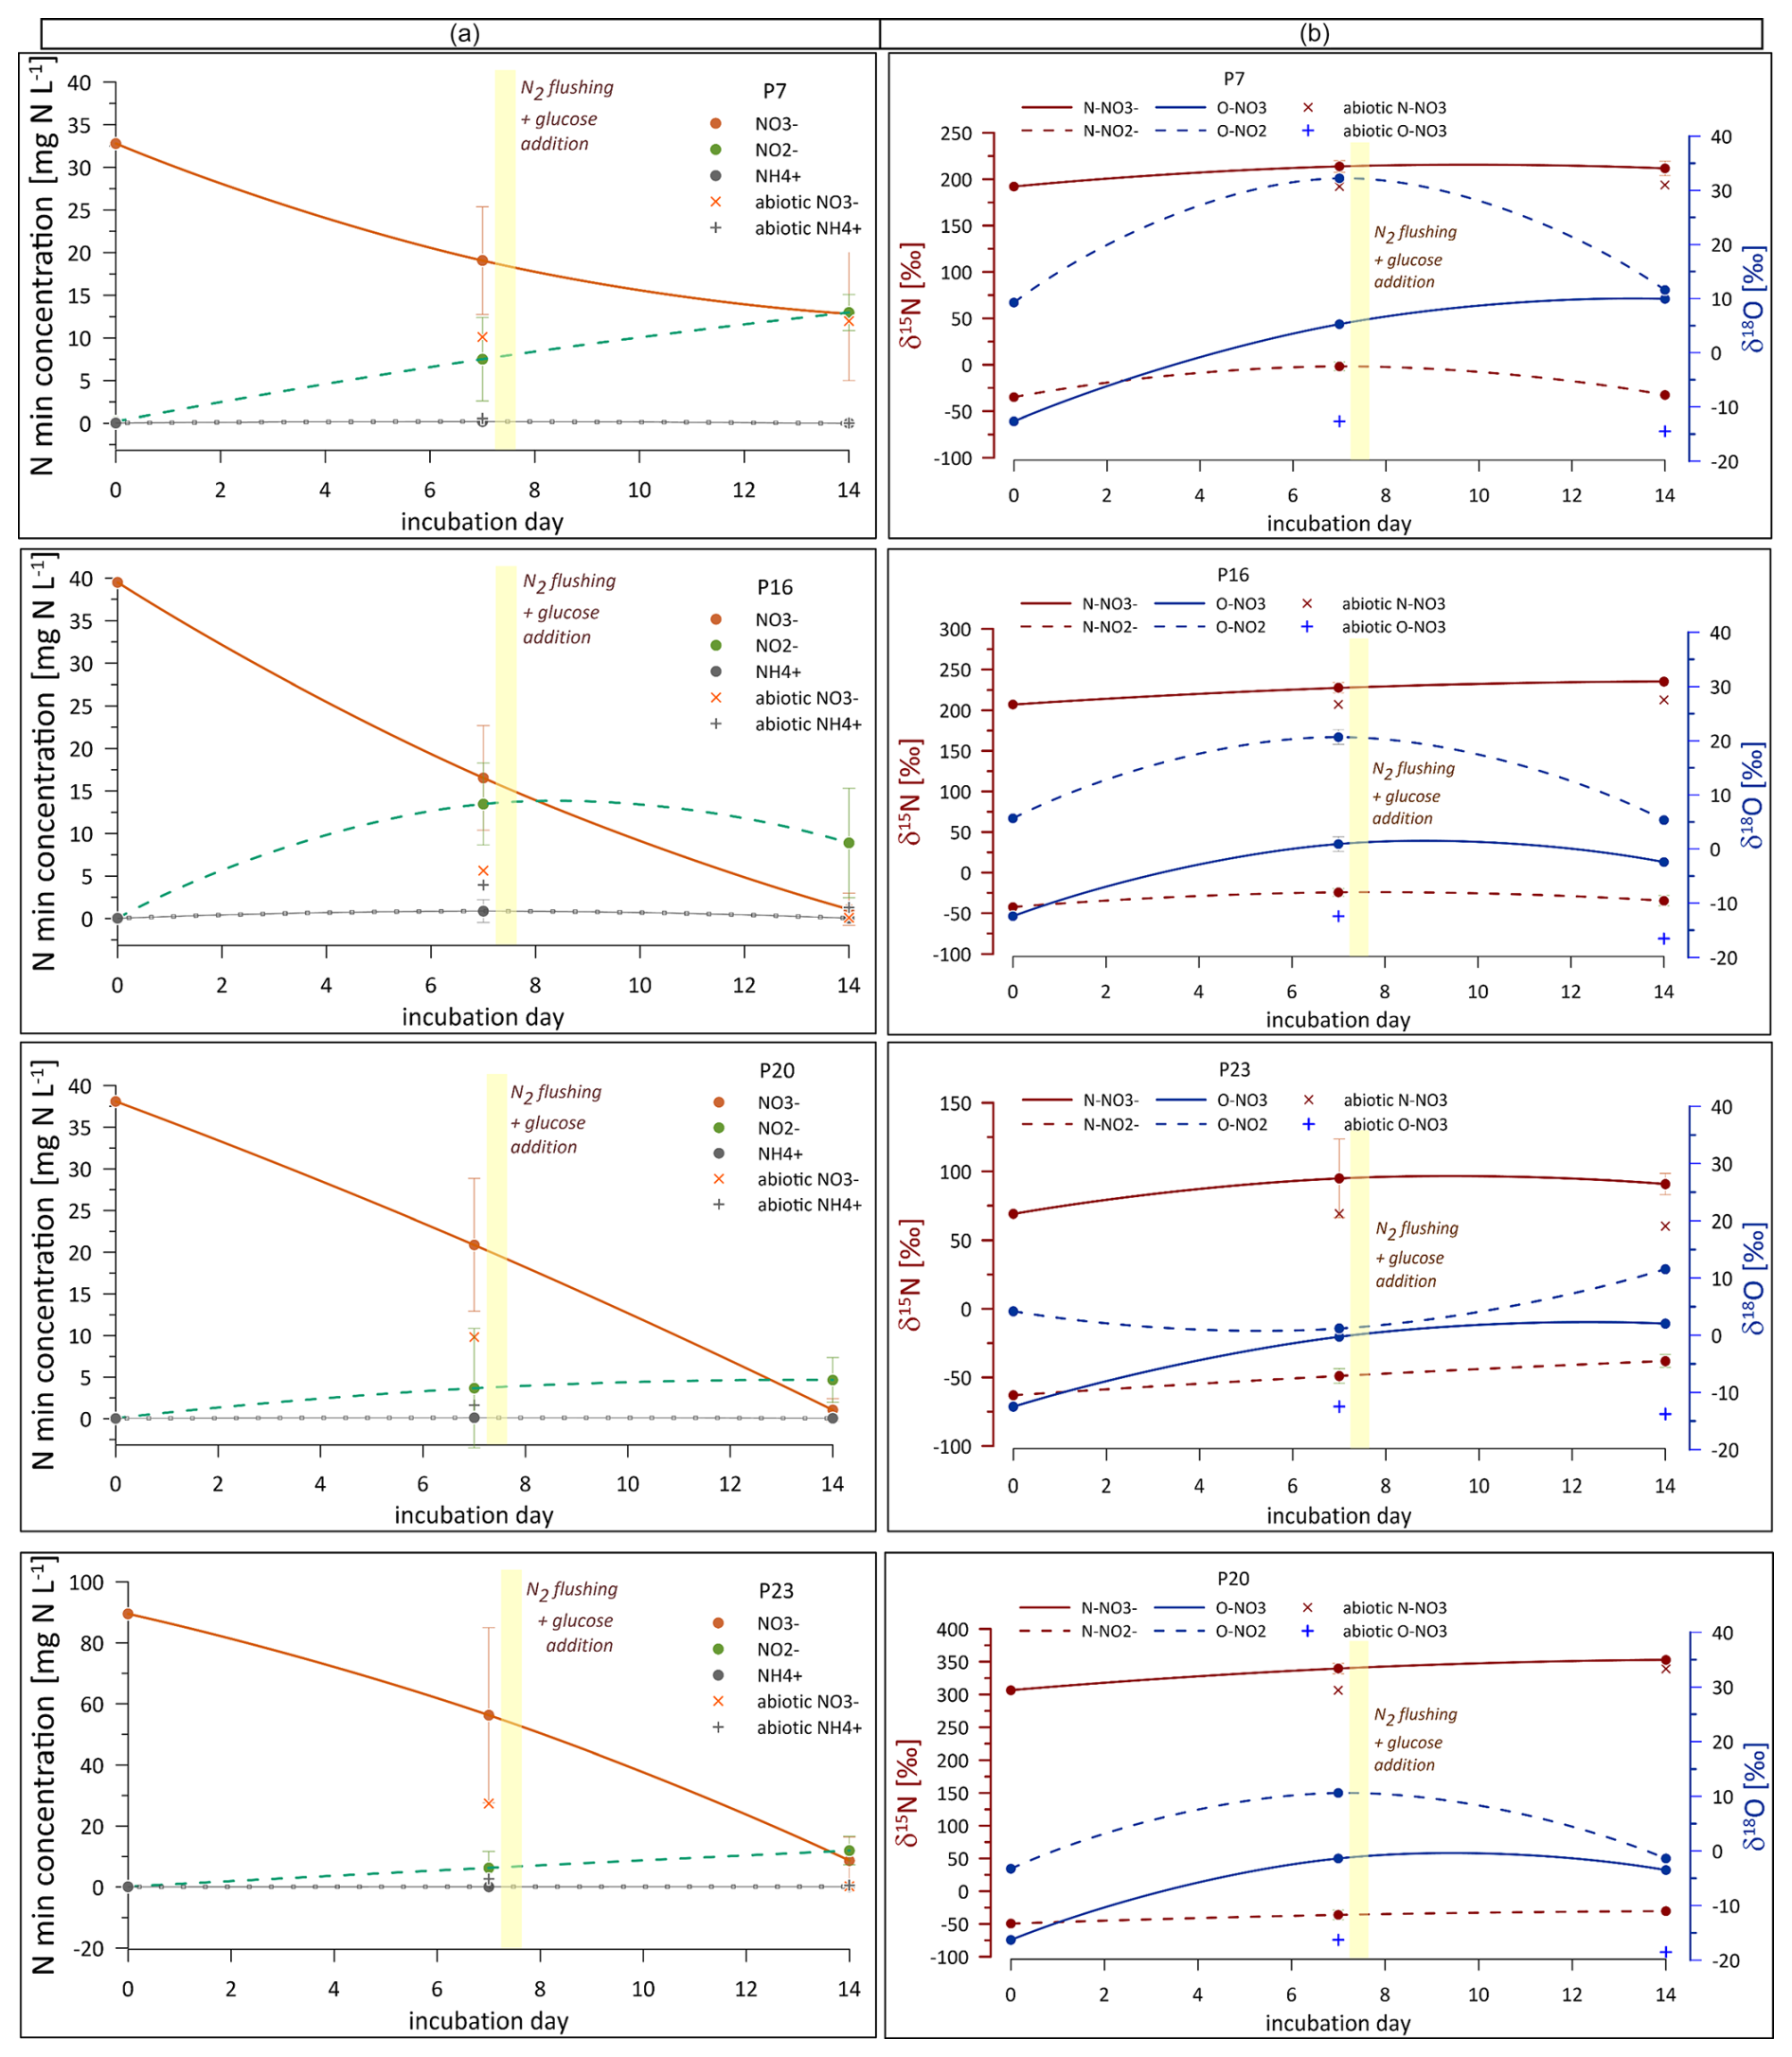
Figure 4(a) Content of inorganic nitrogen forms (orange line: NO, green line: NO, grey line: NH) and their (b) isotopic signatures (δ15N and δ18O) during laboratory incubation. The graphs in (a) show concentration variations over time, and graphs in (b) depict changes in δ15N (dark red lines) and δ18O (blue lines) values over time for NO (solid line) and NO (dashed line) in different samples (P, abbreviation for piezometer: P-7, P-16, P-20, and P-23), illustrating dynamic isotopic variations influenced by microbial processes. Sterile samples are shown as the individual points on the graphs (for NO and NH contents, while NO was very low for all the sterile samples and is not shown).
3.1.3 Isotope mass balance and source attribution for incubation study
To quantify the NO sources during the incubation experiment, a simple isotope mass balance approach was applied based on δ15N measurements of NO and NO. Based on the observed δ15N (initial value, day 0) and change in δ15N values (between day 0 and day 7 of the incubation), we can calculate the maximal contribution of NO originating from NO reduction (NAR) to this newly formed NO applying the isotope mass balance (Eq. 1). These calculations are simplified by neglecting any isotope fractionation of the NO pool.
Table 1Inputs and results of the mass balance calculations for determining the contribution of nitrate reduction (NAR) in the nitrite pool with Eq. (1): N is the change in the nitrite N isotope signature between day 0 and day 7, δ15N is the initial N isotope signature of nitrate, Δ [NO] 2 is the change in nitrite concentration between day 0 and day 7, NAR is the amount of produced nitrite originating from NAR, and Δ [NO] is the nitrate consumption between day 0 and day 7.
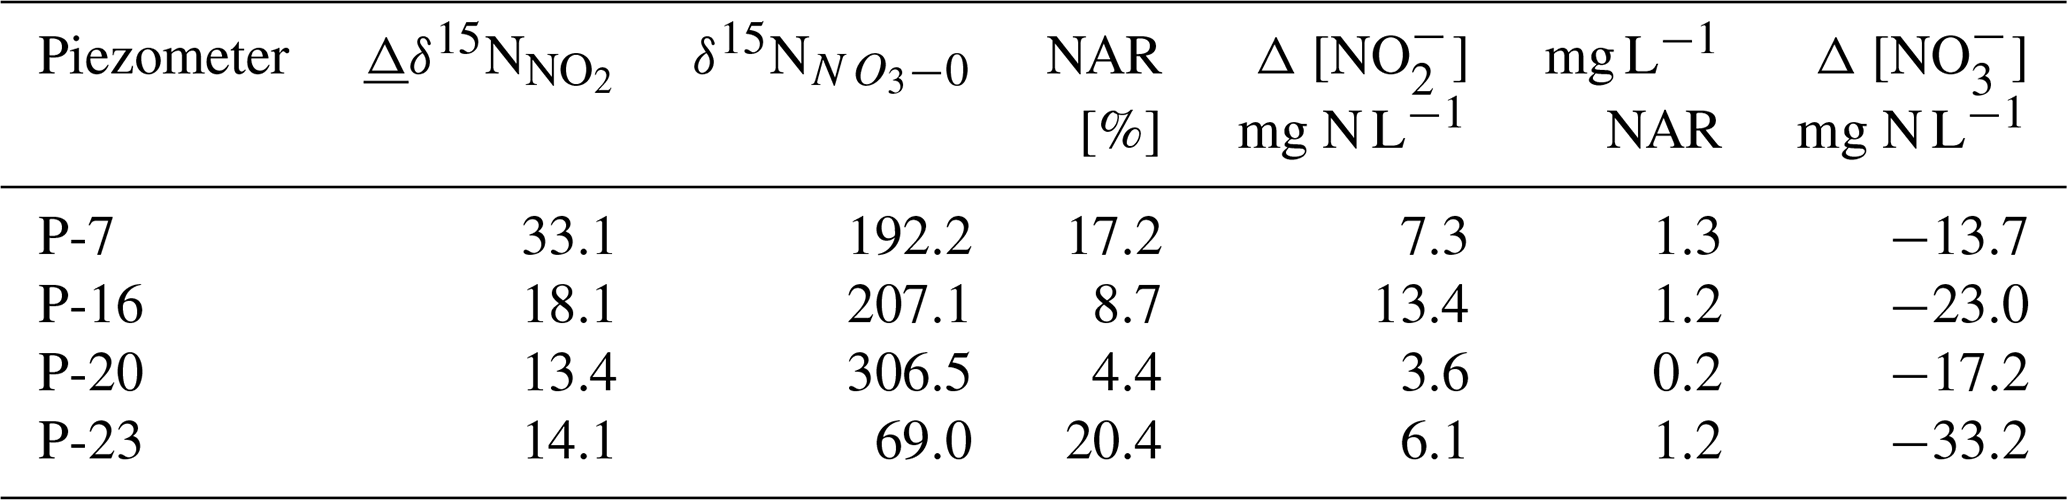
The calculation results (Table 1) indicate that from 0.2 up to 1.3 mg, N–NO L−1 originates from NAR, which is a low amount compared to the magnitude of N–NOconsumption of 13.7 to 33.2 mg L−1 (Table 1). However, interestingly, the majority of N–NO (80 % to 95 %) originates from transformations other than NO reduction.
A closer look at the isotopic analysis of nitrite (NO) in the groundwater incubation study (Fig. 5) reveals that the highest nitrite concentrations are characterized by the lowest isotope signatures. We observe a statistically significant correlation between O and N isotopic signatures of NO. Theoretically, this could be the mixing line, with the 15N-labelled values originating from NO-labelled reduction, but this NO shows low δ18O values in the range from −16 ‰ to +10 ‰. Hence, this instead shows mixing of the different origins of unlabelled NO2, which is in the great majority (as shown above and in Table 1), potentially originating from both autotrophic and heterotrophic nitrification processes.
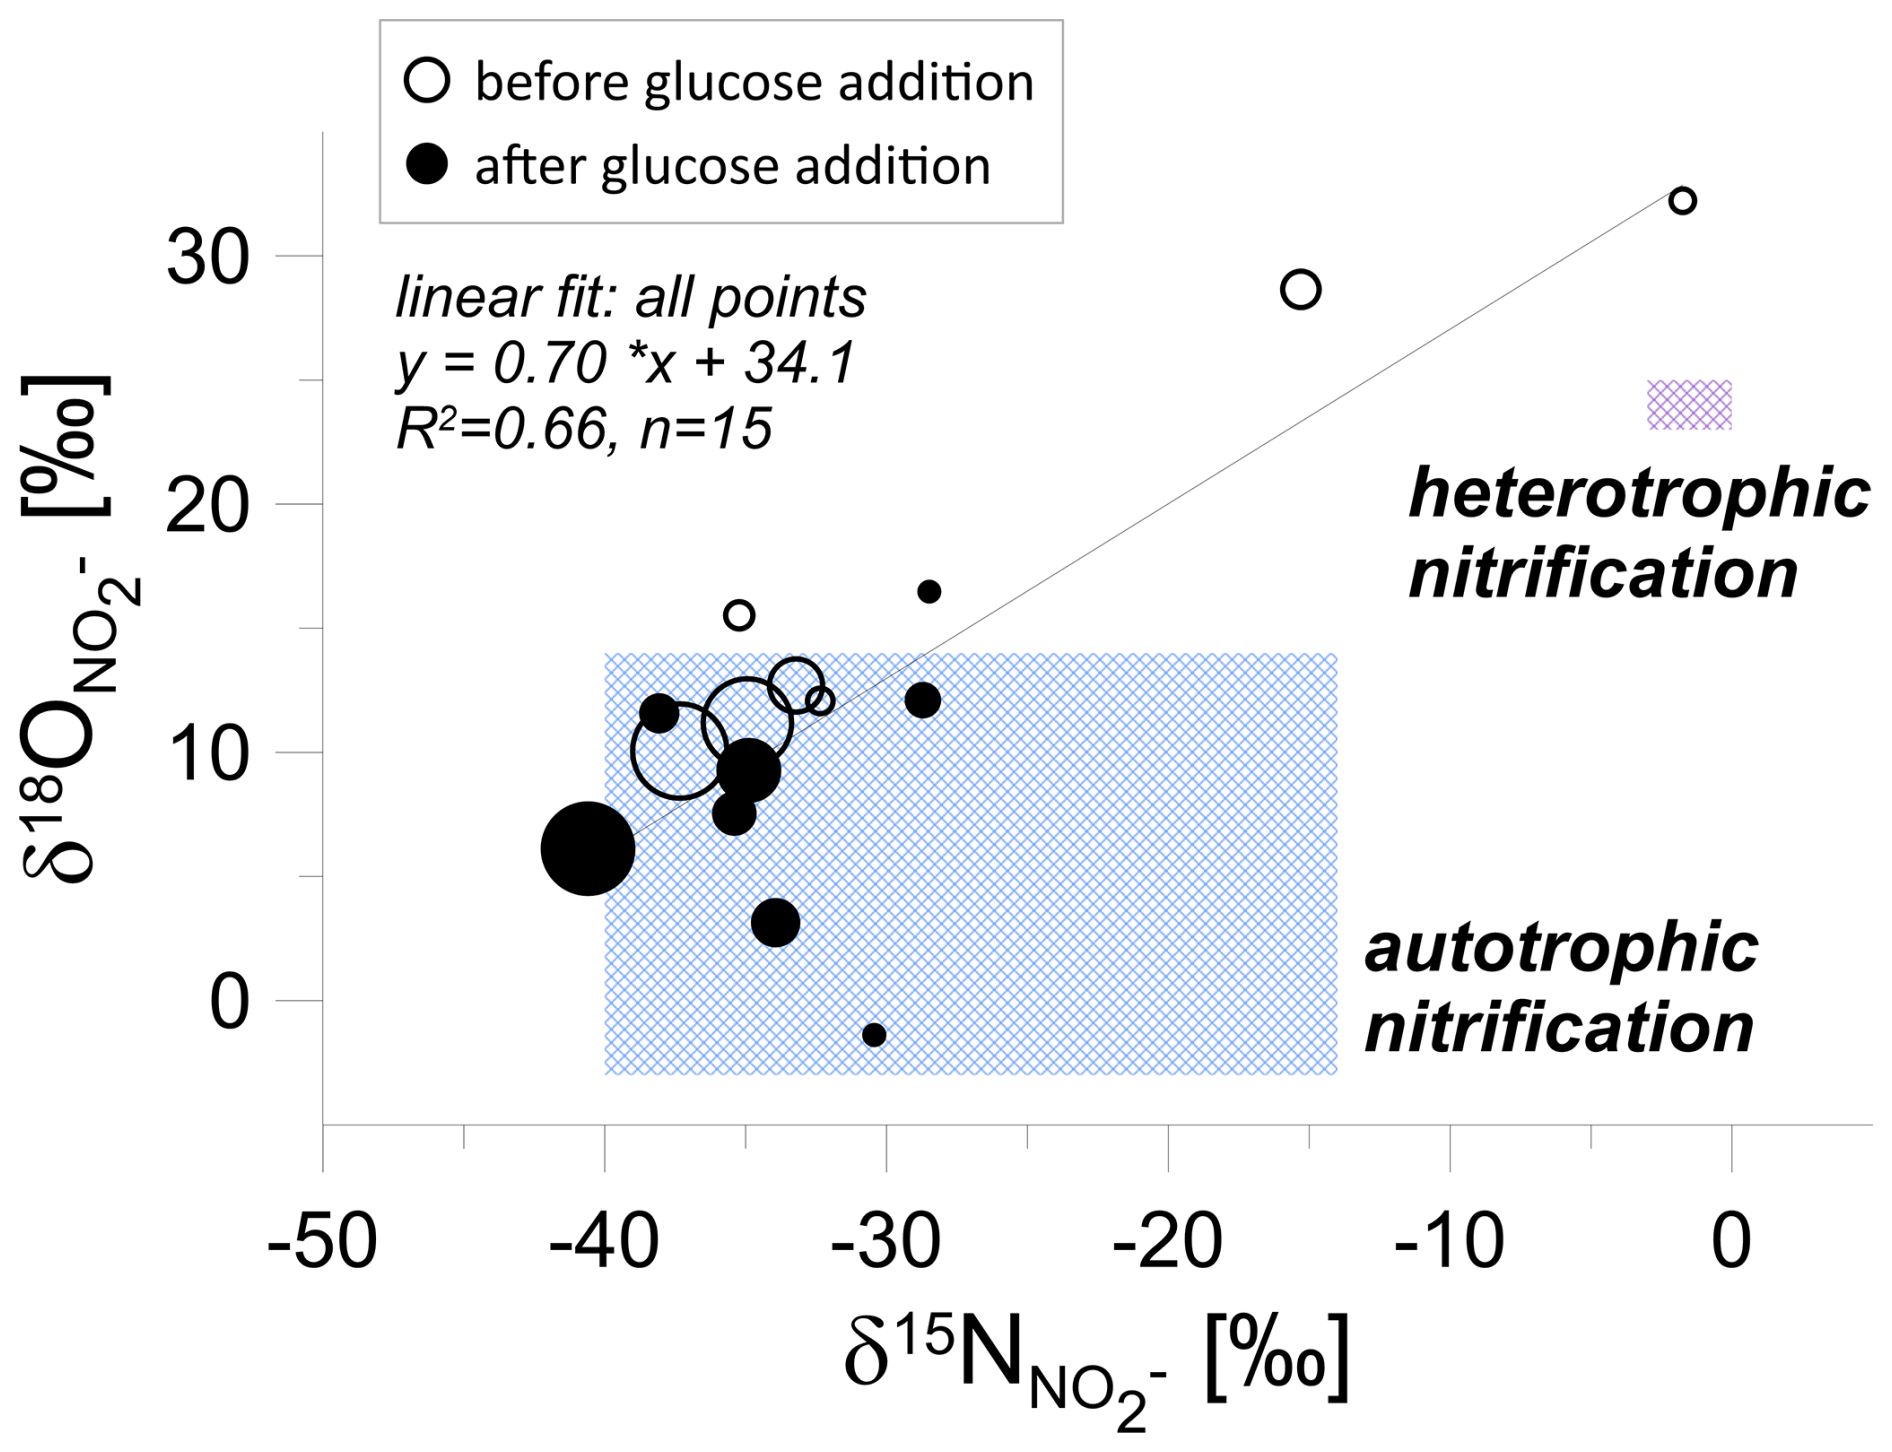
Figure 5Isotopic signatures of nitrite (NO) during laboratory incubation. First phase – before glucose addition (empty circles), second phase – after glucose addition (filled circles). The point size is proportional to the nitrite concentration. The shaded regions correspond to isotopic ranges associated with autotrophic and heterotrophic nitrification (after Deb et al., 2024), illustrating a shift in processes following glucose addition.
3.2 Gas headspace sample analysis and FRAME modelling
For almost all sampling, significant N2O and CO2 fluxes were observed during the incubation. The gases were accumulated in the headspace until day 7 of the incubation (phase 1: day 1–day 7), then, after flushing, the accumulation was started again for the next 7 d (phase 2: day 8–day 14). Table S2 shows the results of headspace gas analyses for the second and last days of the accumulation for each incubation phase, before and after glucose addition. The CO2 production varies from 0.7 to 3.1 mg L−1 d−1, with a similar flux range for both phases. The N2O production varies from 0.1 to 11.6 µg L−1 d−1, with significantly higher fluxes for the second incubation phase, with one extremely high outlier.
Sterile samples show CO2 production in amounts comparable to unsterile treatments and much lower N2O production, although still significant at some points, especially for the second incubation phase after glucose addition (Table S2).
Figure 6 shows the isotopic signatures (δ15NSP, δ18O, δ15N) of N2O in headspace samples from laboratory incubation before and after glucose addition, together with the main N2O production pathways and typical N2O reduction line, summarized following literature data (Yu et al., 2020). The isotope characteristics of the main N2O production pathways – bacterial and fungal denitrification (bD and fD), nitrifier denitrification (nD), nitrification (Ni), and chemodenitrification (chD) – are shown for the particular substrate isotopic signatures of the actual case study: δ18O of −9.0 ‰ (mean common value for all water samples) and respective δ15N, separately determined for each sampling point (respective values in Table S1).
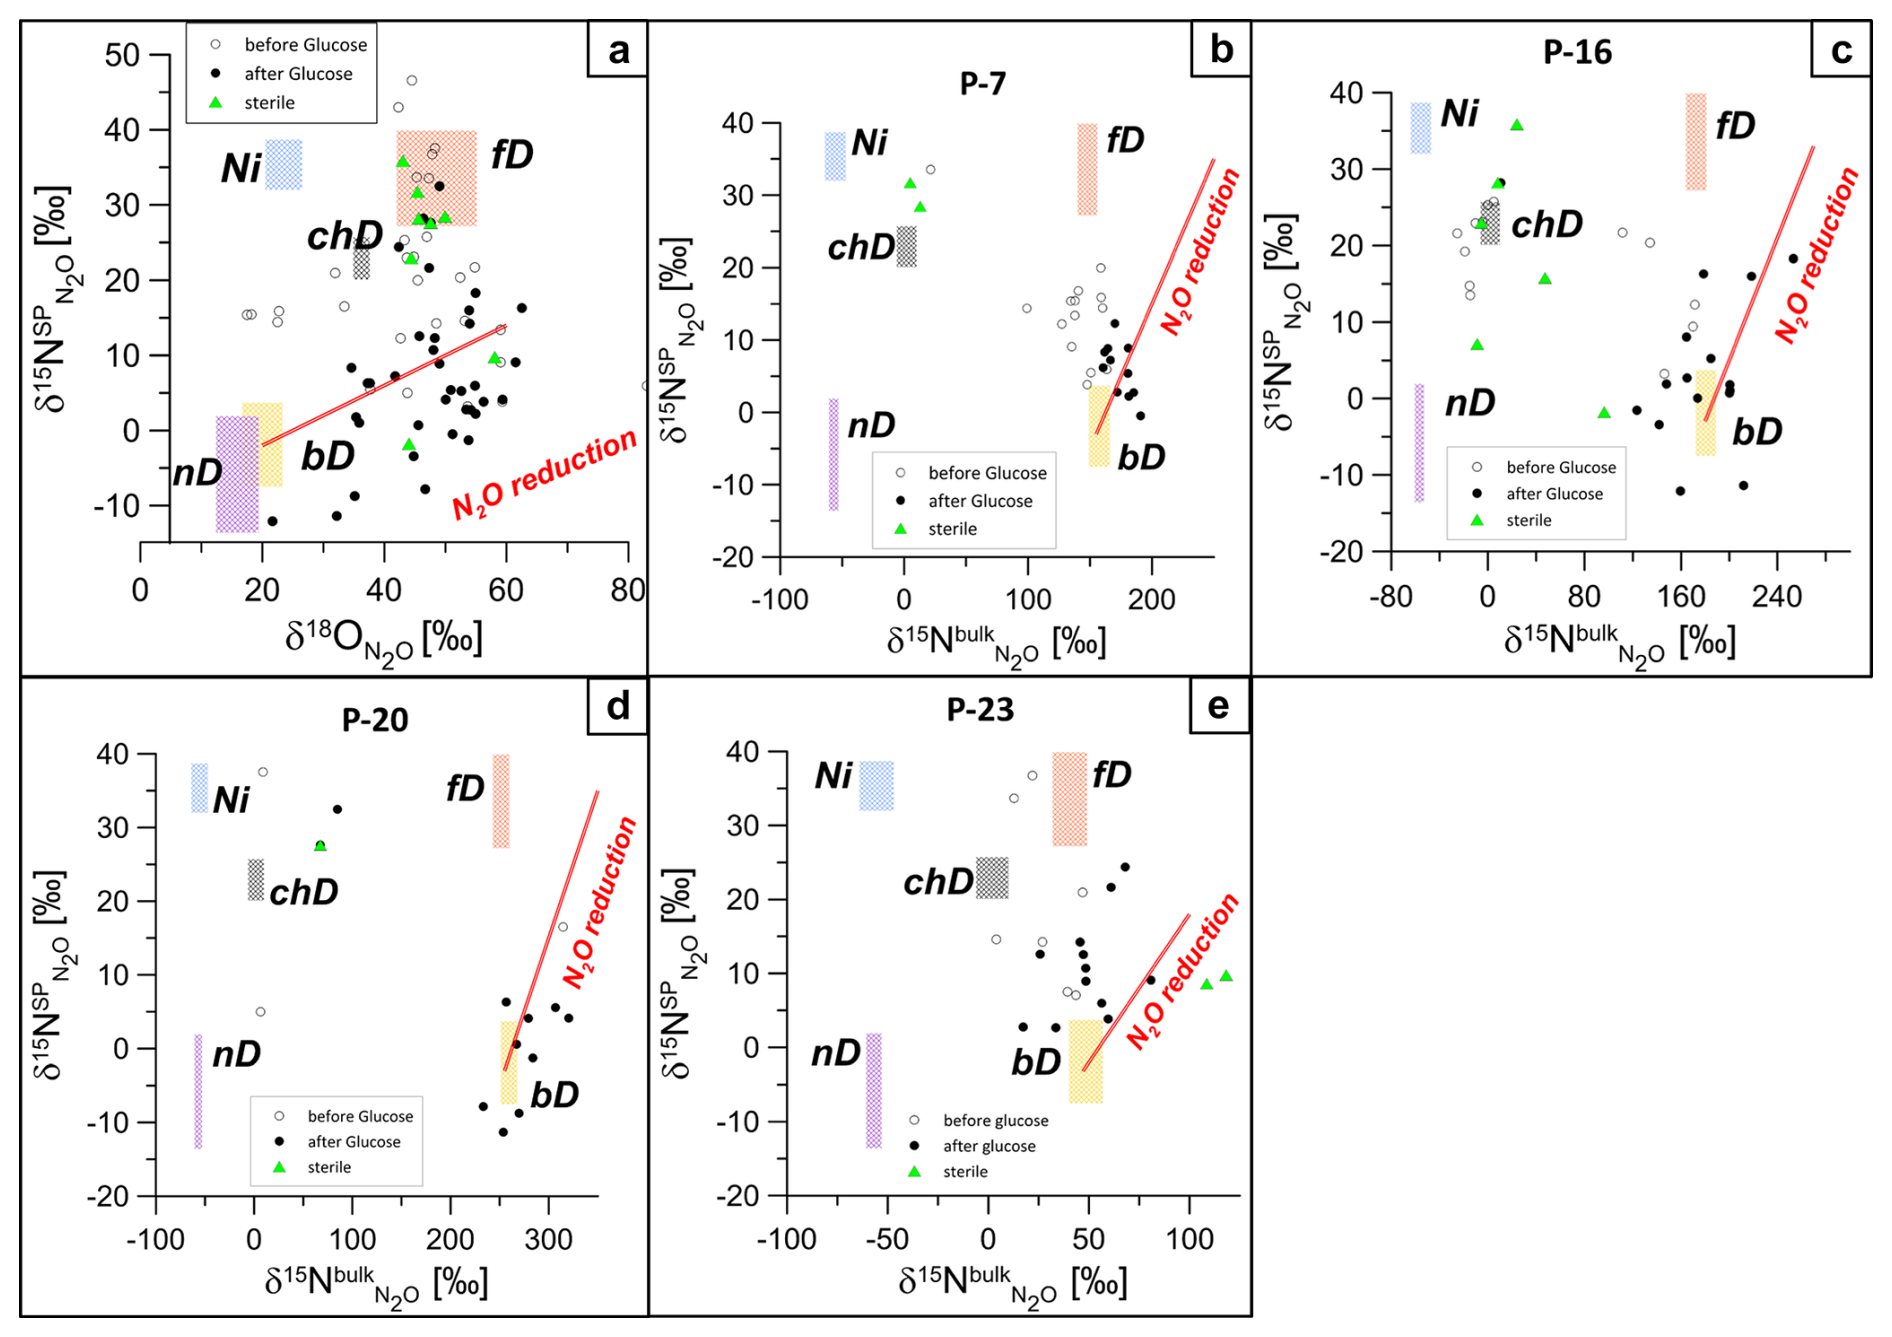
Figure 6Isotopic signatures (δ15N, δ18O, and δ15N) highlighting N2O dynamics and microbial nitrogen transformation pathways during laboratory incubation for groundwater samples (P, abbreviation for piezometer: P-7, P-16, P-20, and P-23). Empty circles represent the first incubation phase before glucose addition, filled circles represent the second incubation phase after glucose addition, and green triangles show sterile samples. Clustering reflects a shift from mixed nitrification and denitrification before glucose addition to bacterial denitrification dominance after glucose addition. Panel (a) presents the δ15NSP–δ18O map for all samples since the source processes are common to all samples. Panels (b)–(e) present δ15NSP–δ15N maps plotted individually for each piezometer because the mixing endmembers' isotopic signatures (bD and fD) differ depending on the particular 15N content for each piezometer. Each plot shows isotopic values before glucose addition (white circles) and after glucose addition (black circles), reflecting microbial processes like bacterial denitrification (bD), autotrophic nitrification (Ni), nitrifier denitrification (nD), and fungal denitrification (fD), with N2O reduction along the red line.
Before glucose addition, the isotopic signatures indicate mixing between nitrification and denitrification processes (Fig. 6a). In P-7, before glucose addition, isotopic data clustered near the nitrifier denitrification (nD) zone, highlighting ammonia oxidation and partial N2O reduction (Fig. 6b). In P-16, isotope signatures are widely distributed between nitrifier and bacterial denitrification zones, suggesting overlapping processes (Fig. 6c). In P-20 and P-23, clustering near the bacterial denitrification (bD) zone reflected nitrate reduction as the dominant pathway with minimal N2O reduction (Fig. 6d, e).
After glucose addition, the isotopic data indicate that N2O production was primarily driven by bacterial denitrification (bD), with relatively low δ15N and δ18O values, clustering mostly around the reduction line (Fig. 6a). In the δ15NSP−δ15N space, the isotopic data mostly showed a clear shift toward bD, supported by a significant increase in δ15N values, indicating N2O production from the slightly 15N-labelled NO pool and some effect of N2O reduction (Fig. 6b–e). In P-23, however, the data indicate more possible pathway mixtures, including nitrification (Ni) and fungal denitrification (fD) (Fig. 6e). Significant reduction in N2O to N2 can be assumed based on the clustering of the points along the N2O reduction line, especially on the δ15NSP−δ18O isotope map (Fig. 6a). On the δ15NSP−δ15N isotope map, the effect of N2O reduction is less visible because the artificially elevated δ15N values result in a very steep reduction line. Minimal clustering near the fungal denitrification (fD) zone suggests limited fungal contributions to N2O production. However, the δ15NSP−δ18O map shows some samples near the fD zone (Fig. 6a), and the FRAME model (Fig. S1) also supports this with minor yet detectable fungal involvement. The shift in δ15N values reflects the changing dynamics, with nitrification and nitrifier denitrification becoming less prominent as bacterial denitrification intensified during the course of incubation.
These isotope results of N2O from the headspace samples were jointly analysed using the three-dimensional FRactionation And Mixing Evaluation (FRAME) model (Lewicki et al., 2022) to quantitatively interpret the isotopic signatures of N2O, identify microbial pathways driving N2O production, and estimate N2O reduction progress. This offers the most precise insight into N transformations under controlled experimental conditions.
The FRAME model outputs (Fig. S1) reveal distinct microbial processes driving N2O production and reduction during laboratory incubation of groundwater samples from P-7, P-16, P-20, and P-23, comparing the initial incubation phase (1–2 d) to the later phase (4–14 d), including samples before and after glucose addition.
This division of samples was made after the observed isotopic signatures – the initial samples (day 2) showed no 15N enrichment in N2O, and later samples (day 7–day 14) were characterized by very significant 15N enrichment. Initially, autotrophic nitrification (Ni) dominated across all samples, contributing approximately 60 %–70 % to N2O production, while bacterial denitrification (bD) was lower, ranging between 20 %–30 %. In P-7 and P-16, minor contributions from nitrifier denitrification (nD) (10 %–20 %) and fungal denitrification (fD) (< 10 %) were observed, with similar trends in P-20 and P-23, where nD accounted for slightly higher fractions of N2O production. Residual N2O fractions () across all piezometers ranged between 10 %–26 %, reflecting high partial N2O reduction to N2.
In the later incubation phase, microbial activity shifted significantly toward denitrification, with bD becoming the dominant pathway (up to 80 %–85 %), driven by the availability of carbon. P-7 and P-16 exhibited a gradual rise in bD, reaching up to 73 %, while residual Ni contributions declined correspondingly. In P-20 and P-23, the transition was sharper, with bD dominance occurring more abruptly. Residual N2O fractions decreased across all samples as bD activity intensified. Simultaneously, Ni contributions dropped below 10 % in all samples, while nD and fD remained minimal, contributing < 15 % to N2O production. However, for the last sample (day 14 of the incubation) for all the analysed groundwater samples, the model could not find any solution. This might be due to accumulation of very different N2O origins and progressing reduction in the N2O mixture of all production pathways.
Figure S2 presents an illustration of the model performance on an example of sample 6 (day 14) of P-16, which is representative of all the piezometers. The modelling problem occurs due to measured δ18O values that are too high. While δ15N and δ15NSP show values typical of bD, δ18O is shifted to much higher values, indicating a large reduction that is not confirmed with the low δ15NSP values.
3.3 Gene abundance and proportion analyses
The gene abundance graph (Fig. 7a) illustrates the quantification of key nitrogen cycle genes, while the proportions of functional genes relative to total prokaryotic abundance are shown in Fig. 7b for groundwater samples (P-7, P-16, P-20, and P-23) before and after incubation.
The gene abundance results indicate that post-incubation, especially with glucose addition, led to a shift in microbial communities from predominantly archaeal ammonia oxidizers toward bacterial denitrifiers. Pre-incubation data indicate a notable presence of archaeal amoA genes compared to bacterial amoA, suggesting active archaeal ammonia oxidation in the samples (Fig. 7a). While the denitrification gene nosZI shows relatively high abundance in some samples (e.g. P-16 and P-23), the consistent presence of archaeal amoA and the lower abundance of other denitrification-related genes (nirK, nirS) suggest that nitrification processes were prominent prior to incubation. This is particularly evident in P-7 and P-20, where archaeal amoA surpasses denitrification genes, suggesting a stronger nitrification potential. Post-incubation, there was a significant increase in the abundance of denitrification genes like nosZI, particularly in samples P-7, P-16, and P-20, illustrating a shift from nitrification to denitrification under incubation conditions (Fig. 7a).
The abundance of archaeal 16S rRNA genes decreased in samples P-7 and P-23, indicating a reduction in the archaeal community, whereas the abundance of bacterial 16S rRNA increased significantly in P-16 and P-20, reflecting bacterial growth during incubation. Paired t tests confirmed these observations, showing significant increases in the abundance of nosZI genes in P7 (p<0.05) and P16 (p<0.05) and shifts in the archaeal 16S rRNA abundance (p<0.05) but not in the abundances of nirK and nosZII genes (p>0.05), highlighting the variability in microbial responses.
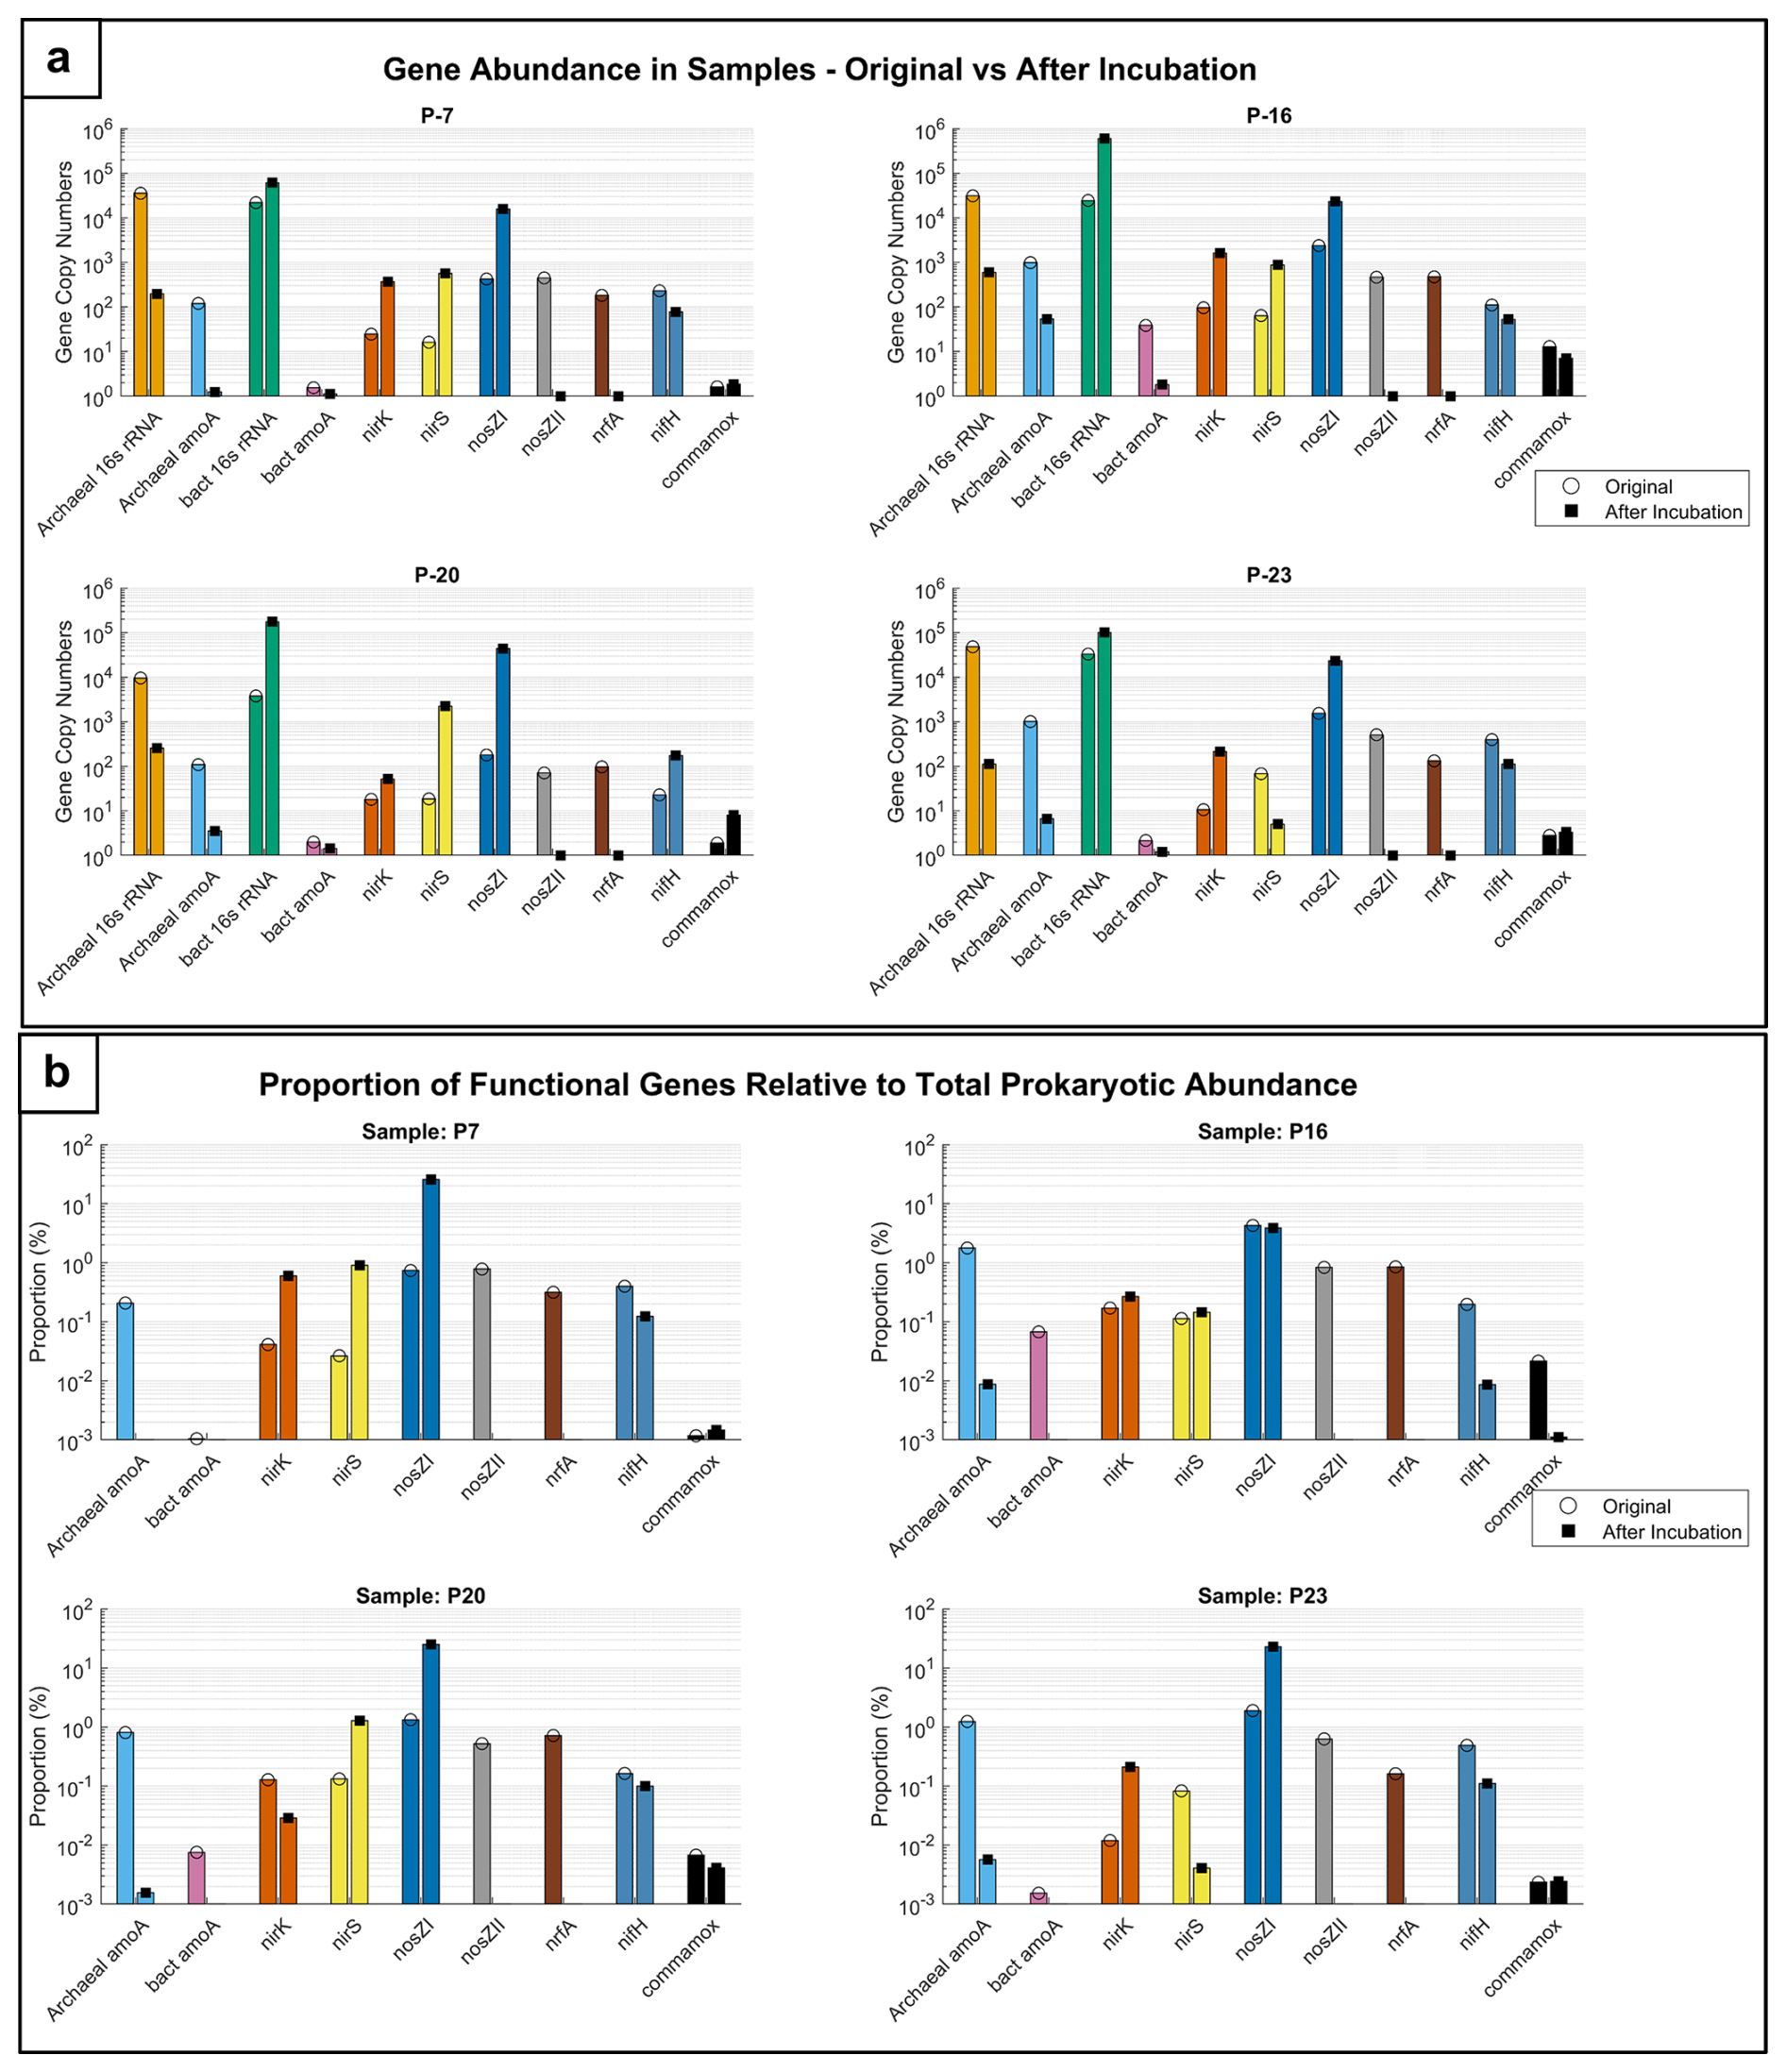
Figure 7Microbial functional gene dynamics in groundwater samples. (a) Comparison of gene abundance in groundwater samples and (b) functional gene proportions in samples before and after incubation.
The graphs (Fig. 7a and b) illustrate the abundance and proportions of key nitrogen cycle genes in groundwater samples (P-7, P-16, P-20, and P-23) before and after incubation. Panel a shows the relative abundance of genes involved in nitrification (archaeal amoA, bacterial amoA), denitrification (nirK, nirS, nosZI, nosZII), nitrogen fixation (nifH), and DNRA (nrfA), as well as complete nitrification (commamox) alongside microbial population markers (archaeal and bacterial 16s rRNA). Panel b presents the proportions of these functional genes relative to total prokaryotic abundance, highlighting their contributions to the microbial community structure.
4.1 Initial groundwater samples – N transformations occurring in field conditions
To identify N transformation processes occurring naturally in the aquifer, the isotope signatures of inorganic N (NO and NO) were compared with the literature-based reference data for denitrification (Fig. 3a) and nitrification (Fig. 3b).
4.1.1 Interplay of denitrification and nitrification processes
Figure 3a illustrates both the sources of nitrate and the processes that transformed it during the residence time in the aquifer. The isotope values indicate organic matter as the dominant nitrate source and the reductive trend for nitrate samples. However, the observed denitrification enrichment is relatively low, and the samples do not show typically high δ values (Fig. 3a). This indicates that the nitrate pool might be constantly renewed with fresh substrate of low δ values. This suggests active nitrification processes, supported by the gene abundances observed in field samples before incubation (Fig. 7), where the majority of gene copy numbers represent archaeal amoA, while denitrification gene occurrence is very low. Hence, we probably have intensive nitrate production by nitrification processes (Fig. 3b).
Both graphs (Fig. 3a and b) show the potentially occurring processes; it is important to review them jointly with the basic aquifer information and further microbial analyses and incubation studies. The physicochemical parameters for our aquifer present redox conditions theoretically allowing for the occurrence of both denitrification and nitrification processes (Wolters et al., 2022; Brettar et al., 2002). Archival field measurements indicated that the aquifer shows slightly suboxic conditions (Sect. 2.1). Oxygen concentrations in the range of less than 1 and up to 2 mg O2 L−1 are regarded as the boundary between nitrate-reducing and non-nitrate-reducing conditions in groundwater (Wolters et al., 2022). Hence, the range of dissolved oxygen content observed for the aquifer under study of 2.2–4.3 mg O2 L−1 is slightly higher, and denitrifying processes might be suppressed. The redox potential of 213–345 mV of our aquifer also lies on the edge of typical denitrifying conditions from 10–300 mV (Brettar et al., 2002). This suggests that reduction processes might occur but might also be accompanied by oxidation processes. Consequently, both conclusions drawn from Fig. 3a and b might be true simultaneously. While NO is being denitrified, it might be produced simultaneously both in autotrophic and in heterotrophic nitrification, which results in only small NO enrichment in heavy isotopes. Groundwater samples of dominant denitrification typically show much higher NO isotope signatures (Clague et al., 2019).
Similarly, the NO isotopic signature most likely shows a mixture of NO reduction and its formation due to nitrification in various proportions for different samples. There is one sample that has the highest δ18O and δ15N (Fig. 3b). This is the P-L2-1 piezometer, located closest to the lagoon used for yeast sewage storage, and the sample with the highest NH content (Table S1). In this sample, NO likely originates mostly from autotrophic nitrification via ammonium oxidation, as can be concluded from Fig. 3b.
Although the isotope signatures provide strong evidence for active denitrification and mixed nitrification pathways in the aquifer, it is important to acknowledge that these isotope-based interpretations of NO and NO transformations are based on single-time-point groundwater sampling in open aquifers. Therefore, processes such as water exchange, nutrient diffusion, and variations in nitrogen transformation may also influence the observed isotopic signatures and cause significant changes to them over time.
4.1.2 Actual N sources and transformations
The increased concentrations of both DON and NO in most piezometers suggest that organic nitrogen input may contribute to higher NO concentrations. Although direct groundwater flow paths were not explicitly studied, the spatial positioning of these wells to the lagoon, along with their elevated DON levels, supports the possibility of influence from wastewater discharge. The precise knowledge of the δ15N signature of the potential N substrates, i.e. of DON and wastewater, could further confirm the dominant source of the samples (Boumaiza et al., 2024).
Interestingly, NH content is very low in the piezometers that have high NO content (Table S1), indicating its rapid nitrification. The most likely explanation suggests microbial mineralization of DON to NH, with instantaneous rapid nitrification to NO under suboxic conditions. A few piezometers with elevated NH content show very low NO and NO contents, which may suggest that the nitrification processes are not active there. However, these waters were not selected for further incubation studies due to our focus on NO formation and the selection of NO-rich waters. Future studies should integrate groundwater level measurements and tracer-based studies to confirm the source connectivity between lagoons and piezometers, along with sampling of NH-rich, NO-poor locations, for better analysis of nitrogen transformation pathways.
4.2 Active N transformation processes during incubation
4.2.1 Inorganic nitrogen dynamic
The dynamic variations in inorganic N concentration and isotopic evolution of NO and NO during the laboratory incubation experiments (Fig. 4) across all incubated samples (P-7, P-16, P-20, and P-23) reflect active microbial transformations during the incubation period.
Phase I (pre-glucose addition): NO reduction and NO accumulation
Prior to glucose addition, the observed decrease in NO concentration, coupled with a parallel increase in δ18O and δ15N (Fig. 4), suggests intensive denitrification with preferential reduction in light isotopes, resulting in enrichment of the residual nitrate. According to Kendall et al. (2007) and Kendall and Aravena (2000), a parallel decrease in NO concentration and increase in δ15N–NO are typical of denitrification, which allows estimation of the nitrogen isotope enrichment factor and helps quantify microbial NO reduction. The apparent isotope effect, i.e. the difference between the initial and final (after 7 d) NO isotope signature, is from 20 ‰ to 33 ‰ for δ15N and from 12 ‰ to 18 ‰ for δ15O, giving an ratio from 0.45 to 0.83, which is a typical slope for heterotrophic denitrification (from 0.48 to 0.88) (Boumaiza et al., 2024; Clague et al., 2019).
During this first phase, the NO concentration clearly increases from near 0 to a few mg NO L−1, and δ15N values show a slight increase (Fig. 4). This shows that the elevated δ15N (due to low-level labelling) is only partially transferred to the NO pool. However, the low magnitude of this increase is rather surprising; i.e. δ15N does not approach the high δ15N values but increases only slightly. This indicates that the formed nitrite must partially originate from another 15N-depleted pool (unlabelled). Isotope-based calculations (Sect. 3.1.3) indicated that most of the NO produced during incubation did not originate from NO reduction but instead likely derived from an unlabelled nitrogen pool (80 % to 95 %, Table 1).
Since the NH contents are very low in all the samples, this unlabelled N source for NO production must originate from dissolved organic N (DON). This pathway is very plausible since the samples show high DON contents from 31 to 92 mg N L−1 (Table S2). The application of yeast-based sewage as a fertilizer in the agricultural site likely introduced organic nitrogen into the groundwater, which undergoes microbial decomposition to release ammonium (NH) through the mineralization of proteins and amino acids (Watanabe et al., 2023). However, NH contents were very low during all the incubations (Fig. 4), indicating its rapid transformation within the nitrogen cycle, such as nitrification and assimilation. Microbial assimilation likely contributed to NH exhaustion, as microbes utilized it for biomass synthesis. However, this is not the case for sterile samples, where we observe slight accumulation of NH, indicative of biological uptake in NH turnover.
Phase II (post-glucose addition): chemodenitrification and possible nitrification
In the second phase of the incubation, after glucose addition, further NO reduction was observed in all samples (Fig. 4a). However, despite this observed reduction, δ values stay quite stable, with much less isotope enrichment between days 7 and 14 of the incubation compared to the day 0–day 7 enrichment, both for δ15N and δ18O (Fig. 4b). Hence, here we do not observe the typical isotope enrichment characteristic of denitrification processes (Boumaiza et al., 2024).
However, the occurrence of intensive denitrification during the second incubation phase can be clearly proved with N2O data, which show high 15N content and δ15NSP and δ18O values typical of bacterial denitrification (Fig. 6). Moreover, the analysed gene abundances clearly indicate intensification of denitrification genes during the incubation (Fig. 7). However, despite the active denitrification process, the typical isotope enrichment of the residual NO is not observed. This might possibly indicate a significant additional contribution of other processes of nitrate reduction. Chemodenitrification can be considered, since this process is associated with no kinetic isotope effects for either δ15N or δ18O in the residual NO pool (Wang et al., 2022). This assumption can be reinforced with the sterile sample data, where the nitrate pool is also largely reduced (Fig. 4a) without any isotope effects (Fig. 4b). This indicates that the conditions in the studied groundwaters may support chemodenitrification.
Simultaneously, δ15N mostly decreases or increases only slightly, indicating that the transformations of unlabelled N sources are becoming even more active than in the first incubation phase, and there is nearly no detectable contribution of NO from NO reduction. However, the labelled 15N is present in the further denitrification product – N2O (Fig. 6) – hence it must have been transformed through NO as the first denitrification intermediate. This shows that this conversion takes place very rapidly, maybe even in the same microbial cell, and NO must be nearly completely converted to further denitrification products. This agrees with the fact that NO is a very reactive and short-living compound, and as a denitrification intermediate, it instantaneously undergoes further reduction (Lewicka-Szczebak et al., 2021).
Importantly, the common pool of NO, which does not show 15N enrichment, is mostly not converted to N2O. This is proven by the fact that δ15N values are very close to δ15N but much higher than δ15N during the second incubation phase. Hence, the NO newly formed in nitrification processes is not further reduced to N2O but is most probably rather further oxidized to NO. Since this process would add 15N-depleted NO, this can mask the 15N enrichment due to denitrification. In this second incubation phase, O isotope signatures of NO and NO mostly move towards each other, which indicates probably intensive reversible reactions of reduction and oxidation between these two compounds, which facilitates O–atom exchange with water. This agrees with the recent findings by Zheng et al. (2023), who indicated tighter cycling between these compounds, with particular emphasis on NO re-oxidation processes. The inconsistencies found in our data for 15N content in NO, NO, and N2O pools reinforce the assumption of separate NO pools for particular N transformation pathways (Müller et al., 2014; Rütting and Müller, 2008; Zhang et al., 2023). Although most of these previous studies apply for soils, it is apparently also true for groundwater N transformations.
NO production pathways: Phases I and II
Before the addition of glucose, the nitrite isotopic signatures (Fig. 5) were mostly associated with the heterotrophic nitrification zone, suggesting a mix of both autotrophic and heterotrophic pathways to nitrite production under low-carbon conditions. Some clustered points were also observed near the autotrophic nitrification area, indicating that autotrophic bacteria, such as Nitrosomonas europaea, were likely involved in conversion of ammonia (NH3) to nitrite (NO) as an energy-generating process (Deb et al., 2024). During this process, CO2 serves as the sole carbon source for these bacteria, assimilated into their biomass to support cellular growth, independent of the chemical reaction used for energy generation (Hommes et al., 2003). In the groundwater samples, CO2 likely originated from the decomposition of organic matter in the yeast sewage (Sect. 2.1) or from the carbonate system naturally present in groundwater (Sect. 3.1.1).
Following glucose addition, the nitrite isotopic signatures (Fig. 5) were more concentrated within the autotrophic nitrification zone, which indicates that autotrophic nitrification continued to dominate nitrite production despite being under elevated carbon conditions. While a shift towards heterotrophic nitrification might be expected under increased carbon availability, the isotope data suggest that autotrophic ammonia-oxidizing bacteria remained more metabolically active than the heterotrophs under the given incubation conditions. Together, these findings demonstrate the rapid transformation of NH from yeast-based fertilizers into intermediate nitrogen compounds, driving nitrification and subsequent nitrogen cycling processes in groundwater.
For most samples, NO shows a significant increase in δ18O values in the first phase (between day 0 and day 7), indicating that the major source of O must be molecular O2 with characteristically high δ18O of +23.5 ‰ (Moore et al., 2006), which is plausible in the suboxic atmosphere applied (up to 5 % in the headspace and 2.1 mg of dissolved oxygen, Table S2). Only for P-23 does the δ18O value stay stable. This sample shows the most intensive NO reduction due to denitrification, and the potential increase was most probably masked with O–atom exchange between water and denitrification intermediates (Lewicka-Szczebak et al., 2016).
4.2.2 Gene abundance shifts in microbial communities
The gene abundances before incubation indicate strong nitrification potential (Fig. 7). This is consistent with findings from Mosley et al. (2022), who reported that ammonia-oxidizing archaea (AOA) tend to dominate in oligotrophic groundwater environments with low ammonia concentrations due to their higher affinity for ammonia and oxygen limitation, often outnumbering ammonia-oxidizing bacteria (AOB). Similarly, the functional gene proportion analysis (Fig. 7b) highlights the contribution of archaeal amoA genes to total prokaryotic abundance, emphasizing their critical role in ammonia oxidation. In contrast, the low proportions of bacterial amoA further confirm limited bacterial involvement in N cycling prior to incubation. This has also been observed in groundwater systems where bacterial nitrification potential remains constrained due to environmental limitations on AOB populations.
The observed post-incubation shift towards increasing denitrification potential aligns with Wang et al. (2022), who found that site-specific environmental conditions, particularly carbon and N availability, drive microbial community shifts in N cycling, with increased denitrification gene abundance. Functional gene proportions also reveal a corresponding rise in the relative abundance of nosZI, illustrating the shift in the microbial community function towards denitrification processes (Fig. 7b). The abundance of DNRA and commamox genes showed minimal changes, suggesting no difference in the presence of these processes between pre- and post-incubation conditions. This observation is consistent with Broman et al. (2021), who reported that DNRA gene abundance remained stable under experimental conditions, indicating its potential resilience to shifts in the N cycling pathway.
These dynamic microbial changes indicate that specific environmental or experimental conditions during incubation can significantly influence certain microbial processes, particularly those related to N cycling. This is consistent with Wang et al. (2022), who found that N cycling gene abundance varies with environmental factors like carbon and N availability. Similarly, Mosley et al. (2022) reported persistent transcriptional activity in nitrification and denitrification across groundwater conditions, indicating microbial adaptability. The significant results for the community of nosZI and archaeal 16s rRNA highlight their potential roles in environmental monitoring and microbial ecology studies.
The observed variations across the piezometers after glucose addition were not uniform and can be attributed to site-specific conditions, such as initial nitrate concentrations, DON levels, and variation in microbial communities. Notably, nosZI gene abundance increased across all piezometers, with higher enrichment in P-16 and P-20, and suggests enhanced denitrification potential. Conversely, archaeal amoA gene abundance declined – particularly in P-7 and P-23 – indicating a microbial shift from archaeal-driven nitrification to bacterial denitrification. These patterns highlight how suboxic, carbon-rich conditions can selectively enhance denitrification, depending on environmental conditions.
4.2.3 N2O production pathways
Microbial N2O sources: Phases I and II
Thanks to the application of a low-level labelling strategy, the source isotopic signatures for N2O production pathways can clearly distinguish between nitrification processes, which utilize the non-labelled NH pool, and denitrification processes, which must result in δ15N enrichment due to 15N-enriched NO substrate (Fig. 6). We observe a significant contribution of nitrification processes in the first samples and very clear dominance of the bacterial denitrification in Phase II of the incubation (Fig. S1), both from the sample locations on the isotope maps (Fig. 6) and from the FRAME modelling results.
The FRAME analysis of N2O isotope data, t-test results, and gene abundance graphs together show a shift from nitrification to denitrification in microbes during incubation, influenced by the addition of a carbon source and suboxic conditions. Initially, the FRAME results show that nitrification, mainly due to the archaeal community (as seen with high levels of the archaeal amoA gene), is the dominant N2O production pathway. Isotope analysis supports this, with N2O isotope signatures characteristic of nitrification for the first samples (Figs. 6, S1). Pre-incubation data indicate that archaeal ammonia oxidation was a dominant process in samples P-7 and P-20, as evidenced by higher archaeal amoA gene abundance relative to denitrification-related genes. However, in samples such as P-16 and P-23, the abundance of nosZI suggests that denitrification processes were also active, pointing to a co-occurrence of nitrification and denitrification processes across the groundwater samples.
Post-incubation, FRAME results show an increase in bacterial denitrification (bD) fractions, correlating with the significant rise in denitrification-related genes, particularly nosZI, validated by paired t tests (p<0.05). These changes are confirmed by gene abundance graphs that show a notable increase in these denitrification genes after incubation. The total prokaryotic abundance also increased in P-16 and P-20, reflecting enhanced bacterial growth, whereas smaller changes in P-7 and P-23 suggest variable responses to carbon addition (Fig. 7). A decline in nitrification genes aligns with the FRAME-predicted reduction in nitrification activity. Additionally, isotopic data revealed significant N2O reduction to N2 in most samples, consistent with bacterial denitrification dominance; reduced contributions from nitrification pathways; and an increase in the abundance of genes responsible for N2O reduction to N2 (nosZII). Together, these results confirm microbial transition from archaeal-driven nitrification to bacterial denitrification, highlighting the role of carbon availability and suboxic conditions in regulating N cycling. The integration of gene abundance, isotope dynamics, and FRAME analysis provides a comprehensive understanding of the microbial processes driving N transformations during incubation.
All piezometers displayed a similar transition from nitrification-driven processes in the first samples to denitrification-dominated processes in the later incubation days. However, at the final sampling points, no fitted solution could be obtained for some data, suggesting the presence of unknown processes or a complex overlap of microbial pathways. These findings indicate very dynamic N2O production processes while highlighting limitations in resolving mixed nitrogen pathways at later stages.
Abiotic N2O contribution
While microbial denitrification was the primary N2O source, the observed discrepancies suggest that abiotic contributions, such as chemodenitrification, may have been a more relevant factor than initially expected, particularly under conditions favouring nitrite accumulation.
The absence of modelling results for the last samples (Fig. S2) may be due to the smaller actual O–isotope exchange with water than that assumed for bD in the model input values. The endmember values for bD are mostly determined based on soil experimental studies (Yu et al., 2020); hence it is theoretically possible that slightly different ranges of values could be assumed for groundwater studies. Another explanation could be a significant admixture of the chemodenitrification pathway, which is characterized by high δ18O values (Wei et al., 2019). This assumption can be supported by the fact that quite significant N2O production was found in some of the sterile samples, with especially high production at the end of the experiment (Table S2). This N2O produced from sterile treatments always shows high δ18O values and very variable δ15NSP values (Fig. 6a). This highlights the importance of considering abiotic N2O formation, especially under low-oxygen conditions. Similarly, previous studies have shown distinct isotope fractionation patterns for N2O production due to chemodenitrification, including elevated δ18O values compared to microbial pathways (Chen et al., 2021).
The detection of N2O in sterile samples points to a possible non-biological contribution, as nitrite can undergo chemical reduction in the absence of microbial activity (Heil et al., 2016). Furthermore, abiotic N2O formation has been linked to Fe(II)-mediated nitrite reduction, particularly under anoxic conditions, with organic matter, including humic and fulvic acids, potentially facilitating N2O production through chemical pathways (Zhu-Barker et al., 2015). However, since the presence of Fe(II) in our sterile samples is unknown, other abiotic mechanisms, such as organic matter interactions, cannot be ruled out.
Importantly, the FRAME model does not include chemodenitrification, which is most probably the reason for the biased results for the last samples. The discrepancies between modelled and observed isotope values (Fig. S2) suggest that additional abiotic pathways, such as chemodenitrification, may need to be considered in future isotope models to improve accuracy.
4.2.4 The identification of active N transformations in the laboratory incubations
The interpretation of the presented results is quite challenging, since this is the first study combining N and O isotope analyses of NO and NO with N2O isotopes, including three signatures: δ15N, δ18O, and δ15N. The overall summary of these data is rather surprising and may seem inconsistent because the low-level 15N label added to the NO pool is not found in the NO pool but is almost completely transferred to the N2O pool. Both the N2O isotope results and the gene copy numbers document the occurrence of intensive denitrification, especially in the second phase of the incubation, whereas the analyses of inorganic N indicate simultaneous intensive nitrification processes, with significant formation of NO. It is surprising due to very low levels of NH during the whole incubation and indicates that the additional unlabelled N must originate from organic nitrogen pool (DON), and the intermediately formed NH is rapidly further nitrified to NO and NO .
Importantly, the overall results show that both reduction and oxidation processes occur simultaneously in the studied aquifer. Theoretically, in our incubations the suboxic conditions should rather favour denitrification NO reduction. Indeed, the majority of the released N2O is formed due to bacterial denitrification from NO as a substrate. However, NO originates predominantly from organic N oxidation, with a very minor fraction originating from NO reduction. These results suggest that in groundwater systems impacted by agricultural or wastewater-derived organic matter, DON can significantly contribute to nitrite formation under suboxic conditions, alongside microbial denitrification, and influence nitrogen transformation pathways. To stimulate microbial denitrification under suboxic conditions, glucose was added as a carbon source. This approach is also supported by previous research (Liu et al., 2022), where external carbon addition significantly enhanced biological denitrification and nitrate removal efficiency in groundwater. This helps understand how elevated organic carbon (e.g. from wastewater or agricultural leachate) could influence N transformations in the field. In our study, the observed shift from archaeal-driven nitrification to bacterial denitrification highlights the role of carbon availability in nitrogen cycling pathways. While lab incubations cannot fully mimic the complex field-scale conditions, they provide insights into microbially mediated processes. Future in situ studies incorporating natural carbon amendments would help validate these findings under real, open-system aquifer conditions.
4.2.5 Comparability of laboratory incubation and field groundwater studies
Laboratory incubation studies are typically conducted under controlled, closed-system conditions for detailed investigation of specific nitrogen transformation pathways and to quantify isotopic and microbial changes without external mass exchange. However, applying the results to natural groundwater systems – which may often have variable flow, recharge, and complex structures – requires careful evaluation. Nevertheless, closed-system assumptions are often applied to simplify case studies.
Several field studies have explored how flow and mixing processes play an important role in nitrogen cycling in aquifers. For example, Well et al. (2010) examined N2O isotopologue signatures (δ15N, δ18O, and δ15NSP) in a sandy aquifer and observed near-complete N2O reduction to N2, attributing this to slow diffusion and limited N2O escape in saturated groundwater – resulting in isotopic signatures comparable to those seen in closed-system incubations. Similarly, Weymann et al. (2008) observed N2 and N2O accumulation in nitrate-contaminated groundwater and studied changes in gas concentrations to estimate nitrate loss. Their mass balance calculations involved accumulation of gaseous denitrification products, assuming limited external exchange with surrounding water – effectively reflecting a closed-system structure in specific aquifers.
Further, Mander et al. (2014) applied isotopologue ratio analysis (δ15N, δ18O, and δ15NSP) to evaluate denitrification in riparian alder forest aquifers. Their study reported denitrification as the dominant nitrogen removal pathway and demonstrated substantial accumulation of N2 and N2O in water-saturated, low-oxygen zones. Although not explicitly studied as a closed system, the mass balance methodology assumed limited mixing and dilution during transformation processes. In another study, Well et al. (2012) applied a closed-system nitrogen balance to estimate N2O emissions. While the approach was based on the stoichiometric balance of nitrogen species to evaluate denitrification extent, the findings also indicated that recharge and groundwater mixing contributed to isotopic and concentration variability – indicating that natural groundwater systems are only partly closed.
Collectively, these studies suggest that while certain aquifer zones – with low permeability or strong redox gradients – may exhibit reduction-dominated closed-system behaviour, most groundwaters are not completely closed and are affected by water flow, mixing, and recharge. In our study, the use of low-level 15N labelling in a closed, suboxic incubation system enabled detailed analysis of nitrate reduction pathways in groundwater systems. However, real aquifer conditions – particularly affected by wastewater inputs or organic carbon – are more complex and may involve complex mixing and transport processes, which can affect nitrogen transformation products. Therefore, even though closed-system lab incubations are useful for elucidating microbial nitrogen processes, their results should be supported by field measurements or transport models that better reflect the open and variable nature of groundwater systems.
This study demonstrates the intricate dynamics of N transformations in groundwater samples by integrating isotope analyses, microbial gene abundance, and FRAME modelling to elucidate the microbial mechanisms involved. The application of multi-compound isotope studies (NO, NO, N2O), combined with the novel idea of low-level 15N labelling and microbiome studies, provides very detailed insights into the occurring processes and reveals some unexpected mechanisms. Based on this complex dataset, we can document the co-occurrence of the oxidation and reduction pathways and the existence of different, separated NO pools. NO production is likely driven by nitrification processes linked to the oxidation of organic N from the elevated DON levels in water samples. Moreover, the data indicated the simultaneous occurrence of denitrification processes, particularly under suboxic conditions induced during incubation, highlighting the dynamic nature of nitrogen cycling.
Isotope-based source partitioning in this study assumes a closed-system approach. However, natural groundwater environments may often exhibit open-system behaviour due to water movement, nutrient inflow, and microbial activity, and therefore, the estimated source contributions – especially based on isotope mass balances and FRAME modelling – are more representative of controlled laboratory conditions. Although tracer application and microbial data helped minimize uncertainties from concurrent processes such as DON oxidation and oxygen exchange, certain limitations still apply and require future field applications to validate closed-system approaches under varying conditions.
Future investigations into the role of DON could deepen our understanding of its impact on nitrification and denitrification in waters. While this study focused on samples with elevated NO and/or DON concentrations to investigate nitrogen transformation processes, samples with higher NH concentrations were not included in the incubation experiments as they typically showed low NO levels below the detection limit of isotope analyses. As such, the role of NH in NO formation under such conditions could not be evaluated in detail and requires further research. Broader application of these integrated methods combining isotope analyses and microbial gene studies in field-scale studies can improve monitoring and management of nitrogen pollution in groundwater systems.
Original data are available in the Zenodo repository files (https://doi.org/10.5281/zenodo.15076761, Lewicka-Szczebak and Deb, 2025). Material necessary for this study's findings is presented in the paper and in the Supplement.
The supplement related to this article is available online at https://doi.org/10.5194/bg-22-5535-2025-supplement.
The conceptualization was led by SD, with supervision from DLS and ME. The figures and plots were prepared by SD and DLS. Microbiological analyses were conducted by SD and ME. SD, DLS, ME, and RW contributed to the methodology, investigation, data curation, and writing. Fieldwork and sample collection were carried out by SD, DLS, MB, and MJ. Funding acquisition and resources were supported by SD, DLS, ME, UM, and MOJ. Gas and isotope analyses were performed by SD, DLS, and RW. All co-authors contributed valuable support and feedback.
The contact author has declared that none of the authors has any competing interests.
Publisher's note: Copernicus Publications remains neutral with regard to jurisdictional claims made in the text, published maps, institutional affiliations, or any other geographical representation in this paper. While Copernicus Publications makes every effort to include appropriate place names, the final responsibility lies with the authors. Views expressed in the text are those of the authors and do not necessarily reflect the views of the publisher.
Many thanks are due to the team of Environmental Department of the Lesaffre Polska S.A, Wołczyn – Bartłomiej Karamon, Natalia Kopaniecka, and Wiktor Okereke – for access to the water monitoring wells, assistance in planning and conducting field sampling campaigns, and sharing the water quality monitoring data.
This research has been financially supported by the “Polish Returns” programme of the Polish National Agency of Academic Exchange and the grants Opus-2021/41/B/ST10/01045 (PI: Dominika Lewicka-Szczebak) and Preludium-2021/41/N/ST10/01839 (PI: Sushmita Deb) of the National Science Centre Poland. The study was also supported by the Estonian Research Council (PRG2032), the European Union's Horizon programme under grant agreement no. 101079192 (MLTOM23003R), and the European Research Council (ERC) under grant agreement no. 101096403 (MLTOM23415R).
This paper was edited by Mark Lever and reviewed by two anonymous referees.
Böhlke, J. K., Smith, R. L., and Hannon, J. E.: Isotopic analysis of N and O in nitrite and nitrate by sequential selective bacterial reduction to N2O, Anal. Chem., 79, 5888–5895, https://doi.org/10.1021/ac070176k, 2007.
Boumaiza, L., Stotler, R. L., Mayer, B., Matiatos, I., Sacchi, E., Otero, N., Johannesson, K. H., Huneau, F., Chesnaux, R., Blarasin, M., Re, V., and Knöller, K.: How the δ18O–NO3 versus δ15N–NO3 plot can be used to identify a typical expected isotopic range of denitrification for NO3-impacted groundwaters, ACS ES&T Water, 4, 5243–5254, https://doi.org/10.1021/acsestwater.4c00796, 2024.
Brettar, I., Sanchez-Perez, J.-M., and Trémolières, M.: Nitrate elimination by denitrification in hardwood forest soils of the Upper Rhine floodplain – correlation with redox potential and organic matter, Hydrobiologia, 469, 11–21, https://doi.org/10.1023/A:1015527611350, 2002.
Broman, E., Zilius, M., Samuiloviene, A., Vybernaite-Lubiene, I., Politi, T., Klawonn, I., Voss, M., Nascimento, F. J. A., and Bonaglia, S.: Active DNRA and denitrification in oxic hypereutrophic waters, Water Res., 194, 116954, https://doi.org/10.1016/j.watres.2021.116954, 2021.
Bucha, M., Lewicka-Szczebak, D., and Wójtowicz, P.: Simultaneous measurement of greenhouse gases (CH4, CO2 and N2O) at atmospheric levels using a gas chromatography system, Atmos. Meas. Tech., 18, 897–908, https://doi.org/10.5194/amt-18-897-2025, 2025.
Buchen-Tschiskale, C., Well, R., and Flessa, H.: Tracing nitrogen transformations during spring development of winter wheat induced by 15N labeled cattle slurry applied with different techniques, Sci. Total Environ., 871, 162061, https://doi.org/10.1016/j.scitotenv.2023.162061, 2023.
Butterbach-Bahl, K., Baggs, E. M., Dannenmann, M., Kiese, R., and Zechmeister-Boltenstern, S.: Nitrous oxide emissions from soils: how well do we understand the processes and their controls?, Philos. T. R. Soc. B, 368, 20130122, https://doi.org/10.1098/rstb.2013.0122, 2013.
Chen, G., Zhao, W., Yang, Y., Chen, D., Wang, Y., Li, F., Zhao, Z., Cao, F., and Liu, T.: Chemodenitrification by Fe(II) and nitrite: effects of temperature and dual N–O isotope fractionation, Chem. Geol., 575, 120258, https://doi.org/10.1016/j.chemgeo.2021.120258, 2021.
Clague, J. C., Stenger, R., and Morgenstern, U.: The influence of unsaturated zone drainage status on denitrification and the redox succession in shallow groundwater, Sci. Total Environ., 660, 1232–1244, https://doi.org/10.1016/j.scitotenv.2018.12.383, 2019.
Cui, Y.-X., Biswal, B. K., Guo, G., Deng, Y.-F., Huang, H., Chen, G.-H., and Wu, D.: Biological nitrogen removal from wastewater using sulphur-driven autotrophic denitrification, Appl. Microbiol. Biotechnol., 103, 6023–6039, https://doi.org/10.1007/s00253-019-09935-4, 2019.
Deb, S. and Lewicka-Szczebak, D.: Comprehensive protocol for isotopic analysis of mineral nitrogen forms using bacterial denitrification techniques W: [Pikomolowe puzzle funkcjonowania Wszechświata – Hołd dla Stanisława Hałasa i trzydziestolecie Pracowni Geologii Izotopowej i Geoekologii], Red. Mariusz O. Jędrysek, Wyd. Uniwersytetu Wrocławskiego i Wyd. “Szermierz” sp. zo.o., Acta Universitas Wratislaviensis No 4238, str. 205-212, Wrocław, ISBN 978-83-229-3888-1, 2024.
Deb, S. and Lewicka-Szczebak, D.: Simplified bacterial denitrification method using Stenotrophomonas nitritireducens for nitrite dual isotope analysis in low-concentration environmental samples, Frontiers in Environ. Sci., 13, 1536882, https://doi.org/10.3389/fenvs.2025.1536882, 2025.
Deb, S., Lewicka-Szczebak, D., and Rohe, L.: Microbial nitrogen transformations tracked by natural abundance isotope studies and microbiological methods: a review, Sci. Total Environ., 926, 172073, https://doi.org/10.1016/j.scitotenv.2024.172073, 2024.
Denk, T. R. A., Mohn, J., Decock, C., Lewicka-Szczebak, D., Harris, E., Butterbach-Bahl, K., Kiese, R., and Wolf, B.: The nitrogen cycle: a review of isotope effects and isotope modeling approaches, Soil Biol. Biochem., 105, 121–137, https://doi.org/10.1016/j.soilbio.2016.11.015, 2017.
Ding, B., Li, Z., Cai, M., Lu, M., and Liu, W.: Feammox is more important than anammox in anaerobic ammonium loss in farmland soils around Lake Taihu, China, Chemosphere, 305, 135412, https://doi.org/10.1016/j.chemosphere.2022.135412, 2022.
Einsiedl, F., Wunderlich, A., Sebilo, M., Coskun, Ö. K., Orsi, W. D., and Mayer, B.: Biogeochemical evidence of anaerobic methane oxidation and anaerobic ammonium oxidation in a stratified lake using stable isotopes, Biogeosciences, 17, 5149–5161, https://doi.org/10.5194/bg-17-5149-2020, 2020.
Espenberg, M., Pille, K., Yang, B., Maddison, M., Abdalla, M., Smith, P., Li, X., Chan, P.-L., and Mander, Ü.: Towards an integrated view on microbial CH4, N2O and N2 cycles in brackish coastal marsh soils: a comparative analysis of two sites, Sci. Total Environ., 918, 170641, https://doi.org/10.1016/j.scitotenv.2024.170641, 2024.
Espenberg, M., Truu, M., Mander, Ü., Kasak, K., Nõlvak, H., Ligi, T., Oopkaup, K., Maddison, M., and Truu, J.: Differences in microbial community structure and nitrogen cycling in natural and drained tropical peatland soils, Sci. Rep., 8, 4742, https://doi.org/10.1038/s41598-018-23032-y, 2018.
Harris, S. J., Liisberg, J., Xia, L., Wei, J., Zeyer, K., Yu, L., Barthel, M., Wolf, B., Kelly, B. F. J., Cendón, D. I., Blunier, T., Six, J., and Mohn, J.: N2O isotopocule measurements using laser spectroscopy: analyzer characterization and intercomparison, Atmos. Meas. Tech., 13, 2797–2831, https://doi.org/10.5194/amt-13-2797-2020, 2020.
Heil, J., Vereecken, H., and Brüggemann, N.: A review of chemical reactions of nitrification intermediates and their role in nitrogen cycling and nitrogen trace gas formation in soil, Eur. J. Soil Sci., 67, 23–39, https://doi.org/10.1111/ejss.12306, 2016.
Hommes, N. G., Sayavedra-Soto, L. A., and Arp, D. J.: Chemolithoorganotrophic growth of Nitrosomonas europaea on fructose, J. Bacteriol., 185, 6809–6814, https://doi.org/10.1128/JB.185.23.6809-6814.2003, 2003.
Hu, J., Tian, J., Deng, X., Liu, X., Zhou, F., Yu, J., Chi, R., and Xiao, C.: Heterotrophic nitrification processes driven by glucose and sodium acetate: new insights into microbial communities, functional genes and nitrogen metabolism from metagenomics and metabolomics, Bioresour. Technol., 408, 131226, https://doi.org/10.1016/j.biortech.2024.131226, 2024.
Kendall, C. and Aravena, R.: Nitrate isotopes in groundwater systems, in: Environmental Tracers in Subsurface Hydrology, Springer US, Boston, MA, 261–297, https://doi.org/10.1007/978-1-4615-4557-6_9, 2000.
Kendall, C., Elliott, E. M., and Wankel, S. D.: Tracing anthropogenic inputs of nitrogen to ecosystems, in: Stable Isotopes in Ecology and Environmental Science, Wiley, 375–449, https://doi.org/10.1002/9780470691854.ch12, 2007.
Kuusemets, L., Mander, Ü., Escuer-Gatius, J., Astover, A., Kauer, K., Soosaar, K., and Espenberg, M.: Interactions of fertilisation and crop productivity on soil nitrogen cycle microbiome and gas emissions, EGUsphere [preprint], https://doi.org/10.5194/egusphere-2024-593, 2024.
Levy-Booth, D. J., Prescott, C. E., and Grayston, S. J.: Microbial functional genes involved in nitrogen fixation, nitrification and denitrification in forest ecosystems, Soil Biol. Biochem., 75, 11–25, https://doi.org/10.1016/j.soilbio.2014.03.021, 2014.
Lewicki, M. P.: Software: Isotopes fractionation and mixing FRAME, GitHub [code], https://malewick.github.io/frame/, last access: 15 January 2025.
Lewicka-Szczebak, D. and Deb, S.: Dataset: Enhanced isotopic approach combined with microbiological analyses for more precise distinction of various N transformation processes in contaminated aquifer – a groundwater incubation study, Zenodo [data set], https://doi.org/10.5281/zenodo.15076761, 2025.
Lewicka-Szczebak, D., Dyckmans, J., Kaiser, J., Marca, A., Augustin, J., and Well, R.: Oxygen isotope fractionation during N2O production by soil denitrification, Biogeosciences, 13, 1129–1144, https://doi.org/10.5194/bg-13-1129-2016, 2016.
Lewicka-Szczebak, D., Lewicki, M. P., and Well, R.: N2O isotope approaches for source partitioning of N2O production and estimation of N2O reduction – validation with the 15N gas-flux method in laboratory and field studies, Biogeosciences, 17, 5513–5537, https://doi.org/10.5194/bg-17-5513-2020, 2020.
Lewicka-Szczebak, D., Jansen-Willems, A., Müller, C., Dyckmans, J., and Well, R.: Nitrite isotope characteristics and associated soil N transformations, Sci. Rep., 11, 5008, https://doi.org/10.1038/s41598-021-83786-w, 2021.
Lewicki, M. P., Lewicka-Szczebak, D., and Skrzypek, G.: FRAME – Monte Carlo model for evaluation of the stable isotope mixing and fractionation, PLoS One, 17, e0277204, https://doi.org/10.1371/journal.pone.0277204, 2022.
Liu, R., Xia, L., Liu, M., Gao, Z., Feng, J., You, H., Qu, W., Xing, T., Wang, J., and Zhao, Y.: Influence of the carbon source concentration on the nitrate removal rate in groundwater, Environ. Technol.-UK, 43, 3355–3365, https://doi.org/10.1080/09593330.2021.1921053, 2022.
Sainju, U. M., Ghimire, R., and Pradhan, G. P.: Nitrogen fertilization I: impact on crop, soil, and environment, in: Nitrogen Fixation, IntechOpen, https://doi.org/10.5772/intechopen.86028, 2020.
Mander, Ü., Well, R., Weymann, D., Soosaar, K., Maddison, M., Kanal, A., Lõhmus, K., Truu, J., Augustin, J., and Tournebize, J.: Isotopologue ratios of N2O and N2 measurements underpin the importance of denitrification in differently N-loaded riparian alder forests, Environ. Sci. Technol., 48, 11910–11918, https://doi.org/10.1021/es501727h, 2014.
Masta, M., Espenberg, M., Kuusemets, L., Pärn, J., Thayamkottu, S., Sepp, H., Kirsimäe, K., Sgouridis, F., Kasak, K., Soosaar, K., and Mander, Ü.: 15N tracers and microbial analyses reveal in situ N2O sources in contrasting water regimes of a drained peatland forest, Pedosphere, 34, 749–758, https://doi.org/10.1016/j.pedsph.2023.06.006, 2024.
Mohn, J., Wolf, B., Toyoda, S., Lin, C. T., Liang, M. C., Brüggemann, N., Wissel, H., Steiker, A. E., Dyckmans, J., Szwec, L., Ostrom, N. E., Casciotti, K. L., Forbes, M., Giesemann, A., Well, R., Doucett, R. R., Yarnes, C. T., Ridley, A. R., Kaiser, J., and Yoshida, N.: Interlaboratory assessment of nitrous oxide isotopomer analysis by isotope ratio mass spectrometry and laser spectroscopy: current status and perspectives, Rapid Commun. Mass Spectrom., 28, 1995–2007, https://doi.org/10.1002/rcm.6982, 2014.
Moore, K. B., Ekwurzel, B., Esser, B. K., Hudson, G. B., and Moran, J. E.: Sources of groundwater nitrate revealed using residence time and isotope methods, Appl. Geochem., 21, 1016–1029, https://doi.org/10.1016/j.apgeochem.2006.03.008, 2006.
Mosley, O. E., Gios, E., Close, M., Weaver, L., Daughney, C., and Handley, K. M.: Nitrogen cycling and microbial cooperation in the terrestrial subsurface, ISME J., 16, 2561–2573, https://doi.org/10.1038/s41396-022-01300-0, 2022.
Müller, C., Stevens, R. J., and Laughlin, R. J.: A 15N tracing model to analyse N transformations in old grassland soil, Soil Biol. Biochem., 36, 619–632, https://doi.org/10.1016/j.soilbio.2003.12.006, 2004.
Müller, C., Laughlin, R. J., Spott, O., and Rütting, T.: Quantification of N2O emission pathways via a 15N tracing model, Soil Biol. Biochem., 72, 44–54, https://doi.org/10.1016/j.soilbio.2014.01.013, 2014.
Nikolenko, O., Jurado, A., Borges, A. V., Knöller, K., and Brouyère, S.: Isotopic composition of nitrogen species in groundwater under agricultural areas: a review, Sci. Total Environ., 621, 141–153, https://doi.org/10.1016/j.scitotenv.2017.10.086, 2018.
Olichwer, T., Wcisło, M., Staśko, S., Buczyński, S., Modelska, M., and Tarka, R.: Numerical model of the catchments of the Oziąbel and Wołczyński Strumień rivers – Wołczyn municipality, Stud. Geotech. Mech., 34, 43–54, 2012.
Rohe, L., Oppermann, T., Well, R., and Horn, M. A.: Nitrite induced transcription of p450nor during denitrification by Fusarium oxysporum correlates with the production of N2O with a high 15N site preference, Soil Biol. Biochem., 151, 108043, https://doi.org/10.1016/j.soilbio.2020.108043, 2020.
Rütting, T. and Müller, C.: Process-specific analysis of nitrite dynamics in a permanent grassland soil by using a Monte Carlo sampling technique, Eur. J. Soil Sci., 59, 208–215, https://doi.org/10.1111/j.1365-2389.2007.00976.x, 2008.
Rütting, T., Aronsson, H., and Delin, S.: Efficient use of nitrogen in agriculture, Nutr. Cycl. Agroecosyst., 110, 1–15, https://doi.org/10.1007/s10705-017-9900-8, 2018.
Sigman, D. M., Casciotti, K. L., Andreani, M., Barford, C., Galanter, M., and Böhlke, J. K.: A bacterial method for the nitrogen isotopic analysis of nitrate in seawater and freshwater, Anal. Chem., 73, 4145–4153, https://doi.org/10.1021/ac010088e, 2001.
Stock, P., Roder, S., and Burghardt, D.: Further optimisation of the denitrifier method for the rapid 15N and 18O analysis of nitrate in natural water samples, Rapid Commun. in Mass Spectrom., 35, e88931, https://doi.org/10.1002/rcm.8931, 2020.
Wang, P., Li, J. L., Luo, X. Q., Ahmad, M., Duan, L., Yin, L. Z., Fang, B. Z., Li, S. H., Yang, Y., Jiang, L., and Li, W. J.: Biogeographical distributions of nitrogen-cycling functional genes in a subtropical estuary, Funct. Ecol., 36, 187–201, https://doi.org/10.1111/1365-2435.13949, 2022.
Wang, X., Wells, N. S., Xiao, W., Hamilton, J. L., Jones, A. M., and Collins, R. N.: Mackinawite (FeS) chemodenitrification of nitrate (NO) under acidic to neutral pH conditions and its stable N and O isotope dynamics, ACS Earth Space Chem., 6, 2801–2811, https://doi.org/10.1021/acsearthspacechem.2c00158, 2022.
Ward, M. H., Jones, R. R., Brender, J. D., De Kok, T. M., Weyer, P. J., Nolan, B. T., Villanueva, C. M., and Van Breda, S. G.: Drinking water nitrate and human health: an updated review, Int. J. Environ. Res. Public Health, 15, 1557, https://doi.org/10.3390/ijerph15071557, 2018.
Watanabe, Y., Aoki, W., and Ueda, M.: Ammonia production using bacteria and yeast toward a sustainable society, Bioengineering, 10, 82, https://doi.org/10.3390/bioengineering10010082, 2023.
Wei, J., Ibraim, E., Brüggemann, N., Vereecken, H., and Mohn, J.: First real-time isotopic characterisation of N2O from chemodenitrification, Geochim. Cosmochim. Ac., 267, 17–32, https://doi.org/10.1016/j.gca.2019.09.018, 2019.
Well, R., Weymann, D., Kahle, P., Maddison, M., Mander, Ü., Soosaar, K., and Flessa, H.: Isotopologue signatures of N2O from groundwater, tile drainage water, riparian wetlands and waste water treatment wetlands, Geophys. Res. Abstr., 12, EGU2010-11601, 2010.
Well, R., Eschenbach, W., Flessa, H., von der Heide, C., and Weymann, D.: Are dual isotope and isotopomer ratios of N2O useful indicators for N2O turnover during denitrification in nitrate-contaminated aquifers?, Geochim. Cosmochim. Acta, 90, 265–282, https://doi.org/10.1016/j.gca.2012.04.045, 2012.
Well, R., Burkart, S., Giesemann, A., Grosz, B., Köster, J. R., and Lewicka-Szczebak, D.: Improvement of the 15N gas flux method for in situ measurement of soil denitrification and its product stoichiometry, Rapid Commun. Mass Spectrom., 33, 437–448, https://doi.org/10.1002/rcm.8363, 2019.
Well, R., Buchen-Tschiskale, C., Burbank, J., Dannenmann, M., Lewicka-Szczebak, D., Mohn, J., Rohe, L., Scheer, C., Tuzzeo, S., and Wolf, B.: Production of standard gases for routine calibration of stable isotope ratios of N2 and N2O , EGU General Assembly 2024, Vienna, Austria, 14–19 Apr 2024, EGU24-11996, https://doi.org/10.5194/egusphere-egu24-11996, 2024.
Weymann, D., Well, R., Flessa, H., von der Heide, C., Deurer, M., Meyer, K., Konrad, C., and Walther, W.: Groundwater N2O emission factors of nitrate-contaminated aquifers as derived from denitrification progress and N2O accumulation, Biogeosciences, 5, 1215–1226, https://doi.org/10.5194/bg-5-1215-2008, 2008.
Wolters, T., Bach, T., Eisele, M., Eschenbach, W., Kunkel, R., McNamara, I., Well, R., and Wendland, F.: The derivation of denitrification conditions in groundwater: Combined method approach and application for Germany, Ecol. Indic., 144, 109564, https://doi.org/10.1016/j.ecolind.2022.109564, 2022.
Yu, L., Harris, E., Lewicka-Szczebak, D., Barthel, M., Blomberg, M. R. A., Harris, S. J., Johnson, M. S., Lehmann, M. F., Liisberg, J., Müller, C., Ostrom, N. E., Six, J., Toyoda, S., Yoshida, N., and Mohn, J.: What can we learn from N2O isotope data? – Analytics, processes and modelling, Rapid Commun. Mass Spectrom., 34, e8858, https://doi.org/10.1002/rcm.8858, 2020.
Zhang, Y., Cai, Z., Zhang, J., and Müller, C.: The controlling factors and the role of soil heterotrophic nitrification from a global review, Appl. Soil Ecol., 182, 104698, https://doi.org/10.1016/j.apsoil.2022.104698, 2023.
Zheng, J., Fujii, K., Koba, K., Wanek, W., Müller, C., Jansen-Willems, A. B., Nakajima, Y., Wagai, R., and Canarini, A.: Revisiting process-based simulations of soil nitrite dynamics: Tighter cycling between nitrite and nitrate than considered previously, Soil Biol. Biochem., 178, 108958, https://doi.org/10.1016/j.soilbio.2023.108958, 2023.
Zhu-Barker, X., Cavazos, A. R., Ostrom, N. E., Horwath, W. R., and Glass, J. B.: The importance of abiotic reactions for nitrous oxide production, Biogeochemistry, 126, 251–267, https://doi.org/10.1007/s10533-015-0166-4, 2015.