the Creative Commons Attribution 4.0 License.
the Creative Commons Attribution 4.0 License.
 | 15 Oct 2025
Reviews and syntheses: Potential and limitations of oceanic carbon dioxide storage via reactor-based accelerated weathering of limestone
Filip J. R. Meysman
Sebastiaan J. van de Velde
To achieve climate stabilization, substantial emission reductions are needed. Emissions from industrial point sources can be reduced by applying CO2 emission mitigation methods, which capture carbon dioxide (CO2) before it is released to the atmosphere. Accelerated weathering of limestone (AWL) is such a CO2 emission mitigation approach, in which calcium carbonate (CaCO3) is dissolved and CO2 is stored as dissolved inorganic carbon in the ocean. At present, AWL technology remains at the pilot scale with no industrial implementation. Here, we review the proposed reactor designs for AWL, comparing them in terms of CO2 uptake efficiency, CaCO3 dissolution efficiency, CO2 sequestration efficiency, and water usage. For this, we represent AWL as a four-step process: (i) CO2 uptake, (ii) CaCO3 dissolution, (iii) alkalinization, and lastly (iv) re-equilibration. AWL application is generally characterized by a large water usage and the need for large reactor sizes. Unbuffered AWL approaches show substantial degassing of CO2 back to the atmosphere after the process water is discharged. Buffered AWL approaches compensate the unreacted CO2 by Ca(OH)2 addition, which prevents degassing and hence substantially increases the CO2 sequestration efficiency. Critically however, buffered AWL requires a source of CO2-neutral Ca(OH)2, which is conventionally produced by calcination causing substantial CO2 emissions. The need for process water can be reduced by increasing the CO2 fraction of the gas stream or increasing its pressure. Further optimization of the size distribution of pulverized CaCO3 particles could reduce the amount of Ca(OH)2 needed to buffer the unreacted CO2. The anticipated CO2 sequestration efficiency of buffered AWL is comparable with that projected for large-scale carbon capture and storage (CCS) in geological reservoirs.
- Article
(1455 KB) - Full-text XML
- BibTeX
- EndNote


Atmospheric CO2 levels have increased by ∼ 50 % compared to preindustrial times and are higher than any period in the past 2 million years (Calvin et al., 2023). The 2015 Paris climate agreement aims to prevent global temperatures from rising more than 2 °C compared to preindustrial levels (Sanderson et al., 2016). To this end, climate policies are focused on the reduction of greenhouse gas (GHG) emissions, combining a reduced usage of fossil fuels with the development of CO2 emission mitigation technologies, which capture carbon dioxide (CO2) before it is released to the atmosphere. To provide a timely and meaningful contribution to climate mitigation, these CO2 emission mitigation technologies need to be implemented at the gigatonne scale within the next decade, which requires a strong acceleration of their development (United Nations Environment Programme, 2024).
Industrial point-source CO2 emissions from waste gas streams can be mitigated by geochemical-based processes in which CO2 is reacted with solid carbonate or silicate rocks in the presence of water, which aims to enhance the natural weathering process of carbonate and silicate rocks (Rau and Caldeira, 1999; Renforth and Kruger, 2013; Caserini et al., 2021). This targeted weathering process can take place in situ, in which CO2 is first captured from the flue gas and then injected into suitable silicate rock formations (basalts and ultramafic rocks). The CO2 is then trapped by a carbonation reaction with the ambient silicate rock, thus ensuring a permanent, geological storage (Matter and Kelemen, 2009; Romanov et al., 2015; Gadikota, 2021; Cao et al., 2024). However, there are certain geomechanical risks associated with geological storage of CO2, such as CO2 leakage, induced seismicity, the loss of well integrity, and surface uplift (Song et al., 2023). Moreover, suitable rock formations for storage are not always in close proximity to the CO2-emitting installations, thus requiring compression/liquefaction and transport of CO2.
Alternatively, the chemical weathering can also be executed under controlled conditions in a land-based reactor, close to the industrial point source. Mitigation of CO2 emissions via such reactor-based methods can follow two main approaches, depending on whether silicates are used as feedstock material (usually referred to a “ex situ mineral carbonation” technologies; Romanov et al., 2015; Gadikota, 2021, or “mineralization”; Campbell et al., 2022) or whether carbonates are used as weathering substrates (referred to a as “accelerated weathering of limestone”; Rau and Caldeira, 1999). In ex situ mineral carbonation (ESMC), a finely ground silicate mineral (e.g. olivine Mg2SiO4) is fed into a reactor, where it reacts at elevated temperature and pressure with CO2 from a flue gas to eventually form stable carbonates (e.g. magnesite MgCO3) – see recent reviews (Snæbjörnsdóttir et al., 2020; Veetil and Hitch, 2020; Thonemann et al., 2022). Alternatively, during the accelerated weathering of limestone (AWL), CO2 is stripped from the flue gas using a mixture of seawater and limestone (Rau and Caldeira, 1999; Renforth and Henderson, 2017), and the resulting effluent is discharged into the sea.
The main difference between the two approaches is that ESMC stores CO2 in a mineral form, whereas AWL stores CO2 in dissolved form in the ocean. As such, AWL bears similarities with so-called ocean alkalinization approaches, which target the deliberate removal of CO2 directly from the atmosphere, by increasing the alkalinity (AT) of the surface ocean (Kheshgi, 1995; Meysman and Montserrat, 2017; Renforth and Henderson, 2017). The natural weathering of silicate and carbonate rocks generates AT (Berner and Berner, 2004), which is defined as the excess of base (proton acceptors) over acid (proton donors) (Dickson, 1981; Zeebe and Wolf-Gladrow, 2001). Increasing the AT content of the surface waters shifts the carbonate equilibrium away from dissolved CO2 towards bicarbonate (HCO) and carbonate (CO) ions. As a result, the partial pressure of CO2 (pCO2) of the surface water is reduced which drives a flux of CO2 from the atmosphere towards the ocean. This increases the amount of CO2 that can be sequestered and stored as dissolved inorganic carbon (DIC; defined as the sum of the aqueous [CO2], [HCO], and [CO] concentrations; Zeebe and Wolf-Gladrow, 2001). This natural process of ocean alkalinization, induced by the chemical weathering of rocks, has regulated atmospheric CO2 and stabilized the climate over geological timescales (Berner et al., 1983). The process of AWL aims to mimic the natural process of carbonate weathering in a reactor but in an accelerated fashion. Here, we review the potential of AWL as a CO2 emission mitigation approach, including its intricacies and possible bottlenecks. To this end, we describe AWL thermodynamically as a four-step process, thus providing a model framework that allows us to calculate the efficiency of the different steps as well as the overall CO2 sequestration potential. We then review the different reactor designs that have been proposed for the AWL process in recent years and evaluate their efficiency and potential in terms of CO2 emission mitigation capacity.
2.1 AWL as a four-step process
The concept of AWL was first proposed more than 2 decades ago by Rau and Caldeira (1999). It provides a geochemistry-based method for CO2 emissions mitigation in which the aqueous reaction of carbonate minerals (e.g. CaCO3) with CO2 is enhanced due to the elevated concentration of CO2, as typically encountered in waste gas streams of industrial combustion processes (Rau and Caldeira, 1999). Finely ground carbonate (e.g., calcite, aragonite, dolomite or magnesite) and a suitable stream of process water are brought into direct contact with the flue gases from a CO2-intensive industrial source, such as a coal-fired power plant or a cement factory (Fig. 1). In general, the process of AWL can be described as consisting of four different steps (Fig. 1): (i) CO2 uptake, whereby the process water comes into contact with the flue gas, which has a much higher pCO2 than the ambient atmosphere (typically pCO2≈0.15 atm). This leads to dissolution of CO2 in the process water, thus increasing the DIC and lowering the pH and calcite saturation state (Ωcalc), while keeping AT constant. (ii) In the CaCO3 dissolution step, the reduced Ωcalc of the process water stimulates the dissolution of carbonate particles and increases both the DIC and AT of the process water. Subsequently, there are two options. In the case of “buffered AWL” (Caserini et al., 2021), there is an additional (iii) alkalinization step before re-equilibration to avoid the degassing of CO2. Additional AT is added to the process water (e.g. by addition of slaked lime, Ca(OH)2) until the excess CO2 is fully buffered. After discharge into the surface ocean, there is no longer any CO2 transfer to the atmosphere. In the case of “unbuffered AWL”, there is the (iv) re-equilibration step. The process water is discharged into the sea without any further treatment after which it re-equilibrates with the atmosphere at the lower pCO2 (pCO2≈0.00042 atm) and the excess CO2 (i.e., the part of DIC not stabilized by the increased AT) will degas back to the atmosphere.
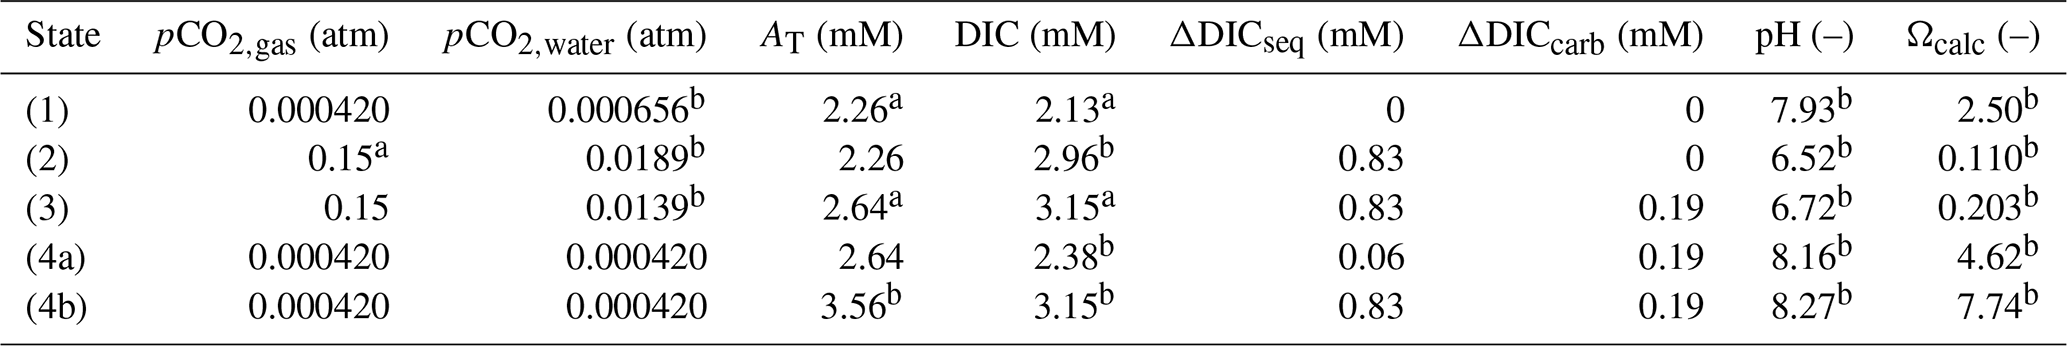
Below we discuss each step in more detail. During the whole AWL process, the process water goes through four consecutive states, each characterized by a specific set of AT, DIC, pCO2, and pH values. These states are (1) the ambient process water that is used as intake, (2) the process water with elevated DIC after CO2 uptake, (3) the process water enriched in AT and DIC after CaCO3 dissolution, and (4a) the unbuffered or (4b) buffered process water after discharge into the surface ocean.
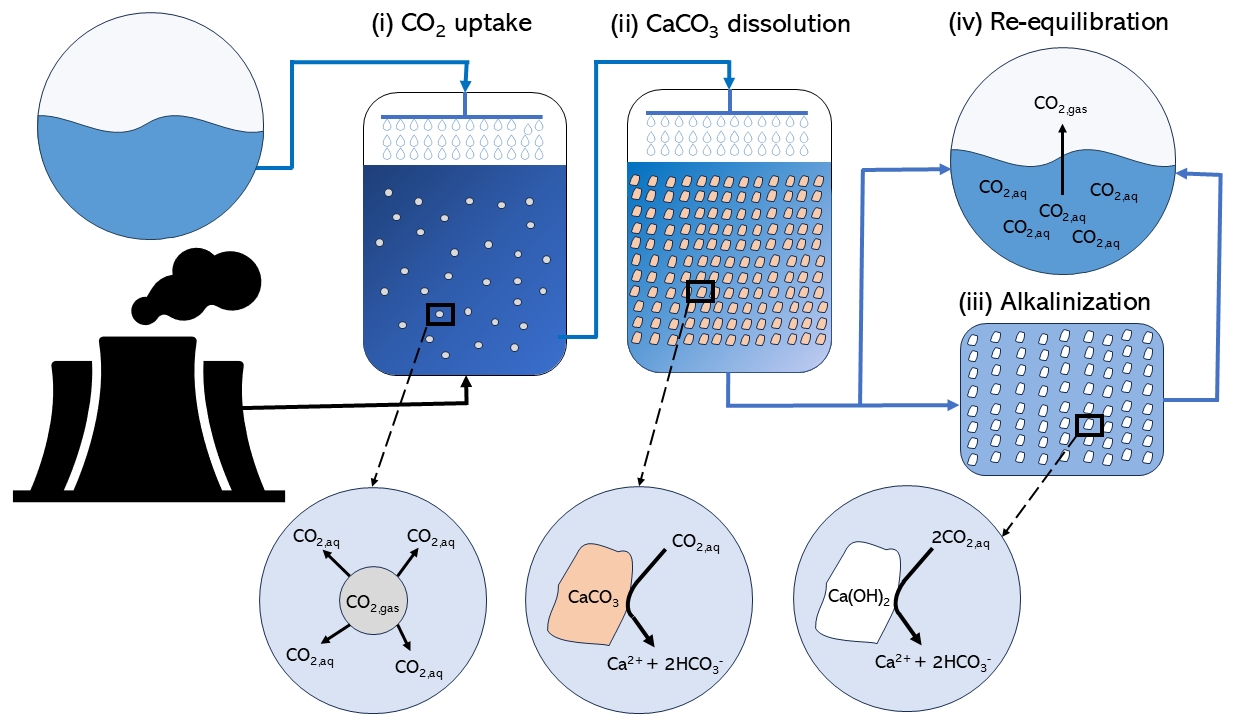
Figure 1The process of accelerated weathering of limestone can be described by four different steps: (i) CO2 uptake, whereby CO2 from the flue gas comes in contact with the process water and CO2 dissolves into the process water; (ii) CaCO3 dissolution, whereby aqueous CO2 reacts with CaCO3 particles and generates AT in the form of HCO, which is stimulated by the reduced Ωcalc; (iii) the alkalinization step (in buffered AWL), whereby additional AT is added to the process water (e.g., by slaked lime addition), until the excess CO2 is fully buffered; and (iv) the re-equilibration step, whereby upon re-exposure to atmospheric conditions, aqueous CO2 which is not stabilized by the increased AT will degas back to the atmosphere. The black lines indicate the gas flows, and the blue lines indicate the process water flows.
Table 1 shows the values for pCO2,gas, pCO2,water, AT, DIC, pH, and Ωcalc in each of the four states for a representative case, which is based on data reported from a two-step bench-top reactor consisting of a separate gas–liquid and liquid–solid reactor (Chou et al., 2015, reactor design as further discussed below). The CO2 concentration of the gas stream was 15 %, while the pCO2 of the atmosphere is fixed at 420 ppm. The AT and DIC values at the inlet and outlet of the reactor are based on measured values (Table 1 in Chou et al., 2015; note that the inlet process water has a higher pCO2,water and thus a higher DIC value than ambient surface water). The remaining variables are calculated using the CRAN AquaEnv package for the thermodynamic equilibria of acid-base systems in seawater (Hofmann et al., 2010). We assume full re-equilibration with the atmosphere (unbuffered AWL) or full buffering with slaked lime (Ca(OH)2) upon discharge into the sea (buffered AWL). This condition of full re-equilibration requires consideration. In the well-mixed coastal zone, air–sea CO2 exchange takes place on a timescale of several weeks up to a year (Jones et al., 2014; He and Tyka, 2023; Geerts et al., 2025). When the surface residence time of the discharged process water is shorter than the air–sea CO2 equilibration timescale, some of the dissolved CO2 unbuffered by the AT increase in the AWL reactor can move to deeper layers, and so full re-equilibration will not be reached (Jones et al., 2014; He and Tyka, 2023). Likewise, when the process water is discharged below the stratification layer or directly in the deeper ocean, full re-equilibration will also be prevented (Jones et al., 2014; He and Tyka, 2023). In both the cases, the CO2 sequestration is increased. Therefore, assuming full re-equilibration represents a conservative lower bound for the CO2 sequestration during AWL.
The transition through the different consecutive states is depicted in the thermodynamic diagrams of Fig. 2, which each depict the pCO2 of the process water versus AT but with different isolines (DIC, pH, and Ωcalc). Changes in the chemical conditions of the inlet process water, the water/gas flow rate (), the pCO2 of the gas stream, or the reactor setup will modify the modeled parameters presented in Table 1 and Fig. 2.
Table 1Theoretical values for process water pCO2 (pCO2,water), alkalinity (AT), dissolved inorganic carbon (DIC), pH, and calcite saturation state (Ωcalc) in the four consecutive states of the example AWL reactor: (1) the process water that is used as intake (the process water was collected from an offshore station near the Hoping power plant and the inlet and outlet of the cooling water drainage of the Hoping power plant, Chou et al., 2015), (2) the process water with elevated DIC after CO2 uptake, (3) the process water enriched in AT and DIC after CaCO3 dissolution, and (4a) the unbuffered or (4b) buffered process water upon discharge. ΔDICseq is the DIC that is added to the process water due to dissolution from the gas stream, and ΔDICcarb is the DIC added through the dissolution of CaCO3 in the reactor. The pCO2,gas, AT, and DIC values (indicated by a) are based on values measured in a two-step AWL bench-top reactor (Chou et al., 2015). The values of pCO2,water, AT, DIC, pH, and Ωcalc (indicated with b) are calculated using CRAN AquaEnv (Hofmann et al., 2010) for seawater at a temperature of 15 °C and salinity of 35.
During step (i), the AT remains invariant between state (1) and state (2) (vertical trajectory in Fig. 2). The high CO2 concentration in the flue gas drives the dissolution of CO2 into the water phase, which increases the DIC of the process water (Fig. 2a), lowers its pH (Fig. 2b), and drastically lowers the Ωcalc (Fig. 2c; Table 1). As a result, the dissolution of CaCO3 in step (ii) becomes thermodynamically favorable, and because of the strong disequilibrium, the dissolution rate is increased (Berner and Morse, 1974; Morse et al., 2007). Note that the effluent at state 3 in the example two-step reactor is not in equilibrium with respect to CaCO3 dissolution (Ωcalc<1, Table 1). This indicates that the effectiveness of CaCO3 dissolution in the reactor design of Chou et al. (2015) could still be improved (e.g. by implementing a longer residence time). The dissolution of CaCO3 can be described by the following reaction:
Because the input of AT from CaCO3 dissolution is twice that of DIC (2:1 ratio of AT to DIC production), the carbonate equilibrium in the process water is shifted away from CO2 towards HCO and CO (Eq. 2), which slightly increases the pH and calcite saturation state (Fig. 2; Table 1).
In the unbuffered AWL scenario, the effluent water of the reactor is simply discharged in the marine environment and is re-exposed to the atmosphere. We can model this as a re-equilibration of the process water with the ambient atmospheric pCO2, step (iv), which will induce an outgassing of excess dissolved CO2. The release of CO2 from the effluent results in a marked decrease of DIC and a concomitant increase in pH and Ωcalc (Fig. 2; Table 1).
Two assumptions are worth noting. In our scheme, we assumed that the effluent process water first equilibrates with the ambient atmosphere, before it is mixed with the surrounding seawater. In reality, the process water will be mixed first with ambient seawater. If mixing involves vertical mixing of the process water supersaturated with CO2, full equilibration will not be reached. Secondly, the calcite saturation state of the solution after degassing is larger than one. Such a supersaturated solution could (at least in theory) induce the reprecipitation of CaCO3 within the marine environment with a resulting loss of AT. Still, the abiotic precipitation of CaCO3 in seawater typically requires a highly supersaturated solution (Ωcalc>18) (Morse and He, 1993). Therefore abiotic CaCO3 formation is unfavorable from supersaturated seawater and rare under natural conditions (Mucci et al., 1989; Moras et al., 2022; Hartmann et al., 2023). Accordingly, we assume that no carbonate precipitation takes place after the discharge of the process water.
In the buffered AWL scenario, Ca(OH)2 is added to the process water before it is discharged into the marine environment (Caserini et al., 2021). During this step, all the unreacted CO2 is buffered, which hence prevents any loss of DIC (Fig. 2a), increases AT and pH, and also substantially increases Ωcalc ∼ 8 (Fig. 2b–c). While the abiotic precipitation of CaCO3 is kinetically inhibited under such high Ωcalc values (see above), its risk could be further reduced by (1) discharging the process water where rapid mixing and dilution occurs; (2) mixing the process water with deeper and colder waters, which increases the solubility of CaCO3; or (3) injecting the process water at a depth below the calcite compensation depth (Kirchner et al., 2020a).
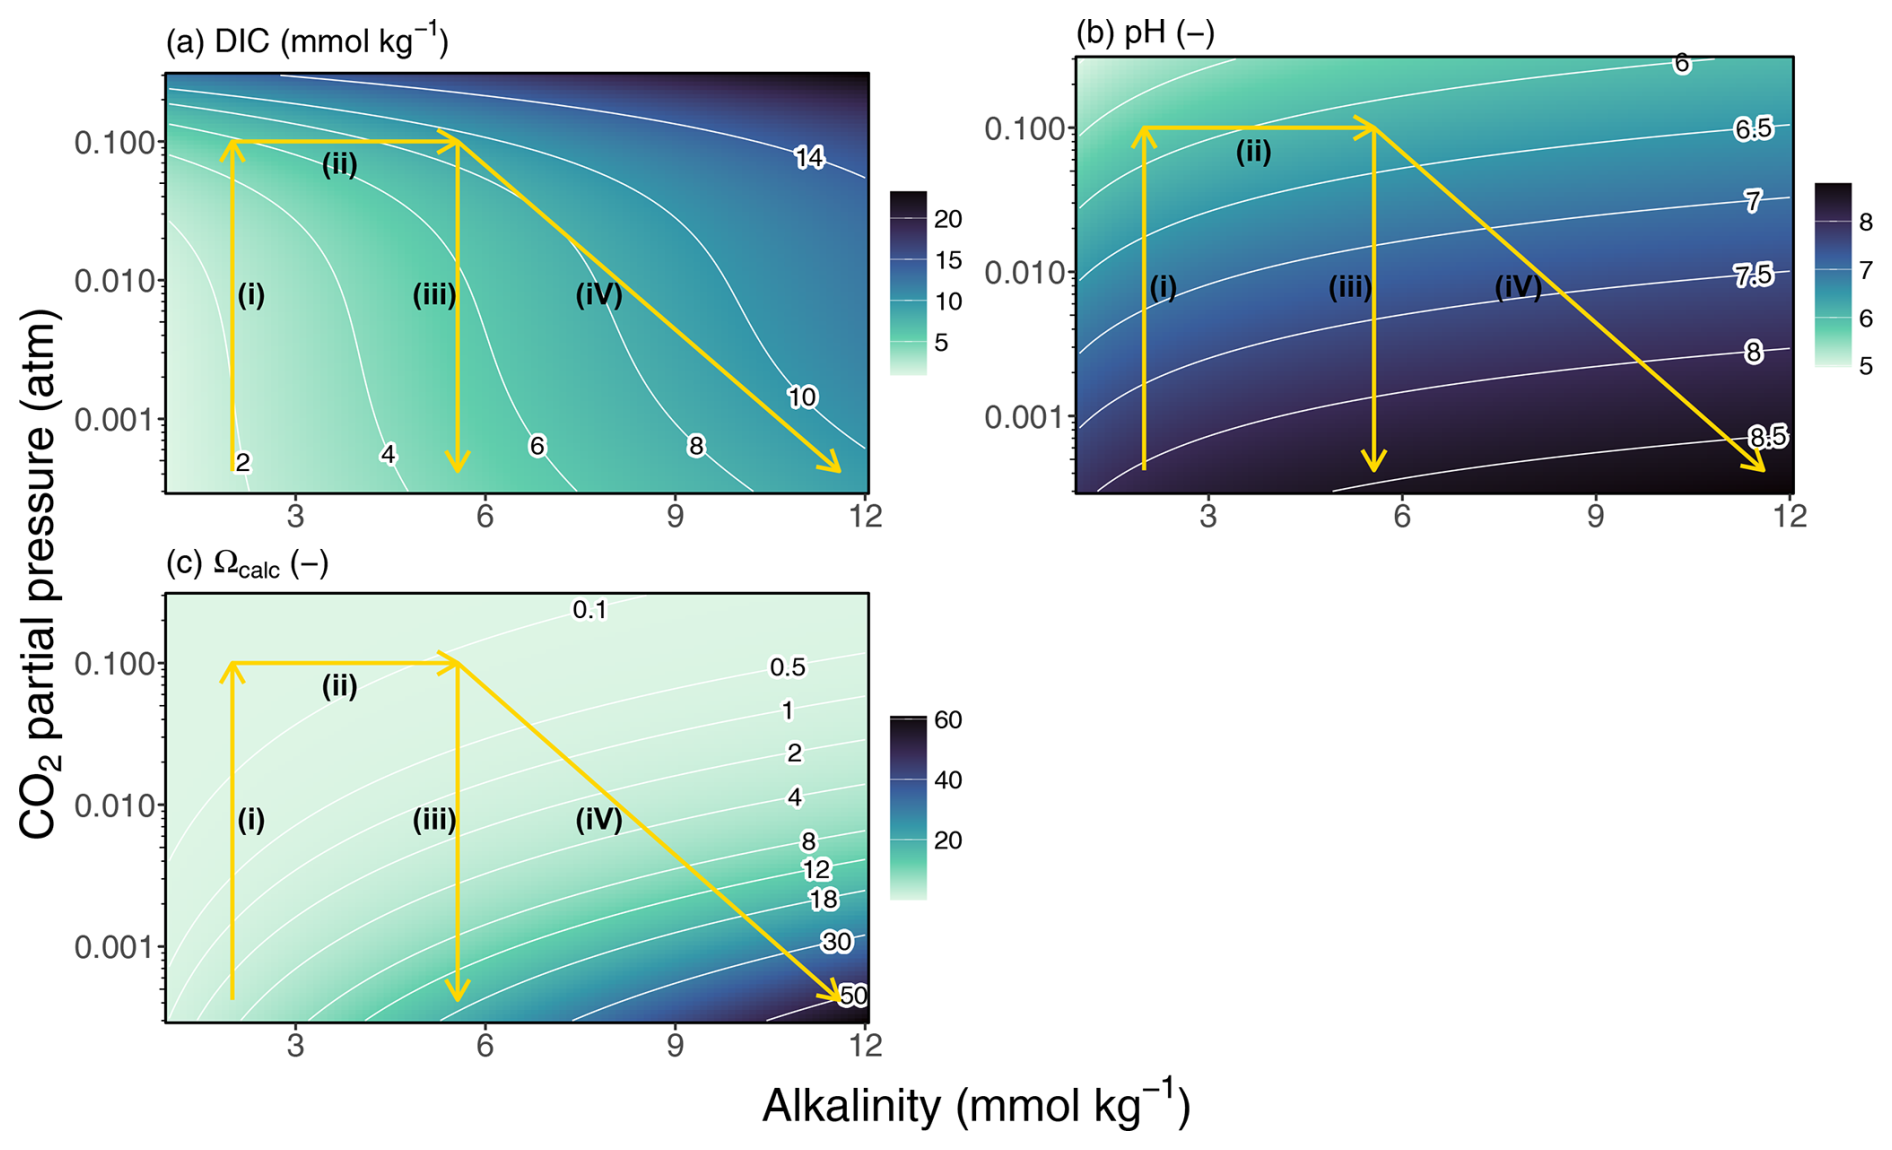
Figure 2Changes in carbonate chemistry for the four different steps during AWL: (i) CO2 uptake, whereby CO2 gas from the flue gas comes in contact with the process water and CO2 dissolves into the process water; (ii) CaCO3 dissolution, whereby aqueous CO2 reacts with CaCO3 particles and generates AT in the form of HCO, which is stimulated by the reduced saturation state; (iii) the alkalinization step (in buffered AWL), whereby additional AT is added to the process water (e.g. by Ca(OH)2 addition), until the excess CO2 is fully buffered; and (iv) the re-equilibration step, whereby upon re-exposure to atmospheric conditions, aqueous CO2 which is not stabilized by the increased AT will degas back to the atmosphere. pCO2 (atm) in function of AT (mmol kg−1) with isolines for (a) DIC, (b) pH, and (c) Ωcalc. The DIC concentration in the process water has increased over the course of the three consecutive steps, indicating a capture of CO2.
2.2 CO2 sequestration during CaCO3 dissolution and Ca(OH)2 buffering
Overall, the AT increase following CaCO3 dissolution leads to the sequestration of CO2 from the flue gas in the form of DIC in the seawater (Rau and Caldeira, 1999; Caldeira and Rau, 2000; Rau et al., 2007; Rau, 2011). As can be seen from Table 1, the final DIC (2.38 mM in the unbuffered case; 3.15 mM in the buffered case) is higher than in the intake water (2.13 mM). However, only part of this DIC increase is due to CO2 sequestration from the flue gas, as part of the additional DIC also originates from CaCO3 dissolution. To separate the different effects that contribute to CO2 sequestration, the DIC increase can be decomposed as
DICinlet is the DIC value measured in the process water at the inlet, ΔDICcarb denotes the DIC that originates from CaCO3 during dissolution, represents the DIC in the process water that originates from net CO2 sequestration from the flue gas in the reactor through the increase in AT from CaCO3 dissolution. represents the DIC that is not sequestered by CaCO3 dissolution that is retained (i.e., prevented from efflux to the atmosphere) due to the Ca(OH)2 addition to the effluent (in the unbuffered scenario ). In a similar fashion, the final AT value is the result of AT addition during CaCO3 dissolution and the AT that is added during buffering with Ca(OH)2 in the case of buffered AWL.
From this, the net CO2 sequestration is obtained by subtraction of the DIC that originates from CaCO3 dissolution:
In practical AWL applications, the Δ quantities can be determined by measuring DIC and AT at the inlet and outlet of the AWL reactor (i.e., before the buffering step), complemented by thermodynamic calculations (see Table 1). The DIC and AT increase due to CaCO3 dissolution can be directly inferred from the stoichiometry of the CaCO3 dissolution reaction Eq. (1) :
For every mole of CaCO3 that dissolves, two moles of AT are formed, and one extra mole of DIC is generated from the CaCO3. Therefore, the amount of DIC generated from CaCO3 dissolution is half the amount of AT increase between the inlet and outlet of the reactor.
In AWL applications, the critical quantity is the overall DIC increase resulting from net CO2 sequestration, i.e., ΔDICseq. Here we need to make a distinction between the buffered and unbuffered scenario. In the unbuffered scenario, one calculates the DIC and AT values after re-equilibration of the process water with the atmosphere.
The AT concentration does not change during re-equilibration (remains same as the outlet), while the final DIC value can be calculated from this AT concentration and the atmospheric pCO2 based on thermodynamic relations of seawater carbonate chemistry (assuming full equilibration with the atmosphere). The approximation in Eq. (9) uses the thermodynamic buffer factor , which specifies the increase in seawater DIC taken due to CO2 uptake from the atmosphere given a certain addition of AT (Zeebe and Wolf-Gladrow, 2001). This buffer factor is calculated at the atmospheric pCO2 and ambient seawater concentrations (i.e., inlet conditions), which serves as a reasonable approximation, since the outlet water will be quickly mixed with ambient seawater. Accordingly, in the unbuffered scenario, the total amount of CO2 sequestered becomes
The amount of CO2 that is lost via outgassing upon re-equilibration can be calculated as
Alternatively, in the case of buffered AWL, one adds additional AT to the effluent water, until equilibrium is reached with the ambient atmosphere, and so no CO2 will be outgassed to the atmosphere. The final state is calculated as
The final AT value can again be calculated from thermodynamic relations of seawater carbonate chemistry. The amount of AT that needs to be supplied by Ca(OH)2 addition to achieve “full buffering” is given by
Accordingly, in the buffered scenario, the total amount of CO2 sequestered can be calculated as
The amount of CO2 sequestration that is generated by buffering can be calculated as
In our example (Table 1), the total DIC increase in the equilibrated effluent water amounts to ΔDICtotal=0.25 mM in the unbuffered case, of which 76 % (0.19 mM) originates from CaCO3 dissolution and 24 % (0.06 mM) is due to CO2 sequestration from the flue gas. In the buffered case, the DIC increase in the buffered discharge water amounts to ΔDICtotal=1.02 mM of which 19 % (0.19 mM) originates from CaCO3 dissolution, 6 % (0.06 mM) is due to unbuffered CO2 sequestration and 75 % (0.77 mM) results from additional (buffered) CO2 sequestration via dissolution of Ca(OH)2. This illustrates how in the unbuffered scenario, a large fraction of the CO2 initially dissolved in the process water escapes back to the atmosphere upon release back into the ocean. This highlights that step (ii), the CaCO3 dissolution, is the limiting step in the AWL process (Chou et al., 2015; Damu et al., 2024; Dong et al., 2025). It has to be noted that the inlet process water for this example from Chou et al. (2015) was not in equilibrium with the atmosphere (pCO atm instead of 0.000420 atm).
The operation and performance of an AWL reactor can be quantified by introducing a number of efficiency factors, which can be calculated from the ΔDICseq and ΔDICcarb values defined above (and hence from AT and DIC values measured at the inlet and outlet of the reactor). These efficiency factors can again be linked to the different steps in the AWL process (as in Fig. 2) and will allow us to compare the efficiency of different reactor designs. We now first introduce these efficiency factors formally.
2.3 CO2 sequestration efficiency and water usage
The key target of the AWL reactor is to remove CO2 from the gas stream and store this permanently as DIC in the surface ocean. This performance is quantified by the CO2 sequestration efficiency (ηseq), which is defined as the fraction of CO2 sequestered from the gas stream, accounting for re-equilibration with the atmosphere and associated CO2 degassing and buffering:
In this, the reactor is fed with a gas stream Qg (m3 s−1) at a certain CO2 partial pressure (pCO2,gas) and uses a process water stream Qw (m3 s−1), which is characterized by DICinlet and AT,inlet. R is the ideal gas constant (L atm mol−1 K−1), and T is the temperature of the gas stream (K). The maximum CO2 sequestration efficiency is achieved when upon exit, the process water is in full equilibrium with the flue gas and all the dissolved CO2 in the process water is suitably buffered by CaCO3 dissolution in the AWL reactor and/or additional Ca(OH)2 buffering, i.e., .
The equilibrium value, DICeq (, pCO2,gas, T, S) can be calculated from carbonate chemistry as a function of the AT of the inlet water and the pCO2 of the gas stream. From this, the minimum water gas flow ratio () that is required to achieve 100 % CO2 sequestration efficiency () can be calculated as
In our example reactor, this amounts to 0.76 (Table 2). A water efficiency factor (Weff) can be defined as actual water consumption of the reactor over the minimum required Qw to achieve maximum sequestration.
If Weff is smaller than 1, the Qwis not sufficient to dissolve all the CO2 in the gas stream down to atmospheric pCO2, and so the sequestration efficiency is limited by the Qw (). If the Weff is larger than 1, more water is used than is strictly required. In our example reactor, the maximum CO2 uptake efficiency is 100 % and Weff=3.2 (Table 2). The volume of process water (m3) that is used to capture 1 t of CO2 can be calculated from Eq. (17) as
In this, is the molar mass of CO2 (44.01 g mol−1) and 10−6 is used to convert grams to tonnes (1 g = 10−6 t), while ΔDICseq is expressed in moles per unit of volume. In our reactor example, 150 000 m3 of process water is used to capture 1 t of CO2.
2.4 CO2 dissolution efficiency and CaCO3 dissolution efficiency
In reality, the maximum CO2 sequestration efficiency will not be reached, due to several forms of inefficiency. In the first step, there might be incomplete dissolution of CO2 in the inlet water from the flue gas stream. To account for this, the CO2 dissolution efficiency is defined as the amount of CO2 that is effectively removed from the gas stream versus its theoretical maximum
The maximum CO2 dissolution efficiency of 100 % is reached when DIC. The CO2 uptake efficiency is defined as the relative amount of CO2 that is stripped from the incoming gas stream (irrespective of whether it is eventually sequestered or not – see below):
As can be seen, the CO2 uptake efficiency is critically dependent on the CO2 dissolution efficiency as well as the ratio at which the reactor operates (which defines ). In the example reactor, the CO2 uptake efficiency (ηuptake) becomes 33 %, implying that only one third of the CO2 is removed from the gas stream.
In a second step, the dissolution of CaCO3 in the AWL reactor targets the neutralization the dissolved CO2 by its conversion to HCO via the reaction in Eq. (1). The CaCO3 dissolution efficiency is defined as the percentage of the dissolved CO2 within the reactor that has reacted with CaCO3.
The maximum CaCO3 dissolution efficiency is reached when the DIC released during CaCO3 dissolution matches the amount of CO2 extracted from the gas phase, i.e., . In the example reactor, the CaCO3 dissolution efficiency is 22 %, implying that only a part of the CO2 extracted from the gas stream is buffered by CaCO3 dissolution.
2.5 Outgassing and buffering effects
The outgassing effect εoutgas is defined as the amount of amount of CO2 sequestered in the unbuffered scenario relative to the amount of CO2 that has reacted with CaCO3:
As shown in Eq. (9), the outgassing effect εoutgas is directly proportional to the thermodynamic buffer factor γ, which is always smaller than 1, and so εoutgas<1. Finally, the buffering effect is defined as
Based on the factors introduced above, the effective CO2 sequestration efficiency thus becomes
As apparent, the fact that the efficiencies , , and γ are lower than 1 decreases the CO2 sequestration efficiency below its maximal attainable value. When there is no buffering (εbuffer=0), then . In contrast, when there is maximum buffering, the relation holds, and so the CO2 uptake efficiency is always the same as the CO2 sequestration efficiency. In this scenario, the buffering compensates entirely for incomplete CaCO3 dissolution and prevents outgassing (i.e., ). In our example reactor, the unbuffered CO2 sequestration efficiency is only 6 % (see Table 2), while the buffered CO2 sequestration efficiency (or, equally, the CO2 uptake efficiency) amounts to 33 %, thus indicating that a large part of the CO2 initially gained will be lost by outgassing upon re-equilibration. However, when improving reactor designs to increase the CaCO3 dissolution efficiency, the gap between the unbuffered and buffered CO2 sequestration efficiency will become smaller.
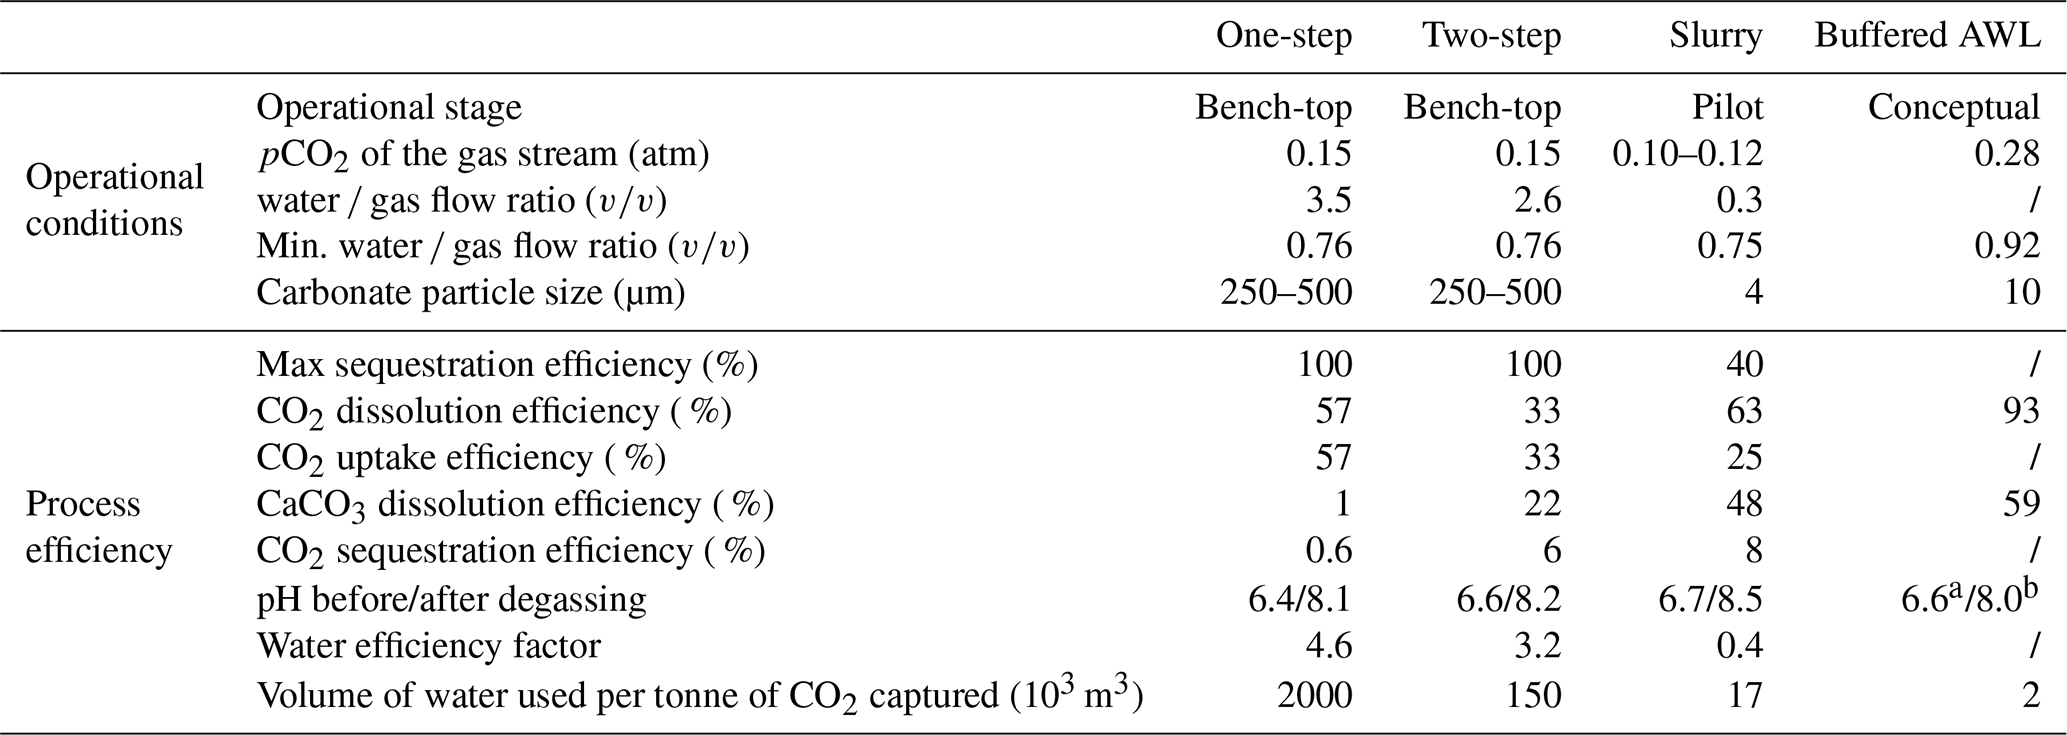
Over the past decades, several reactor designs have been proposed for AWL. Some have remained at a conceptual model stage, while others have been tested in bench-top or pilot-scale operations (Table 2). As such, the technological readiness level is still limited and restricted to pilot-scale applications (Chou et al., 2015; Kirchner et al., 2020b). In this section, we will compare four different reactor designs: a one-step reactor (Rau, 2011; Chou et al., 2015), a two-step reactor (Chou et al., 2015), a slurry reactor (Kirchner et al., 2020b), and a buffered AWL reactor (Caserini et al., 2021). The operational conditions and process efficiencies of these reactor designs are summarized in Table 2. The presented operational conditions are given for specific example reactor setups (bench-top, Chou et al., 2015 or pilot plant, Kirchner et al., 2020b) or conceptual designs (Caserini et al., 2021), and the process efficiencies are calculated based on published data for a specific operational condition. Changes in reactor design or operational conditions will change these calculated efficiencies.
Table 2Operational and process conditions for an example of a one- and two-step reactor (Chou et al., 2015), a slurry reactor (Kirchner et al., 2020b), and a buffered AWL reactor (Caserini et al., 2021). a After the dissolution reactor and b after the buffering reactor as no degassing takes place. When water and/or gas flow rates are not specified, no CO2 uptake or sequestration efficiency can be calculated, as was the case for two-step and buffered AWL.
3.1 One-step fixed-bed reactor
The first AWL reactor design comprised a one-step fixed-bed reactor (Fig. 3a), of which the theoretical concept was first presented in Rau and Caldeira (1999), and experimental results from a bench-top version were reported in Rau (2011). This reactor contains a porous bed of limestone particles, sprayed with water until they are submerged. The CO2-rich gas enters through one or more inlets located at the bottom or lower half of the reactor (Fig. 3a). Subsequently, the gas stream passes over and through the wetted, porous bed of limestone particles, which then allows the CO2 in the gas phase to hydrate in the pore fluid. The flue gas (partially) depleted in CO2 leaves the reactor from the top and is discharged to the atmosphere.
As indicated by the analysis above, the CO2 uptake from the gas is critically dependent on the water to gas flow ratio () – see Eq. (22). This was confirmed by laboratory experiments with bench-top versions of the one-step fixed-bed reactor, with CO2 uptake efficiency increasing with increasing (Damu et al., 2024; Rau, 2011). At a low of below 1, the CO2 uptake efficiency remained below ∼ 30 % but could be increased up to 97 % by increasing the to > 8 (Rau, 2011). Chou et al. (2015) examined a similar lab-scale one-step reactor and achieved a CO2 uptake efficiency of ∼ 57 % using a of 3.5 (Table 2). The dissolution of CO2 in the process water generates a low-pH carbonic acid solution, which then can react with the carbonates to form Ca2+ and HCO. The removal of CO2 from the flue gas alone however does not imply that the reaction with limestone is completed. Rau (2011) found that the majority of the hydrated CO2 did not react with the CaCO3 particles and would be outgassed again to the atmosphere upon release. This was confirmed by a lab-scale one-step reactor investigated by Chou et al. (2015) and Damu et al. (2024), who both showed that most of the dissolved CO2 did react with CaCO3 and remained present as aqueous CO2. Consequently, the overall CO2 sequestration efficiency of a one-step reactor remains low due to a lack of CaCO3 dissolution. A large fraction of the dissolved CO2 remains unbuffered by the increase in AT. This unbuffered CO2 will escape if the solution is exposed to the atmosphere during the re-equilibration step (Rau, 2011; Chou et al., 2015; Damu et al., 2024). With such a low CaCO3 dissolution efficiency (limiting step), the reactor configuration of Chou et al. (2015) requires an excessive ∼ 2 ×10⁶ m3 of water to sequester 1 t of CO2 (Table 2). Possibilities to improve the CaCO3 dissolution efficiency are to increase the reaction time or to decrease the limestone particle size so as to increase the reactive surface area and dissolution rate (Rau, 2011).
3.2 Two-step reactor
A fundamental problem of a one-step reactor is that the timescale of CO2 dissolution is much smaller than that of CaCO3 dissolution, thus leading to a low CaCO3 dissolution efficiency. To accommodate this, a two-step reactor design was tested to improve the CaCO3 dissolution efficiency (Chou et al., 2015). In this, the dissolution of CO2 in the process water and the CaCO3 dissolution occur in two separated reactors placed in series (Fig. 3b). In the first step, the CO2-rich gas stream is brought into contact with the inlet process water in a gas–liquid reactor, and after the pH of the process water is stabilized, the acid solution was fed into a liquid–solid reactor filled with limestone powder (> 95 wt % CaCO3) with a particle size of 250–500 µm (Chou et al., 2015). Under identical operation conditions, the CaCO3 dissolution efficiency could be increased from 1 % in the one-step process to 22 % in the two-step process (Chou et al., 2015). This reduced the required amount of water needed to sequester 1 t of CO2 to ∼ 150 000 m3 (Chou et al., 2015). This design was further improved by Dong et al. (2025), by adding four two-step reactors in series. The intermediate CaCO3 dissolution steps allowed for partial conversion of the dissolved aqueous CO2 to bicarbonate, which increased the total CO2 sequestration efficiency to 17 %–30 % assuming a γ of 0.85 (Dong et al., 2025). The CaCO3 dissolution step was shown to remain the rate-limiting step (Dong et al., 2025). The CaCO3 dissolution could be improved by increasing the weight percentage of CaCO3 particles (over the range in which all particles can remain in suspension), using counter flow, and increasing the residence time of the process water in the liquid–solid reactor (Dong et al., 2025).
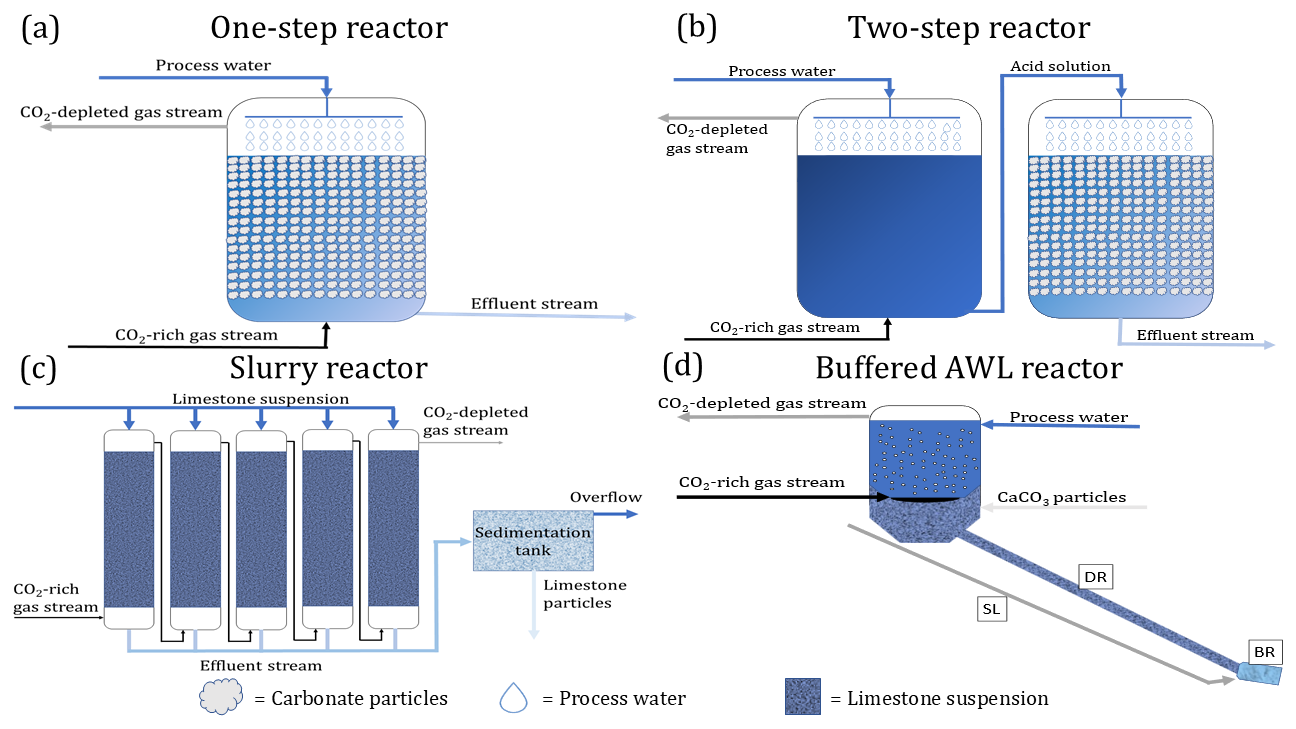
Figure 3Conceptual reactor design of four AWL reactors. (a) One-step reactor, (b) two-step reactor, (c) slurry reactor, (d) buffered AWL reactor. SL = slaked lime pipe, DR = dissolution reactor, BR = buffering reactor.
3.3 Slurry reactor
The next improvement in reactor design was achieved by using a suspension of fine CaCO3 instead of a reactor with large CaCO3 grains (Fig. 3c). This reactor design was implemented in an AWL demonstration plant at a coal-fired power plant in Wilhelmshaven (Germany) that could process up to 200 m3 h−1 of flue gas (Kirchner et al., 2020b). The AWL reactor consisted of a five columns (1.95 m high; 0.32 m diameter) packed with plastic packing rings to increase the surface area within the reactor to enhance the dissolution of CO2 into the water as well as the subsequent CaCO3 dissolution. A limestone suspension of approximately 0.5 % () was sprayed into the head space of each column. The desulfurized flue gas from the coal-fired power plant entered the columns from the bottom side. The flue gas was channeled through all five columns sequentially to achieve maximal removal of CO2. The flue gas leaving the last column was fed back into the chimney of the power plant. These improvements resulted in a CO2 uptake efficiency between 15 % and 55 % during the operation of this AWL demonstration plant, with the uptake efficiency being inversely proportional to theQg. For a of 0.3, a CO2 uptake efficiency of 25 % was achieved (Table 2; Kirchner et al., 2020b). At this , the Weff is smaller than 1, and the Qw limits the maximum achievable CO2 sequestration efficiency ( %). The CO2 uptake efficiency can be further improved by increasing the , by increasing the number of reactor columns or by recirculating the gas stream. Note however that all these factors lead to a larger (and hence more costly) reactor setup.
The CaCO3 dissolution, step (ii), was improved by using a limestone suspension with micronized CaCO3 particles (∼ 4 µm) and by improving mixing and turbulence within the reactor by implementation of the plastic packing rings (Kirchner et al., 2020b). This resulted in an AT increase from 2 mM in the input stream to 5.6 mM in the effluent water and a CaCO3 dissolution efficiency of 48 % (Table 2; Kirchner et al., 2020b). This then led to a substantially reduced water consumption (17 000 m3 per tonne of CO2 sequestered) compared to the one-step and two-step reactors (Table 2; Kirchner et al., 2020b). When the process was performed in a closed-loop with recirculation of the process water, an AT of > 10 mM was achieved. This indicated that the contact time between the limestone suspension and the flue gas was too short in the one-pass setup. Additional columns, elongation of the existing ones, and higher limestone concentrations could be considered for optimization of the reactor design (Kirchner et al., 2020b). The water stream leaving the columns was fed into a sedimentation tank to separate the remaining limestone particles from the process water. The particle-poor overflow water was then fed into the wastewater treatment system of the powerplant (Kirchner et al., 2020b).
3.4 Buffered accelerated weathering of limestone reactor
The feasibility of unbuffered AWL reactors is hindered by the large water requirements (103–105 m3 water per tonne of CO2 sequestered) in current reactor designs (Rau and Caldeira, 1999; Rau, 2011; Caserini et al., 2021). This large water requirement is a direct consequence of the low CaCO3 dissolution efficiency (as illustrated by Eqs. 24–25). To increase the CaCO3 dissolution efficiency, longer reaction times and thus larger reactors are required, which then also increases capital investment (Rau, 2011; Kirchner et al., 2020b). A second issue of unbuffered AWL reactors is the outgassing effect εoutgas. If the effluent solution is exposed to the atmosphere, excess CO2 will be degassed until the effluent is in equilibrium with the pCO2 of the ambient atmosphere. One option would be to avoid this contact with the atmosphere. If the effluent were directly discharged into the deep sea, the CO2 storage potential would be higher as it avoids extensive degassing. However, this would also lead to acidification of the deeper ocean and associated environmental impacts (Caserini et al., 2021).
To overcome the issues of low CaCO3 dissolution efficiency, high water requirements, and inefficient CO2 sequestration of unbuffered AWL, the concept of “buffered AWL” has been proposed (Caserini et al., 2021). Buffered AWL reactors have not been physically built or tested and still reside within the conceptual phase. Buffered AWL consists of four distinct sections: a mixer, a dissolution reactor (DR), slaked lime pipe (SL), and a buffering reactor (BR) (Fig. 3d). The main difference between AWL is the buffering of the unreacted CO2 by Ca(OH)2. In the mixer, CO2 from the gas stream is mixed with seawater and CaCO3 particles to form a homogeneous slurry. The CO2 gas stream enters the mixer from the bottom and is hydrated through a bubble-type absorption column or a packed-bed absorption column. A bubble type absorption column would be preferred as the absorption can be 3–10 times faster than in a packed-bed column, which reduces the reactor size significantly (Teir et al., 2014; Xing et al., 2022; Zhang et al., 2023). The CO2-depleted gas is released at the top of the mixer. Seawater is fed to the mixer from the upper part. This theoretical example assumes a dissolution of 1000 kg of CO2 in 2000 m3 process water, at which point the process water is in equilibrium with the flue gas (pCO2≅0.28 bar) (Caserini et al., 2021).
CaCO3 particles, with a suitably small diameter (< 50 µm) so that they remain in suspension, are uniformly mixed with the main water stream at the bottom of the mixer before entering into the dissolution reactor (DR). The dissolution rate of the CaCO3 particles is determined by the size of the CaCO3 particles, residence time, and pressure in the dissolution reactor (Caserini et al., 2021). The primary objective of the DR is to maximize the amount of dissolved CaCO3 per tonne of dissolved CO2 in solution (Caserini et al., 2021). The DR consists of a piping system in which CaCO3 is dissolved into a fully ionic solution during transport to the coastal ocean. The DR can be located on- or offshore. If the DR is constructed offshore, between the coasts and the deeper ocean, the solution flowing down the DR encounters an increase in the hydrostatic pressure, which improves the dissolution of CaCO3 (Dong et al., 2018; Caserini et al., 2021). The CaCO3 dissolution efficiency (step (ii)) of the theoretical example proposed was 59 % (Table 2). The solution leaving the DR will be acidic as CO2 needs to be present in stoichiometric excess to allow full dissolution of the CaCO3 particles. Therefore, a final buffering in the buffering reactor (BR) is needed before discharge to the ocean. This BR is located at the end of the DR. Aqueous calcium hydroxide (Ca(OH)2), supplied through the slaked lime pipe, is mixed with the acid solution leaving the DR. The Ca(OH)2 reacts with the unreacted CO2 remaining in the solution at the end of the DR.
The buffering of the unreacted CO2 by Ca(OH)2 allows us to release an ionic solution at the same pH as the seawater and thereby avoiding acidification. The buffering also avoids degassing of the unreacted CO2 and increases the long-term storage efficiency of the process compared to traditional AWL (Caserini et al., 2021; Chou et al., 2015; Rau, 2011). The use of a tubular reactor in the buffered AWL process also allows for long residence times, higher pressures and reduces the need for maintenance. High-density polyethylene (HDPE) pipelines have a long lifetime and can be used up to 900 m deep. Extending the DR into the deep sea allows for efficient dissolution of CaCO3 as dissolution is favored at high pressure. This reduces the amount of Ca(OH)2 that would be needed to compensate for the unreacted CO2 left in the solution.
The use of Ca(OH)2 and micronized CaCO3 particles comes, however, at an energy and CO2 penalty. This penalty can be minimized using electric energy from renewable sources for the production of Ca(OH)2 and the milling of CaCO3 (Caserini et al., 2021). Furthermore, Ca(OH)2 can potentially be made from steel slags at low temperatures, lowering the CO2 emissions by at least 65 % (Castaño et al., 2021). The estimated cost for capturing and storing CO2 using buffered AWL is comparable with estimates for large-scale geological carbon capture and storage projects (De Marco et al., 2023).
The three feedstock components needed for traditional AWL are water, CaCO3, and CO2, with the addition of Ca(OH)2 in the case of buffered AWL. The amount of materials needed will depend of the pCO2 in the flue gas and the efficiency of the reactor (Table 2).
Limestone (containing 92 %–98 % CaCO3; Rau et al., 2007) is the primary mineral source of CaCO3 as it is much more abundant and less expensive than pure CaCO3 (USD ∼ 4 per tonne of limestone, USD ∼ 105 per tonne of dolomite, USD ∼ 400 per tonne of pure CaCO3; Calcium Carbonate Prices, News, Monitor, Analysis and Demand, 2024; Caserini et al., 2021). The US production of limestone was about 1.05×10⁹ t in 2023 (Survey, 2023), with Sweden being the largest producer in Europe, accounting for a production of 6.3×10⁶ t in 2021 (Mineral statistics, 2024). About 20 % of the limestone production and processing results in waste limestone fines with no significant market value (Rau et al., 2007; Langer et al., 2009). These fines could be used as a low-cost source of CaCO3 for application in AWL and at the same time reduce waste from limestone mining and processing.
Significant volumes of water are needed to dissolve the CO2 and dilute the resulting bicarbonate in the original reactor designs (104–105 t of water per tonne of CO2; Table 2) (Rau et al., 2007; Rau and Caldeira, 1999), although more recent designs have reduced the water demand by a few orders of magnitude (∼ 103 t of water per tonne of CO2; Table 2). The high water demand and the accompanying pumping cost could limit the feasibility of the overall AWL process. Therefore, a low-cost water source such as cooling water from a power plant or other sources of recycled water should be used preferably (Rau and Caldeira, 1999). Due the required quantities of process water, the favored locations for (un)buffered AWL reactors would be coastal regions as seawater is a virtually limitless source, and the bicarbonate-containing effluent could be directly dumped and diluted in the ocean after degassing or buffering and removal of potential contaminants (Rau and Caldeira, 1999; Rau et al., 2001). Pumping costs could further be reduced by reusing the large volumes of seawater already pumped and used as power plant cooling water (Rau et al., 2007; Kirchner et al., 2021). However, the elevated temperature of the seawater during the cooling of the power plants would reduce the CO2 dissolution into the seawater (Kirchner et al., 2021).
The third resource needed in the AWL process is CO2. AWL can use different industrial point sources of CO2. However, the CO2 concentration in the flue gas of different industrial sources can vary substantially from ∼ 3 vol % in a natural gas turbine up to 25 vol % in cement plants (De Marco et al., 2023). As increased CO2 concentrations in the gas stream promote dissolution of CO2 in the seawater, industrial sources with high concentrations of CO2 in the flue gas are preferable (De Marco et al., 2023; Rau and Caldeira, 1999).
Buffered accelerated weathering of limestone uses a fourth feedstock, calcium hydroxide (Ca(OH)2), also known as slaked lime. The Ca(OH)2 is used to buffer the remaining unreacted CO2 at the end of the reactor to be able to release a solution at the same pH as the seawater (Caserini et al., 2021). Slaked lime is produced through calcination of limestone to form calcium oxide (CaO), which is then granulated and hydrated to from Ca(OH)2 (Castaño et al., 2021; Simoni et al., 2022). This production process generates about 1–1.8 t of CO2 per tonne of Ca(OH)2 (Oates, 2008; Simoni et al., 2022). This results in a CO2 penalty for the buffered AWL process. However, if Ca(OH)2 can be made from alkaline industrial waste, such as steel slag, through a calcination-free pathway, the specific CO2 intensity can be reduced by as much as 65 % (Castaño et al., 2021). This will greatly improve the CO2 sequestration efficiency of the buffered AWL process.
Due to the high resource requirements, especially for process water and CaCO3, the (un)buffered AWL plant should preferably be located near the coast and close to limestone deposits and mines. This will reduce the economic and environmental cost of long-distance transport of large volumes of water and limestone and thereby increase the overall efficiency of the (un)buffered AWL process (Kirchner et al., 2021; Rau et al., 2007).
Seawater is the preferable source of process water for AWL as it requires large volumes of water. The intake of large volumes of seawater could lead to entrainment and impingement of small marine organisms (Liyanaarachchi et al., 2014; Missimer and Maliva, 2018). To avoid additional environmental damage to marine organisms from seawater intake, downstream seawater discharge of cooling water from power plant facilities could be used. This combined water usage has several benefits which include (1) avoidance of the need to build expensive offshore intake structures, (2) no need for maintenance of the offshore infrastructure, (3) avoidance of extra potential damage from seawater intake, and (4) minimal need for environmental permitting as primary intake is already permitted (Liyanaarachchi et al., 2014).
During the process of AWL, large amounts of effluent water will be produced that needs to be discharged in rivers or coastal areas. As seawater is a preferred source of process water used in AWL, disposal of the effluent water in the ocean will be the most likely option. Considering the large pool of DIC already present in the ocean and the natural variability of AT on diurnal, seasonal, and interannual basis, the discharge of AWL effluent water can be expected to only have minor effect on AT and DIC concentrations (Rau et al., 2007; Kirchner et al., 2020a). Nevertheless, changes in the balance between AT and DIC induced by AWL discharge can affect pH and the calcite and aragonite saturation state () (Chou et al., 2015; Kirchner et al., 2020a), which in turn can impact the calcification rate of several major groups of marine calcifiers such as coccolithophores, foraminifera, and corals, in a similar fashion to ongoing ocean acidification (Kleypas et al., 1999; Ries et al., 2009). However, the pH in coastal ecosystem can vary strongly in space and time. In vegetated areas, photosynthesis and respiration cause significant change in the environmental pH on a diurnal timescale (0.2–0.7 pH units; Hendriks et al., 2014; Rivest and Gouhier, 2015; James et al., 2020), with the largest pH fluctuations found in sheltered areas with low hydrodynamics (James et al., 2020). Therefore, it is important to consider the local ecosystem and hydrodynamic regime to estimate the effect the discharge water will have on the local environment. The effluent pH from the reactors analyzed here are in the range 6.4–8.5 (Table 2). If the effluent with a pH of 6.5 were discharged directly into the ocean, the expect acidification impact would be significant. To limit environmental effects, the effluent could be diluted with seawater before discharge. A 10-fold dilution would be sufficient to bring an effluent pH of 6.5 back to within the tolerable range of a < 0.2 pH unit change from background levels (Chou et al., 2015). Discharge in a place with strong currents would be favorable to achieve rapid advection and mixing between the discharge water and the receiving seawater (Chou et al., 2015). Inversely, if the effluent water is allowed to equilibrated with the atmosphere before discharge, or buffered with Ca(OH)2, the increased AT and pH would help counter ocean acidification and its effect on marine biota (Rau and Caldeira, 1999; Rau et al., 2007; Chou et al., 2015; Albright et al., 2016; Kirchner et al., 2020a; Sánchez et al., 2024).
Another environmental concern is the potential release of impurities from the limestone or flue gas, in particular, if flue gas from coal-fired power plants were used, as this is known to contain SOx, NOx, and trace elements (Rau et al., 2007; Kirchner et al., 2020a, b). The dissolution of SOx and NOx can lead to the formation of strong acids such as H2SO4, HNO3, and HNO2. These dissolution products can lead to eutrophication and reduced biodiversity if discharged directly in the aquatic environment. Existing flue gas desulfurization facilities already in use at most power plants can effectively remove most of the SOx contained in the flue gas. The solubility of NOx is fairly limited, and most will leave with the CO2-depleted gas stream leaving the AWL reactor. The effluent stream of an AWL pilot plant utilizing desulfurized flue gas contains SO and N species in concentrations below the marine background level (Kirchner et al., 2020b). Trace elements such as Ba, Co, Ni, and Zn could be released from the flue gas or from the dissolution of CaCO3, while increased concentrations of Mn and Co were found in the effluent stream of the AWL plant in Wilhelmshaven (Germany). However, the final concentrations were not expected to be of environmental concern and well below the environmental guidelines (Kirchner et al., 2020b). The potential negative effects from trace elements and other pollutants can be further mitigated using relatively clean waste gas streams (such as from the combustion of natural gas or calcination of CaCO3) in (un)buffered AWL applications.
The disposal of large volumes of process water in the surface water of the coastal zone can locally increase pH and mitigate the adverse effect of ocean acidification on calcifying phytoplankton. However, this implies a reduction of the efficiency of the CO2 sequestration via AWL, as part of the produced AT will be consumed, leading to CO2 degassing (Lehmann and Bach, 2025). Additionally, mixing of this AT enriched coastal water within the coastal sediment through porewater flushing or diffusion could potentially inhibit natural CaCO3 dissolution (Lunstrum and Berelson, 2022; Bach, 2024). If this were to occur, the efficiency of the (un)buffered AWL process would be reduced as the CO2 sequestration by AWL would be partially compensated by a loss of natural CO2 sequestration. However, this is less likely to occur with (un)buffered AWL than with mineral-based ocean alkalinity enhancement (OAE), where alkaline minerals are directly added to the coastal sediment and AT can build up in the porewater (Hartmann et al., 2023).
Accelerated weathering of limestone (AWL) is a CO2 emission mitigation technology that aims to artificially increase the weathering rate of CaCO3 (Rau and Caldeira, 1999). The AWL process consist of four main steps: (i) the CO2 uptake step, (ii) the CaCO3 dissolution step, (iii) the alkalinization step (for buffered AWL), and (iv) the re-equilibration step.
Since the first AWL reactor design proposed by Rau and Caldeira in 1999 (Rau and Caldeira, 1999), laboratory experiments and pilot-scale operations have optimized the CO2 uptake efficiency and reduced resource consumption. Nevertheless, large quantities of water are still needed for the dissolution of CaCO3, while degassing of CO2 after contact of the effluent with the atmosphere limits the CO2 sequestration efficiency. The concept of buffered AWL, as proposed by Caserini et al. (2021), reduces the water requirements and increases the CO2 sequestration efficiency by adding an extra Ca(OH)2 buffering step. This additional step however comes at a CO2 penalty, as conventional production of Ca(OH)2 emits CO2.
Improved design of reactors and generation of feedstock can further optimize the CO2 sequestration efficiencies. The tubular reactor design used in buffered AWL reduces the required reactor size significantly compared to traditional unbuffered AWL reactors. The use of a tubular reactor furthermore allows for long residence times and higher pressures, which stimulates CaCO3 dissolution (Caserini et al., 2021). Furthermore, using renewable energy and starting from waste limestone fines for the milling of CaCO3 particles and producing Ca(OH)2 from alkaline industrial waste via calcination-free processes can avoid the CO2 penalty of buffered AWL (Caserini et al., 2021; Castaño et al., 2021). The pumping of the large quantities of process water needed in (un)buffered AWL requires a significant amount of energy. Therefore, optimization of the water usage is needed and could be achieved by increasing the pressure of the incoming gas stream or increasing the fraction of CO2 in the gas stream. Reusing the cooling water from nearby power plants could further reduce costs and environmental damage associated with large water intake. Further optimization of the dissolution kinetics of the micronized CaCO3 particles could reduce the amount of Ca(OH)2 needed in the buffering, thereby reducing the energy and CO2 penalty from the Ca(OH)2 production.
The effects of disposing large amounts of effluent with increased AT, altered pH, and trace elements to the marine environment are currently poorly constrained. Existing research on ocean acidification and ecotoxicological studies on trace element toxicity can provide information of ecosystem impacts of AWL water discharge. However, because of the limited number of operational pilot plants, little is known about the actual conditions that can be expected for AWL water discharge. If AWL is to be implemented as a CO2 emission mitigation technology on a large scale in the next decade, more pilot plants should be constructed sooner rather than later.
The code used for analysis in this study is available upon request. Interested parties may contact the corresponding author.
All datasets used in this paper are derived from the published literature that is cited in the text. Full citations for these sources are provided in the References of this article (Caserini et al., 2021; Chou et al., 2015; Kirchner et al., 2020b). Calculations with these data are performed using the formulas provided in Sect. 2 of this article.
FJRM conceptualized the idea for the review. TH was responsible for data collection, analysis, and visualization, and SJVDV supervised the study. TH and FJRM worked out the model formulation. TH wrote the manuscript with substantial contribution from all authors.
The contact author has declared that none of the authors has any competing interests.
Publisher's note: Copernicus Publications remains neutral with regard to jurisdictional claims made in the text, published maps, institutional affiliations, or any other geographical representation in this paper. While Copernicus Publications makes every effort to include appropriate place names, the final responsibility lies with the authors.
The authors thank Gunter Flipkens for academic discussions.
This research was supported by the Research Foundation Flanders (FWO-SBO project S000619N) and the VLAIO Blauwe cluster project “Blue Alkalinity” (HBC.2023.0496). Additional financial support was provided by Team for the Planet (https://team-planet.com, last access: 1 February 2025), a citizen community initiative dedicated to tackling the climate challenge (funding through a collaboration agreement with its Carbon Time subsidiary).
This paper was edited by Tyler Cyronak and reviewed by two anonymous referees.
Albright, R., Caldeira, L., Hosfelt, J., Kwiatkowski, L., Maclaren, J. K., Mason, B. M., Nebuchina, Y., Ninokawa, A., Pongratz, J., Ricke, K. L., Rivlin, T., Schneider, K., Sesboüé, M., Shamberger, K., Silverman, J., Wolfe, K., Zhu, K., and Caldeira, K.: Reversal of ocean acidification enhances net coral reef calcification, Nature, 531, 362–365, https://doi.org/10.1038/nature17155, 2016.
Bach, L. T.: The additionality problem of ocean alkalinity enhancement, Biogeosciences, 21, 261–277, https://doi.org/10.5194/bg-21-261-2024, 2024.
Berner, R. A. and Berner, R. A.: The Phanerozoic Carbon Cycle: CO2 and O2, Oxford University Press, Oxford, New York, 158 pp., ISBN 9780197562215, https://doi.org/10.1093/oso/9780195173338.001.0001, 2004.
Berner, R. A. and Morse, J. W.: Dissolution kinetics of calcium carbonate in sea water; IV, Theory of calcite dissolution, American Journal of Science, 274, 108–134, 1974.
Berner, R. A., Lasaga, A. C., and Garrels, R. M.: The Carbonate-Silicate Geochemical Cycle and Its Effect on Atmospheric Carbon-Dioxide over the Past 100 Million Years, Am. J. Sci., 283, 641–683, https://doi.org/10.2475/ajs.283.7.641, 1983.
Calcium Carbonate Prices, News, Monitor, Analysis and Demand: Calcium Carbonate Price Trend and Forecast, https://www.chemanalyst.com/Pricing-data/calcium-carbonate-1158, last access: 27 March 2024.
Caldeira, K. and Rau, G. H.: Accelerating carbonate dissolution to sequester carbon dioxide in the ocean: Geochemical implications, Geophysical Research Letters, 27, 225–228, https://doi.org/10.1029/1999GL002364, 2000.
Calvin, K., Dasgupta, D., Krinner, G., Mukherji, A., Thorne, P. W., Trisos, C., Romero, J., Aldunce, P., Barrett, K., Blanco, G., Cheung, W. W. L., Connors, S., Denton, F., Diongue-Niang, A., Dodman, D., Garschagen, M., Geden, O., Hayward, B., Jones, C., Jotzo, F., Krug, T., Lasco, R., Lee, Y.-Y., Masson-Delmotte, V., Meinshausen, M., Mintenbeck, K., Mokssit, A., Otto, F. E. L., Pathak, M., Pirani, A., Poloczanska, E., Pörtner, H.-O., Revi, A., Roberts, D. C., Roy, J., Ruane, A. C., Skea, J., Shukla, P. R., Slade, R., Slangen, A., Sokona, Y., Sörensson, A. A., Tignor, M., Van Vuuren, D., Wei, Y.-M., Winkler, H., Zhai, P., Zommers, Z., Hourcade, J.-C., Johnson, F. X., Pachauri, S., Simpson, N. P., Singh, C., Thomas, A., Totin, E., Arias, P., Bustamante, M., Elgizouli, I., Flato, G., Howden, M., Méndez-Vallejo, C., Pereira, J. J., Pichs-Madruga, R., Rose, S. K., Saheb, Y., Sánchez Rodríguez, R., Ürge-Vorsatz, D., Xiao, C., Yassaa, N., Alegría, A., Armour, K., Bednar-Friedl, B., Blok, K., Cissé, G., Dentener, F., Eriksen, S., Fischer, E., Garner, G., Guivarch, C., Haasnoot, M., Hansen, G., Hauser, M., Hawkins, E., Hermans, T., Kopp, R., Leprince-Ringuet, N., Lewis, J., Ley, D., Ludden, C., Niamir, L., Nicholls, Z., Some, S., Szopa, S., Trewin, B., Van Der Wijst, K.-I., Winter, G., Witting, M., Birt, A., Ha, M., Lee, H., Abdullq, A., Aldrian, E., Barret, K., Clavo, E., Carraro, C., Dadi, D. K., Driouech, F., Fischlin, A., Fuglestvedt, J., Krug, T., Mahmoud. N. G. E., Masson-Delmotte, V., Méndez. C., Pereira, J. J., Pichs-Madruga, R., Pörtner, H., Reisinger, A., Roberts, D. C., Semenov. S., Shukla, P., Skea, J., Sokona, Y., Tanabe, K., Tariq, M. I., ürge-Vorsatz, D., Vera, C., Yanada, P., Yassaa, N., Zatari, T. M., and Zhai, P.: IPCC, 2023: Climate Change 2023: Synthesis Report. Contribution of Working Groups I, II and III to the Sixth Assessment Report of the Intergovernmental Panel on Climate Change [Core Writing Team: Lee, H. and Romero, J., IPCC, Geneva, Switzerland, Intergovernmental Panel on Climate Change (IPCC), https://doi.org/10.59327/IPCC/AR6-9789291691647, 2023.
Campbell, J. S., Foteinis, S., Furey, V., Hawrot, O., Pike, D., Aeschlimann, S., Maesano, C. N., Reginato, P. L., Goodwin, D. R., Looger, L. L., Boyden, E. S., and Renforth, P.: Geochemical Negative Emissions Technologies: Part I: Review, Front. Clim., 4, https://doi.org/10.3389/fclim.2022.879133, 2022.
Cao, X., Li, Q., Xu, L., and Tan, Y.: A review of in situ carbon mineralization in basalt, Journal of Rock Mechanics and Geotechnical Engineering, 16, 1467–1485, https://doi.org/10.1016/j.jrmge.2023.11.010, 2024.
Caserini, S., Cappello, G., Righi, D., Raos, G., Campo, F., De Marco, S., Renforth, P., Varliero, S., and Grosso, M.: Buffered accelerated weathering of limestone for storing CO2: Chemical background, International Journal of Greenhouse Gas Control, 112, 103517, https://doi.org/10.1016/j.ijggc.2021.103517, 2021.
Castaño, S. V., Plante, E. C. L., Shimoda, S., Wang, B., Neithalath, N., Sant, G., and Pilon, L.: Calcination-free production of calcium hydroxide at sub-boiling temperatures, RSC Adv., 11, 1762–1772, https://doi.org/10.1039/D0RA08449B, 2021.
Chou, W.-C., Gong, G.-C., Hsieh, P.-S., Chang, M.-H., Chen, H.-Y., Yang, C.-Y., and Syu, R.-W.: Potential impacts of effluent from accelerated weathering of limestone on seawater carbon chemistry: A case study for the Hoping power plant in northeastern Taiwan, Marine Chemistry, 168, 27–36, https://doi.org/10.1016/j.marchem.2014.10.008, 2015.
Damu, D. N. A., Lee, A. G. J., Chai, S. Y. W., and Ngu, L. H.: Accelerated weathering of construction-grade limestone for CO2 absorption, Greenhouse Gases: Science and Technology, 14, 1049–1067, https://doi.org/10.1002/ghg.2311, 2024.
De Marco, S., Varliero, S., Caserini, S., Cappello, G., Raos, G., Campo, F., and Grosso, M.: Techno-economic evaluation of buffered accelerated weathering of limestone as a CO2 capture and storage option, Mitig. Adapt. Strateg. Glob. Change, 28, 17, https://doi.org/10.1007/s11027-023-10052-x, 2023.
Dickson, A. G.: An Exact Definition of Total Alkalinity and a Procedure for the Estimation of Alkalinity and Total Inorganic Carbon from Titration Data, Deep-Sea Res., 28, 609–623, https://doi.org/10.1016/0198-0149(81)90121-7, 1981.
Dong, S., Subhas, A. V., Rollins, N. E., Naviaux, J. D., Adkins, J. F., and Berelson, W. M.: A kinetic pressure effect on calcite dissolution in seawater, Geochimica et Cosmochimica Acta, 238, 411–423, https://doi.org/10.1016/j.gca.2018.07.015, 2018.
Dong, S., Berelson, W. M., Forin, P., Gutierrez, M., Carroll, D., Menemenlis, D., Kyi, A. Y., and Adkins, J. F.: Potential of CO2 sequestration through accelerated weathering of limestone on ships, Science Advances, 11, eadr7250, https://doi.org/10.1126/sciadv.adr7250, 2025.
Gadikota, G.: Carbon mineralization pathways for carbon capture, storage and utilization, Commun. Chem., 4, 1–5, https://doi.org/10.1038/s42004-021-00461-x, 2021.
Geerts, L. J. J., Hylén, A., and Meysman, F. J. R.: Review and syntheses: Ocean alkalinity enhancement and carbon dioxide removal through marine enhanced rock weathering using olivine, Biogeosciences, 22, 355–384, https://doi.org/10.5194/bg-22-355-2025, 2025.
Hartmann, J., Suitner, N., Lim, C., Schneider, J., Marín-Samper, L., Arístegui, J., Renforth, P., Taucher, J., and Riebesell, U.: Stability of alkalinity in ocean alkalinity enhancement (OAE) approaches – consequences for durability of CO2 storage, Biogeosciences, 20, 781–802, https://doi.org/10.5194/bg-20-781-2023, 2023.
He, J. and Tyka, M. D.: Limits and CO equilibration of near-coast alkalinity enhancement, Biogeosciences, 20, 27–43, https://doi.org/10.5194/bg-20-27-2023, 2023.
Hendriks, I. E., Olsen, Y. S., Ramajo, L., Basso, L., Steckbauer, A., Moore, T. S., Howard, J., and Duarte, C. M.: Photosynthetic activity buffers ocean acidification in seagrass meadows, Biogeosciences, 11, 333–346, https://doi.org/10.5194/bg-11-333-2014, 2014.
Hofmann, A. F., Soetaert, K., Middelburg, J. J., and Meysman, F. J. R.: AquaEnv: An Aquatic Acid–Base Modelling Environment in R, Aquat. Geochem., 16, 507–546, https://doi.org/10.1007/s10498-009-9084-1, 2010.
James, R. K., van Katwijk, M. M., van Tussenbroek, B. I., van der Heide, T., Dijkstra, H. A., van Westen, R. M., Pietrzak, J. D., Candy, A. S., Klees, R., Riva, R. E. M., Slobbe, C. D., Katsman, C. A., Herman, P. M. J., and Bouma, T. J.: Water motion and vegetation control the pH dynamics in seagrass-dominated bays, Limnology and Oceanography, 65, 349–362, https://doi.org/10.1002/lno.11303, 2020.
Jones, D. C., Ito, T., Takano, Y., and Hsu, W.-C.: Spatial and seasonal variability of the air-sea equilibration timescale of carbon dioxide, Global Biogeochemical Cycles, 28, 1163–1178, https://doi.org/10.1002/2014GB004813, 2014.
Kheshgi, H. S.: Sequestering atmospheric carbon dioxide by increasing ocean alkalinity, Energy, 20, 915–922, https://doi.org/10.1016/0360-5442(95)00035-F, 1995.
Kirchner, J. S., Lettmann, K. A., Schnetger, B., Wolff, J.-O., and Brumsack, H.-J.: Carbon capture via accelerated weathering of limestone: Modeling local impacts on the carbonate chemistry of the southern North Sea, International Journal of Greenhouse Gas Control, 92, 102855, https://doi.org/10.1016/j.ijggc.2019.102855, 2020a.
Kirchner, J. S., Berry, A., Ohnemüller, F., Schnetger, B., Erich, E., Brumsack, H.-J., and Lettmann, K. A.: Reducing CO2 Emissions of a Coal-Fired Power Plant via Accelerated Weathering of Limestone: Carbon Capture Efficiency and Environmental Safety, Environ. Sci. Technol., 54, 4528–4535, https://doi.org/10.1021/acs.est.9b07009, 2020b.
Kirchner, J. S., Lettmann, K. A., Schnetger, B., Wolff, J.-O., and Brumsack, H.-J.: Identifying Appropriate Locations for the Accelerated Weathering of Limestone to Reduce CO2 Emissions, Minerals, 11, 1261, https://doi.org/10.3390/min11111261, 2021.
Kleypas, J. A., Buddemeier, R. W., Archer, D., Gattuso, J.-P., Langdon, C., and Opdyke, B. N.: Geochemical Consequences of Increased Atmospheric Carbon Dioxide on Coral Reefs, Science, 284, 118–120, https://doi.org/10.1126/science.284.5411.118, 1999.
Langer, W. H., Juan, C. A., Rau, G., and Caldeira, K.: Accelerated weathering of limestone for CO2 mitigation: Opportunities for the stone and cement industries, Mining Engineering, 61, 27–32, 2009.
Lehmann, N. and Bach, L. T.: Global carbonate chemistry gradients reveal a negative feedback on ocean alkalinity enhancement, Nat. Geosci., 18, 232–238, https://doi.org/10.1038/s41561-025-01644-0, 2025.
Liyanaarachchi, S., Shu, L., Muthukumaran, S., Jegatheesan, V., and Baskaran, K.: Problems in seawater industrial desalination processes and potential sustainable solutions: a review, Rev. Environ. Sci. Biotechnol., 13, 203–214, https://doi.org/10.1007/s11157-013-9326-y, 2014.
Lunstrum, A. and Berelson, W.: CaCO3 dissolution in carbonate-poor shelf sands increases with ocean acidification and porewater residence time, Geochimica et Cosmochimica Acta, 329, 168–184, https://doi.org/10.1016/j.gca.2022.04.031, 2022.
Matter, J. M. and Kelemen, P. B.: Permanent storage of carbon dioxide in geological reservoirs by mineral carbonation, Nat. Geosci., 2, 837–841, https://doi.org/10.1038/ngeo683, 2009.
Meysman, F. J. R. and Montserrat, F.: Negative CO emissions via enhanced silicate weathering in coastal environments, Biol. Lett., 13, https://doi.org/10.1098/rsbl.2016.0905, 2017.
Missimer, T. M. and Maliva, R. G.: Environmental issues in seawater reverse osmosis desalination: Intakes and outfalls, Desalination, 434, 198–215, https://doi.org/10.1016/j.desal.2017.07.012, 2018.
Moras, C. A., Bach, L. T., Cyronak, T., Joannes-Boyau, R., and Schulz, K. G.: Ocean alkalinity enhancement – avoiding runaway CaCO3 precipitation during quick and hydrated lime dissolution, Biogeosciences, 19, 3537–3557, https://doi.org/10.5194/bg-19-3537-2022, 2022.
Morse, J. W. and He, S.: Influences of T, S and PCO2 on the pseudo-homogeneous precipitation of CaCO3 from seawater: implications for whiting formation, Marine Chemistry, 41, 291–297, https://doi.org/10.1016/0304-4203(93)90261-L, 1993.
Morse, J. W., Arvidson, R. S., and Lüttge, A.: Calcium Carbonate Formation and Dissolution, Chem. Rev., 107, 342–381, https://doi.org/10.1021/cr050358j, 2007.
Mucci, A., Canuel, R., and Zhong, S.: The solubility of calcite and aragonite in sulfate-free seawater and the seeded growth kinetics and composition of the precipitates at 25 °C, Chemical Geology, 74, 309–320, https://doi.org/10.1016/0009-2541(89)90040-5, 1989.
Oates, J. A. H.: Lime and Limestone: Chemistry and Technology, Production and Uses, John Wiley & Sons, 475 pp., ISBN 9783527612024, https://doi.org/10.1002/9783527612024, 2008.
Rau, G., Caldeira, K., Knauss, K., Downs, B., and Sarv, H.: Enhanced Carbonate Dissolution as a Means of Capturing and Sequestering Carbon Dioxide, in: First National Conference on Carbon Sequestration, Washington DC, US, 14–17 May 2001, 2001.
Rau, G. H.: CO2 Mitigation via Capture and Chemical Conversion in Seawater, Environ. Sci. Technol., 45, 1088–1092, https://doi.org/10.1021/es102671x, 2011.
Rau, G. H. and Caldeira, K.: Enhanced carbonate dissolution:: a means of sequestering waste CO2 as ocean bicarbonate, Energy Conversion and Management, 40, 1803–1813, https://doi.org/10.1016/S0196-8904(99)00071-0, 1999.
Rau, G. H., Knauss, K. G., Langer, W. H., and Caldeira, K.: Reducing energy-related CO2 emissions using accelerated weathering of limestone, Energy, 32, 1471–1477, https://doi.org/10.1016/j.energy.2006.10.011, 2007.
Renforth, P. and Henderson, G.: Assessing ocean alkalinity for carbon sequestration, Rev. Geophys., 55, 636–674, https://doi.org/10.1002/2016rg000533, 2017.
Renforth, P. and Kruger, T.: Coupling Mineral Carbonation and Ocean Liming, Energy Fuels, 27, 4199–4207, https://doi.org/10.1021/ef302030w, 2013.
Ries, J. B., Cohen, A. L., and McCorkle, D. C.: Marine calcifiers exhibit mixed responses to CO2-induced ocean acidification, Geology, 37, 1131–1134, https://doi.org/10.1130/G30210A.1, 2009.
Rivest, E. B. and Gouhier, T. C.: Complex Environmental Forcing across the Biogeographical Range of Coral Populations, PLOS ONE, 10, e0121742, https://doi.org/10.1371/journal.pone.0121742, 2015.
Romanov, V., Soong, Y., Carney, C., Rush, G. E., Nielsen, B., and O'Connor, W.: Mineralization of Carbon Dioxide: A Literature Review, ChemBioEng. Rev., 2, 231–256, https://doi.org/10.1002/cben.201500002, 2015.
Sánchez, N., Goldenberg, S. U., Brüggemann, D., Jaspers, C., Taucher, J., and Riebesell, U.: Plankton food web structure and productivity under ocean alkalinity enhancement, Science Advances, 10, eado0264, https://doi.org/10.1126/sciadv.ado0264, 2024.
Sanderson, B. M., O'Neill, B. C., and Tebaldi, C.: What would it take to achieve the Paris temperature targets?, Geophys. Res. Lett., 43, 7133–7142, https://doi.org/10.1002/2016gl069563, 2016.
Simoni, M., Wilkes, M. D., Brown, S., Provis, J. L., Kinoshita, H., and Hanein, T.: Decarbonising the lime industry: State-of-the-art, Renewable and Sustainable Energy Reviews, 168, 112765, https://doi.org/10.1016/j.rser.2022.112765, 2022.
Snæbjörnsdóttir, S. Ó., Sigfússon, B., Marieni, C., Goldberg, D., Gislason, S. R., and Oelkers, E. H.: Carbon dioxide storage through mineral carbonation, Nat. Rev. Earth Environ., 1, 90–102, https://doi.org/10.1038/s43017-019-0011-8, 2020.
Song, Y., Jun, S., Na, Y., Kim, K., Jang, Y., and Wang, J.: Geomechanical challenges during geological CO2 storage: A review, Chemical Engineering Journal, 456, 140968, https://doi.org/10.1016/j.cej.2022.140968, 2023.
Survey, U. S. G.: Mineral commodity summaries 2023, Mineral Commodity Summaries, U.S. Geological Survey, https://doi.org/10.3133/mcs2023, 2023.
Teir, S., Suomalainen, M., and Onarheim, K.: Pre-evaluation of a new process for capture of CO2 using water, VTT Technical Centre of Finland, 20 pp., https://publications.vtt.fi/julkaisut/muut/2014/VTT-R-04035-14.pdf (last access: 15 January 2025), 2014.
Thonemann, N., Zacharopoulos, L., Fromme, F., and Nühlen, J.: Environmental impacts of carbon capture and utilization by mineral carbonation: A systematic literature review and meta life cycle assessment, Journal of Cleaner Production, 332, 130067, https://doi.org/10.1016/j.jclepro.2021.130067, 2022.
United Nations Environment Programme: Emissions Gap Report 2024: No more hot air … please! With a massive gap between rhetoric and reality, countries draft new climate commitments, United Nations Environment Programme, ISBN 978-92-807-4185-8, https://doi.org/10.59117/20.500.11822/46404, 2024.
Veetil, S. P. and Hitch, M.: Recent developments and challenges of aqueous mineral carbonation: a review, Int. J. Environ. Sci. Technol., 17, 4359–4380, https://doi.org/10.1007/s13762-020-02776-z, 2020.
Xing, L., Pullin, H., Bullock, L., Renforth, P., Darton, R. C., and Yang, A.: Potential of enhanced weathering of calcite in packed bubble columns with seawater for carbon dioxide removal, Chemical Engineering Journal, 431, 134096, https://doi.org/10.1016/j.cej.2021.134096, 2022.
Zeebe, R. E. and Wolf-Gladrow, D.: CO2 in seawater: equilibrium, kinetics and isotopes, Elsevier Science, Amsterdam, ISBN 978-0-444-50579-8, 2001.
Zhang, J., Yang, A., Darton, R., Xing, L., and Vaughan, A.: Surrogate modelling-assisted comparison of reactor schemes for carbon dioxide removal by enhanced weathering of minerals using seawater, Chemical Engineering Journal, 461, 141804, https://doi.org/10.1016/j.cej.2023.141804, 2023.
- Abstract
- Introduction
- The theoretical principle of AWL
- Different reactor designs for AWL
- AWL feedstocks
- Environmental concerns
- Summary and conclusions
- Code availability
- Data availability
- Author contributions
- Competing interests
- Disclaimer
- Acknowledgements
- Financial support
- Review statement
- References