the Creative Commons Attribution 4.0 License.
the Creative Commons Attribution 4.0 License.
 | 21 Oct 2025
Carbohydrates, enzyme activities, and microbial communities across depth gradients in the western North Atlantic Ocean
C. Chad Lloyd
Sarah Brown
Greta Giljan
Sherif Ghobrial
Silvia Vidal-Melgosa
Nicola Steinke
Jan-Hendrik Hehemann
Rudolf Amann
Carol Arnosti
Heterotrophic bacteria process nearly half of the organic matter produced by phytoplankton in the surface ocean. Much of this organic matter consists of high-molecular-weight (HMW) biopolymers such as polysaccharides and proteins, which must initially be hydrolyzed to smaller sizes by structurally specific extracellular enzymes. Few previous studies, however, have investigated the structural complexity of polysaccharides among regions and depths. To simultaneously investigate substrate structure and microbial community composition and function, we concurrently determined carbohydrate abundance and structural complexity, bacterial community composition, and peptidase and polysaccharide hydrolase activities across depth gradients from surface to bottom water at four distinct stations in the western North Atlantic Ocean. Although the monosaccharide constituents of particulate organic matter (POM) were similar among stations, the structural complexity of POM-derived polysaccharides varied by depth and station, as demonstrated by polysaccharide-specific antibody probing. Bacterial community composition and polysaccharide hydrolase activities also varied substantially by depth, suggesting that the structure and function of bacterial communities may be related to substrate structural complexity. Thus, the extent to which bacteria can transform organic matter in the ocean is dependent on both the structural complexity of the organic matter and their enzymatic capabilities in different depths and regions of the ocean.
- Article
(6682 KB) - Full-text XML
-
Supplement
(4171 KB) - BibTeX
- EndNote


Polysaccharides and proteins are major macromolecular components of the phytoplankton-derived organic matter (Wakeham et al., 1997; Hedges et al., 2002) that forms the base of marine food webs. Much of this organic matter is processed by heterotrophic bacterial communities (Azam and Malfatti, 2007) that use structure-specific extracellular enzymes (Lombard et al., 2014) to hydrolyze high-molecular-weight (HMW) organic matter to sizes suitable for uptake (Fig. 1a). Since different community members possess distinct enzymatic complements (Avci et al., 2020; Krüger et al., 2019), the composition of a microbial community is an important determinant of a community's enzymatic capabilities. These community enzymatic capabilities vary with depth and location in the ocean (Arnosti et al., 2011; Steen et al., 2012; Hoarfrost and Arnosti, 2017; Balmonte et al., 2021). However, the cues to which these microbial communities are responding – in particular, the structure of the macromolecules that they sense and target – have to date not been well characterized.
This long-standing knowledge gap (Hedges et al., 2000) is due in part to the difficulties of characterizing intact macromolecules. These macromolecules are found as part of the HMW dissolved (DOM) and particulate (POM) phases of organic matter. POM is operationally defined by filtration – organic matter retained by a filter of defined pore size – and DOM is the filtrate; large volumes of DOM can be concentrated (often via ultrafiltration) to HMW DOM. The macromolecules in HMW DOM as well as in POM include proteins and polysaccharides, which are typically broken into component pieces for further analysis. Although recent analytical advances have enabled high-resolution identification of protein structures in marine organic matter (e.g., Morris et al., 2010; Saito et al., 2019; Francis et al., 2021; Saunders et al., 2022), comparable analyses are not yet possible for polysaccharides. A major issue is the fact that the individual monosaccharides that make up a polysaccharide can be linked in multiple positions, unlike the amino acids that make up proteins. As a result, even a few monosaccharides can be linked in multiple ways (Laine, 1994). Monomer analysis thus cannot provide information about the order of the monomers in a polymer chain or the 3D structure of the initial macromolecule (Fig. 1b), aspects of structure that are essential for enzyme-substrate “fit”.
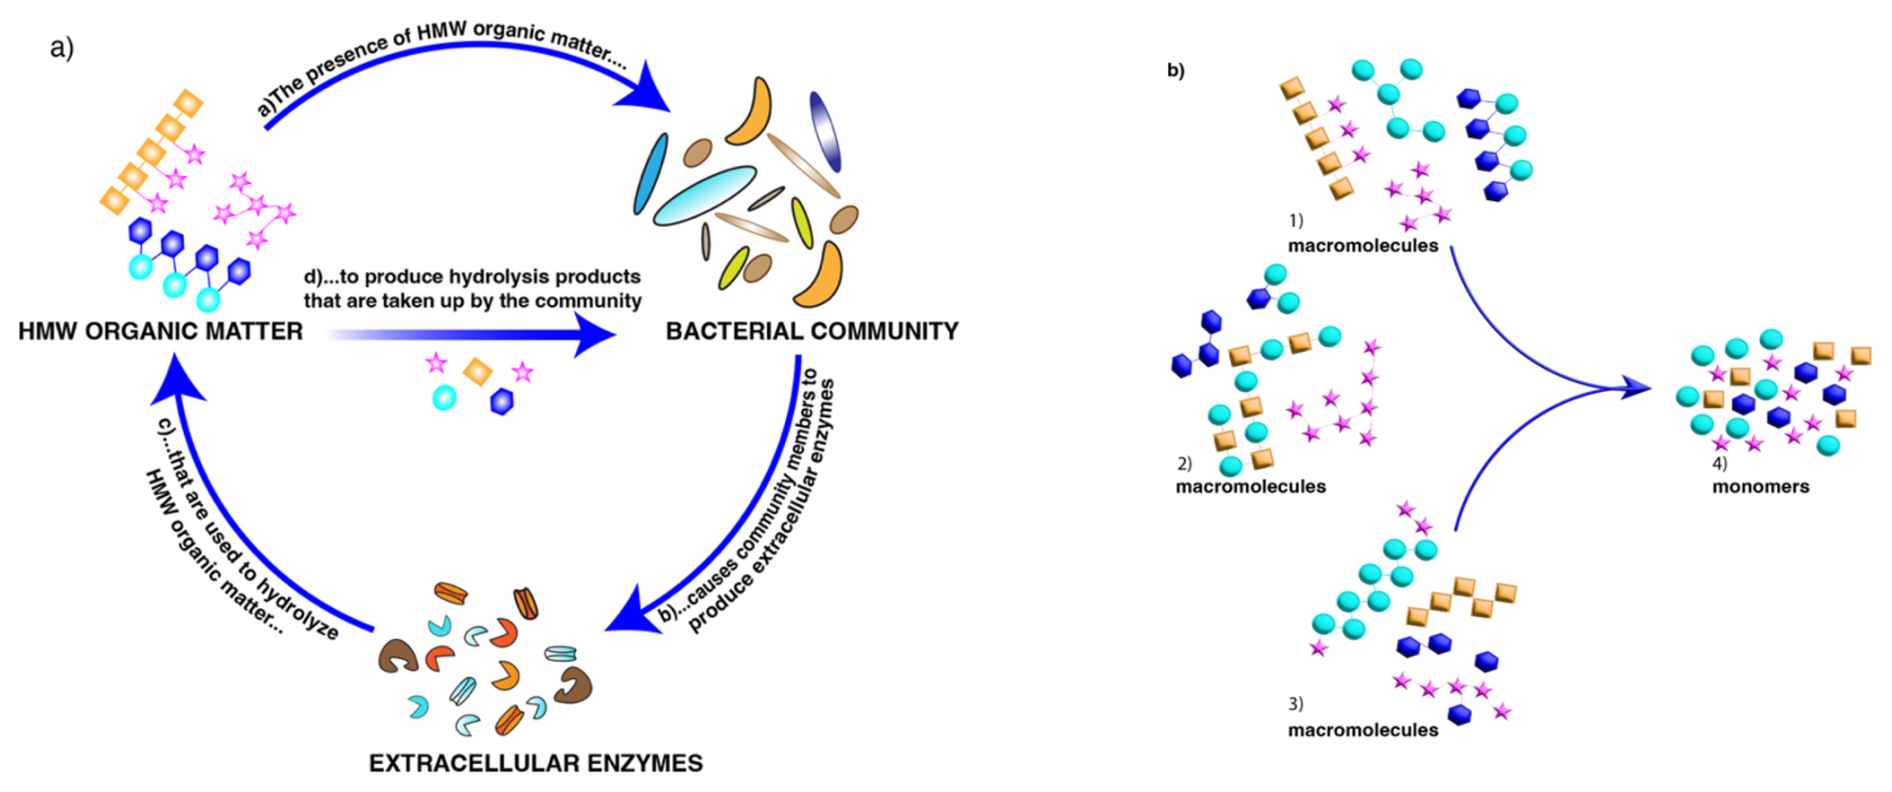
Figure 1(a) Key factors affecting biogeochemical cycling of high-molecular-weight (HMW) organic matter in the ocean: macromolecular structure, microbial community composition/capabilities, and the activities of the extracellular enzymes that process specific macromolecules. (b) Conceptual representation of three different groups of macromolecules (1–3) that could lead to the same pool of hydrolyzed monomers (4). Analysis of the monomers provides no information on the original sequence or 3D structure of the parent macromolecule(s) – structural features that are essential for enzyme-substrate fit.
Interrelated factors therefore play a key role in the biogeochemical cycling of organic matter in the ocean: the structure of marine organic matter, the capabilities of the microbial communities that process it, and the activities of the enzymatic tools they use to initiate its degradation (Fig. 1a). Here, we investigate these factors through a variety of approaches. We use recent advances in carbohydrate chemistry (Vidal-Melgosa et al., 2021; Buck-Wiese et al., 2023) that have previously been used only once in the open ocean (Priest et al., 2023) to derive new insight into the structural complexity of marine carbohydrates. Currently, however, these advanced analytical techniques can only be carried out on POM or on HMW DOM. We use well-established methods to determine composition of microbial communities from water samples collected at different depths and locations in the ocean. However, with the exception of “selfish” bacteria (Cuskin et al., 2015; Reintjes et al., 2017), it is not yet possible to definitively link specific microbial taxa in these communities with the activities of the extracellular enzymes they release to initiate the degradation of HMW organic matter: these enzyme activities currently can only be measured on a whole-community level. We therefore measured community composition and the activities of these communities' enzymes in similar water volumes from the same samples. Given the relatively small volumes of water used in our analyses, the bacterial community – as well as the activities of the enzymes we measured – likely predominately represents the free-living fraction; the carbohydrate analyses, due to the requirement for higher concentrations of organic matter, were carried out on POM.
Through the depth of the water column at four distinct sites in the western North Atlantic Ocean, we measured the activities of enzymes targeting polysaccharides and proteins, microbial community composition, and carbohydrate constituents of organic matter. These stations are characterized by different water masses and levels of primary productivity, and thus are likely to have distinct microbial communities. Although previous investigations have compared bacterial community composition with polysaccharide hydrolase activities (e.g., Murray et al., 2007; Teske et al., 2011; Arnosti et al., 2012; Balmonte et al., 2018; Giljan et al., 2023; Lloyd et al., 2023), this is the first study to also investigate the structure and abundance of the combined carbohydrates these communities may target.
2.1 Stations and water sampling
Water samples were collected in the western North Atlantic aboard R/V Endeavor (cruise EN638; 15–30 May 2019). Samples were collected at one continental slope station and three open ocean stations (Stns. 17 and 18–20, respectively; Fig. 2; Table S1 in the Supplement) using a Niskin rosette (12×30 L bottles) equipped with a Seabird 32 CTD. At each offshore station, water was collected from seven discrete depth horizons, i.e., the surface (∼ 3 m), the deep chlorophyll maximum (DCM, as observed from the CTD's fluorescence sensor), 300 m, the lower mesopelagic (typically between 600 and 850 m), 1500, 3000 m, and the bottom (ranging from 3190 to 5580 m). At Stn. 17, water was collected from the surface, DCM, and bottom (depth: 625 m). Seawater was transferred from Niskin bottles into 20 L carboys that had been acid-washed and rinsed with reverse osmosis water, and then it was rinsed three times with seawater from the sampling depth prior to filling. Transfers were carried out using silicone tubing that had been acid-washed and rinsed with reverse osmosis water prior to use. Seawater was taken directly from the carboys to measure bacterial protein production, polysaccharide hydrolase activities, peptidase activities, and glucosidase activities, as described below.
Temperature (T), salinity (S), O2, and chlorophyll-a concentration data (Table S2) are all from the Seabird CTD sensors. Chlorophyll a was calculated by multiplying the scaling factor (µg L−1 V−1) by the sensor-corrected sensor output (output – dark counts, V) to obtain a concentration (µg L−1). This value was then converted to mg m−3 (see Table S2).
2.2 Bacterial production and cell counts
2.2.1 Bacterial productivity
Bacterial productivity was measured after Kirchman et al. (2001), using incorporation of tritiated leucine (3H-Leu; 20 nM). In brief, leucine incorporation rates were measured in samples incubated in the dark at in situ temperatures. Leucine incorporation rates are reported as pmol leucine per liter per hour.
2.2.2 Bacterial cell counts
Seawater samples were fixed with formaldehyde at a final concentration of 1 %, and then 25–50 mL of the fixed samples were filtered through a polycarbonate filter (pore size: 0.22 µm) at a maximum vacuum of 200 mbar. DNA staining was done using 4′,6-Diamidin-2-phenylindol (DAPI), and samples were mounted with a Citifluor VectaShield (4:1) solution. Cell counting was done using a fully automated epifluorescence microscope (Zeiss AxioImager.Z2 microscope stand, Carl Zeiss) and image analysis was carried out as described by Bennke et al. (2016). Cell count verification of the automated image analysis was done manually.
2.3 Organic matter analyses of POM
2.3.1 Collection of particulate organic matter
To determine the structural complexity of carbohydrates (epitope analysis; see below), the current state of the art require analysis of POM collected on a glass fiber filter or HMW DOM concentrated via ultrafiltration; the concentration of carbohydrates dissolved in seawater is far too low for direct detection using this technique. Since we did not have access shipboard to equipment that would be required for ultrafiltration, we focused on POM composition. The POM was collected by filtering 5–15 L of water through a 47 mm pre-combusted (400 °C for 6 h) glass fiber filter (GF/F; nominal pore size 0.7 µm; for volumes filtered at each depth and station, see Table S3). These samples were collected at all of the depths and stations.
2.3.2 Particulate organic carbon
Particulate organic carbon was measured as described in Becker et al. (2020). In brief, triplicate filter punches from samples collected on pre-combusted (400 °C for 6 h) glass fiber filters (GF/F) were placed in an acidic environment (concentrated HCl fumes) for 24 h to remove inorganic carbon. After drying for 24 h at 60 °C, the samples were packed in pre-combusted tin foil. C was quantified using an elemental analyzer (cario MICRO cube; Elementar Analysensysteme) using sulfanilamide for calibration. The limit of detection for POC was 0.001 mg C L−1, based on the standard deviation of blank measurements.
2.3.3 Monosaccharide composition of POM
The monosaccharide constituents of total combined carbohydrates (i.e., polysaccharides, glycoproteins, and glycolipids) of POM (collected as described above) were determined from triplicate filter punches (11.2 mm diameter). Samples were acid hydrolyzed by adding 1 M HCl to each filter piece, flame sealing each piece in a glass ampule, and placing the ampules in a drying oven at 100 °C for 24 h. After acid hydrolysis, the samples were dried on a speed-vac and resuspended in Milli-Q to remove any HCl. The quantity and composition of the resulting monosaccharides were measured using a modified protocol (Engel and Handel, 2011, as described by Vidal-Melgosa et al., 2021). In brief, neutral, amino, and acidic sugars were quantified using high-performance anion exchange chromatography on a Dionex ICS-5000+ system with pulsed amperometric detection (HPAEC-PAD). Peaks were identified using retention times of purified monosaccharide standards; abundance was quantified from standards using the peak area for a given monosaccharide. The limit of detection for monosaccharides varied from 0.5 to 10 µg L−1, depending on the specific monosaccharide measured. Note that the recovery of monosaccharides from acid hydrolysis of marine samples is typically considered to yield an underestimate of total carbohydrates due to incomplete hydrolysis of acid-resistant structures, and destruction of acid-labile monosaccharides, as well as cross-reactivity of hydrolyzed monosaccharides with amino acids (Engel and Handel, 2011; Becker et al., 2020).
2.3.4 Polysaccharide extraction for microarray analyses of POM
POM samples were prepared for polysaccharide analysis according to Vidal-Melgosa et al. (2021). Polysaccharides were sequentially extracted from four filter piece punches (11.2 mm diameter) from GF/F filters. The samples were first extracted with autoclaved MilliQ water, followed by 50 mM EDTA, and finally 4 M NaOH with 0.1 % NaBH4. These different extraction steps are required to extract polysaccharides of varying structure and solubility. The supernatant containing extracted polysaccharides was collected from each of the sequential steps and stored at 4 °C.
2.3.5 Carbohydrate microarray analysis to determine structural complexity of POM
The polysaccharides extracted as described above were analyzed following Vidal-Melgosa et al. (2021). In brief, the polysaccharide extracts were first diluted in printing buffer (55.2 % glycerol, 44 % water, 0.8 % Triton X-100), and then printed on 0.45 µm pore size nitrocellulose membrane (Whatman) using a microarray robot (Sprint, Arrayjet, Roslin, UK) at 20 °C and 50 % humidity. The membranes were probed with one of nine monoclonal antibodies (Table S4), washed multiple times, and probed with secondary antibodies (anti-rat, anti-mouse, or anti-His tag) conjugated to alkaline phosphatase for 2 h. The arrays were developed using 5-bromo-4-chloro-3-indolyphosphate and nitro blue tetrazolium in alkaline phosphatase buffer (100 mM NaCl, 5 mM MgCl2, 100 mM Tris-HCl, pH 9.5). The microarrays were scanned and signal intensity was acquired using the software Array-Pro Analyzer 6.3 (Media Cybernetics). Signals were normalized among samples; higher signals correspond to a higher abundance of a given polysaccharide epitope. Signals were then combined for the different extraction steps, as in Priest et al. (2023), to yield the overall values shown in Fig. 5 and Table S4. Note that the carbohydrate microarray data are only semiquantitative: while comparisons can be made for the abundance of a given epitope among stations and depths, due to fundamental differences in binding intensity of different epitopes to their targets, the signal intensity cannot be used to compare signals of different epitopes.
2.4 Analysis of bacterial community composition
Composition of bacterial communities at all of the stations and sampling depths was assessed through 16S rRNA gene analysis. Seawater (25 mL) from the Niskin bottles was filtered through 0.22 µm pore size polycarbonate filters at a maximum vacuum of 200 mbar. The filters were air-dried and frozen at −20 °C until further processing. Total DNA was extracted from these filters using the DNeasy Power Water Kit (Quiagen). The variable V3 and V4 regions (490 bp) of the 16S rRNA gene were amplified in 30 PCR cycles, using the 5 PRIME HotMasterMix (Quantabio) together with the Bakt_341F (5′ CCTACGGGNGGCWGCAG 3′) and Bakt_805R (5′ GACTACGVGGGTATCTAATCC 3′) PCR primer pair (Herlemann et al., 2011). Note that these primers omit archaeal sequences; while it is possible that archaea may contribute to enzyme activities, they are excluded from our sequence analyses. Forward and reverse primers were barcoded with individual 8 bp barcode adapter (based on the NEB Multiplex Oligos for Illumina, New England Biolabs). Each amplified PCR product was purified and size selected using the AMPure XP PCR Cleanup system (Beckman Coulter) before barcoded products were pooled in equimolar concentrations. The pools were sent to the Max Planck Genome Centre (Cologne) for paired-end Illumina sequencing (2×250 bp HiSeq2500). Merging, demultiplexing, and quality trimming (sequence length 300–500 bp, < 2 % homopolymers, < 2 % ambiguities) of bulk sequences were done using BBTools (Bushnell, 2014). Sequence comparison and taxonomic assignment of the retrieved sequences were done using the SILVAngs pipeline (Quast et al., 2013) with the SSU rRNA SILVA database 138. Rarefaction curves were plotted to determine the adequacy of sequencing; no samples fell below the threshold.
2.5 Enzymatic activity measurements
Extracellular enzymes act either on terminal units of a polymer (exo-acting enzymes), or they cleave a polymer mid-chain (endo-acting enzymes). In this study, both types of activities were measured. We measured activities of (exo-acting) glucosidase enzymes that hydrolyze terminal glucose units from polymers by using small substrate proxies, consisting of α- or β-glucose linked to a fluorophore. Exo-acting peptidase activities (hydrolysis of a terminal peptide from a polymer) were measured using the amino acid leucine linked to a fluorophore; this method has been shown to integrate the activities of a wide range of exo-acting peptidases (Steen et al., 2015). The activities of endo-acting peptidases were measured using short oligopeptides (see below) linked to a fluorophore. For all of these substrates, when the bond between the monomer/oligomer and the fluorophore is hydrolyzed, fluorescence increases substantially, enabling measurements of hydrolysis. To measure the activities of endo-acting enzymes that hydrolyze polysaccharides, we used fluorescently labeled polysaccharides (see below). These polysaccharides are fluorescent at all stages of an experiment: hydrolysis is determined by tracking the change in polysaccharide molecular weight via chromatography as the polysaccharide is systematically hydrolyzed to smaller sizes (Arnosti, 2003). Note also that since polysaccharide hydrolases are highly structure specific – more structure-specific than endopeptidases (Lapébie et al., 2019) – the activities measured are specific to each polysaccharide.
2.5.1 Measurement of peptidase and glucosidase activities
Alpha- and beta-glucosidase activities were measured using small substrate proxies consisting of α-glucose and β-glucose linked to 4-methylumbelliferone (MUF). Exo-acting (terminal-unit-cleaving) peptidase activities were measured using the amino acid leucine linked to the fluorophore 7-amido-4-methyl coumarin (MCA), whereas activities of endo-acting (midchain-cleaving) peptidases were measured using short peptides linked to MCA. Chymotrypsin activities were measured with alanine-alanine-phenylalanine (AAF; one-letter amino acid codes) and alanine-alanine-proline-phenylalanine (AAPF), and trypsin activities were measured with glutamine-alanine-arginine (QAR) and phenylalanine-serine-arginine (FSR).
Enzymatic activities were measured in seawater as previously described (Hoarfrost and Arnosti, 2017). In brief, substrate was added under saturating concentrations (150 µM as determined in surface seawater at Stn. 17) to a total volume of 200 µL in a 96-well plate. Activities were measured in triplicate wells of seawater amended with substrate; triplicate wells of autoclaved seawater (from the same depth and station) amended with substrate were used for killed controls. Fluorescence was measured immediately (t0) and every 6 h over 24 h, using a plate reader (TECAN SpectraFluor Plus with 340 nm excitation, 460 nm emission). Fluorescence signals were converted to concentrations using standard curves of MUF and MCA fluorophores. Hydrolysis rates were calculated from the increase in fluorescence over time. Activities reported here were averaged using data collected during the first 12 h of incubations.
2.5.2 Measurement of polysaccharide hydrolase activities
The activities of enzymes hydrolyzing distinct polysaccharides were measured using six fluorescently labeled polysaccharides: pullulan, laminarin, xylan, fucoidan, arabinogalactan, and chondroitin sulfate. The polysaccharides (Sigma) were labeled with fluoresceinamine (Sigma) and characterized following Arnosti (2003).
To measure each polysaccharide hydrolase activity, three 15 mL sterile centrifuge tubes were filled with unfiltered seawater for the live incubations and one 15 mL centrifuge tube was filled with autoclaved seawater from the same station and depth to serve as a killed control. Note that this water volume is comparable to the volume of water collected for bacterial community composition analyses (see above). A single substrate was added to each tube to a final concentration of 3.5 µM (except for fucoidan, which was added to a final concentration of 5 µM). One 15 mL centrifuge tube with autoclaved seawater served as a negative control, and one 15 mL centrifuge tube filled with bulk seawater served as a blank. In total, we had 26 incubations for each depth at each station: 18 live incubations with substrates, 6 killed controls with substrates, one live seawater, and one autoclaved seawater. Incubations were stored in the dark at close to in situ temperatures. For surface, DCM, 300 m, and bottom water depths, larger incubations (600 mL) were set up (at the same final concentrations as above) to enable additional volume for analyses reported elsewhere (Giljan et al., 2023). Note that incubations were started at sea and were transported to land with the use of buckets (for samples at room temperature; Arnosti et al., 2023) and coolers (for chilled samples); transport between the ship and shore lab took ca. 5 h.
Subsamples were taken directly after each incubation was set up (day 0) and at five additional time points (3, 5, 10, 15, and 30 d) to measure hydrolysis rates. At each time point, 2 mL of water was collected from each sample and filtered (0.2 µm pore size SFCA filter) into an epi tube and then stored frozen at −20 °C until analysis.
Hydrolysis of the six polysaccharides was measured using gel permeation chromatography with fluorescence detection (Arnosti, 2003). The samples were injected onto a series of columns (a G50 Sephadex gel column followed by a G75 Sephadex gel column), and fluorescence was measured using a Hitachi detector set to excitation and emission wavelengths of 490 and 530 nm, respectively. Polysaccharide hydrolase activities were calculated by measuring the change in the relative proportion of signal in different molecular weight bins over time. Note that polysaccharide hydrolysis rates measured in surface waters, at the DCM, 300 m, and in bottom waters at Stns. 18, 19, and 20 were previously reported in Giljan et al. (2023).
2.6 Statistical analyses
2.6.1 NMDS plots
Non-metric multidimensional scaling (NMDS) plots using the Bray–Curtis dissimilarity index were constructed to visualize dissimilarities in peptidase and glucosidase activities, polysaccharide hydrolase activities, and bacterial community composition. For bacterial community composition, the data were transformed logarithmically, and Q–Q plots were created to assess the validity of the transformed data. As stated above, rarefaction curves were performed to assess the quality of sampling as well. Analysis of variance (ANOVA) was used to test differences in enzymatic activity and carbohydrate content between stations and depths.
2.6.2 Correlation plots
To visualize correlations between collected environmental data and enzyme activities, correlation plots were constructed based on Pearson correlations using Corrplot (v. 0.92) in R (v. 4.2.1 Patched). P values were calculated and adjusted using the Bonferroni method. Since environmental parameters varied considerably by station (Table S2), correlation plots were also constructed for each station. In addition, a correlation plot was constructed by depth, with the surface and DCM classified as epipelagic; 300, , and 1500 m as mesopelagic; and depths below 1500 m as bathypelagic.
3.1 Distinct water mass characteristics at each station
Stations differed considerably in the physical and chemical characteristics of the water masses, especially in surface waters (Fig. 2; Table S2). Stns. 17 and 18 were located within the Gulf Stream, while Stn. 20 was located within the oligotrophic Sargasso Sea (Fig. 2; Liu and Tanhua, 2021). The satellite images (Fig. 2a) show the very distinct sea surface temperatures around the sampling days for each station. Most notably, it shows the distinction between Stns. 17 and 18 – located in the Gulf Stream – and Stn. 19, which had much cooler waters than any other station. At Stn. 17, located on the continental slope (maximum depth: 625 m), surface water and DCM water both were characteristic of Gulf Stream Water (Liu and Tanhua, 2021). Surface water at Stn. 18 also had characteristics of Gulf Stream water. This water was warmer and more saline (25.18 °C and 36.42 PSU) than surface water at Stns. 19 (8.78 °C and 33.72 PSU). Bottom water collected at Stn. 18 was characteristic of upper Labrador Sea Water (Heidrich and Todd, 2020; Andres et al., 2018).
Surface water from Stn. 19, near the continental shelf break off Newfoundland, had characteristics similar to the Labrador Current that flows south past the Grand Banks (Fratantoni and Pickart, 2007). The salinity at this station increased by 1 PSU between surface and DCM waters and a depth of 300 m, resulting in the strongest measured vertical gradient of salinity with depth (Fig. 2). The relatively fresh surface water at Stn. 19 likely indicates the influence of sea ice melt or potentially also freshwater drainage from the Gulf of St. Lawrence (Fratantoni and Pickart, 2007). The physicochemical characteristics of water samples collected at the surface, DCM, and 300 m at Stn. 19 were similar in density and salinity to those of the Warm Slope Water and Labrador Slope Water measured by Fratantoni and Pickart (2007). The water at 300 m at Stn. 19 also corresponded to an oxygen minimum with an O2 concentration of 135 µmol kg−1, as measured by the CTD sensor.
Stn. 20 was located within the North Atlantic subtropical gyre. Surface water was characteristic of Thermocline Water (Heidrich and Todd, 2020). At a depth of 300 m, characteristics were very similar at Stn. 20 and Stn. 18; this water was likely Eighteen Degree Water (Heidrich and Todd, 2020). Water collected at 3000 m and just above the seafloor had similar characteristics at Stns. 18–20, consistent with North Atlantic Deep Water (Fig. 2; Broecker, 1991).
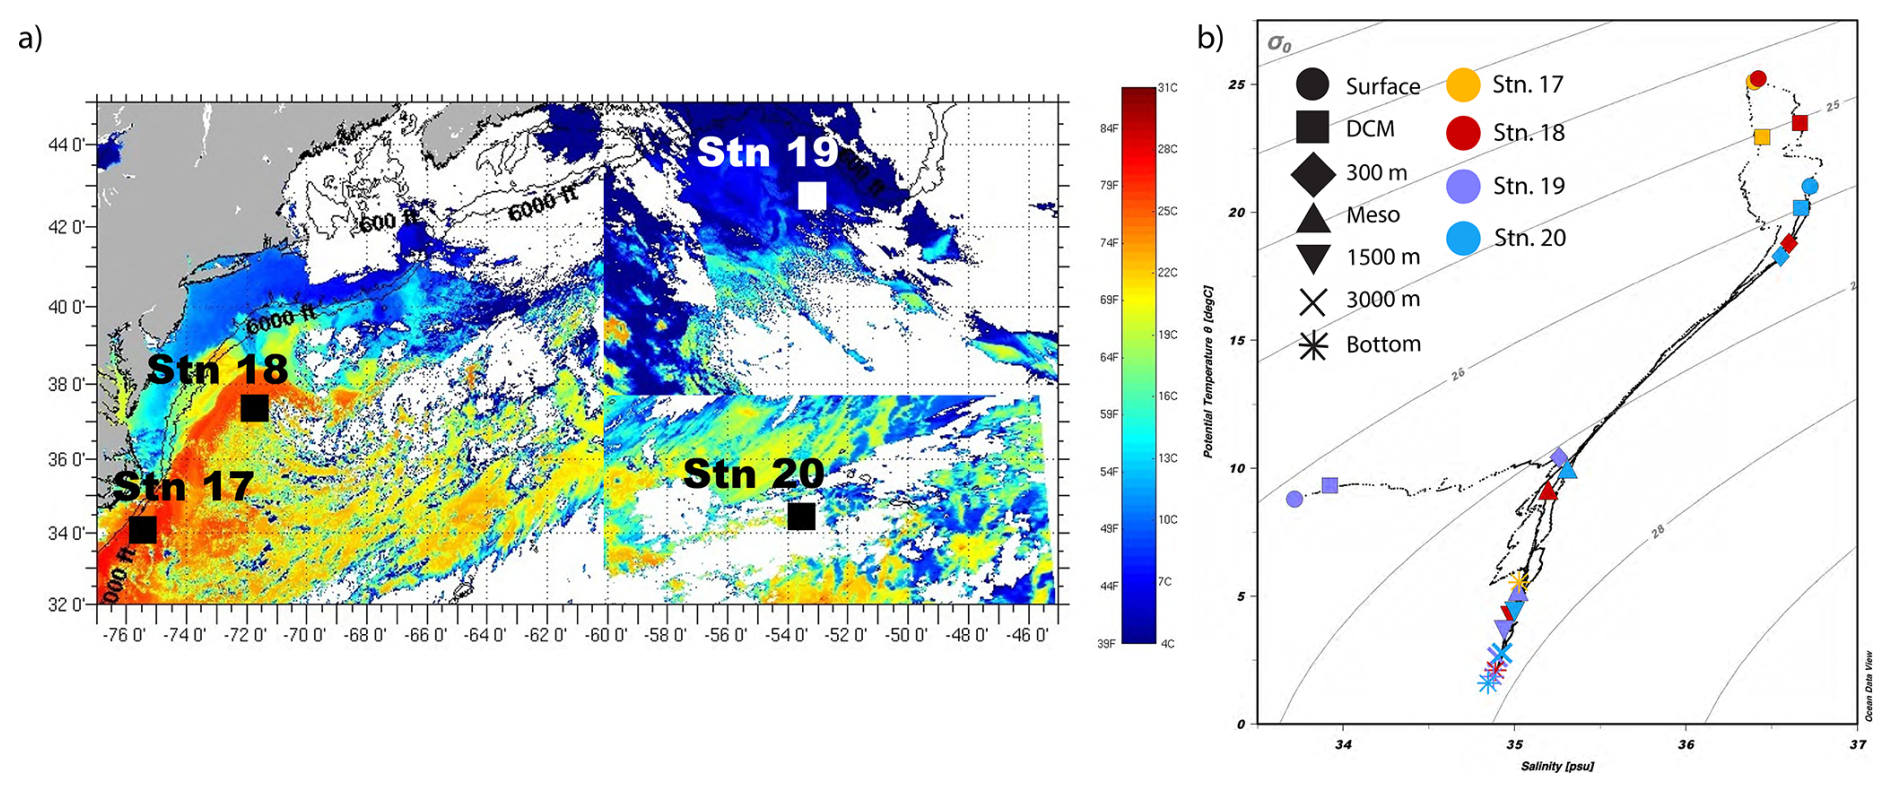
Figure 2Physical and chemical characteristics of sampling stations within the western North Atlantic. (a) Sea surface temperature, acquired by satellite imaging on/around the sampling day at each station (Rutgers University Coastal Observation Lab: RU-COOL satellite imagery, https://marine.rutgers.edu/cool/data/satellites/imagery/ (last access: 28 September 2022). (b) The temperature and salinity diagram of the four stations highlights the differences in the water masses sampled. Shapes denote the depths; colors denote the stations.
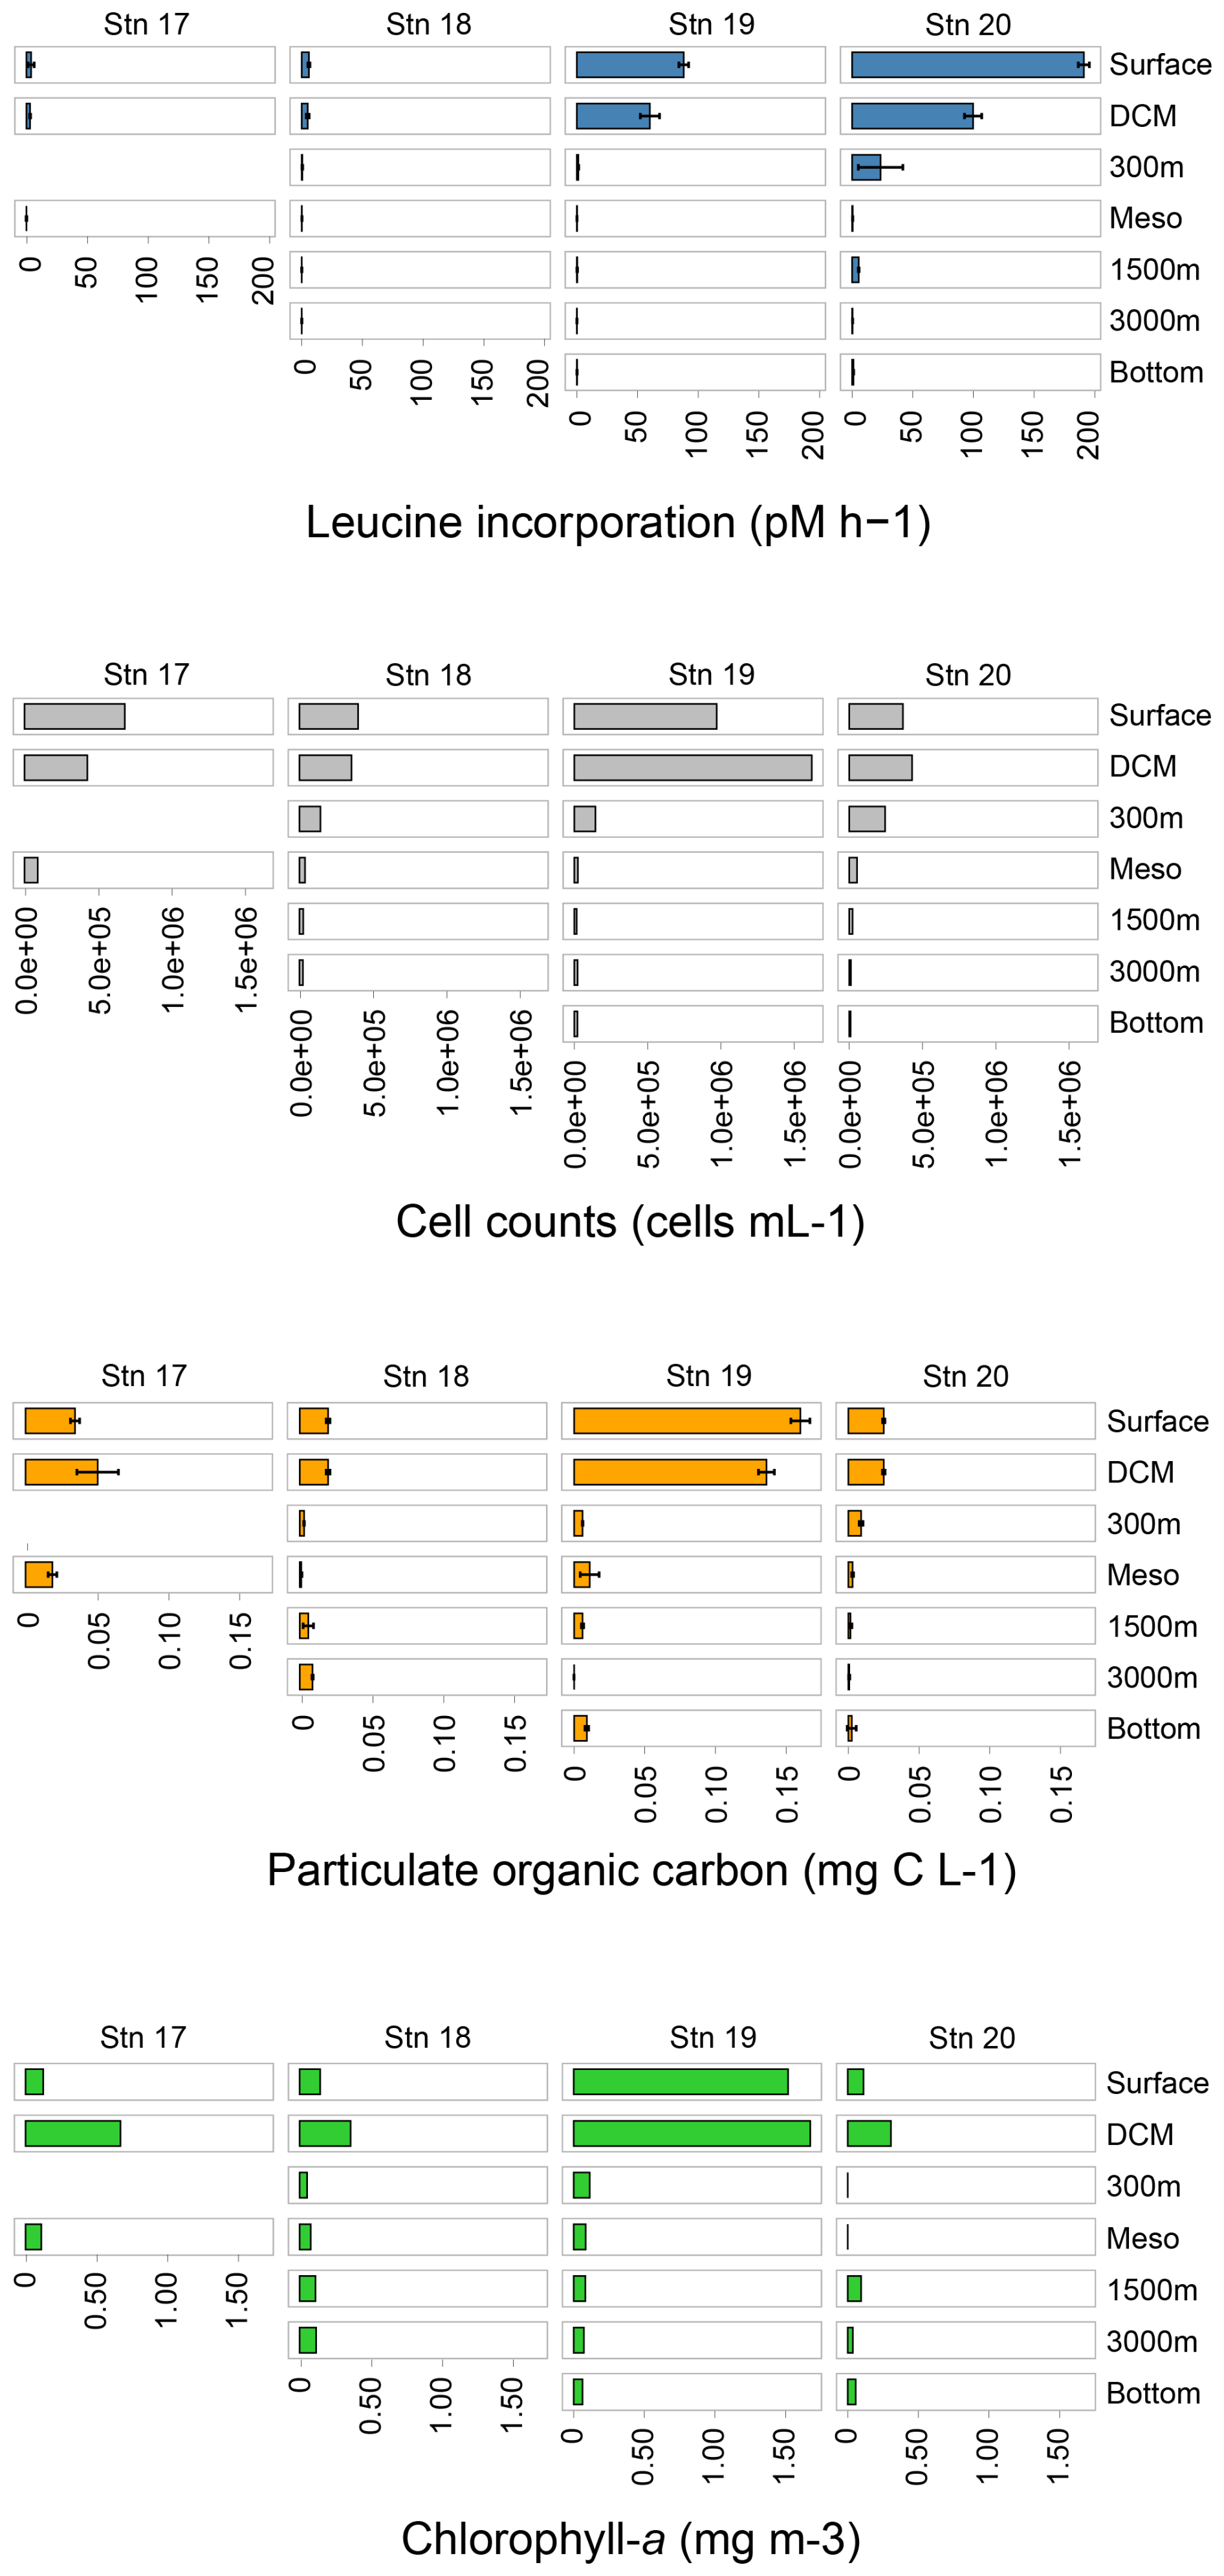
Figure 3Bacterial protein productivity (leucine incorporation; blue), total cell counts (grey), particulate organic carbon concentrations (orange), chlorophyll a (green) at each sampling station and depth. See Table S2 for exact values for these data.
3.2 Total cell counts and bacterial protein productivity
At all of the stations, total microbial cell counts were highest in the upper water column and decreased with depth (Fig. 3; Table S2). At Stn. 19, surface and DCM waters had much higher total cell counts than waters at the same depths at Stns. 17, 18, and 20; these high total cell counts coincided with the higher chlorophyll-a concentrations at Stn. 19 (Figs. 3, S1; Table S2). Cell counts ranged from 0.3–1.0×10⁹ cells per liter in surface waters, to ca. 1.0–2.0×10⁸ cells per liter at 300 m, to as few as 0.8–1.3×10⁷ cells per liter in bottom water at Stns. 18–20 (Fig. 3; Table S2).
Bacterial protein productivity – as measured by incorporation of tritiated leucine – was highest in surface waters and decreased with depth. Bulk bacterial productivity (pmol leucine L−1 h−1) was highest at Stn. 20, where leucine was incorporated at ∼ 2 times the rate of Stn. 19; this trend holds true for all of the depths when comparing Stns. 19 and 20 (Fig. 3; Table S2). At Stn. 17, protein productivity increased slightly at the DCM compared to the surface, but was undetectable in bottom waters. At Stns. 18–20, bacterial productivity decreased considerably within the first 300 m of the water column, followed by a peak in productivity in lower mesopelagic waters at Stn. 18 and at 1500 m at Stns. 19 and 20, respectively. While bacterial protein productivity roughly doubled at this depth at Stns. 18 and 19, bacterial protein productivity increased even more, 11-fold to 5.5 pmol L−1 h−1 at this depth at Stn. 20. These peaks are followed by decreases in bacterial productivity with depth, and a slight increase again in bottom waters. Bulk bacterial protein productivity in bottom waters increased with distance offshore (Fig. 3; Table S2).
Cell-specific bacterial productivity was calculated by dividing the bulk bacterial productivity for each depth by the cell abundance. Cell-specific bacterial productivity increased in surface waters by 2 orders of magnitude from the inshore Stn. 17 at pmol cell−1 h−1 to pmol cell−1 h−1 at the offshore, open ocean Stn. 20 (Fig. S2). Cell-specific bacterial productivity generally increased with distance offshore, with especially high values at Stn. 20. Comparing Stns. 19 and 20, for example, showed that the cell-specific productivity at Stn. 20 was much higher at every depth than at Stn. 19; in surface waters, the bacterial productivity was ∼ 6 times higher at Stn. 20 than at Stn. 19 and ∼ 12 times higher in bottom waters at Stn. 20 than at Stn. 19 (Fig. S2).
3.3 POC concentrations
Overall, POC concentrations were highest in surface and DCM waters, and decreased with depth (Fig. 3; Table S2; Fig. S3). The highest POC concentrations in surface and DCM waters were measured at Stn. 19, the same depths with high chlorophyll fluorescence values (Fig. 3; Table S2; Figs. S1 and S3). At the offshore stations, POC concentrations increased slightly at bottom depths compared to the depths measured above.
3.4 Monosaccharide composition of POM-derived combined carbohydrates
The monosaccharide constituents of POM-derived combined carbohydrates were very similar in surface and DCM waters of all of the stations (ANOVA, p=0.90) but changed markedly with depth (Fig. 4). In subsurface waters, these constituents were significantly different from the constituents in surface and DCM waters (ANOVA, p=0.026). In surface waters at all of the stations, glucose, xylose, and galactose comprised ∼ 80 % or more of the total combined carbohydrates. Although fucose, galactosamine, arabinose, glucosamine, and glucuronic acid comprised ∼ 20 % or less of the total combined carbohydrates, they were more abundant in surface waters and decreased considerably in relative abundance with depth (Fig. 4). Galactosamine and arabinose were only detected in surface and DCM waters offshore and at all depths at Stn. 17. Overall, the concentration of POM-derived combined carbohydrates in seawater decreased with depth as well, ranging from 6–28 µg L−1 in surface waters to ∼ 0.5–1 µg L−1 in bottom waters (Fig. 4).
In the upper water column, total concentrations of monosaccharides contributing to combined carbohydrates differed somewhat by station (Fig. 4b; ANOVA, p=0.014). Stn. 19 had the highest concentration (∼ 28 µg L−1 in surface waters), consistent with the high chlorophyll fluorescence (Fig. S1) and high POC concentration at this station (Fig. 3). At Stns. 18 and 20, the concentrations were much lower (∼ 6 µg L−1). Stn. 17 (with a total water column depth of ca. 600 m) also had higher total concentrations in both surface and bottom waters as well as different monosaccharide constituents than at the other stations (Fig. 4). At Stns. 18–20, there were no station-specific differences in monosaccharide composition in waters below DCM (ANOVA, p=0.58).
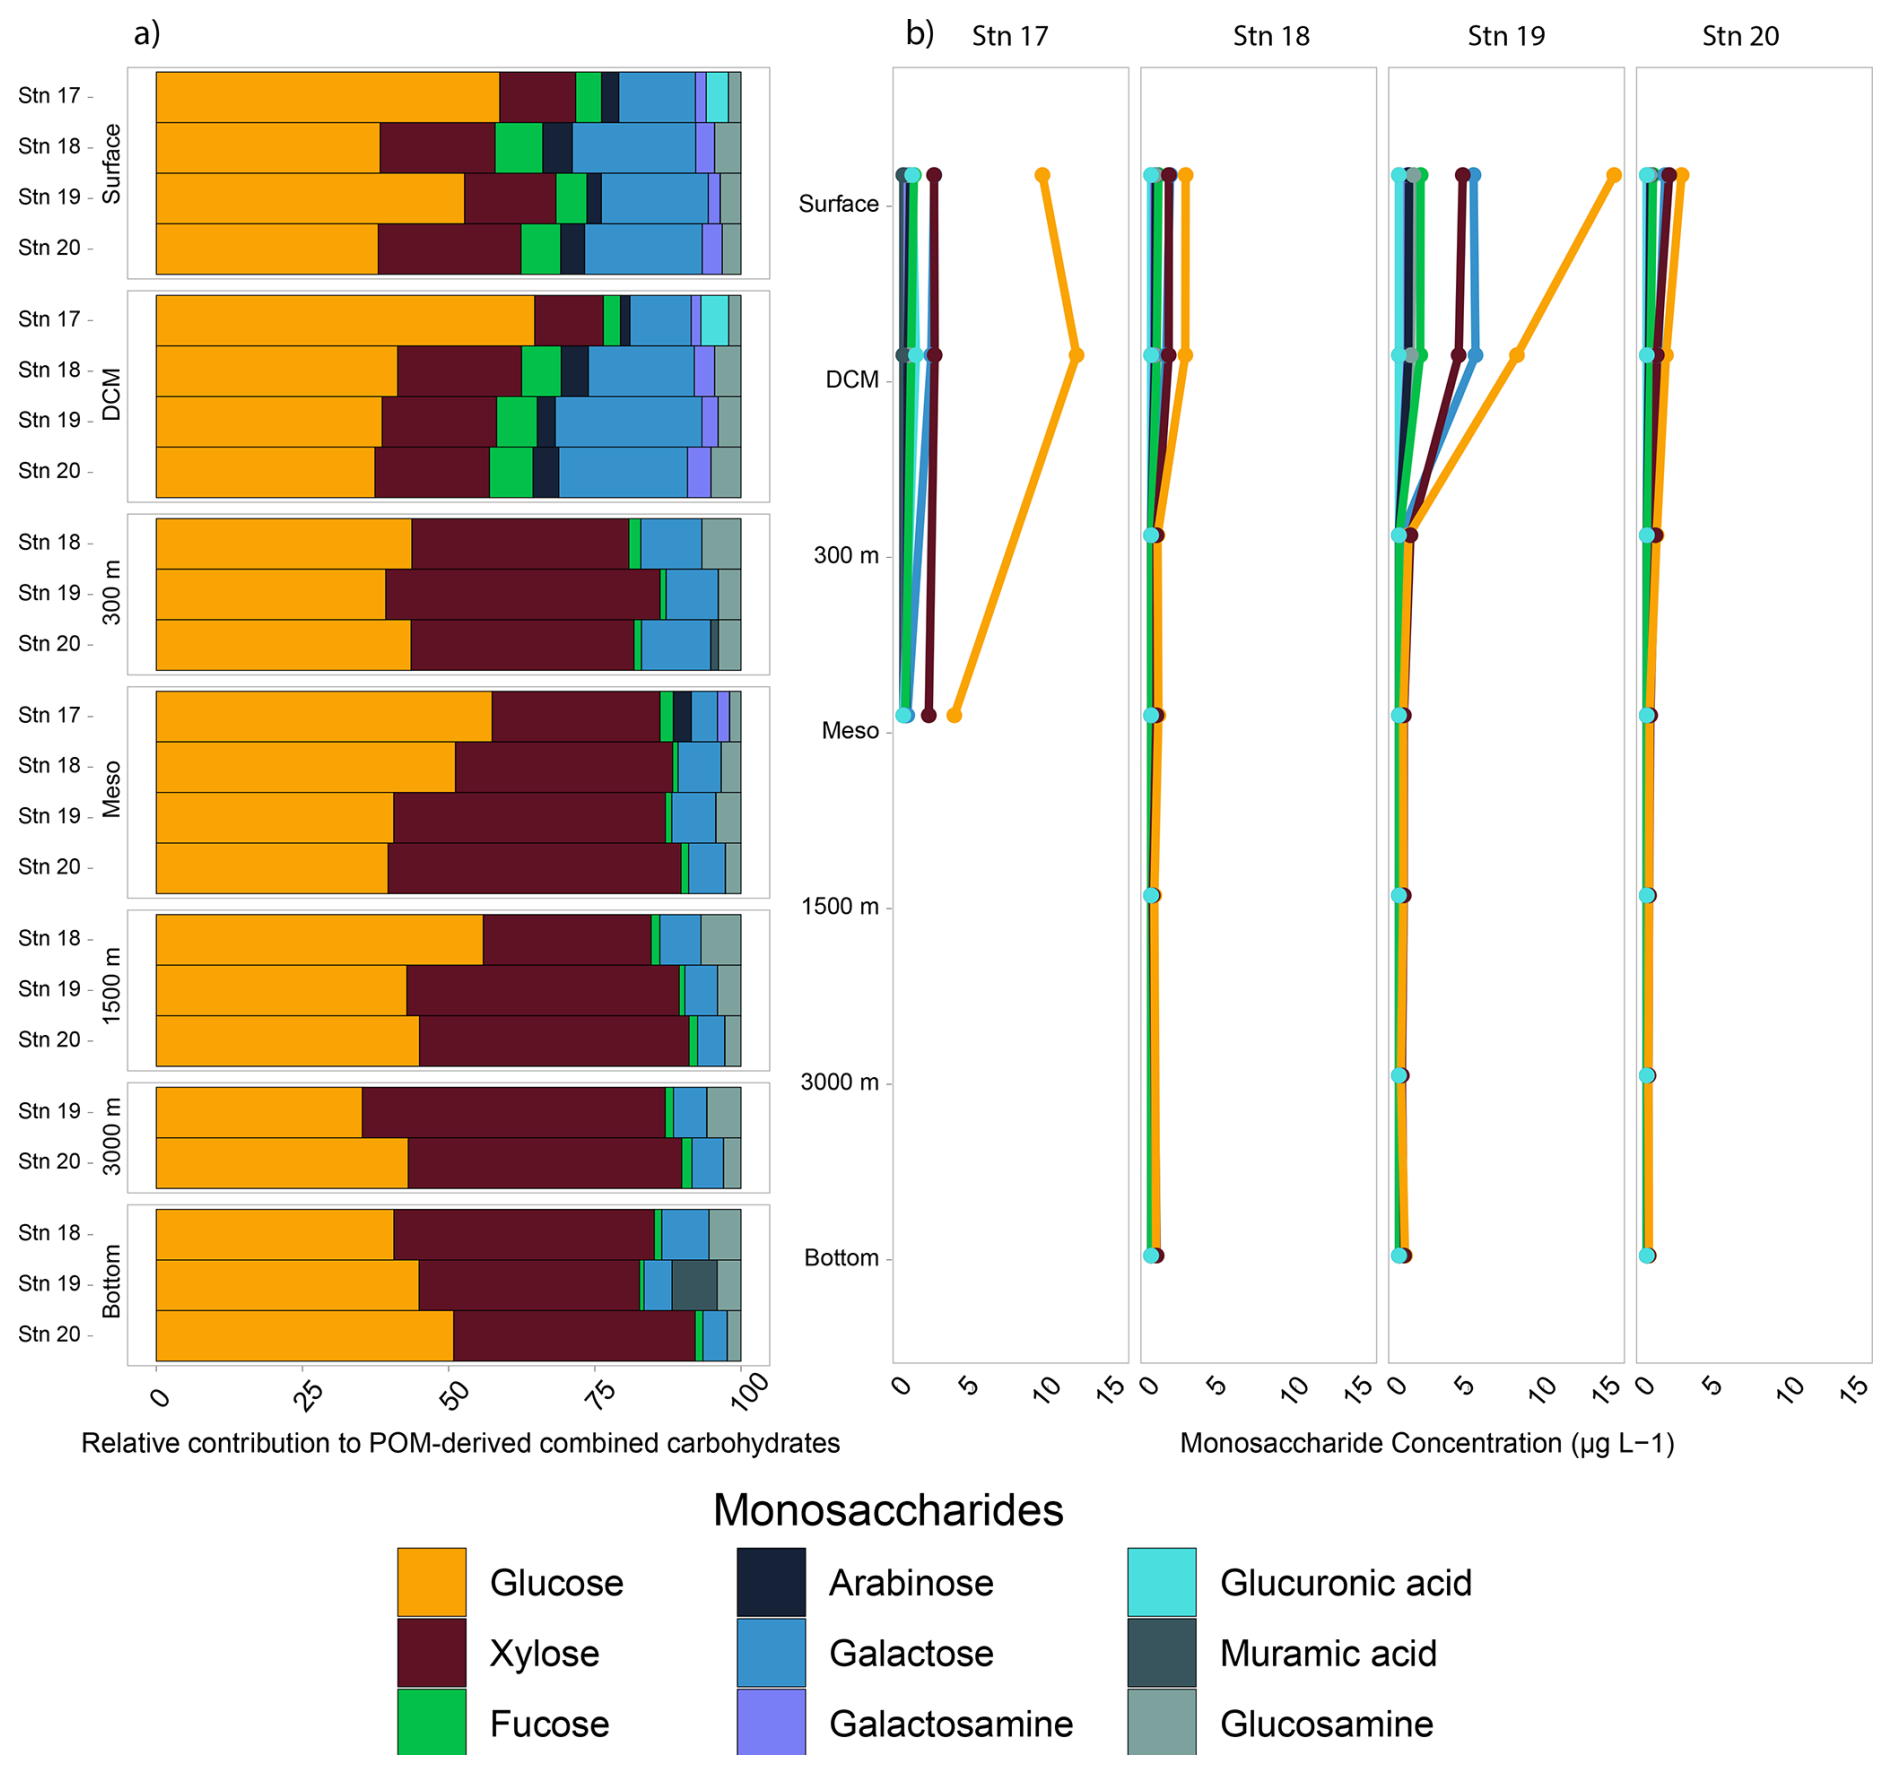
Figure 4Monosaccharide constituents of the combined carbohydrates in POM. (a) The relative contribution of the combined carbohydrates shows the percentage contribution of each monosaccharide to the total. (b) The concentration of each monosaccharide, as determined by HPAEC-PAD.
3.5 Polysaccharide structures of POM detected via microarray analysis
The carbohydrate epitopes – and therefore the structural complexity of polysaccharides in POM – differed among stations (Fig. 5; ANOVA, p=0.016). Although filtered samples from all of the depths and stations were included in the epitope analyses (Tables S3, S4), polysaccharide structures extracted from POM were only detected in surface and DCM waters, with the exception of the β-1,4-mannan detected in the comparatively shallow bottom water at Stn. 17 (Fig. 5; Table S4). At all of the stations, β-1,3-glucan and alginate were detected in surface and DCM waters. These were the only epitopes detected at Stn. 18; at all of the other stations, additional epitopes were detected. At Stn. 17, fucoidan (epitope II) was also detected in surface waters, and β-1,4-mannan in bottom waters at 625 m. In the highly productive surface waters of Stn. 19 (Fig. 3, Table S2), all of the epitopes except fucoidan (epitope II) were detected (Fig. 5). At Stn. 20, in addition to β-1,3-glucan and alginate, fucoidan (epitopes I and II) was detected, as was β-1,4-mannan.
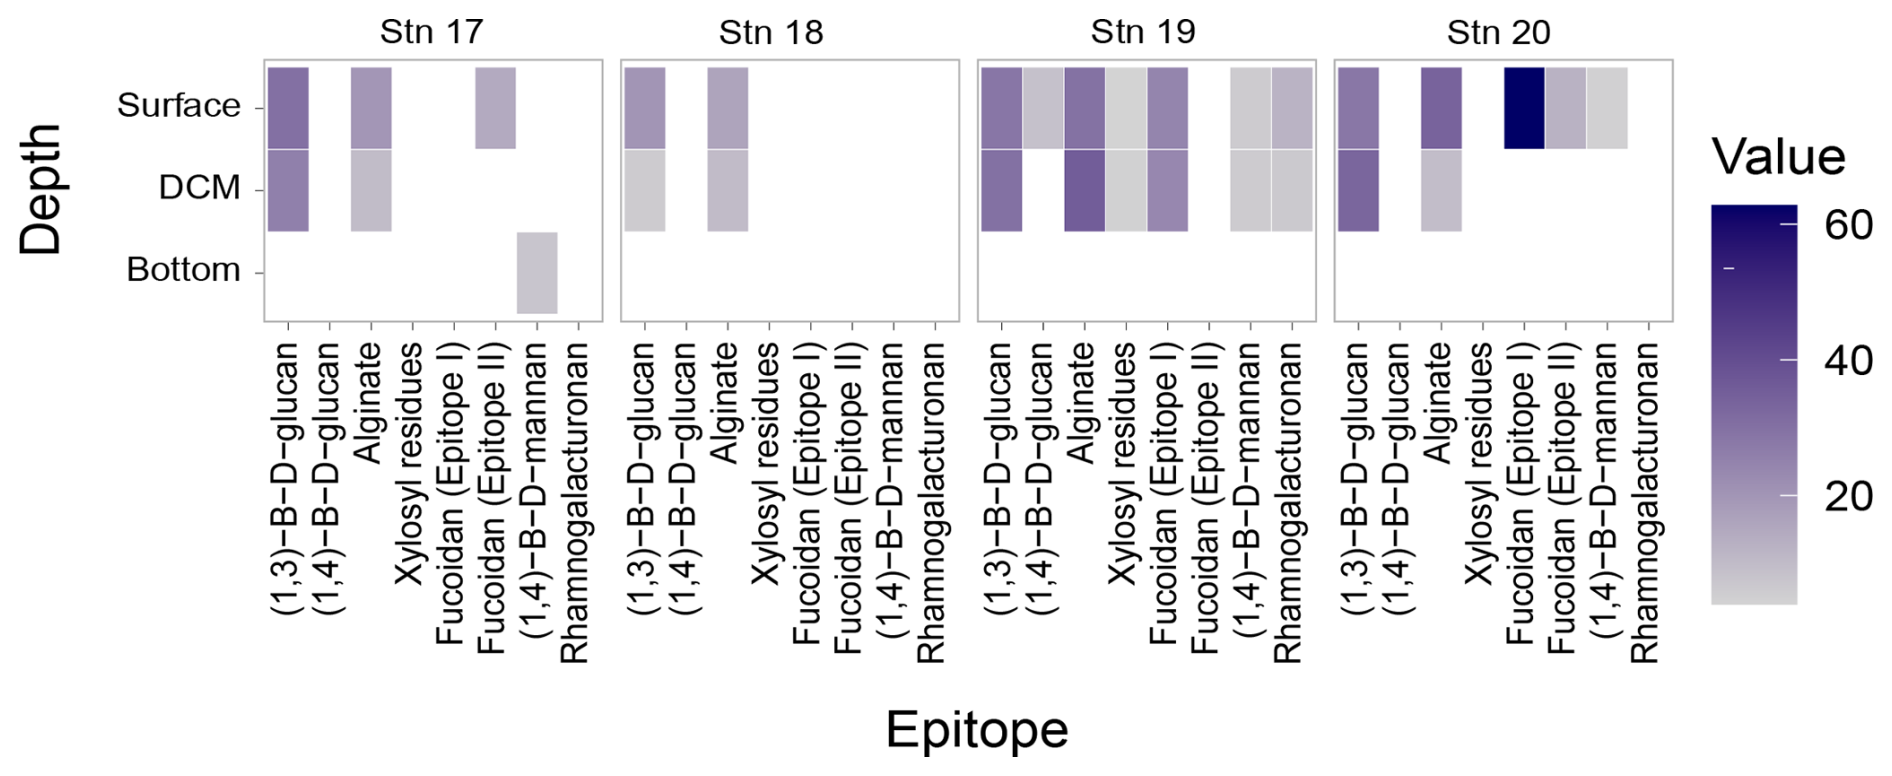
Figure 5Heatmap of polysaccharides detected from the carbohydrate microarrays. Darker shades represent a higher relative intensity, while lighter shades represent a lower relative intensity; white spaces represent samples where no epitopes were detected. Note that samples were collected at each depth horizon for all of the stations, but depths below the DCM and above bottom waters are not explicitly shown on the y axis in the figure, as no epitopes were detected in any of those samples.
3.6 Community composition
Sequencing of 16s rRNA genes was intended to provide an overview of bacterial community composition. Since particle-associated bacteria are typically a small fraction of the total community (Bachman et al., 2018), our sequences – although carried out with water that was not prefiltered – likely primarily reflect the free-living bacterial community. It should also be noted that different primers can yield different results, especially at the ASV level, and results of community composition based on 16s rRNA gene sequencing frequently differ in part from direct counts of cells carried out by FISH (e.g., Fadeev et al., 2021). Even considering these caveats, however, bacterial community composition differed considerably by depth (ANOSIM, R-stat = 0.3248, p=0.0052; Fig. 6) and also to an extent by station (Fig. S4). In surface and DCM waters at all four stations, bacterial communities were mainly composed of members of the Proteobacteria (Gamma- and Alphaproteobacteria), Bacteroidota, Actinobacteria, and Cyanobacteria. In waters at 300 m and below, higher relative abundances of the SAR324 clade, Marinimicrobia, Chloroflexi, and Firmicutes were detected; Bacteroidota and Actinobacteria were present in lower relative numbers, and Cyanobacteria had virtually disappeared (Fig. S5).
Stns. 17 and 18 surface and DCM waters were distinguished by a large contribution (∼ 30 %) of Prochlorococcus, which was not observed at Stns. 19 and 20 (Fig. S5). Surface waters of Stn. 19 were dominated by Alphaproteobacteria; members of the Bacteroidota were present in greater abundance with a wider array of taxa than at other locations. In Stn. 19 DCM waters, Gammaproteobacteria made up a larger portion of the bacterial community (∼ 30 %) compared to other stations. Stn. 20 surface waters were dominated by SAR11 clade Ia (Fig. S5).
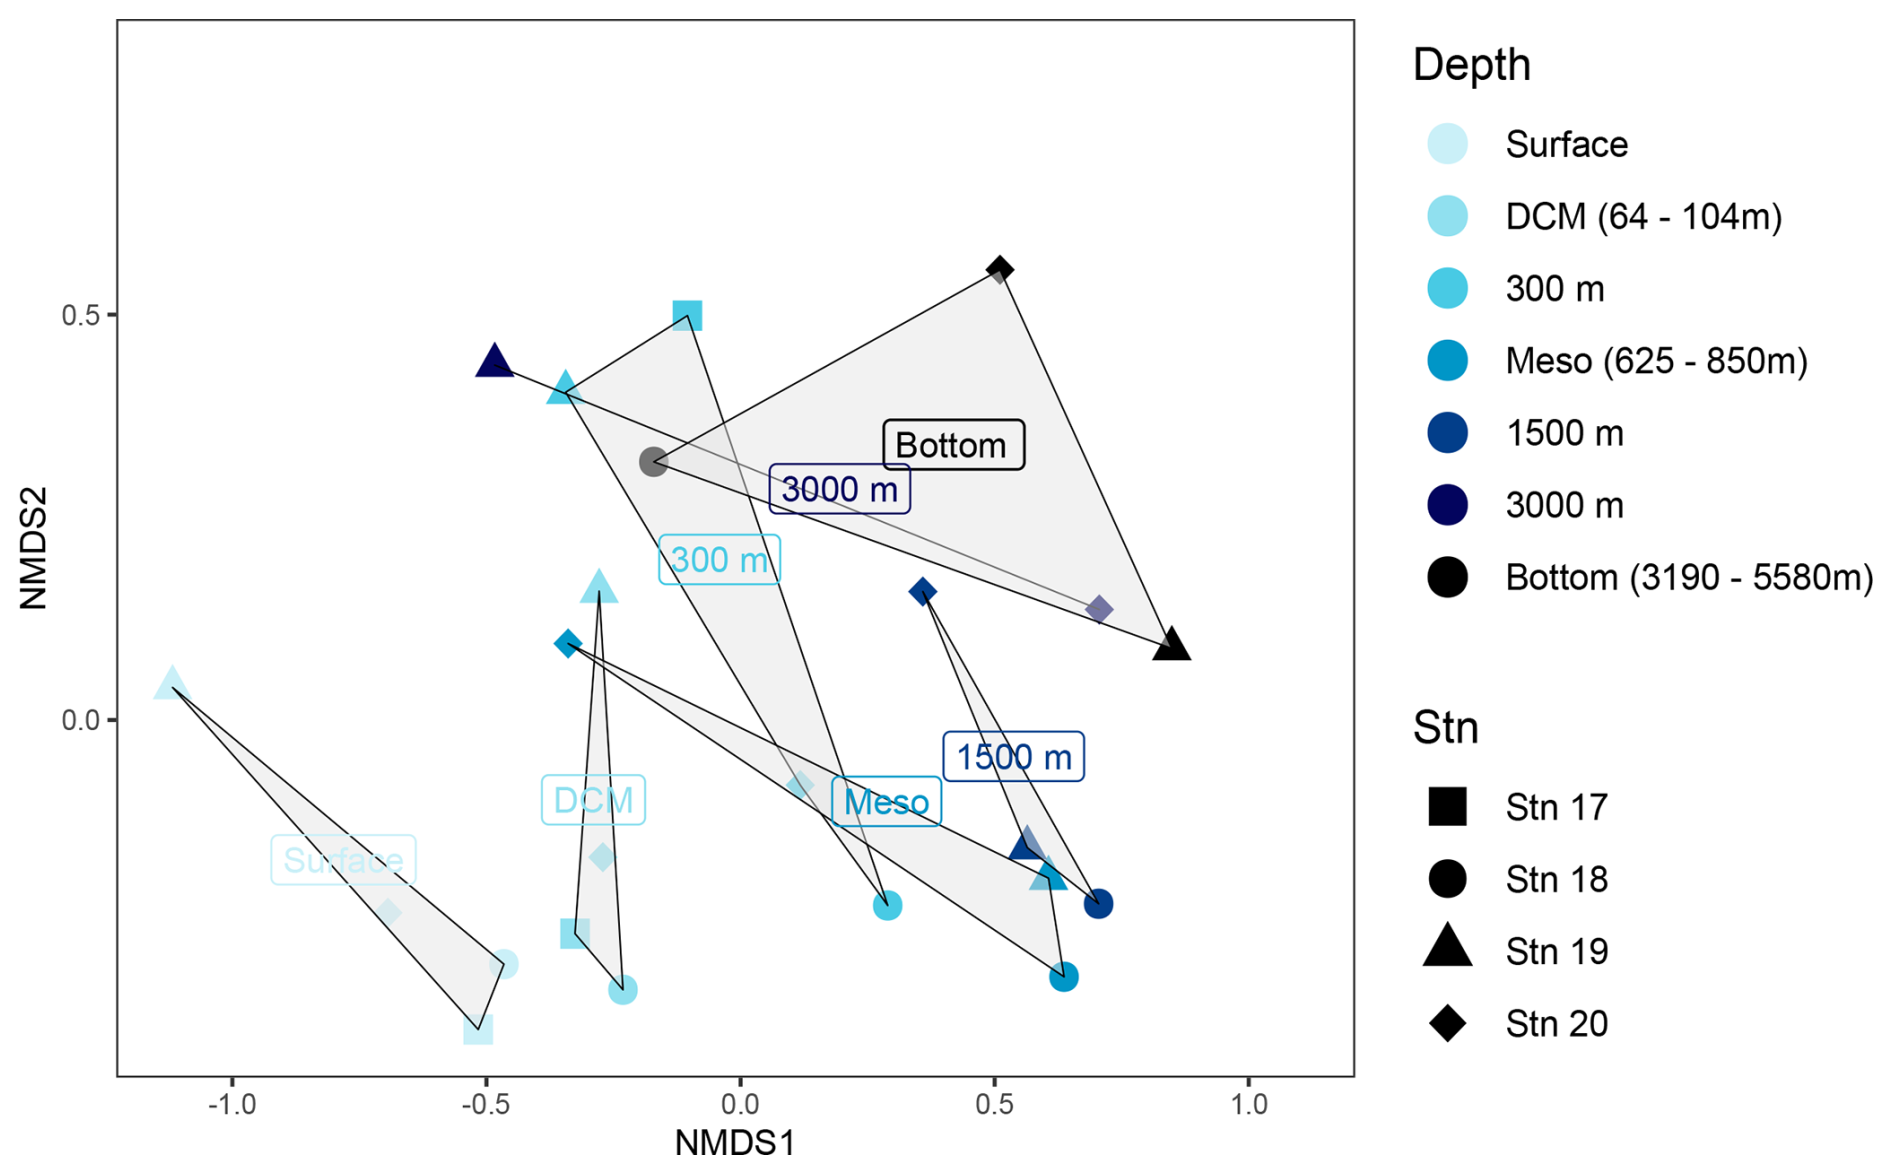
Figure 6Non-metric multidimensional scaling (NMDS) plots based on Bray–Curtis dissimilarity shows bacterial communities clustered by depth. Stations are represented by shapes; depths are indicated by colors (see the key). The grey-shaded regions in the NMDS plots represent the clustering of bacterial communities by depth.
Bacterial communities in subsurface waters differed substantially from their surface counterparts (ANOSIM, R-stat = 0.3248, p=0.0052; Figs. 6, S5). Stn. 17 bottom water (at 625 m) had a strong representation of Gammaproteobacteria (∼ 35 % of the community), while the contribution of Prochlorococcus and Alphaproteobacteria decreased relative to the surface and DCM. At Stn. 18, the communities at 300 m, the lower mesopelagic, and 1500 m were relatively similar to each other and also to communities in the lower mesopelagic and 1500 m at Stn. 19. These communities were dominated by Alphaproteobacteria and SAR324. Stn. 20 communities at the lower mesopelagic and in deeper waters were distinct from communities at similar depths for Stns. 18 and 19.
Bacterial communities at 3000 m and in bottom water differed considerably among the stations (Figs. 6, S5). The bottom water community at 3190 m at Stn. 18 stands out based on the contribution of Bacteroidota as well as the presence of Prochlorococcus. Bacteroidota were also detected in 3000 m and bottom waters at Stn. 19, although this phylum was in low relative abundance at depths between 300 and 1500 m. Stn. 19 bottom waters were distinguished by the contributions of SAR324, Marinimicrobia, Chloroflexi, and Firmicutes, which constituted ∼ 50 % of the bacterial community at this depth. In Stn. 20 bottom waters, the Gammaproteobacteria – and particularly Pseudoalteromonas – accounted for up to 40 % of the community.
3.7 Glucosidase and peptidase activities
Peptidase and glucosidase activities differed by station and depth (Figs. 7, S6). Leucine aminopeptidase activity (exo-peptidase, a terminal-unit-cleaving enzyme) tended to dominate at all depths at Stn. 19, whereas at the other stations endopeptidase activities (activities of mid-chain cleaving enzymes) were frequently comparable to leucine aminopeptidase activities. Alpha- and beta-glucosidase activities were particularly prominent at 300 m and in the lower mesopelagic (Fig. 7).
In general, summed glucosidase and peptidase activities at 3000+ m depths were only slightly lower than at shallower depths. Summed activities were highest in surface and DCM waters (upwards of 150–200 nmol L−1 h−1) and then decreased by half (to upwards of 50–100 nmol L−1 h−1) below 300 m (Fig. S7). Fewer substrates were typically hydrolyzed at deeper depths, although Stn. 20 showed hydrolysis of all seven glucosidase and peptidase substrates at 1500 m as well as in bottom water (Fig. 7). At Stn. 18, one endopeptidase, chymotrypsin substrate AAPF, was hydrolyzed more rapidly at deeper depths (depths at the lower mesopelagic and below), with particularly high activity in bottom water. In contrast, leucine aminopeptidase activities were generally high at all depths at Stn. 19 and were the highest peptidase activities at depths of 1500 m and below at Stn. 20.
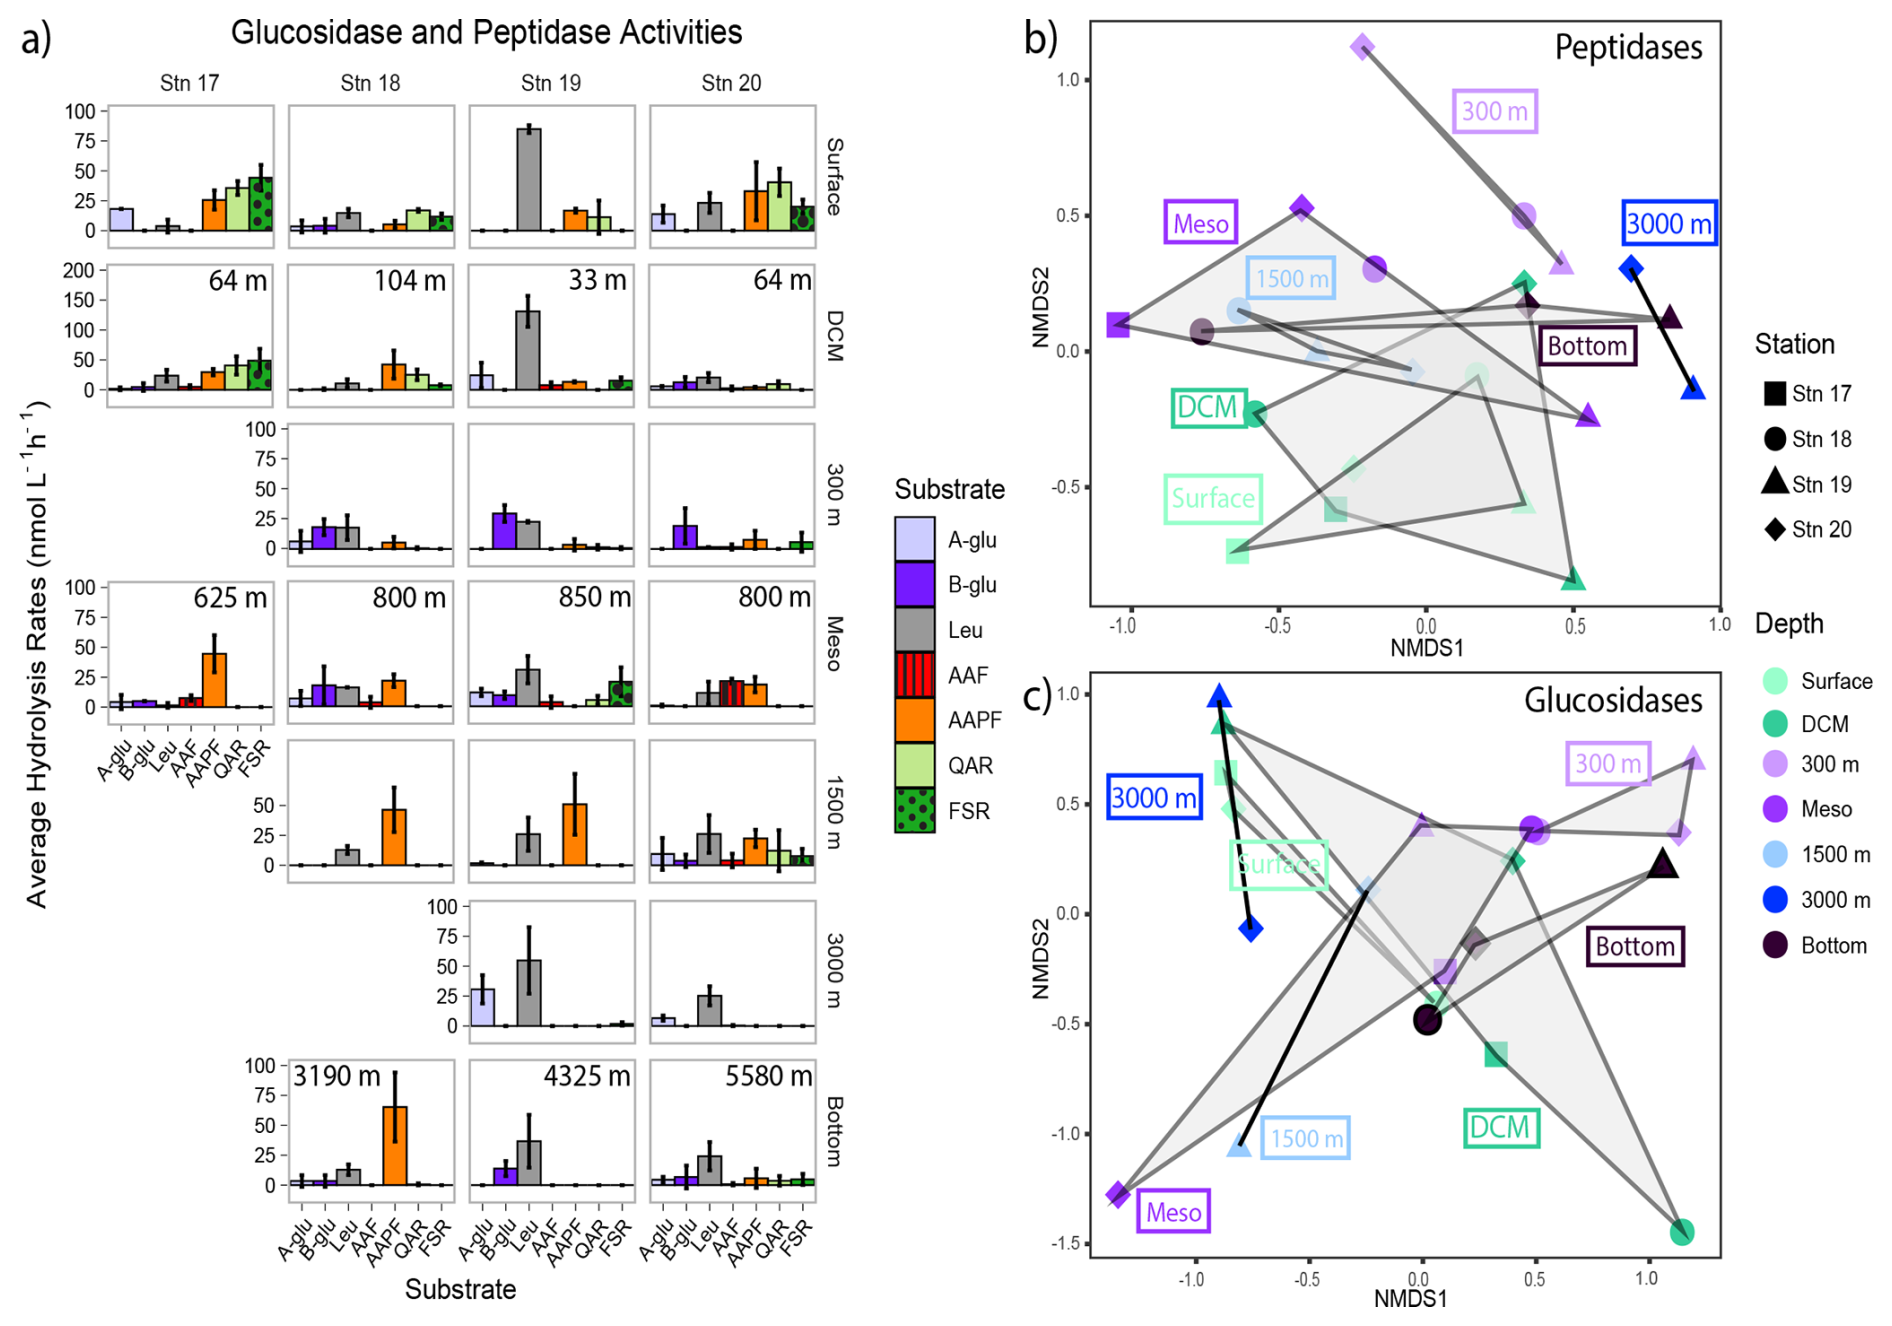
Figure 7(a) Average glucosidase and peptidase activities for each station and depth; error bars represent the standard deviation of activities measured over 12 h. Note that the y axes differ between each depth. A-glu: α-glucosidase; b-glu: β-glucosidase; leu: leucine aminopeptidase; AAF: alanine-alanine-phenylalanine; AAPF: alanine-alanine-proline-phenylalanine; QAR: glutamine-alanine-arginine; FSR: phenylalanine-serine-arginine. The NMDS plot based on Bray–Curtis dissimilarity shows (b) peptidase and (c) glucosidase activities clustered by depth. Shapes represent stations; colors represent depths. The shaded regions represent the grouping of enzyme activities by depth.
3.8 Polysaccharide hydrolase activities
Polysaccharide hydrolase activities varied considerably by depth (Fig. 8); the NMDS plot showed broad overlaps among stations (Fig. S8). The spectrum of enzyme activities (the number of different polysaccharides hydrolyzed) was generally broadest not in surface waters, where three or fewer polysaccharide substrates were hydrolyzed, but at the DCM, at 300 m, in the lower mesopelagic (ca. 800 m), or at 1500 m, where generally four or five substrates were hydrolyzed (Fig. 8). Stn. 18 lower mesopelagic and Stns. 19 and 20 1500 m waters showed increased polysaccharide hydrolase activities compared with other stations at the comparable depths; these higher activities are also reflected in the bacterial productivity data (Fig. 3). Summed polysaccharide hydrolase activities were lower in 3000+ m waters (∼ 1–4 nmol monomer L−1 h−1) compared to surface, DCM, 300 m, and lower mesopelagic waters (∼ 4–40 nmol monomer L−1 h−1; Fig. S9). At deeper depths, enzymatic activities were also generally first detected at later time points (Fig. 8).
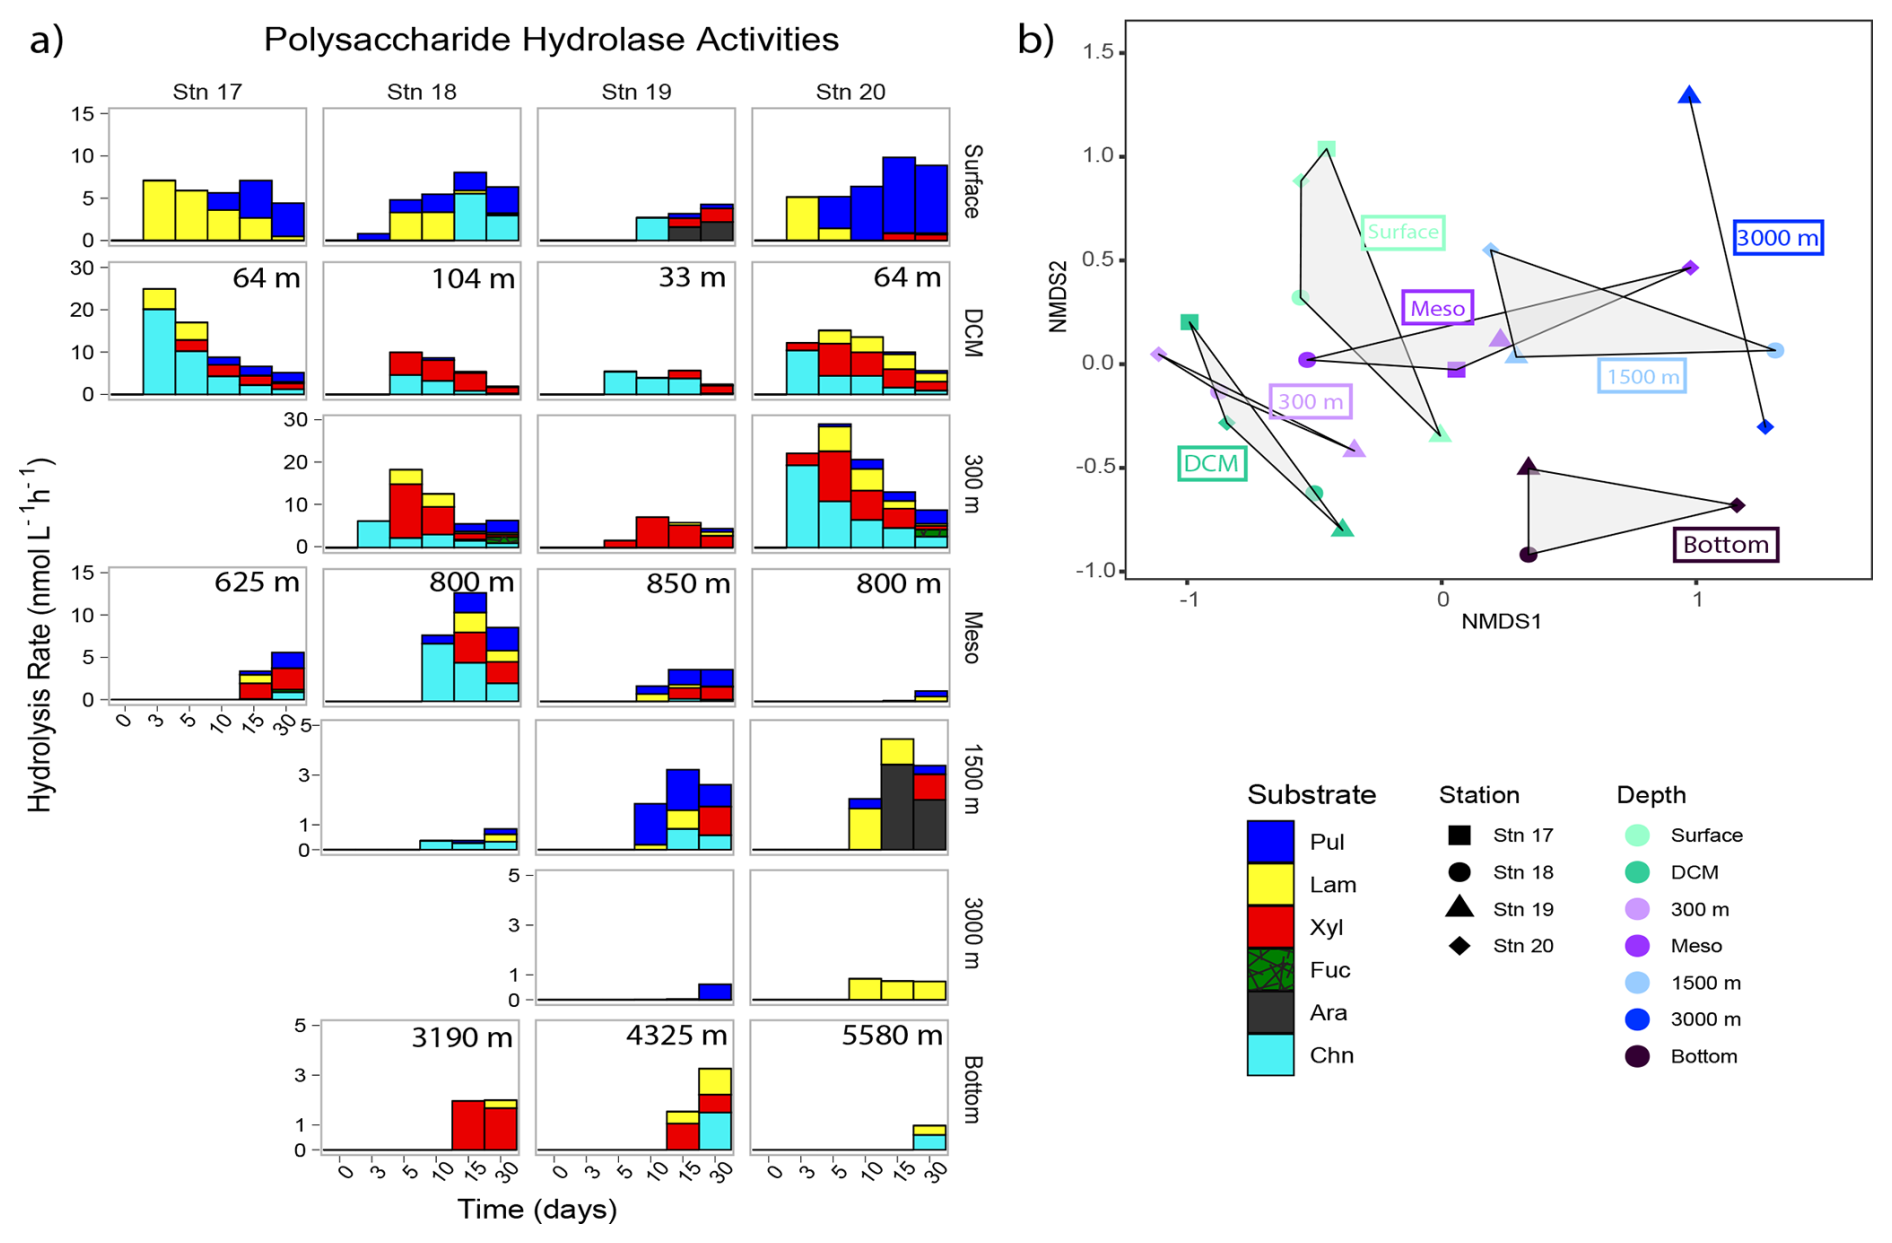
Figure 8(a) Polysaccharide hydrolase activities for each station and depth; the hydrolysis rates for each time point show when each substrate was hydrolyzed. Note that y axes differ between each depth. Pul: pullulan; Lam: laminarin; Xyl: xylan; Fuc: fucoidan; Ara: arabinogalactan; Chn: chondroitin sulfate. (b) The NMDS plot based on Bray–Curtis dissimilarity shows polysaccharide hydrolysis rates clustered by depth. Shapes represent stations; colors represent depths. The shaded regions represent the grouping of polysaccharide hydrolase activities by depth.
Hydrolysis of pullulan, laminarin, chondroitin, and xylan was measurable at most stations and depths. Laminarin hydrolysis was measured in 19 of 23 distinct depths across stations, pullulan hydrolysis was measured in 18 depths across stations, xylanase activity was measured in 16 depths across stations, and chondroitin sulfate was hydrolyzed at 15 depths across stations. Fucoidan and arabinogalactan hydrolysis was rarely detected; fucoidan was only measurably hydrolyzed at 300 m at Stns. 18 and 20, and arabinogalactan was only measurably hydrolyzed in Stn. 19 surface waters and, notably, at Stn. 20 at 1500 m. No stations or depths showed hydrolysis of all six polysaccharides.
3.9 Correlations among environmental parameters, carbohydrates, and enzymatic activities
Connections among enzymatic activities, environmental parameters, and carbohydrate composition across all of the stations were investigated using a correlation plot based on Pearson correlations (Fig. 9). Note that specific bacterial taxa were not included in this correlation plot because the polysaccharide hydrolase complement of bacteria varies widely even among closely related taxa (e.g., Avci et al., 2020; Krüger et al., 2019); moreover, resource prioritization can mean that even bacteria with the capability of hydrolyzing specific polysaccharides may target only a subset of the polysaccharides that they are capable of using (Koch et al., 2019). Total cell counts (TCCs) correlated strongly with particulate organic carbon, chlorophyll a, and carbohydrate content (i.e., the constituent monosaccharides of POC), including all monosaccharides except muramic and glucuronic acids. Most monosaccharides – again, with the exception of muramic acid and glucuronic acid – were also highly correlated with one another (Fig. 9), as were those same monosaccharides and the polysaccharide epitopes to detect β-1,3-glucan, β-1,4-mannan, xylosyl residues, and alginate. Correlations among enzyme activities were evident in only a few cases: laminarinase with pullulanase; xylanase and fucoidanase. QAR and FSR were highly correlated with one another; β-glucosidase was positively correlated with xylanase.
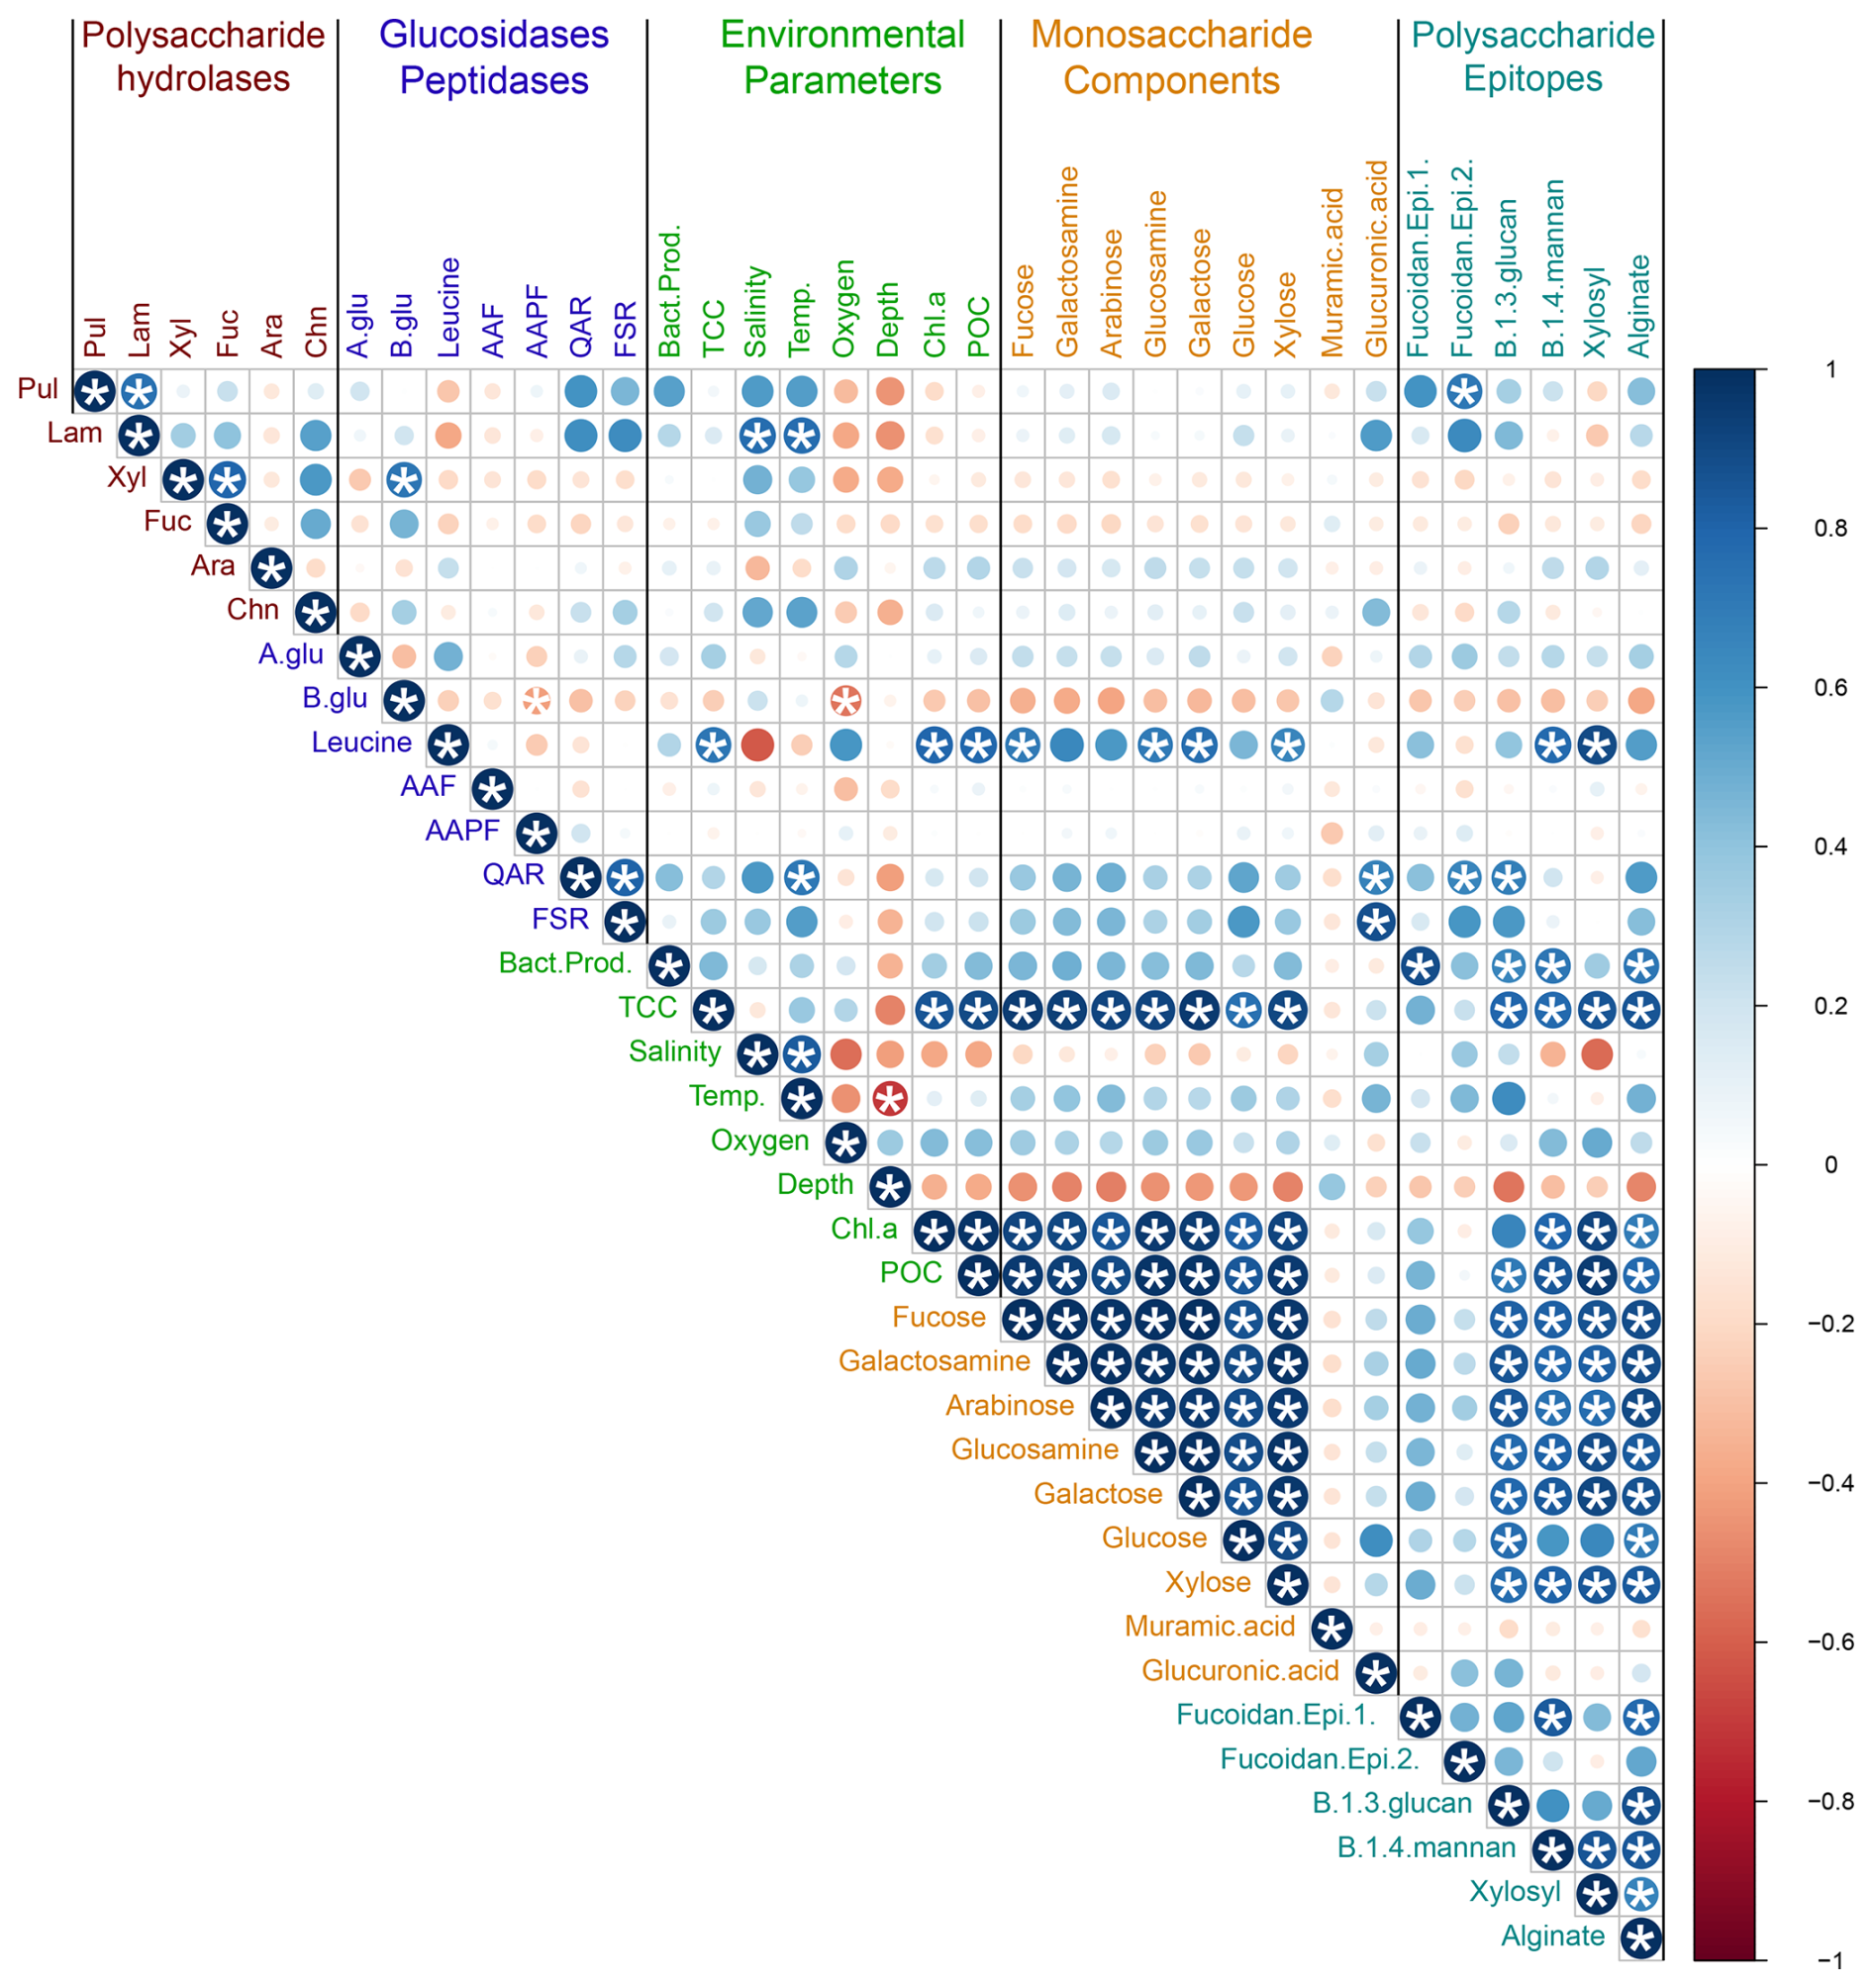
Figure 9Correlation plot displaying Pearson's correlations among enzymatic activities, environmental parameters, and carbohydrate constituents for all samples. Blue denotes positive correlations while red denotes negative correlations. The shade and size of the circle represents the intensity of correlation. * denotes statistical significance (p<0.05) after Bonferroni correction.
Given the physical and chemical distinctions among stations and depths (Figs. 2, 3, S1; Table S2), we also constructed individual correlation plots using enzymatic activities, environmental parameters, and carbohydrate constituents for each station (Fig. S10). These plots differed considerably from one another and from the overall correlation plot. For example, the polysaccharide hydrolase activities – aside from the correlations noted for the grouped stations (Fig. 9) – showed variable and distinctly different (i.e., positive/negative) correlations at individual stations, as did α- and β-glucosidase and most of the peptidase activities (Fig. S10).
Considering the depth patterns evident among polysaccharide hydrolase activities (Fig. 8), we also investigated interrelationships among all enzyme activities by grouping depths from all of the stations as either epipelagic (surface and DCM), mesopelagic (300 m, mesopelagic, 1500 m), or bathypelagic depths (3000 m and bottom water; Fig. 10). Correlations between polysaccharide hydrolase activities differed in each zone: the epipelagic showed a mix of positive and negative correlations, the mesopelagic zone showed strong positive correlations between most of the polysaccharide hydrolase activities, while the bathypelagic showed fewer positive correlations (Fig. 10). Although the glucosidase and peptidase activities show a mix of correlations in each zone, there were strong positive correlations between QAR and FSR activities in all of the zones (Fig. 10).
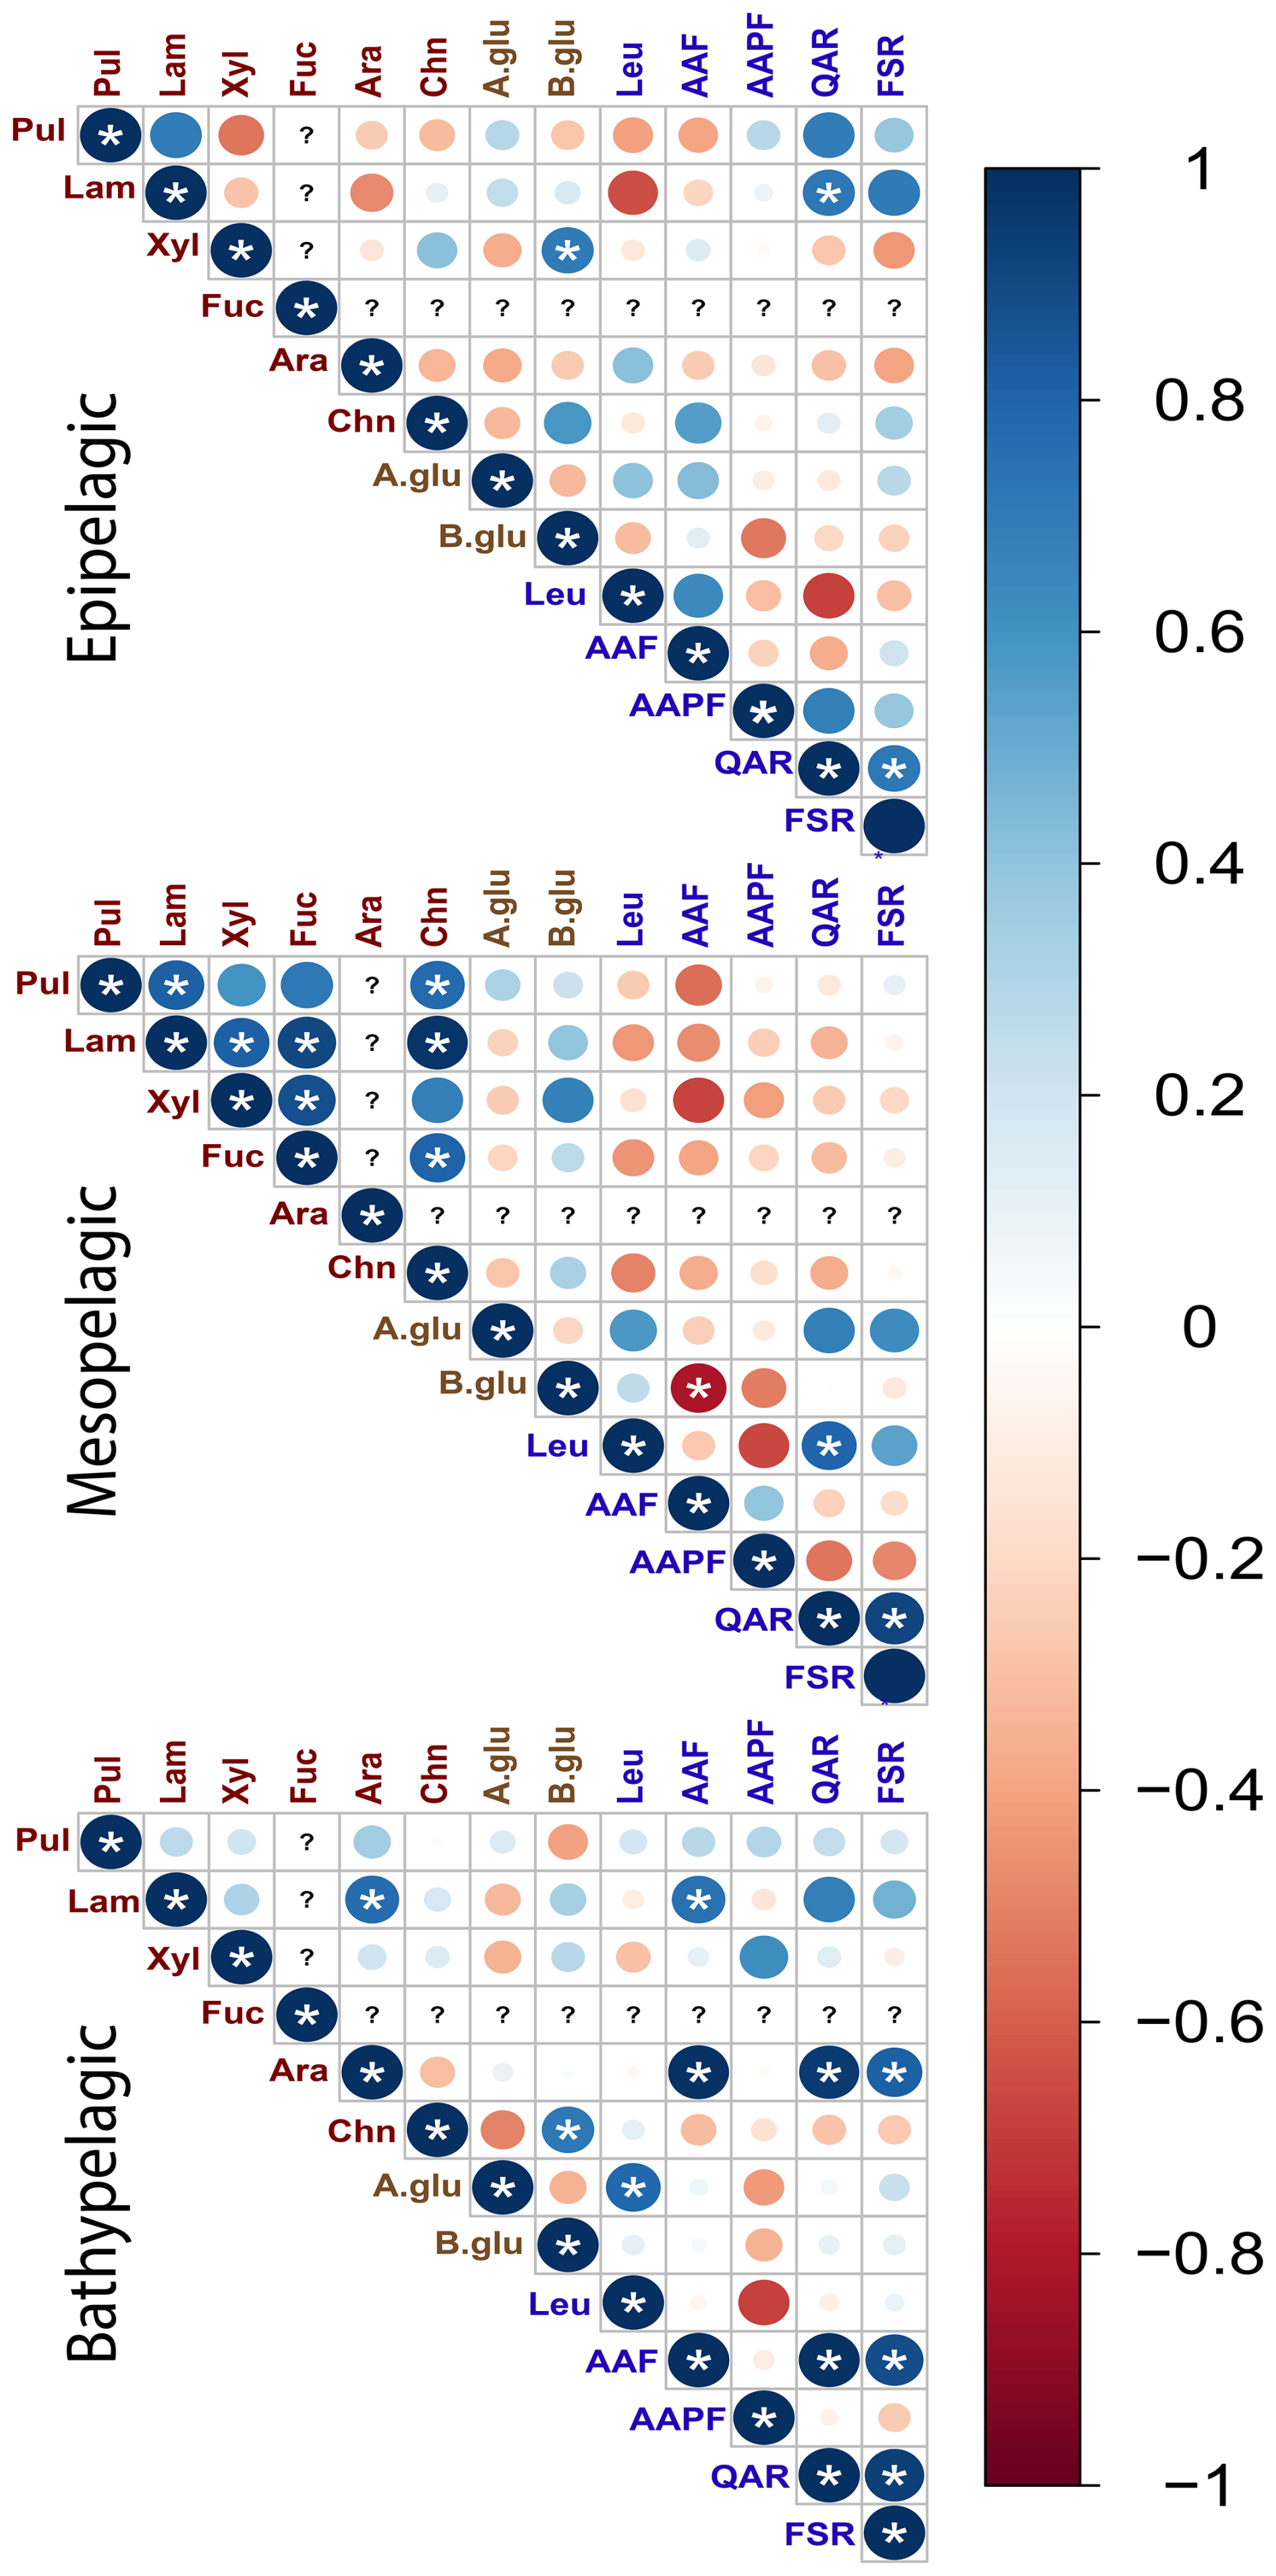
Figure 10Correlation plots displaying Pearson's correlations between enzymatic activities in different depth zones. Epipelagic zone: surface and DCM waters; mesopelagic zone: 300, , and 1500 m; bathypelagic zone: > 1500 m. Blue denotes positive correlations while red denotes negative correlations. The shade and size of the circle emphasizes the intensity of correlation between enzymatic activities. (?) for a given column or row represents a lack of data to assess a correlation for a given observation or measurement. * denotes statistical significance (p<0.05) after Bonferroni correction.
The production and decomposition of marine organic matter is a function of interlinked oceanic processes and actors: marine productivity is powered by phytoplankton at the base of the food web that produce high-molecular-weight biopolymers such as polysaccharides and proteins. These biopolymers can take both DOM and POM forms and include DOM excreted by phytoplankton and algae during growth (e.g., Mitulla et al., 2016; Buck-Wiese et al., 2023), as well as DOM released via viral lysis and grazing (Suttle, 2005; Middelboe, 2008; Nagata and Kirchman, 1992). POM by definition includes phytoplankton and other organisms that are retained via filtration, as well as POM produced via aggregation and gel formation of high-molecular-weight DOM – especially polysaccharide-containing DOM (Zhou et al., 1998; Verdugo et al., 2004; Huang et al., 2021) – that can entrain smaller particles into larger sinking aggregates (Markussen et al., 2020; Vidal-Melgosa et al., 2021). Marine organic matter therefore is present in a continuum of sizes and forms (Azam and Malfatti, 2007; Iversen 2023). All of this organic matter fuels heterotrophs, including the heterotrophic bacteria that cycle a large fraction of marine productivity (Azam and Malfatti, 2007); this organic matter must also be hydrolyzed to sufficiently small sizes prior to bacterial uptake. The nature and structure of this organic matter – whether dissolved or particulate – therefore dictate the enzymatic tools needed by heterotrophic microbial communities to access them (Gügi et al., 2015; Thomas et al., 2017). Microbial communities vary in their summed genetic capabilities and the extent to which they can activate them at a specific time and place; thus, substrates that are labile in one location may be recalcitrant in another (Arnosti et al., 2021). Untangling these interrelationships – the structure of the biopolymers found in different fractions of organic matter, the composition and capabilities of the heterotrophic communities, and the activities of the specific enzymes they produce – is essential to understand the rate and location at which organic matter is cycled in the ocean (Fig. 1a).
4.1 Carbohydrates, microbial communities, and their enzymatic capabilities by site and depth
The constituent monosaccharides of POM were similar across stations, showing slight differences between the upper water column (surface and DCM) compared to deeper depths (Fig. 3), a pattern previously observed in other locations in the ocean (Handa and Tominaga, 1969; Handa and Yanagi, 1969). This similarity in constituent monosaccharides (Fig. 1b), however, masks considerable differences in the carbohydrate epitopes detected in the POM collected in surface and DCM waters (Fig. 5). The number of epitopes detected ranged from a high of seven at Stn. 19 to a low of two at Stn. 18 (Fig. 5, Table S4); at all locations, β-1,3-glucan and alginate were detected. The widespread detection of β-1,3-glucan in our samples could be linked to the high prevalence of laminarin in the ocean (Alderkamp et al. 2007; Becker et al. 2020); this epitope has also been detected in cultured diatoms and diatom-derived HMW DOM (Huang et al., 2021), in POM and HMW DOM during a spring sampling series in the North Sea (Vidal-Melgosa et al., 2021), and in POM from all surface water samples at a series of sites around Svalbard (Priest et al., 2023). Alginate was also widely detected via epitopes in POM from surface water samples from Svalbard (Priest et al., 2023), in exudates of macroalgae (Koch et al., 2019), and additionally in cores collected from anoxic brine sediments in the Red Sea (Vidal-Melgosa et al., 2022). Although the alginate probe (BAM-7; Table S4) has been reported to cross-react with fucose-containing polysaccharides (Torode et al., 2016), the observation that alginate was detected in our samples at depths and locations where no fucoidan was detected (e.g., Stn. 18; DCM of Stns. 17 and 20) suggests that, in these cases, at a minimum, the positive signal was not due to cross-reaction. Fucoidan was detected, however, in surface waters of Stns. 17 and 20 (Epitope II; plus Epitope I for Stn. 20) as well as surface and DCM waters of Stn. 19 (Epitope I). These epitopes could be reacting to diatom-derived fucoidan (Huang et al., 2021; Vidal-Melgosa et al., 2021). Stn. 19 waters were notable in that most of the epitopes investigated were detected at this station: in addition to β-1,3-glucan and alginate, rhamnogalacturonan, β-1,4-mannan, and xylosyl residues were detected in POM from surface and DCM waters and β-1,4-glucan in POM from surface waters (Fig. 5; Table S4). This wide array of epitopes suggests that a considerable diversity of complex polysaccharides was present in POM samples at Stn. 19, a diversity that may be due to the North Atlantic spring bloom (high chlorophyll-a concentrations; Fig. 3), with a high concentration of phytoplankton. In support of this hypothesis, sequential waves of phytoplankton and a considerable array of carbohydrate epitopes have been reported in POM as well as HMW DOM during spring blooms in the German Bight (Vidal-Melgosa et al., 2021). In contrast, at Stn. 18, in the Gulf Stream, just two epitopes were detected in surface and DCM waters (Fig. 5). The differences in polysaccharide complexity detected in POM from Stns. 18 and 19 could also be driven in part by the different phytoplankton communities that dominate distinct regions of the western North Atlantic (Bolaños et al., 2020; Della Penna and Gaube, 2019).
In accordance with the structural differences of POM indicated by carbohydrate epitopes, activities of extracellular enzymes – which are also very sensitive to substrate structural features – differed notably by station and depth (Fig. 8; ANOVA, p = 0.0011). To measure potential activities of polysaccharides and proteins, two key components of POM (Hedges et al., 2002) and HMW DOM (McCarthy et al., 1996), we measured hydrolysis of a series of substrates that vary in structural complexity as well as in enzyme class. We note that the enzyme activities were measured in comparatively small volumes of water and thus likely primarily represented enzymes of free-living microbial communities; since bacterial community composition was measured in water volumes comparable to those used for the enzyme activity measurements, free-living microbial communities likely also dominated the sequences we obtained. However, a previous investigation in other parts of the western North Atlantic Ocean demonstrated that enzyme activities measurable in volumes of unfiltered water comparable to those used in the current study were always also measurable in the particle-associated fraction (Lloyd et al., 2022). In any case, polysaccharide hydrolase activities show spatial variations that parallel spatial differences in microbial community composition (Figs. 6, 8b; Arnosti et al., 2011, 2012); depth-related patterns have also been observed (Steen et al., 2012; Hoarfrost and Arnosti 2017; Balmonte et al., 2021; Lloyd et al., 2023). We note, however, that drawing a more direct connection between specific organisms and the activities of specific enzymes – with the exception of selfish bacteria (Cuskin et al., 2015; Reintjes et al., 2017) – is currently beyond the state of the art.
We also examined the statistical connection among polysaccharide- and protein-hydrolyzing enzymes, as well as physical and environmental factors. Among the four stations, a handful of very robust correlations in enzyme activities were evident (Fig. 9), but there were also considerable differences among individual stations (Fig. S9). These variations in activities likely reflect the considerable variety of enzymes produced even by closely related bacteria (Avci et al., 2020; Krüger et al., 2019) as well as resource prioritization for specific substrates among bacteria (Koch et al., 2019). Given the depth stratification of microbial communities (Figs. 6, S5), which extends to the ability of communities to excrete extracellular enzymes (Zhao et al., 2020), we investigated correlations among enzyme activities by depth zone (Fig. 10). This correlation plot revealed patterns not evident from the depth-integrated correlation plots (Fig. 9). Most notably, in the mesopelagic, most of the polysaccharide hydrolases positively correlate with one another, despite the fact that different enzymes, often produced by different organisms, are responsible for hydrolysis of these structurally distinct polysaccharides (e.g., Becker et al., 2020; Reisky et al., 2019; Sichert et al., 2020). Peptidase correlations, however, were not notably more prevalent in the mesopelagic than in other depth zones. These correlations suggest that, in the mesopelagic, polysaccharides – including those with more complex structures – are a specific target, in accordance with studies that have demonstrated intense organic matter remineralization in this zone (Boyd et al., 1999; Buesseler et al., 2007).
A surprising observation is that activities of the exo-acting enzymes (β- and α-glucosidase, leucine aminopeptidase) seldom showed positive correlations with endo-acting enzymes targeting the same substrate class (i.e., leucine aminopeptidase with the other peptidases: AAF, AAPF, QAR, and FSR; β- and α-glucosidase with the polysaccharide hydrolases). Moreover, α- and β-glucosidase activities did not show positive correlations with each other. Leucine aminopeptidase activity overall strongly correlated with most of the monomers of combined carbohydrates, as well as some of the carbohydrate epitopes (Fig. 9), perhaps a sign of activity hydrolyzing terminal amino acids from polysaccharide components, given that leucine aminopeptidase activity integrates the activities of multiple exo-acting peptidases (Steen et al., 2015). However, leucine-aminopeptidase activities did not otherwise show broad-scale correlations with the endopeptidase activities. The lack of correlations between activities of the exo- and endo-acting enzymes targeting carbohydrates, as well as those targeting peptides, suggest that these enzymes may be targeting structures that include terminal monosaccharides or amino acids. In any case, these results suggest that measurements of exo-acting activities with leucine-MCA and MUF-β-glucosidase should not be used generally as overall proxies for polysaccharide or protein degradation by microbial communities.
Spatial differences in polysaccharide hydrolase activities (Fig. 8) are likely a function of depth- and location-related differences in microbial community composition (Figs. 6, S5). These differences have been linked to substrate availability, as in the case of the shifting nature of organic matter produced during phytoplankton blooms (e.g., Teeling et al., 2012; Dlugosch et al., 2023), with specific organisms targeting distinct polysaccharide structures (Francis et al., 2021; Giljan et al., 2023; Orellana et al., 2022). While depth stratification in microbial composition has been previously reported (e.g., DeLong et al., 2006), including in the northwestern Atlantic Ocean (Zorz et al., 2019), we found indications of differences in community composition across locations (Figs. S4, S5). Location-related differences were particularly pronounced in the surface ocean (Fig. S4), where physical, biological, and chemical properties of the water masses differed the most (Figs. 2, 3; Table S2). For example, the high chlorophyll fluorescence at Stn. 19 at the time of sampling likely is due to the North Atlantic spring bloom; phytoplankton blooms have been shown to lead to increases in bacteria that possess the genes capable of degrading complex substrates (e.g., Teeling et al., 2016; Kalenborn et al., 2024). Differences in community composition and enzymatic function (Figs. 6, 8) were also evident in the water below 1500 m from all of the stations, despite all water from these depths having characteristics typical of North Atlantic Deep Water (Broecker, 1991; Fig. 2). These differences in community composition and enzymatic function could be due in part to the ca. 2000 m difference in bottom water depths between Stns. 18 and 20 (Table S2) as well as differences in the quantity and nature of sinking particles at each location (Mestre et al., 2018; Pelve et al., 2017), which may also affect enzymatic activities in the deep ocean (Lloyd et al., 2022).
4.2 Polysaccharide structural complexity could in part explain patterns of heterotrophic carbon cycling in the ocean
This analysis of carbohydrate epitopes in POM, only the second study using this technique on open ocean samples (Priest et al., 2023), provides insight into the composition of intact polysaccharides in the upper ocean. The presence of 1,3-β-D-glycans and alginate at all of the stations in surface and DCM waters (Fig. 5) demonstrates that laminarin and alginate-derived structures are found in POM from a broad range of locations. At Stns. 17, 19, and 20, moreover, at least one of the fucoidan epitopes was detected in POM from surface waters. Detection of these structures is particularly intriguing, since laminarin and fucoidan in essence are at the opposite ends of the degradation spectrum. Laminarin is rapidly hydrolyzed in most ocean waters, but fucoidan hydrolysis is rarely detected in the water column (Arnosti et al., 2011; Hoarfrost and Arnosti, 2017; Balmonte et al., 2021; Lloyd et al., 2023). This pattern holds for the current investigation as well, where fucoidan hydrolysis was only measurable at 300 m at Stns. 18 and 20, whereas laminarin hydrolysis was widely detected, at 19 of the 23 stations and depths (Fig. 8).
The difference in hydrolysis of laminarin and fucoidan is likely linked to substrate structural complexity, since the number of different types of enzymes required to hydrolyze a polysaccharide scales linearly with polysaccharide structural complexity (Bligh et al., 2022); fucoidan in particular represents a hydrolytic challenge (Sichert et al., 2020). POM in the upper ocean likely includes polysaccharide structures that are highly labile, as well as those that are generally recalcitrant with respect to bacterial remineralization. We surmise that with increasing depth in the ocean, the contribution of labile constituents would decrease, and the relative contribution of recalcitrant polysaccharides would be enhanced. Testing this hypothesis would require investigation of polysaccharide epitopes in POM collected in deep water, where sinking particles can be substantially re-worked by bacterial communities. In the current investigation, however, aside from the (shallow) bottom water at Stn. 17, we were not able to detect polysaccharide epitopes in POM from the deep ocean. Given the low concentrations of POM in the deep ocean (Table S2; Baker et al., 2017), the potential for incomplete extraction of polysaccharides by our methods, and the comparatively small volume of water we filtered for POM analysis, we surmise that any polysaccharides present in deeper samples were below our limit of detection. Alternatively, deep ocean POM may not be characterizable using epitopes due to bacterial transformations of sinking particles (Wakeham et al., 1997; Hedges et al., 2001; Kharbusch et al., 2020). However, previous studies have also reported rapid fluxes of fresh organic matter to the deep ocean (Follett et al., 2014; Ruiz-Gonzalez et al., 2020; Poff et al., 2021), suggesting that labile polysaccharides may be present even in deep waters. In support of this point, bathypelagic bacteria capable of selfish uptake of a broad range of polysaccharides (including fucoidan) have recently been identified in deep ocean waters at these same stations (Giljan et al., 2023). Because this mechanism of acquiring polysaccharides involves initially binding, partially hydrolyzing, and transporting larger macromolecules to the periplasmic region of the cell (Cuskin et al., 2015), this finding suggests that intact polysaccharides are components of fresh organic matter that reaches the bottom of the ocean (Giljan et al., 2023). Collection of larger quantities of POM and/or improvements in extraction methods may lead in the future to characterization of intact polysaccharides in deep ocean POM.
The structural complexity of polysaccharides may help explain patterns of the enzymatic capabilities of microbial communities and the in situ carbohydrate signatures that differ among the stations, information that is not evident when analyzing the individual monosaccharide building blocks of combined carbohydrates (Fig. 1b). This variability may not exist to the same extent in the peptidase activities (Fig. 7), since peptidases generally have a broader array of target substrates (Lapébie et al., 2019). However, the observation that activities of both classes of exo-acting enzymes (glucosidases and leucine aminopeptidase) do not correlate with the activities of endo-acting enzymes (polysaccharide hydrolases and trypsin and chymotrypsin peptidases; Figs. 9, 10) that target the same class of molecule suggests that hydrolysis of HMW substrates involves a level of structural complexity that is not easily captured experimentally (Fig. 1). Epitope analysis begins to reveal some of these otherwise hidden structural features of polysaccharides, providing a pathway to understanding the intricacies of the microbial community's enzymatic toolbox and the manner in which microbial activities vary with location and depth in the ocean.
The polysaccharide hydrolase dataset can be accessed via the Biological and Chemical Oceanography Data Management Office (BCO-DMO) under the project A mechanistic microbial underpinning for the size–reactivity continuum of dissolved organic carbon degradation (Microbial DOC Degradation; https://doi.org/10.26008/1912/bco-dmo.821801.1, Arnosti, 2020a, last access: March 2025).
The peptidase and glucosidase extracellular hydrolase activity dataset can be accessed via the Biological and Chemical Oceanography Data Management Office (BCO-DMO) under the project A mechanistic microbial underpinning for the size–reactivity continuum of dissolved organic carbon degradation (Microbial DOC Degradation; https://doi.org/10.26008/1912/bco-dmo.820973.1, Arnosti, 2020b, last access: March 2025).
The total cell abundance dataset can be accessed via the Biological and Chemical Oceanography Data Management Office (BCO-DMO) under the project A mechanistic microbial underpinning for the size–reactivity continuum of dissolved organic carbon degradation (Microbial DOC Degradation; https://doi.org/10.26008/1912/bco-dmo.820961.1, Arnosti, 2020c, last access: March 2025).
The bacterial productivity dataset can be accessed via the Biological and Chemical Oceanography Data Management Office (BCO-DMO) under the project A mechanistic microbial underpinning for the size–reactivity continuum of dissolved organic carbon degradation (Microbial DOC Degradation; https://doi.org/10.26008/1912/bco-dmo.820556.1, Arnosti, 2020d, last access: March 2025).
The monosaccharide constituents of particulate organic matter dataset can be accessed via Zenodo at https://doi.org/10.5281/zenodo.15375159 (Lloyd, 2025a, last access: March 2025).
The carbohydrate epitopes of particulate organic matter dataset can be accessed via Zenodo at https://doi.org/10.5281/zenodo.15375738 (Lloyd, 2025b, last access: March 2025).
Bacterial community composition can be accessed through the European Nucleotide Archive (ENA) under accession number PRJEB63119.
The supplement related to this article is available online at https://doi.org/10.5194/bg-22-5787-2025-supplement.
CCL: investigation, formal analysis, data curation, visualization, writing – original draft, writing – review and editing; SB: investigation, data curation, methodology, writing – original draft, writing – review and editing; GG: investigation, data curation, visualization, writing – original draft; writing – review and editing; SVM: investigation, data curation, methodology, writing – review and editing; NS: investigation, writing – review and editing; JHH: investigation, conceptualization, methodology, writing – review and editing, funding acquisition; SG: investigation, methodology, writing – review and editing; RA: investigation, writing – review and editing, supervision, funding acquisition; CA: conceptualization, methodology, investigation, writing – original draft, writing – review and editing, supervision, project administration, funding acquisition.
The contact author has declared that none of the authors has any competing interests.
Publisher’s note: Copernicus Publications remains neutral with regard to jurisdictional claims made in the text, published maps, institutional affiliations, or any other geographical representation in this paper. While Copernicus Publications makes every effort to include appropriate place names, the final responsibility lies with the authors. Also, please note that this paper has not received English language copy-editing. Views expressed in the text are those of the authors and do not necessarily reflect the views of the publisher.
We thank the captain and crew of the R/V Endeavor as well as the members of the scientific party of EN638 for excellent work at sea. We would like to thank John Bane for valuable discussions pre- and post-cruise and for his help in interpreting the physical oceanography of the region. Funding was provided by the U.S. National Science Foundation (OCE-2022952 to CA), with additional funding from the Max Planck Society.
This research has been supported by the National Science Foundation (grant nos. OCE-2022952 and OCE-1736772) and the Max-Planck-Gesellschaft.
The article processing charges for this open-access publication were covered by the Max Planck Society.
This paper was edited by Tina Treude and reviewed by two anonymous referees.
Alderkamp, A.-C., Van Rijssel, M., and Bolhuis, H.: Characterization of marine bacteria and the activity of their enzyme systems involved in degradation of the algal storage glucan laminarin, FEMS Microbiol. Ecol., 59, 108–117, 2007.
Andres, M., Muglia, M., Bahr, F., and Bane, J.: Continuous flow of Upper Labrador Sea Water around Cape Hatteras, Sci. Rep., 8, 4494, https://doi.org/10.1038/s41598-018-22758-z, 2018.
Arnosti, C.: Fluorescent derivatization of polysaccharides and carbohydrate-containing biopolymers for measurement of enzyme activities in complex media, J. Chromatogr. B. Analyt. Technol. Biomed. Life Sci., 793, 181–191, https://doi.org/10.1016/s1570-0232(03)00375-1, 2003.
Arnosti, C.: Microbial extracellular enzymes and the marine carbon cycle, Ann. Rev. Mar. Sci., 3, 401–425, https://doi.org/10.1146/annurev-marine-120709-14273, 2011.
Arnosti, C.: Large substrate hydrolysis of bulk water samples taken aboard the R/V Endeavor EN638, May 2019 in the Northern Atlantic. (Version 1), Biological and Chemical Oceanography Data Management Office (BCO-DMO) [data set], https://doi.org/10.26008/1912/BCO-DMO.821801.1, 2020a.
Arnosti, C.: Small substrate hydrolysis of bulk water samples taken aboard the R/V Endeavor EN638, May 2019 in the Northern Atlantic. (Version 1), Biological and Chemical Oceanography Data Management Office (BCO-DMO) [data set], https://doi.org/10.26008/1912/BCO-DMO.820973.1, 2020b.
Arnosti, C.: Bulk water cell abundance of samples taken aboard the R/V Endeavor EN638, May 2019 in the Northern Atlantic (Version 1), Biological and Chemical Oceanography Data Management Office (BCO-DMO) [data set], https://doi.org/10.26008/1912/BCO-DMO.820961.1, 2020c.
Arnosti, C.: Bacterial production of bulk water and large volume samples taken aboard the R/V Endeavor EN638, May 2019 in the Northern Atlantic. (Version 1), Biological and Chemical Oceanography Data Management Office (BCO-DMO) [data set], https://doi.org/10.26008/1912/BCO-DMO.820556.1, 2020d.
Arnosti, C., Steen, A. D., Ziervogel, K., Ghobrial, S., and Jeffrey, W. H.: Latitudinal gradients in degradation of marine dissolved organic carbon, PLoS ONE, 6, e28900, https://doi.org/10.1371/journal.pone.0028900, 2011.
Arnosti, C., Fuchs, B., Amann, R., and Passow, U.: Contrasting extracellular enzyme activities of particle associated bacteria from distinct provinces of the North Atlantic Ocean, Front. Microbiol., 3, 425, https://doi.org/10.3389/fmicb.2012.00425, 2012.
Arnosti, C., Wietz, M., Brinkhoff, T., Hehemann, J.-H., Probandt, D., Zeugner, L., and Amann, R.: The biogeochemistry of marine polysaccharides: Sources, inventories, and bacterial drivers of the carbohydrate cycle, Annu. Rev. Mar. Sci., 13, https://doi.org/10.1146/annurev-marine-032020-012810, 2021.
Arnosti, C., Hoarfrost, A., Balmonte, J. P., Lloyd, C. C., Brown, S. A., and Ghobrial, S.: Empirical definition of the mad buckets magic number: A guide for seagoing scientists, L&O Bull., 32, 104, https://doi.org/10.1002/lob.10577, 2023.
Avci, B., Kruger, K., Fuchs, B. M., Teeling, H., and Amann, R. I.: Polysaccharide niche partitioning of distinct Polaribacter clades during North Sea spring algal blooms, ISME J., 14, 1369–1383, 2020.
Azam, F., and Malfatti, F.: Microbial structuring of marine ecosystems, Nat. Rev. Microbiol., 5, 782–791, https://doi.org/10.1038/nrmicro1747, 2007.
Baker, C. A., Henson, S. A., Cavan, E. L., Giering, S. L. C., Yool, A., Gehlen, M., Belcher, A., Riley, J. S., Smith, H. E. K., and Sanders, R.: Slow-sinking particulate organic carbon in the Atlantic Ocean: Magnitude, flux, and potential controls, Global Biogeochem. Cy., 31, 105101065, https://doi.org/10.1002/2017GB005638, 2017.
Balmonte, J. P., Teske, A., and Arnosti, C.: Structure and function of high Arctic pelagic, particle-associated and benthic bacterial communities, Environ. Microbiol., 20, 2941–2959, 2018.
Balmonte, J. P., Simon, M., Giebel, H.-A., and Arnosti, C.: A sea change in microbial enzymes: Heterogeneous latitudinal and depth-related gradients in bulk water and particle-associated enzymatic activities from 30° S to 59° N in the Pacific Ocean, Limnol. Ocean., 66, 3489–3507, https://doi.org/10.1002/lno.11894, 2021.
Becker, S., Tebben, J., Coffinet, S., Hehemann, J.-H.: Laminarin is a major molecule in the marine carbon cycle, P. Natl. Acad. Sci. USA, 117, 6599–6607, https://doi.org/10.1073/pnas.1917001117, 2020.
Bennke, C. M., Reintjes, G., Schattenhofer, M., Ellrott, A., Wulf, J., Zeder, M., and Fuchs, B. M.: Modification of a high-throughput automatic microbial cell enumeration system for shipboard analyses, Appl. Environ. Microbiol., 82, 3289–3296, 2016.
Bligh, M., Nguyen, N., Buck-Wiese, H., Vidal-Melgosa, S., Hehemann, J.-H.: Structures and functions of algal glycans shape their capacity to sequester carbon in the ocean, Curr. Opin. Chem. Biol., 71, 102204, https://doi.org/10.1016/j.cbpa.2022.102204, 2022.
Bolaños, L., Karp-Boss, L., Choi, C., Worden, A., Graff, J., Haentjens, N., Chase, A., Penna, A., Gaube, P., Morison, F., Menden-Deuer, S., Westberry, T., O'Malley, R., Boss, E., Behrenfeld, M., and Giovannoni, S.: Small phytoplankton dominate western North Atlantic biomass, ISME J., 14, 1663–1674, https://doi.org/10.1038/s41396-020-0636-0, 2020.
Boyd, P. W., Sherry, N. D., Berges, J. A., Bishop, J. K. B., Calvert, S. E., Charette, M. A., Giovannoni, S. J., Goldblatt, R., Harrison, P. J., Moran, S. B., Roy, S., Soon, M., Strom, S., Thibault, D., Vergin, K. L., Whitney, F. A., and Wong, C. S.: Transformations of biogenic particulates from the pelagic to the deep ocean realm, Deep-Sea Res. Pt. II, 46, 2761–2792, 1999.
Broecker, W.: The great ocean conveyor, Oceanography, 4, 79–89, https://doi.org/10.5670/oceanog.1991.07, 1991.
Buck-Wiese, H., Andskog, M. A., Nguyen, N. P., Asmala, E., Vidal-Melgosa, S., Liebke, M., Gustafsson, C., and Hehemann, J.-H.: Fucoid brown algae inject fucoidan carbon into the ocean, P. Natl. Acad. Sci. USA, 120, e2210561119, https://doi.org/10.1073/pnas.2210561119, 2023.
Buesseler, K. O., Lamborg, C. H., Boyd, P. W., Lam, P. J., Trull, T. W., Bidigare, R. R., Bishop, J. K., Casciotti, K. L., Dehairs, F., Elskens, M., Honda, M., Karl, D. M., Siegel, D. A., Silver, M. W., Steinberg, D. K., Valdes, J., Van Mooy, B., and Wilson, S.: Revisiting carbon flux through the ocean's twilight zone, Science, 316, 567–570, 2007.
Bushnell, B.: BBTools software package, 578, http://sourceforge.net/projects/bbmap (last access: November 2023), 2014.
Cuskin, F., Lowe, E. C., Temple, M. J., Zhu, Y., Cameron, E. A., Pudlo, N. A., Porter, N. T., Urs, K., Thompson, A. J., Cartmell, A., Rogowski, A., Hamilton, B. S., Chen, R., Tolbert, T. J., Piens, K., Bracke, D., Vervecken, W., Hakki, Z., Speciale, G., Munoz-Munoz, J. L., Day, A., Pena, M. J., McLean, R., Suits, M. D., Boraston, A. B., Atherly, T., Ziemer, C. J., Williams, S. J., Davies, G. J., Abbott, D. W., Martens, E. C., and Gilbert, H. J.: Human gut Bacteroidetes can utilize yeast mannan through a selfish mechanism, Nature, 517, 165–169, 2015.
Della Penna, A. and Gaube, P.: Overview of (Sub)mesoscale ocean dynamics for the NAAMES field program, Frontiers Mar. Sci., 6, 384, https://doi.org/10.3389/fmars.2019.00384, 2019.
DeLong, E. F., Preston, C. M., Mincer, T., Rich, V., Hallam, S. J., Frigaard, N.-U., Martinez, A., Sullivan, M. B., Edwards, R., Brito, B. R., Chisholm, S. W., and Karl, D. M.: Community genomics among stratified microbial assemblages in the ocean's interior, Science, 311, 496–503, 2006.
Dlugosch, L., Bunse, C., Bunk, B., Böttcher, L., Tran, D. Q., Dittmar, T., Hartmann, M., Heinrichs, M., Hintz, N. H., Milke, F., Mori, C., Niggemann, J., Spröer, C., Striebel, M., and Simon, M.: Naturally induced biphasic phytoplankton spring bloom reveals rapid and distinct substrate and bacterial community dynamics, FEMS Microbiol. Ecol., 99, fiad078, https://doi.org/10.1093/femsec/fiad078, 2023.
Engel, A. and Handel, B.: A novel protocol for determining the concentration and composition of sugars in particulate and in high molecular weight dissolved organic matter (HMW-DOM) in seawater, Mar. Chem., 127, 180–191, https://doi.org/10.1016/j.marchem.2011.09.004, 2011.
Fadeev, E., Cardozo-Mino, M. G., Rapp, J. Z., Bienhold, C., Salter, I., Salman-Carvalho, V., Molari, M., Tegetmeyer, H. E., Buttigieg, P. L., and Boetius, A.: Comparison of two 16S rRNA primers (V3-V4 and V4-V-5) for studies of Arctic microbial communities, Frontiers Microb., 12, 637526, https://doi.org/10.3389/fmicb.2021.637526, 2021.
Follett, C. L., Repeta, D. J., Rothman, D. H., Xu, L., and Santinelli, C.: Hidden cycle of dissolved organic carbon in the deep ocean, P. Natl. Acad. Sci. USA, 111, 16706–16711, 2014.
Francis, B. T., Bartosik, D., Sura, T., Sichert, A., Hehemann, J.-H., Markert, S., Schweder, T., Fuchs, B. M., Teeling, H., Amann, R. I., and Becher, D.: Changing expression of TonB-dependent transporters suggest shifts in polysaccharide consumption over the course of a spring phytoplankton bloom, ISME J., 15, 2336–2350, https://doi.org/10.1038/s41396-021-00928-8, 2021.
Fratantoni, P. S. and Pickart, R. S.: The western North Atlantic shelfbreak current system in summer, J. Phys. Oceanogr, 37, 2509–2533, 2007.
Giljan, G., Brown, S., Lloyd, C. C., Ghobrial, S., Amann, R., and Arnosti, C.: Selfish bacteria are active throughout the water column of the ocean, ISME Commun., 3, 11, https://doi.org/10.1038/s43705-023-00219-7, 2023.
Gügi, B., Le Cosaouec, T., Burel, C., Lerouge, P., Helbert, W., and Bardor, M.: Diatom-specific oligosaccharide and polysaccharide structures help to unravel biosynthetic capabilities in diatoms, Mar. Drugs, 13, 5993–6018, 2015.
Handa, N. and Tominaga, H.: A detailed analysis of carbohydrates in marine particulate matter Mar. Biol., 2, 228–235, 1969.
Handa, N. and Yanagi, K.: Studies on water-extractable carbohydrates of the particulate matter from the northwest Pacific Ocean, Mar. Biol., 4, 197–207, 1969.
Hedges, J. I., Baldock, J. A., Gelinas, Y., Lee, C., Peterson, M., and Wakeham, S. G.: Evidence for non-selective preservation of organic matter in sinking marine particles, Nature, 409, 801–804, 2001.
Hedges, J. I., Baldock, J. A., Gelinas, Y., Lee, C., Peterson, M., and Wakeham, S. G.: The biochemical and elemental compositions of marine plankton: a NMR perspective, Mar. Chem., 78, 47–63, 2002.
Hedges, J. I., Eglinton, G., Hatcher, P. G., Kirchman, D. L., Arnosti, C., Derenne, S., Evershed, R. P., Kögel-Knabner, I., De Leeuw, J. W., Littke, R., Michaelis, W., and Rullkötter, J.: The molecularly-uncharacterized component (MUC) of nonliving organic matter in natural environments, Organic Geochem., 31, 945–958, 2000.
Heidrich, J. and Todd, R. E.: Along-stream evolution of Gulf Stream volume transport, J. Phys. Oceanogr., 50, 2251–2270, https://doi.org/10.1175/JPO-D-19-0303.1, 2020.
Herlemann, D. P. R., Labrenz, M., Jürgens, K., Bertilsson, S., Waniek, J. J., and Andersson, A. F.: Transitions in bacterial communities along the 2000 km salinity gradient of the Baltic Sea, ISME J., 5, 1571–1579, 2011.
Hoarfrost, A. and Arnosti, C.: Heterotrophic extracellular enzymatic activities in the Atlantic Ocean follow patterns across spatial and depth regimes, Front. Mar. Sci., 4, 200, https://doi.org/10.3389/fmars.2017.00200, 2017.
Huang, G., Vidal-Melgosa, S., Sichert, A., Becker, S., Fang, Y., Niggemann, J., Iversen, M. H., Cao, Y., and Hehemann, J.-H.: Secretion of sulfated fucans by diatoms may contribute to marine aggregate formation, Limnol. Oceanography, 66, 3768–3782, 2021.
Iversen, M. H.: Carbon export in the ocean: A biologist's perspective, Annu. Rev. Mar. Sci., 15, 357–381, 2023.
Kalenborn, S., Zuhlke, D., Riedel, K., Amann, R. I., and Harder, J.: Proteomic insight into arabinogalactan utilization by particle-associated Maribacter sp. MAR_2009_72, FEMS Microb. Ecol., 100, fiae045, https://doi.org/10.1093/femsec/fiae045, 2024.
Kharbush, J., Close, H., Van Mooy, B., Arnosti, C., Smittenberg, R., Le Moigne, F., Molienhauer, G., Scholz-Bottcher, B., Obreht, I., Koch, B., Becker, K., Iversen, M., and Mohr, W.: Particulate organic carbon Deconstructed: Molecular and chemical composition of particulate organic carbon in the ocean, Front. Mar. Sci., 7, 00518, https://doi.org/10.3389/fmars.2020.00518, 2020.
Kirchman, D. L.: Measuring bacterial biomass production and growth rates from leucine incorporation in natural aquatic environments, Methods Microbiol., 30, 227–237, https://doi.org/10.1016/s0580-9517(01)30047-8, 2001.
Koch, H., Dürwald, A., Schweder, T., Noriega-Ortega, B., Vidal-Melgosa, S., Hehemann, J.-H., Dittmar, T., Freese, H. M., Becher D., Simon, M., and Wietz, M.: Biphasic cellular adaptations and ecological impllications of Alteromonas macleodii degrading a mixture of algal polysaccharides, ISME J., 13, 92–103, https://doi.org/10.1038/s41396-018-0252-4, 2019.
Krüger, K., Chafee, M., Francis, T. B., Glavina del Rio, T., Becher, D., Schweder, T., Amann, R. I., and Teeling, H.: In marine Bacteroidetes the bulk of glycan degradation during algae blooms is mediated by few clades using a restricted set of genes, ISME J., 13, 2800–2816, 2019.
Laine, R. A.: A calculation of all possible oligosaccharide isomers both branched and linear yields 1.05 x 10¹² structures for a reducing hexasaccharide: the Isomer Barrier to development of single-method saccharide sequencing or synthesis systems, Glycobiology, 4, 759–767, https://doi.org/10.1093/glycob/4.6.759, 1994.
Lapébie, P., Lombard, V., Drula, E., Terrapon, N., and Henrissat, B.: Bacteroidetes use thousands of enzyme combinations to break down glycans, Nat. Commun., 10, 2043, https://doi.org/10.1038/s41467-019-10068-5, 2019.
Liu, M. and Tanhua, T.: Water masses in the Atlantic Ocean: characteristics and distributions, Ocean Sci., 17, 463–486, https://doi.org/10.5194/os-17-463-2021, 2021.
Lloyd, C. C.: Monosaccharide composition of POM-derived carbohydrates in the western North Atlantic Ocean, Zenodo [data set], https://doi.org/10.5281/zenodo.15375159, 2025a.
Lloyd, C. C.: Carbohydrate epitope analysis (via antibody probing) of POM-derived organic matter in the western North Atlantic Ocean, Zenodo [data set], https://doi.org/10.5281/zenodo.15375738, 2025b.
Lloyd, C. C., Brown, S., Balmonte, J. P., Hoarfrost, A., Ghobrial, S., and Arnosti, C.: Particles act as “specialty centers” with expanded enzymatic function throughout the water column in the western North Atlantic, Front. Microbiol., 13, 882333, https://doi.org/10.3389/fmicb.2022.882333, 2022.
Lloyd, C. C., Brown, S., Balmonte, J. P., Hoarfrost, A., Ghobrial, S., and Arnosti, C.: Links between regional and depth patterns of microbial communities and enzyme activities in the western North Atlantic Ocean, Mar. Chem., 255, 104299, https://doi.org/10.1016/j.marchem.2023.104299, 2023.
Lombard, V., Ramulu, H. G., Drula, E., Coutinho, P. M., and Henrissat, B.: The carbohydrate-active enzymes database (CAZy) in 2013, Nucleic Acids Res., 42, D490–495, https://doi.org/10.1093/mar/gkt1178, 2014.
Markussen, T. N., Konrad, C., Waldmann, C., Becker, M., Fischer, G., and Iversen, M. H.: Tracks in the snow – advantage of combining optical methods to characterize marine particles and aggregates, Front. Marine Sci., 7, 476, https://doi.org/10.3389/fmars.2020.00476, 2020.
McCarthy, M., Hedges, J., and Benner, R.: Major biochemical composition of dissolved high molecular weight organic matter in seawater, Mar. Chem., 55, 281–297, 1996.
Mestre, M., Ruiz-González, C., Logares, R., Duarte, C. M., Gasol, J. M., and Sala, M. M.: Sinking particles promote vertical connectivity in the ocean microbiome, P. Natl. Acad. Sci. USA, 115, E6799–E6807, https://doi.org/10.1073/pnas.1802470115, 2018.
Middelboe, M.: Microbial disease in the sea: effects of viruses on carbon and nutrient cycling, Princeton University Press, 242–251, ISBN 9780691124858, 2008.
Mitulla, M., Dinasquet, J., Guillemette, R., Simon, M., Azam, F., and Wietz, M.: Response of bacterial communities from California coastal waters to alginate particles and an alginolytic Alteromonas macleodii strain, Environ. Microb. 18, 4369–4377, 2016.
Morris, R. M., Nunn, B. L., Frazar, C., Goodlett, D. R., Ting, Y. S., and Rocap, G.: Comparative metaproteomics reveals ocean-scale shifts in microbial nutrient utilization and energy transduction, ISME J., 5, 673–685, 2010.
Murray, A. E., Arnosti, C., De La Rocha, C. L., Grossart, H.-P., and Passow, U.: Microbial dynamics in autotrophic and heterotrophic seawater mesocosms. II. Bacterioplankton community structure and hydrolytic enzyme activities, Aquatic Microbial Ecology, 49, 123–141, 2007.
Nagata, T. and Kirchman, D. L.: Release of dissolved organic matter by heterotrophic protozoa: implications for microbial food webs, Arch. Hydrobiol. Beij. Ergebn. Limnol., 35, 99–109, 1992.
Orellana, L. H., Francis, T. B., Ferraro, M., Hehemann, J.-H., Fuchs, B. M., and Amann, R. I.: Verrucomicrobiota are specialist consumers of sulphated methyl pentoses during diatom blooms, ISME J., 16, 630–641, 2022.
Pelve, E., Fontanez, K., and DeLong, E.: Bacterial succession on sinking particles in the ocean's interior, Front. Microbiol., 8, 2269, https://doi.org/10.3389/fmicb.2017.02269, 2017.
Poff, D. E., Leu, A. O., Eppley, J. M., Karl, D. M., and DeLong, E. F.: Microbial dynamics of elevated carbon flux in the open ocean's abyss, P. Natl. Acad. Sci. USA, 118, e2018269118, https://doi.org/10.1073/pnas.2018269118, 2021.
Priest, T., Vidal-Melgosa, S., Hehemann, J.-H., Aman, R., and Fuchs, B. M.: Carbohydrates and carbohydrate degradation gene abundance and transcription in Atlantic waters of the Arctic, ISME Comm., 3, 130, https://doi.org/10.1038/s43705-023-00324-7, 2023.
Quast, C., Pruesse, E., Yilmaz, P., Gerken, J., Schweer, T., Yarza, P., Peplies, J., and Glöckner, F. O.: The SILVA ribosomal RNA gene database project: improved data processing and web-based tools, Nuc. Acids Res., 41, 590–596, 2013.
Reintjes, G., Arnosti, C., Fuchs, B. M., and Amann, R.: An alternative polysaccharide uptake mechanism of marine bacteria, ISME J., 11, 1640–1650, https://doi.org/10.1038/ismej.2017.26, 2017.
Reisky, L., Prechoux, A., Zuhlke, M.-K., Baumgen, M., Robb, C. S., Gerlach, N., Roret, T., Stanetty, C., Larocque, R., Michel, G., Song, T., Markert, S., Unfried, F., Mihovilovic, M. D., Trautwein-Schult, A., Becher, D., Schweder, T., Bornscheuer, U. T., and Hehemann, J.-H.: A marine bacterial enzymatic cascade degrades the algal polysaccharide ulvan, Nat. Chem. Biol., 15, 803–812, 2019.
Ruiz-González, C., Mestre, M., Estrada, M., Sebastián, M., Salazar, G., Agustí, S., Moreno-Ostos, E., Reche, I., Álvarez-Salgado, X. A., Morán, X. A. G., Duarte, C. M., Sala, M. M., and Gasol, J. M.: Major imprint of surface plankton on deep ocean prokaryotic structure and activity, Mol. Ecol., 29, 1820–1838, https://doi.org/10.1111/mec.15454, 2020.
Saito, M. A., Bertrand, E. M., Duffy, M. E., Gaylord, D. A., Held, N. A., Hervey IV, W. J., Hettich, R. L., Jagtap, P. D., Janech, M. G., Kinkade, D. B., Leary, D. H., McIlvin, M. R., Moore, E. K., Morris, R. M., Neely, B. A., Nunn, B. L., Saunders, J. K., Shepherd, A. I., Symmonds, N. I., and Walsh, D. A.: Progress and challenges in ocean metaproteomics and proposed best practices for data sharing, Journal of Proteome Research, 18, 1461–1476, 2019.
Saunders, J. K., McIIvin, M. R., Dupont, C. L., Kaul, D., Moran, D. M., Horner, T., Laperriere, S. M., Webb, E. A., Bosak, T., Santoro, A. E., and Saito, M. A.: Microbial functional diversity across biogeochemical provinces in the central Pacific Ocean, P. Natl. Acad. Sci. USA 119, e2200014119, https://doi.org/10.1073/pnas.2200014119, 2022.
Sichert, A., Corzett, C. H., Schechter, M. S., Unfried, F., Markert, S., Becher, D., Fernandez-Guerra, A., Liebeke, M., Schweder, T., Polz, M. F., and Hehemann, J.-H.: Verrucomicrobia use hundreds of enzymes to digest the algal polysaccharide fucoidan, Nat. Commun., 5, 1026–1039, 2020.
Steen, A. D., Ziervogel, K., Ghobrial, S., and Arnosti, C.: Functional variation among polysaccharide-hydrolyzing microbial communities in the Gulf of Mexico, Mar. Chem., 138–139, 13–20, https://doi.org/10.1016/j.marchem/2012.06.001, 2012.
Steen, A. D., Vazin, J. P., Hagen, S. M., Mulligan, K. H., and Wilhelm, S. W.: Substrate specificity of aquatic extracellular peptidases assessed by competitive inhibition assays using synthetic substrates, Aquat. Microb. Ecol., 75, 271–281, https://doi.org/10.3354/ame01175, 2015.
Suttle, C. A.: Viruses in the sea, Nature, 437, 356–361, https://doi.org/10.1038/nature04160, 2005.
Teeling, H., Fuchs, B. M., Becher, D., Klockow, C., Gardebrecht, A., Bennke, C. M., Kassagby, M., Huang, S., Mann, A. J., Waldmann, J., Weber, M., Klindworth, A., Otto, A., Lange, J., Bernhardt, J., Reinsch, C., Hecker, M., Peplies, J., Bockelmann, F. D., Callies, U., Gerdts, G., Wichels, A., Wiltshire, K. H., Glöckner, F. O., Schweder, T., and Amann, R.: Substrate-controlled succession of marine bacterioplankton populations induced by a phytoplankton bloom, Science, 336, 608–611, 2012.
Teeling, H., Fuchs, B. M., Bennke, C. M., Krüger, K., Chafee, M., Kappelmann, L., Reintjes, G., Waldmann, J., Quast, C., Glöckner, F. O., Lucas, J., Wichels, A., Gerdts, G., Wiltshire, K. H., and Amann, R. I.: Recurring patterns in bacterioplankton dynamics during coastal spring algae blooms, eLife, 5, e11888, https://doi.org/10.7554/eLife.11888.001, 2016.
Teske, A., Durbin, A., Ziervogel, K., Cox, C., and Arnosti, C.: Microbial community composition and function in permanently cold seawater and sediments from an Arctic fjord of Svalbard, Appl. Environ. Micro., 77, https://doi.org/10.1128/AEM.01507-10, 2011.
Thomas, F., Bordron, P., Eveillard, D., and Michel, G.: Gene expression analysis of Zobellia galactanivorans during the degradation of algal polysaccharides reveals both substrate-specific and shared transcriptome-wide responses, Front. Microbiol., 81, 7385–7393, 2017.
Torode, T. A., Siméon, A., Marcus, S. E., Jam, M., Le Moigne, M.-A., Duffieux, D., Knox, J. P., and Hervé, C.: Dynamics of cell wall assembly during early embryogenesis in the brown alga Fucus, J. Exp. Bot., 67, 6089–6100, 2016.
Verdugo, P., Alldredge, A. L., Azam, F., Kirchman, D. L., Passow, U., and Santschi, P. H.: The oceanic gel phase: a bridge in the DOM-POM continuum, Mar. Chem., 92, 67–85, 2004.
Vidal-Melgosa, S., Sichert, A., Francis, T., Bartosik, D., Niggemann, J., Wichels, A., Willats, W., Fuchs, B., Teeling, H., Becher, D., Schweder, T., Amann, R., and Hehemann, J.-H.: Diatom fucan polysaccharide precipitates carbon during algal blooms, Nat. Commun., 12, 1150, https://doi.org/10.1038/s41467-021-21009-6, 2021.
Vidal-Melgosa, S., Lagator, M., Sichert, A., Priest, T., Patzold, J., and Hehemann, J.-H.: Not digested: algal glycans move carbon dioxide into the deep-sea, bioRxiv [preprint], https://doi.org/10.1101/2022.03.04.483023, 2022.
Wakeham, S. G., Lee, C., Hedges, J. I., Hernes, P. J., and Peterson, M. L.: Molecular indicators of diagenetic status in marine organic matter, Geochim. Cosmochim. Acta, 61, 5363–5369, https://doi.org/10.1016/S0016-7037(97)00312-8, 1997.
Zhao, Z., Baltar, F., and Herndl, G. J.: Linking extracellular enzymes to phylogeny indicates a predominantly particle-associated lifestyle of deep-sea prokaryotes, Sci. Adv., 6, eaaz4354, https://doi.org/10.1126/sciadv.aaz4354, 2020.
Zhou, J., Mopper, K., and Passow, U.: The role of surface-active carbohydrates in the formation of transparent exopolymer particles by bubble adsorption of seawater, Limnol. Oceanogr., 43, 1860–1871, 1998.
Zorz, J., Willis, C., Comeau, A. M., Langille, M. G. I., Johnson, C. L., Li, W. K. W., and LaRoche, J.: Drivers of regional bacterial community structure and diversity in the Northwest Atlantic Ocean, Front Microbiol., 10, 00281, https://doi.org/10.3389/fmicb.2019.00281, 2019.