the Creative Commons Attribution 4.0 License.
the Creative Commons Attribution 4.0 License.
 | 30 Oct 2025
Intertidal regions regulate seasonal coastal carbonate system dynamics in the East Frisian Wadden Sea
Yoana G. Voynova
Bryce Van Dam
Lara Luitjens
Dagmar Daehne
Helmuth Thomas
Seasonal and regional changes in carbon dynamics in the Wadden Sea, the world's largest intertidal sand and mud flats system, were analysed to quantify the influence of biogeochemical processes on the carbonate system at the land-sea interface. With a focus on the East Frisian Wadden Sea (EFWS), we successfully used the difference between total alkalinity (TA) and dissolved inorganic carbon (DIC) ([TA-DIC]), ΔTAexcess, ΔDICexcess (deviations beyond conservative mixing) and ΔTAP (alkalinity production due to primary production) to quantify local biogeochemical influences on carbonate system dynamics.
In spring, a phytoplankton bloom with high biological activity, indicated by (a) supersaturated oxygen (up to 180 in % saturation), (b) elevated chlorophyll a (up to 151.7 µg L−1) and (c) low pCO2 (as low as 141.3 µatm), resulted in decrease in nitrate (, 19.29 ± 18.11 µmol kg−1) and DIC (159.4 ± 125.4 µmol kg−1), and a slight increase in TA (9.1 ± 29.2 µmol kg−1). The regression analysis of the differences between March and May 2022 in concentrations (Δ) against the differences in DIC (ΔDIC) yielded a slope of 6.90, matching the Redfield C:N ratio, and suggesting that uptake of nitrate by primary producers increased total alkalinity during the spring bloom.
In summer, we assume that organic matter remineralization, along with CaCO3 dissolution in sediments, enhances TA production in the coastal and nearshore regions of the Western EFWS (concentrations up to 2400 µmol kg−1). In the Eastern EFWS, enhanced CaCO3 formation may consume TA ([TA-DIC]<200 µmol kg−1), but the region still acts as a net source of TA, likely due to sedimentary processes such as organic matter decomposition, which follow the time of increased biological activity during the spring bloom. The increase of TA enhances the coastal ocean's ability to absorb and store CO2 through buffering and suggests that the EFWS can be a source of TA to the coastal regions during the warm productive seasons. This study highlights the complex relationships between these factors, emphasizing the need for a comprehensive understanding of regional and seasonal variations to better assess the role of coastal systems in carbon cycling and storage, as well as climate regulation.
- Article
(5928 KB) - Full-text XML
-
Supplement
(1485 KB) - BibTeX
- EndNote


Coastal oceans are biogeochemically active regions, which play a significant role in biogeochemical cycles, despite covering less than 10 % of the oceanic realm (Gattuso et al., 1998). Coastal regions are directly affected by terrestrial organic matter and nutrients through river run-off, groundwater discharge, atmospheric deposition, and exchange of large amounts of matter and energy with the open ocean (Borges et al., 2006; Gattuso et al., 1998). Overall, coastal oceans also support approximately 14 %–23 % of the ocean carbon dioxide uptake, 10 %–30 % of the primary production, 80 % of organic matter burial, 90 % of sedimentary mineralization and 75 %–90 % of the oceanic sink of suspended river loads (Bauer et al., 2013; Gattuso et al., 1998).
Since the start of the industrial era, the levels of CO2 in the atmosphere have increased from ∼280 ppm to over ∼419 ppm due to human activities (Friedlingstein et al., 2023). About 30 % of anthropogenic CO2 emissions since the industrial period have been absorbed by the ocean (Friedlingstein et al., 2023). The uptake increases the concentration of protons [H+] and decreases the carbonate ion concentration [], leading to lower pH and a reduced saturation state of calcium carbonate, a process known as ocean acidification (Orr et al., 2005). Depending on the different model scenarios, it is predicted that surface pH in the ocean might decline by about 0.3–0.4 pH units by 2100, corresponding to a decrease of about 40 %–50 % of carbonate ions in the seawater (Feely et al., 2009; Orr et al., 2005). The future capacity of the ocean to take up CO2, can affect the precipitation and dissolution of the carbonate minerals, as well as the survival of marine organisms (Duan et al., 2023; Kroeker et al., 2013; Liang et al., 2023; Ricour et al., 2023). Whereas oceans are a significant sink for anthropogenic CO2 it is not well known how this uptake will further change under the continual increase of anthropogenic CO2 in the atmosphere (Lorkowski et al., 2012; Sabine et al., 2004; Thomas et al., 2007). However, rising atmospheric CO2 will influence carbon stocks and fluxes in the pelagic, benthic and coastal zone, particularly in shelf seas, which are annually mixed and ventilated (Legge et al., 2020).
Total alkalinity (TA) represents the buffering capacity of the ocean and is controlled by many factors including erosion/weathering pathways on land (Lehmann et al., 2023) and respiration of organic matter (OM) along anaerobic metabolic pathways, mostly generated in shallow marine and shelf sediments (Dickson, 1981). These processes are directly influenced by terrestrial and anthropogenic nutrient inputs (Burt et al., 2016; Thomas et al., 2009; Van Beusekom and De Jonge, 2002), as well as increased sedimentation of reactive organic matter (OM) (Al-Raei et al., 2009; Böttcher et al., 1998). Coastal seas and shelf seas, like the North Sea often have relatively high rates of primary production in spring, leading to drawdown in DIC, pCO2 and a consequent pH increase (Macovei et al., 2021; Thomas et al., 2005). In addition, nutrient loads from land contribute to enhanced primary production, and increased carbon remineralization (Prowe et al., 2009; Thomas et al., 2009), and subsequent changes in the carbonate system. Previous studies suggested that the Wadden Sea, a large network of intertidal sand and mudflats bordering the North Sea along the Dutch, German and Danish coasts (Staneva et al., 2009), plays a significant role in modulating local carbonate system dynamics (Thomas et al., 2009; Voynova et al., 2019). The seasonal TA production in the southern North Sea was variable according to the region, influenced by the Wadden Sea (Voynova et al., 2019) and by benthic TA production (Brenner et al., 2016). The observed seasonal changes of TA can affect the coastal ocean capacity to absorb carbon from the atmosphere (Burt et al., 2016; Gruber et al., 2019; Li et al., 2024; Schwichtenberg et al., 2020).
This study offers a detailed analysis of seasonal and inter-annual carbonate system dynamics in the EFWS, a key region within the world's largest intertidal sand and mudflat system (UNESCO World Heritage Centre, 2025). The research focuses on seasonal and regional variations, and particularly on the drivers of TA production in spring-summer. By examining changes in TA, DIC, and other biogeochemical parameters, this study identifies key mechanisms affecting carbonate chemistry, including calcium carbonate (CaCO3) dissolution and formation, photosynthesis and respiration. Our findings highlight the complex interactions among these factors, emphasizing the need for a comprehensive understanding of regional and seasonal variations to better assess the role of coastal systems in carbon cycling, storage, and climate regulation. Moreover, observed TA and DIC distributions provide valuable insights into potential carbon and TA sources within this dynamic environment.
2.1 Study side
The German Bight region is bordered by Germany, Denmark and the Netherlands, situated in the southeastern corner of the North Sea (Fig. 1a). The East Frisian Wadden Sea (EFWS) is one of the shallowest regions of the German Bight, characterized by a series of barrier islands (Fig. 1b), each 5–17 km long and 2–3 km wide (Staneva et al., 2009). The system is an intertidal region, influenced by semidiurnal tides with a tidal range from approximately 2.2–2.8 m (Grunwald et al., 2009; Staneva et al., 2009) and up to ∼3.5 m in the Elbe River mouth (Staneva et al., 2009). Main freshwater sources to the German Bight are the rivers Elbe, Weser, and Ems, with additional river discharge values of 860 m3 s−1 (Elbe), 323 m3 s−1 (Weser), and 80 m3 s−1 (Ems) (Luebben et al., 2009; Schmidt et al., 2011, and references herein). During winter, high freshwater input (e.g., Elbe ∼1420 m3 s−1 in February) leads to reduced salinities, whereas in summer discharge is considerably lower (e.g., Elbe ∼300 m3 s−1 in August), resulting in comparatively more marine conditions (Rewrie et al., 2023; Schwichtenberg, 2013; Schwichtenberg et al., 2020; Voynova et al., 2017). However, model estimates indicate that only about 5 % of the TA variability in the German Bight is attributable to effective river loads (Schwichtenberg et al., 2020). Seasonally, the river inflow and hydrodynamics can affect the carbonate system in the German Bight.
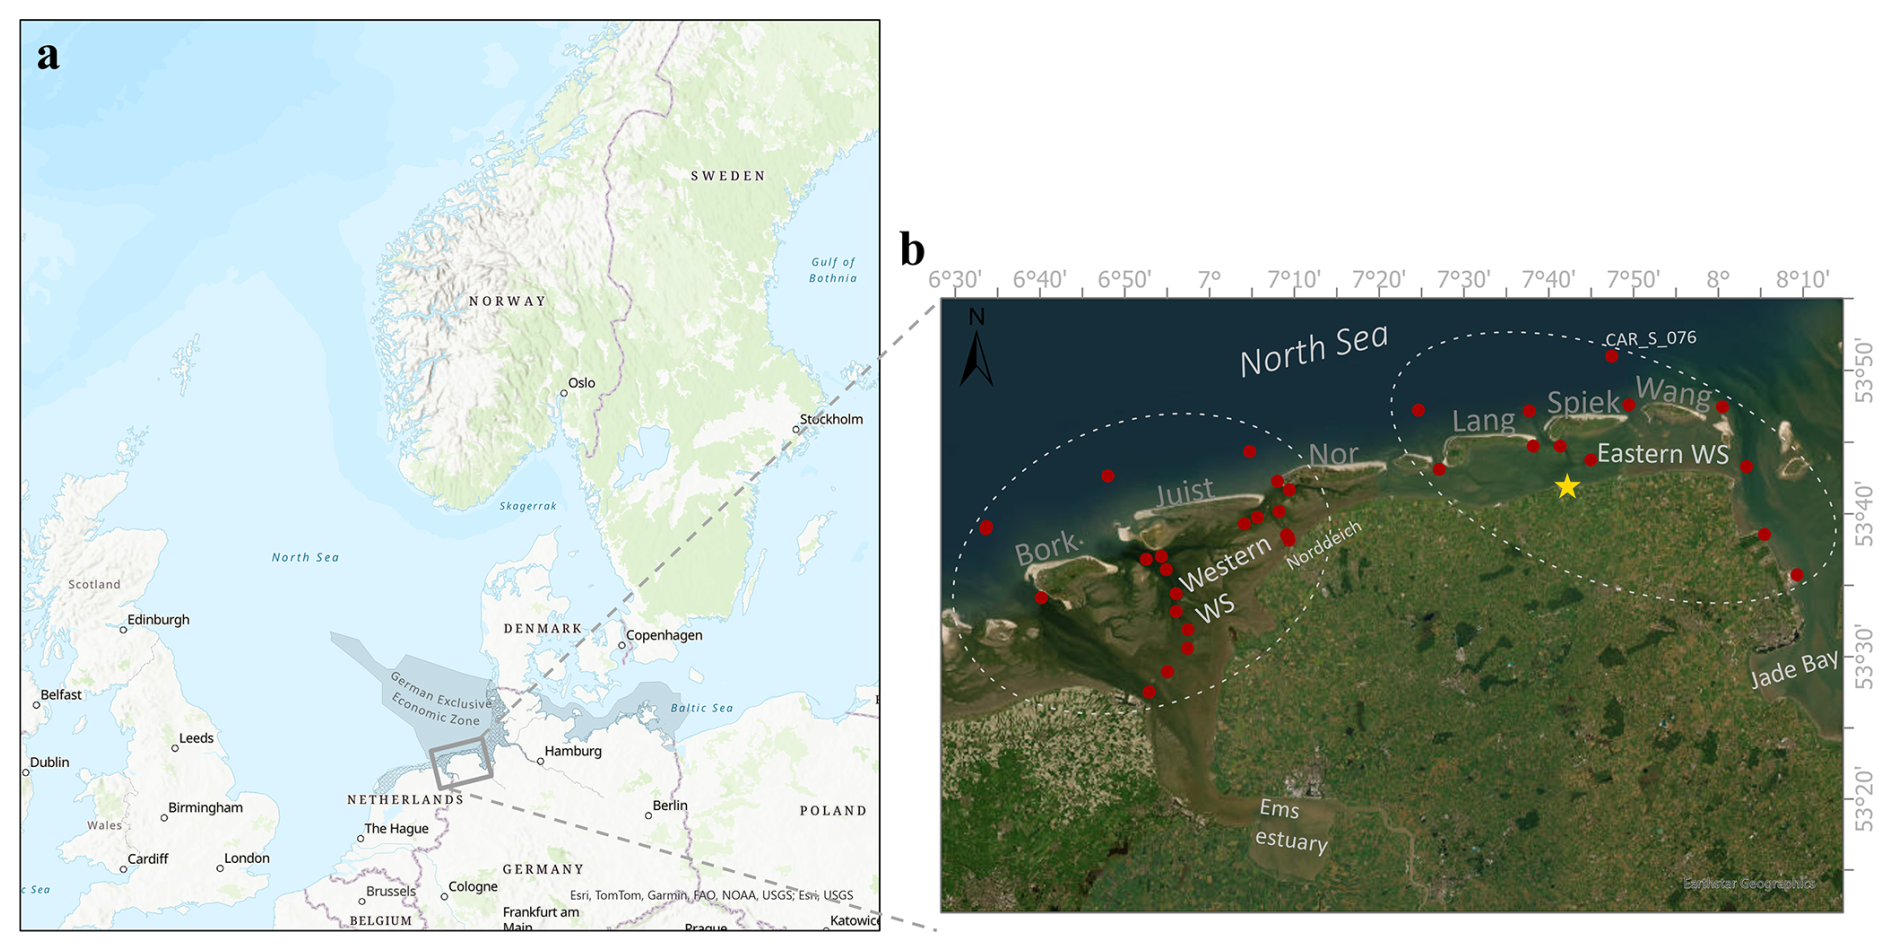
Figure 1Study area. (a) The German Wadden Sea (WS, shown in grey) with the German Exclusive Economic Zone (hatched region) and the East Frisian Wadden Sea (EFWS, grey box). (b) Zoom into the EFWS, showing the sampling stations (red dots) in the different regions (Western WS and Eastern WS) considered in this study. The yellow star shows the Neuharlingersiel sluice location. Station CAR_S_076, used as the North Sea endmember, is explicitly labelled (see Sect. 2.5). The different Islands are labelled with the first few letters of their names (Bork = Borkum, Juist, Nor = Norderney, Lang = Langeoog, Spiek = Spiekeroog, Wang = Wangeoog). The map in this Figure was generated using ArcGIS. Data sources: (a) Esri, TomTom, Garmin, FAO, NOAA, USGS; (b) Earthstar Geographics.
The study site is also characterized by complex local freshwater dynamics. Local sluices (e.g., in Greetsiel, Bensersiel, Harlesiel, Carolinensiel, or Neuharlingersiel) regulate freshwater inflow in intertidal regions and can thereby affect salinity levels and nutrient dynamics in the Wadden Sea (Luebben et al., 2009). The opening of such sluices is primarily controlled by tidal cycles but can also vary seasonally depending on precipitation and drainage needs. As shown by Beck et al. (2012) freshwater discharged through a sluice along the East Frisian coast, can be enriched in terrestrial organic matter and trace metals and undergoes strong geochemical modifications upon mixing with seawater. Such processes, comparable to those in estuaries, are likely to influence not only trace metal dynamics but also carbonate chemistry and nutrient availability in the Wadden Sea. Terrestrial run-off enters the back-barrier tidal flats of Spiekeroog via the sluice located in Neuharlingersiel (Fig. 1b), generally about 2 h before low tide when the water level of the hinterland is above sea level, with drainage volume depending on precipitation in the catchment area (ca. 125 km2) and averages 15×106 m3 in winter and 9×10⁶ m3 in summer (Luebben et al., 2009, and references therein).
We separated the study area into two regions (Western WS and Eastern WS; Fig. 1b) due to the differences in the tidal dynamics and hydrodynamic properties (Herrling and Winter, 2015), which drive the area's carbon dynamics, sediment transport, and overall ecological functioning. The tidal range increases from 2.4 m at Borkum to 3.0 m at Wangerooge, with the Eastern region experiencing stronger tidal influences (Herrling and Winter, 2015). In the Langeoog basin, wind effects cause the largest relative increase in residual discharge, while Norderney experiences the largest absolute increase in water flux. Westerly winds influence residual circulation and sediment transport differently in each region. The flow dynamics between the basins of Baltrum and Langeoog are interconnected, whereas the flow regime between Borkum and Norderney is more independent from the dominant circulation patterns and inter-basin exchange (Herrling and Winter, 2015).
Seasonal cruises were completed in the Wadden Sea (WS) and North Sea around the East Frisian Islands (and the Ems River estuary) with the research vessel (RV) Burchana (NLWKN; Fig. 1b). The July 2021 and October 2021 cruises focused exclusively on the intertidal mudflats of the EFWS. The RV Burchana, with a draft of 1.3 m, allowed sea water sampling even during low tide, providing the opportunity to collect samples at various tidal stages. Sampling took place during daylight hours, typically starting in the morning at low tide and continuing throughout the day, with no nighttime samples collected. Both shallow intertidal areas (accessible due to the vessel's low draft) and deeper subtidal channels were sampled to ensure comprehensive spatial coverage. Later cruises extended into the Ems River Estuary, from the island of Borkum (Bork, Fig. 1b) to Weener ( N, E), a town located upstream the Ems River Estuary. These additional data from the Ems River will be presented in a subsequent paper.
2.2 FerryBox measurements
A FerryBox system (4H-JENA engineering GmbH, Jena, Germany) was operated during all cruises on board the RV Burchana (NLWKN), measuring the following parameters every minute: temperature (SBE38, Sea-Bird Scientific, USA), salinity (SBE45, Sea-Bird Scientific, USA), dissolved oxygen (DO) (Optode 4835, Aanderaa, Bergen, Norway), chlorophyll fluorescence to estimate chlorophyll a concentrations (AlgaeOnlineAnalyser, bbe moldaenke, Germany), pH (electrode, Xylem; USA) and turbidity (Solitax inline SC, Hach Lange, Germany). The pH electrode was calibrated using standard DuraCal buffer solutions at pH 7 and pH 10 (Hamilton Company, USA), corresponding to the NBS scale. The partial pressure of CO2 (pCO2) was measured using a sensor (HydroC CO2-FT, 4H-JENA engineering, Germany) attached to the flow-through system of the FerryBox. These data were corrected using the data processing manual of 4H – Jena Engineering GmbH (4H Jena, 2021). Regions near the ports were excluded in all datasets, to remove any influence from the port, or from the cleaning cycles.
2.3 Discrete samples
Samples for Winkler titration (dissolved oxygen), nutrients, salinity and turbidity were collected from each cruise to crosscheck the measurements of the FerryBox. Therefore, dissolved oxygen (DO) samples were collected on the last day of each cruise by filling Biological Oxygen Demand (BOD) bottles from the FerryBox outflow. Three replicates collected underway were treated according to the standard Winkler method and measured within 24 h in the lab using a Metrohm 870 KF Titrino Plus (Germany). The Winkler titrations were used to correct the FerryBox DO measurements from the seasonal cruises. A single regression equation of the Winkler titrations and the FerryBox data was used to apply a DO correction of the entire data set (, R2=0.98, n=46).
In addition, the apparent oxygen utilization (AOU) was calculated using the corrected oxygen measurements, as according to:
Where is the expected oxygen in µmol L−1 at equilibrium with the atmosphere, at the measured temperature and salinity according to Grasshoff et al. (1999), and O2 is the oxygen concentration measured by the FerryBox optode.
Duran bottles (∼300 mL) were filled with sample water during all seasonal cruises using the FerryBox outflow to measure turbidity and salinity in the laboratory. Salinity was measured using an OPTIMARE High Precision Salinometer (Optimare Systems GmbH, Bremerhaven, Germany) and turbidity was measured using a Hach 2100 turbidimeter.
Nutrient samples were collected at each station using the onboard water sampler. A sample volume of 250 mL was filtered through pre-combusted GF/F filters, and the samples were collected in clean centrifuged tubes, frozen and stored at −20 °C. The concentrations of nitrite (), nitrate () ammonium () and silicate (SiO2) were also measured using a MicroMaC analyser from SYSTEA (Anagni (FR), Italy). The system, which induces a colour reaction, is coupled with a photometer (, , SiO2) and a fluorometer (), using a one-point calibration. was determined with sulfanilamide and N-(1-Naphthyl)ethylenediamine, with orthophthalaldehyde and with diethylenetriaminepentaacetic acid and automatic UV reduction (Luitjens, 2019).
Water samples for TA and DIC were collected in 300 mL BOD bottles at all stations using the FerryBox outflow according to the Standard Operating Procedure (SOP) (Dickson et al., 2007). The samples were poisoned with saturated mercury chloride and measured in the laboratory with a VINDTA 3C (MARIANDA, Kiel, Germany), using certified reference material (CRM) (Dickson et al., 2003). The method is precise, with a reproducibility better than 1 µmol kg−1 and an accuracy within 2 µmol kg−1 (Dickson et al., 2003).
In addition, the saturation state of calcite (Ωcal) was calculated using the CO2SYS program developed by Lewis and Wallace (1998). The dissociation constants for carbonic acid (K1 and K2) were taken from Lueker et al. (2000), which are widely used for seawater CO2 chemistry and generally provide reliable results, with uncertainties in K1 and K2 translating to about ±1 % in calculated pCO2. For bisulfate (KHSO4), the constant of Dickson (1990) was applied, and for the boron-to-chlorinity ratio of Lee et al. (2010). The results within this study were plotted with R Project (ggplot package) and maps were created with ArcGIS Pro.
2.4 [TA-DIC] as a proxy for biogeochemical processing
[TA-DIC] is a good proxy for biogeochemical processes such as CaCO3 precipitation / formation, photosynthesis, respiration and therefore CO2 uptake and release, even in coastal oceans (Xue and Cai, 2020). The parameter is independent of ocean mixing and not sensitive to temperature and pressure changes, and this makes it a good tracer for larger-scale oceanographic studies, and suitable for seasonal observations of biogeochemical processes and carbonate dynamics of an ecosystem. In addition, it is assumed that [TA-DIC], can better reflect variations of [] compared to the ratio of TA and DIC (Xue et al., 2017).
The difference between TA and DIC is often expressed as:
However, [TA–DIC] should not be used at low salinity (e.g. <20) and when [TA–DIC] is µmol kg−1, where the relationships of [TA–DIC] with pH and/or ocean acidification are nonlinear, these low values also occur in oxygen minimum zones (Xue and Cai 2020).
2.5 Calculations of estuarine DIC and TA contributions
To estimate the contributions of estuarine DIC and TA in the Western and Eastern EFWS, we used DIC and TA measurements from the lowest salinity station located in the Wadden Sea, just before the Ems Estuary (where the river enters the Wadden Sea) as endmembers for our mixing model. The stations chosen for these measurements were in areas of low salinity within the estuary, with considerable freshwater influence (DICestuary; TAestuary; Table 1). These values (DICestuary; TAestuary) were used to calculate the DICmixing w/est and TAmixing w/est (Eqs. 3 and 4) for the different regions. We hereafter denote these conservative mixing values as DICmixing w/est and TAmixing w/est, i.e. the expected concentrations under two-endmember mixing between the North Sea (Wadden Sea) and estuarine sources.
Table 1Endmember values of dissolved inorganic carbon (DIC, µmol kg−1), total alkalinity (TA, µmol kg−1), and salinity (S) for the estuary (DICestuary, TAestuary) and North Sea/Wadden Sea (DICNorthSea, TANorthSea, SNorthSea) used in the mixing model for each season.
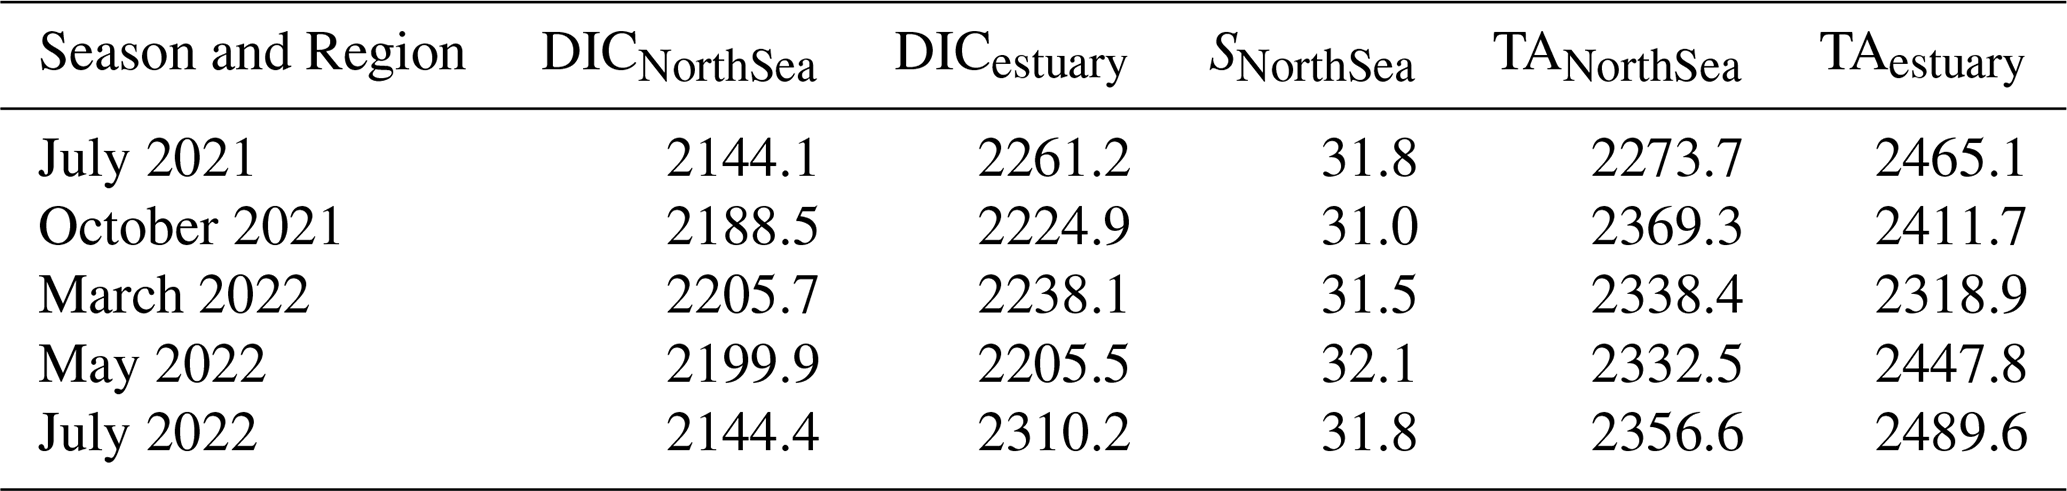
In this study, DICNorthSea (and TANorthSea) refers to the DIC (and TA) values at the station (CAR_S_076) located farthest from land (Fig. 1b), which we used as our North Sea endmember, as it is situated farthest offshore of the Ems and experiences the highest salinity (SNorthSea) levels during almost each season. The DICNorthSea and TANorthSea endmembers applied for each season are shown in Table 1.
Starting from these endmembers, the expected DIC and TA at each station due to conservative mixing were calculated following the equations of Jiang et al. (2008) and Joesoef et al. (2015):
where Si represents the salinity at each related station i. The ratio normalizes the influence of the salinity at the specific station by the salinity of the North Sea (SNorthSea).
To quantify the net contributions of estuarine processes beyond conservative mixing, ΔDICexcess and ΔTAexcess were calculated, using the equation of (Jiang et al., 2008; Van Dam et al., 2018):
These calculations use the measured DIC and TA concentrations at station i, together with the DICmixing w/est and TAmixing w/est values from Eqs. (3) and (4). Here, ΔDICexcess represents the deviation of the measured DIC from the expected conservative mixing value, while ΔTAexcess quantifies the corresponding deviation for TA. Values close to zero indicate that concentrations are consistent with mixing alone. Positive or negative deviations reflect local biogeochemical processes (e.g., photosynthesis, respiration, carbonate precipitation or dissolution) or additional inputs and losses not represented by the two endmembers. By accounting for conservative mixing, this approach isolates the influence of biogeochemical processes and external contributions from the physical mixing of North Sea and estuarine waters.
During productive seasons, primary production will decrease DIC, while consuming CO2 and nutrients (Xue and Cai, 2020). The uptake of can increase TA, while the uptake of can decrease TA in an ecosystem (Brewer and Goldman, 1976; Wolf-Gladrow et al., 2007). The production of 1 mol organic matter ((CH2O)106(NH3)16H3PO4) will generally increase TA by 17 mol TA (ΔTAP) and decrease DIC by 106 mol (Chen, 1978). Consequently, ΔTAP is used to calculate the expected amount of TA produced, according to the equation of ΔTAbio from Xue and Cai (2020), which was modified using the calculated ΔDICexcess:
It is important to note, that the calculation of ΔTAP is an overestimation assuming the measured TA is modulated by photosynthesis ( – fuelled) or respiration, such that the presence of other non-photosynthetic DIC sinks will cause ΔTAP to be overestimated.
3.1 Regional and seasonal variation in the EFWS
In July 2021, salinities were lowest on the route from Norddeich harbour to Norderney (25.2) in the Western WS (Table 2; Fig. S1 in the Supplement). In summer 2022, the salinity on 12 July (31.16–32.03) increased by 2–3 salinity units compared to 11 July (28.28–29.43) in the Eastern WS (Table 2; Fig. S1). This indicates that during July 2022 cruise, there was a change in salinity range between the first and second leg of the cruise (in roughly the same region). A possible reason for these salinity differences could be the Neuharlingersiel sluice opening in the early morning of 11 July 2022, which could have influenced the salinity on this day. The turbidity in October 2021 showed a completely different pattern compared to all other seasons, with values from 96.08–306.46 NTU (Fig. S1), caused by rougher weather conditions during the campaign.
Table 2Overview of measured parameters across all seasonal samplings in the East Frisian Wadden Sea, including temperature (°C), salinity, pH, oxygen (% saturation), apparent oxygen utilization (AOU, µmol L−1), chlorophyll a (Chl a, µg L−1), observed pCO2 (µatm), and calcite saturation (Ωcal).
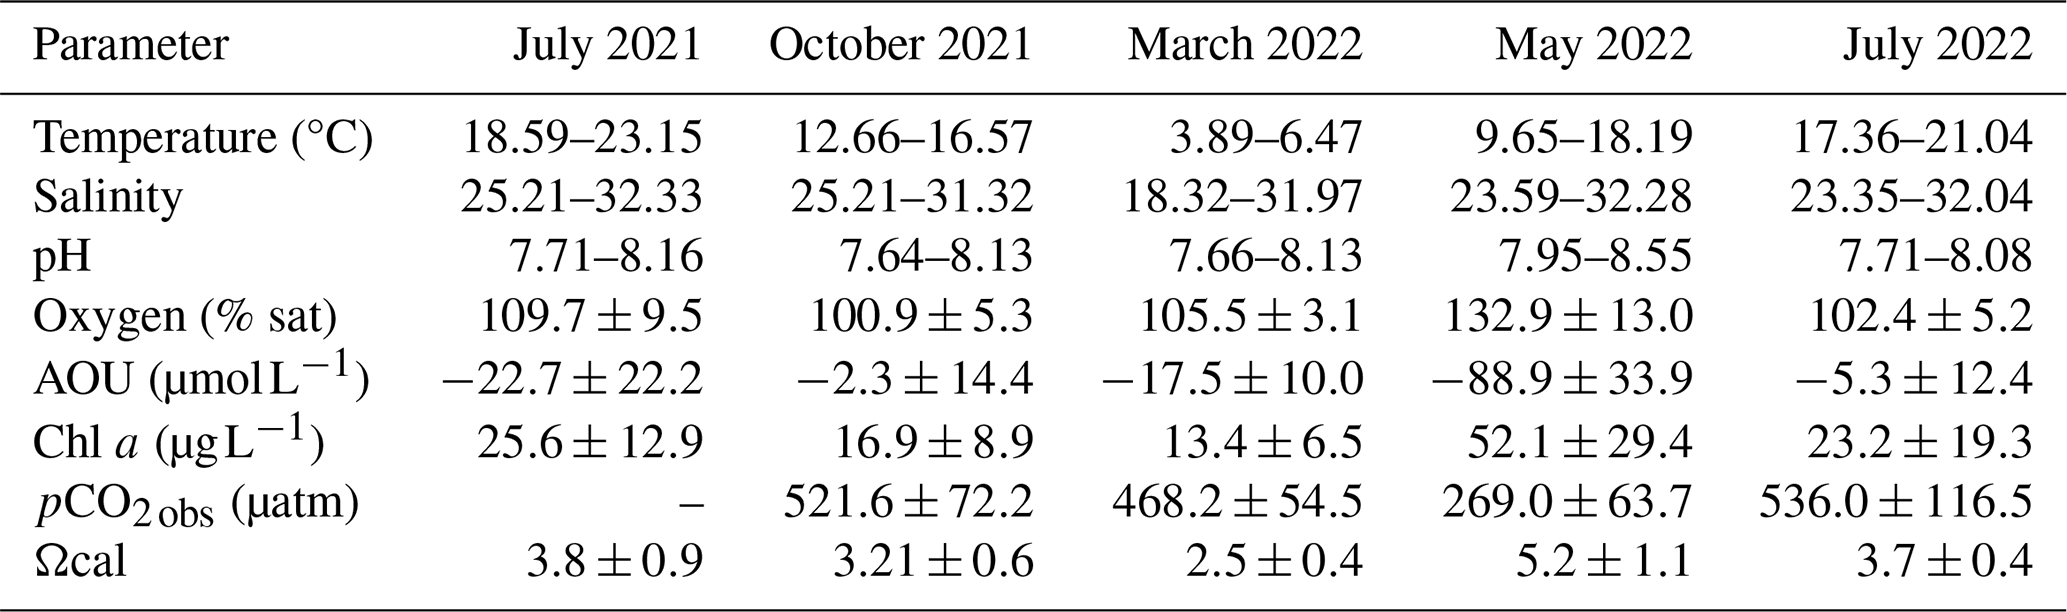
A land-to-sea gradient in pH was observed in October 2021 (7.6–8.1; Table 2; Fig. S2 in the Supplement), with higher values in offshore regions and lower values near the coast. Regional differences with maximum pH values >8 in higher-salinity waters were observed in all seasons, with particularly high values in the Western Wadden Sea in May 2022 (Fig. S2; Table 2).
The maximum concentrations of chlorophyll a were observed in May 2022, displaying the most substantial fluctuations (Table 2), especially in the Western part (up to 151.7 µg L−1) (Fig. S2). In July 2021, the highest chlorophyll measurements (up to 74.7 µg L−1) were detected underway between Norderney to Spiekeroog (Table 2; Fig. S2). A similar pattern can be seen for July 2022 (Fig. S2), although measurements were not available for all transects.
In July 2021 the measured oxygen ranged from 72.4–112.01 in % saturation (Fig. S2), with the highest values in the Western WS. Oxygen decreased from July 2021 to October 2021, on average by 8.8 % ± 10.9 % saturation (Table 2; Fig. S2). The lowest oxygen saturation was measured from Norddeich to Norderney in October (down to ∼57 % saturation). Oxygen saturation then increased continuously until May, reaching maximum values up to ∼180 % saturation in the Western EFWS and up to ∼152 % saturation in the Eastern EFWS (Table 2; Fig. S2). Overall, oxygen decreased by a mean value of 28.4 % ± 16.4 % saturation from May to July 2022 (Fig. S2), resulting in slightly lower oxygen saturation in July 2022 compared to the previous year (Table 2). For the AOU (Table 2), the same inverse picture was obtained. The observed pCO2 (pCO2 obs) was highest in July 2022 and lowest in May 2022 (down to 141.3 µatm) in the Western WS. The average decrease in pCO2 obs was 166.2 ± 276.1 µatm from March to May 2022 (Table 2; Fig. S3 in the Supplement).
During all seasons, Ωcal was supersaturated, ranging from 1.5–7.5 (Table 2), but with a pronounced seasonal pattern. Higher, supersaturated Ωcal values (>2.5) were observed during more productive seasons (July 2021, July 2022, May 2022). However, the highest variability of Ωcal was found in May 2022 with values >1 in 80 % of the stations and reaching up to 7.52 in the Wesern WS (Table 2; Fig. S3). In summer (July 2021, July 2022), a decrease of Ωcal in the EFWS from West to East was observed, regionally (Fig. S3).
3.2 TA and DIC variability in the EFWS
Large seasonal and regional variability in TA and DIC was observed along the estuarine land–sea gradient of the EFWS (Table 3; Fig. 2), with particularly high TA values in summer (Table 3; Fig. 3b). In July 2021, TA ranged from ∼2273 µmol kg−1 in the Jade Bay (Eastern WS) to ∼2465 µmol kg−1, following a negative mixing line with a slope of −24.9 µmol kg−1 per salinity unit (Fig. 3b). Most data points were close to or slightly above this line, consistent with net TA production in this tidally driven system. In July 2022, TA was lower at reduced salinities (28–29) in the Eastern WS, although the slope versus salinity remained similar (−23.3 µmol kg−1 per salinity unit). At higher salinities (31–32) in the Western WS, values were comparable to July 2021, again closely following the conservative mixing line (−25.1 µmol kg−1 per salinity unit). The DIC concentrations also showed a similar pattern during both summer cruises, with negative slopes of −49.0 and −44.3 µmol kg−1 per salinity unit in July 2021 and 2022, respectively, in the Eastern WS (Table 3; Fig. 3a).
Table 3Mean ± standard deviation of total alkalinity (TA, µmol kg−1), dissolved inorganic carbon (DIC, µmol kg−1), and the difference between TA and DIC ([TA–DIC], µmol kg−1) across all seasonal samplings.
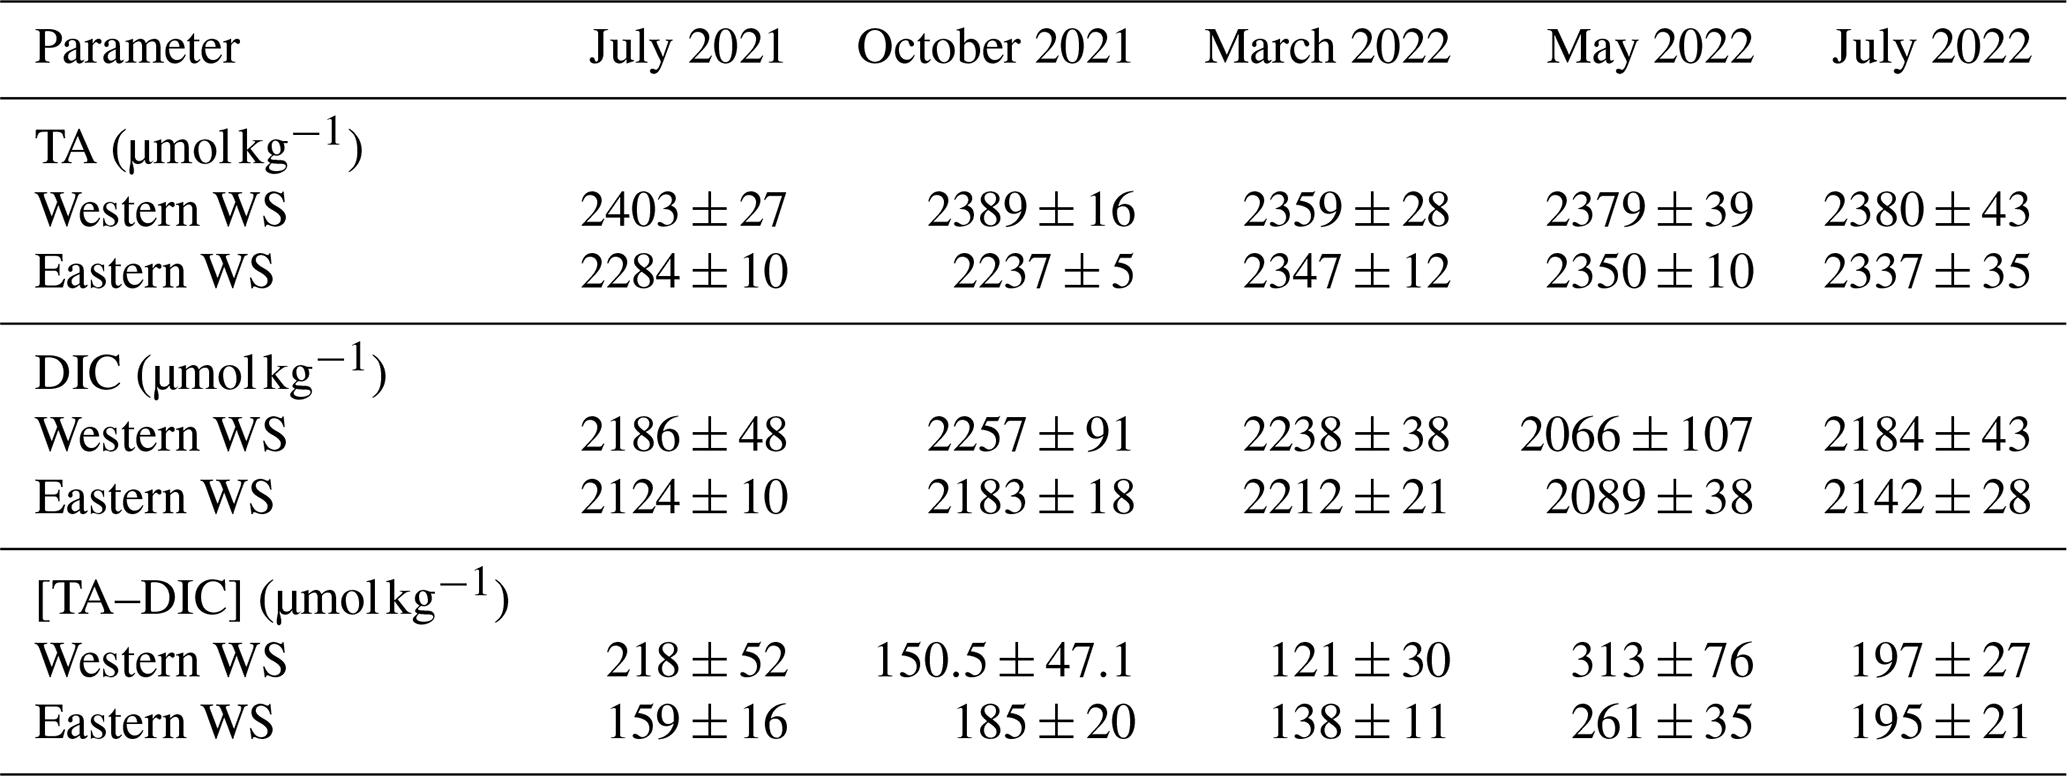
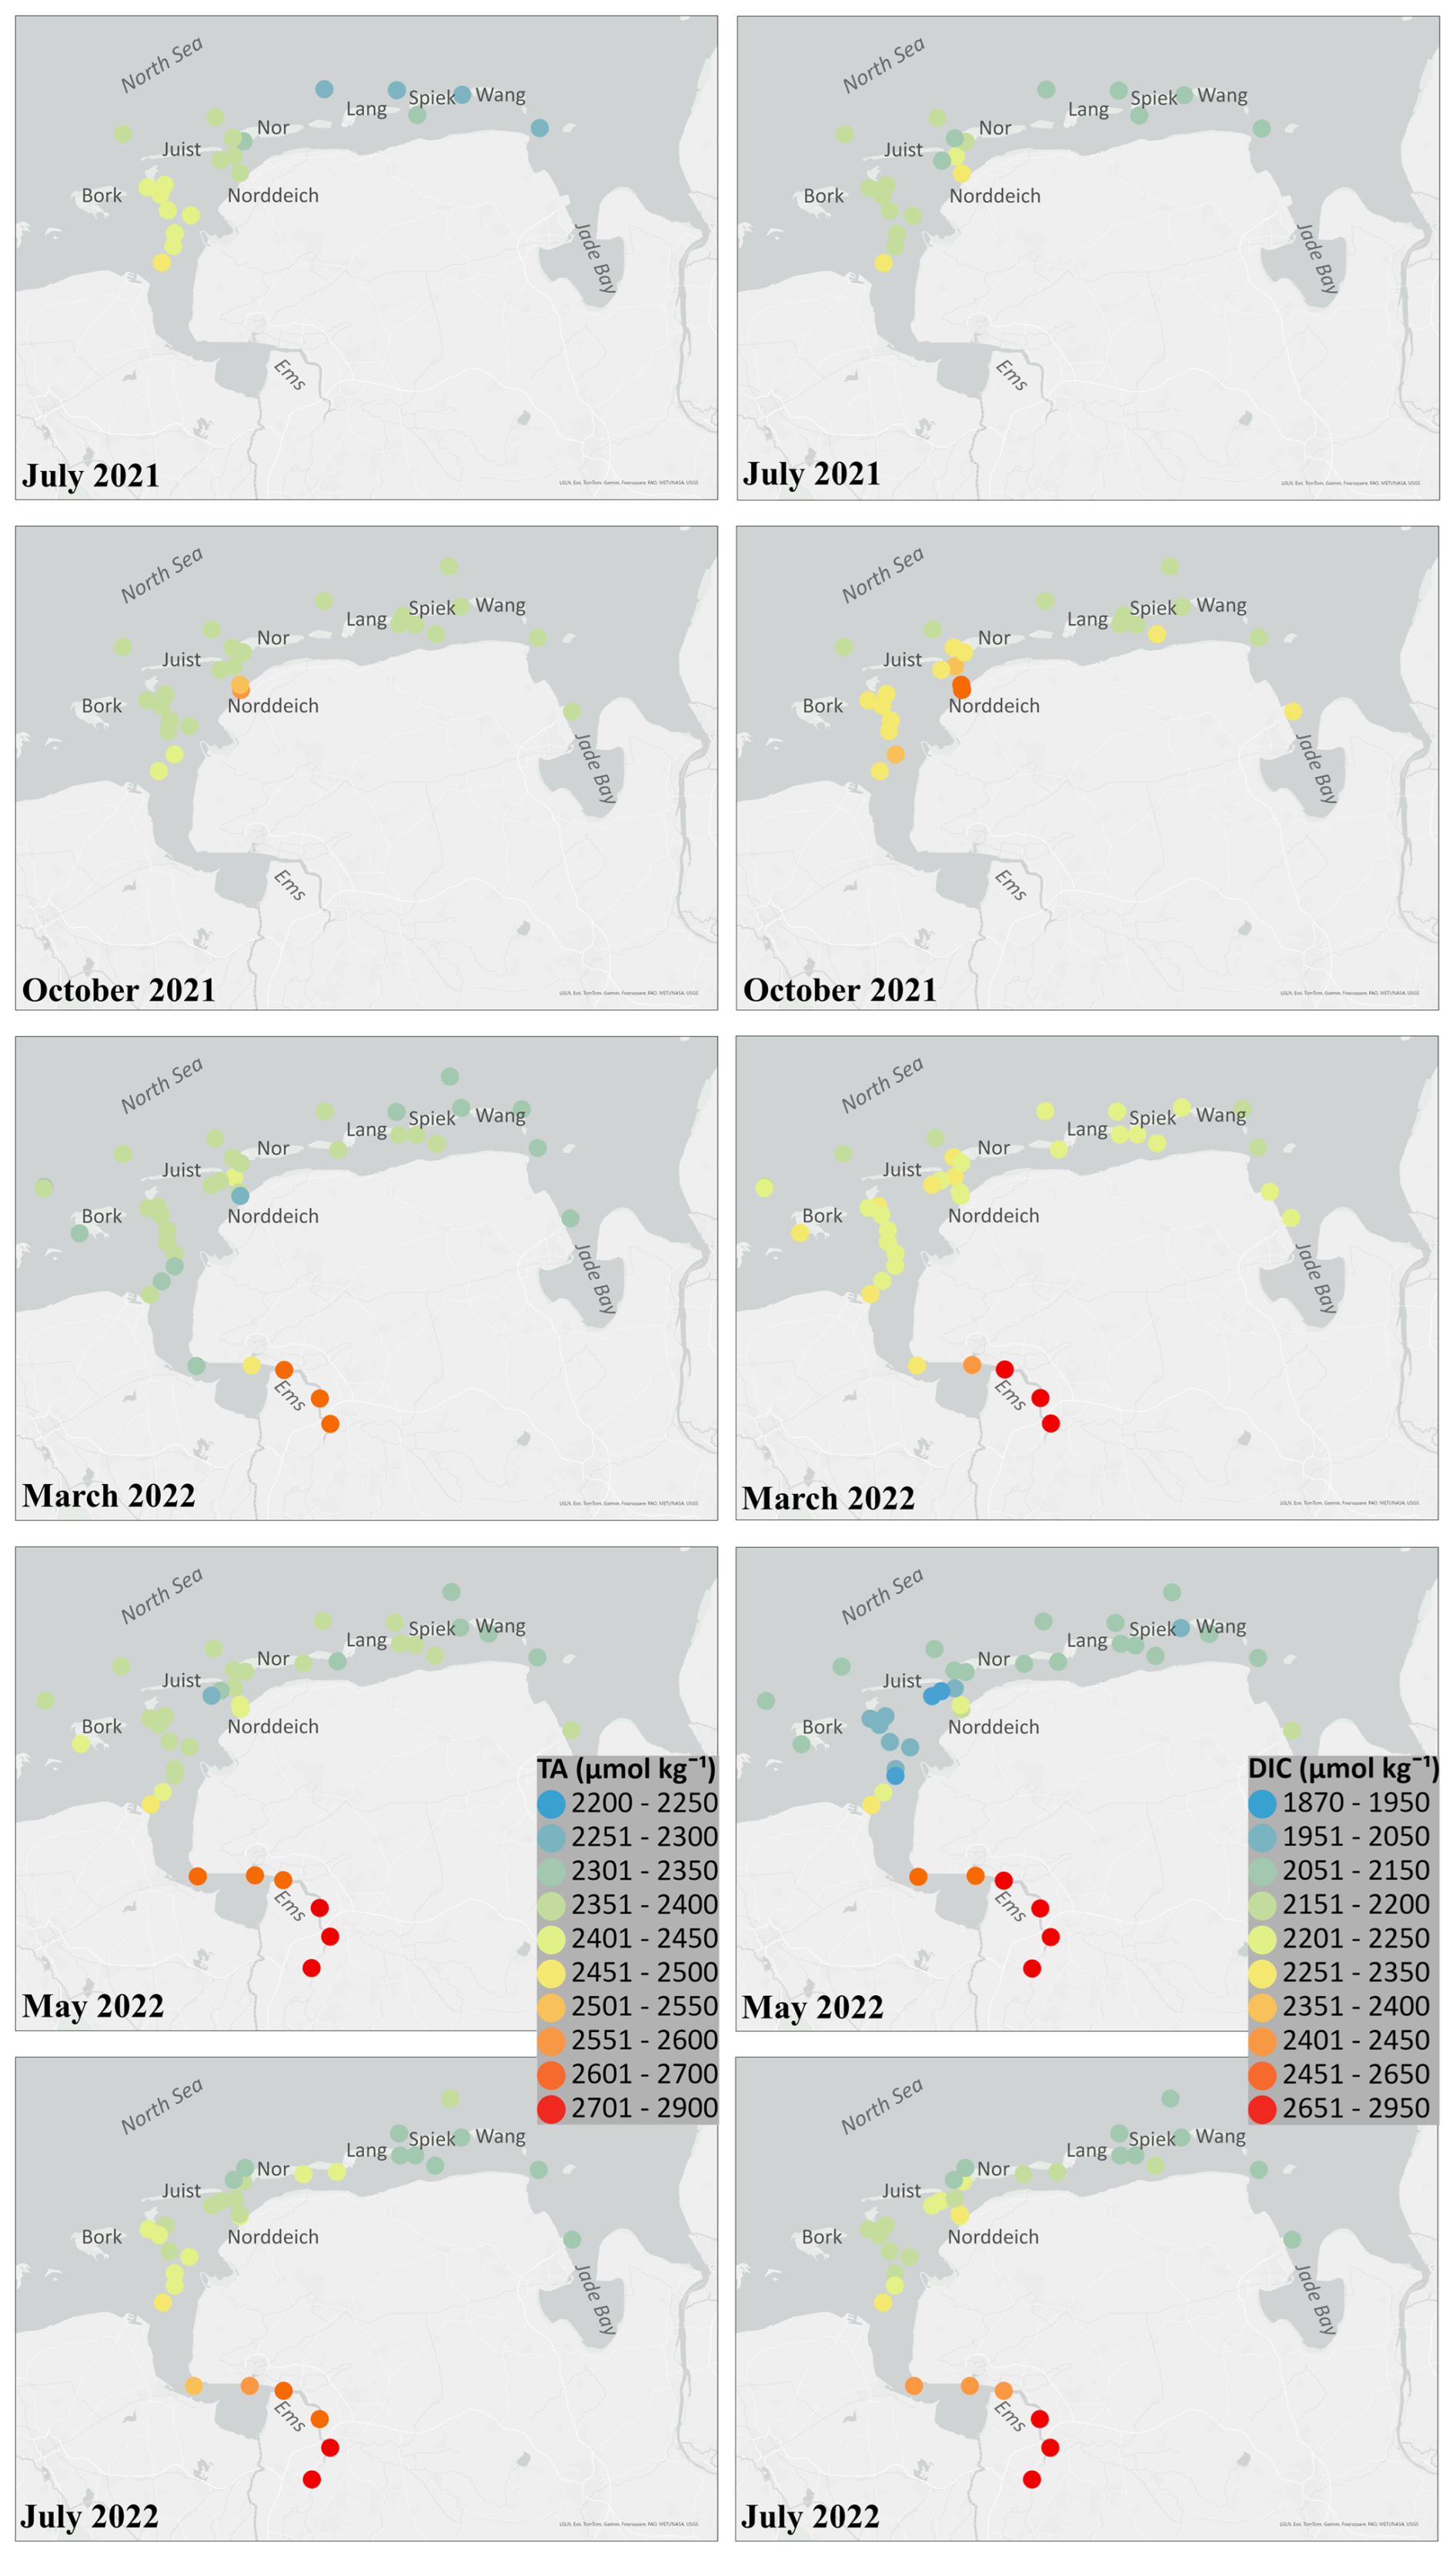
Figure 2Measured results of total alkalinity (TA) and dissolved inorganic carbon (DIC) from all seasonal cruises of July 2021, October 2021, March 2022, May 2022 and July 2022. All TA and DIC values are in µmol kg−1. The map in this Figure was generated using ArcGIS. Data sources: LGLN, Esri, TomTom, Garmin, Foursquare, FAO, METI/NASA, USGS.
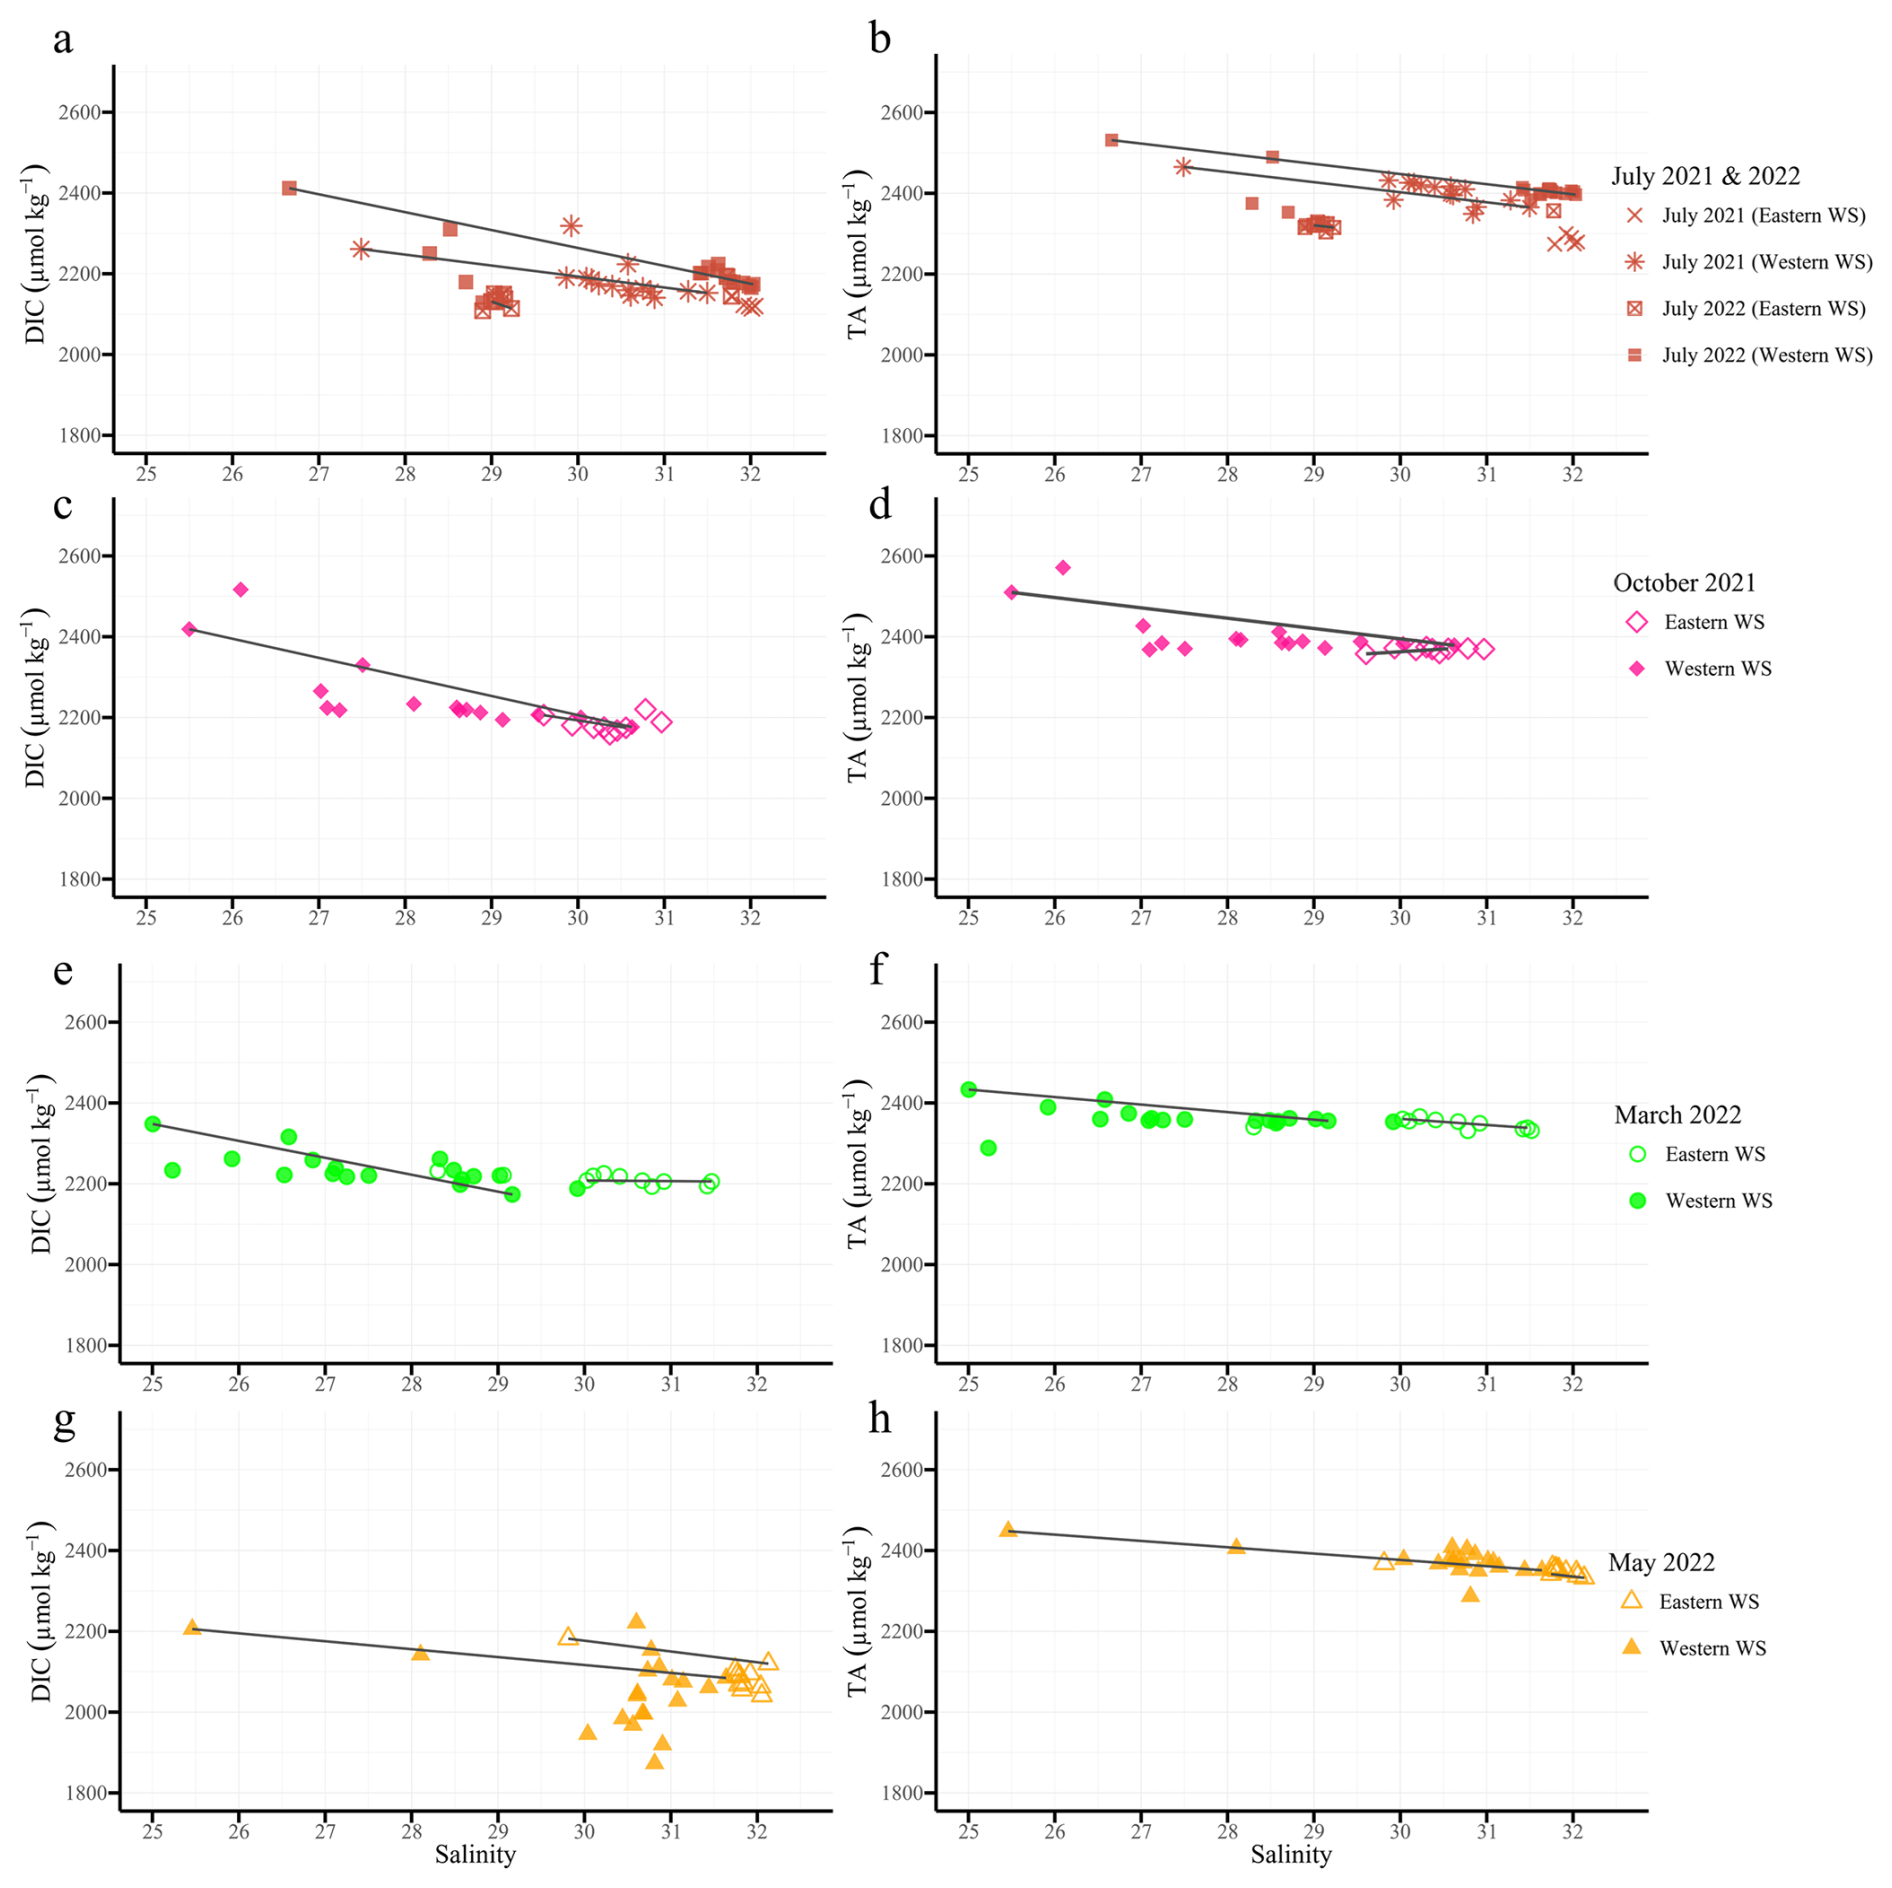
Figure 3Conservative mixing plots of dissolved inorganic carbon (DIC, left column a, c, e, g) and total alkalinity (TA, right column b, d, f, h) in µmol kg−1 versus salinity in the East Frisian Wadden Sea (EFWS), separated by cruise and region. Each plot includes data from both Eastern and Western regions (different symbols). Rows correspond to cruises: (a, b) July 2021 and July 2022, (c, d) October 2021, (e, f) March 2022, and (g, h) May 2022. Solid lines represent conservative mixing lines. Only data with salinity >25 are shown, illustrating seasonal and regional variability along the land-to-sea gradient in the EFWS.
In October 2021, TA peaked at Norddeich in the Western WS (up to 2571 µmol kg−1; Fig. 2). DIC values reached 2516 µmol kg−1 and decreased eastward to 2158 µmol kg−1 (Fig. 2). The TA mixing line in the Western WS had a negative slope (−25.4 µmol kg−1 per salinity unit), while the Eastern WS showed a near-linear positive slope (+13.1 µmol kg−1 per salinity unit) (Fig. 3d). DIC conservative mixing lines revealed a similar pattern, with a steep negative slope (−46.9 µmol kg−1 per salinity unit) in the Western WS (Fig. 3c). This consistent difference across both parameters highlights strong spatial heterogeneity in carbonate system dynamics
Relatively low DIC values (<2200 µmol kg−1 in the Western WS) were observed outside the barrier islands in March, with slight increase towards the coast (Fig. 2). During this season, TA concentrations showed little deviation from conservative mixing during this season. The mixing lines exhibited weak negative slopes in both subregions (−7.5 µmol kg−1 per salinity unit in the Western WS and −6.8 µmol kg−1 per salinity unit in the Eastern WS; Fig. 3f), indicating that TA dynamics were largely controlled by physical mixing with only a minor signal of net production. Similarly, DIC mixing lines revealed shallow negative slopes (−18.2 and −15.9 µmol kg−1 per salinity unit in the Western and Eastern WS, respectively; Fig. 3e).
Mean TA values in the Western WS reached 2379 µmol kg−1 in May (Table 3; Fig. 2), reflecting a moderate seasonal increase, with concentrations generally close to or slightly above the mixing line and showing similar negative slopes in the Western (−15.6 µmol kg−1 per salinity unit) and Eastern WS (−15.3 µmol kg−1 per salinity unit) (Fig. 3h). During this period, the signal of TA production was most clearly expressed in the Western WS. The lowest DIC concentrations of the study (down to 1872 µmol kg−1) were observed in spring (Fig. 3g).
We note that conservative mixing lines in intertidal areas are often difficult to resolve visually, especially when data cluster closely. To better capture non-conservative variability, we calculated ΔDICexcess and ΔTAexcess for each season and region, reflecting deviations from mixing. In addition, ΔTAP was derived as an upper estimate of photosynthetically driven TA changes. These metrics reduce uncertainty and provide a clearer assessment of net production and consumption than graphical mixing lines alone.
3.3 Seasonal dynamics of DIC and TA excess and primary production effects
Stations near Norddeich harbour, closer to the mainland, consistently exhibited the highest TA (up to 2571 µmol kg−1 in October) and DIC (up to 2516 µmol kg−1 in October) concentrations across all seasons (see Sect. 3.2; Fig. 2). These locally high values were therefore excluded from the calculation of mean ± standard deviation to provide a more representative assessment of ΔDICexcess, ΔTAexcess, and ΔTAP. However, these values are still displayed in the scatter plots (Fig. 4) to illustrate the range of variability, including highly positive and negative deviations.
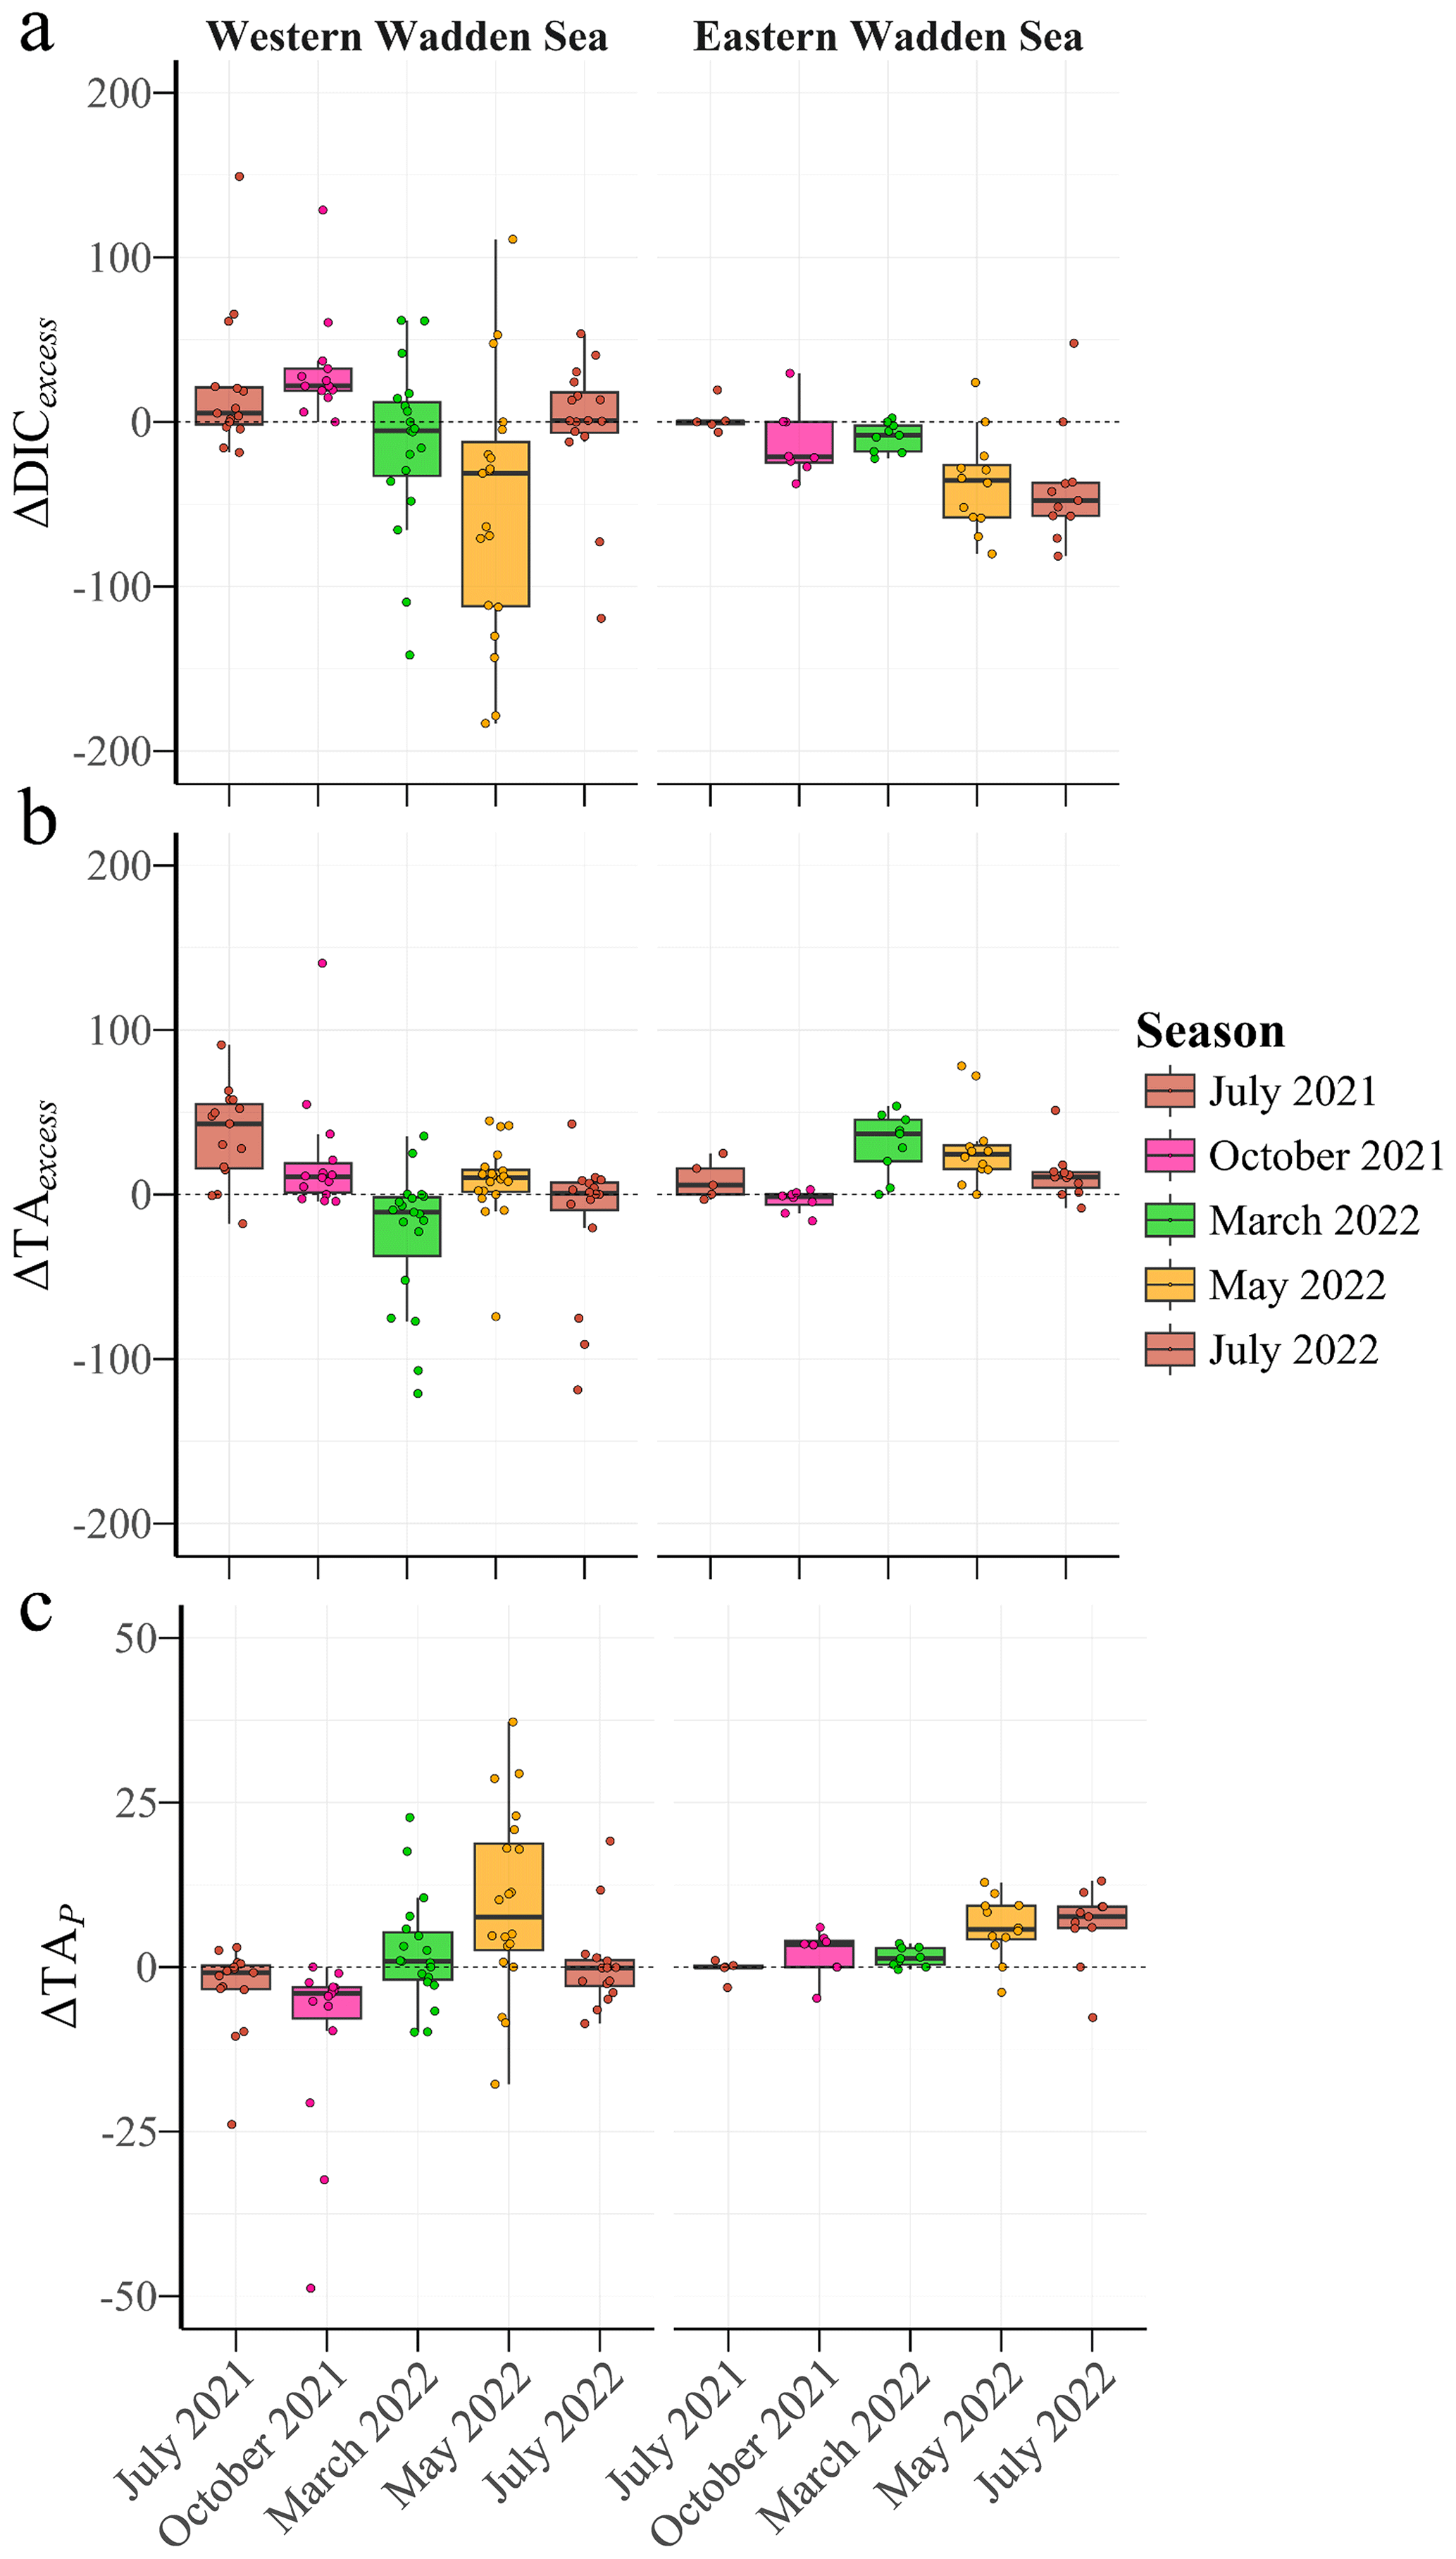
Figure 4Boxplots of excess dissolved inorganic carbon (ΔDICexcess, a), excess total alkalinity (ΔTAexcess, b), and biological alkalinity signal (ΔTAP, c) in µmol kg−1 in the Western Wadden Sea (left panels) and Eastern Wadden Sea (right panels) for each season. Each colour represents different seasons. Each box represents the interquartile range (IQR), with the median shown by the thick line.
Seasonal deviations in ΔDICexcess, ΔTAexcess, and ΔTAP were evaluated using one-sample t-tests against a null hypothesis of zero for each Season and Region, where zero represents the scenario in which all DIC and TA at a station are solely the result of conservative mixing between North Sea and estuarine waters, with no additional contributions from estuarine processes or biological activity.
The Western WS generally exhibits positive ΔDICexcess values, with a peak in October 2021 (47.7 ± 84.9 µmol kg−1, p=0.078) and summer (July 2021: 23.4 ± 27.6 µmol kg−1; July 2022: 54.6 ± 33.3 µmol kg−1, p<0.001), suggesting an excess of DIC beyond the expected mixing (Fig. 4a). In contrast, during May, ΔDICexcess in the Western WS was negative (−69.3 ± 107.0 µmol kg−1, p=0.014), suggesting significant DIC consumption, due to enhanced primary production during spring bloom conditions. Similarly, negative values were observed in the Eastern WS in May 2022 (−30.1 ± 35.8 µmol kg−1, p=0.014) and July 2021 (−19.3 ± 11.2 µmol kg−1, p=0.018) (Table 4; Fig. 4a).
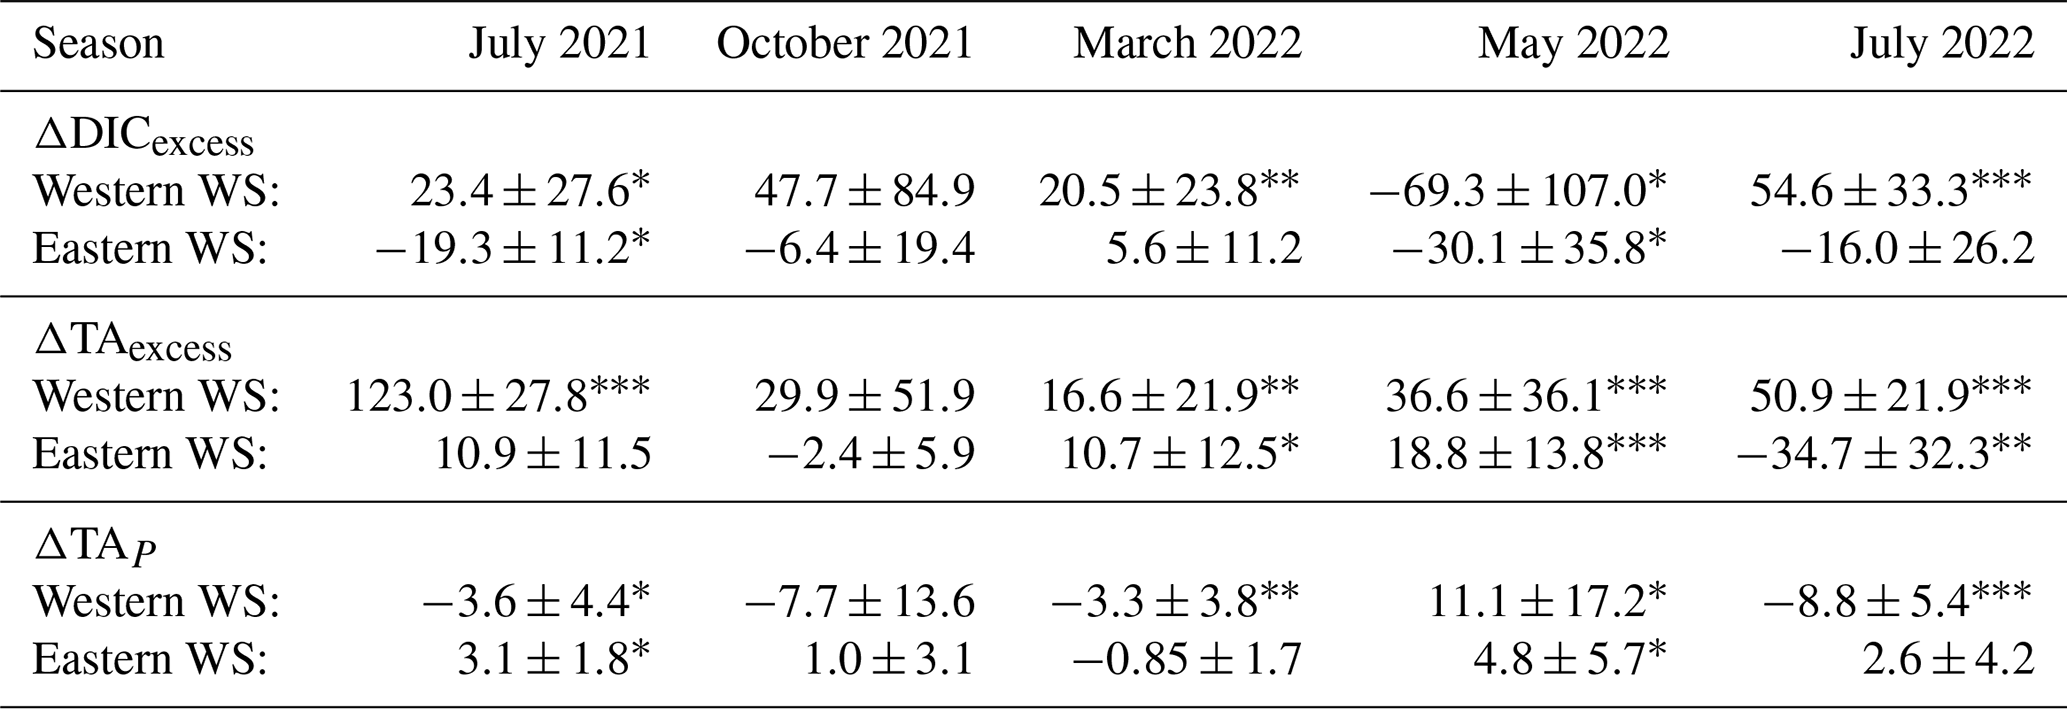
Table 4Mean ± Standard Deviation (µmol kg−1) of excess dissolved inorganic carbon (ΔDICexcess), excess total alkalinity (ΔTAexcess), and biological alkalinity signal (ΔTAP) of all seasons and regions. ΔDICexcess and ΔTAexcess are deviations from conservative mixing, reflecting biogeochemical processes; ΔTAP estimates the contribution of primary production and respiration. One-sample t-tests against zero (representing conservative mixing between North Sea and estuarine waters) were performed. Significant deviations from zero are indicated with symbols (∗ p<0.05, p<0.01, p<0.001).
ΔTAexcess also exhibited seasonal and regional patterns: in the Western WS, high positive and significant deviations were observed in July 2021 (123.0 ± 27.8 µmol kg−1, p<0.001) and July 2022 (50.9 µmol kg−1, ), reflecting additional alkalinity sources. In the Eastern WS, ΔTAexcess was negative in July 2022 (−34.7 µmol kg−1, p=0.005), whereas July 2021 showed a slight, non-significant positive deviation (10.9 µmol kg−1, p=0.102) (Fig. 4b).
ΔTAP, representing primary production effects, was positive in May in both the Western (11.1 µmol kg−1, p=0.014) and Eastern WS (4.83 µmol kg−1, p=0.014), indicating a significant impact on TA, during times with net uptake of CO2 through primary production with nitrate uptake, and a corresponding significant decrease in DIC (Fig. 4a and c). In other seasons, ΔTAP exhibited contrasting patterns between regions: ΔTAP in July in the Western WS was negative (July 2021: −3.8 µmol kg−1, p=0.010; July 2022: −8.75 µmol kg−1, p<0.001), whereas in the Eastern WS ΔTAP was positive in July 2021 (3.1 µmol kg−1, p=0.018), highlighting regional differences (Fig. 4c). To sum up, the Western WS exhibited higher and more variable deviations in ΔDICexcess and ΔTAexcess, with significant summer TA production signal. In the Eastern WS, ΔDICexcess followed a similar seasonal pattern with smaller magnitudes, while ΔTAexcess was positive in 2021 but turned significantly negative in July 2022. In the Eastern WS, ΔDICexcess followed a similar seasonal pattern with smaller magnitudes, while ΔTAexcess was positive in 2021 but turned significantly negative in July 2022, which may indicate a stronger influence of sluice openings on TA.
3.4 Influence of biogeochemical processes on seasonal [TA–DIC] and AOU in the EFWS
The relationship between [TA–DIC] and AOU provides valuable insights into the biogeochemical processes that drive carbonate dynamics in coastal systems (Xue and Cai, 2020). A critical threshold for interpreting this relationship is that [TA–DIC] cannot be used when values are <50 µmol kg−1, as proposed by Xue and Cai (2020). This threshold applied only to one station near Norddeich harbor in October (Fig. 5), so these data were excluded from the seasonal calculations (Table 3).
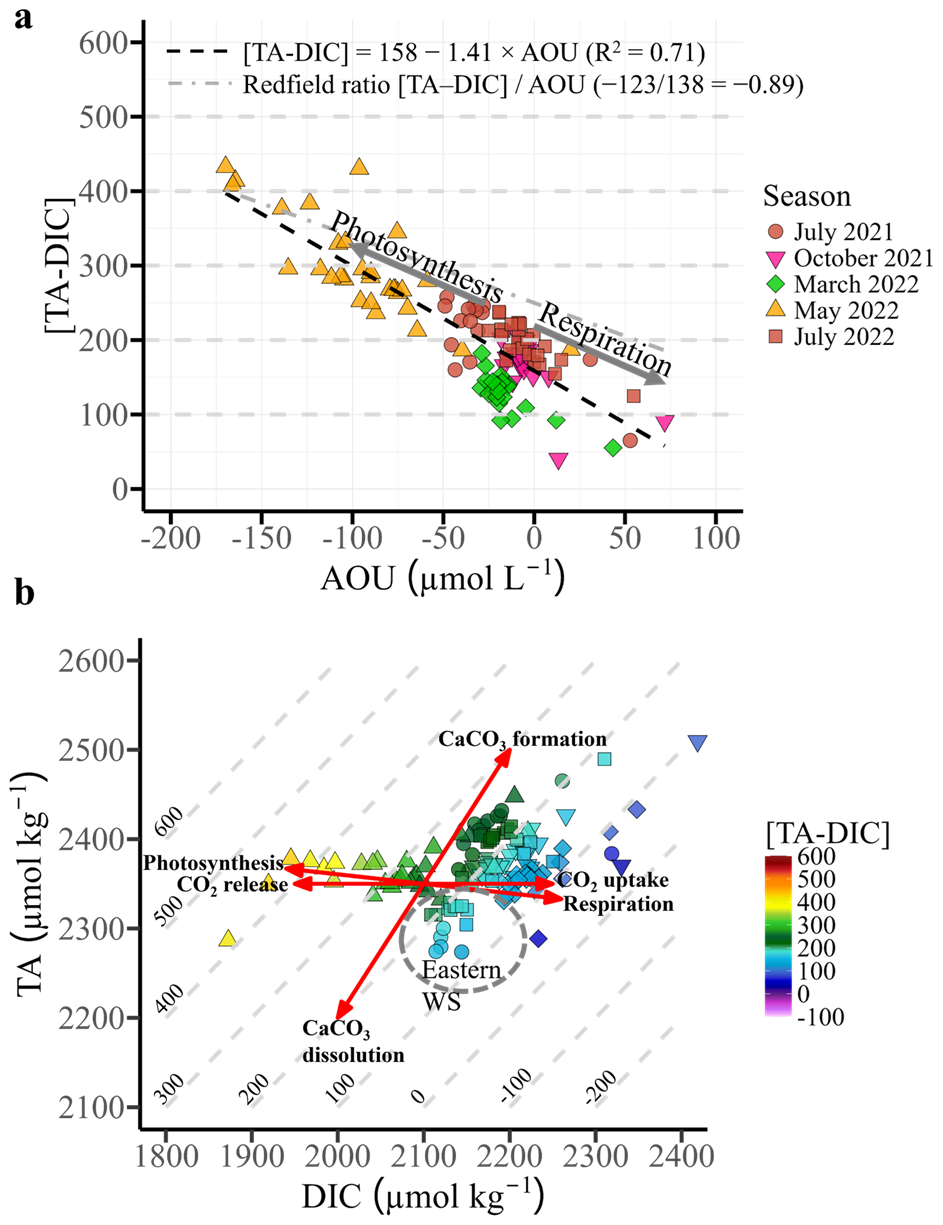
Figure 5(a) Apparent oxygen utilization (AOU) versus the difference between total alkalinity and dissolved inorganic carbon ([TA-DIC], in µmol kg−1) across all seasonal cruises, with regression analysis (black dashed line). Arrows indicate potential processes affecting [TA-DIC] and AOU. The grey dashed line represents the regression slope () proposed by Xue and Cai (2020). (b) Dissolved inorganic carbon (DIC) versus total alkalinity (TA) from all seasons, with [TA–DIC] values indicated by colour at salinity 25–32.5. Isoclines represent constant [TA–DIC] values. Red lines indicate key biogeochemical processes (photosynthesis/respiration, CO2 exchange, and CaCO3 formation/dissolution). The Eastern Wadden Sea is highlighted with a grey circle.
Figure 5a illustrates the AOU relationship to [TA–DIC] from all stations sampled during various seasons in the Wadden Sea. The regression analysis highlights a negative correlation, with a slope of −1.42 ± 0.08 µmol kg−1 per µmol L−1 of AOU. When accounting for density-normalized O2 (i.e., converting AOU from µmol L−1 to µmol kg−1 using the potential density of seawater), the slope becomes −1.44 ± 0.09 µmol kg−1 per µmol kg−1. The grey dashed line in Fig. 5a represents the theoretical Redfield ratio slope (), which Xue and Cai (2020) summarize as a reference for expected [TA–DIC] changes per unit AOU in subsurface waters. In their framework, [TA–DIC] serves as a proxy for ocean acidification, directly linking biological production and respiration to changes in DIC and TA. Biological production consumes CO2 and nutrients, decreasing DIC and increasing TA, while respiration has the opposite effect, increasing DIC and decreasing TA; thus, the decomposition or formation of 1 mol of organic matter ((CH2O)106(NH3)16H3PO4) alters [TA–DIC] by ±123 mol, which can be approximated from the slope of ΔAOU. Deviations from the Redfield slope, for example in deep waters, may result from processes such as CaCO3 dissolution, which increases both DIC and TA. Our measured slope in the Wadden Sea is steeper than the Redfield reference, indicating a stronger local biological influence on [TA–DIC].
Based on the distribution of our dataset (Fig. 5), we use ∼200 µmol kg−1 [TA–DIC] as an empirical threshold that separates respiration-dominated conditions (lower [TA–DIC], positive AOU) from photosynthesis-dominated conditions with net TA production (higher [TA–DIC], negative AOU). We emphasize that this threshold is not a universal constant, but a pragmatic value derived from our dataset to interpret biogeochemical dynamics in the EFWS.
In spring, negative AOU values (down to −169 µmol L−1; Fig. 5a) coincided with [TA–DIC] values exceeding 200 µmol kg−1. In the summer (2021; 2022), [TA-DIC] values from the Eastern WS are located under the respiration/photosynthesis line (<200 µmol kg−1; Fig. 5b). In contrast, the measured [TA-DIC] concentrations in the Western WS in summer are >200 µmol kg−1, above the respiration/photosynthesis fit (Fig. 5b). In July 2022, the salinity in the same region changed by 2–3 units from one day (11 July) to another (12 July), where the salinity was higher in the East. This short-term change in salinity is relevant to the observed TA and DIC because both parameters are partially controlled by conservative mixing, and slight increases in salinity can lead to proportionally higher TA values. Indeed, TA was slightly higher in summer 2022 (+53.7 ± 36.7 µmol kg−1) compared to the previous year (Table 3).
3.5 Regional and seasonal variation of nutrients
A clear seasonal pattern can also be seen in the measured nutrients (Fig. S4 in the Supplement). For and a decrease in concentrations was observed from October 2021 to May 2022, except in the East part of the EFWS (Fig. S4), where the concentration did not change much. concentration ranged seasonally, with an increasing trend from summer to March 2022 (up to 66.28 µmol L−1) in the EFWS. In May 2022, the concentrations decreased again below the detection limit of the instrument (>0.01 µmol L−1) at some stations, mainly in the Western part (Fig. S4). This analogous seasonal tendency possibly will point to common sources and sinks.
Overall, from March 2022 to May 2022 there was an average decrease in of 19.29 ± 18.11 µmol kg−1 (Fig. 6). TA slightly increased by 9.1 ± 29.2 µmol kg−1 during this time (Figs. 4–6), while DIC decreased on average by 159.4 ± 125.4 µmol kg−1. In Fig. 6, the changes from March to May (Δ May–March 2022) of and SiO2 at all stations are plotted against the corresponding change in DIC (ΔDIC). For Δ; a regression line was fitted with equation of (R2=0.464, p<0.05, Fig. 6), while the ΔSiO2 regression has an equation of (R2=0.216, p<0.05; Fig. 6). The slopes of these regressions represent the calculated C:N (6.90) and C:Si (8.11) ratios. Both values are close to the Redfield ratios of (C:N) and (C:Si) (Redfield et al., 1963), indicating that enhanced primary production in spring, along with nitrate and silicate uptake, most likely led to the concomitant decrease in DIC (Fig. 6) and the observed increase in TA.
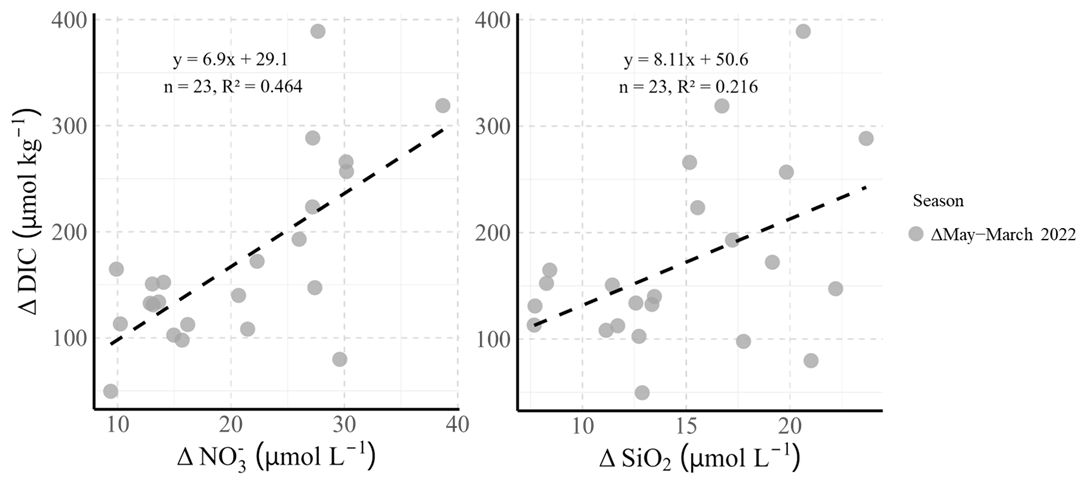
Figure 6Differences between May and March 2022 for nitrate (Δ) and silicic acid (ΔSiO2) plotted against the corresponding differences in dissolved inorganic carbon (ΔDIC) for all measured stations in the Western and Eastern Wadden Sea. Each point represents the change between the 2 months at a given station (Δ May–March 2022). Black dashed lines show linear regressions through the data, and the slopes correspond to the calculated C:N and C:Si ratios at the measured stations, derived from these differences.
4.1 Regional and seasonal differences of the carbonate dynamics in the EFWS
This study highlights regional and seasonal variability in the carbonate system, with a notable West-to-East gradient in DIC and TA, showing considerable fluctuations across seasons (Table 3; Fig. 2). This is the first study to investigate ΔDICexcess, ΔTAexcess, ΔTAP and [TA-DIC] in the EFWS to provide insights into the respective biogeochemical processes and to determine the source and sink dynamics of carbon on such a large spatial and temporal scale (Table 4; Fig. 4). We successfully demonstrated that TA increased in the spring because of intense primary production, most likely driven by nitrate uptake (Figs. 4 and 6), highlighting the impact of biological activity on carbonate system dynamics. During the other seasons, the system acted as a source of DIC, indicating seasonal shifts in carbon cycling. Similar patterns of intense production periods and TA increases have also been reported in the North Sea adjacent to the Wadden Sea (Voynova et al., 2019). Additionally, we observed TA production during summer, which was more prominent in the Western WS, further suggesting that these intertidal regions act as a stronger source of TA and DIC during all seasons except in spring, compared to the Eastern EFWS.
4.2 Seasonal TA production and DIC dynamics in the EFWS
The data reveal important differences in the patterns between years and regions in summer (Table 4; Figs. 2–5). The observed summer dynamics in the Eastern and Western EFWS show distinct patterns in the biogeochemical processes related to TA and DIC production. Positive ΔTAexcess (e.g., 123.0 ± 27.8 µmol kg−1 in July 2021) and ΔDICexcess (23.4 ± 27.6; Table 4) suggest the presence of additional sources of TA and DIC beyond what would be expected from conservative mixing between North Sea and estuarine waters. One key biogeochemical process, which can contribute to increasing TA, without a proportional increase in DIC, is the dissolution of CaCO3, which results in elevated [TA-DIC] values (>200 µmol kg−1) (Chen and Wang, 1999; Hoppema, 1990). However, CaCO3 dissolution can be ruled out as a major TA source in the water column, since calcite is supersaturated (Ωcal>1) during the study period (Brasse et al., 1999; Norbisrath et al., 2024). Nevertheless, in the sediments large amount of DIC can be produced by carbonate shells and transported by erosion processes into the water column (Brasse et al., 1999). Previous studies have estimated that TA production in the Wadden Sea is driven by anaerobic processes such as denitrification and/or CaCO3 dissolution in sediments (Norbisrath et al., 2024; Thomas et al., 2009). Anaerobic degradation of organic matter – via denitrification and sulfate reduction – releases both TA and DIC (Brasse et al., 1999; Hu and Cai, 2011; Norbisrath et al., 2024; Thomas et al., 2009), with TA concentrations reaching up to 2310 µmol kg−1 in summer (Thomas et al., 2009). Other studies suggest that permeable Janssand sediments (a tidal sand flat in the back-barrier area of Spiekeroog Island, Eastern EFWS) exhibit the highest potential denitrification rates (Gao et al., 2010).
In the summer months, the production of TA in both the Eastern and Western EFWS can be attributed to the decomposition of organic matter, especially following a productive spring season, such as the one observed in May 2022 (see Sect. 4.3), which likely led to an elevated input of organic matter into the system (Borges et al., 2017). This organic matter subsequently undergoes both aerobic and anaerobic decomposition in the sediments during the summer months, where anaerobic processes like denitrification and sulphate reduction are drivers in generating both TA and DIC (Brasse et al., 1999; Norbisrath et al., 2024). These processes can significantly contribute to the enhancement of TA production (Figs. 4b, 5a and b), especially in the Western EFWS, where sedimentary anaerobic processes dominate in the summer (Al-Raei et al., 2009; Böttcher et al., 1998; Hu and Cai, 2011; Kamyshny and Ferdelman, 2010; Norbisrath et al., 2024; Thomas et al., 2009; Wu et al., 2015). Furthermore, with oxygen saturation remaining high (>100 % saturation) and apparent oxygen utilization (AOU) being negative (Fig. 5a), it is evident that the water column is net autotrophic. This suggests that TA is primarily produced in the sediments and subsequently transported into the water column, rather than being generated in situ via remineralization (Beck and Brumsack, 2012; Postma, 1981).
Organic matter remineralization varies regionally across the North Frisian Wadden Sea (NFWS), EFWS, and Jade Bay (Van Beusekom et al., 2012; Kowalski et al., 2013). The NFWS favours aerobic degradation due to its wide tidal basins and high-water exchange (∼8.1 km3 d−1), resulting in lower organic matter accumulation, reduced eutrophication, and lower TA production relative to DIC (Van Beusekom et al., 2012; Kowalski et al., 2013; Schwichtenberg et al., 2020). In contrast, the EFWS experiences higher eutrophication and organic matter accumulation due to its narrower basins and limited exchange, promoting anaerobic degradation processes (e.g., sulfate reduction), which enhance TA production (Van Beusekom et al., 2012; Kowalski et al., 2013; Schwichtenberg et al., 2020; Thomas et al., 2009). Jade Bay, with the lowest water exchange (∼0.8 km3 d−1), exhibits sporadic high TADIC ratios, likely due to short-term iron reduction processes (Brasse et al., 1999).
A similar pattern was also seen in the Eastern EFWS compared to the Western in [TA-DIC] dynamics (Figs. 2 and 5b). In comparison to the Western, the Eastern EFWS consistently exhibits lower [TA-DIC] values (<200 µmol kg−1) during the summer months of 2021 and 2022, while the Western EFWS shows slightly higher [TA-DIC] values (>200 µmol kg−1; Fig. 5b). This difference can be attributed to enhanced CaCO3 formation, as indicated by its Ωcal (1.9 ± 0.8) in the Eastern CaCO3 formation likely consumes TA (Chen, 1978), leading to the observed shift toward negative ΔTAexcess values (Fig. 4b). The formation of CaCO3, particularly in sediments or shells, contributes to the lower observed source of TA in the Eastern compared to the Western WS. Despite this, the region still acts as a net source of TA, which aligns with the assumption that the Eastern EFWS can contribute TA to the coastal system during the summer months, especially from anaerobic degradation processes (Schwichtenberg et al., 2020; Thomas et al., 2009).
Additionally, the salinity change observed in July 2022 was likely due to local anthropogenic influences, such as the sluice opening in summer 2022. On 11 July 2022, the sluice in Neuharlingersiel was opened before we started our sampling. This anthropogenic intervention likely caused sudden changes in salinity and local hydrological conditions (Figs. S1, 3a and b). Luebben et al. (2009) investigated the influence of the sluice in the back-barrier area of Spiekeroog and found that the patterns of salinity, CDOM fluorescence, and DOC are strongly affected by the discharge of organic-rich freshwater via the sluice in Neuharlingersiel. Local freshwater inputs from sluices in the EFWS, such as Neuharlingersiel – which can induce a salinity decrease of at least 1 unit (Luebben et al., 2009) – and potentially sluices in the Jade Bay (e.g. Dangaster Siel), as well as coastal circulation, may therefore play a more important role, although the exact contribution of each factor remains uncertain. While, the observed salinity drop extends beyond Norderney into Jade Bay, the low river discharge in summer (Pätsch and Lenhart, 2004; Schwichtenberg et al., 2020) suggests that large riverine inputs (e.g., from the Weser) are unlikely to be the primary cause. Importantly, lower [TA–DIC] values in the Eastern EFWS were observed both on the day of sluice opening in July 2022 and when the sluice was closed in July 2021, suggesting that sluice activity did not substantially control the [TA–DIC] dynamics in July 2022.
The seasonal shifts in TA can influence the coastal ocean's ability to absorb carbon from the atmosphere (Burt et al., 2016; Gruber et al., 2019; Li et al., 2024; Schwichtenberg et al., 2020). In summer, the generation of TA and DIC may alter the region's buffering capacity, with the Western WS possibly storing or taking up carbon (Figs. 2–5) (Gruber et al., 2019; Li et al., 2024). These findings align with previous studies (Thomas et al., 2009; Voynova et al., 2019) suggesting that the intertidal regions of the EFWS act as a source of both TA and DIC to the coastal system during the summer months.
Particularly, the tidal WS plays an important role in the biogeochemical cycling of the North Sea (Santos et al., 2015; Thomas et al., 2009), because many European rivers are empty in the WS (Thomas et al., 2009). A few studies discussed the generation in of TA in summer before (Schwichtenberg, 2013; Voynova et al., 2019) and the contribution of rivers (Pätsch and Lenhard, 2004), however in summer the riverine inflow was lowest, which could not explain an increase of TA in the WS. The highest riverine contribution of TA is expected from January to April (Pätsch and Lenhart, 2004; Schwichtenberg, 2013; Schwichtenberg et al., 2020).
The moderate rainfall and cooler-than-average weather in October 2021 may have influenced the hydrology of the region, potentially causing increased terrestrial runoff and enhanced delivery of alkalinity-rich water to the coastal system. The slight source of DIC in October (Table 3; Fig. 3c) suggests that organic matter remineralization and sediment-water exchange continue to play a role during this period (Borges et al., 2017). In addition, pore waters enriched with remineralized nutrients are actively released into the overlying water column (Beck and Brumsack, 2012) and organic matter-enriched water masses transported from the North Sea contribute to the availability of degradable material in the Wadden Sea, sustaining biogeochemical activity into autumn (Van Beusekom et al., 1999). This mechanism aligns with studies highlighting the importance of tidally-driven nutrient and carbon fluxes in permeable sediments (Postma, 1981), where advective transport processes facilitate the continuous exchange of dissolved carbon species between sediments and the water column (Santos et al., 2015). Model simulations suggest that effective riverine inputs account for only about 5 % of the total TA variability in the German Bight, implying that other processes – particularly tidal pumping – likely play a key role in sustaining elevated TA and DIC concentrations (Moore et al., 2011), as observed in October. In the Dutch Wadden Sea, De Groot et al. (2023) showed that tides control methanotrophic activity, which increases by ∼40 % at low tide compared to high tide. By analogy, tidal cycles in the EFWS likely enhance advective transport of dissolved carbon from sediments to the water column, with Ra, TA, and DOC peaking at low tide and potentially driving substantial export to the adjacent North Sea (Moore et al., 2011), reinforcing the role of sediments as an active source of carbon and nutrients, consistent with the observations in October 2021.
4.3 Nitrate assimilation and carbonate dynamics in spring
The highest rates of photosynthesis were measured in our study in the spring of 2022 (May 2022). This is evidenced by high O2 levels (up to 180 % saturation), low pCO2 obs (Table 2) and high chlorophyll a levels, along with negative AOU values (down to −169 µmol L−1; Fig. 5a) (Artioli et al., 2012; Thomas et al., 2005). These findings highlight the dominant role of photosynthetic activity in modulating the carbonate system, particularly in the Western EFWS, where carbon fixation via photosynthesis is a key factor in this study. The resulting changes in [TA-DIC] during this period are reflected in the AOU to [TA-DIC] relationship shown in Fig. 4a, with a steeper negative slope of −1.416 µmol kg−1 per µmol L−1 AOU, deviating from the Redfield ratio of −0.89 (Xue and Cai, 2020). This deviation suggests that the EFWS may differ from the typical conditions assumed in the Redfield model (Redfield et al., 1963), which is primarily based on aerobic respiration and production (Xue and Cai, 2020).
Furthermore, [TA-DIC] increased due to the significant decrease in DIC in May 2022 (Fig. 3c). Together with the positive ΔTAP and strongly negative ΔDICexcess values after removal of mixing, this supports the findings of intense spring primary production generating TA, while drawing down DIC (Fig. 4). This was particularly evident in the Western EFWS, but also in the Eastern, indicating the Western EFWS is a stronger sink for CO2 due to carbon fixation and nitrate assimilation (Brenner et al., 2016). The May measurements follow roughly the photosynthesis/respiration line, indicated by the progressively low DIC values in both regions, and slight increase in TA (9.1 ± 29.2 µmol kg−1 from March 2022 to May 2022; Fig. 5b), above the mixing line (Fig. 3h). The relationship in Fig. 6 also indicates that primary production is influenced by nitrate and silicate availability. Nitrate concentrations decreased substantially from 65 µmol kg−1 in March to 22 µmol kg−1 in May 2022 (Figs. 6 and S4), coinciding with the period of intense primary production. This significant drawdown in nitrate concentrations suggests that nitrate assimilation was the primary driver of the observed decrease in DIC and the slight increase in TA during this period. Nitrate assimilation involves the consumption of hydrogen ions (H+) and the release of hydroxide ions (OH−), which leads to an increase in pH and, consequently, in TA (Brenner et al., 2016; Wolf-Gladrow et al., 2007). Therefore, nitrate assimilation played a crucial role in shaping the carbonate system dynamics by decreasing CO2 and DIC, while increasing TA.
The regression analysis of Δ and ΔDIC between March and May 2022 revealed a slope of 6.90 for the changes in nitrate concentrations (Fig. 6), which is close to the Redfield ratio of 6.625 for the C:N ratio (Redfield et al., 1963). This close match suggests nitrate assimilation during the spring bloom, which is closely linked to a reduction in DIC. Similarly, the ΔSiO2 regression produced a slope of 8.11 (Fig. 6), which is also close to the Redfield ratio for SiO2 (7.067), further supporting the conclusion that the enhanced primary production in this region during the spring bloom contributed to nutrient uptake, particularly nitrate and silicate.
We therefore propose that assimilation of during the time of intense primary production in May 2022 could explain the local increase of total alkalinity during the spring bloom. First, the maximum concentration of was captured in March before the high biologically productive season started in May 2022 (Figs. 3–6), with maximum concentrations measured in the Western WS. A significant drawdown of from the maximum value of 65 µmol kg−1 in March 2022 to 22 µmol kg−1 in May 2022, resulted in an average decrease of 19.2 ± 9.6 µmol kg−1 of (Figs. 6 and S4). Brewer and Goldman (1976) also documented that nitrate assimilation increases TA (9.1 ± 29.2 µmol kg−1).
An uptake of was not obvious, because concentrations were much lower during this period (Fig. S4), suggesting only a small impact on TA patterns. This further emphasizes the central role of nitrate assimilation via primary production in shaping the observed patterns in the carbonate system in the spring-early summer, and the role of land-based nitrate inputs to the coast. Nitrification, the process by which is converted into , causes a decrease in TA by 2 moles per mole of nitrogen (Wolf-Gladrow et al., 2007; Xue and Cai, 2020), thus has the opposite effect compared to nitrate assimilation, which increases TA. The decrease in from May to July 2022 was less pronounced (1.51 ± 5.16 µmol kg−1, Fig. 6), which is consistent with the general trend of lower concentrations in summer, likely driven by higher turnover rates (Kieskamp et al., 1991).
The findings highlight significant regional and seasonal variations in the EFWS carbonate system, reflecting broader carbon dynamics in coastal and shelf seas. Both TA and DIC exhibit substantial variations across regions and seasons, with a notable decrease in DIC from East to West and an increase in TA during biologically productive periods, such as spring and summer. In spring 2022, a significant drawdown of was observed, correlating with a slight increase in TA, likely due to nitrate assimilation during primary production. Primary production could explain up to 88 % of the ΔDICexcess in the Western WS and up to 92 % in the Eastern WS, contributing to the significant drop in DIC, slight TA production, and drawdown during this period.
In the summer, it is likely that the remineralization of organic matter, combined with the dissolution of CaCO3 in sediments, contributes to higher TA production, especially in the coastal and nearshore areas of the Western EFWS. On the other hand, our work suggested possible CaCO3 formation in the Eastern EFWS, which may reduce TA levels ([TA-DIC]<200 µmol kg−1). However, the region still acts as a net source of TA, in part due to the known high rates of benthic anaerobic respiration, such as organic matter decomposition and associated TA production, particularly after the high productivity of the spring season. This TA generation may enhance the region's capacity to absorb CO2, despite the broader southern North Sea generally being considered a carbon source to the atmosphere. These findings emphasize the complexity of the biogeochemical processes driving regional and seasonal variability in the EFWS carbonate system, particularly those influenced by tidal cycles, river inputs, and sediment interactions.
To gain a comprehensive understanding of these intricate interactions and their impact on carbon storage and marine biogeochemistry in this ecologically important region, further research, including sediment studies and continuous tidal monitoring, is essential. This study is the first to combine the analysis of [TA-DIC] with other parameters such as ΔTAexcess, ΔDICexcess, and ΔTAP to infer underlying biogeochemical processes – such as biological productivity and nutrient availability. This innovative approach offers a new way to examine how various environmental factors interact and influence the carbonate system. The results have the potential to refine existing models of the biogeochemical cycle, providing valuable insights for more accurate climate predictions and improved strategies for managing coastal systems in response to environmental change.
The data supporting the findings of this study have been published on the PANGAEA data repository. The datasets are accessible under the following DOIs:
https://doi.org/10.1594/PANGAEA.974424 (Luitjens et al., 2025a)
https://doi.org/10.1594/PANGAEA.974426 (Luitjens et al., 2025b)
https://doi.org/10.1594/PANGAEA.974427 (Luitjens et al., 2025c)
https://doi.org/10.1594/PANGAEA.974428 (Luitjens et al., 2025d).
The supplement related to this article is available online at https://doi.org/10.5194/bg-22-6255-2025-supplement.
LL, DD, and YGV planned the campaigns. YGV and JM planned the measurements and selected the parameters used in this study. JM, LL, and DD carried out the measurements. LL corrected the FerryBox data and the pCO2 data. JM analyzed the data, with advisory support from YGV, BVD, and HT. JM prepared the manuscript draft, and YGV, BVD, DD, LL, and HT reviewed and edited the manuscript.
The contact author has declared that none of the authors has any competing interests.
Publisher's note: Copernicus Publications remains neutral with regard to jurisdictional claims made in the text, published maps, institutional affiliations, or any other geographical representation in this paper. While Copernicus Publications makes every effort to include appropriate place names, the final responsibility lies with the authors. Views expressed in the text are those of the authors and do not necessarily reflect the views of the publisher.
We thank Martina Gehrung, Tanja Pieplow, and Catharina Petrauskas for their exceptional technical support, meticulous work, and dedication. They ensured the reliability and accuracy of our data through their careful handling of samples and precise analytical measurements. We also thank Vlad-Alexandru Macovei for his assistance with processing the raw data from the pCO2 sensor.
The scientists and crew who participated in the research expeditions, including the captain Alexander Heidenreich and the crew of the RV Burchana (Jens Voß and Winfried Bruns) are also greatly appreciated. It was their hard work, professionalism and co-operation during the challenging field work that made it possible to collect the data required for this study. The success of our research would not have been possible without your tireless efforts at sea. We thank all of you for your unwavering support and commitment.
Finally, we would like to acknowledge the support and valuable discussions with the members of the “CARBOSTORE” project and especially Michael Böttcher from the Institute for Baltic Sea Research in Warnemünde (Germany).
The author wishes to express their gratitude to the anonymous reviewer for their constructive comments and valuable feedback, which significantly enhanced the manuscript.
This research and Julia Meyer were supported by the German Federal Ministry of Education and Research (BMBF) through the “CARBOSTORE” project (Grant 03F0875A), the Helmholtz European Partnering project “SEA-ReCap – Research Capacity Building for Healthy, Productive, and Resilient Seas”, and the Helmholtz Association’s “Changing Earth” initiative.
The article processing charges for this open-access publication were covered by the Helmholtz-Zentrum Hereon.
This paper was edited by Frédéric Gazeau and reviewed by Marta Álvarez and three anonymous referees.
4H – Jena engineering GmbH: Data Processing for CONTROS HydroC® CO2 (Manual), 1–7, 2021.
Al-Raei, A. M., Bosselmann, K., Böttcher, M. E., Hespenheide, B., and Tauber, F.: Seasonal dynamics of microbial sulfate reduction in temperate intertidal surface sediments: controls by temperature and organic matter, Ocean Dyn., 59, 351–370, https://doi.org/10.1007/s10236-009-0186-5, 2009.
Artioli, Y., Blackford, J. C., Butenschön, M., Holt, J. T., Wakelin, S. L., Thomas, H., Borges, A. V., and Allen, J. I.: The carbonate system in the North Sea: Sensitivity and model validation, J. Mar. Syst., 102–104, 1–13, https://doi.org/10.1016/j.jmarsys.2012.04.006, 2012.
Bauer, J. E., Cai, W. J., Raymond, P. A., Bianchi, T. S., Hopkinson, C. S., and Regnier, P. A. G.: The changing carbon cycle of the coastal ocean, Nature, 504, 61–70, https://doi.org/10.1038/nature12857, 2013.
Beck, M. and Brumsack, H. J.: Biogeochemical cycles in sediment and water column of the Wadden Sea: The example Spiekeroog Island in a regional context, Ocean. Coast. Manag., 68, 102–113, https://doi.org/10.1016/j.ocecoaman.2012.05.026, 2012.
Beck, M., Dellwig, O., Fischer, S., Schnetger, B., and Brumsack, H.-J.: Trace metal geochemistry of organic carbon-rich watercourses draining the NW German coast, Estuar. Coast. Shelf Sci., 104–105, 66–79, https://doi.org/10.1016/j.ecss.2012.03.025, 2012.
Borges, A. V., Schiettecatte, L.-S., Abril, G., Delille, B., and Gazeau, F.: Carbon dioxide in European coastal waters, Estuar. Coast. Shelf Sci., 70, 375–387, https://doi.org/10.1016/j.ecss.2006.05.046, 2006.
Borges, A. V., Speeckaert, G., Champenois, W., Scranton, M. I., and Gypens, N.: Productivity and Temperature as Drivers of Seasonal and Spatial Variations of Dissolved Methane in the Southern Bight of the North Sea, Ecosystems, 21, 583–599, https://doi.org/10.1007/s10021-017-0171-7, 2017.
Böttcher, M. E., Oelschläger, B., Höpner, T., Brumsack, H. J., and Rullkötter, J.: Sulfate reduction related to the early diagenetic degradation of organic matter and “black spot” formation in tidal sandflats of the German Wadden Sea (southern North Sea): Stable isotope (13C, 34S, 18O) and other geochemical results, Org. Geochem., 29, 1517–1530, https://doi.org/10.1016/S0146-6380(98)00124-7, 1998.
Brasse, S., Reimer, A., Seifert, R., and Michaelis, W.: The influence of intertidal mudflats on the dissolved inorganic carbon and total alkalinity distribution in the German Bight, southeastern North Sea, J. Sea Res., 93–103, https://doi.org/10.1016/S1385-1101(99)00020-9, 1999.
Brenner, H., Braeckman, U., Le Guitton, M., and Meysman, F. J. R.: The impact of sedimentary alkalinity release on the water column CO2 system in the North Sea, Biogeosciences, 13, 841–863, https://doi.org/10.5194/bg-13-841-2016, 2016.
Brewer, P. G. and Goldman, J. C.: Alkalinity changes generated by phytoplankton growth1, Limnol. Oceanogr., 21, 108–117, https://doi.org/10.4319/lo.1976.21.1.0108, 1976.
Burt, W. J., Thomas, H., Hagens, M., Pätsch, J., Clargo, N. M., Salt, L. A., Winde, V., and Böttcher, M. E.: Carbon sources in the North Sea evaluated by means of radium and stable carbon isotope tracers, Limnol. Oceanogr., 61, 666–683, https://doi.org/10.1002/lno.10243, 2016.
Chen, C. A. and Wang, S.: Carbon, alkalinity and nutrient budgets on the East China Sea continental shelf, J. Geophys. Res. Oceans, 104, 20675–20686, https://doi.org/10.1029/1999JC900055, 1999.
Chen, C.-T. A.: Decomposition of Calcium Carbonate and Organic Carbon in the Deep Oceans, Science, 201, 735–736, https://doi.org/10.1126/science.201.4357.735, 1978.
de Groot, T. R., Mol, A. M., Mesdag, K., Ramond, P., Ndhlovu, R., Engelmann, J. C., Röckmann, T., and Niemann, H.: Diel and seasonal methane dynamics in the shallow and turbulent Wadden Sea, Biogeosciences, 20, 3857–3872, https://doi.org/10.5194/bg-20-3857-2023, 2023.
Dickson, A. G.: An exact definition of total alkalinity and a procedure for the estimation of alkalinity and total inorganic carbon from titration data, Deep-Sea Res. I, 28, 609–623, https://doi.org/10.1016/0198-0149(81)90121-7, 1981.
Dickson, A. G.: Standard Potential of the Reaction: , and and the Standard Acidity Constant of the Ion in Synthetic Sea Water from 273.15 to 318.15 K, J. Chem. Thermodyn., 22, 113–127, https://doi.org/10.1016/0021-9614(90)90074-Z, 1990.
Dickson, A. G., Afghan, J. D., and Anderson, G. C.: Reference materials for oceanic CO2 analysis: a method for the certification of total alkalinity, Mar. Chem., 80, https://doi.org/10.1016/S0304-4203(02)00133-0, 2003.
Dickson, A. G., Sabine, C. L., and Christian, J. R. (Eds.): Guide to best practices for ocean CO2 measurements, PICES Special Publication 3, 191 pp., ISBN 1-897176-07-4, https://doi.org/10013/epic.51789.d001, 2007.
Duan, L. Q., Song, J. M., Li, X. G., Yuan, H. M., and Zhuang, W.: Potential risks of CO2 removal project based on carbonate pump to marine ecosystem, Sci. Total. Environ., 862, https://doi.org/10.1016/j.scitotenv.2022.160728, 2023.
Feely, R., Doney, S., and Cooley, S.: Ocean Acidification: Present Conditions and Future Changes in a High-CO2 World, Oceanography, 22, 36–47, https://doi.org/10.5670/oceanog.2009.95, 2009.
Friedlingstein, P., O'Sullivan, M., Jones, M. W., Andrew, R. M., Bakker, D. C. E., Hauck, J., Landschützer, P., Le Quéré, C., Luijkx, I. T., Peters, G. P., Peters, W., Pongratz, J., Schwingshackl, C., Sitch, S., Canadell, J. G., Ciais, P., Jackson, R. B., Alin, S. R., Anthoni, P., Barbero, L., Bates, N. R., Becker, M., Bellouin, N., Decharme, B., Bopp, L., Brasika, I. B. M., Cadule, P., Chamberlain, M. A., Chandra, N., Chau, T.-T.-T., Chevallier, F., Chini, L. P., Cronin, M., Dou, X., Enyo, K., Evans, W., Falk, S., Feely, R. A., Feng, L., Ford, D. J., Gasser, T., Ghattas, J., Gkritzalis, T., Grassi, G., Gregor, L., Gruber, N., Gürses, Ö., Harris, I., Hefner, M., Heinke, J., Houghton, R. A., Hurtt, G. C., Iida, Y., Ilyina, T., Jacobson, A. R., Jain, A., Jarníková, T., Jersild, A., Jiang, F., Jin, Z., Joos, F., Kato, E., Keeling, R. F., Kennedy, D., Klein Goldewijk, K., Knauer, J., Korsbakken, J. I., Körtzinger, A., Lan, X., Lefèvre, N., Li, H., Liu, J., Liu, Z., Ma, L., Marland, G., Mayot, N., McGuire, P. C., McKinley, G. A., Meyer, G., Morgan, E. J., Munro, D. R., Nakaoka, S.-I., Niwa, Y., O'Brien, K. M., Olsen, A., Omar, A. M., Ono, T., Paulsen, M., Pierrot, D., Pocock, K., Poulter, B., Powis, C. M., Rehder, G., Resplandy, L., Robertson, E., Rödenbeck, C., Rosan, T. M., Schwinger, J., Séférian, R., Smallman, T. L., Smith, S. M., Sospedra-Alfonso, R., Sun, Q., Sutton, A. J., Sweeney, C., Takao, S., Tans, P. P., Tian, H., Tilbrook, B., Tsujino, H., Tubiello, F., van der Werf, G. R., van Ooijen, E., Wanninkhof, R., Watanabe, M., Wimart-Rousseau, C., Yang, D., Yang, X., Yuan, W., Yue, X., Zaehle, S., Zeng, J., and Zheng, B.: Global Carbon Budget 2023, Earth Syst. Sci. Data, 15, 5301–5369, https://doi.org/10.5194/essd-15-5301-2023, 2023.
Gao, H., Schreiber, F., Collins, G., Jensen, M. M., Kostka, J. E., Lavik, G., De Beer, D., Zhou, H. Y., and Kuypers, M. M. M.: Aerobic denitrification in permeable Wadden Sea sediments, ISME Journal, 4, 417–426, https://doi.org/10.1038/ismej.2009.127, 2010.
Gattuso, J. P., Frankignoulle, M., and Wollast, R.: Carbon and carbonate metabolism in coastal aquatic ecosystems, Annu. Rev. Ecol. Syst., 29, 405–434, https://doi.org/10.1146/annurev.ecolsys.29.1.405, 1998.
Grasshoff, K., Kremling, K., and Ehrhardt, M. (Eds.): Methods of Seawater Analysis, Wiley, Print ISBN: 9783527295890, Online ISBN: 9783527613984, https://doi.org/10.1002/9783527613984, 1999.
Gruber, N., Clement, D., Carter, B. R., Feely, R. A., van Heuven, S., Hoppema, M., Ishii, M., Key, R. M., Kozyr, A., Lauvset, S. K., Lo Monaco, C., Mathis, J. T., Murata, A., Olsen, A., Perez, F. F., Sabine, C. L., Tanhua, T., and Wanninkhof, R.: The oceanic sink for anthropogenic CO2 from 1994 to 2007, Science, 363, 1193–1199, https://doi.org/10.1126/science.aau5153, 2019.
Grunwald, M., Dellwig, O., Beck, M., Dippner, J. W., Freund, J. A., Kohlmeier, C., Schnetger, B., and Brumsack, H. J.: Methane in the southern North Sea: Sources, spatial distribution and budgets, Estuar. Coast. Shelf Sci., 81, 445–456, https://doi.org/10.1016/j.ecss.2008.11.021, 2009.
Herrling, G. and Winter, C.: Tidally- and wind-driven residual circulation at the multiple-inlet system East Frisian Wadden Sea, Cont. Shelf Res., 106, 45–59, https://doi.org/10.1016/j.csr.2015.06.001, 2015.
Hoppema, J. M. J.: The distribution and seasonal variation of alkalinity in the Southern Bight of the North Sea and in the Western Wadden Sea, Neth. J. Sea Res., 26, 11–23, https://doi.org/10.1016/0077-7579(90)90053-J, 1990.
Hu, X. and Cai, W. J.: An assessment of ocean margin anaerobic processes on oceanic alkalinity budget, Global Biogeochem. Cycles, 25, GB3003, https://doi.org/10.1029/2010GB003859, 2011.
Jiang, L.-Q., Cai, W.-J., and Wang, Y.: A comparative study of carbon dioxide degassing in river- and marine-dominated estuaries, Limnol. Oceanogr., 53, 2603–2615, https://doi.org/10.4319/lo.2008.53.6.2603, 2008.
Joesoef, A., Huang, W.-J., Gao, Y., and Cai, W.-J.: Air–water fluxes and sources of carbon dioxide in the Delaware Estuary: spatial and seasonal variability, Biogeosciences, 12, 6085–6101, https://doi.org/10.5194/bg-12-6085-2015, 2015.
Kamyshny, A. and Ferdelman, T. G.: Dynamics of zero-valent sulfur species including polysulfides at seep sites on intertidal sand flats (Wadden Sea, North Sea), Mar. Chem., 121, 17–26, https://doi.org/10.1016/j.marchem.2010.03.001, 2010.
Kieskamp, W., Lohse, L., Epping, E., and Helder, W.: Seasonal variation in denitrification rates and nitrous oxide fluxes in intertidal sediments of the western Wadden Sea, Mar. Ecol. Prog. Ser., 72, 145–151, https://doi.org/10.3354/meps072145, 1991.
Kowalski, N., Dellwig, O., Beck, M., Gräwe, U., Neubert, N., Nägler, T. F., Badewien, T. H., Brumsack, H.-J., van Beusekom, J. E. E., and Böttcher, M. E.: Pelagic molybdenum concentration anomalies and the impact of sediment resuspension on the molybdenum budget in two tidal systems of the North Sea, Geochim. Cosmochim. Acta, 119, 198–211, https://doi.org/10.1016/j.gca.2013.05.046, 2013.
Kroeker, K. J., Kordas, R. L., Crim, R., Hendriks, I. E., Ramajo, L., Singh, G. S., Duarte, C. M., and Gattuso, J. P.: Impacts of ocean acidification on marine organisms: Quantifying sensitivities and interaction with warming, Glob. Chang. Biol., 19, 1884–1896, https://doi.org/10.1111/gcb.12179, 2013.
Lee, K., Kim, T.-W., Byrne, R. H., Millero, F. J., Feely, R. A., and Liu, Y.-M.: The universal ratio of boron to chlorinity for the North Pacific and North Atlantic oceans, Geochim. Cosmochim. Acta, 74, 1801–1811, https://doi.org/10.1016/j.gca.2009.12.027, 2010.
Legge, O., Johnson, M., Hicks, N., Jickells, T., Diesing, M., Aldridge, J., Andrews, J., Artioli, Y., Bakker, D. C. E., Burrows, M. T., Carr, N., Cripps, G., Felgate, S. L., Fernand, L., Greenwood, N., Hartman, S., Kröger, S., Lessin, G., Mahaffey, C., Mayor, D. J., Parker, R., Queirós, A. M., Shutler, J. D., Silva, T., Stahl, H., Tinker, J., Underwood, G. J. C., Van Der Molen, J., Wakelin, S., Weston, K., and Williamson, P.: Carbon on the Northwest European Shelf: Contemporary Budget and Future Influences, Front. Mar. Sci., 7, https://doi.org/10.3389/fmars.2020.00143, 2020.
Lehmann, N., Stacke, T., Lehmann, S., Lantuit, H., Gosse, J., Mears, C., Hartmann, J., and Thomas, H.: Alkalinity responses to climate warming destabilise the Earth's thermostat, Nat. Commun., 14, https://doi.org/10.1038/s41467-023-37165-w, 2023.
Lewis, E. and Wallace, D.: Program developed for CO2 system calculations, Oak Ridge National Laboratory, https://doi.org/10.2172/639712, 1998.
Li, X., Wu, Z., Ouyang, Z., and Cai, W.-J.: The source and accumulation of anthropogenic carbon in the U. S. East Coast, Sci. Adv., 10, 3169, https://doi.org/10.1126/sciadv.adl3169, 2024.
Liang, H., Lunstrum, A. M., Dong, S., Berelson, W. M., and John, S. G.: Constraining CaCO3 Export and Dissolution With an Ocean Alkalinity Inverse Model, Global Biogeochem. Cycles, 37, https://doi.org/10.1029/2022GB007535, 2023.
Lorkowski, I., Pätsch, J., Moll, A., and Kühn, W.: Interannual variability of carbon fluxes in the North Sea from 1970 to 2006 – Competing effects of abiotic and biotic drivers on the gas-exchange of CO2, Estuar. Coast. Shelf Sci., 100, 38–57, https://doi.org/10.1016/j.ecss.2011.11.037, 2012.
Luebben, A., Dellwig, O., Koch, S., Beck, M., Badewien, T. H., Fischer, S., and Reuter, R.: Distributions and characteristics of dissolved organic matter in temperate coastal waters (Southern North Sea), Ocean Dyn., 59, 263–275, https://doi.org/10.1007/s10236-009-0181-x, 2009.
Lueker, T. J., Dickson, A. G., and Keeling, C. D.: Ocean pCO2 calculated from dissolved inorganic carbon, alkalinity, and equations for K1 and K2: validation based on laboratory measurements of CO2 in gas and seawater at equilibrium, Mar. Chem., 70, 105–119, https://doi.org/10.1016/S0304-4203(00)00022-0, 2000.
Luitjens, L.: Analytische Messung auserwählter Nährstoffkonzentrationen im ökologischen System Wattenmeer und Ems, sowie deren Entwicklung, Einflüsse und Auswirkungen, Master thesis, University of Applied Sciences, Emden/Leer, Germany, 2019.
Luitjens, L., Daehne, D., Berkenbrink, C., and Wurpts, A.: FerryBox-integrated membrane-based pCO2, temperature, salinity, oxygen, chlorophyll, turbidity and pH measurements of BU-C-2107 during RV Burchana cruise, PANGAEA [data set], https://doi.org/10.1594/PANGAEA.974424, 2025a.
Luitjens, L., Daehne, D., Berkenbrink, C., and Wurpts, A.: FerryBox-integrated membrane-based pCO2, temperature, salinity, oxygen, chlorophyll, turbidity and pH measurements of BU-C-2203 during RV Burchana cruise, PANGAEA [data set], https://doi.org/10.1594/PANGAEA.974426, 2025b.
Luitjens, L., Daehne, D., Berkenbrink, C., and Wurpts, A.: FerryBox-integrated membrane-based pCO2, temperature, salinity, oxygen, chlorophyll, turbidity and pH measurements of BU-C-2205 during RV Burchana cruise, PANGAEA [data set], https://doi.org/10.1594/PANGAEA.974427, 2025c.
Luitjens, L., Daehne, D., Berkenbrink, C., and Wurpts, A.: FerryBox-integrated membrane-based pCO2, temperature, salinity, oxygen, chlorophyll, turbidity and pH measurements of BU-C-2207 during RV Burchana cruise, PANGAEA [data set], https://doi.org/10.1594/PANGAEA.974428, 2025d.
Macovei, V. A., Petersen, W., Brix, H., and Voynova, Y. G.: Reduced Ocean Carbon Sink in the South and Central North Sea (2014–2018) Revealed From FerryBox Observations, Geophys. Res. Lett., 48, 1–11, https://doi.org/10.1029/2021GL092645, 2021.
Moore, W. S., Beck, M., Riedel, T., Rutgers van der Loeff, M., Dellwig, O., Shaw, T. J., Schnetger, B., and Brumsack, H. J.: Radium-based pore water fluxes of silica, alkalinity, manganese, DOC, and uranium: A decade of studies in the German Wadden Sea, Geochim. Cosmochim. Acta, 75, 6535–6555, https://doi.org/10.1016/j.gca.2011.08.037, 2011.
Norbisrath, M., van Beusekom, J. E. E., and Thomas, H.: Alkalinity sources in the Dutch Wadden Sea, Ocean Sci., 20, 1423–1440, https://doi.org/10.5194/os-20-1423-2024, 2024.
Orr, J. C., Fabry, V. J., Aumont, O., Bopp, L., Doney, S. C., Feely, R. A., Gnanadesikan, A., Gruber, N., Ishida, A., Joos, F., Key, R. M., Lindsay, K., Maier-Reimer, E., Matear, R., Monfray, P., Mouchet, A., Najjar, R. G., Plattner, G. K., Rodgers, K. B., Sabine, C. L., Sarmiento, J. L., Schlitzer, R., Slater, R. D., Totterdell, I. J., Weirig, M. F., Yamanaka, Y., and Yool, A.: Anthropogenic ocean acidification over the twenty-first century and its impact on calcifying organisms, Nature, 437, 681–686, https://doi.org/10.1038/nature04095, 2005.
Pätsch, J. and Lenhart, H.: Daily Loads of Nutrients, Total Alkalinity, Dissolved Inorganic Carbon and Dissolved Organic Carbon of the European Continental Rivers for the Years 1977–2002, Berichte aus dem Zentrum für Meeres- und Klimaforschung, Reihe B, Ozeanographie, 2004.
Postma, H.: Exchange of materials between the North Sea and the Wadden Sea, Mar. Geol., 40, 199–213, https://doi.org/10.1016/0025-3227(81)90050-5, 1981.
Prowe, A. E. F., Thomas, H., Pätsch, J., Kühn, W., Bozec, Y., Schiettecatte, L. S., Borges, A. V., and de Baar, H. J. W.: Mechanisms controlling the air-sea CO2 flux in the North Sea, Cont. Shelf Res., 29, 1801–1808, https://doi.org/10.1016/j.csr.2009.06.003, 2009.
Redfield, A. C., Ketchum, B. H., and Richards, F. A.: The influence of organisms on the composition of seawater, The sea, 2, 26–77, 1963.
Rewrie, L. C. V., Baschek, B., van Beusekom, J. E. E., Körtzinger, A., Ollesch, G., and Voynova, Y. G.: Recent inorganic carbon increase in a temperate estuary driven by water quality improvement and enhanced by droughts, Biogeosciences, 20, 4931–4947, https://doi.org/10.5194/bg-20-4931-2023, 2023.
Ricour, F., Guidi, L., Gehlen, M., DeVries, T., and Legendre, L.: Century-scale carbon sequestration flux throughout the ocean by the biological pump, Nat. Geosci., 16, 1105–1113, https://doi.org/10.1038/s41561-023-01318-9, 2023.
Sabine, C. L., Feely, R. A., Gruber, N., Key, R. M., Lee, K., Bullister, J. L., Wanninkhof, R., Wong, C. S., Wallace, D. W. R., Tilbrook, B., Millero, F. J., Peng, T.-H., Kozyr, A., Ono, T., and Rios, A. F.: The Oceanic Sink for Anthropogenic CO2, Science, 305, 367–371, https://doi.org/10.1126/science.1097403, 2004.
Santos, I. R., Beck, M., Brumsack, H. J., Maher, D. T., Dittmar, T., Waska, H., and Schnetger, B.: Porewater exchange as a driver of carbon dynamics across a terrestrial-marine transect: Insights from coupled 222Rn and pCO2 observations in the German Wadden Sea, Mar. Chem., 171, 10–20, https://doi.org/10.1016/j.marchem.2015.02.005, 2015.
Schmidt, C., Hanfland, C., Regnier, P., van Cappellen, P., Schlüter, M., Knauthe, U., Stimac, I., and Geibert, W.: 228Ra, 226Ra, 224Ra and 223Ra in potential sources and sinks of land-derived material in the German Bight of the North Sea: Implications for the use of radium as a tracer, Geo-Mar. Lett., 31, 259–269, https://doi.org/10.1007/s00367-011-0231-5, 2011.
Schwichtenberg, F.: Drivers of the carbonate system variability in the southern North Sea: River input, anaerobic alkalinity generation in the Wadden Sea and internal processes, Doktorarbeit/PhS, Universität Hamburg, Hamburg, Germany, 161 pp., 2013.
Schwichtenberg, F., Pätsch, J., Böttcher, M. E., Thomas, H., Winde, V., and Emeis, K.-C.: The impact of intertidal areas on the carbonate system of the southern North Sea, Biogeosciences, 17, 4223–4245, https://doi.org/10.5194/bg-17-4223-2020, 2020.
Staneva, J., Stanev, E. V., Wolff, J. O., Badewien, T. H., Reuter, R., Flemming, B., Bartholomä, A., and Bolding, K.: Hydroynamics and sediment dynamics in the German Bight. A focus on observations and numerical modelling in the East Frisian Wadden Sea, Cont. Shelf Res., 29, 302–319, https://doi.org/10.1016/j.csr.2008.01.006, 2009.
Thomas, H., Bozec, Y., Elkalay, K., de Baar, H. J. W., Borges, A. V., and Schiettecatte, L.-S.: Controls of the surface water partial pressure of CO2 in the North Sea, Biogeosciences, 2, 323–334, https://doi.org/10.5194/bg-2-323-2005, 2005.
Thomas, H., Prowe, A. E. F., van Heuven, S., Bozec, Y., de Baar, H. J. W., Schiettecatte, L. S., Suykens, K., Koné, M., Borges, A. V., Lima, I. D., and Doney, S. C.: Rapid decline of the CO2 buffering capacity in the North Sea and implications for the North Atlantic Ocean, Global Biogeochem. Cycles, 21, https://doi.org/10.1029/2006GB002825, 2007.
Thomas, H., Schiettecatte, L.-S., Suykens, K., Koné, Y. J. M., Shadwick, E. H., Prowe, A. E. F., Bozec, Y., de Baar, H. J. W., and Borges, A. V.: Enhanced ocean carbon storage from anaerobic alkalinity generation in coastal sediments, Biogeosciences, 6, 267–274, https://doi.org/10.5194/bg-6-267-2009, 2009.
UNESCO World Heritage Centre: The Wadden Sea, https://whc.unesco.org/en/list/1314, last access: 23 March 2025.
Van Beusekom, J. E. E. and De Jonge, V. N.: Long-term changes in Wadden Sea nutrient cycles: Importance of organic matter import from the North Sea, Hydrobiologia, 475, 185–194, https://doi.org/10.1023/A:1020361124656, 2002.
Van Beusekom, J. E. E., Brockmann, U. H., Hesse, K.-J., Hickel, W., Poremba, K., and Tillmann, U.: The importance of sediments in the transformation and turnover of nutrients and organic matter in the Wadden Sea and German Bight, Deutsche Hydrographische Zeitschrift, 51, 245–266, https://doi.org/10.1007/BF02764176, 1999.
Van Beusekom, J. E. E., Buschbaum, C., and Reise, K.: Wadden Sea tidal basins and the mediating role of the North Sea in ecological processes: scaling up of management?, Ocean. Coast. Manag., 68, 69–78, https://doi.org/10.1016/j.ocecoaman.2012.05.002, 2012.
Van Dam, B. R., Crosswell, J. R., Anderson, I. C., and Paerl, H. W.: Watershed-scale drivers of air-water CO2 exchanges in two lagoonal North Carolina (USA) estuaries. J. Geophys. Res. Biogeosci., 123, 271–287, https://doi.org/10.1002/2017JG004243, 2018.
Voynova, Y. G., Brix, H., Petersen, W., Weigelt-Krenz, S., and Scharfe, M.: Extreme flood impact on estuarine and coastal biogeochemistry: the 2013 Elbe flood, Biogeosciences, 14, 541–557, https://doi.org/10.5194/bg-14-541-2017, 2017.
Voynova, Y. G., Petersen, W., Gehrung, M., Aßmann, S., and King, A. L.: Intertidal regions changing coastal alkalinity: The Wadden Sea-North Sea tidally coupled bioreactor, Limnol. Oceanogr., 64, 1135–1149, https://doi.org/10.1002/lno.11103, 2019.
Wolf-Gladrow, D. A., Zeebe, R. E., Klaas, C., Körtzinger, A., and Dickson, A. G.: Total alkalinity: The explicit conservative expression and its application to biogeochemical processes, Mar. Chem., 106, 287–300, https://doi.org/10.1016/j.marchem.2007.01.006, 2007.
Wu, C. S., Røy, H., and de Beer, D.: Methanogenesis in sediments of an intertidal sand flat in the Wadden Sea, Estuar. Coast. Shelf Sci., 164, 39–45, https://doi.org/10.1016/j.ecss.2015.06.031, 2015.
Xue, L. and Cai, W. J.: Total alkalinity minus dissolved inorganic carbon as a proxy for deciphering ocean acidification mechanisms, Mar. Chem., 222, https://doi.org/10.1016/j.marchem.2020.103791, 2020.
Xue, L., Cai, W.-J., Sutton, A. J., and Sabine, C.: Sea surface aragonite saturation state variations and control mechanisms at the Gray's Reef time-series site off Georgia, USA (2006–2007), Mar. Chem., 195, 27–40, https://doi.org/10.1016/j.marchem.2017.05.009, 2017.