the Creative Commons Attribution 4.0 License.
the Creative Commons Attribution 4.0 License.
 | 03 Nov 2025
Temperature-driven vapor pressure deficit structures forest bryophyte communities across the landscape
Anna Růžičková
Matěj Man
Martin Macek
Atmospheric vapor pressure deficit (VPD) controls local plant physiology and global vegetation productivity. However, at ecologically crucial intermediate spatial scales, the role of VPD variability in forest bryophyte community assembly and the processes controlling this variability are little known.
To explore VPD effects on bryophyte community composition and richness and to disentangle processes controlling landscape-scale VPD variability, we recorded bryophyte communities and simultaneously measured forest microclimate air temperature and relative humidity across a topographically diverse landscape representing a bryophyte diversity hotspot in temperate Europe. Based on VPD importance for plant physiology, we hypothesize that VPD can be important also for bryophyte community assembly and that VPD variability will be jointly driven by saturated and actual vapor pressure across the topographically diverse landscape with contrasting forest types and steep microclimatic gradients.
Contrary to our expectation, VPD variability was dictated by temperature-driven differences in saturated vapor pressure, while actual vapor pressure was surprisingly constant across the landscape. Gradients in species composition, species richness and community structure of bryophyte assemblages followed closely the VPD variability. The average daily mean VPD was a much better predictor of species composition than average daily maximum VPD. The mean VPD also explained significantly more variation in species composition and richness than maximum temperature, indicating that time-averaged evaporative stress is more relevant for bryophyte communities than microclimatic extremes. While mesic forest bryophytes occurred along the whole VPD gradient, species occurring near their distributional limits and locally rare species preferred sites with low VPD. Consequently, low VPD sites represent species-rich microclimatic refugia within the landscape, where regionally abundant mesic forest bryophytes coexist with rare species occurring near their distributional range limits.
Our results showed that VPD variability at ecologically crucial landscape scales is controlled by temperature-driven saturated vapor pressure. Future climate warming will thus increase evaporative stress and reshuffle VPD-sensitive forest bryophyte communities even in topographically diverse landscapes, which are traditionally considered as microclimatic refugia buffered against climate change. Bryophyte species occurring near their distributional range limits in microclimatic refugia with low VPD will be especially vulnerable to the future changes in atmospheric VPD.
- Article
(6820 KB) - Full-text XML
- BibTeX
- EndNote


Vapor pressure deficit (VPD) expresses atmospheric water demand as the difference between the amount of water vapor the air can hold at a given temperature and the actual amount of water vapor present in the air. Unlike relative air humidity, VPD accurately expresses plant evaporative stress (Campbell and Norman, 1998). Since air capacity to hold water vapor increases exponentially with temperature, the same relative humidity at different temperatures indicates very different atmospheric moisture conditions (Anderson, 1936). An atmosphere with the same relative air humidity may be very “dry” (when the temperature is high) or it may be very “wet” (when the temperature is low). Relative air humidity therefore does not indicate the atmospheric moisture condition in physiologically meaningful way, despite its popularity in ecological studies (Campbell and Norman, 1998). In contrast, VPD directly expresses the atmospheric moisture conditions in terms of plant evaporative stress (Anderson, 1936).
Atmospheric VPD is a key driver of plant functioning in terrestrial ecosystems (Ruehr et al., 2014; Grossiord et al., 2020), because higher VPD leads to reduced photosynthesis in the short term and drought-induced mortality in the long term (McDowell et al., 2008; Fu et al., 2022). Ongoing climate changes exacerbate VPD-driven evaporative stress because higher temperatures lead to an exponential increase in VPD (Lawrence, 2005; Grossiord et al., 2020). Increasing VPD already limits global vegetation productivity (Yuan et al., 2019; López et al., 2021; Lu et al., 2022) and triggers large-scale forest diebacks (Breshears et al., 2013; Eamus et al., 2013; Williams et al., 2013). Yet, in contrast to the widely recognized role of VPD in local plant physiology and global vegetation functioning, VPD effects on plant community assembly are largely unknown (Novick et al., 2024).
The knowledge about VPD effects on plant communities and the processes that control VPD variability over the landscape are crucial for more realistic predictions of climate change impacts on vegetation and the identification of microclimatic refugia (Ashcroft and Gollan, 2013; Davis et al., 2019; Finocchiaro et al., 2024; Ogée et al., 2024). Because VPD is a difference between saturated vapor pressure (Psat) and actual vapor pressure (Pair), VPD variability reflects the interplay between spatial patterns in saturated and actual vapor pressures. While saturated vapor pressure is solely an exponential function of air temperature, actual vapor pressure is influenced by many processes operating at different spatial scales – ranging from regional atmospheric circulation and precipitation to local evaporation and plant transpiration (Campbell and Norman, 1998). Yet, despite increasingly recognized VPD importance, it is still unknown how these contrasting processes integrate into the VPD variability over the landscape.
A deeper understanding of the mechanisms behind landscape-scale VPD variability is particularly important for climate change biology. Scientists predict a temperature increase of up to 4.4 °C by 2100 (IPCC, 2023), which would lead to a more than 40 % increase in VPD for the same atmospheric water vapor content (Will et al., 2013). These changes can also modify VPD variability over the landscape, potentially shift the distribution of individual species and therefore alter the composition of plant communities. However, VPD effects on plant distribution and community assembly over the landscape are not sufficiently known.
Among plants, bryophytes are exceptionally sensitive to evaporative stress because they lack roots, lignified water-conducting system, water storage tissues, and active stomata and have a large surface area in proportion to biomass (Rice et al., 2001; Goffinet and Shaw, 2009). When exposed to the air with non-zero VPD, bryophytes therefore inevitably lose water (Hinshiri and Proctor, 1971; Busby and Whitfield, 1978). Because bryophytes transport water only passively, mainly through external capillary spaces between tiny parts of their body (Schofield, 1981), their internal water content is a function of the water availability in the surrounding environment (Vanderpoorten and Goffinet, 2009). Once the external water evaporates, bryophyte cells rapidly lose turgor, metabolic activity slows down, and carbon fixation decreases.
To cope with this evaporative stress, bryophytes developed an evolutionary and ecologically unique desiccation strategy, allowing them to survive drought episodes in a desiccated state (Proctor, 2000, 2001). Despite this ability to survive microclimatic extremes, bryophyte assemblages are potentially sensitive to evaporative stress, because desiccation tolerance widely differs among bryophyte species (Hinshiri and Proctor, 1971; Wagner and Titus, 1984; Oliver et al., 2000; Proctor et al., 2007a, b). Therefore, it can be assumed that the atmospheric VPD – an ecologically meaningful variable expressing evaporative stress – will strongly affect composition, richness and structure of bryophyte assemblages. Yet surprisingly little is known about the VPD effect on bryophyte assemblages in temperate forests (Fenton and Frego, 2005).
To provide this missing knowledge, we combined detailed in-situ forest microclimate measurements with simultaneous bryophyte inventories conducted across topographically diverse landscape representing bryophyte diversity hotspot in central Europe. Using these data, we explored how landscape-scale VPD variability affects bryophyte community composition and species richness in temperate forests, quantified VPD variability over the topographically diverse landscape, and identified which processes drive this variability.
2.1 Study area
We recorded bryophytes and measured microclimate in the Bohemian Switzerland National Park in the Czech Republic (Fig. 1). The rugged terrain of this sandstone landscape creates a fine-scale mosaic of contrasting habitats with steep microclimatic gradients over short distances (Wild et al., 2013). The elevation within the national park ranges from 125 to 619 m, and the mean elevation is 340 m. According to the data from the Tokáň weather station (Fig. 1), the mean annual air temperature during the 2011–2019 period was 8.3 °C, and the mean annual precipitation was 765 mm.
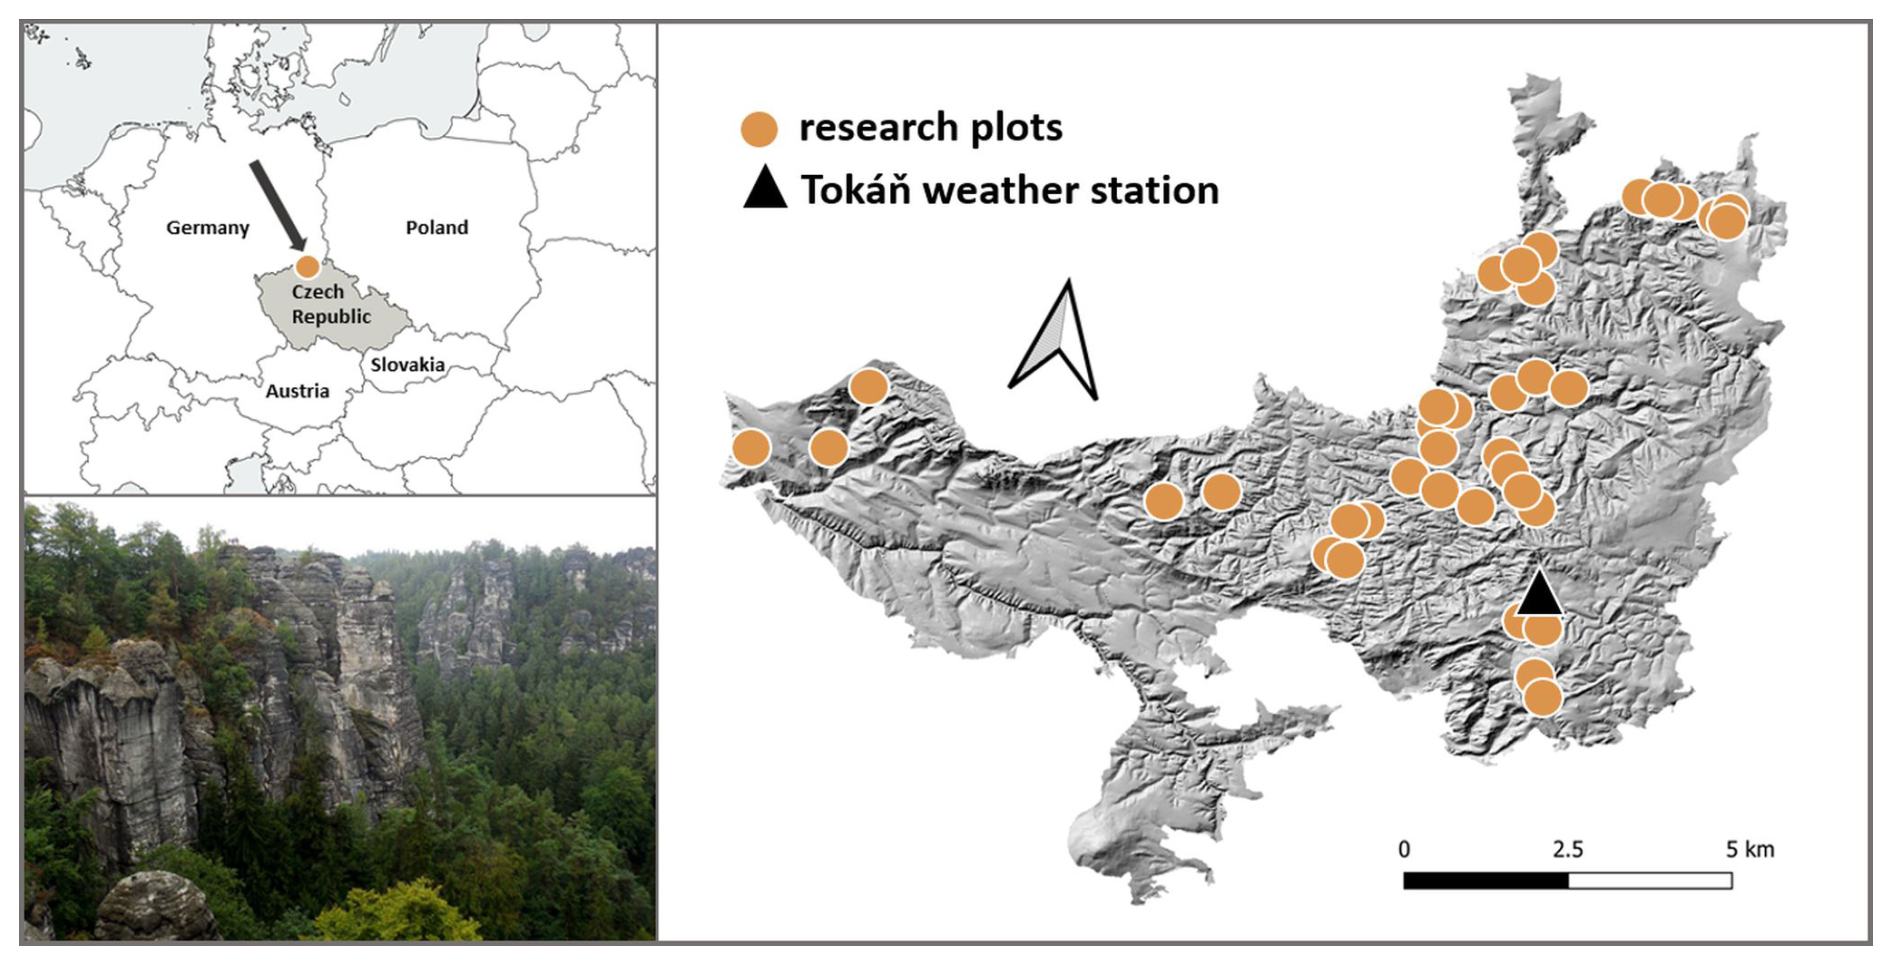
Figure 1We measured microclimate and simultaneously recorded bryophyte species composition at 38 permanent research plots within the Bohemian Switzerland National Park in Central Europe. This forested area has rugged terrain creating steep environmental gradients over short distances.
Most of the Bohemian Switzerland is covered with coniferous forests. Norway spruce (Picea abies) planted mostly during the 19th and 20th century dominates in the valleys and on the plateaus, while patches of semi-natural forests are dominated either by Scots pine (Pinus sylvestris) on the upper slopes and rocky ridges or by European beech (Fagus sylvatica) on more mesic sites.
The nutrient-poor and strongly acidic soils result in a relatively low diversity of vascular plants, which contrasts with the exceptionally rich bryophyte flora (Härtel et al., 2007). The Bohemian Switzerland currently hosts more than 300 bryophyte species and therefore represents a hotspot of bryophyte diversity in Central Europe (Marková, 2008).
The bryophyte flora of the Bohemian Switzerland is dominated by forest species like Tetraphis pellucida, Bazzania trilobata, and Dicranum scoparium. These dominant floristic elements are enriched by disjunct occurrences of (sub)alpine or (sub)montane (e.g., Hygrobiella laxifolia, Geocalyx graveolens, Anastrophyllum michauxii), boreal (e.g., Dicranum majus, Rhytidiadelphus subpinnatus), and (sub)oceanic (e.g., Tetrodontium brownianum, Plagiothecium undulatum) species (Härtel et al., 2007; Marková, 2008).
2.2 Field data collection
We recorded bryophyte species composition and measured microclimate on 38 permanent plots within the Bohemian Switzerland National Park (Fig. 1). These plots were selected through stratified-random sampling to capture the main microclimatic gradients within the core zone of the national park. Specifically, using GIS and LiDAR-based digital terrain model, we first divided the study area into geographical strata defined by the terrain (valley bottoms, lower slopes, upper slopes, and ridges) and further separated the slopes with predominantly northern and southern orientation. Within each stratum, we randomly selected an equal number of locations separated by at least 50 m. In the field, we navigated to the selected location with GPS device and placed the center of plot 1.5 m to the north from the nearest tree.
Within each permanent plot, we installed HOBO U23 ProV2 (Onset, USA) microclimatic datalogger at 1.5 m height on the north side of a tree nearest to the plot center. Each HOBO datalogger was protected by a white radiation shield with good ventilation and measured air temperature (resolution 0.02 °C, accuracy ± 0.21 °C) and relative humidity (resolution 0.05 %, accuracy ± 2.5 %) every 30 min from 1 June to 31 August 2022.
Simultaneously with microclimate measurements, we recorded the presence of all bryophyte species in each research plot following the nomenclature of the Czech national checklist (Kučera et al., 2012). We deliberately sampled bryophytes in a relatively small circular plot with 1 m radius (3.14 m2) without any exposed rocks or big stones to reduce the possible effects of within-plot environmental heterogeneity (Rambo and Muir, 1998; Vanderpoorten and Engels, 2002; Schmalholz and Hylander, 2011).
2.3 Microclimate data processing
First, we checked the microclimatic time series visually and then with standard automated procedures implemented in the myClim R package (Man et al., 2023). Air humidity measurement with microclimatic loggers is sensitive to water condensation, resulting in unrealistically high measurements for prolong periods of time (Ashcroft and Gollan, 2013; Feld et al., 2013). We therefore carefully checked microclimatic time series and found no signs of the condensation effect.
Using checked air temperature and relative humidity data, we first calculated the saturated vapor pressure (Psat) following the updated Buck formula (Buck, 1981, 1996):
where t is air temperature [°C].
Then, we calculated the actual vapor pressure (Pair) using the Tetens's formula (Tetens, 1930):
where rh is relative humidity [%].
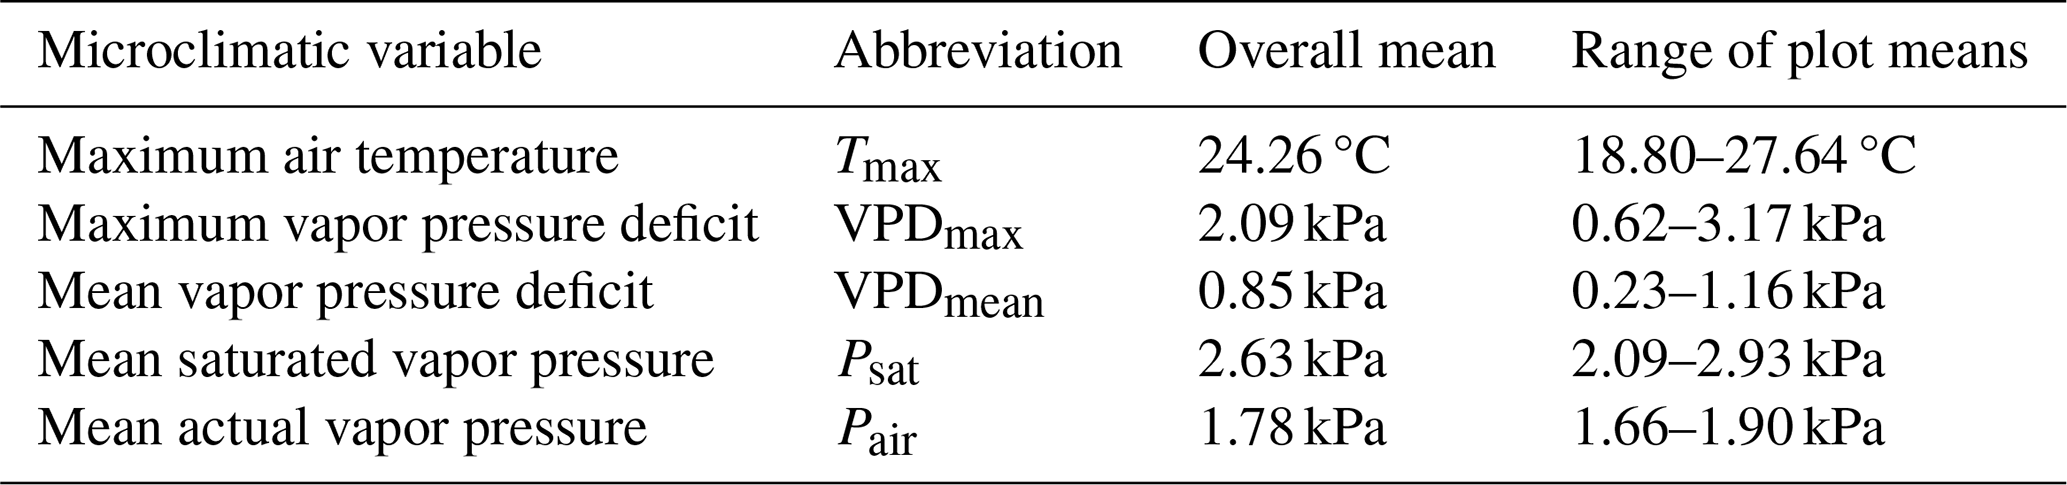
Finally, we calculated atmospheric VPD as the difference between Psat and Pair (Jones, 2014). Using the resulting microclimatic time series, we calculated three variables representing evaporative stress (Table 1). First, we calculated the average daily maximum temperature (Tmax). While Tmax is ecologically less meaningful proxy for evaporative stress than atmospheric VPD (Campbell and Norman, 1998; Eamus et al., 2013), several previous studies identified Tmax as highly relevant microclimatic variable linked to evaporative stress and affecting species composition and richness of forest vascular plants and bryophytes within the central Europe (Macek et al., 2019; Man et al., 2022). Then, we calculated two variables capturing different aspects of VPD driven evaporative stress. First, we calculated the average daily maximum VPD (VPDmax), which represents site-specific microclimatic extremes (Ashcroft and Gollan, 2013). Second, we calculated the average daily mean VPD, which represents time-aggregated evaporative demand experienced by bryophytes on each site.
To disentangle the drivers of spatio-temporal VPD variability over the landscape, we calculated also plot-specific daily average values of Psat and Pair (Table 1).
Table 1Overview of microclimatic variables representing evaporative stress (Tmax, VPDmax, VPDmean) and its components (Psat, Pair). For each variable, we provide the overall mean and range of plot-specific averaged daily values measured continually during summer 2022 on 38 forest research plots in the Bohemian Switzerland National Park, Czech Republic.
2.4 Data analysis
2.4.1 Bryophyte community composition, richness and structure
In our analysis, we focused on the relationship between microclimatic variables representing evaporative stress and bryophyte community composition, structure, and richness. First, we identified the main gradients in community composition and explored their relationship with variables representing evaporative stress. Then, to explore which variable representing evaporative stress is more closely associated with bryophyte community composition and richness, we calculated the variability in species composition and richness explained by the mean and maximum atmospheric VPD and maximum air temperature. Further, to disentangle the effects of atmospheric VPD from the effects of the maximum temperature, we partition the explained variability into independent and shared fractions. Finally, we tested the link between VPD and bryophyte community structure through nestedness analysis.
To explore the main gradients in the bryophyte community composition, we used non-metric multidimensional scaling (NMDS) to extract the main patterns in bryophyte community composition expressed with the Sørensen dissimilarity index. We calculated two-dimensional NMDS with the weak treatment of ties, a maximum of 500 random starts, and 999 iterations in each NMDS run using metaMDS function from the vegan R package version 2.6-4 (Oksanen et al., 2022). To maximize variance along the first ordination axis, we centered and rotated the resulting two-dimensional configuration with principal component analysis.
To explore how main compositional gradients correlate with microclimate variables representing evaporative stress, we passively projected vectors of maximum and mean VPD, and maximum temperature into the NMDS ordination space and tested the significance of the fit with 999 random permutations using the envfit function from vegan R package (Oksanen et al., 2022). Finally, we projected bryophyte species richness gradients into the NMDS ordination space using a generalized additive model (GAM) fitted through ordisurf function from vegan R package (Oksanen et al., 2022).To quantify the relationship between the microclimatic variables representing evaporative stress and species richness expressed as a number of bryophyte species recorded in the plot, we used GAM fitted with the R package mgcv 1.9.1 (Wood, 2011). We used GAM with Poisson distribution, log link function, and smooth terms fitted by thin plate regression splines without null space penalization and smoothing parameter estimation using restricted maximum likelihood. To assess the statistical significance, we used a χ2 test comparing the fitted model to the only intercept null model.
To calculate the proportion of variability in bryophyte community composition explained by microclimatic variables representing evaporative stress, we used distance-based redundancy analysis (db-RDA) calculated on the same Sørensen dissimilarity matrix as used for NMDS (McArdle and Anderson, 2001). We calculated the db-RDA with dbrda function from vegan R package (Oksanen et al., 2022) and assess the statistical significance using 999 random permutations of the raw data (Legendre et al., 2011).
As all three microclimatic variables representing evaporative stress were correlated (Appendix A), we explored their shared and independent effects on bryophyte community composition and richness through variation partitioning (Legendre, 2008). Because VPDmax and Tmax were almost identical (Pearson r=0.98), we disentangled shared and independent effects of substantially less correlated VPDmean and Tmax (Pearson r=0.78). To quantify their independent and shared effects, we partitioned the variation in bryophyte community composition explained by atmospheric VPDmean and Tmax using adjusted R2 (Peres-Neto et al., 2006) calculated with the varpart function from the vegan R package (Oksanen et al., 2022).
To quantify the shared and independent effects of atmospheric VPDmean and Tmax on species richness, we partitioned the deviance explained in GAM models. First, we related species richness to atmospheric VPDmean and Tmax in the full GAM, when both variables were used simultaneously as predictors. Then, we fitted two partial GAMs (first with VPDmean, second with Tmax as explanatory variables). To prevent different smoothing parameters in the partial models, we extracted smoothing parameters from the full GAM and used them in both partial GAMs (Hjort et al., 2012). To assess the statistical significance, we compared each model against the null model with only intercept using a χ2 test. To assesses the significance of the independent effects of atmospheric VPD and Tmax, we compared partial GAMs with the full GAM using χ2 test.
Finally, we used nestedness analyses (Ulrich et al., 2009) to test the VPD effects on bryophyte community structure. To directly test the two hypotheses about the bryophyte community structure along the VPD gradient, we first order the community matrix along the gradient of increasing plot-specific VPDmean. To test the first hypothesis that the bryophyte communities from sites with high VPD are nested subsets of bryophyte communities from sites with low VPD, we used NODFsites metric (Almeida-Neto et al., 2008). To test the second hypothesis that more frequent bryophyte species occur along the whole VPD gradient, but less frequent species are concentrated on sites with low VPD, we used NODFspecies metric (Almeida-Neto et al., 2008). To calculate both NODF metrics, we used nestednodf function from the vegan R package (Oksanen et al., 2022).
We used a null model approach to assess the statistical significance of nestedness patterns (Ulrich et al., 2009). Specifically, we compared the observed NODF values to the distribution of 999 NODF values calculated through the conservative R1 null model, which maintains species richness of the site and uses species frequencies as probabilities of selecting species (Wright et al., 1997). To quantify the difference between the observed NODF values and the NODF values generated by the R1 null model, we calculated the standardized effect size (SES) expressing the number of standard deviations that the observed NODF value differs from the mean NODF value of the simulated assemblages (Ulrich et al., 2009). To construct the null models and to calculate SES, we used the oecosimu function from the vegan R package (Oksanen et al., 2022).
We used R version 4.4.0 (R Core Team, 2024) for complete data analysis and figure preparation. For the color-blind safe visualisations we used the R package scico 1.5.0 (Pedersen and Crameri, 2023).
2.4.2 VPD variability across the landscape
Using the time-series of both VPD components (Psat and Pair), we explored their spatio-temporal variability and quantify their influence on the VPD variability over the landscape. First, we explored how variable was VPD and both its components over the landscape in a daily timesteps. Then, we averaged this daily variability into the overall measure of spatial variability in VPD, Psat, and Pair during the whole study period. Finally, we used variation partitioning to quantify how much was VPD variability controlled by Psat and Pair.
To quantify spatial variability in daily VPD and both its components (Psat and Pair) over the landscape, we calculated the standard deviation (SD) of the plot-specific daily mean VPD, Psat and Pair values among all study plots. In this first step, we calculated SD of these microclimatic variables for every day within the study period separately. Then we averaged these daily inter-plot SD values separately for VPD, Psat and Pair into an overall measure of spatial variability for each microclimatic variable during the whole study period.
Finally, to disentangle the contribution of Psat and Pair to the VPD variability over the landscape, we performed variation partitioning based on a multiple linear regression model and adjusted R2 (Legendre, 2008) with the plot-specific mean VPD as the response variable and the mean Psat and Pair as the predictors.
3.1 Bryophyte community composition, richness and structure
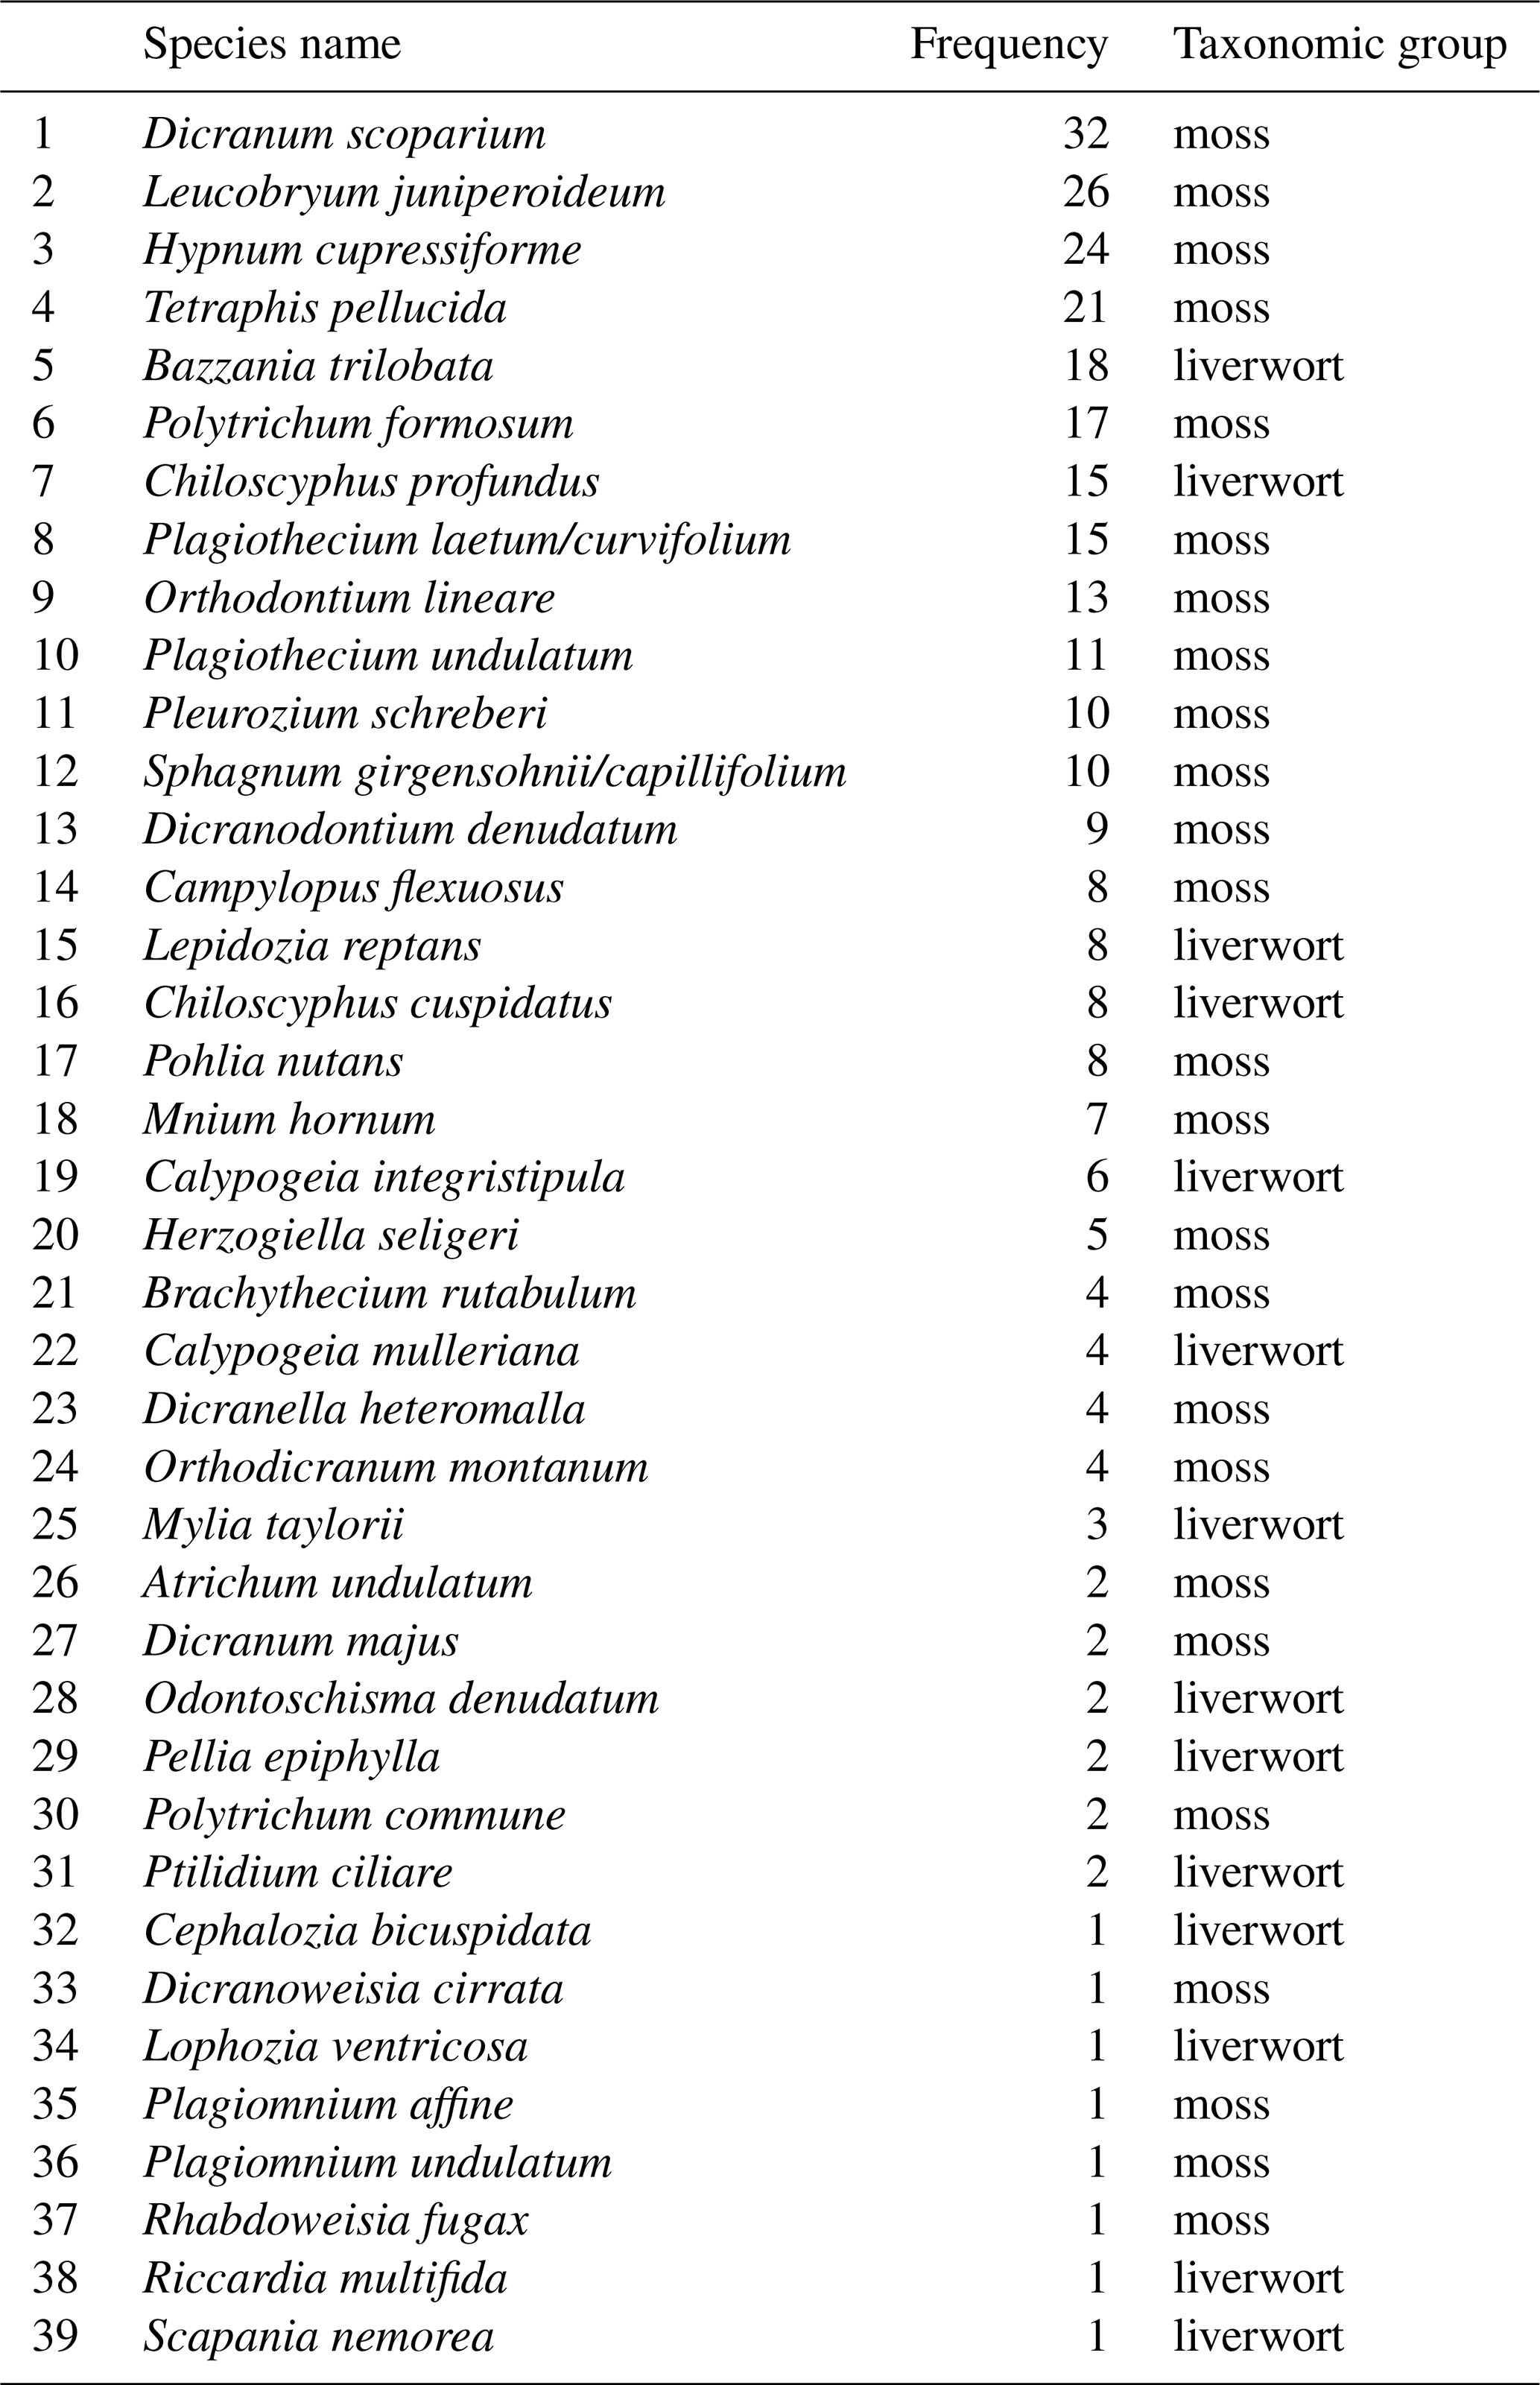
In total, we recorded 39 bryophyte species: 14 liverworts and 25 mosses (Appendix C, Table C1). The species richness was highly variable among the plots – while the average number of species per plot was 8, the minimum was 1 and the maximum 21. The most frequent species were Dicranum scoparium (n=32), Leucobryum juniperoideum (n=26) and Hypnum cupressiforme (n=24).
Main patterns in community composition and species richness reflected the gradient of evaporative stress (Fig. 2). Gradient in Tmax was highly correlated to the gradients in VPD (Fig. 2), but main patterns in community composition were less related to Tmax than to VPD (vegan::envfit – Tmax: R2 = 0.32, p = 0.003; vegan::envfit − VPDmean: R2=0.52, p = 0.001; VPDmax: R2=0.37, p=0.001).
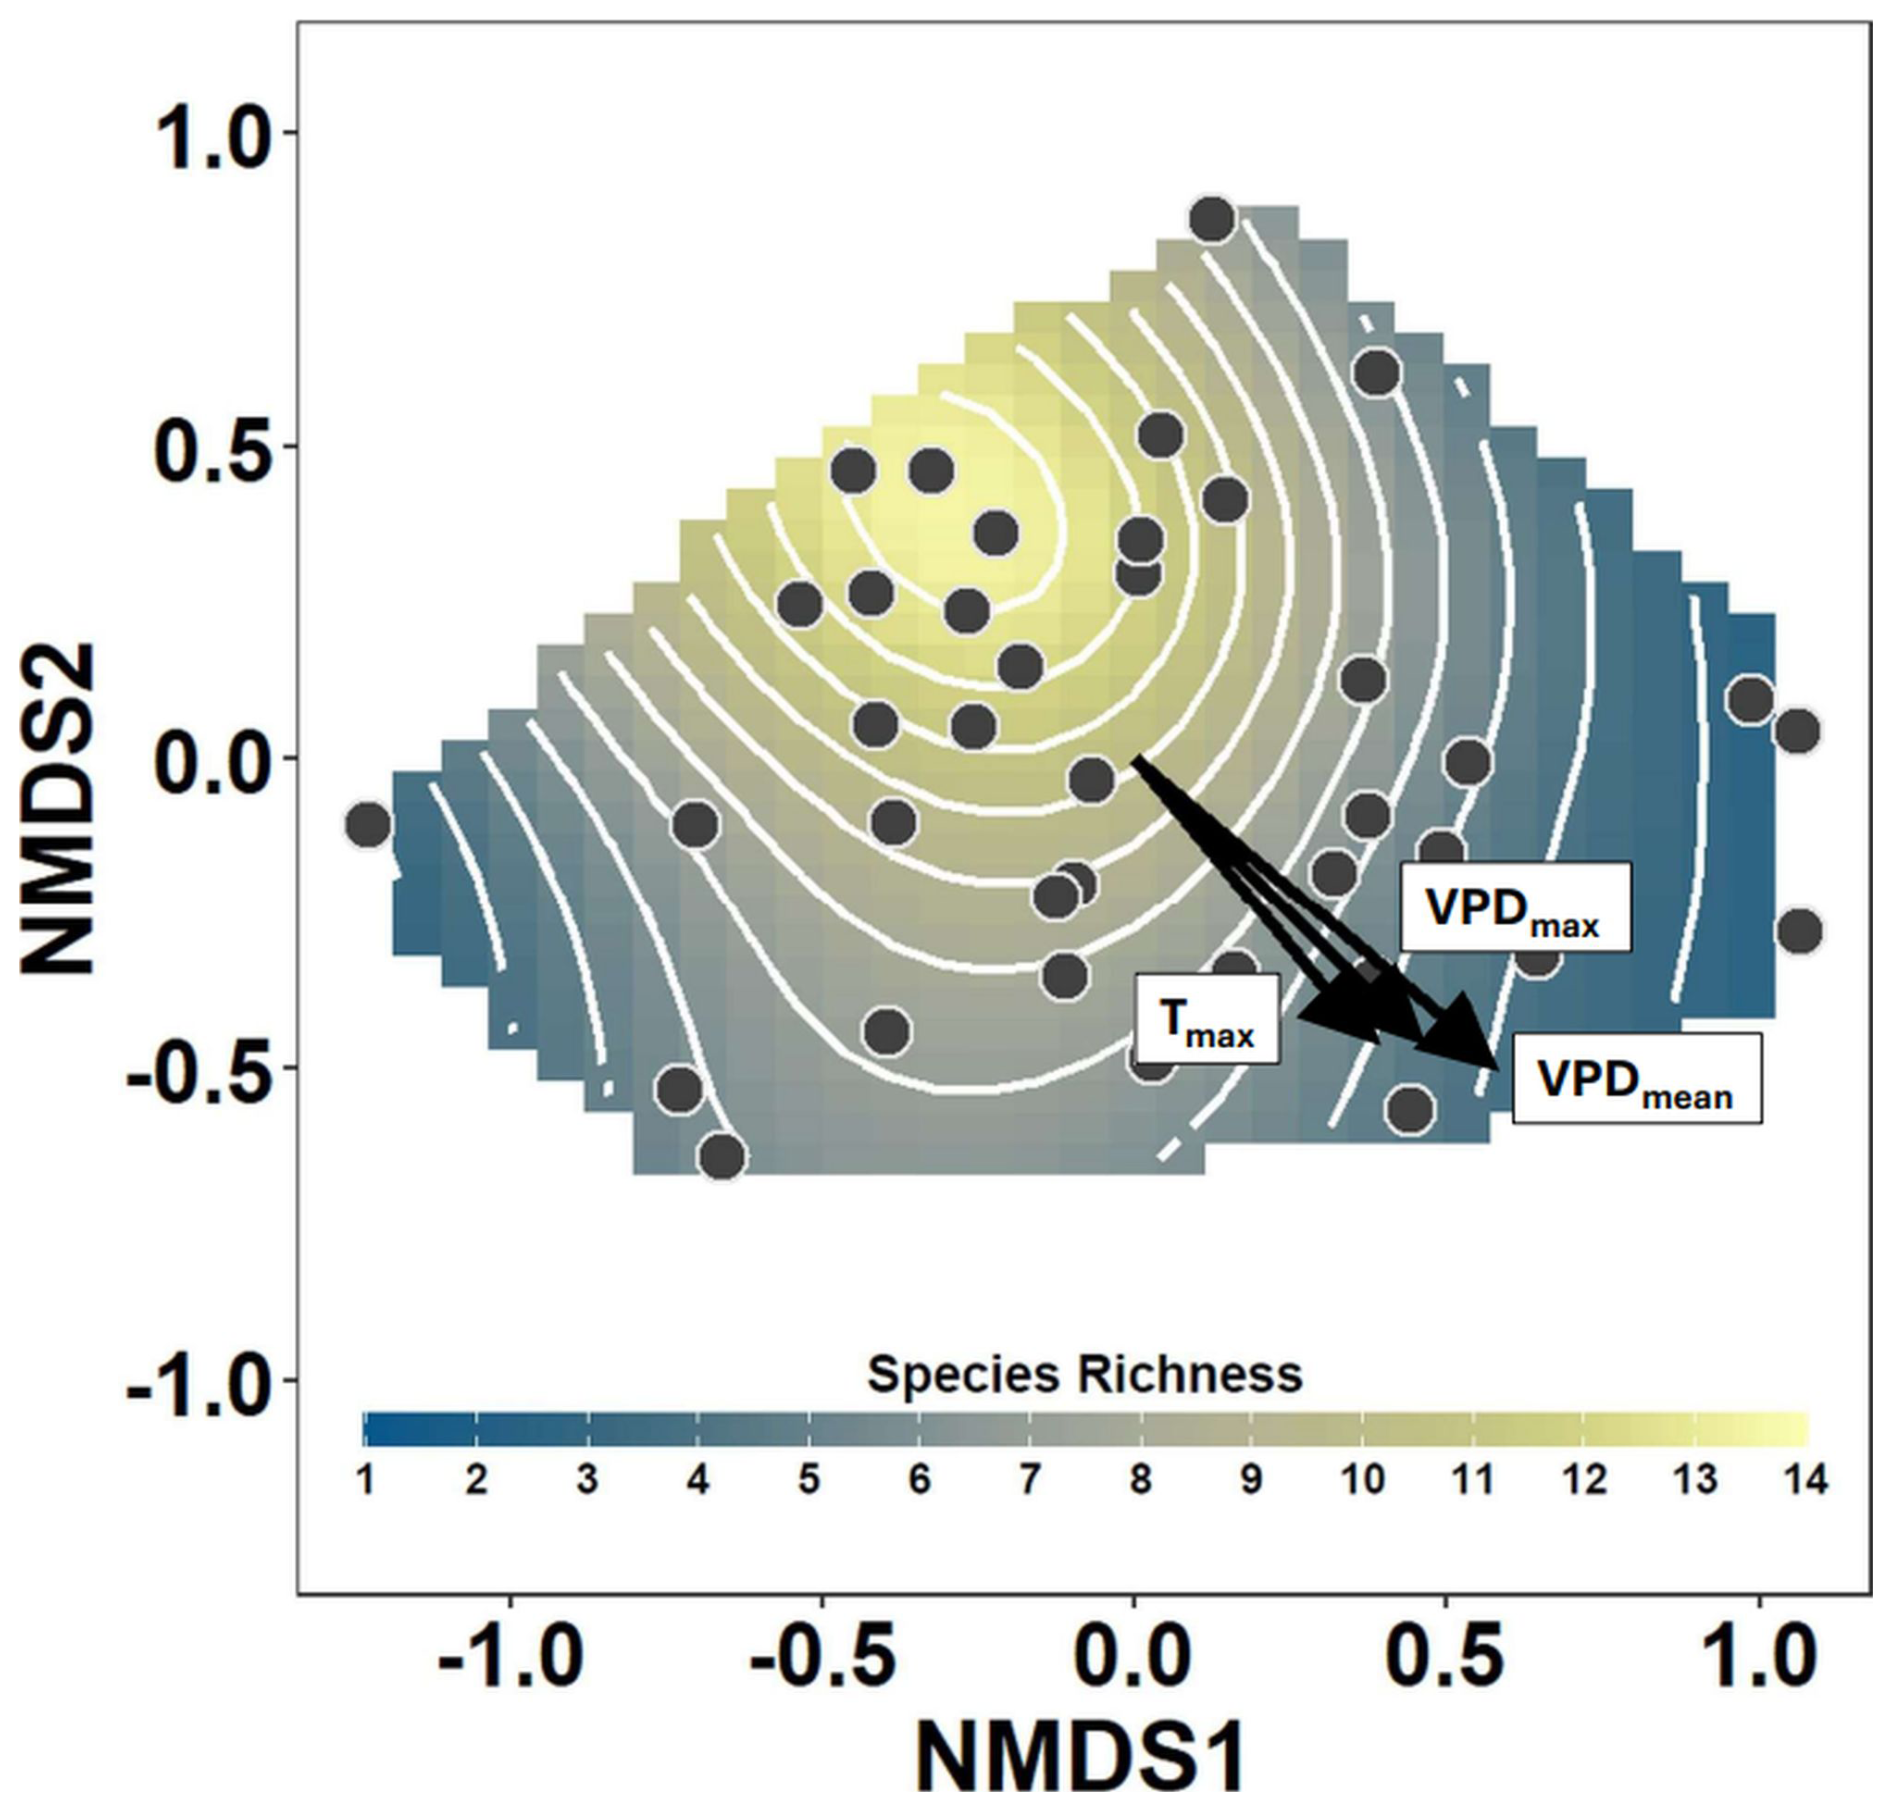
Figure 2Nonmetric multidimensional scaling (NMDS) of the bryophyte community composition showing main gradients in bryophyte assemblages sampled at 38 temperate forest plots. Points show the positions of the individual plots within the NMDS ordination space, and the vectors show the gradients in the maximum air temperature (Tmax), maximum VPD (VPDmax) and mean VPD (VPDmean). The smooth surface and associated contours fitted into the NMDS ordination space with a generalized additive model show the pattern of decreasing species richness with increasing evaporative stress.
The number of bryophyte species was higher in plots with low VPD and declined with an increasing VPD (Fig. 2). Both atmospheric VPD and maximum temperature were significantly associated with species richness, but maximum temperature explained substantially less deviance (Table 2). The mean VPD explained slightly more deviance than the maximum VPD (Table 2).
Table 2Variation in community composition and species richness explained by three microclimatic variables representing evaporative stress. To quantify variation explained by each variable, we used distance-based redundancy analysis (db-RDA) for community composition and generalized additive models (GAM) for species richness.
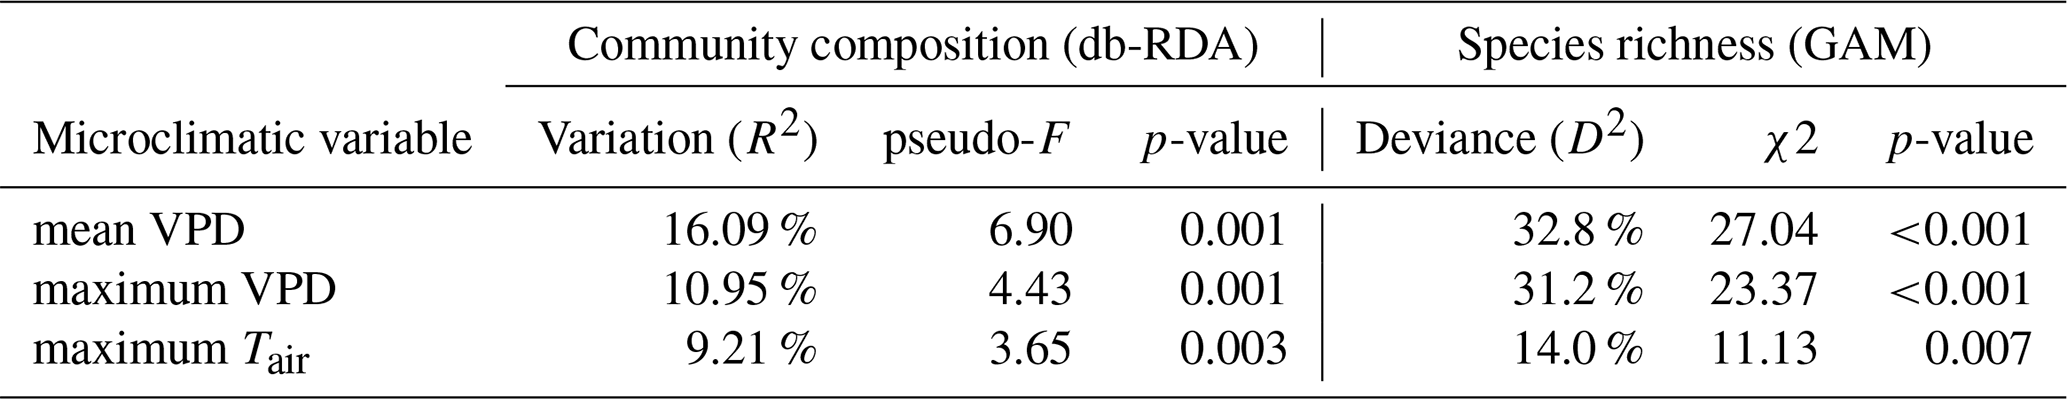
The mean VPD explained substantially more variation in species composition than the maximum VPD and the maximum temperature (Table 2). When used independently, both VPDmean and Tmax were significant predictors of bryophyte community composition (Table 2). However, the effect of Tmax almost completely overlaps with VPDmean (Fig. 3). When we controlled for the effect of mean VPD, maximum temperature did not explain significant part of variation in community composition (vegan::dbrda – adj. R2 = 0 %, p = 0.764) or in species richness (mgcv::gam – D2=3.72 %, p = 0.174). In contrast, the mean VPD explained a significant part of variation in species composition and richness even after the controlling for maximum temperature (vegan::dbrda − adj. R2 = 6 %, p = 0.003; mgcv::gam – D2=22 %, p = 0.001). Therefore, the mean VPD explained substantially more variation in bryophyte community composition and richness than maximum temperature and maximum temperature did not have any significant effects independent from the mean atmospheric VPD (Fig. 3).
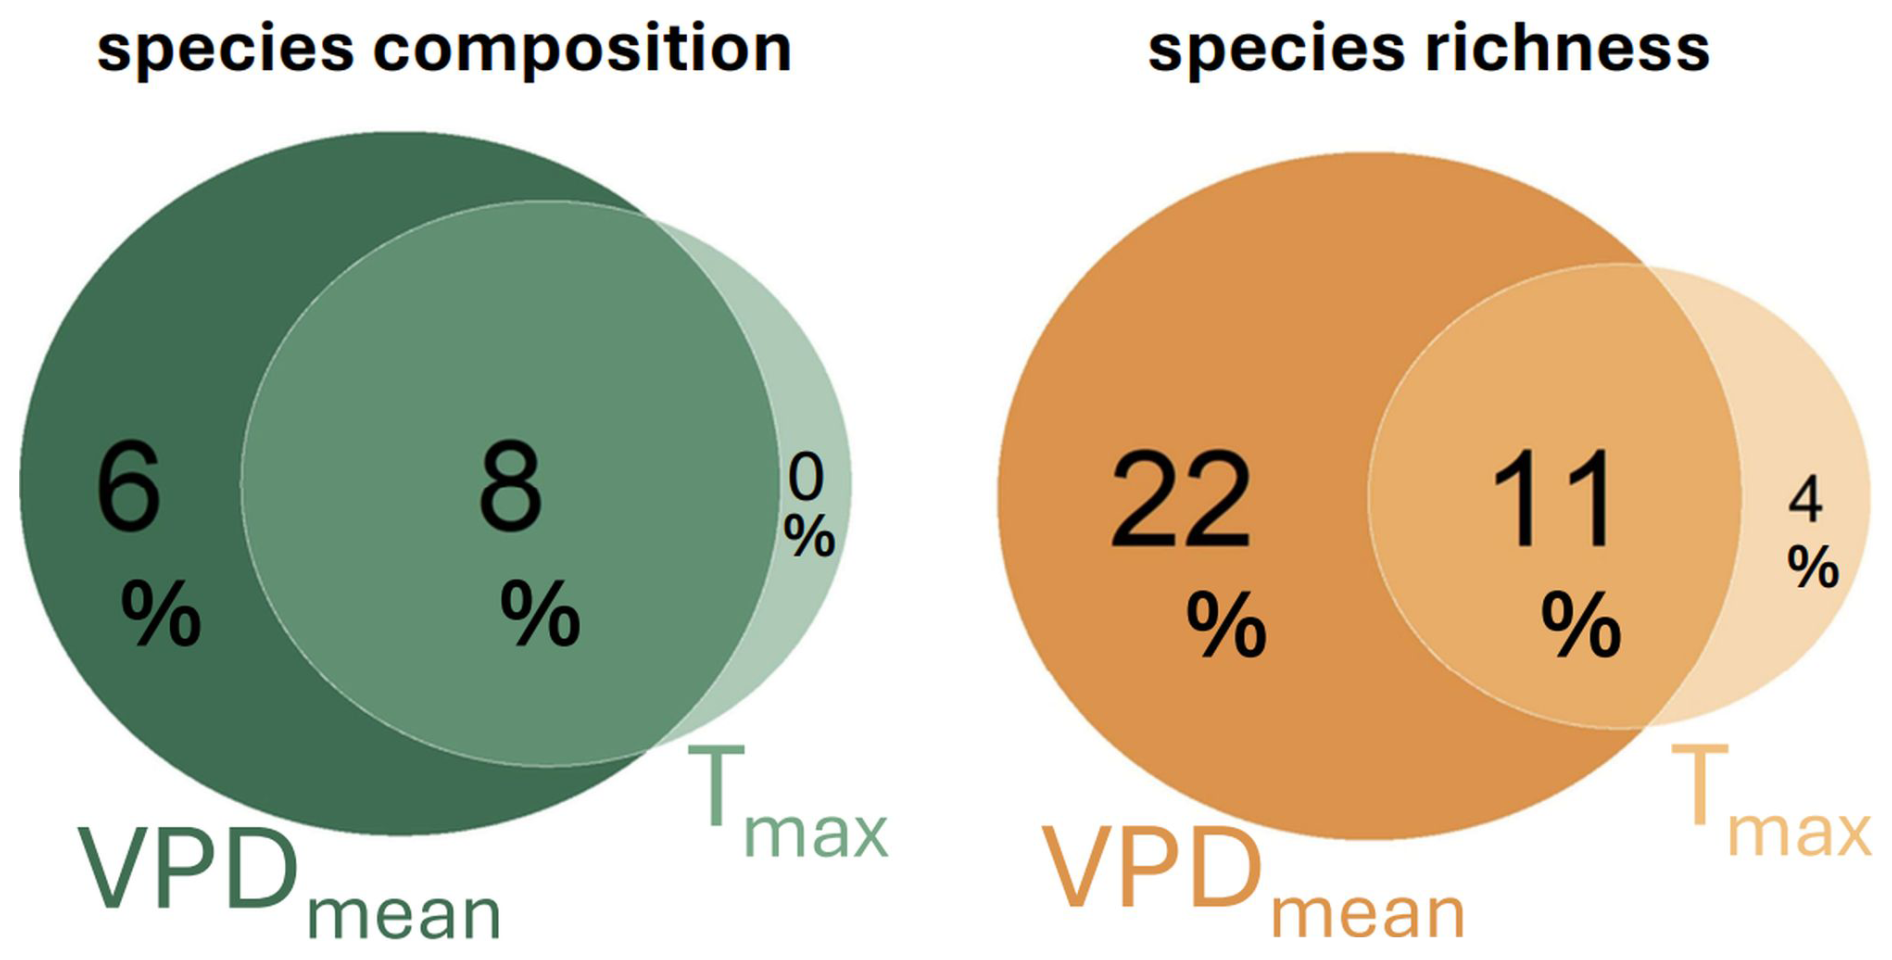
Figure 3Variation partitioning showing independent and shared effect of mean VPD (VPDmean) and maximum air temperature (Tmax) on bryophytes species composition and richness in 38 forest plots. Values represent adjusted R2 from distance-based redundancy analysis for species composition and explained deviance from a generalized additive model for species richness. While VPDmean has significant effects even after the controlling for Tmax both for species composition (p = 0.003) and richness (p <0.001), the unique effects Tmax were non-significant both for species composition (p = 0.764) and richness (p = 0.174).
Bryophyte community structure was closely related to the gradient of mean atmospheric VPD (Fig. 4). Bryophyte communities from plots with higher VPD were generally impoverished and compositionally nested subset of the communities from sites with lower VPD (vegan::oecosimu – NODFsites=39.17, SES = 4.26, p = 0.001). Moreover, while frequent species occurred along the whole VPD gradient, rare species occurred preferably on sites with low VPD (vegan::oecosimu – NODFspecies=29.97, SES = 3.34, p = 0.003).
At the species level, small liverworts (e.g. Riccardia multifida, Lophozia ventricosa) and hygrophilous bryophytes (e.g. Polytrichum commune, Bazzania trilobata), as well as species with boreal (e.g. Dicranum majus) and (sub)oceanic (e.g. Mylia taylorii, Plagiothecium undulatum) distribution preferred plots with low atmospheric VPD (Fig. 4). In contrast, regionally frequent species like Hypnum cupressiforme, Polytrichum formosum or Dicranum scoparium occurred also in plots with higher atmospheric VPD (Fig. 4).
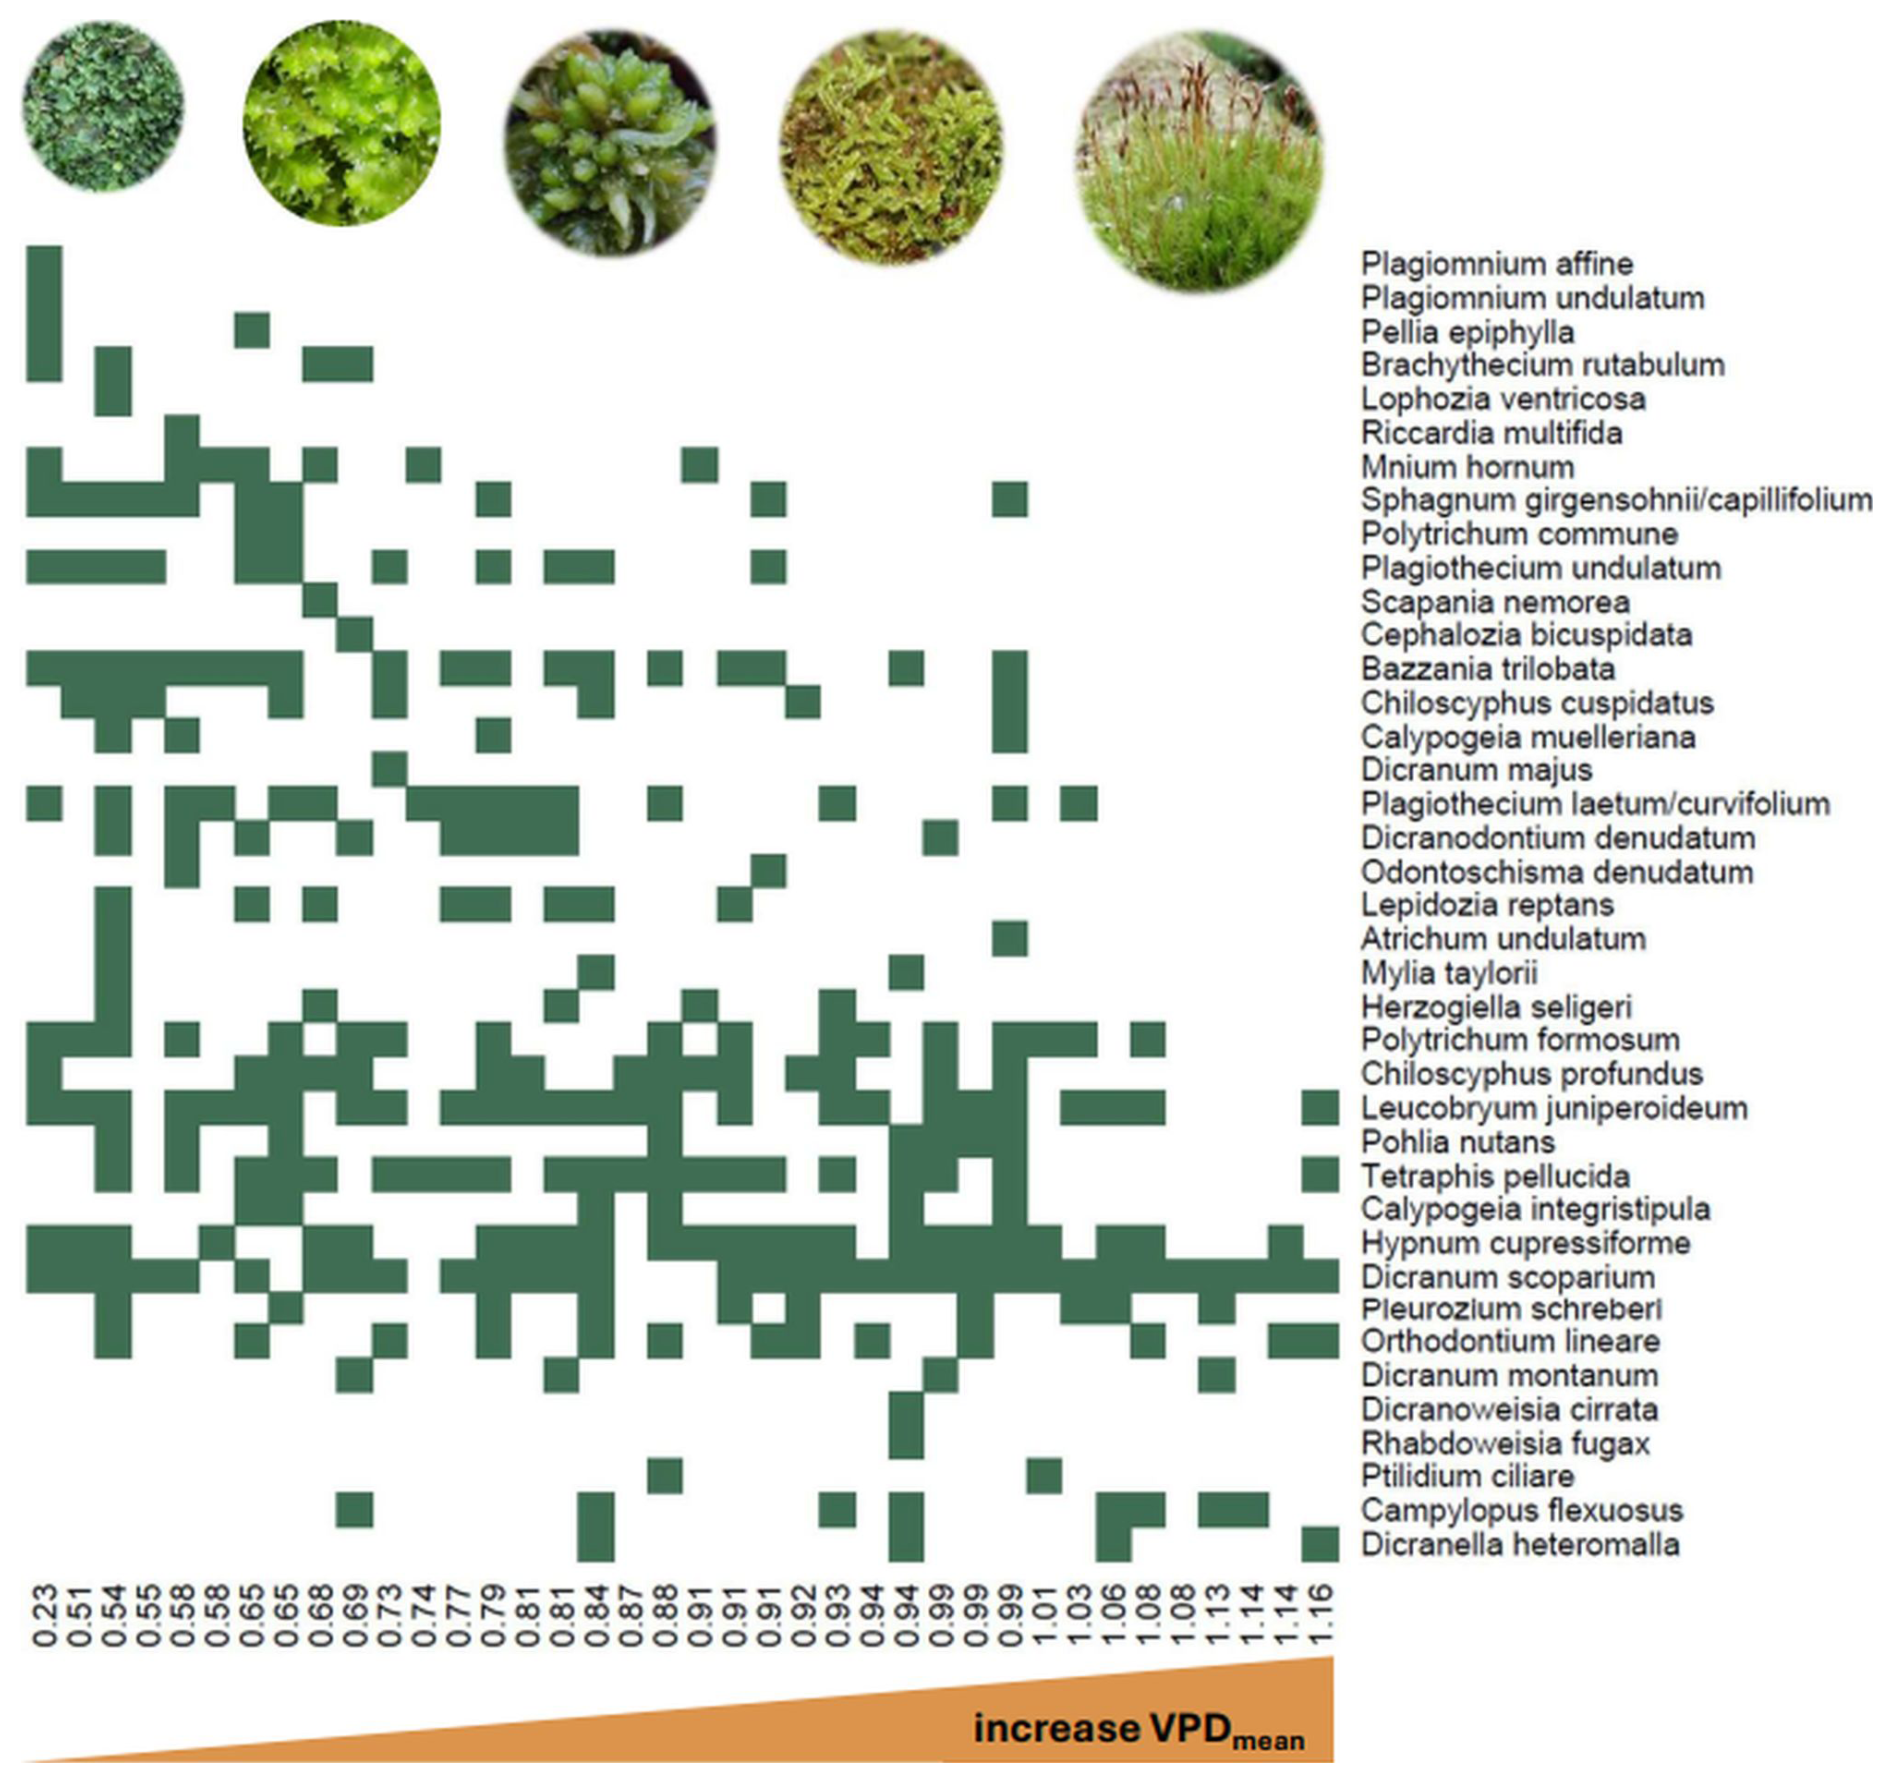
Figure 4Occurrences of all recorded bryophyte species along the gradient of the mean VPD measured at 38 forest plots. Plots are sorted from the lowest to highest mean VPD and each filled square shows the presence of the focal species within the plot. While rare and species near their distributional range limits prefer sites with low VPD, mesic forest species occur along the whole VPD gradient.
3.2 VPD variability across the landscape
VPD in the forest understory was highly variable across the landscape (Fig. 5). While the variability in saturated vapor pressure was comparable to the variability in VPD, actual vapor pressure was much less variable among the sites (Fig. 5). In average, the landscape-scale spatial variability of Psat (average daily SD = 0.20 kPa) was almost three times higher than the spatial variability of Pair (SD = 0.07 kPa).
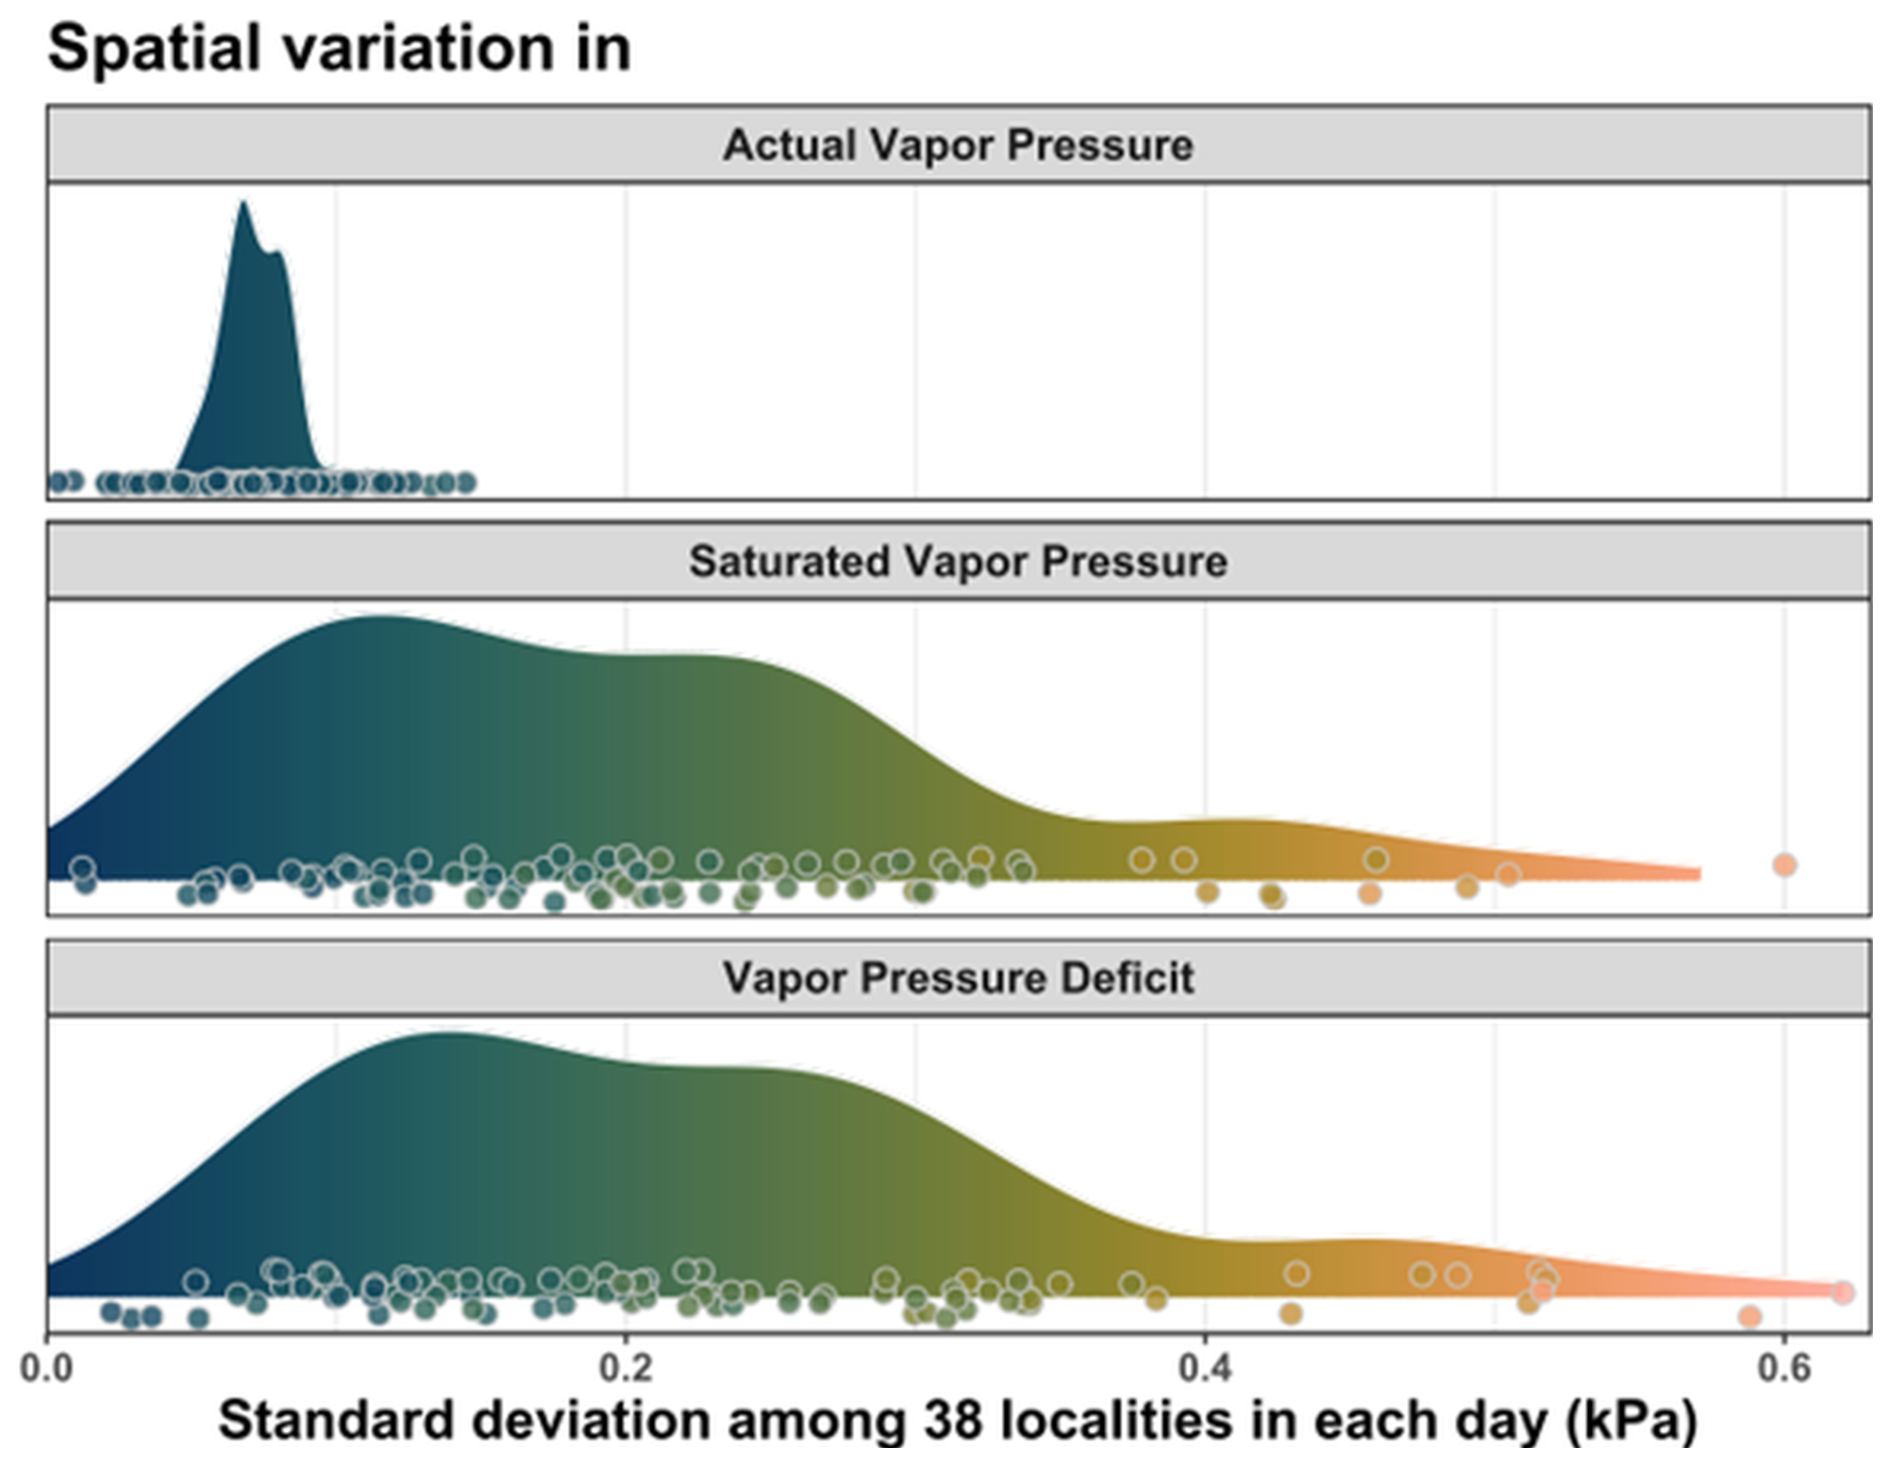
Figure 5Spatio-temporal variability of VPD and its components – saturated and actual atmospheric vapor pressures. Each data point shows the standard deviation of the plot-specific daily mean values simultaneously measured at 38 forest plots, and density plots summarize this spatio-temporal variability over the summer season. The individual data points were slightly jittered for better visibility.
The dominant driver of VPD variability across the landscape was temperature-driven saturated vapor pressure (Fig. 6). In a univariate linear regression model, Psat explained 93 % of VPD variability, while Pair explained 30 %. However, Psat and Pair were negatively correlated (Pearson ) and variation partitioning based on multiple regression model showed that the Pair uniquely explained only 7 % of variability in VPD (Fig. 6). Therefore, temperature-driven Psat was the dominant driver of VPD variability, while spatial variation in Pair contributed surprisingly little to the overall VPD variability across the landscape.
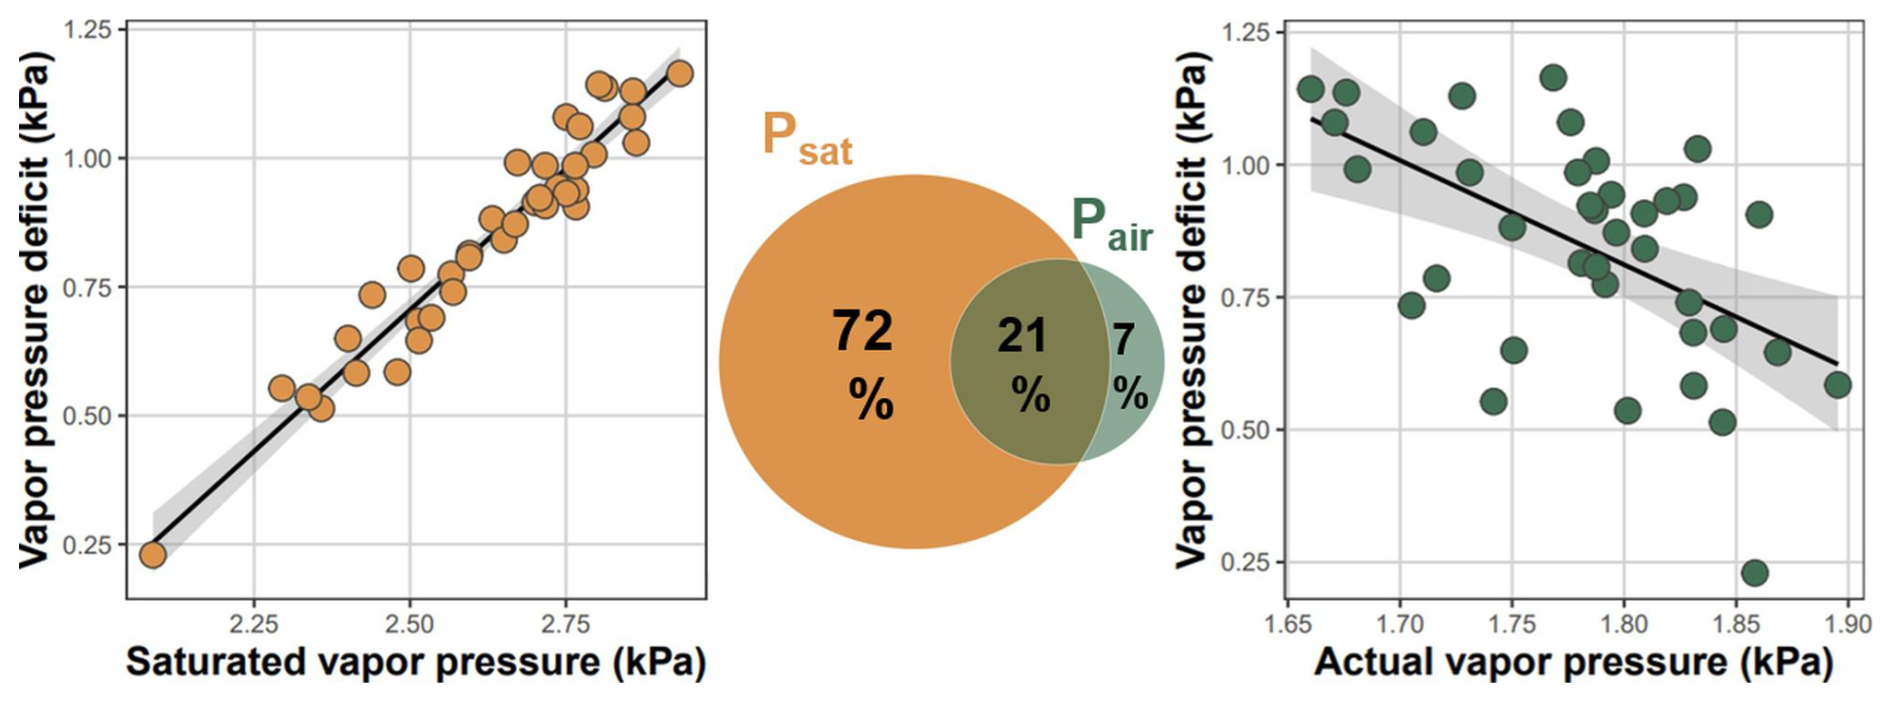
Figure 6Atmospheric vapor pressure deficit (VPD) was driven by temperature-dependent saturated vapor pressure, while actual vapor pressure was weakly related to local VPD. Each dot represents the mean VPD, and the mean saturated and actual vapor pressure measured during the summer at 38 forest plots established over topographically diverse landscape. Venn diagram shows variation (adjusted R2) in mean VPD explained solely by mean saturated (Psat) and mean actual (Pair) vapor pressure and the variation explained jointly by both predictors.
We found that community composition and richness of forest bryophytes was significantly affected by atmospheric VPD. Our findings have important implications both for theoretical and applied ecology. First, the variation in VPD over the landscape was largely controlled by air temperature. Therefore, air temperature and VPD are tightly coupled at biologically relevant scales, and their effects are hard to disentangle with observational data. Interestingly, this coupling was strongest between maximum VPD, and maximum temperature and maximum temperatures was previously identified as a key driver of bryophyte and vascular plant species distribution in temperate forests (Macek et al., 2019; Man et al., 2022). Unfortunately, these studies did not measure VPD. Considering our results, the importance of maximum temperature does not necessarily stem from its direct effects on plant ecophysiology, but more likely from strong temperature control of VPD variability over the landscape. Nevertheless, this new hypothesis needs further testing.
Interestingly, we also found that mean VPD was a much better predictor of bryophyte community composition and richness than maximum VPD or maximum temperature. At the same time, maximum temperature did not explain any additional variation in species composition and richness not explained by mean VPD. Our results thus provide strong evidence that the mean VPD is more relevant predictor of bryophyte community composition and richness than maximum temperature or maximum VPD. The unique effects of mean VPD, not reflected by the maximum temperature or maximum VPD, suggest that bryophyte communities are more sensitive to the long-term characteristics of site microclimatic conditions, rather than to short-term microclimatic extremes captured by maxima.
Second, our results showing that actual vapor pressure is relatively constant across the landscape imply that it is possible to estimate VPD from local microclimate air temperature measurements combined with non-local measurements of air relative humidity, for example from a nearby weather station. While the general applicability of this approach should be further tested across spatial scales (Dahlberg et al., 2020), in various environmental settings and different vegetation types, our findings suggest that local VPD can be reasonably estimated (Appendix B, Fig. B1). This finding thus opens exciting possibilities for further research as local temperature measurements are increasingly available all over the world (Lembrechts et al., 2020). However, it should be stressed that this approach generates VPD estimates which provide reasonable ranking of the sites along the VPD gradient, but generally overestimate the VPD (Appendix B, Fig. B1), likely because it does not account for locally higher actual vapor pressure, for example near springs, water bodies or on permanently waterlogged soils.
4.1 VPD variability across the landscape
Large spatial variability in atmospheric VPD structured forest bryophyte communities across the landscape. Interestingly, VPD variation was driven by temperature-controlled Psat, while Pair was relatively constant across the landscape. This finding is important, as the actual vapor pressure should also be variable across the landscape (Ogeé et al., 2024; Johnston et al., 2025). However, our findings suggest that the local and spatially highly heterogeneous processes like evaporation from soil and water surfaces and plant transpiration contribute little to the landscape-scale variation in VPD, even in the topographically diverse landscape with steep microclimatic gradients.
While maximum VPD was solely driven by saturated vapor pressure and therefore maximum temperature, the mean VPD was more affected by actual vapor pressure. However, saturated and actual vapor pressures were negatively correlated and therefore the unique effect of actual vapor pressure on spatial pattern in atmospheric VPD was surprisingly small. The landscape-scale variation in atmospheric VPD was therefore controlled by microclimate temperature variation.
Microclimate temperature variation over the landscape, crucial for community ecology, is largely dictated by land-surface topography (Dobrowski, 2011). Land-surface topography controls also maximum air temperatures in the forest understory (Vanwalleghem and Meentemeyer, 2009; Macek et al., 2019) and therefore spatial variability in saturation vapor pressure. However, we were surprised that the highly localized processes like evapotranspiration did not contribute much to the spatial variability in absolute air humidity despite our study area with extremely rugged topography and contrasting forest vegetation types. Therefore, spatial variability in absolute air humidity seems to be determined mostly by processes operating at much larger scales like atmospheric circulation and precipitation patterns (Campbell and Norman, 1998). Nevertheless, local topographic depression with waterlogged soils and especially the proximity to flowing water or permanent water bodies can locally elevate actual vapor pressure and therefore decrease atmospheric VPD (Wei et al., 2018; Ogeé et al., 2024) However, our results suggest that the overall pattern in atmospheric VPD will generally follow changes in air temperature and therefore future climate warming will result in non-linear increase in evaporative stress across the landscapes. Given the growing recognition of VPD importance for many ecosystem processes, plant distribution, and community assembly (Grossiord et al., 2020; Kopecký et al., 2024; Novick et al., 2024), the approach we developed here to disentangle the contribution of saturated versus actual vapor pressure can provide new insights into the drivers of VPD variability across spatial and temporal scales. So far, the knowledge of the relative importance of saturated versus actual vapor pressure is limited, therefore it is difficult to compare our results with other studies. Nevertheless, a comparison of the drivers of VPD variability across agricultural fields in Germany supports our conclusion that temperature-driven variability in saturated vapor pressure is a dominant control of VPD variability at finer scales (Wörlen et al., 1999).
4.2 VPD effects on bryophytes
In contrast to vascular plants, bryophytes tolerate desiccation and become metabolically inactive in the absence of water (Proctor, 2000). When conditions improve, bryophytes quickly reactivate physiological processes such as respiration, photosynthesis, cell cycle, or normal cytoskeleton function (Proctor et al., 2007a, b). However, this reactivation requires a lot of energy, for example to produce specific repair proteins (Oliver and Bewley, 1984; Zeng et al., 2002) or to maintain the integrity and normal function of cell organelles and membranes (Platt et al., 1994). Prolonged periods without evaporative stress are therefore key for bryophyte growth and long-term survival (Proctor et al., 2007b; Merinero et al., 2020).
Bryophyte cells at full turgor have osmotic potential rarely more negative than −2 MPa (Proctor, 2000). An osmotic potential of −1.36 MPa is in equilibrium with air at 20 °C and 99 % relative humidity (i.e. VPD <0.03 kPa). If the temperature remains at 20 °C, but the relative humidity drops to 90 %, the water potential outside the bryophyte body decreases to −14 MPa (Proctor, 2000) and bryophytes start to lose water. To maintain full turgor and normal cell function, bryophytes thus need free liquid water close to the cells. However, this external water completely evaporates within 45–50 min if atmospheric VPD reaches 1.22 kPa (León-Vargas et al., 2006). Once the external water evaporates, bryophyte cells rapidly lose turgor, metabolic activity slows down, and carbon fixation decreases.
In our study region, microclimatic conditions with VPD lower than 0.03 kPa and therefore without evaporative stress for bryophytes (Proctor, 2000) occurred on average only 9 % of the measurement time. However, there was large variability among the sites, resulting in fine-scaled landscape mosaic of sites with widely different evaporative stress. We found that this fine-scale VPD variation structured bryophyte communities. Regionally rare species with disjunct distribution in central Europe generally preferred sites with low VPD. These species – otherwise typical for (sub)montane, boreal, or (sub)oceanic regions – are approaching their distributional limits within our study area (Hill and Preston, 1998). For these species, sites with low VPD serve as microclimatic refugia within an otherwise unsuitable landscape matrix. In contrast, regionally widespread bryophytes occurred along the whole VPD gradient. Fine-scale variation in VPD thus functions as an environmental filter for bryophyte community assembly over the landscape. Sites with low atmospheric VPD, hosting simultaneously rare as well as widespread bryophytes, thus represent hotspots of bryophyte diversity in the landscape.
Our findings of dominant temperature control on VPD variability across the landscape suggest that even the sites which can be considered as buffered against climate warming because of locally higher actual vapor pressure will be negatively affected by warming. With climate warming, areas with low VPD will likely shrink, and their bryophyte diversity will become more vulnerable (Pardow and Lakatos, 2013). Moreover, the increasingly frequent and severe canopy disturbances will likely further increase understory temperatures and consequently also VPD (Wolf et al., 2021; Máliš et al., 2023). Our results suggest that such changes will reshuffle bryophyte communities, supporting widespread mesic bryophytes at the expense of regionally rare species near their distributional limits. Such changes will likely decrease not only local and regional bryophyte species richness but also trigger biotic homogenization of bryophyte assemblages across larger spatial scales (Staude et al., 2020).
4.3 Disentangling atmospheric VPD and temperature
The close coupling between VPD and temperature clearly shows the need – and simultaneously the difficulty – of disentangling the influences of VPD and temperature on plant communities. While temperature affects basic life functions of bryophytes like photosynthesis, respiration (Dilks and Proctor, 1975), and growth (Furness and Grime, 1982), bryophytes thrive in a wide range of temperatures – from less than −30 °C (Dilks and Proctor, 1975) to over 40 °C in a dry state (Hearnshaw and Proctor, 1982). For most bryophytes, the optimal growth temperature ranges from 12 to 25 °C (Vanderpoorten and Goffinet, 2009). However, many bryophyte species grow even at temperatures around 5 °C (Dilks and Proctor, 1975), and some can even photosynthesize at temperatures below 0 °C (Lösch et al., 1983). Therefore, temperature is hardly a direct limiting factor of bryophyte distribution and community composition in temperate regions.
Our results fully support this conclusion, as we found that mean VPD was much better predictor of bryophyte community composition and richness than maximum temperature or maximum VPD. Bryophytes probably survive the most extreme conditions represented by maximum VPD in desiccated state. However, the time required to recover from desiccation increases and degree of recovery decreases with the length of desiccation (Proctor et al. 2007b). Bryophytes are therefore probably more sensitive to time-averaged characteristics of site microclimatic condition than to short-term extremes captured by maximum VPD. The open question is whether these findings apply also to vascular plants, which cannot survive microclimatic extremes in desiccated state and can be therefore more sensitive to the microclimatic extremes (Schönbeck et al., 2022).
Several studies of vascular plants have attempted to distinguish the independent effect of VPD from other microclimatic factors affecting plant functioning and distribution (Eamus et al., 2013; Denham et al., 2021; Flo et al., 2022; Fu et al., 2022; Kopecký et al., 2024), highlighting the critical importance of VPD (Novick et al., 2016; Schönbeck et al., 2022). Unfortunately, no physiological studies addressed the independent effects of VPD on bryophytes, despite clear indications that VPD plays a key role (Busby et al., 1978; Sonnleitner et al., 2009). So far, studies of bryophyte physiology concentrated on desiccation tolerance (Morales-Sánchez et al., 2022). While desiccation tolerance is an adaptation to cope with the external lack of water, the ultimate driver of desiccation is atmospheric VPD. A deeper focus on atmospheric VPD can therefore bring a new insight into bryophyte ecology and distribution.
Atmospheric VPD controls community composition, richness and structure of bryophyte assemblages in temperate forest understory. Even across the landscape with extremely rugged terrain, spatial variability in atmospheric VPD was controlled by temperature-dependent saturated vapor pressure. Maximum air temperature and VPD are thus tightly coupled at biologically relevant scales, and their effects are hard to disentangle. Nevertheless, we found that the time-averaged mean VPD was much better predictor of bryophyte assemblages than maximum temperature (or closely related maximum VPD) representing microclimatic extremes. This points toward the mean atmospheric VPD as the most important variable representing time-averaged evaporative stress and highlights so far overlooked importance of atmospheric VPD for bryophyte community ecology and distribution. With climate warming, the tight coupling between VPD and local air temperature will cause nonlinear increases in VPD-driven evaporative stress, which will subsequently reshuffle bryophyte community composition and decrease species richness. Especially vulnerable will be bryophyte species occurring near their distributional range limits in microclimatic refugia with low VPD.
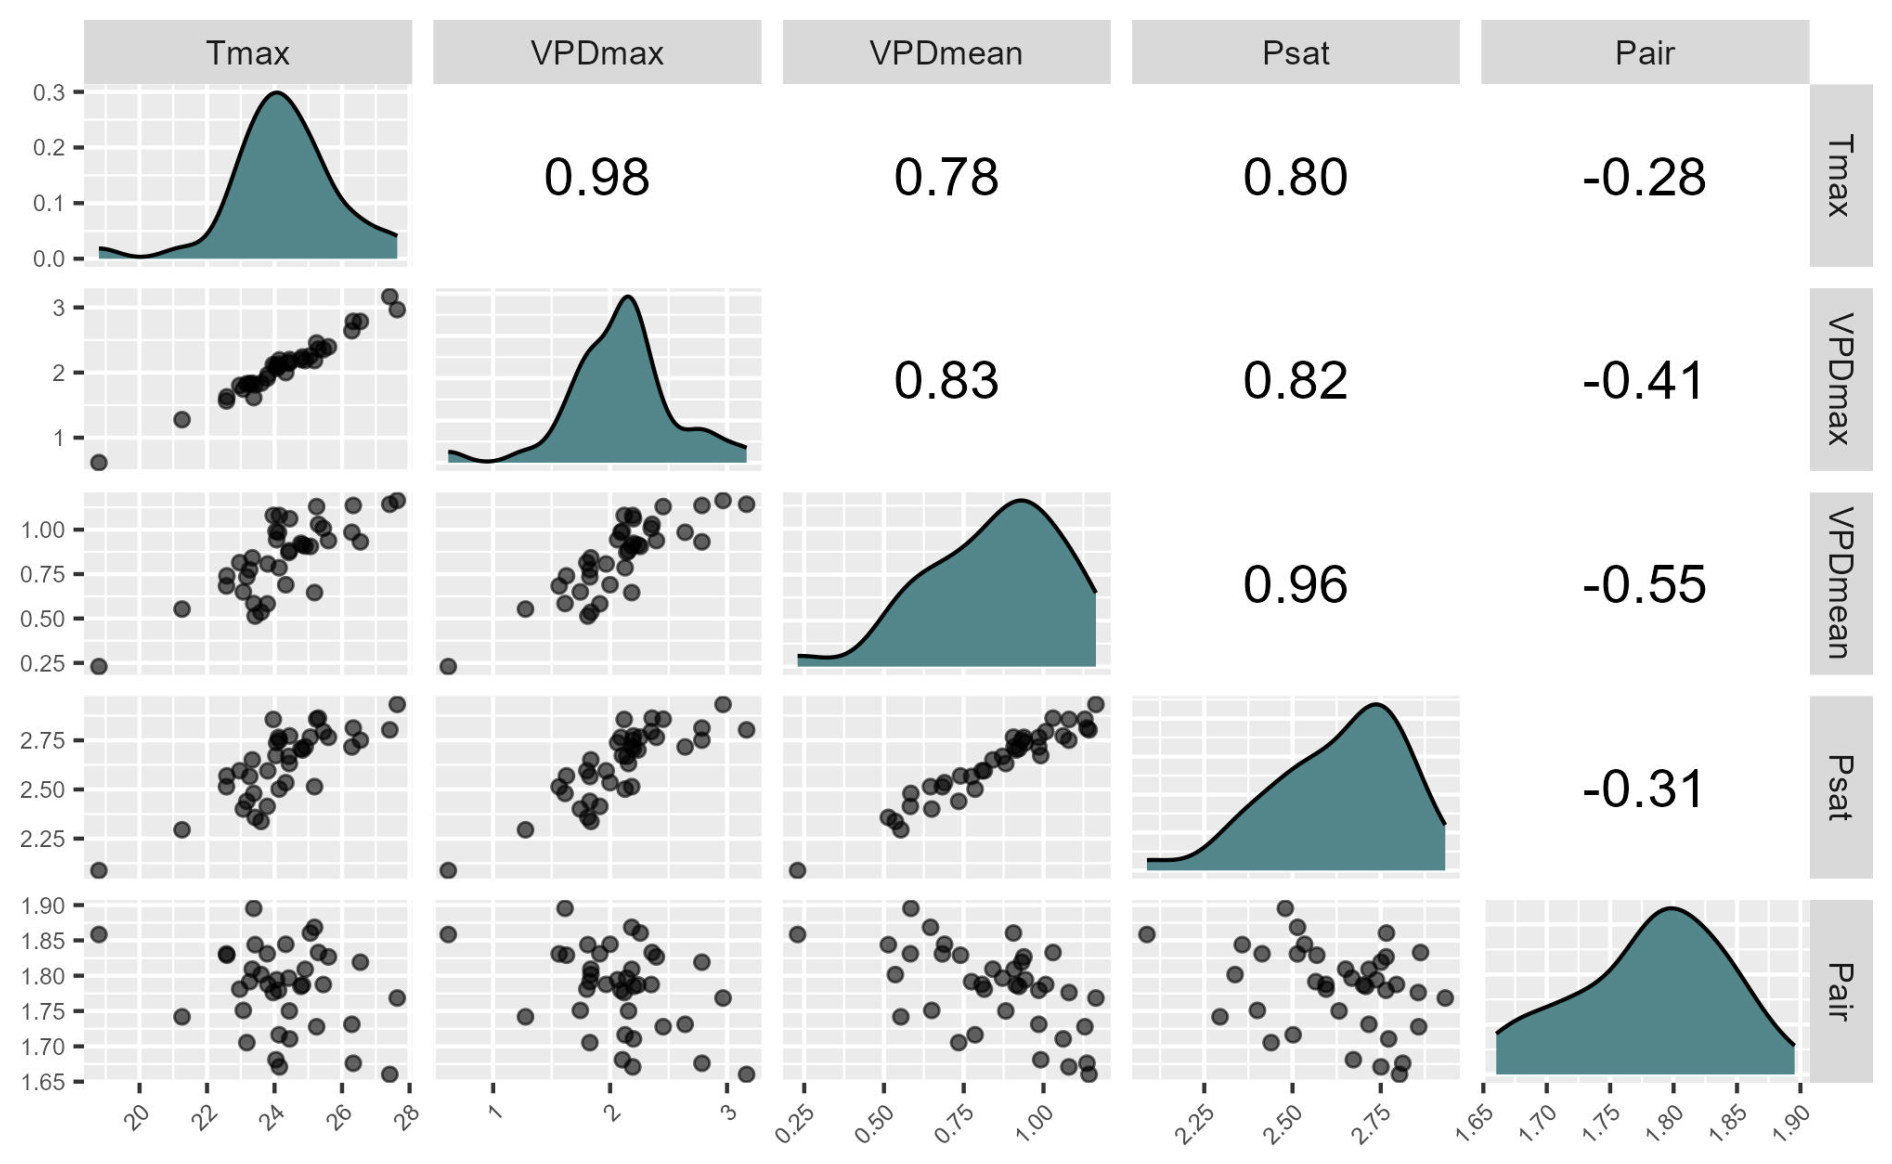
Figure A1Pearson correlation matrix of microclimatic variables representing evaporative stress (maximum temperature, maximum and mean VPD) and its components (mean Psat and mean Pair).
Based on our results, we speculated that local atmospheric VPD can be reasonably estimated using the in-situ air temperature measurements paired with relative air humidity measurements representative for the whole region (and therefore the same for all plots situated within that region).
To explore this idea, we estimated the mean VPD using in-situ measured air temperature (HOBO U23 ProV2 dataloggers in 1.5 m height) and relative air humidity measured in the Tokáň weather station located in the study area (Fig. 1).
While the measured and estimated VPD were closely correlated (Pearson r = 0.97), estimated VPD were consistently higher than in-situ measured VPD (Fig. B1).
Therefore, we conclude that the relative position of the site on the VPD gradient can be reasonably estimated from in-situ microclimate temperature measurements paired with regional relative air humidity measurements. However, it should be stressed that this approach generates VPD estimates which provide reasonable ranking of the sites along the VPD gradient, but generally overestimate the VPD (Fig. B1), likely because it does not account for locally higher actual vapor pressure, for example near springs, water bodies or on permanently waterlogged soils. Therefore, this approach cannot fully replace local air humidity measurements.
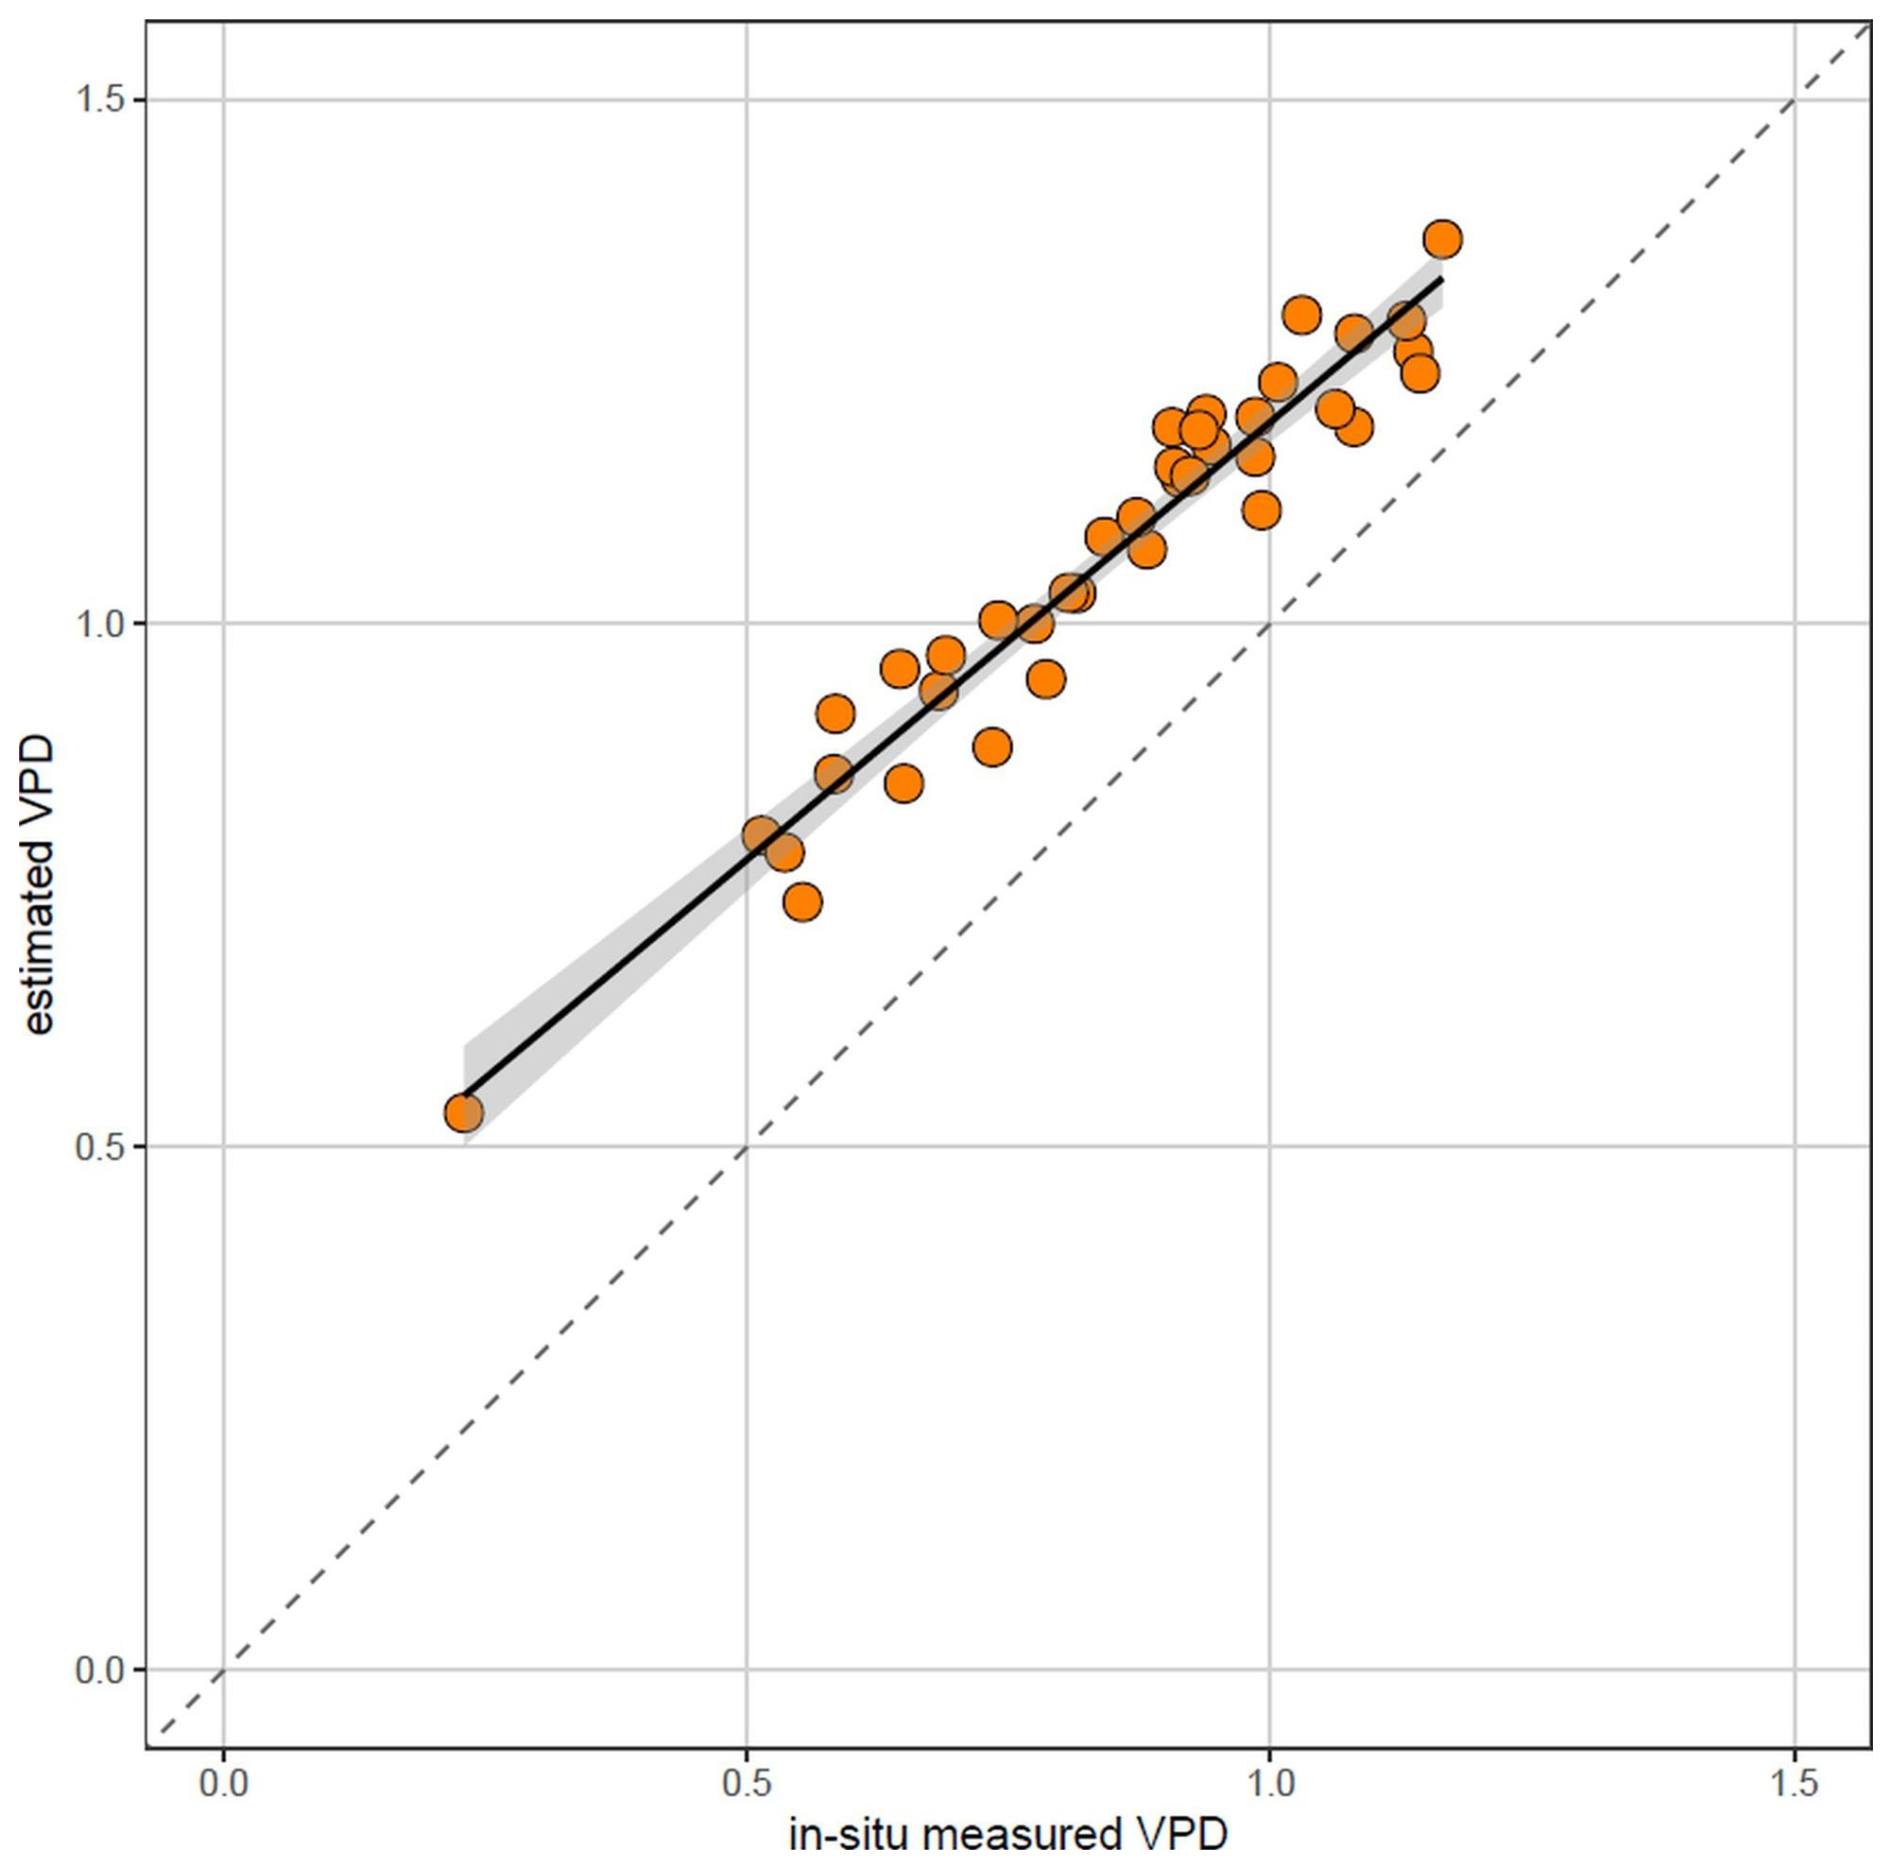
Figure B1Relationship between in-situ measured mean vapor pressure deficit (VPD) and mean VPD estimated from in-situ measured air temperature and relative air humidity measured in regional weather station (June–August 2022). While the measured and estimated VPD are closely correlated (Pearson r=0.97), estimated VPD tends to be higher than in-situ measured VPD, likely because of locally higher air humidity in topographically sheltered sites near valley bottoms.
Table C1Complete list of bryophyte species recorded at 38 study plots.
The data supporting the findings of this study are provided on Zenodo (https://doi.org/10.5281/zenodo.17437034, Růžičková et al., 2025).
Conceptualization: AR, MMan, MMac, JW, MK. Funding acquisition: MK. Data curation: AR. Methodology: MMac, MK. Formal analysis: AR. Investigation: AR, MMan, MMac, JW, MK. Visualization: AR, MMan, MMac, MK. Writing – original draft: AR. Writing – review & editing: AR, MMan, MMac, JW, MK. Supervision: MK.
The contact author has declared that none of the authors has any competing interests.
Publisher's note: Copernicus Publications remains neutral with regard to jurisdictional claims made in the text, published maps, institutional affiliations, or any other geographical representation in this paper. While Copernicus Publications makes every effort to include appropriate place names, the final responsibility lies with the authors. Also, please note that this paper has not received English language copy-editing. Views expressed in the text are those of the authors and do not necessarily reflect the views of the publisher.
We thank all colleagues who helped us to collect microclimate data, the Administration of the Bohemian Switzerland National Park for the long-term support, and Caroline Greiser, Alain Vanderpoorten and anonymous reviewer for their useful comments and suggestions.
This research has been supported by the Czech Science Foundation (grant no. GACR 23-06614S) and the Czech Academy of Sciences (grant no. RVO 67985939).
This paper was edited by Anne Klosterhalfen and reviewed by Alain Vanderpoorten and one anonymous referee.
Almeida-Neto, M., Guimaraes, P., Guimaraes, P. R. J., Loyola, R. D., and Ulrich, W.: A consistent metric for nestedness analysis in ecological systems: reconciling concept and measurement, Oikos, 117, 1227–1239, https://doi.org/10.1111/j.0030-1299.2008.16644.x, 2008.
Anderson, D. B.: Relative humidity or vapor pressure deficit, Ecology, 17, 277–282, https://doi.org/10.2307/1931468, 1936.
Ashcroft, M. B. and Gollan, J. R.: Moisture, thermal inertia, and the spatial distributions of near-surface soil and air temperatures: understanding factors that promote microrefugia, Agr. Forest Meteorol., 176, 77–89, https://doi.org/10.1016/j.agrformet.2013.03.008, 2013.
Breshears, D. D., Adams, H. D., Eamus, D., McDowell, N. G., Law, D. J., Will, R. E., Williams, A. P., and Zou, C. B.: The critical amplifying role of increasing atmospheric moisture demand on tree mortality and associated regional die-off, Front. Plant Sci., 4, 2–5, https://doi.org/10.3389/fpls.2013.00266, 2013.
Buck, A. L.: New equations for computing vapor pressure and enhancement factor. J. Appl. Meteorol. Clim., 20, 1527–1532, https://doi.org/10.1175/1520-0450(1981)020<1527:NEFCVP>2.0.CO;2, 1981.
Buck, A. L.: CR-5 Users Manual 2009–12, Buck Research, https://www.hygrometers.com (last access: 10 March 2025), 1996.
Busby, J. R. and Whitfield, D. W. A.: Water potential, water content, and net assimilation of some boreal forest mosses, Can. J. Botany, 56, 1551–1558, https://doi.org/10.1139/b78-184, 1978.
Busby, J. R., Bliss, L. C., and Hamilton, C. D.: Microclimate control of growth rates and habitats of the boreal forest mosses, Tomenthypnum nitens and Hylocomium splendens, Ecol. Monogr., 48, 95–110, https://doi.org/10.2307/2937294, 1978.
Campbell, G. S. and Norman, J. M.: An introduction to environmental biophysics, 2nd edn., Springer, New York, 286 pp., https://doi.org/10.1007/978-1-4612-1626-1, 1998.
Dahlberg, C. J., Ehrlén, J., Christiansen, D. M., Meineri, E., and Hylander, K.: Correlations between plant climate optima across different spatial scales, Environ. Exp. Botany, 170, 103899, https://doi.org/10.1016/j.envexpbot.2019.103899, 2020.
Davis, K. T., Dobrowski, S. Z., Holden, Z. A., Higuera, P. E., and Abatzoglou, J. T.: Microclimatic buffering in forests of the future: the role of local water balance, Ecography, 42, 1–11, https://doi.org/10.1111/ecog.03836, 2019.
Denham, S. O., Oishi, A. C., Miniat, C. F., Wood, J. D., Yi, K., Benson, M. C., and Novick, K. A.: Eastern US deciduous tree species respond dissimilarly to declining soil moisture but similarly to rising evaporative demand, Tree Physiol., 41, 1–56, https://doi.org/10.1093/treephys/tpaa153, 2021.
Dilks, T. J. K. and Proctor, M. C. F: Comparative experiments on temperature responses of bryophytes: assimilation, respiration and freezing damage, J. Bryol., 8, 317–336, https://doi.org/10.1179/jbr.1975.8.3.317, 1975.
Dobrowski, S. Z.: A climatic basis for microrefugia: the influence of terrain on climate, Global Change Biol., 17, 1022–1035, https://doi.org/10.1111/j.1365-2486.2010.02263.x, 2011.
Eamus, D., Boulain, N., Cleverly, J., and Breshears, D. D.: Global change-type drought-induced tree mortality: vapor pressure deficit is more important than temperature per se in causing decline in tree health, Ecol. Evol., 3, 2711–2729, https://doi.org/10.1002/ece3.664, 2013.
Feld, S. I., Cristea, N. C. and Lundquist, J. D.: Representing atmospheric moisture content along mountain slopes: examination using distributed sensors in the Sierra Nevada, California, Water Resour. Res., 49, 4424–4441, https://doi.org/10.1002/wrcr.20318, 2013.
Fenton, N. J. and Frego, K. A.: Bryophyte (moss and liverwort) conservation under remnant canopy in managed forests, Biol. Conserv., 122, 417–430, https://doi.org/10.1016/j.biocon.2004.09.003, 2005.
Finocchiaro, M., Médail, F., Saatkamp, A., Diadema, K., Pavon, D., Brousset, L., and Meineri, E.: Microrefugia and microclimate: unraveling decoupling potential and resistance to heatwaves, Sci. Total Environ., 924, 171696, https://doi.org/10.1016/j.scitotenv.2024.171696, 2024.
Flo, V., Martínez-Vilalta, J., Granda, V., Mencuccini, M., and Poyatos, R.: Vapour pressure deficit is the main driver of tree canopy conductance across biomes, Agr. Forest Meteorol., 322, 109029, https://doi.org/10.1016/j.agrformet.2022.109029, 2022.
Fu, Z., Ciais, P., Prentice, I. C., Gentine, P., Makowski, D., Bastos, A., Luo, X., Green, J. K., Stoy, P. C., Yang, H., and Hajima, T.: Atmospheric dryness reduces photosynthesis along a large range of soil water deficits, Nat. Commun., 13, 1–10, https://doi.org/10.1038/s41467-022-28652-7, 2022.
Furness, S. B. and Grime, J. P.: Growth rate and temperature responses in bryophytes: II. A comparative study of species of contrasted ecology, J. Ecol., 70, 525–536, https://doi.org/10.2307/2259920, 1982.
Goffinet, B. and Shaw, J. A. (Eds.): Bryophyte biology, 2nd edn., Cambridge University Press, New York, 556 pp., ISBN 978-0-521-69322-6, 2009.
Grossiord, C., Buckley, T. N., Cernusak, L. A., Novick, K. A., Poulter, B., Siegwolf, R. T. W., Sperry, J. S., and McDowell, N. G.: Plant responses to rising vapor pressure deficit, New Phytol., 226, 1550–1566, https://doi.org/10.1111/nph.16485, 2020.
Härtel, H., Sádlo, J., Świerkosz, K., and Marková, I.: Phytogeography of the sandstone areas in the Bohemian Cretaceous Basin (Czech Republic/Germany/Poland), in: Sandstone landscapes, edited by: Härtel, H., Cílek, V., Herben, T.,Jackson, A., and Williams, R., Academia, Prague, 177–189, ISBN 978-80-200-1577-8, 2007.
Hearnshaw, G. F. and Proctor, M. C. F.: The effect of temperature on the survival of dry bryophytes, New Phytol., 90, 221–228, https://doi.org/10.1111/j.1469-8137.1982.tb03254.x, 1982.
Hill, M. O. and Preston, C. D.: The geographical relationships of British and Irish bryophytes, J. Bryol., 20, 127–226, https://doi.org/10.1179/jbr.1998.20.1.127, 1998.
Hinshiri, H. M. and Proctor, M. C. F.: The effect of desiccation on subsequent assimilation and respiration of the bryophytes Anomodon viticulosus and Porella platyphylla, New Phytol., 70, 527–538, https://doi.org/10.1111/j.1469-8137.1971.tb02554.x, 1971.
Hjort, J., Heikkinen, R. K., and Luoto, M.: Inclusion of explicit measures of geodiversity improve biodiversity models in boreal landscape, Biodivers. Conserv., 21, 3487-3506, https://doi.org/10.1007/s10531-012-0376-1, 2012.
IPCC: Climate Change 2023: synthesis report, https://doi.org/10.59327/IPCC/AR6-9789291691647, 2023.
Johnston, M. R, Barnes, M. L., Preisler, Y., Smith, W. K., Biederman, J. A., Scott, R. L., Williams, A. P., and Dannenberg, M. P.: Effects of hot versus dry vapor pressure deficit on ecosystem carbon and water fluxes, J. Geophys. Res.-Biogeo., 130, e2024JG008146, https://doi.org/10.1029/2024JG008146, 2025.
Jones, H. G.: Plants and microclimate: a quantitative approach to environmental plant physiology, 3rd edn., Cambridge University Press, https://doi.org/10.1017/CBO9780511845727, 2014.
Kopecký, M., Hederová, L., Macek, M., Klinerová, T., and Wild, J.: Forest plant indicator values for moisture reflect atmospheric vapour pressure deficit rather than soil water content, New Phytol., 244, 1801–1811, https://doi.org/10.1111/nph.20068, 2024.
Kučera, J., Váňa, J., and Hradílek, Z.: Bryophyte flora of the Czech Republic: updated checklist and Red List and a brief analysis, Preslia, 84, 813–850, 2012.
Lawrence, M. G.: The relationship between relative humidity and the dewpoint temperature in moist air: a simple conversion and applications, B. Am. Meteorol. Soc., 86, 225–234, https://doi.org/10.1175/BAMS-86-2-225, 2005.
Legendre, P.: Studying beta diversity: ecological variation partitioning by multiple regression and canonical analysis, J. Plant Ecol., 1, 3–8, https://doi.org/10.1093/jpe/rtm001, 2008.
Legendre, P., Oksanen, J., and ter Braak, C. J. F.: Testing the significance of canonical axes in redundancy analysis, Methods Ecol. Evol., 2, 269–277, https://doi.org/10.1111/j.2041-210X.2010.00078.x, 2011.
Lembrechts, J. J., Aalto, J., Ashcroft, M. B., et al.: SoilTemp: a global database of near-surface temperature, Glob. Change Biol., 26(11), 6616–6629, https://doi.org/10.1111/gcb.15123, 2020.
León-Vargas, Y., Engwald, S., and Proctor, M. C. F.: Microclimate, light adaptation and desiccation tolerance of epiphytic bryophytes in two Venezuelan cloud forests, J. Biogeogr., 33, 901–913, https://doi.org/10.1111/j.1365-2699.2006.01468.x, 2006.
López, J., Way, D. A., and Sadok, W.: Systemic effects of rising atmospheric vapor pressure deficit on plant physiology and productivity, Glob. Change Biol., 27, 1704–1720, https://doi.org/10.1111/gcb.15548, 2021.
Lösch, R., Kappen, L., and Wolf, A.: Productivity and temperature biology of two snowbed bryophytes, Polar Biol., 1, 243–248, https://doi.org/10.1007/BF00443195, 1983.
Lu, H., Qin, Z., Lin, S., Chen, X., Chen, B., He, B., Wei, J., and Yuan, W.: Large influence of atmospheric vapor pressure deficit on ecosystem production efficiency, Nat. Commun., 13, 10–13, https://doi.org/10.1038/s41467-022-29009-w, 2022.
Macek, M., Kopecký, M., and Wild, J.: Maximum air temperature controlled by landscape topography affects plant species composition in temperate forests, Landscape Ecol., 34, 2541–2556, https://doi.org/10.1007/s10980-019-00903-x, 2019.
Máliš, F., Ujházy, K., Hederová, L., Ujházyová, M., Csölleová, L., Coomes, D. A., and Zellweger, F.: Microclimate variation and recovery time in managed and old-growth temperate forests, Agr. Forest Meteorol., 342, 109722, https://doi.org/10.1016/j.agrformet.2023.109722, 2023.
Man, M., Wild, J., Macek, M., and Kopecký, M.: Can high-resolution topography and forest canopy structure substitute microclimate measurements? Bryophytes say no, Sci. Total Environ., 821, 153377, https://doi.org/10.1016/j.scitotenv.2022.153377, 2022.
Man, M., Kalčík, V., Macek, M., Brůna, J., Hederová, L., Wild, J., and Kopecký, M.: myClim: microclimate data handling and standardised analyses in R, Methods Ecol. Evol., 14, 2308–2320, https://doi.org/10.1111/2041-210X.14192, 2023.
Marková, I.: Mechorosty Èeského Švýcarska (Labských pískovcù), in: Labské pískovce – historie, pøíroda a ochrana území, edited by Bauer P., Kopecký V. and Šmucar J., Agentura ochrany přírody a krajiny ČR and Správa CHKO Labské pískovce, Děčín, 106–120, ISBN 978-80-87051-27-6, 2008 (in Czech).
Merinero, S., Dahlberg, C. J., Ehrlén, J., and Hylander, K.: Intraspecific variation influences performance of moss transplants along microclimatic gradients, Ecology, 101, e02999, https://doi.org/10.1002/ecy.2999, 2020.
McArdle, B. H. and Anderson, M. J.: Fitting multivariate models to community data: a comment on distance-based redundancy analysis, Ecology, 82, 290–297, https://doi.org/10.1890/0012-9658(2001)082[0290:FMMTCD]2.0.CO;2, 2001.
McDowell, N., Pockman, W. T., Allen, C. D., Breshears, D. D., Cobb, N., Kolb, T., Plaut, J., Sperry, J., West, A., Williams, D. G., and Yepez, E. A.: Mechanisms of plant survival and mortality during drought: why do some plants survive while others succumb to drought?, New Phytol., 178, 719–739, https://doi.org/10.1111/j.1469-8137.2008.02436.x, 2008.
Morales-Sánchez, J. Á. M., Mark, K., Souza, J. P.S., and Niinemets, Ü.: Desiccation – rehydration measurements in bryophytes: current status and future insights, J. Exp. Bot., 73, 4338–4361, https://doi.org/10.1093/jxb/erac172, 2022.
Novick, K. A., Ficklin, D. L., Stoy, P. C., Williams, C. A., Bohrer, G., Oishi, A. C., Papuga, S. A., Blanken, P. D., Noormets, A., Sulman, B. N., Scott, R. L., Wang, L., and Phillips, R. P.: The increasing importance of atmospheric demand for ecosystem water and carbon fluxes, Nat. Clim. Change, 6, 1023–1027, https://doi.org/10.1038/nclimate3114, 2016.
Novick, K. A., Ficklin, D. L., Grossiord, C., Konings, A. G., Martínez-Vilalta, J., Sadok, W., Trugman, A. T., Williams, A. P., Wright, A. J., Abatzoglou, J. T., Dannenberg, M. P., Gentine, P., Guan, K., Johnston, M. R., Lowman, L. E. L., Moore, D. J. P., and McDowell, N. G.: The impacts of rising vapour pressure deficit in natural and managed ecosystems, Plant Cell Environ., 47, 3561–3589, https://doi.org/10.1111/pce.14846, 2024.
Ogée, J., Walbott, M., Barbeta, A., Corcket, E., and Brunet, Y.: Decametric-scale buffering of climate extremes in forest understory within a riparian microrefugia: the key role of microtopography, Int. J. Biometeorol., 68, 1741–1755, https://doi.org/10.1007/s00484-024-02702-9, 2024.
Oksanen, J., Simpson, G., Blanchet, F., Kindt, R., Legendre, P., Minchin, P. R., O'Hara, R. B., Solymos, P., Stevens, M. H. H., Szoecs, E., Wagner, H., Barbour, M., Bedward, M., Bolker, B., Borcard, D., Carvalho, G., Chirico, M., De Caceres, M., Durand, S., Evangelista, H. B. A., FitzJohn, R., Friendly, M., Furneaux, G., Hill, M. O., Lahti, L., McGlinn, D., Ouellette, M-H., Cunha, E. R., Smith, T., Stier, A., ter Braak, C. J. F., Weedon, J., and Borman, T.: vegan: Community Ecology Package [R package vegan version 2.6-4], CRAN [code], https://cran.r-project.org/package=vegan (last access: 5 February 2025), 2022.
Oliver, M. J. and Bewley, J. D.: Plant desiccation and protein synthesis, Plant Physiol., 74, 923–927, https://doi.org/10.1104/pp.74.4.923, 1984.
Oliver, M. J., Velten, J., and Wood, A. J.: Bryophytes as experimental models for the study of environmental stress tolerance: Tortula ruralis and desiccation-tolerance in mosses, Plant Ecol., 151, 73–84, https://doi.org/10.1023/A:1026598724487, 2000.
Pardow, A. and Lakatos, M.: Desiccation tolerance and global change: implications for tropical bryophytes in lowland forests, Biotropica, 45, 27–36, https://doi.org/10.1111/J.1744-7429.2012.00884.X, 2013.
Pedersen, T. and Crameri, F.: scico: Colour palettes based on the scientific colour maps [R package scio version 1.5.0], CRAN [code], https://CRAN.R-project.org/package=scico (last access: 11 March 2025), 2023.
Peres-Neto, P. R., Legendre, P., Dray, S., and Borcard D.: Variation partitioning of species data matrices: estimation and comparison of fractions, Ecology, 87, 2614–25, https://doi.org/10.1890/0012-9658(2006)87[2614:VPOSDM]2.0.CO;2, 2006.
Platt, K. A., Oliver, M. J., and Thomson, W. W.: Membranes and organelles of dehydrated Selaginella and Tortula retain their normal configuration and structural integrity: freeze fracture evidence, Protoplasma, 178, 57–65, https://doi.org/10.1007/BF01404121, 1994.
Proctor, M. C. F.: The bryophyte paradox: tolerance of dessication, evasion of drought, Plant Ecol., 151, 41–49, https://doi.org/10.1023/A:1026517920852, 2000.
Proctor, M. C. F.: Patterns of desiccation tolerance and recovery in bryophytes, Plant Growth Regul., 35, 147–156, https://doi.org/10.1023/A:1014429720821, 2001.
Proctor, M. C. F., Ligrone, R., and Duckett, J. G.: Desiccation tolerance in the moss Polytrichum formosum: physiological and fine-structural changes during desiccation and recovery, Ann. Bot.–London, 99, 75–93, https://doi.org/10.1093/aob/mcl246, 2007a.
Proctor, M. C. F, Oliver, M. J., Wood, A. J., and Alpert, P.: Desiccation-tolerance in bryophytes: a review, Bryologist, 110, 595–621, https://doi.org/10.1639/0007-2745(2007)110[595:DIBAR]2.0.CO;2, 2007b.
R Core Team: R: A language and environment for statistical computing, R foundation for statistical computing, Vienna, Austria [code], https://www.R-project.org/ (last access: 15 March 2025), 2024.
Rambo, T. R. and Muir, P. S.: Forest floor bryophytes of Pseudotsuga menziesii-Tsuga heterophylla stands in Oregon: influence of substrate and overstory, Bryologist, 101, 116–130, https://doi.org/10.2307/3244083, 1998.
Rice, S. K., Collins, D., and Anderson, A. M.: Functional significance of variation in bryophyte canopy structure, Am. J. Bot., 88, 1568–1576, https://doi.org/10.2307/3558400, 2001.
Ruehr, N. K., Law, B. E., Quandt, D., and Williams, M.: Effects of heat and drought on carbon and water dynamics in a regenerating semi-arid pine forest: a combined experimental and modeling approach, Biogeosciences, 11, 4139–4156, https://doi.org/10.5194/bg-11-4139-2014, 2014.
Růžičková, A., Man, M., Macek, M., Wild, J., and Kopecký, M.: Temperature-driven vapor pressure deficit structures forest bryophyte communities across the landscape, Zenodo [data set], https://doi.org/10.5281/zenodo.17437034, 2025.
Schmalholz, M. and Hylander, K.: Microtopography creates small-scale refugia for boreal forest floor bryophytes during clear-cut logging, Ecography, 34, 637–348, https://doi.org/10.1111/j.1600-0587.2010.06652.x, 2011.
Schofield, W. B.: Ecological significance of morphological characters in the moss gametophyte, Bryologist, 84, 149–165, https://doi.org/10.2307/3242819, 1981.
Schönbeck, L. C., Schuler, P., Lehmann, M. M., Mas, E., Mekarni, L., Pivovaroff, A. L., Turberg, P., and Grossiord, C.: Increasing temperature and vapour pressure deficit lead to hydraulic damages in the absence of soil drought, Plant, Cell Environ., 45, 3275–3289, https://doi.org/10.1111/pce.14425, 2022.
Sonnleitner, M., Dullinger, S., Wanek, W., and Zechmeister, H.: Microclimatic patterns correlate with the distribution of epiphyllous bryophytes in a tropical lowland rain forest in Costa Rica, J. Trop. Ecol., 25, 321–330, https://doi.org/10.1017/S0266467409006002, 2009.
Staude, I. R., Waller, D. M., Bernhardt-Römermann, M., Bjorkman, A. D., Brunet, J., De Frenne, P., Hédl, R., Jandt, U., Lenoir, J., Máliš, F., Verheyen, K., Wulf, M., Pereira, H. M., Vangansbeke, P., Ortmann-Ajkai, A., Pielech, R., Berki, I., Chudomelová, M., Decocq, G., Dirnböck, T., Durak, T., Heinken, T., Jaroszewicz, B., Kopecký, M., Macek, M., Malicki, M., Naaf, T., Nagel, T. A., Petřík, P., Reczyńska, K., Schei, F. H., Schmidt, W., Standovár, T., Świerkosz, K., Teleki, B., Van Calster, H., Vild, O., and Baeten, L.: Replacements of small- by large-ranged species scale up to diversity loss in Europe's temperate forest biome, Nature, 4, 802–808, https://doi.org/10.1038/s41559-020-1176-8, 2020.
Tetens, O.: Ueber einige meteorologische Begriffe, Zeitschrift für geophysik, 6, 297–309, 1930 (in German).
Ulrich, W., Almeida-Neto, M., and Gotelli, N. J.: A consumer's guide to nestedness analysis, Oikos, 118, 3–17, https://doi.org/10.1111/j.1600-0706.2008.17053.x, 2009.
Vanderpoorten, A. and Engels, P.: The effects of environmental variation on bryophytes at regional scale, Ecography, 25, 513–522, https://doi.org/10.1034/j.1600-0587.2002.250501.x, 2002.
Vanderpoorten, A. and Goffinet, B.: Introduction to bryophytes, Cambridge University Press, Cambridge, 303 pp., https://doi.org/10.1017/CBO9780511626838, 2009.
Vanwalleghem, T. and Meentemeyer, R. K.: Predicting forest microclimate in heterogeneous landscapes, Ecosystems, 12, 1158–1172, https://doi.org/10.1007/s10021-009-9281-1, 2009.
Wagner, D.J. and Titus, J. E.: Comparative desiccation tolerance of two Sphagnum mosses, Oecologia, 62, 182–187, https://doi.org/10.1007/BF00379011, 1984.
Wei, L., Zhou, H., Link, T. E., Kavanagh, K. L., Hubbart, J. A., Du, E., Hudak, A. T., and Marshall, J. D.: Forest productivity varies with soil moisture more than temperature in a small montane watershed, Agr. Forest Meteorol., 259, 211–221, https://doi.org/10.1016/j.agrformet.2018.05.012, 2018.
Wild, J., Macek, M., Kopecký, M., Zmeškalová, J., Hadincová, V., and Trachtová, P.: Temporal and spatial variability of microclimate in sandstone landscape: detailed field measurement, in: Proceedings of the 3rd International Conference on Sandstone Landscapes, edited by Kasprzak, M. and Migoń, P., University of Wroclaw, 220–224, ISBN 9788362673292, 2013.
Will, R. E., Wilson, S. M., Zou, C. B., and Hennessey, T. C.: Increased vapor pressure deficit due to higher temperature leads to greater transpiration and faster mortality during drought for tree seedlings common to the forest-grassland ecotone, New Phytol., 200, 366–374, https://doi.org/10.1111/nph.12321, 2013.
Williams, A. P., Allen, C. D., Macalady, A. K., Griffin, D., Woodhouse, C. A., Meko, D. M., Swetnam, T. W., Rauscher, S. A., Seager, R., Grissino-Mayer, H. D., Dean, J. S., Cook, E. R., Gangodagamage, C., Cai, M., and McDowell, N. G.: Temperature as a potent driver of regional forest drought stress and tree mortality, Nat. Clim. Change, 3, 292–297, https://doi.org/10.1038/nclimate1693, 2013.
Wolf, K. D., Higuera, P. E., Davis, K. T., and Dobrowski, S. Z.: Wildfire impacts on forest microclimate vary with biophysical context, Ecosphere, 12, e03467, https://doi.org/10.1002/ecs2.3467, 2021.
Wood, S. N.: Fast stable restricted maximum likelihood and marginal likelihood estimation of semiparametric generalized linear models, J. R. Stat. Soc.: Series B (Statistical Methodology), 73, 3–36, https://doi.org/10.1111/J.1467-9868.2010.00749.X, 2011.
Wörlen, C., Schulz, K., Huwe, B., and Eiden, R.: Spatial extrapolation of agrometeorological variables, Agr. For. Meteorol., 94, 233–242, https://doi.org/10.1016/S0168-1923(99)00015-5, 1999.
Wright, D. H., Patterson, B. D., Mikkelson, G. M., Cutler, A., and Atmar, W.: A comparative analysis of nested subset patterns of species composition, Oecologia, 113, 1–20, https://doi.org/10.1007/s004420050348, 1997.
Yuan, W., Zheng, Y., Piao, S., Ciais, P., Lombardozzi, D., Wang, Y., Ryu, Y., Chen, G., Dong, W., Hu, Z., Jain, A. K., Jiang, C., Kato, E., Li, S., Lienert, S., Liu, S., Nabel, J. E. M. S., Qin, Z., Quine, T., Sitch, S., Smith, W. K., Wang, F., Wu, C., Xiao, Z., and Yang, S.: Increased atmospheric vapor pressure deficit reduces global vegetation growth, Sci. Adv., 5, 1–13, https://doi.org/10.1126/sciadv.aax1396, 2019.
Zeng, Q., Chen, X., and Wood, A. J.: Two early light-inducible protein (ELIP) cDNAs from the resurrection plant Tortula ruralis are differentially expressed in response to desiccation, rehydration, salinity, and high light, J. Exp. Bot., 53, 1197–1205, https://doi.org/10.1093/jexbot/53.371.1197, 2002.
- Abstract
- Introduction
- Material and methods
- Results
- Discussion
- Conclusions
- Appendix A: Correlation of variables representing evaporative stress and its components
- Appendix B: VPD estimate from in-situ air temperature and regional air humidity
- Appendix C: List of bryophyte species
- Data availability
- Author contributions
- Competing interests
- Disclaimer
- Acknowledgements
- Financial support
- Review statement
- References