the Creative Commons Attribution 4.0 License.
the Creative Commons Attribution 4.0 License.
 | 06 Nov 2025
Automated mask generation in citizen science smartphone photos and their value for mapping plant species in drone imagery
Salim Soltani
Lauren E. Gillespie
Moises Exposito-Alonso
Olga Ferlian
Nico Eisenhauer
Hannes Feilhauer
Teja Kattenborn
Spatially accurate information on plant species is essential for monitoring in forestry, agriculture and nature conservation. Unoccupied aerial vehicle (UAV)-based remote sensing combined with supervised deep learning segmentation methods can provide accurate segmentation of plant species. However, labeling training data for supervised deep learning methods in vegetation monitoring is a resource-intensive task. Citizen science photographs annotated with species recognition apps could solve this challenge. However, citizen science photographs only have weak species classification labels and no segmentation masks, which are required to train state-of-the-art segmentation methods for fine-grained species recognition. Here, we explore the potential of an automated workflow that integrates the Segment Anything Model (SAM) with Gradient-weighted Class Activation Mapping (Grad-CAM) to automatically generate segmentation masks from citizen science plant photographs. We evaluated the workflow by using the generated masks to train CNN-based segmentation models to segment 10 broadleaf tree species in UAV images. Our results demonstrate that segmentation models can be trained directly using citizen science-sourced plant photographs, automating mask generation without the need for extensive manual labeling. Despite the inherent complexity of segmenting broadleaf tree species, the model achieved an overall acceptable performance for several species. In the context of monitoring vegetation dynamics across space and time, this study highlights the potential of integrating foundation models with citizen science data and remote sensing into automated vegetation mapping workflows, providing a scalable and cost-effective solution for biodiversity monitoring.
- Article
(15548 KB) - Full-text XML
- Companion paper
- BibTeX
- EndNote


Many environmental monitoring applications rely on spatially explicit, timely, and accurate data on the presence of plant species for tasks such as biodiversity mapping, monitoring endangered or invasive species in conservation efforts, weed detection in precision agriculture, and assessing tree species composition in forest management.
Remote sensing images from drones, also known as unoccupied aerial vehicles (UAVs), have emerged as an effective source of information for detecting plant species (Sun et al., 2021; Maes and Steppe, 2019; Lopatin et al., 2019; Curnick et al., 2021; Wagner, 2021; Müllerová et al., 2023; Bouguettaya et al., 2022; Fassnacht et al., 2016). Through mosaicing aerial images, UAVs enable the creation of georeferenced orthoimages that cover relatively large areas with very high spatial resolution in the centimeter to millimeter range. The spatial detail in such imagery can reveal distinct morphological features for plant species identification (Kattenborn et al., 2019). These features include leaf shapes, flower structures, branching patterns, and canopy structure (Schiefer et al., 2020b).
Supervised deep learning methods, particularly convolutional neural networks (CNNs), can successfully be used to exploit these spatial patterns for automated plant species identification (Kattenborn et al., 2019; Schiefer et al., 2020b; Brodrick et al., 2019). The integration of deep learning-based pattern recognition with the high spatial resolution achievable by UAVs transforms even simple RGB cameras into effective tools for vegetation monitoring. Particularly, CNNs for semantic segmentations enable an assignment of each pixel of a UAV orthoimage to a plant species, enabling the mapping of the spatial distribution of plant species in unprecedented detail (Kattenborn et al., 2021b; Hoeser and Kuenzer, 2020)
Supervised deep learning methods, which require labeled training data, hold great potential for plant species mapping. Despite their potential, a key challenge of making supervised deep learning methods operational for plant species mapping is the need for large amounts of training data (Kattenborn et al., 2021b; Galuszynski et al., 2022). Especially when neighboring plant species look similar, a large amount of training data is needed to allow the model to learn the subtle differences between these species (Kattenborn et al., 2021b; Schiefer et al., 2020b). Traditionally, such training data have been derived from field surveys or manual annotation of UAV imagery, both of which are labor-intensive and time-consuming processes (Leitão et al., 2018; Kattenborn et al., 2021a). One alternative source of training data is crowd-sourced plant photos from citizen science species identification platforms, such as iNaturalist and Pl@ntNet (Boone and Basille, 2019; Di Cecco et al., 2021; Joly et al., 2016; Affouard et al., 2017; Soltani et al., 2022, 2024). These citizen science platforms generated millions of photos of vascular plants annotated with species labels, representing a valuable resource for training computer vision models (Joly et al., 2016; Van Horn et al., 2018). iNaturalist allows users to identify plant species manually or with assistance from an integrated AI-based model, after which community consensus determines the reliability of each label, assigning “research-grade” status when at least two-thirds of users agree on the identification. Similarly, Pl@ntNet, with over 12 million observations, uses a comparable approach by combining automated species suggestions with community-based validation (Joly et al., 2016). Both platforms contribute their validated data to the Global Biodiversity Information Facility (GBIF), an international repository for open-access biodiversity information (GBIF, 2019).
While citizen science datasets such as iNaturalist and Pl@ntNet provide valuable species-level labels, they fall short in delivering the pixel-level annotations, called segmentation masks, required to fully exploit high-resolution UAV imagery (Soltani et al., 2022). These simple labels can indicate whether a species is present in an image, but they offer no information about where the species occurs within it. This lack of spatial localization severely limits their usefulness for UAV-based applications, where the primary interest is not if a species is present in an image but to map where species are located in a landscape. To realize the full potential of deep learning for species mapping in UAV imagery we need training data with precise pixel-level masks.
An additional challenge of citizen science imagery lies in its heterogeneity in scene conditions and geometry (Soltani et al., 2022). In particular, the backgrounds are often highly variable, ranging from sky and vegetation to mountains and diverse landscapes, which may limit the transferability of image features to the drone perspective.
To address these limitations, we present a novel workflow that transforms weakly labeled, crowd-sourced plant photographs into high-quality segmentation masks (Fig. 1). Our approach leverages the Segment Anything Model (SAM), a state-of-the-art foundation model designed for generic segmentation tasks (Kirillov et al., 2023), in combination with Gradient-weighted Class Activation Mapping (Grad-CAM) (Selvaraju et al., 2017). First, we train a computer vision model for a simple species classification of the citizen science photographs. Based on these classifications, Grad-CAM highlights image regions that contribute most to species classification, which we use to guide point-based prompts for SAM to generate accurate segmentation masks. This enables an automated mask creation from images with only species-level labels, eliminating the need for manual pixel-wise annotation. Lastly, we enhance the transferability of these citizen science-based training data and its image features to the drone scale by exchanging the textures of the background class with common background samples from drone imagery.
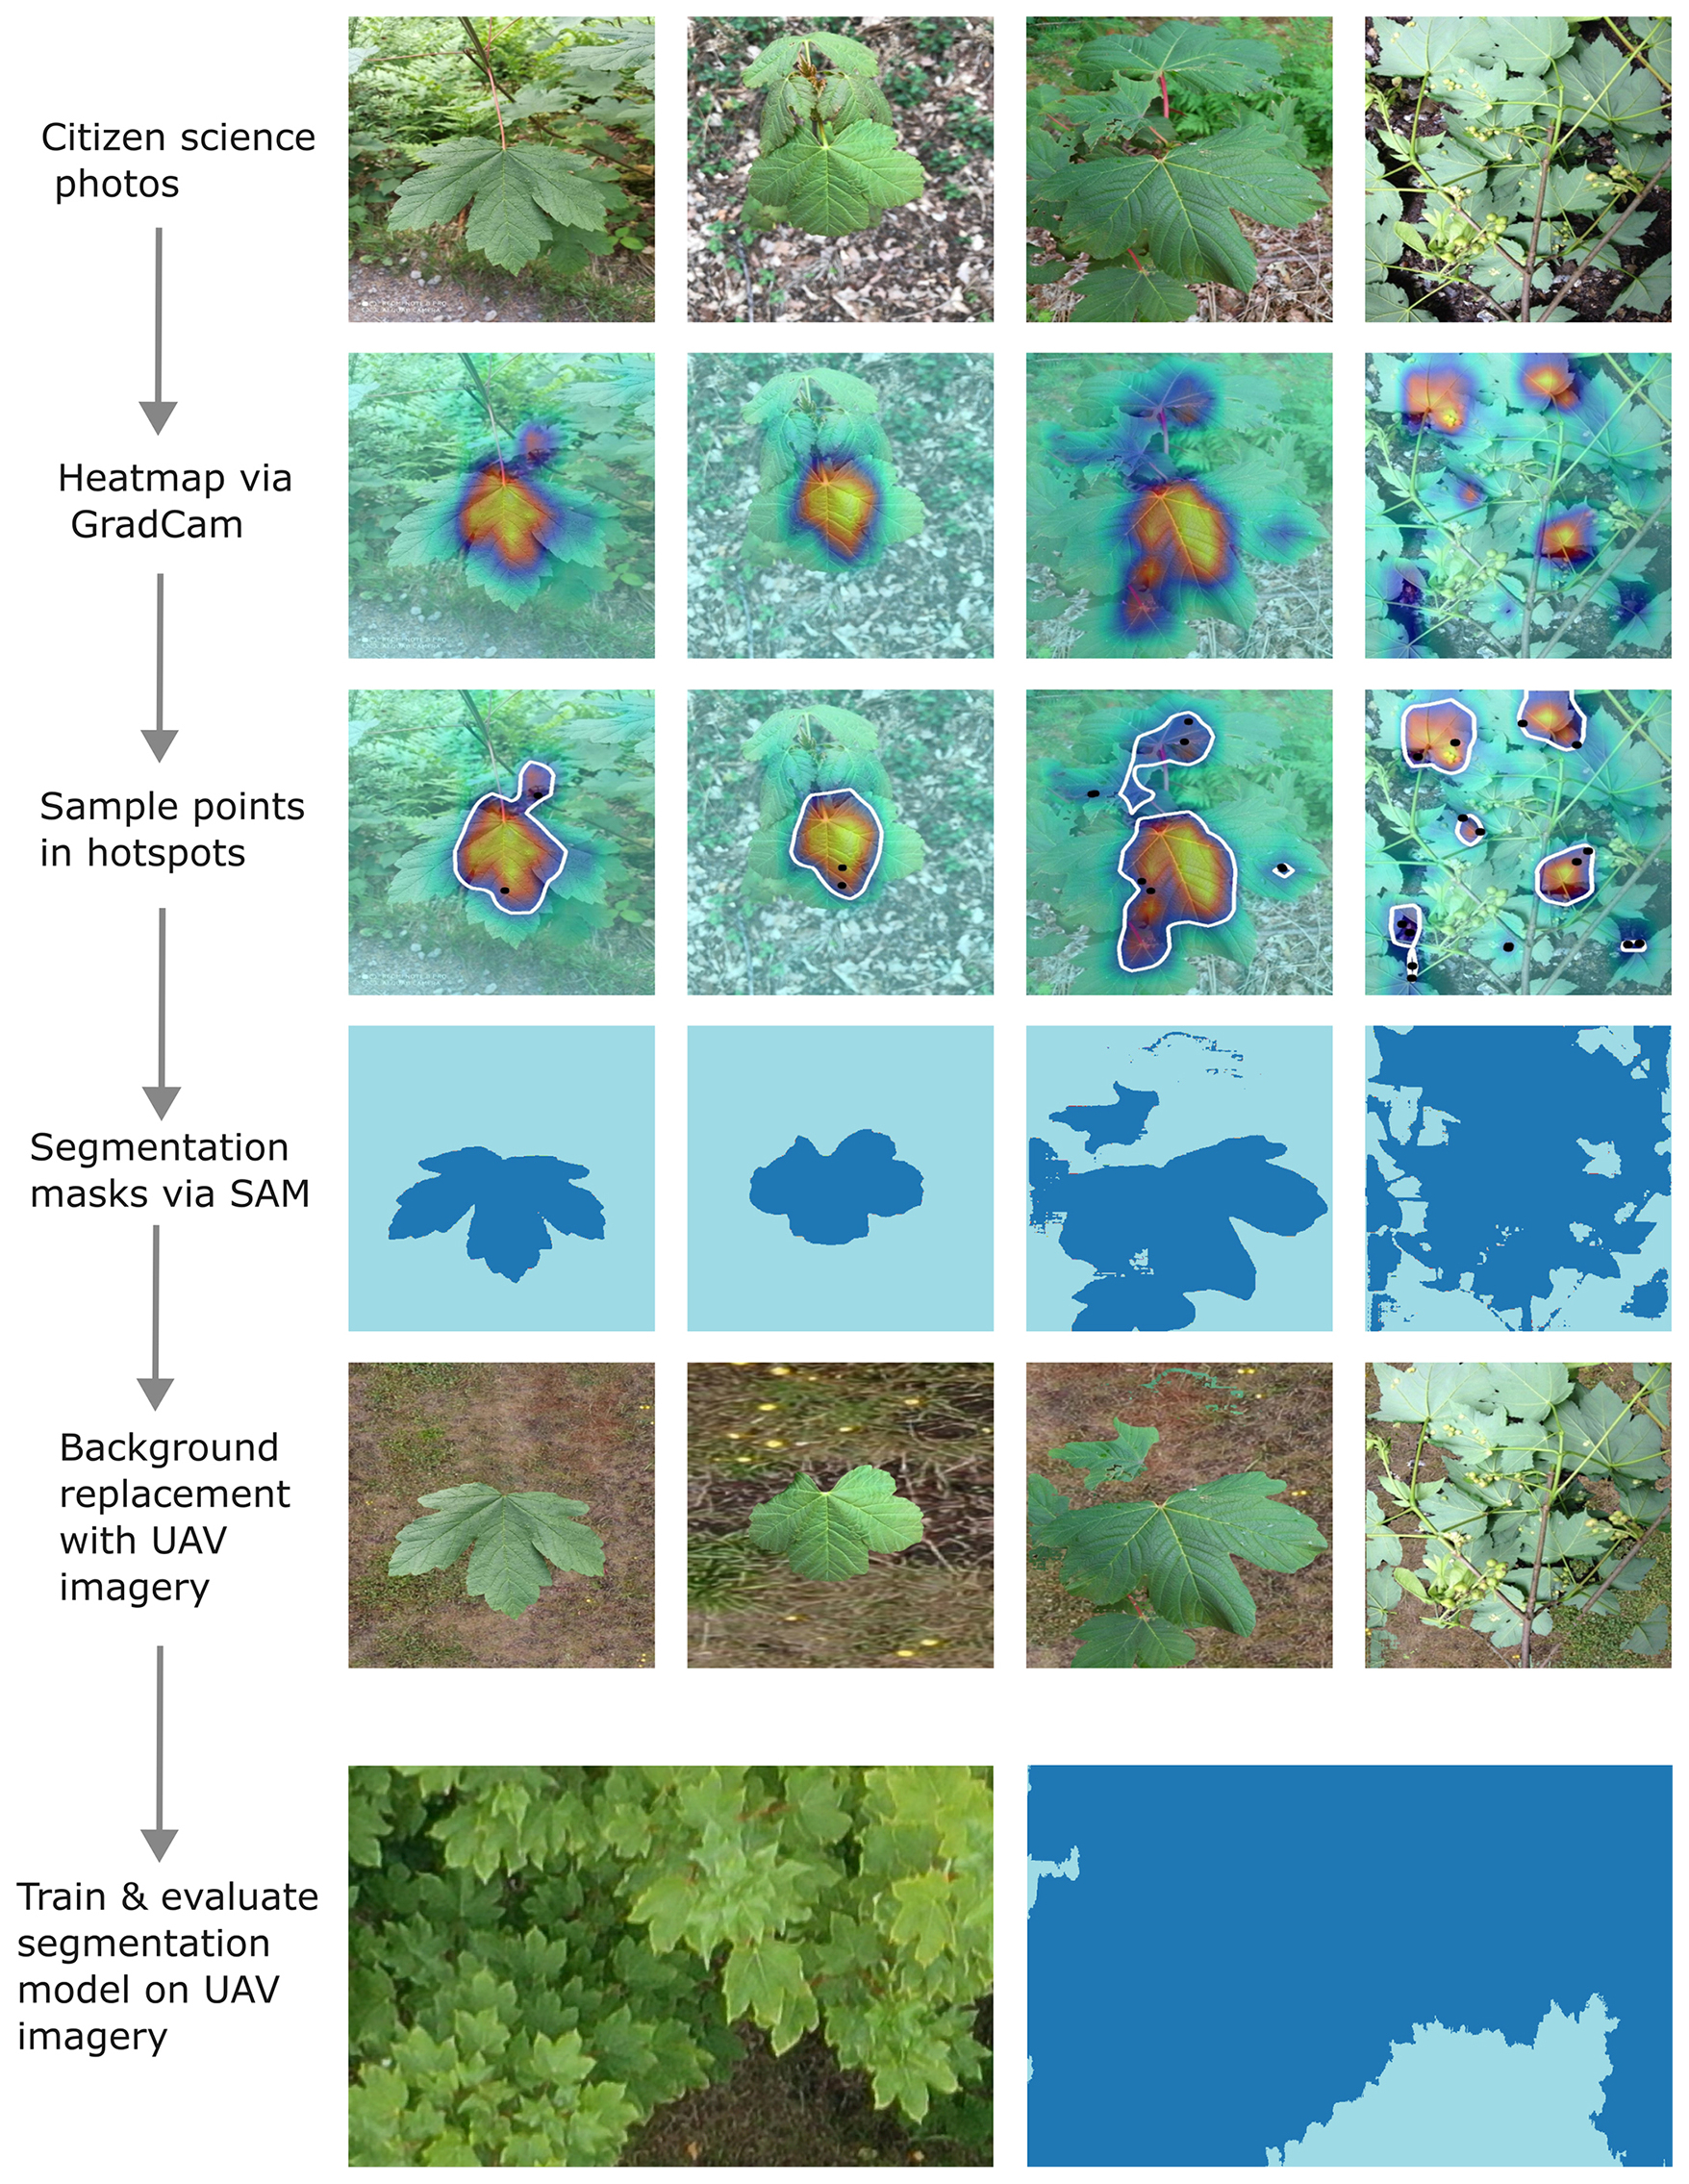
Figure 1Schematic workflow of the mask generation for UAV-related segmentation tasks. Heatmaps are generated using the Grad-CAM approach on the species classification model. The resulting heatmaps are used to extract sample points for the SAM foundation model, which generates segmentation masks. These segmentation masks are then used to replace the background with a background corresponding to the UAV imagery. These modified citizen science photos and segmentation masks are then used to create segmentation models which are applied to UAV orthoimages.
We demonstrate the potential of this approach in a workflow that generates segmentation masks from iNaturalist and Pl@ntNet photos, making them directly suitable for training CNN-based encoder-decoder segmentation models for plant species segmentation. We then apply these models to UAV orthoimagery for high-resolution, large-scale plant species segmentation (Kattenborn et al., 2021b; Bayraktar et al., 2020; Brandt et al., 2020). To evaluate this workflow, we test it on a UAV dataset from the MyDiv experimental site in Bad Lauchstädt, Germany, which includes ten deciduous tree species (Ferlian et al., 2018). Our results demonstrate the potential of combining weakly labeled citizen science data with foundation models (SAM) to scale training data generation for semantic segmentation, significantly reducing manual effort and enabling broader application in remote sensing-based plant species mapping.
2.1 Data acquisition and pre-processing
2.1.1 Study site and drone data acquisition
This study was conducted at the MyDiv site, which is located at the Bad Lauchstädt Experimental Research Station of the Helmholtz Centre for Environmental Research – UFZ in Bad Lauchstädt, Saxony-Anhalt, Germany (latitude 51°23′ N, longitude 11°53′ E). The MyDiv site comprises 20 monoculture plots of ten tree species (two per species). The species comprise Acer pseudoplatanus, Aesculus hippocastanum, Betula pendula, Carpinus betulus, Fagus sylvatica, Fraxinus excelsior, Prunus avium, Quercus petraea, Sorbus aucuparia, and Tilia platyphyllos (Ferlian et al., 2018). Each plot measures 11 × 11 m and contains 140 individuals planted in a uniform grid with 1 m spacing, resulting in a total of 2800 trees across the experimental area (Fig. 2).
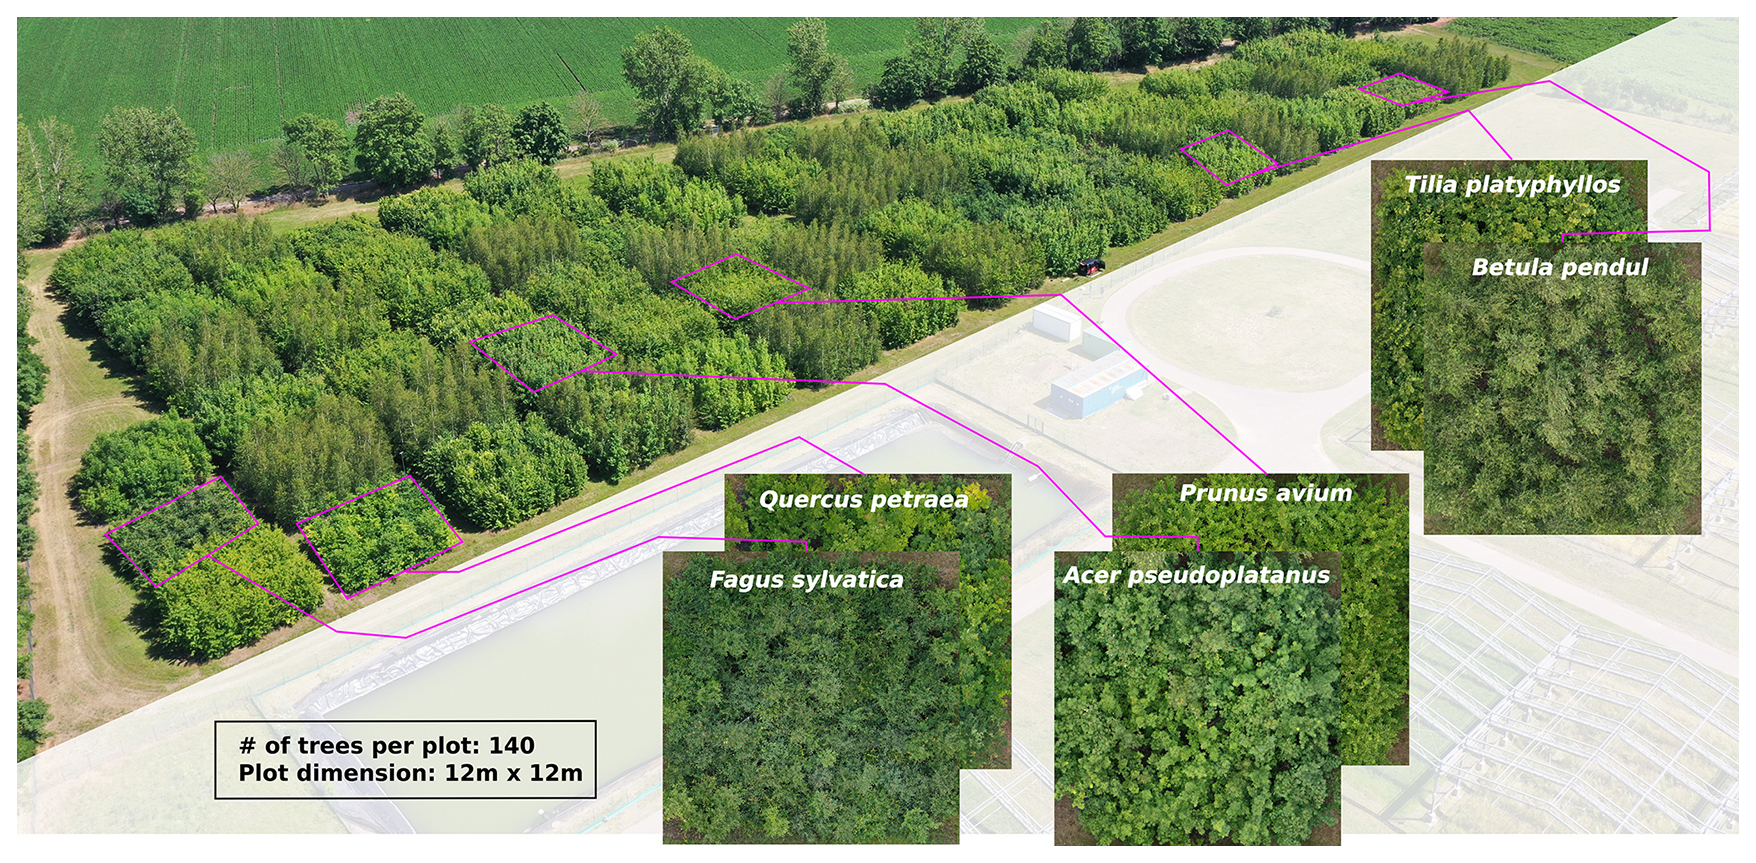
Figure 2Overview of the MyDiv experimental site, highlighting six monoculture plots in close-up. The site is located at 51.3916° N, 11.8857° E.
We generated a high-resolution, georeferenced orthomosaic of the MyDiv experimental site using UAV-based RGB imagery acquired during the peak growing season in July 2022 (Fig. 2). To obtain the imagery, we conducted UAV flights at 16 meters altitude using a DJI Mavic 2 Pro drone and DroneDeploy flight planning software (v5.0, USA), applying 90 % forward and 70 % side image overlap. The resulting imagery had a ground sampling distance of approximately 0.22 cm per pixel. We processed the image set using Metashape (v1.7.6, Agisoft LLC, Russia) to produce the final orthomosaic.
Using the generated orthoimage, we created an independent test data of the target species, which served for testing the models trained on the citizen science data. This independent test data was generated in an earlier study (Soltani et al., 2024) by manually delineating the canopies of the tree species in the UAV orthoimages using QGIS (version 3.32.3). Given the laborious effort to create such reference masks at high quality, we created diagonal transects for each plot measuring 20 m in length and 2 m in width, instead of annotating the entire plot.
2.1.2 Citizen science data
To compile the tree species training dataset, we queried citizen science plant observations from the iNaturalist and Pl@ntNet via the Global Biodiversity Information Facility (GBIF) database using the scientific names of the target tree species. We retrieved iNaturalist data using the R package rinat (version 0.1.8), which provides an application programming interface (API) for iNaturalist. We acquired Pl@ntNet data directly from GBIF as tabulated observation records through an R pipeline that downloads the plant photographs using the provided URLs. We restricted the iNaturalist dataset to photographs taken between May and September to avoid photographs in leaf-off conditions, improving their comparability with the UAV orthoimages. Given that plant photographs within the Pl@ntNet dataset are initially focused on the green parts of the plants such as leaves, it was unnecessary to perform any date-based filtering on the Pl@ntNet data.
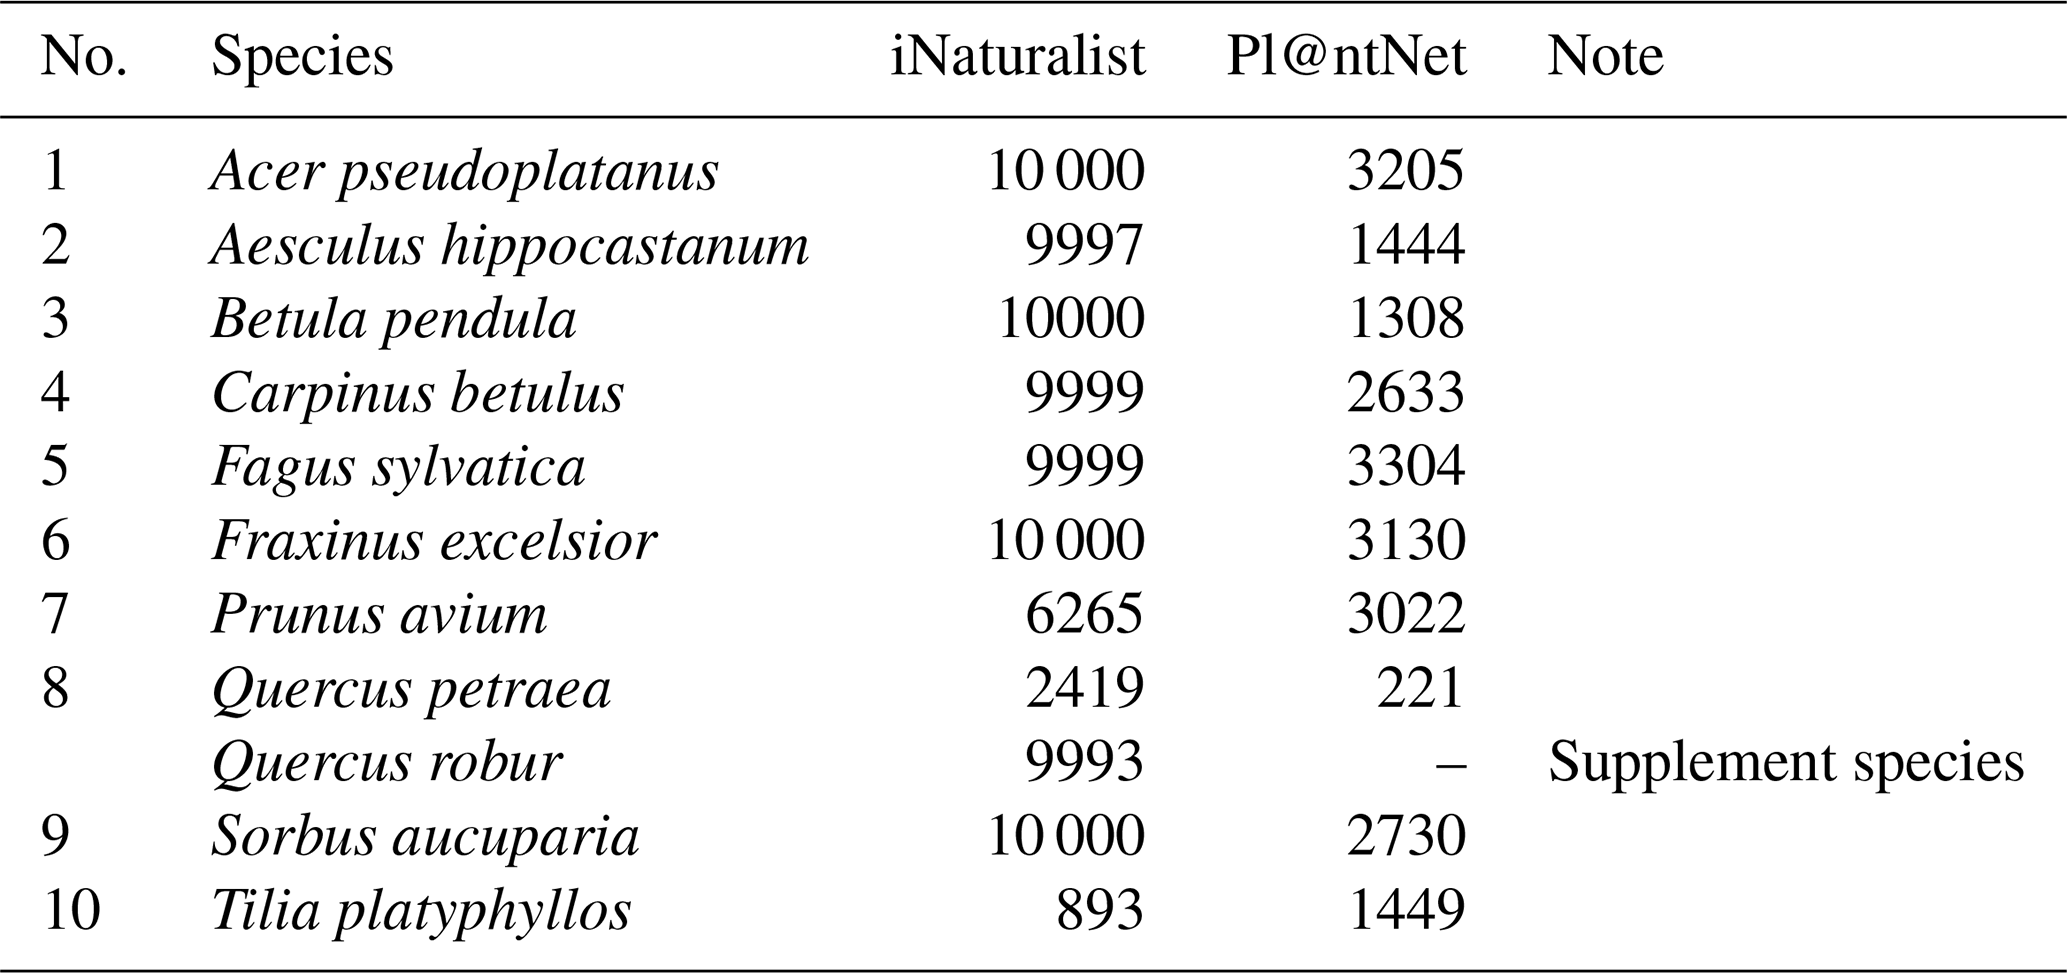
The number of photographs available for each species varied across our two datasets. We were able to download between 893 and 10 000 photographs per species (mean = 7957) from the iNaturalist platform. Likewise, the Pl@ntNet platform provided between 221 and 3304 photographs per species (mean = 2238). Complete details regarding the number of downloaded photos per species are provided in Table A1 in the Appendix.
We preprocessed all photos to ensure a uniform shape by cropping each image to a rectangular shape based on the shorter side and resampling them to 512 × 512 pixels. The RGB values were normalized within the range [0, 1].
2.2 Segmentation mask creation
Various ongoing efforts are being made for automated segmentation of objects in images, with Meta's Segment Anything Model (SAM) being one of the most widely used (Kirillov et al., 2023). SAM segments objects based on boxes or points as inputs.
We automated the process of generating input points for the SAM model by utilizing the feature attribution method Grad-CAM (Selvaraju et al., 2017). Grad-CAM attributes a decision of an existing model to the pixels of an input image in the form of a heatmap. This heatmap thus indicates which areas were important for identifying a class. The citizen science photographs with their simple species labels allowed us to train image classification models for the target tree species to predict if one of the tree species is somewhere in the photograph. Using Grad-CAM, we located the pixels that were important for the model to reveal the approximate location of the species within the image. Then, we sampled points from these image regions as input for the segmentation mask generation using SAM. Thereby, SAM was directly applied to the raw citizen science photographs.
For training the image classification model, we used the EfficientNet-V2 Large architecture (Tan and Le, 2021). The final classifier layer was adjusted to correspond to the number of tree species plus an additional class for the background. The default fully connected layer was substituted with a linear layer comprising eleven output units, which map to each distinct plant species or background class. To achieve a balanced dataset for training, we selected 4000 photographs per class. For those species with fewer available photographs, we duplicated the existing photographs. A data augmentation was applied to all photographs to increase generalization and to minimize the redundancy of duplicated photographs. The data augmentation included random horizontal and vertical flips, color jitter, random cropping, and random erasing with a probability of 20 %.
We explored a range of hyperparameters. Specifically, we tested learning rates from 0.00001 to 0.1 and batch sizes between 5 and 20. Additionally, we evaluated various optimizers (Adam, SGD, AdamW), momentum parameters for SGD (0.4 to 0.99), weight decay for regularization (1 × 10⁻² to 1 × 10⁻⁵), dropout rates (0.1 to 0.5), and multiple dense layer configurations. We also compared different loss functions, including Cross-Entropy Loss and Focal Loss. Initial experiments showed that the AdamW optimizer with moderate weight decay (1 × 10⁻⁴) and no dropout, combined with the dynamic OneCycleLR learning rate scheduler, with a maximum learning rate of 0.01 (Smith, 2018), consistently yielded the most stable and superior convergence.
The optimal hyperparameters identified were a learning rate of 0.001 and a batch size of 16. The final model implementation utilized the PyTorch framework and was trained on a high-performance GPU system (NVIDIA A6000 with 48 GB RAM). We partitioned the reference dataset into training (80 %) and validation sets (20 %).
We used the final model with the lowest validation loss to generate Grad-CAM heatmaps. After several tests, we found that the original Grad-CAM implementation revealed meaningful outputs and had high computational efficiency (Selvaraju et al., 2017). The heatmap values ranged from 0 to 1, with higher values indicating greater importance for a given species' identification. To enhance the precision of input point selection, we applied a contour-based sampling method that restricted point placement to regions with an activation probability threshold > 0.6. After multiple tests, we found that placing two input points per contour yielded optimal segmentation performance. The sampled points were used as input for SAM, which subsequently automatically generated segmentation masks for the citizen science plant photographs. All four steps described in this paragraph are illustrated in the workflow figure, which progresses from the “Heatmap via Grad-CAM” row to the final “Segmentation masks via SAM” row (Fig. 1).
2.3 Harmonizing citizen science photographs with UAV images
We performed several preprocessing steps to improve the consistency between the perspective of the citizen science photographs and UAV orthoimagery. A significant challenge in using citizen science plant photographs is that they often include understory vegetation and background elements (e.g. sky, mountains). The latter are typically not visible in UAV imagery, as they predominantly capture the upper canopy structure. These background elements during training can introduce unwanted variance and increase the complexity of the segmentation model, potentially leading to misclassification and reduced performance.
To simulate the top-down canopy perspective for the citizen science photographs, we replaced the backgrounds in the crowd-sourced photographs with background images derived from the UAV orthomosaic. We used the masks derived with Grad-CAM and SAM to automatically substitute the background of the citizen science photos across the entire dataset. This approach preserved the shape and structure of the target species in the foregrounds, while ensuring that the backgrounds matched the visual characteristics captured in the UAV orthoimage. For the background class, we manually extracted a total of 1879 high-resolution close-up images from the UAV orthoimage, including exposed soil, herbaceous vegetation, and leaf litter ensuring comprehensive coverage of various background types in the study area.
Another preprocessing step involved zoom-outs of the original plant photographs. Citizen science photographs often include close-ups of plants and their leaves. To align such photographs with the often more distant UAV image acquisition geometry, the entire citizen science training dataset was augmented through zoom-out operations. Specifically, we duplicated each photograph and zoomed out the plant foreground by 60 %. This approach ensures that our training dataset includes both the original and zoomed-out photographs. The value of 60 % was set heuristically, since an effective resolution of the citizen science photos is not available.
A common limitation of our automated workflow for mask generation was that it occasionally failed to detect the entire plant within a photograph, instead detecting only small fragments of the foreground plant (e.g., a single branch or leaf). To exclude these incomplete masks and their corresponding photographs, we filtered out all masks when the detected plant in the foreground was less than 30 % of the total photograph area. This threshold was empirically determined as a balance between retaining meaningful samples and removing erroneous data.
Citizen science photographs exhibit substantial variability in acquisition perspectives and settings compared to UAV imagery. UAV images typically capture tree canopies from a consistent bird's eye view at uniform distances, whereas citizen science photographs are very heterogeneous, including close-up views of leaves, horizontal shots of trunks, or landscape views. Previous works demonstrated that excluding photos based on acquisition distance, such as too close to plants, far away showing landscapes, or photos mainly showing tree trunks, improves the precision of species segmentation in UAV orthoimage (Soltani et al., 2022, 2024). To enhance the quality of training data, we applied filters based on acquisition distance and the presence of tree trunks. Since the metadata for these attributes is not available on citizen science platforms, we developed a CNN-based regression model to predict acquisition distances in meters and a separate CNN-based classification model to detect the presence of the trunks. The models were developed in our previous study on tree species, and we used them in the current study without any additional fine-tuning. Estimating acquisition distance from photographs using a CNN-based regression model was first introduced in our previous work Soltani et al. (2022). The model achieved an R2=0.7 on independent test data. This accuracy indicates reliable performance in predicting acquisition distances from crowd-sourced photographs. An example of the model’s predictions and the resulting distance-based filtering is provided in the appendix (Fig. A2).
For an in-depth explanation of the distance estimation, refer to (Soltani et al., 2022). Based on these estimated distances, we excluded photos with acquisition distances of less than 0.2 m or greater than 20 m, as well as photos for which a probability of including a tree trunk was greater than 0.5. After filtering, 65 024 of the original 112 018 photographs were retained for tree species segmentation. Figure 3 illustrates examples of processed images and highlights their visual differences compared to UAV orthoimages.
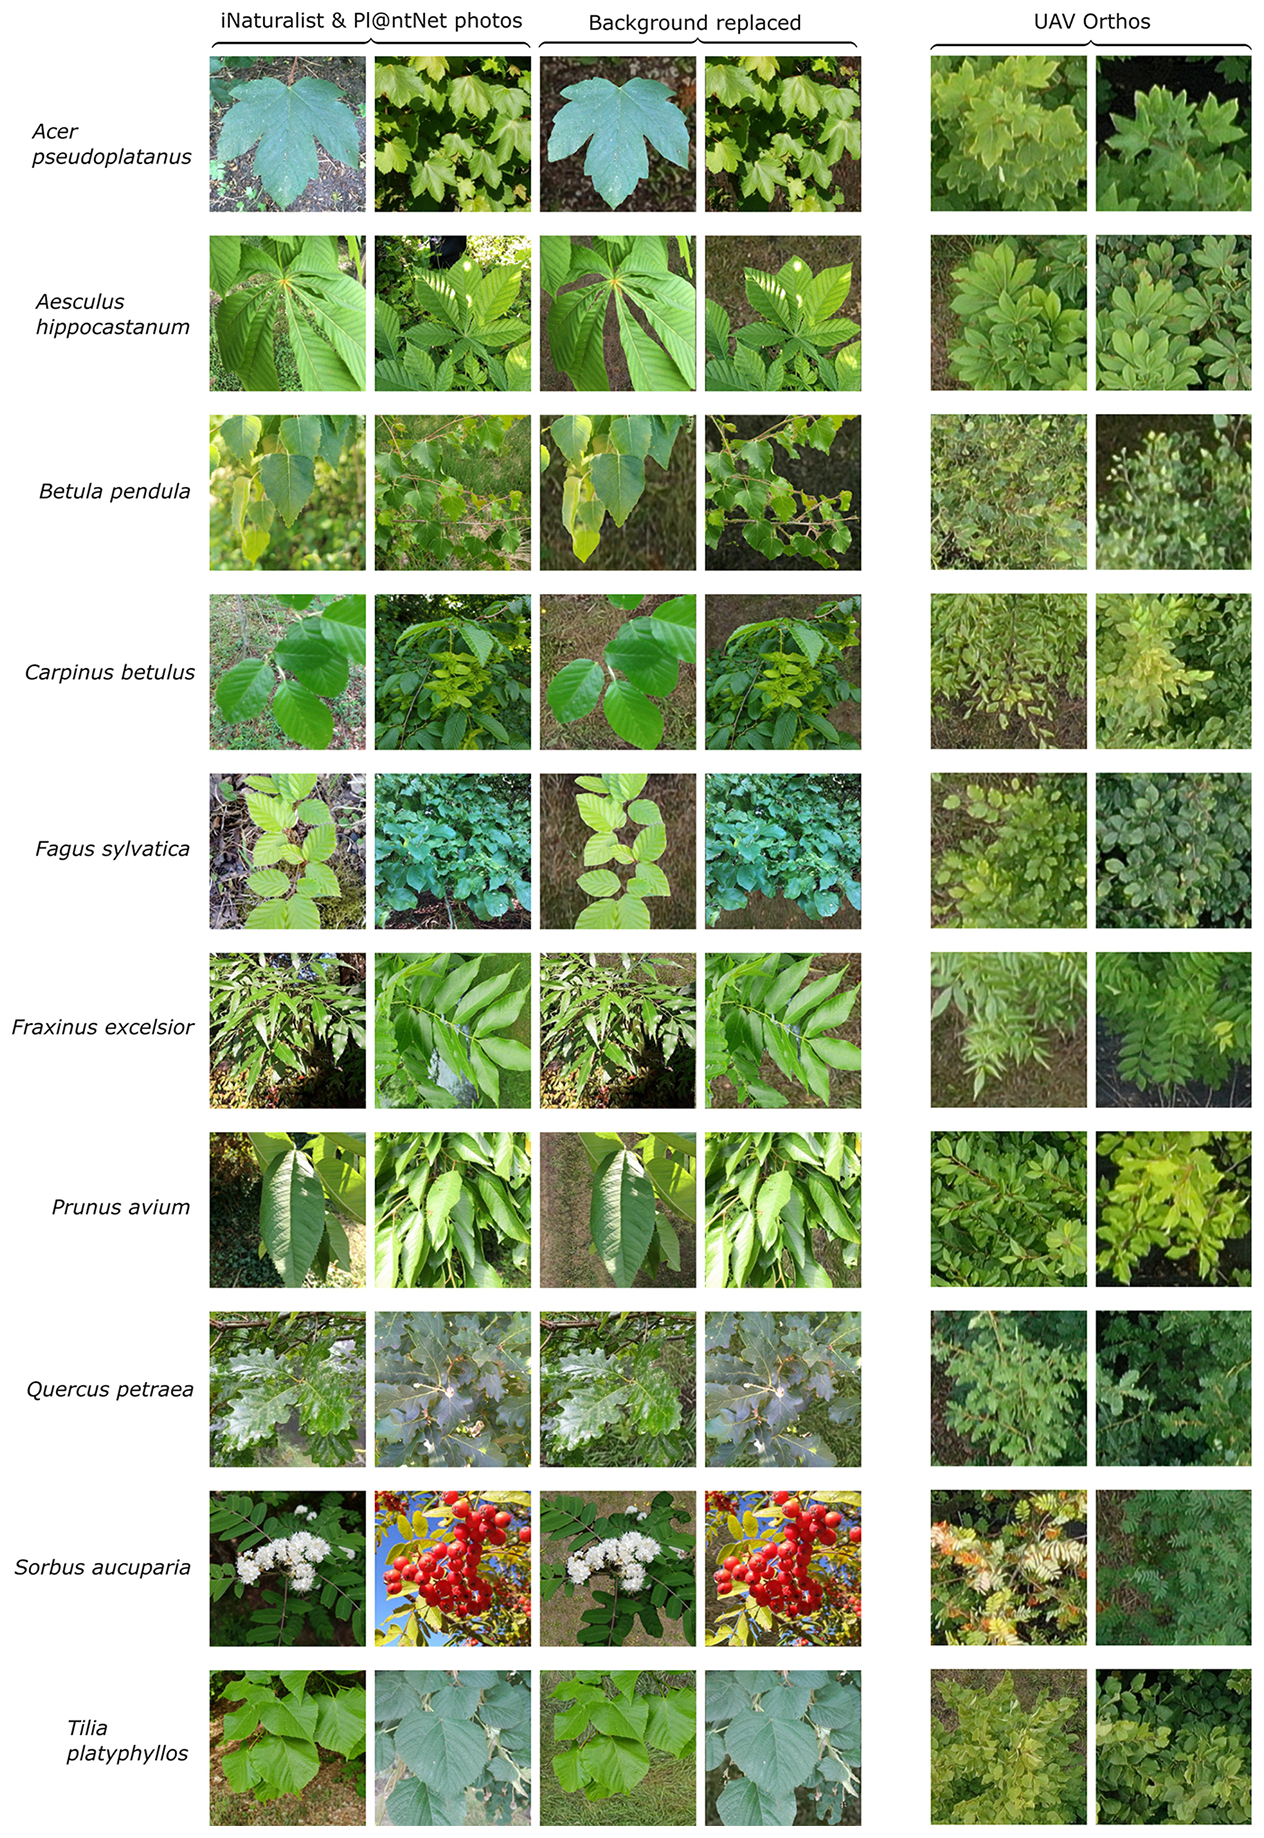
Figure 3Example citizen science-based photographs derived from iNaturalist and Pl@ntNet as well as tiles of UAV orthoimages (512 × 512 pixels) for the ten tree species in the MyDiv experiment.
2.4 CNN-based plant species segmentation using an encoder-decoder architecture
As a segmentation architecture, we chose U-Net (Ronneberger et al., 2015), which is the most widely applied segmentation architecture in remote sensing image segmentation (Kattenborn et al., 2021b). It is implemented as an encoder-decoder network, where the encoder captures hierarchical feature representations and the decoder reconstructs spatial details to generate a dense prediction map. Skip connections link the corresponding encoder and decoder layers, allowing the model to combine high-level semantic information with fine-grained spatial details. This architecture produces semantic segmentation by predicting a class for each input image pixel.
The U-Net architecture implemented in this study consists of a symmetric encoder–decoder structure organized into four stages. Each stage in the encoder applies two convolutional operations with batch normalization and ReLU activations, followed by max-pooling to reduce spatial dimensions and extract higher-level features. The decoder reverses this process through transposed convolutions, progressively refining spatial resolution. Skip connections link encoder and decoder levels to retain spatial detail lost during downsampling. The final layer outputs eleven probability maps corresponding to ten tree species and one background class. A softmax function converts the outputs into probabilities, and each pixel is assigned the class with the highest probability (Fig. A1).
After filtering the training data (see Sect. 2.3), the number of photos per tree species ranged from 2342 to 13 303 samples: Acer pseudoplatanus (6991), Aesculus hippocastanum (7583), Betula pendula (6129), Carpinus betulus (7849), Fagus sylvatica (6873), Fraxinus excelsior (9094), Prunus avium (4883), Quercus petraea (6344), Sorbus aucuparia (7792), and Tilia platyphyllos (1486), and background (1879). Similar to the image classification model training, we sampled 4000 photos per class to avoid any effects of class imbalance. We applied sampling with replacement for the classes with fewer photos. To increase the variance of duplicated photos, we applied data augmentation including vertical and horizontal flips, random brightness adjustments with a maximum delta of ±10 % (0.1), and contrast alterations within a range of 90 % to 110 % (0.9 to 1.1) of the original training photographs. We partitioned the training photographs into 80 % training and 20 % validation sets for the evaluation of the segmentation model.
Similar to the training procedure of the image-classification model used for mask generation (see Sect. 2.2), we tested a range of hyperparameters to optimize the segmentation model’s performance. Learning rates in the range of 10−4–10−3 and batch sizes from 5 to 10 were evaluated. We compared different optimizers, including Adam, SGD, and RMSprop, and tested both ReLU and GELU activation functions. For loss computation, we experimented with a customised Focal Tversky loss using different parameter settings. The weight of the background class was ignored during training, as it appeared in all citizen science plant photographs and contributed disproportionately to the pixel distribution, resulting in strong class imbalance. Ignoring this class allowed the model to better focus on learning the features of the tree species. The Focal Tversky loss adapts the Tversky index by focusing training on hard-to-classify pixels and underrepresented classes, which is particularly beneficial for imbalanced datasets. The final U-Net model was trained using RMSprop with a learning rate of 10−4, a batch size of 10, ReLU activation, and the Focal Tversky loss with α=0.3, β=0.7, and γ=0.75, as this configuration resulted in high segmentation performance across different species.
We trained the models with a batch size of 10 over 80 epochs. We trained the segmentation model on citizen science plant photographs using a fixed data split, with 80 % of the data for training and 20 % for validation. The final segmentation model performance was evaluated using independent reference data derived from visual interpretation of UAV orthoimage transects, which were not used during training (see Sect. 2.1.1).
We evaluated the model performance of the segmentation model using the F1 score. The F1 score combines both Precision and Recall into a single measure, balancing false positives and false negatives (Eq. 1). The formulas used to compute Precision, Recall, and the F1 score are provided below:
In addition, we computed a confusion matrix for each class to reveal systematic confusion between species. We obtained the confusion matrix based on the predicted and reference segmentation masks on a per-pixel basis. For each class, we counted the number of True Positives (TP), False Positives (FP), False Negatives (FN), and True Negatives (TN).
Across the ten tree species, the automated mask creation generated precise segmentation masks. These masks clearly delineated the target species, accurately capturing leaf contours, edges, and complex and even small morphological features such as small twigs, petioles, and branches (Fig. 4). Even in complex image scenarios and across the heterogeneous scene components, such as hands or other species, the masks consistently indicated the silhouettes of the target species.
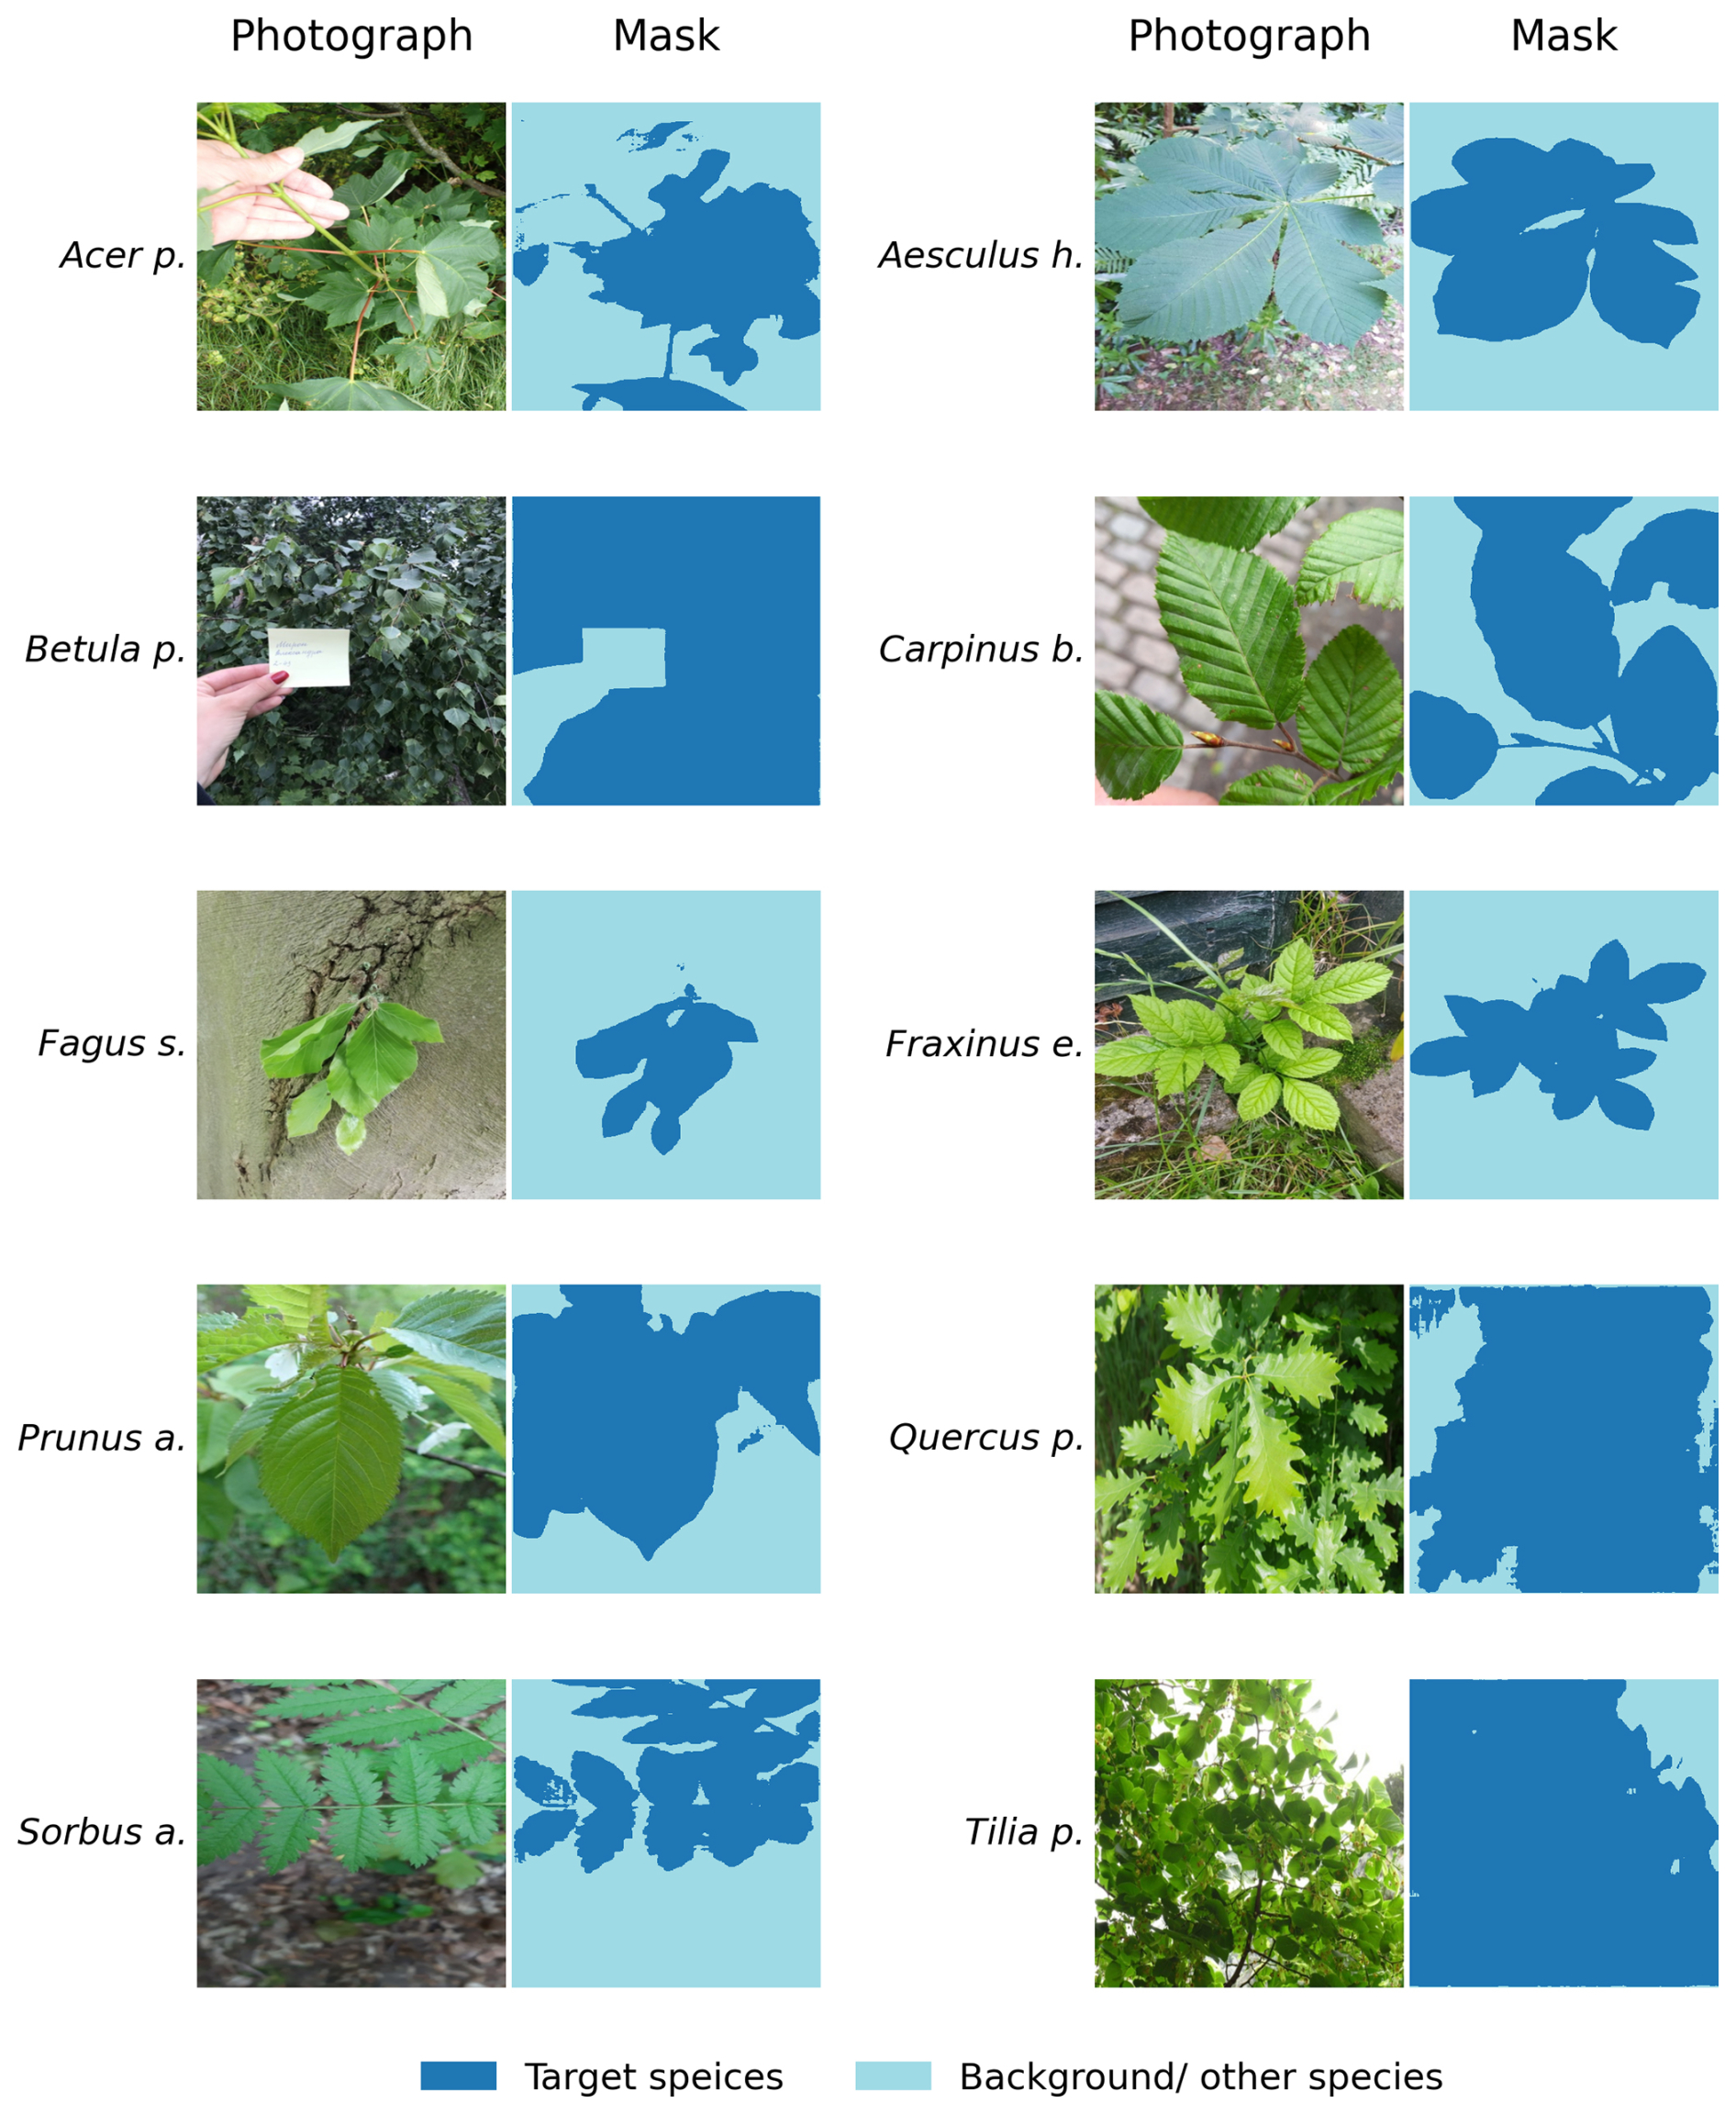
Figure 4Examples of citizen science plant photographs and their corresponding automatically generated segmentation masks for each of the ten tree species.
The U-Net segmentation model was first trained using the automatically derived segmentation masks in 80 epochs. The best model across these epochs, as selected from a validation split of the citizen science data, resulted in an F1 of 0.89 across all tree species and the background class. This model was then applied to the UAV imagery and corresponding reference data. The evaluation on the UAV-based reference data yielded varying F1 scores for the different tree species (Figs. 5 and 6).
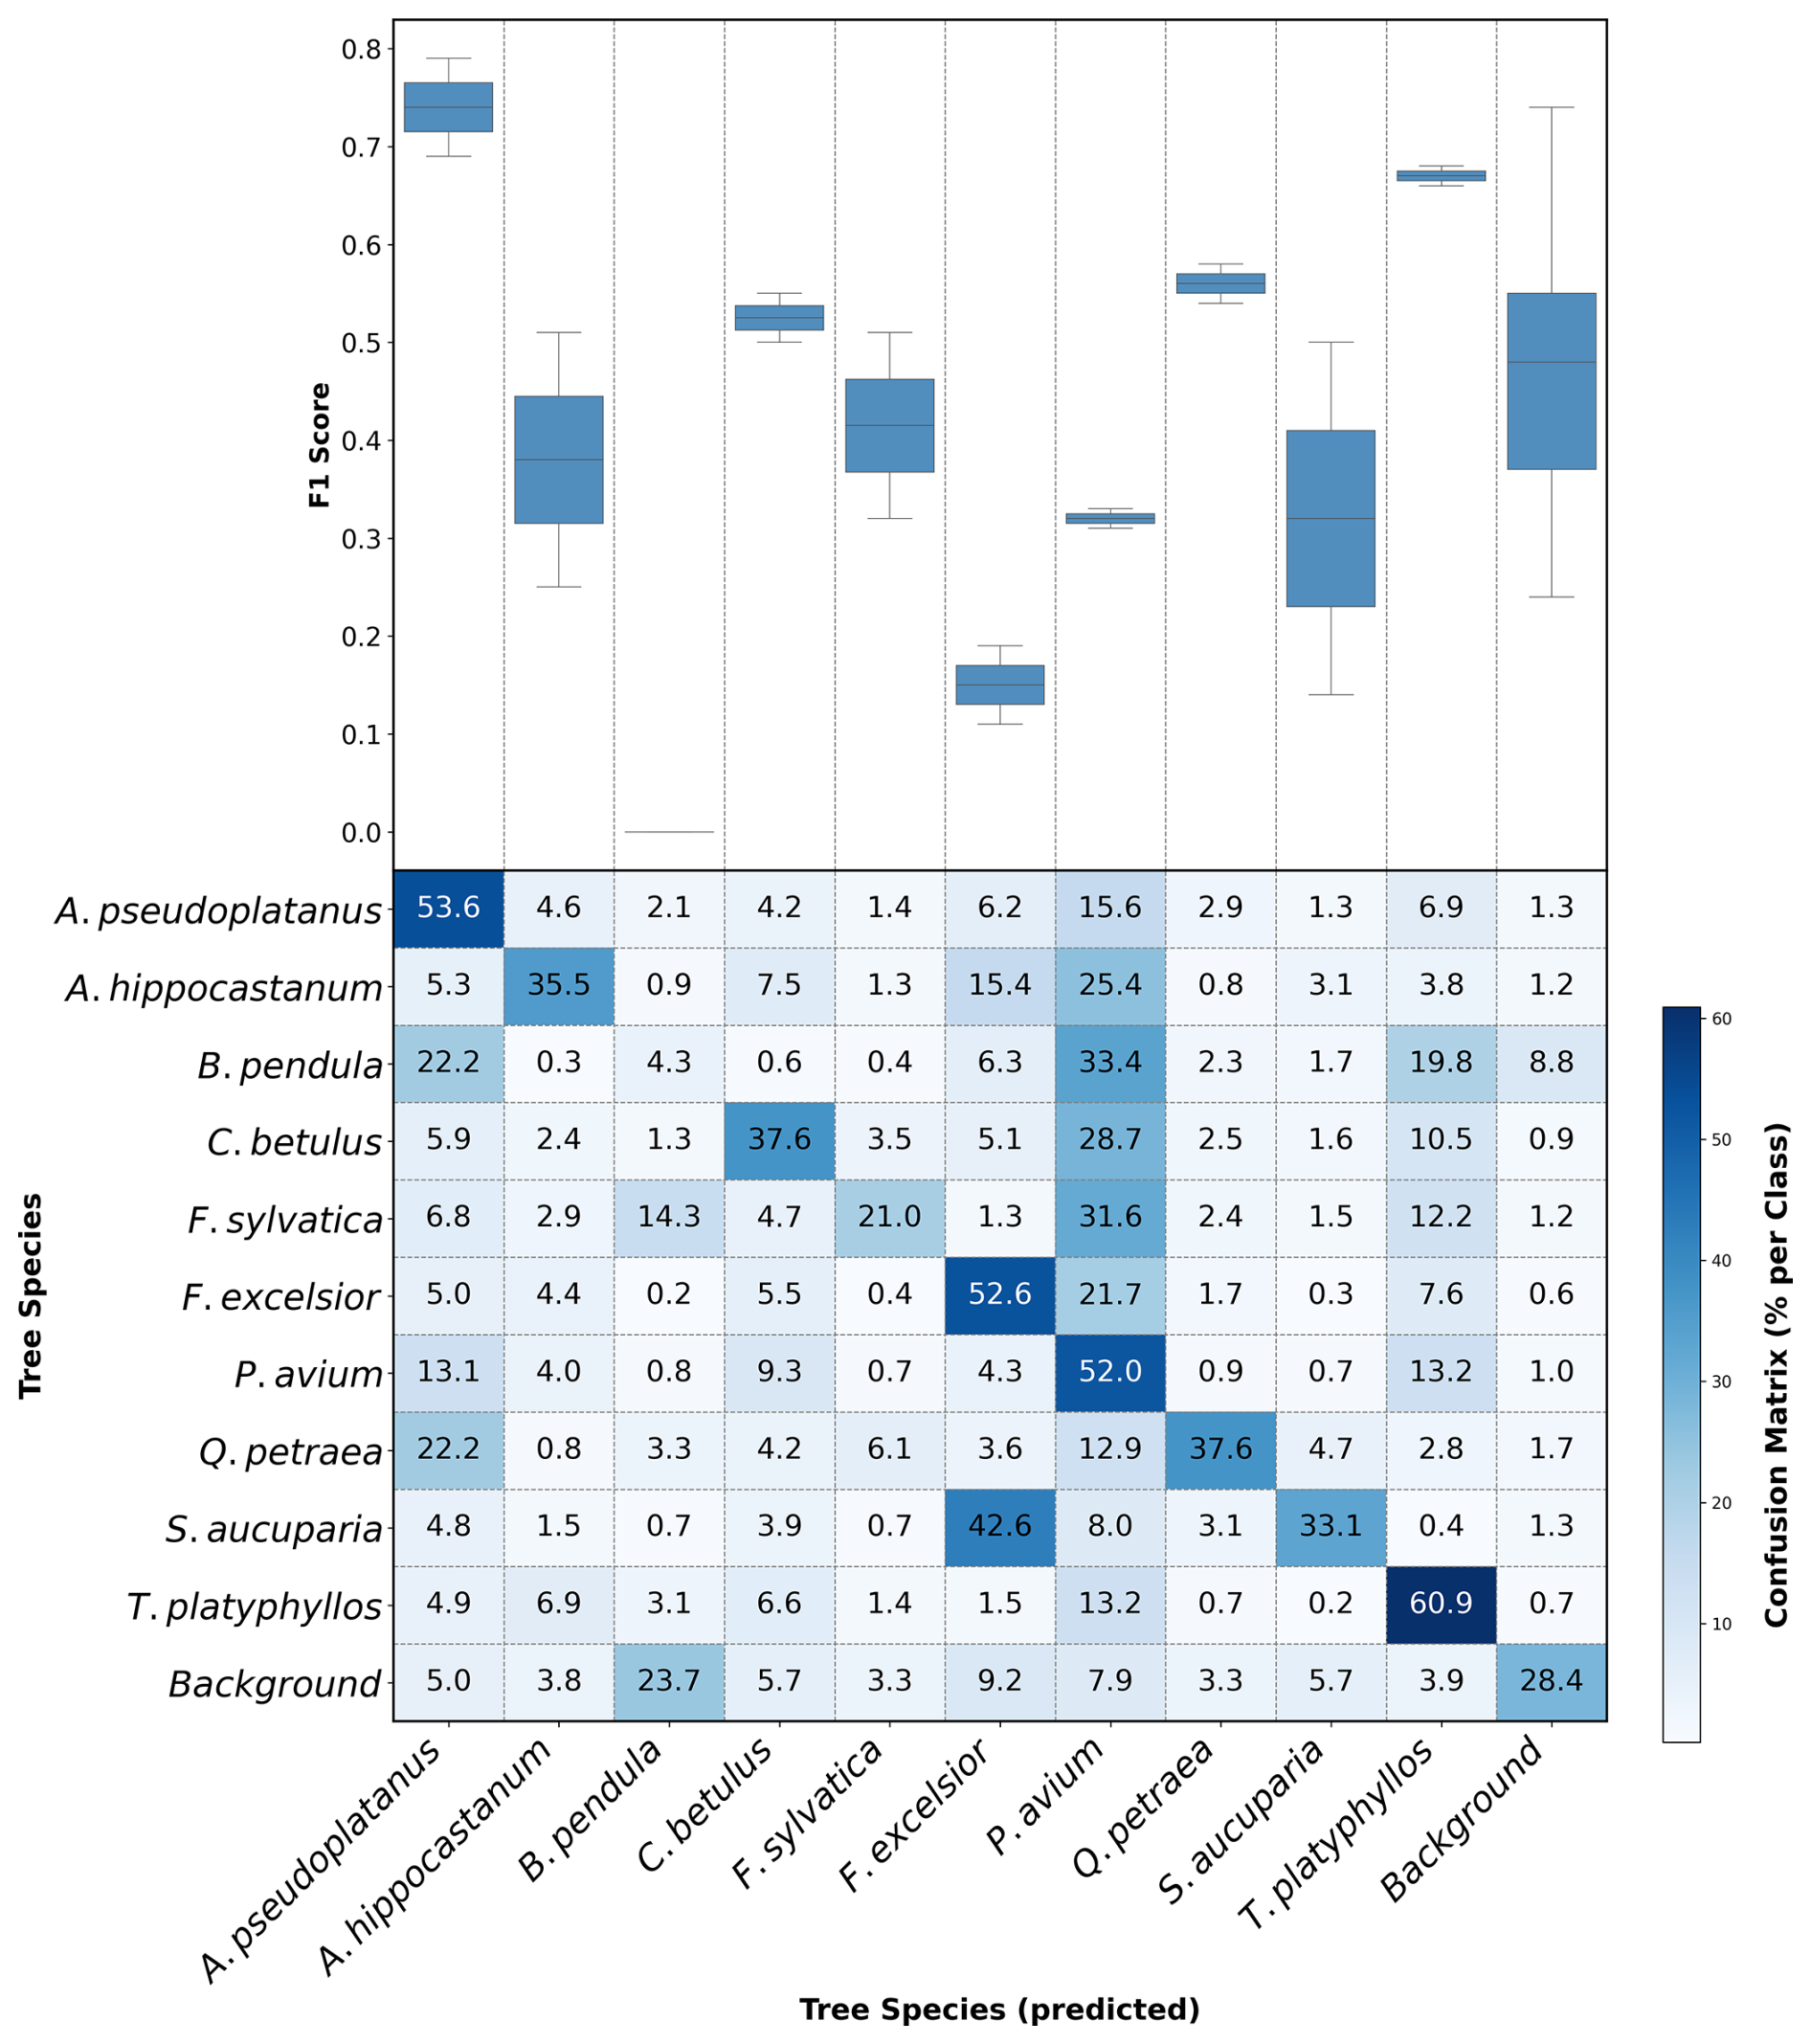
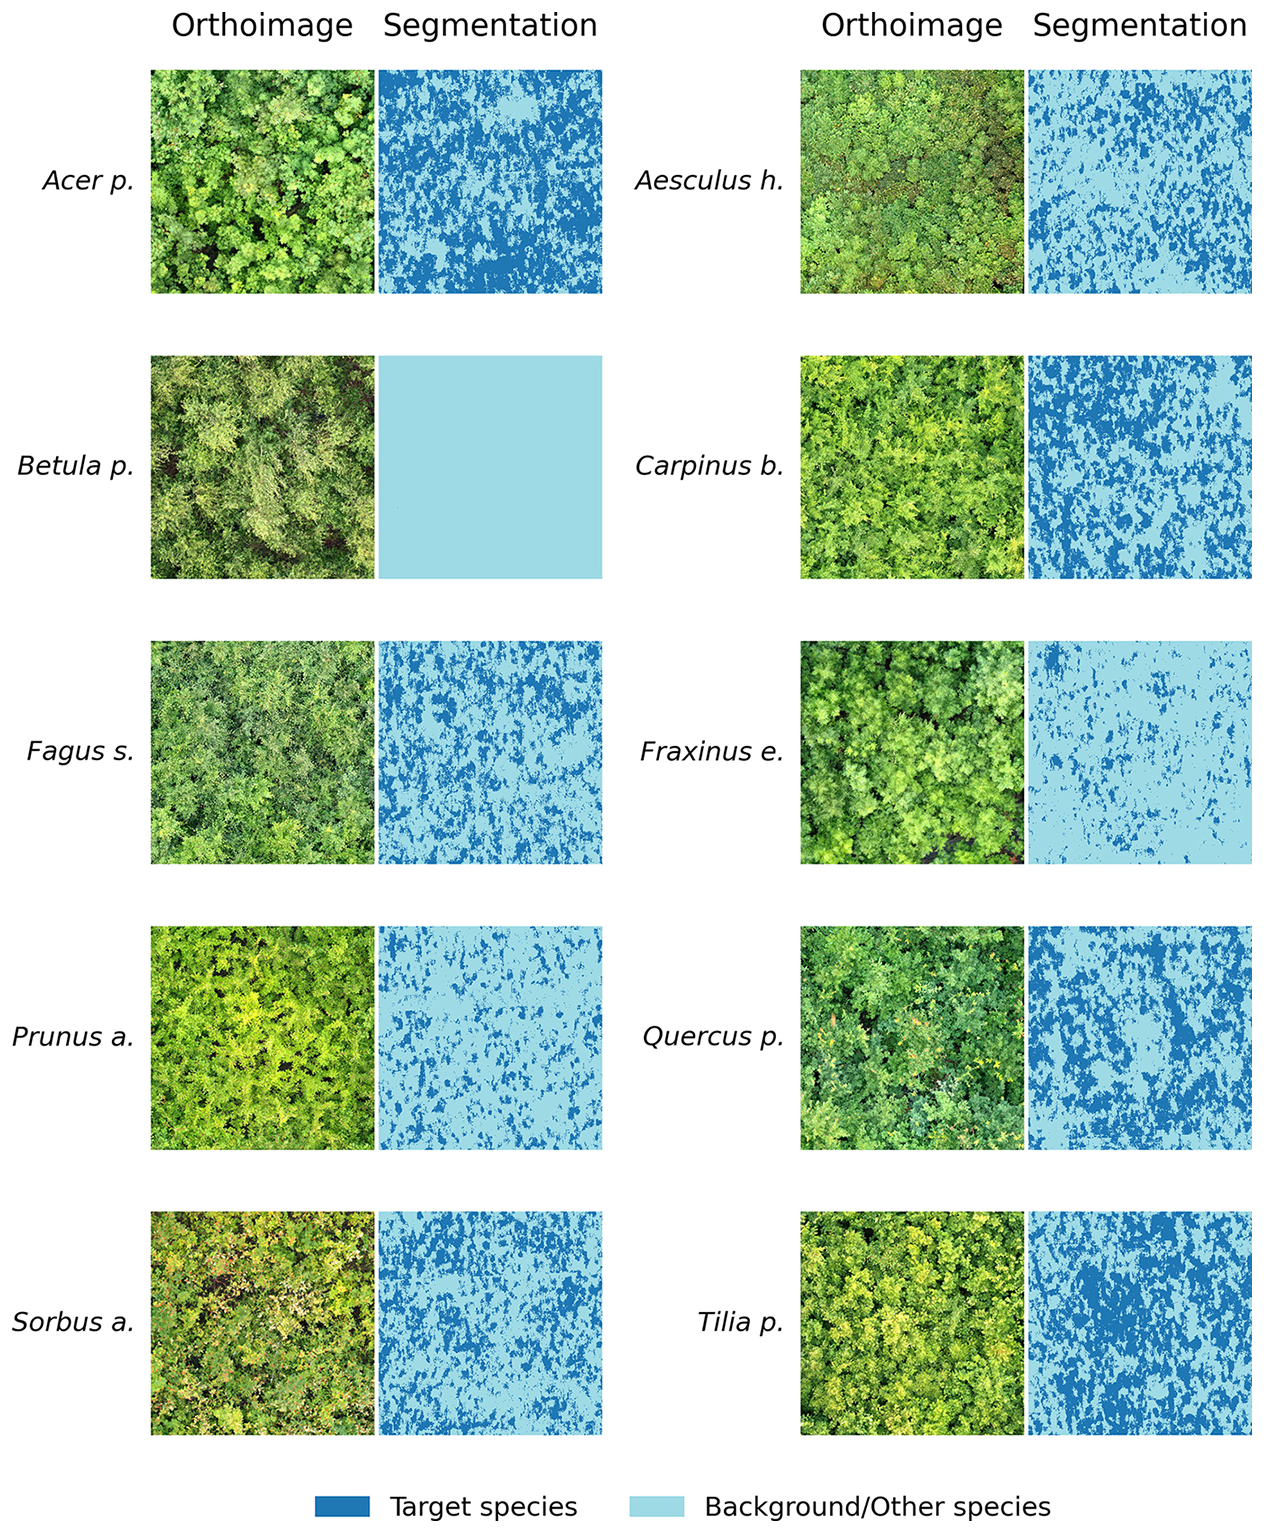
Figure 6Tree species segmentation results in UAV images using the encoder-decoder model trained on citizen science plant photographs and their corresponding masks. A multiclass visualization for each plot, illustrating inter-class confusion, is provided in the appendix (Fig. A3).
At the plot level, high model performance (mean F1 > 0.6) was observed for Acer pseudoplatanus and Tilia platyphyllos. This was followed by moderate performance (mean F1 score: 0.35–0.56) for Aesculus hippocastanum, Carpinus betulus, Fagus sylvatica, and Quercus petraea. Low segmentation performance (mean F1 score < 0.35) was observed for Sorbus aucuparia, Prunus avium, Fraxinus excelsior, and Betula pendula.
We observed large differences in the confusion between species, where some species were rather randomly and sometimes systematically confused with each other. For instance, we observed many false positives for Prunus avium, which was in fact Aesculus hippocastanum (25.4 %), Betula pendula (33.4 %), Carpinus betulus (28.7 %), Fagus sylvatica (31.6 %), and Fraxinus excelsior (21.7 %) (Fig. 5).
Furthermore, Sorbus aucuparia was often confused for Fraxinus excelsior, with the former incorrectly classified at a confusion rate of 42.6 % (Fig. 5). Both the model performance and the confusion were related to leaf size, where the performance of the model declined as the leaf size decreased in the tree species dataset.
4.1 Automated mask generation of citizen science photos using the SAM
Labeling training data for computer vision, particularly for vegetation monitoring using remote sensing data, remains a persistent challenge, primarily due to the complexity and scale of datasets required for such applications (Singh and Surasinghe, 2024; Gillespie et al., 2024; Bah et al., 2018). This challenge is more pronounced for segmentation tasks that require mask labels (Maß and Alirezazadeh, 2025; Illarionova et al., 2022; Kattenborn et al., 2021a). Our proposed method attempts to address this issue by automating the mask generation process through the integration of the SAM foundation model with the Grad-CAM technique (Kirillov et al., 2023; Selvaraju et al., 2017).
In our study, we focussed on using two Grad-CAM-derived input points as the basis for mask generation. Although this approach proved effective, alternative input strategies, such as polygonal annotations or directly using the most activated regions heatmaps, present opportunities for further exploration. Each method has unique trade-offs in terms of computational complexity, mask quality, and suitability for different applications. For example, polygonal annotations might better capture complex shapes, while thresholded heatmaps could provide more generalized masks for species with diffuse features. Exploring these strategies could enhance the adaptability of our methodology to a wider range of plant species and photographic conditions.
One of our notable findings was the delineation precision of the automated workflow for mask generation. From the Grad-CAM-generated input points, SAM was able to follow leaf contours with high precision. Achieving this level of delineation precision through manual efforts is infeasible, especially when handling large datasets. Therefore this automated mask generation addresses one of the most labor-intensive steps in ecological monitoring (Kattenborn et al., 2021b; Katal et al., 2022; Maß and Alirezazadeh, 2025). The capability to automatically and efficiently generate detailed masks removes barriers to annotating large datasets, paving the way to leverage large, heterogeneous datasets for remote sensing applications.
The mask generation approach presented further enabled to tailor the training data to the remote sensing scene. Here, we modified the background of the training data with the background that was observed in UAV imagery. This was only possible due to the precise segmentation masks created using the presented workflow. Previous modeling attempts (results not shown) showed that the presence of various image components, such as understory, may complicate a model transfer to the UAV scale. Instead, removing the original background with the UAV-based background greatly improved the model performance. This innovation highlights that datasets with extreme variance can be tailored to specific remote sensing applications.
By automating segmentation mask generation, our proposed methodology also significantly improves the utility of citizen science data for ecological research. Our approach enables the exploitation of the huge and rapidly growing availability of citizen science plant photographs for remote sensing-based vegetation monitoring. Citizen science platforms such as iNaturalist and Pl@ntNet already include many of the globe's vascular plant species, with many species already being observed hundreds to thousands of times (iNaturalist, 2025; Plantnet, 2025). Automatically labeled citizen science photos as presented in this study can be used as standalone datasets or augment existing training data. Citizen science data further comes with a high variability in image geometries, acquisition dates, and plant status, making it a rich and diverse source of training data. However, this diversity can also hamper model performance if imagery is not curated to match the downstream tasks, which prompted our removal of extremely close and extremely far images during training. Incorporating additional task-specific image adjustments, such as spatial re-sampling to the resolution of the UAV imagery (Martins et al., 2020) should further improve performance. Lastly, both citizen science data collection and UAV data acquisition are effective across diverse landscapes and seasons (Soltani et al., 2024; Katal et al., 2022; Schiller et al., 2021) and scalable across wide geographies (Gillespie et al., 2024; Mosig et al., 2024; Möhring et al., 2025), raising the exciting possibility of real-time, landscape-level vegetation monitoring. This further offers the public unique opportunities to support biodiversity monitoring and conservation by transforming their contributed data into actionable insights for large-scale environmental applications.
Beyond vegetation monitoring, the presented workflow of an automated segmentation mask generation holds transformative potential for a variety of supervised computer vision tasks across multiple domains. Automating the mask generation process not only accelerates the annotation workflow but also significantly improves the scalability and robustness of deep learning models, enabling them to be trained across large datasets where manual annotation would be infeasible.
4.2 Filtering of citizen science data for UAV-related applications
The filtering of citizen science photographs was crucial for aligning ground-based observations with UAV imagery. This process involved selecting photos captured during the growing season (May to September), ensuring appropriate acquisition distances, and excluding images dominated by tree trunks. Since photos of deciduous trees taken during winter primarily show leafless branches, filtering photos acquired beyond the growing seasons enhanced consistency with the UAV imagery.
A challenge of the automated segmentation mask generation was that the dataset was dominated by the background class. To address this, we filtered out photographs where more than 30 % of the photos were covered by the background class. These filtering measures enhanced data quality, minimized irrelevant inputs, and improved overall model performance.
4.3 Segmentation performance
Segmenting temperate broadleaf tree species using UAV imagery presents a complex challenge due to leaf form similarities between many species (Fig. 3). This complexity was evident in the confusion patterns observed in this study, particularly among species such as Sorbus aucuparia and Fraxinus excelsior. Despite having different leaf arrangements, these species appear remarkably similar at the current resolution of UAV imagery (0.22 cm) in the absence of flowers and fruits for Sorbus aucuparia (Fig. 3). This similarity in leaf shape makes them difficult to visually distinguish, even in centimetre-scale orthomosaics. Although Fraxinus excelsior possesses pointy leaves, as visible in citizen science photographs, these subtle distinctions are barely visible in UAV orthoimages, further compounding the classification challenges. These findings are in line with previous studies (Schiefer et al., 2020a; Soltani et al., 2024) and highlight that some species require even higher-resolution UAV data to capture the subtle morphological details critical for species differentiation.
The resolution of UAV imagery is critical for accurate segmentation, as it allows for the detection of fine morphological features such as leaf shape and branching patterns (Kattenborn et al., 2021a; Schiefer et al., 2020b). In this study, species with higher model performance, such as Acer pseudoplatanus and Tilia platyphyllos, benefited from their large, distinct leaves, which were more readily detectable in UAV orthomosaics. However, the presence of other species of the respective genus with a similar leaf shape, e.g. Acer planatonides or Tilia cordata, that were not present in MyDiv but may co-occur in real-world forests, may lead to the similar confusion as between Fraxinus excelsior and Sorbus aucuparia. Still, in the present study, the high F1 scores for Acer pseudoplatanus (mean F1: 0.74) and Tilia platyphyllos (mean F1: 0.67) underscore the advantage of pronounced morphological patterns. However, the model's performance declined significantly for species with smaller or morphologically similar leaves, such as Betula pendula and Fraxinus excelsior. These species demonstrated very low mean F1 scores, indicating a notable limitation in resolving fine-scale distinctions. Higher-resolution UAV images finer than 0.22 cm could allow the model to capture species-specific details that are currently apparent, and subtle differences in leaf shape and arrangement. These findings align with a previous study using the MyDiv dataset, where small canopy areas decreased segmentation performance (Soltani et al., 2024).
Further model improvements might be possible with increasing availability of citizen science photographs. Here, for most species we could obtain between 2342 to 13 303 photographs per species. The increasing size of citizen science data will provide more diverse representations of species across different habitats and seasons (Boone and Basille, 2019). Together with filtering such data and further tailoring it to the UAV perspective, incorporating additional and high-quality citizen science photographs could address current limitations related to the underrepresentation of specific species and enhance the model’s ability to generalize to new environments.
In addition to data-related improvements, leveraging advanced segmentation models could address some of the limitations observed in this study. While U-Net has been effective in segmentation tasks, here, its performance is constrained in scenarios with similar morphological features and complex canopies. More complex architectures or methods, such as transformer or deeper CNN architectures, which integrate multi-scale feature extraction and attention mechanisms, offer promising alternatives (Li et al., 2024). We assume that particularly in concert with higher resolution data, such methods could significantly enhance segmentation accuracy for challenging species like Betula pendula and Fraxinus excelsior.
This study demonstrates the value of citizen science photographs for remote sensing-based plant species identification. We showed that the simple species annotations of citizen science projects can be automatically used to create segmentation masks with high precision. These segmentation masks can then be used to train segmentation models to locate plant species in UAV imagery. Despite the inherent complexity of segmenting broadleaf tree species and their often similar appearance, the model achieved an overall acceptable performance for various species. This performance is enhanced by filtering the citizen science data. Here, we filtered photographs that are not similar to the UAV perspective, including photographs that are too close or too far from the plant or photographs that focus on stems of trees. We also demonstrated that the citizen science photographs can be further tailored to the remote sensing imagery by replacing the background of the photograph using the automatically generated segmentation masks with a typical background of the UAV images. By bridging citizen science with advanced remote sensing and machine learning, this study lays a foundation for inclusive and scalable biodiversity assessments, supporting efforts to understand and preserve Earth's ecosystems.
A1 Segmentation model architecture
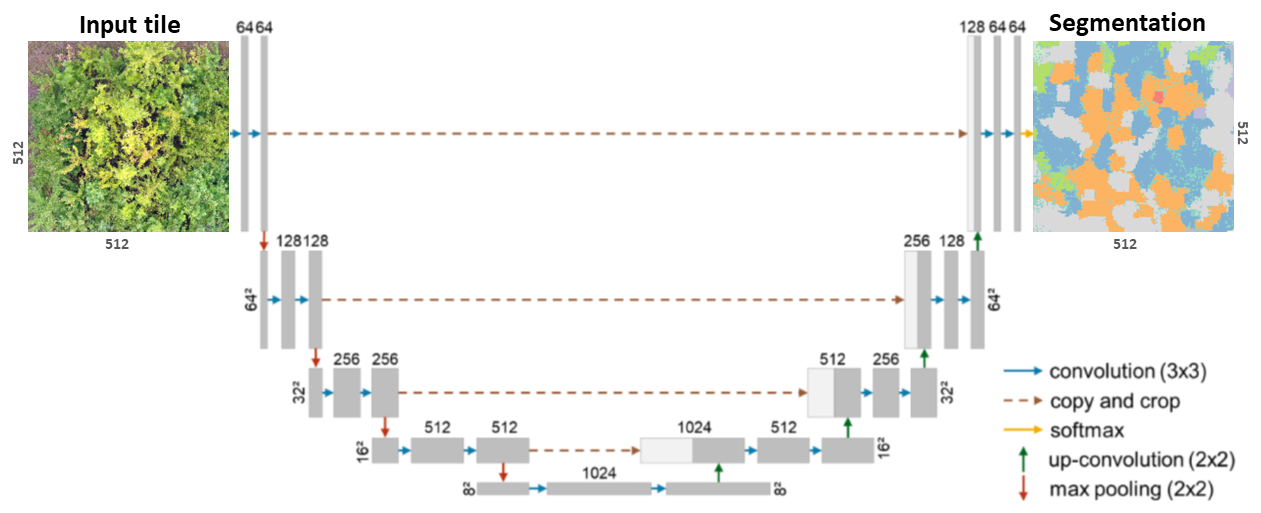
Figure A1U-Net architecture adopted from Soltani et al. (2024) for segmenting tree species in UAV orthoimages (Ronneberger et al., 2015)
A2 Citizen science data availability
Table A1Number of downloaded photographs for selected tree species from the iNaturalist and Pl@ntNet datasets.
A3 Estimation of acquisition distance from photographs
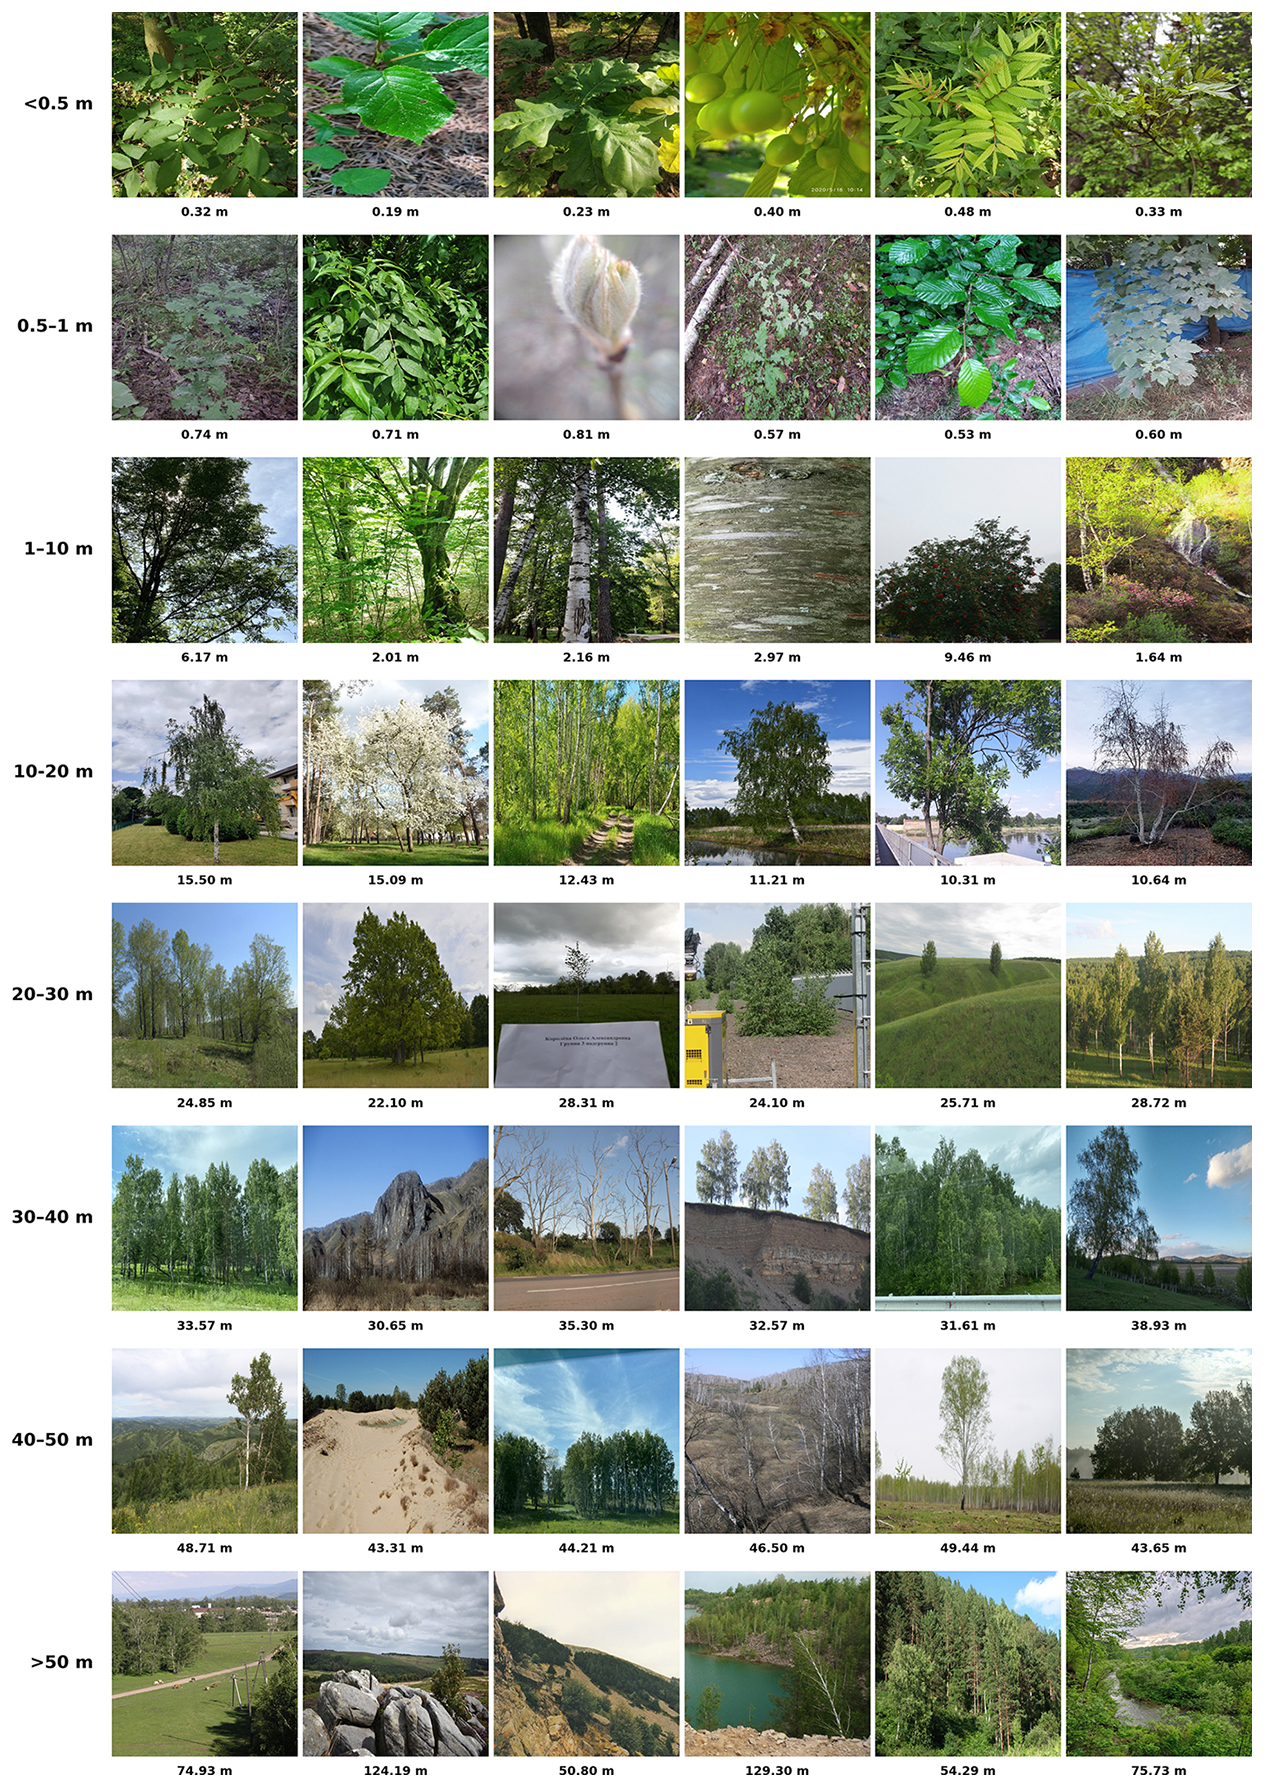
Figure A2Examples of citizen science photographs illustrating the predicted camera-to-object acquisition distances, demonstrating the accuracy and utility of our CNN-based regression model (Soltani et al., 2022). Rows represent increasing predicted distances, ranging from close-up leaf-level details to entire trees and broader landscape views, highlighting the variability in training data. Individual predicted distances are indicated below each image.
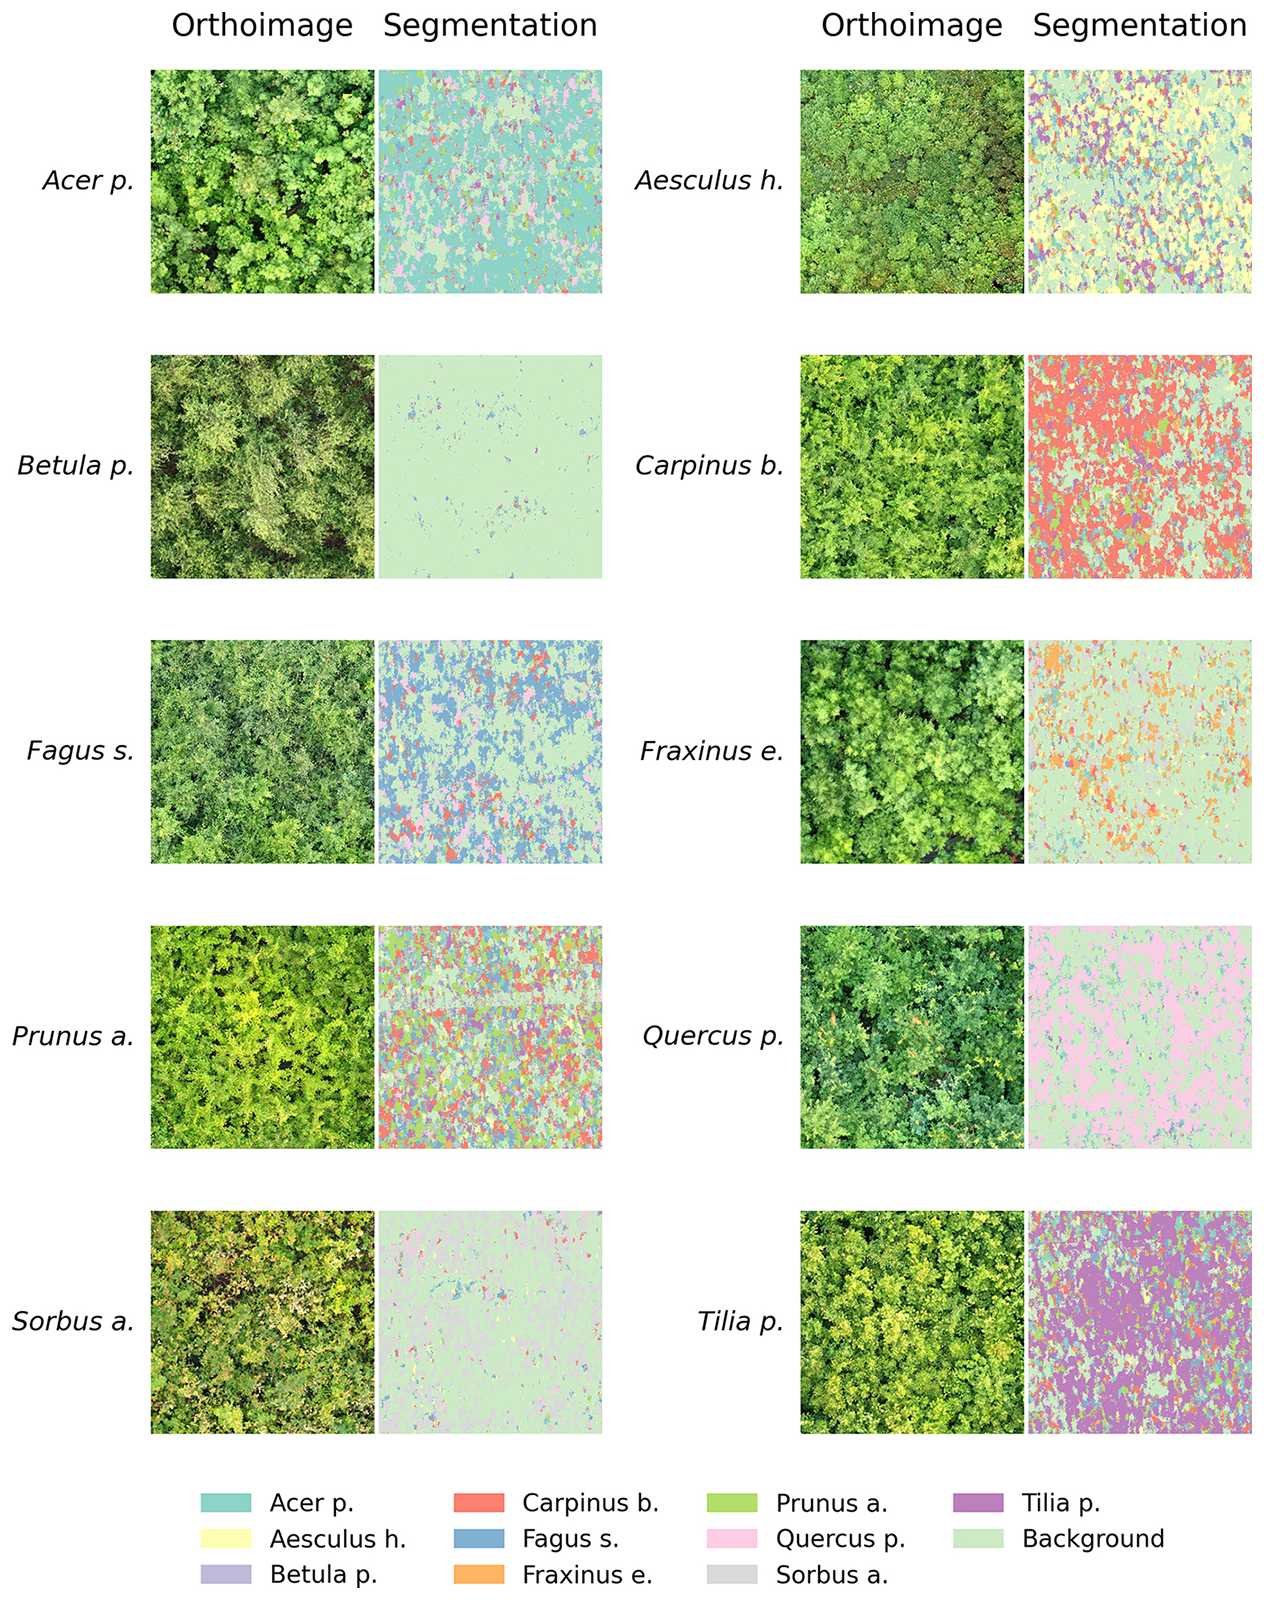
Figure A3Tree species segmentation results in UAV images using the encoder-decoder model trained on citizen science plant photographs and their corresponding masks. The multiclass predictions are visualized across monoculture plots, enabling inspection of segmentation outputs and inter-class confusion.
The code used in this study is publicly accessible via our GitHub repository at https://github.com/salimsoltani28/Flora_Mask (https://doi.org/10.5281/zenodo.17456239, Soltani, 2025). The data supporting the findings of this research is available on Zenodo at https://doi.org/10.5281/zenodo.10019552 (Kattenborn and Soltani, 2023).
SS: conceptualization, methodology, formal analysis, data curation, visualization, and writing – original draft preparation. LEG: mentoring, methodology, writing – review and editing. MEA: provided lab resources, supervision, writing – review and editing. OF: provided resources and contributed to writing – review and editing. NE: provided resources and contributed to writing – review and editing. HF contributed to funding acquisition, supervision, and writing – review and editing. TK contributed to conceptualization, methodology, data collection, funding acquisition, data curation, resource acquisition, supervision, and writing – original draft preparation.
The contact author has declared that none of the authors has any competing interests.
Publisher’s note: Copernicus Publications remains neutral with regard to jurisdictional claims made in the text, published maps, institutional affiliations, or any other geographical representation in this paper. While Copernicus Publications makes every effort to include appropriate place names, the final responsibility lies with the authors. Views expressed in the text are those of the authors and do not necessarily reflect the views of the publisher.
SS and TK acknowledge funding by the German Research Foundation (DFG) under the project BigPlantSens (Assessing the Synergies of Big Data and Deep Learning for the Remote Sensing of Plant Species; project no. 444524904) and PANOPS (Revealing Earth's plant functional diversity with citizen science; project no. 504978936). SS acknowledges financial support from the XR Future Forests Lab, Faculty of Environment and Natural Resources, University of Freiburg (with corresponding funding from the Eva Mayr-Stihl Stiftung). SS also acknowledges funding from the Young Biodiversity Graduate School at the German Centre for Integrative Biodiversity Research. HF acknowledge financial support by the Federal Ministry of Education and Research of Germany (BMBF) and by the Saechsische Staatsministerium für Wissenschaft, Kultur und Tourismus in the program Center of Excellence for AI-research “Center for Scalable Data Analytics and Artificial Intelligence Dresden/Leipzig”, project identification number: ScaDS.AI. NE and OF acknowledge funding by the Deutsche Forschungsgemeinschaft DFG (German Centre for Integrative Biodiversity Research, FZT118; and Gottfried Wilhelm Leibniz Prize, Ei 862/29-1). LEG acknowledges funding by the NSF Graduate Research Fellowship DGE-1656518 and the TomKat Graduate Fellowship for Translational Research. Lastly, MEA acknowledges funding by the Office of the Director of the National Institutes of Health’s Early Investigator Award (1DP5OD029506-01), the U.S. Department of Energy, Office of Biological and Environmental Research (DE-SC0021286), and by the U.S. National Science Foundation's DBI Biology Integration Institute WALII (Water and Life Interface Institute, 2213983).
This research has been supported by the Deutsche Forschungsgemeinschaft (DFG; BigPlantSens, project no. 444524904, and PANOPS, project no. 504978936), the Federal Ministry of Education and Research of Germany (BMBF) and the Saxon State Ministry for Science, Culture and Tourism (SMWK) through the Center of Excellence for AI research “ScaDS.AI Dresden/Leipzig” (project ID: ScaDS.AI), the Eva Mayr-Stihl Stiftung (XR Future Forests Lab, University of Freiburg), and the German Centre for Integrative Biodiversity Research (iDiv, FZT 118; Gottfried Wilhelm Leibniz Prize Ei 862/29-1). Additional support was provided by the U.S. National Science Foundation (DGE-1656518, 2213983), the National Institutes of Health (1DP5OD029506-01), and the U.S. Department of Energy (DE-SC0021286).
This open-access publication was funded by the University of Freiburg.
This paper was edited by Andrew Feldman and reviewed by two anonymous referees.
Affouard, A., Goëau, H., Bonnet, P., Lombardo, J.-C., and Joly, A.: Pl@ ntnet app in the era of deep learning, in: ICLR: International Conference on Learning Representations [data set], https://www.gbif.org/dataset/7a3679ef-5582-4aaa-81f0-8c2545cafc81 (last access: 10 February 2025), 2017. a
Bah, M. D., Hafiane, A., and Canals, R.: Deep Learning with Unsupervised Data Labeling for Weed Detection in Line Crops in UAV Images, Remote Sens., 10, 1690, https://doi.org/10.3390/rs10111690, 2018. a
Bayraktar, E., Basarkan, M. E., and Celebi, N.: A low-cost UAV framework towards ornamental plant detection and counting in the wild, ISPRS Journal of Photogrammetry and Remote Sensing, 167, 1–11, 2020. a
Boone, M. E. and Basille, M.: Using iNaturalist to contribute your nature observations to science, EDIS, 2019, 5–5, 2019. a, b
Bouguettaya, A., Zarzour, H., Kechida, A., and Taberkit, A. M.: Deep learning techniques to classify agricultural crops through UAV imagery: A review, Neural Computing and Applications, 34, 9511–9536, 2022. a
Brandt, M., Tucker, C. J., Kariryaa, A., Rasmussen, K., Abel, C., Small, J., Chave, J., Rasmussen, L. V., Hiernaux, P., Diouf, A. A., Kergoat, L., Mertz, O., Igel, C., Gieseke, F., Schöning, J., Li, S., Melocik, K., Meyer, J., Sinno, S., Romero, E., Glennie, E., Montagu, A., Dendoncker, M., and Fensholt, R.: An unexpectedly large count of trees in the West African Sahara and Sahel, Nature, 587, 78–82, 2020. a
Brodrick, P. G., Davies, A. B., and Asner, G. P.: Uncovering ecological patterns with convolutional neural networks, Trends in Ecology & Evolution, 34, 734–745, 2019. a
Curnick, D. J., Davies, A. J., Duncan, C., Freeman, R., Jacoby, D. M., Shelley, H. T., Rossi, C., Wearn, O. R., Williamson, M. J., and Pettorelli, N.: SmallSats: a new technological frontier in ecology and conservation?, Remote Sensing in Ecology and Conservation, https://doi.org/10.1002/rse2.239, 2021. a
Di Cecco, G. J., Barve, V., Belitz, M. W., Stucky, B. J., Guralnick, R. P., and Hurlbert, A. H.: Observing the observers: How participants contribute data to iNaturalist and implications for biodiversity science, BioScience, 71, 1179–1188, 2021. a
Fassnacht, F. E., Latifi, H., Stereńczak, K., Modzelewska, A., Lefsky, M., Waser, L. T., Straub, C., and Ghosh, A.: Review of studies on tree species classification from remotely sensed data, Remote Sensing of Environment, 186, 64–87, 2016. a
Ferlian, O., Cesarz, S., Craven, D., Hines, J., Barry, K. E., Bruelheide, H., Buscot, F., Haider, S., Heklau, H., Herrmann, S., Kühn, P., Pruschitzki, U., Schädler, M., Wagg, C., Weigelt, A., Wubet, T., and Eisenhauer, N.: Mycorrhiza in tree diversity–ecosystem function relationships: conceptual framework and experimental implementation, Ecosphere, 9, e02226, https://doi.org/10.1002/ecs2.2226, 2018. a, b
Galuszynski, N. C., Duker, R., Potts, A. J., and Kattenborn, T.: Automated mapping of Portulacaria afra canopies for restoration monitoring with convolutional neural networks and heterogeneous unmanned aerial vehicle imagery, PeerJ, 10, e14219, https://doi.org/10.7717/peerj.14219, 2022. a
GBIF: GBIF: the global biodiversity information facility [data set], https://www.gbif.org/occurrence/search?q=plantae&taxon_key=6 (last access: 10 February 2025), 2019. a
Gillespie, L. E., Ruffley, M., and Expósito-Alonso, M.: Deep Learning Models Map Rapid Plant Species Changes from Citizen Science and Remote Sensing Data, Proceedings of the National Academy of Sciences, https://doi.org/10.1073/pnas.2318296121, 2024. a, b
Hoeser, T. and Kuenzer, C.: Object detection and image segmentation with deep learning on earth observation data: A review-part i: Evolution and recent trends, Remote Sensing, 12, 1667, https://doi.org/10.3390/rs12101667, 2020. a
iNaturalist: iNaturalist Observations – Plantae, iNaturalist Website, https://www.inaturalist.org/observations?view=species&iconic_taxa=Plantae (last access: 10 February 2025), 2025. a
Illarionova, S., Shadrin, D., and Ignatiev, V.: A Survey of Computer Vision Techniques for Forest Characterization and Carbon Monitoring Tasks, MDPI Remote Sensing, https://doi.org/10.3390/rs14225861, 2022. a
Joly, A., Bonnet, P., Goëau, H., Barbe, J., Selmi, S., Champ, J., Dufour-Kowalski, S., Affouard, A., Carré, J., Molino, J.-F., Boujemaa, N., and Barthélémy, D.: A look inside the Pl@ntNet experience: The good, the bias and the hope, Multimedia Systems, 22, 751–766, 2016. a, b, c
Katal, N., Rzanny, M., Mäder, P., and Wäldchen, J.: Deep Learning in Plant Phenological Research: A Systematic Literature Review, Frontiers in Plant Science, https://doi.org/10.3389/fpls.2022.805738, 2022. a, b
Kattenborn, T. and Soltani, S.: CrowdVision2TreeSegment, Zenodo [data set], https://doi.org/10.5281/zenodo.10019552, 2023. a
Kattenborn, T., Eichel, J., and Fassnacht, F. E.: Convolutional Neural Networks enable efficient, accurate and fine-grained segmentation of plant species and communities from high-resolution UAV imagery, Scientific Reports, 9, 1–9, 2019. a, b
Kattenborn, T., Leitloff, J., and Schiefer, F.: Review on Convolutional Neural Networks in Vegetation Remote Sensing, ISPRS Journal of Photogrammetry and Remote Sensing, https://doi.org/10.1016/j.isprsjprs.2020.12.010, 2021a. a, b, c
Kattenborn, T., Leitloff, J., Schiefer, F., and Hinz, S.: Review on Convolutional Neural Networks (CNN) in vegetation remote sensing, ISPRS Journal of Photogrammetry and Remote Sensing, 173, 24–49, 2021b. a, b, c, d, e, f
Kirillov, A., Mintun, E., Ravi, N., Mao, H., Rolland, C., Gustafson, L., Xiao, T., Whitehead, S., Berg, A. C., Lo, W.-Y., Dollár, P., and Girshick, R. B.: Segment Anything, arXiv [preprint], https://doi.org/10.48550/arXiv.2304.02643, 2023. a, b, c
Leitão, P. J., Schwieder, M., Pötzschner, F., Pinto, J. R. R., Teixeira, A. M. C., Pedroni, F., Sanchez, M., Rogass, C., van der Linden, S., Bustamante, M. M. C., and Hostert, P.: From sample to pixel: multi-scale remote sensing data for upscaling aboveground carbon data in heterogeneous landscapes, Ecosphere, 9, e02298, https://doi.org/10.1002/ecs2.2298, 2018. a
Li, J., Cai, Y., Li, Q., Kou, M., and Zhang, T.: A review of remote sensing image segmentation by deep learning methods, International Journal of Digital Earth, 17, 2328827, https://doi.org/10.1080/17538947.2024.2328827, 2024. a
Lopatin, J., Dolos, K., Kattenborn, T., and Fassnacht, F. E.: How canopy shadow affects invasive plant species classification in high spatial resolution remote sensing, Remote Sensing in Ecology and Conservation, 5, 302–317, 2019. a
Maes, W. H. and Steppe, K.: Perspectives for remote sensing with unmanned aerial vehicles in precision agriculture, Trends in Plant Science, 24, 152–164, 2019. a
Martins, V. S., Kaleita, A. L., Gelder, B. K., da Silveira, H. L., and Abe, C. A.: Exploring multiscale object-based convolutional neural network (multi-OCNN) for remote sensing image classification at high spatial resolution, ISPRS Journal of Photogrammetry and Remote Sensing, 168, 56–73, 2020. a
Maß, V. and Alirezazadeh, P.: Annotated Image Dataset with Different Stages of European Pear Rust for UAV-Based Automated Symptom Detection in Orchards, ScienceDirect, https://doi.org/10.1016/j.dib.2025.111271, 2025. a, b
Möhring, J., Kattenborn, T., Mahecha, M. D., Cheng, Y., Schwenke, M. B., Cloutier, M., Denter, M., Frey, J., Gassilloud, M., Göritz, A., Hempel, J., Horion, S., Jucker, T., Junttila, S., Khatri-Chhetri, P., Korznikov, K., Kruse, S., Laliberté, E., Maroschek, M., Neumeier, P., Pérez-Priego, O., Potts, A., Schiefer, F., Seidl, R., Vajna-Jehle, J., Zielewska-Büttner, K., and Mosig, C.: Global, multi-scale standing deadwood segmentation in centimeter-scale aerial images, Authorea [preprint], https://doi.org/10.36227/techrxiv.174137781.13803217/v1, 2025. a
Mosig, C., Vajna-Jehle, J., Mahecha, M. D., Cheng, Y., Hartmann, H., Montero, D., Junttila, S., Horion, S., Schwenke, M. B., Adu-Bredu, S., Al-Halbouni, D., Allen, M., Altman, J., Angiolini, C., Astrup, R., Barrasso, C., Bartholomeus, H., Brede, B., Buras, A., Carrieri, E., Chirici, G., Cloutier, M., Cushman, K. C., Dalling, J. W., Dempewolf, J., Denter, M., Ecke, S., Eichel, J., Eltner, A., Fabi, M., Fassnacht, F., Ferreira, M. P., Frey, J., Frick, A., Ganz, S., Garbarino, M., García, M., Gassilloud, M., Ghasemi, M., Giannetti, F., Gonzalez, R., Gosper, C., Greinwald, K., Grieve, S., Aguirre-Gutierrez, J., Göritz, A., Hajek, P., Hedding, D., Hempel, J., Hernández, M., Heurich, M., Honkavaara, E., Jucker, T., Kalwij, J. M., Khatri-Chhetri, P., Klemmt, H.-J., Koivumäki, N., Korznikov, K., Kruse, S., Krüger, R., Laliberté, E., Langan, L., Latifi, H., Lehmann, J., Li, L., Lines, E., Lopatin, J., Lucieer, A., Ludwig, M., Ludwig, A., Lyytikäinen-Saarenmaa, P., Ma, Q., Marino, G., Maroschek, M., Meloni, F., Menzel, A., Meyer, H., Miraki, M., Moreno-Fernández, D., Müller-Landau, H. C., Mälicke, M., Möhring, J., Müllerova, J., Neumeier, P., Näsi, R., Oppgenoorth, L., Palmer, M., Paul, T., Potts, A., Prober, S., Puliti, S., Pérez-Priego, O., Reudenbach, C., Rossi, C., Rühr, N. K., Ruiz-Benito, P., Runge, C. M., Scherer-Lorenzen, M., Schiefer, F., Schladebach, J., Schmehl, M.-T., Schwarz, S., Seidl, R., Shafeian, E., de Simone, L., Sohrabi, H., Sotomayor, L., Sparrow, B., Steer, B. S. C., Stenson, M., Stöckigt, B., Su, Y., Suomalainen, J., Torresani, M., Umlauft, J., Vargas-Ramírez, N., Volpi, M., Vásquez, V., Weinstein, B., Tagle-Casapia, X., Zdunic, K., Zielewska-Büttner, K., de Oliveira, R. A., van Wagtendonk, L., von Dosky, V., and Kattenborn, T.: deadtrees. earth-An Open-Access and Interactive Database for Centimeter-Scale Aerial Imagery to Uncover Global Tree Mortality Dynamics, bioRxiv, 2024–10, https://doi.org/10.1101/2024.10.18.619094, 2024. a
Müllerová, J., Brundu, G., Große-Stoltenberg, A., Kattenborn, T., and Richardson, D. M.: Pattern to process, research to practice: remote sensing of plant invasions, Biological Invasions, 26 pp., https://doi.org/10.1007/s10530-023-03150-z, 2023. a
Plantnet: Stats – Pl@ntNet – Plant Identifier, Pl@ntNet Website, https://identify.plantnet.org/stats (last access: 10 February 2025), 2025. a
Ronneberger, O., Fischer, P., and Brox, T.: U-net: Convolutional networks for biomedical image segmentation, in: International Conference on Medical image computing and computer-assisted intervention, Springer, 234–241, https://doi.org/10.1007/978-3-319-24574-4_28, 2015. a, b
Schiefer, F., Kattenborn, T., Frick, A., Frey, J., Schall, P., Koch, B., and Schmidtlein, S.: Mapping forest tree species in high resolution UAV-based RGB-imagery by means of convolutional neural networks, ISPRS Journal of Photogrammetry and Remote Sensing, 170, 205–215, https://doi.org/10.1016/j.isprsjprs.2020.10.015, 2020a. a
Schiefer, F., Kattenborn, T., Frick, A., Frey, J., Schall, P., Koch, B., and Schmidtlein, S.: Mapping forest tree species in high resolution UAV-based RGB-imagery by means of convolutional neural networks, ISPRS Journal of Photogrammetry and Remote Sensing, 170, 205–215, 2020b. a, b, c, d
Schiller, C., Schmidtlein, S., Boonman, C., Moreno-Martínez, A., and Kattenborn, T.: Deep learning and citizen science enable automated plant trait predictions from photographs, Scientific Reports, 11, 1–12, 2021. a
Selvaraju, R. R., Cogswell, M., Das, A., Vedantam, R., Parikh, D., and Batra, D.: Grad-CAM: Visual explanations from deep networks via gradient-based localization, in: Proceedings of the IEEE International Conference on Computer Vision, 618–626, https://doi.org/10.1109/ICCV.2017.74, 2017. a, b, c, d
Singh, K. K. and Surasinghe, T. D.: Systematic Review and Best Practices for Drone Remote Sensing of Invasive Plants, Wiley Online Library, https://doi.org/10.1111/2041-210X.14330, 2024. a
Smith, L. N.: A disciplined approach to neural network hyper-parameters: Part 1 – learning rate, batch size, momentum, and weight decay, arXiv [preprint] arXiv:1803.09820, https://doi.org/10.48550/arXiv.1803.09820, 2018. a
Soltani, S.: salimsoltani28/Flora_Mask: Flora_Mask (Final_release), Zenodo [code], https://doi.org/10.5281/zenodo.17456239, 2025. a
Soltani, S., Feilhauer, H., Duker, R., and Kattenborn, T.: Transfer learning from citizen science photographs enables plant species identification in UAVs imagery, ISPRS Open Journal of Photogrammetry and Remote Sensing, 100016, https://doi.org/10.1016/j.ophoto.2022.100016, 2022. a, b, c, d, e, f, g
Soltani, S., Ferlian, O., Eisenhauer, N., Feilhauer, H., and Kattenborn, T.: From simple labels to semantic image segmentation: leveraging citizen science plant photographs for tree species mapping in drone imagery, Biogeosciences, 21, 2909–2935, https://doi.org/10.5194/bg-21-2909-2024, 2024. a, b, c, d, e, f, g
Sun, Z., Wang, X., Wang, Z., Yang, L., Xie, Y., and Huang, Y.: UAVs as remote sensing platforms in plant ecology: review of applications and challenges, Journal of Plant Ecology, 14, 1003–1023, 2021. a
Tan, M. and Le, Q. V.: EfficientNetV2: Smaller Models and Faster Training, arXiv [preprint], https://doi.org/10.48550/arXiv.2104.00298 2021. a
Van Horn, G., Mac Aodha, O., Song, Y., Cui, Y., Sun, C., Shepard, A., Adam, H., Perona, P., and Belongie, S.: The inaturalist species classification and detection dataset, in: Proceedings of the IEEE conference on computer vision and pattern recognition, 8769–8778, https://doi.org/10.1109/CVPR.2018.00914, 2018. a
Wagner, F. H.: The flowering of Atlantic Forest Pleroma trees, Scientific Reports, 11, 1–20, 2021. a