the Creative Commons Attribution 4.0 License.
the Creative Commons Attribution 4.0 License.
 | 07 Nov 2025
Rising atmospheric CO2 concentrations: the overlooked factor promoting SW Iberian Forest development across the LGM and the last deglaciation?
Sandra Domingues Gomes
William Fletcher
Abi Stone
Teresa Rodrigues
Andreia Rebotim
Dulce Oliveira
Maria Sánchez Goñi
Fátima Abrantes
Filipa Naughton
Across the last deglaciation, the atmospheric CO2 concentration (CO2) increased substantially from ∼ 180 to ∼ 280 ppm, yet its impact on vegetation dynamics across this major climatic transition remains insufficiently understood. In particular, Iberian pollen records reveal an intriguing feature that can be related to an often overlooked role of CO2 in shaping vegetation responses during the last deglaciation. These records reveal the near disappearance of forests during the cold Last Glacial Maximum (LGM) and Heinrich Stadial 1 (HS1) phases and an unexpected recovery during the Younger Dryas (YD) cold phase when CO2 increased. Here, we present high-resolution tracers of terrestrial (pollen, C29 : C31 organic biomarker) and marine (alkenone-derived Sea Surface Temperature, C37 : 4 %, and long-chain n-alkanes ratios) conditions from the southwestern (SW) Iberian margin Integrated Ocean Drilling Program Site U1385 (“Shackleton site”) for the last 22 cal kyr BP. This direct land-sea comparison approach allows us to investigate how the Iberian Peninsula vegetation responded to major global CO2 changes during the last deglaciation.
Our results show that cool and moderately humid conditions of the LGM supported a grassland-heathland mosaic ecosystem, but low CO2 likely caused physiological drought and suppressed forest development. HS1, the coldest and most arid period, combined with sustained low CO2 values, almost suppressed forest growth in favour of Mediterranean steppe. In contrast, the warmer Bølling-Allerød, characterised by a temperature optimum and variable but generally wetter conditions, along with the rise of CO2 above 225 ppm at ∼ 15 cal kyr BP, contributed to substantial forest development. During the YD, sufficient moisture combined with increasing CO2 enabled the persistence of a mixed grassland-forest mosaic despite cooler temperatures. Our study suggests that during cool and humid periods (LGM and YD) different pCO2 values led to contrasting SW Iberian vegetation responses. In contrast, during periods of relatively high CO2, temperature and precipitation played the main role in shaping the distribution and composition of the vegetation.
- Article
(2233 KB) - Full-text XML
-
Supplement
(759 KB) - BibTeX
- EndNote


The last deglaciation, spanning 20–19 cal kyr BP (e.g., Denton and Hughes, 1981; Toucanne et al., 2008; Denton et al., 2010) to ∼ 7 cal kyr BP (e.g., Dyke and Prest, 1987; Carlson et al., 2008) was marked by a global annual mean surface air temperature increase of 5 °C, (Annan et al., 2022), driving progressive melting of Northern Hemisphere glaciers. This interval was interrupted by an alternation of cold and warm phases (Alley and Clark, 1999): the warmer Bølling-Allerød (BA, 15–12.5 cal kyr BP) was bracketed by two major cold phases, Heinrich Stadial 1 (HS1, 18.5–15 cal kyr BP) and the Younger Dryas (YD, 12.9–11.6 cal kyr BP), particularly in the North Atlantic region. This period was also characterized by an increase in atmospheric carbon dioxide concentration (CO2) from ∼ 180 to ∼ 280 ppmv (Monnin et al., 2001; Shakun et al., 2012; Marcott et al., 2014), one of the largest shifts of the last 800 000 years (Lüthi et al., 2008). This rise was not gradual, rather there were three main rapid (< 200 years) CO2 rises, of ∼ 10 to 15 ppmv, at the end of HS1, within the BA and at the onset of the YD, as recorded in the West Antarctic Ice Sheet Divide ice core (Marcott et al., 2014).
Beyond its role in shaping global climate, pCO2 directly influences plant physiology and the nature of vegetation responses to environmental change. The annual atmospheric-biospheric exchange of pCO2 from photosynthetic activity is more than one-third of the total stored in the atmosphere (Farquhar and Lloyd, 1993). Atmospheric pCO2 plays a critical role in plant physiology; plants absorb CO2 through their stomata (small leaf pores) and lose water. At lower pCO2, such as during glacial periods, plants must open these pores wider or increase their number to capture enough CO2 (Royer, 2001), which whilst enhancing gas exchange, also increases water loss through transpiration, reducing water-use efficiency (WUE) and inducing physiological drought stress, even under moderate climatic conditions (Street-Perrot et al., 1997; Körner, 2000). Plasticity in stomatal conductance and density is considered an adaptive trait that evolved under declining Cenozoic CO2 levels, enabling plants to sustain carbon uptake as concentrations approached glacial minima (∼ 180–190 ppmv), though at the cost of greater water loss (Wagner et al.,1996). These effects are especially pronounced in semi-arid environments. Under low pCO2 conditions, species better adapted to drought and nutrient stress – such as those typical of steppes – are more likely to dominate and are typically observed in colder periods. Conversely, higher pCO2 promotes forest expansion and higher plant productivity, particularly in trees that benefit from improved WUE (Huang et al., 2007; Randall et al., 2013). However, the response to pCO2 is not globally uniform, with differences in water and nutrient availability, alongside other environmental constraints, mediating the response (e.g., Tognetti et al., 2008).While many reconstructions of past vegetation focus only on temperature and precipitation, the importance of pCO2 as a limiting factor in plant productivity, coverage, and WUE is now widely supported by both empirical and model-based studies (e.g., Cowling and Sykes, 1999; Harrison and Prentice, 2003; Claussen et al., 2013; Piao et al., 2020). The BIOME4 model and a biome-scale reconstruction compiled from pollen records covering the last 40 kyr across the Northern Hemisphere (> 30° N) reveal a level of unexplained variability in vegetation patterns across both space and time (Cao et al., 2019), and provide key insights into other factors than temperature, precipitation and potential evapotranspiration that drive changes in vegetation dynamics and composition, such as pCO2 (Ludwig et al., 2018; Cao et al., 2019). Similarly, coupled vegetation-climate modelling and multiproxy reconstructions demonstrate that CO2 significantly impacts regional vegetation extent and productivity across glacial-interglacial transitions (Wu et al., 2007; Wei et al., 2021; Koutsodendris et al., 2023; Clément et al., 2024). These findings underscore the need to include CO2 changes when interpreting pollen data or evaluating biome shifts (Prentice et al., 2017; Cao et al., 2019). While current day pCO2 fertilization receives considerable attention (Piao et al., 2020), studying the effects of low CO2, and major transitions from low to high CO2, are equally critical.
Growing evidence shows that many climate reconstructions for glacial periods based on vegetation records may be biased as they neglect the influence of low pCO2 on WUE. Neglecting this influence may contribute to the underestimation of past precipitation under full glacial conditions (Jolly and Haxeltine, 1997; Cowling and Skyes, 1999; Gerhart and Ward, 2010; Prentice et al., 2017; Cleator et al., 2020; Izumi and Bartlein, 2016; Chevalier et al., 2021), a concern still highlighted by recent studies (Chevalier et al., 2020; Wei et al., 2021; Prentice et al., 2022; Cruz-Silva et al., 2023). By contrast, under interglacial conditions with higher CO2 levels, model experiments suggest that forest expansion in SW Iberia is mostly controlled by precipitation rather than by CO2 levels (Oliveira et al., 2018, 2020).
Recognising the role of pCO2 is crucial, not only to interpret the drivers of past ecosystems accurately, but also for anticipating how semi-arid landscapes – particularly in the Iberian Peninsula and Mediterranean region, which are predicted to experience significantly increased aridity – will respond to ongoing climate change. The terrestrial and marine climatic indicators from the SW Iberian margin sedimentary sequences provide an extremely valuable record of environmental change, and last deglaciation vegetation changes have been widely studied here using palaeoecological records (e.g., Peyron et al., 1998; Carrión, 2002; Chabaud et al., 2014; Combourieu Nebout et al., 2009; Dormoy et al., 2009; Fletcher et al., 2010a, b; Aranbarri et al., 2014; Bartlein et al., 2011; Naughton et al., 2011, 2019; Tarroso et al., 2016) and ecological niche modelling (Casas-Gallego et al., 2025). However, these are traditionally interpreted as a result of the combined effects of temperature, precipitation and evaporation changes, rather than pCO2. Furthermore, few of the existing records span the entire deglaciation, or offer resolution or chronological precision to detect short-term vegetation and climate shifts in detail.
Here we present a new multiproxy study of IODP Site U1385 that allows a direct comparison between terrestrial and marine climatic indicators across the LGM and deglaciation at high (centennial-scale) temporal resolution. Hence, this record provides a detailed reconstruction of vegetation changes in SW Iberia along with sea surface temperature (SST) trends in its margin during the LGM, HS1, BA and the YD. Our new paleoenvironmental record enables the exploration of the main factors driving forest development during the LGM and the last deglaciation, and an evaluation of potential CO2 thresholds for western Mediterranean forest development.
IODP Site U1385 is a composite record of five drillings in the SW Iberian margin (37°34.285′ N; 10°7.562′ W, 2587 m below sea level) located on a spur at the continental slope of the Promontório dos Príncipes de Avis, which is elevated above the abyssal plain and free from turbidite influence (Hodell et al., 2015) (Fig. 1). This work focuses on Hole A, a continuous record of 10 corrected revised meter composite depth (crmcd) mainly composed of hemipelagic silt alternating with clay (Hodell et al., 2015). For this study, Hole A was sampled from 3.84 to 1.08 crmcd, which corresponds to the period between ∼ 21.5 and 6.4 cal kyr BP. The sediment supply, including pollen grains, to Site 1385 is mainly derived via fluvial transport from the Tagus and Sado hydrographic basins, providing a reliable signature of the vegetation of the adjacent continent (Naughton et al., 2007; Morales-Molino et al., 2020).
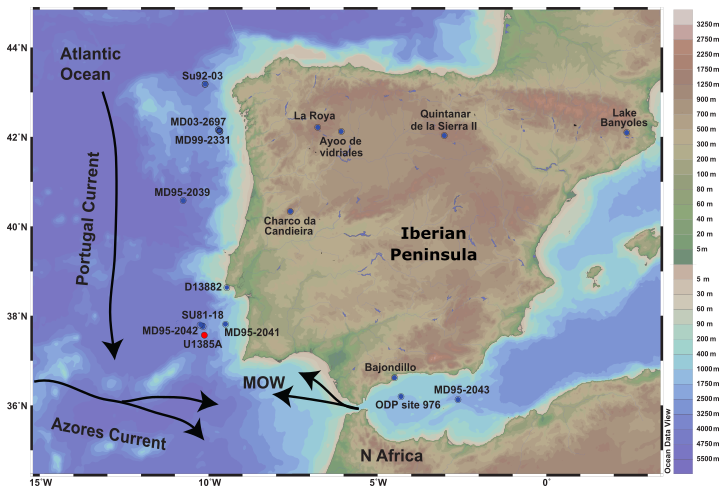
Figure 1Location of IODP Site U1385 and of the marine and terrestrial pollen records discussed in the text. Marine sedimentary records: MD03-2697 (Naughton et al., 2016); MD99-2331 (Naughton et al., 2007); MD95-2039 (Roucoux et al., 2005); D13882 (Gomes et al., 2020); MD95-2043 (Fletcher and Sánchez Goñi, 2008); MD95-2042 (Chabaud et al., 2014); SU81-18 (Turon et al., 2003); ODP Site 976 (Combourieu Nebout et al., 2009); Continental sedimentary records: Lake de Banyoles (Pèrez-Obiol and Julià, 1994); Quintanar de la Sierra II (Peñalba et al., 1997); La Roya (Allen et al., 1996); Ayoo de vidriales (Morales-Molino and García-Anton, 2014); Charco da Candieira (Van der Knaap and van Leeuwen, 1997); Padul 15-05 (Camuera et al., 2019). Black arrows represent the surface water circulation (MOW, Portugal and Azores Current). Note that coastline boundaries are for the present day. From: Schlitzer, Reiner, Ocean Data View, https://odv.awi.de (last access: 9 May 2020), 2019.
The present-day climate of southwestern Iberia is characterised by a Mediterranean climate strongly influenced by the Atlantic Ocean, Köppen classification Csa with warm summers (average ∼ 22 °C in the warmest month) mean annual temperatures 12.5–17.5 °C, and mean annual precipitation 400–1000 mm yr−1. The rainy season peaks in the winter between November and January and drought occurs in the summer generally from June to September (Agencia Estatal de Meteorología (AEMET) and Instituto de Meteorologia (IM, Portugal), 2011).
The present-day vegetation of southwestern Iberia reflects a transitional biogeographical zone between temperate and Mediterranean climates (Rivas-Martínez et al., 2017). Coastal areas, influenced by oceanic humidity and milder winters, support thermophilous evergreen species such as Quercus suber, Olea europaea var. sylvestris, Myrtus communis, and Pistacia lentiscus (Asensi and Díez-Garretas et al., 2017). Inland, as elevation increases and oceanic influence diminishes, Mesomediterranean forests dominate, composed of both evergreen (Q. suber, Q. rotundifolia, Q. coccifera) and deciduous oaks (Q. faginea, Q. robur), often combined with heathlands or aromatic scrublands (e.g., Cistus spp.). Distinctive oak–juniper woodlands appear in drier zones, and pine forests (Pinus pinaster, P. pinea) are common on sandy coastal soils. Riparian zones feature Alnus glutinosa and Salix spp., while widespread Cistus and Erica shrublands reflect the area's susceptibility to fire.
3.1 Chronological framework
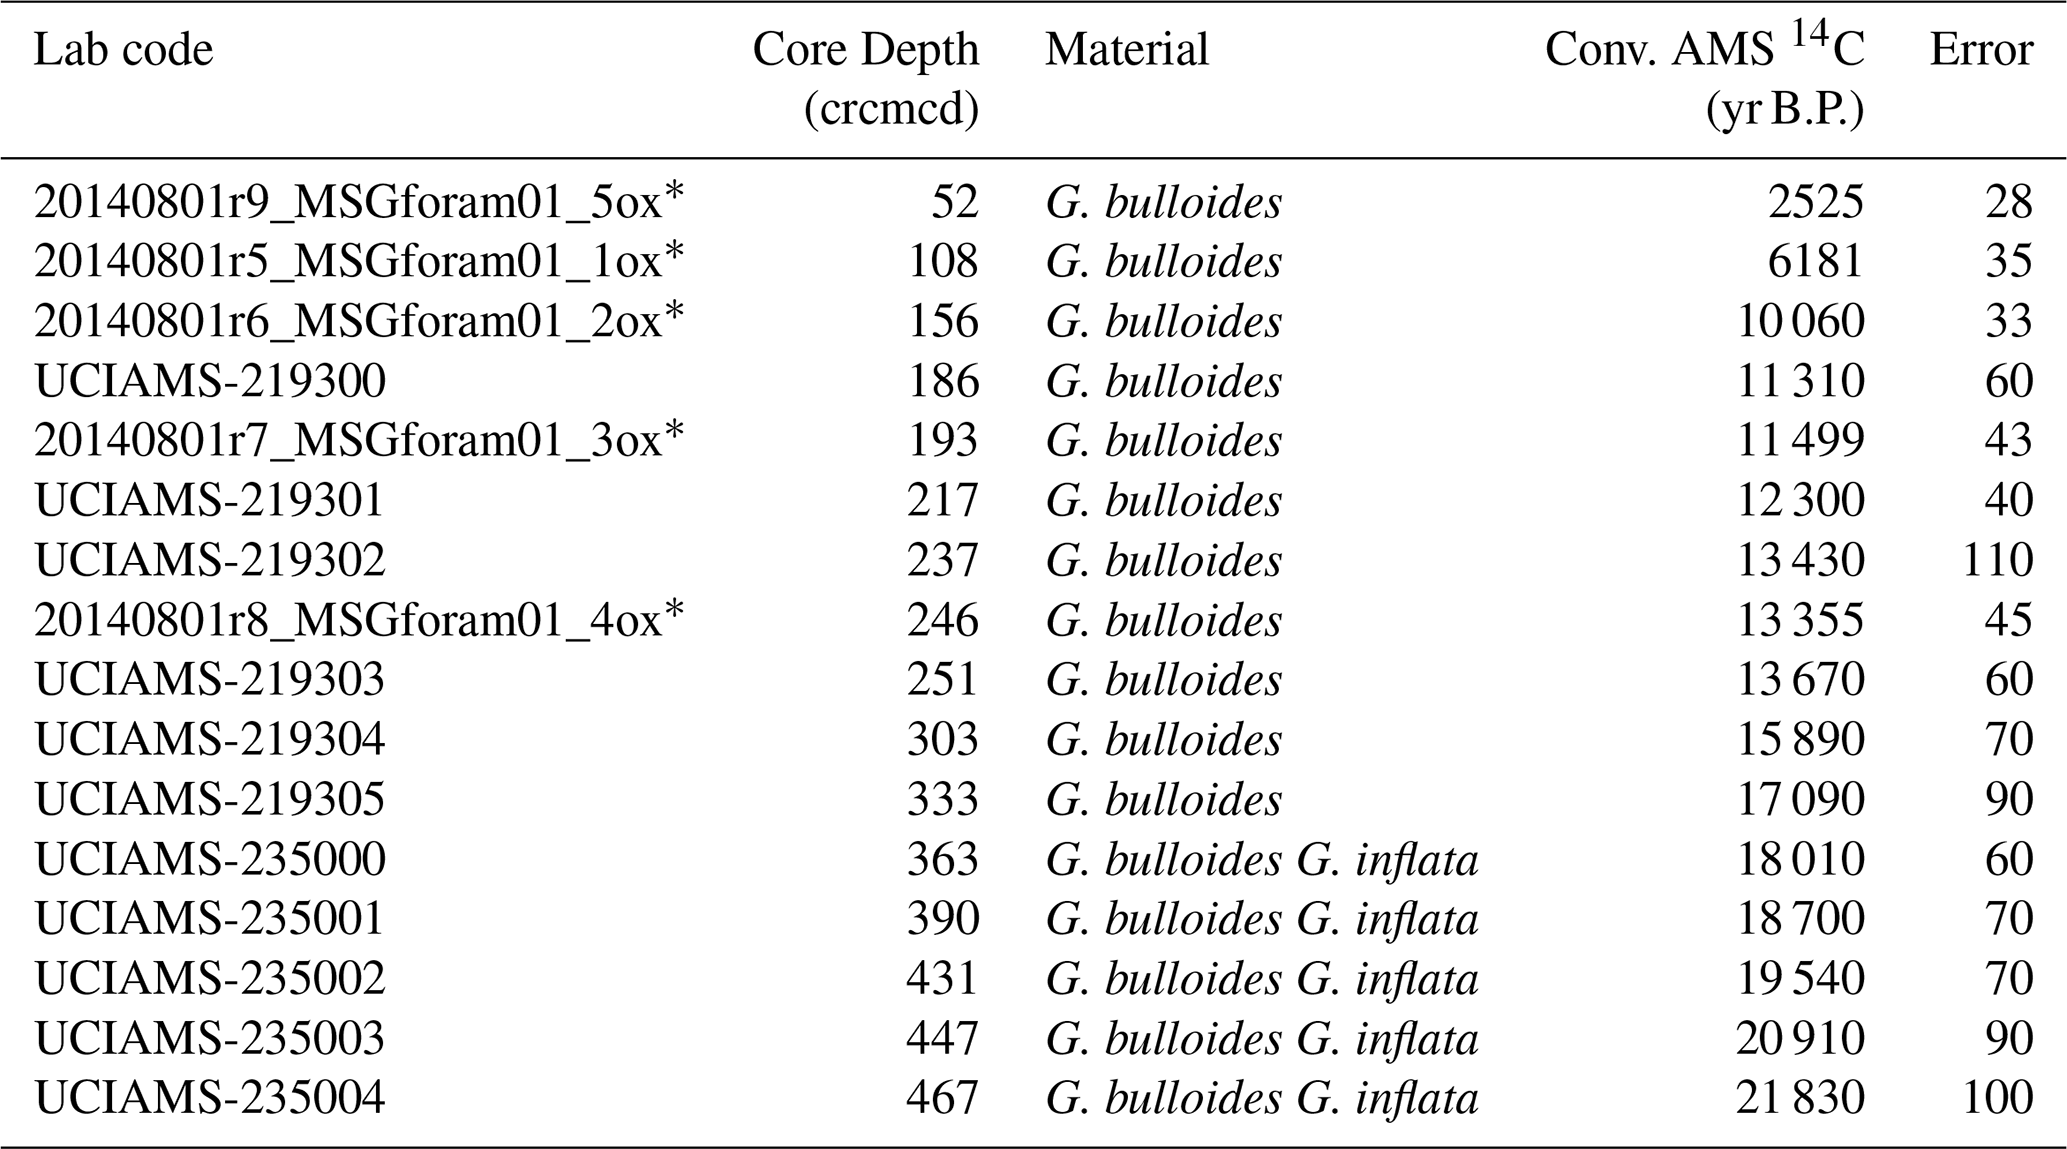
Sixteen AMS 14C dates were used to generate a new age-model for the last deglaciation at Site U1385 (Table 1 and Fig. 2). Five of these were published by Oliveira et al. (2018), based on monospecific Globigerina bulloides samples and analysed at the Vienna Environmental Research Accelerator (VERA), University of Vienna, Austria. A new set of eleven samples for AMS 14C analysis was selected primarily from monospecific assemblages of G. bulloides. When sample size requirements could not be met, a mixed assemblage of G. bulloides and G. inflata was used. All samples were processed at the Keck Carbon Cycle AMS Facility, University of California, Irvine (Table 1). The new age model, using solely the available radiocarbon dates for sedimentary record U1385 without any tuning, was calculated using a Bayesian approach through the software Bacon implemented in R (Blaauw and Christen, 2011; R Development Core Team, 2020) using the Marine20 calibration curve (Heaton et al., 2020). The studied interval encompasses the period from ∼ 22 to 6 kyr, as shown by the radiocarbon age model (Fig. 2). The average temporal resolution for the pollen and organic biomarkers across the deglaciation is 110 and 104 years, respectively, or slightly lower (174 and 135 years, respectively) when including the Holocene section (Figs. 3 and S1 in the Supplement).
Table 1AMS radiocarbon ages of IODP Site U1385.
* AMS from Oliveira et al. (2018).
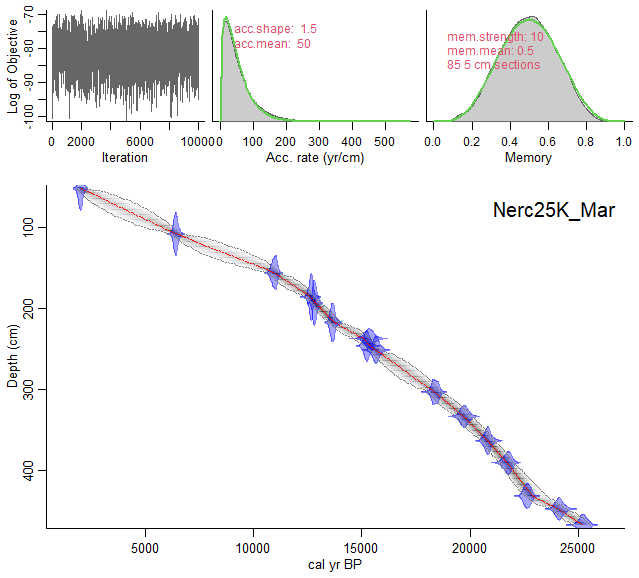
Figure 2Age-depth model for IODP Site U1385 using a Bayesian approach with Bacon v.2.3.9.1 (Blaauw and Christen, 2011). The original dates were calibrated using Marine20 (Heaton et al., 2020). Grey stippled lines show 95 % confidence intervals; red curve shows single “best” model based on the mean age for each depth. Upper graphs show from left to right: Markov Chain Monte Carlo (MCMC) iterations and priors (green line) and posteriors (dark grey line with a grey fill) for the accumulation rate and variability/memory. Note: the depth (y axis) was converted to cm from the corrected revised meter composite depth (crmcd).
3.2 Pollen analysis
A total of 97 samples (including 25 published by Oliveira et al., 2018) were analysed from 3.84 to 1.08 crmcd in Hole A, and prepared at the University of Bordeaux, France, using the standard protocol of the UMR EPOC laboratory (Georget et al., 2025). The sediment was firstly separated using coarse sieving at 150 µm, retaining the fine fraction. A sequence of chemical treatments, starting with cold HCl (hydrochloric acid) at increasing concentrations (10 %, 25 %, 50 %), eliminated calcium carbonate particles. Followed by cold HF (hydrofluoric acid) at increasing strength (45 % and 70 %) to eliminate the silicates. The remaining residue was micro-sieved (10 µm mesh), retaining the coarse fraction. Exotic Lycopodium spore tablets of known concentration were added to each sample to calculate pollen concentrations (Stockmarr, 1971). The obtained residue was mounted in a mobile medium composed of phenol and glycerol 1 % (), to allow pollen/spore rotation and accurate identification. Samples were counted using a transmitted light microscope at 400X and 1000X (oil immersion) magnifications. To perform pollen identification, we used identification keys (Faegri et al., 1989; Moore et al., 1991), photographic atlases (Reille, 1992, 1995) and the SW Mediterranean modern reference collection.
The total count ranged from 198 to 1545 pollen and spores per sample, with a minimum of 100 terrestrial pollen grains and 20 pollen morphotypes to provide statistical reliability of the pollen spectra (McAndrews and King, 1976; Heusser and Balsam, 1977). The main pollen sum was calculated following previous palynological studies of Site U1385 (e.g., Oliveira et al., 2016) that excluded Pinus, Cedrus, aquatic plants, Pteridophyte and other spores, and indeterminable pollen. The pollen percentages are calculated against the main pollen sum; but the percentages of over-represented taxa were calculated based on the main sum plus the counts for that particular individual taxon; for example: 100× Pinus (Main sum + Pinus) and 100× Cedrus (main sum + Cedrus). Aquatic plants and spores were excluded because their abundant pollen originates in or near water bodies and can be transported far from their source, potentially overrepresenting regional vegetation. Pinus pollen, which is typically overrepresented in marine deposits, is transported by rivers from the Tagus and Sado's watersheds (Naughton et al., 2007). In contrast, the overrepresented Cedrus is transported by wind from the Atlas or Rif mountains in Morocco. Both taxa were also excluded from the main sum. PSIMPOLL 4.27 (Bennett, 2009) was used to plot percentages for selected taxa, grouped by ecological affinities (Gomes et al., 2020). Stratigraphically constrained cluster analysis by Sum of Squares determined the five statistically significant pollen assemblage zones (U1385-1 to 5 in Figs. 3, S1 and Table S1 in the Supplement) based on a dissimilarity matrix of Euclidean distances with pollen taxa ≥ 1 % (Grimm, 1987; Bennett, 2009).
Figure 3Comparison of multiproxy records from Site U1385 with (a) 65° N July (W m−2) summer insolation (Berger and Loutre, 1991) (b) CO2 (ppmv) composite from WAIS (Marcott et al., 2014). Principal pollen-based ecological groups percentages: (c) Temperate Mediterranean Forest from Site U1385 (solid black line) and compilation of Iberian Margin TMF records (D13882, MD03-2697; MD95-2042; MD95-2043; ODP-976; U1385) – GAM (grey curve), (d) Semi-desert taxa including Amaranthaceae (previously Chenopodiaceae), Artemisia, and Ephedra. (e) Heathland including members of the Ericaceae family (including various Erica spp.) and Calluna spp., (f) Mediterranean taxa and (g) Poaceae + Cyperaceae. Biomarkers: (h) C29 C31 ratio, (i) C37:4 (%) and (j) SST ( °C). The different coloured shading corresponds to the pollen zones (Fig. S1 and Table S1 in the Supplement) which are related with the periods indicated above.
In addition to pollen-based ecological groups, we calculated the sum of Poaceae and Cyperaceae (Fig. 3g), to check the potential importance of C4 plants in the Iberian Peninsula. While most of the present-day Poaceae and Cyperaceae in this region chiefly belong to the C3 photosynthetic-pathway plant type (Casas-Gallego et al., 2025), it is possible that C4 pathway plants were more important at other moments in recent Earth history. Pollen analysis is a core method in palaeoclimatology and palaeoecology, used to assess past climate conditions based on the ecological affinities of specific taxa grouped into pollen-based ecological groups. These groups reflect present-day vegetation–climate relationships, allowing inferences about dry, cold, warm, or moist conditions. As such, our pollen data reflect ecological responses rather than absolute quantitative climate parameters (Williams et al., 2001). A pollen diagram with clustering analysed (Fig. S1 in the Supplement) was produced revealing four main episodes over the LGM and the Last deglaciation (Fig. 3, further details in Fig. S1 and Table S1 in the Supplement).
3.3 Compilation of Iberian margin pollen records
In order to assess vegetation and climate changes more widely in the Iberian Peninsula region across the LGM and last deglaciation, we compiled available marine records along the Iberian margin covering the period from 23 to 6 cal kyr BP. Pollen count datasets from eight marine pollen records (D13882 – Gomes et al., 2020; MD03-2697 – Naughton et al., 2016; MD95-2039 – Roucoux et al., 2005; MD95-2043 Fletcher and Sánchez Goñi, 2008; MD95-2042 – Chabaud et al., 2014; ODP Site 976 – Combourieu Nebout et al., 2009; SU81-18 – Turon et al., 2003; Site U1385 – this study) were used with the original published chronologies, without any additional alignment or synchronization. Pollen percentages were recalculated against the main pollen sum. A uniform calculation of the pollen-based ecological group TMF (Temperate and Mediterranean forest) was made for each record, integrating the following taxa of (1) Temperate trees and shrubs: deciduous Quercus, Acer, Betula, Cannabis/Humulus, Carpinus, Castanea, Fraxinus excelsior-type, Hedera helix, Hippophae, Ilex, Juglans, Myrica and Vitis; and (2) Mediterranean taxa: evergreen Quercus, Quercus suber, Arbutus type, Buxus, Daphne, Jasminum, Ligustrum, Myrtus, Olea, Phillyrea, Pistacia, Rhamnus, Rhus.
To assess the general trend of vegetation patterns throughout the deglaciation, we applied a Generalised Additive Model (GAM), considered as a more robust statistical approach than loess curves (Wood, 2017; Simpson, 2018). The GAM model was fitted using the gam() function of the mgcv package (version 1.8.24; Wood, 2017) for R (version 3.6.3; R Development Core Team, 2020). We used a standard GAM with REML smoothness selection, specifying 30 basis functions (k=30) and a smoothing parameter of 0.0001 (sp = 0.0001). The relatively high K allowed the model to capture potential nonlinear patterns in the data without overfitting, while the small sp ensured sufficient smoothness; these values were chosen after exploratory analysis and diagnostic checks. To assess the validity of the smooth terms and confirm that the basis functions adequately captured the data wiggliness, we applied the gam.check() function of the mgcv package. The resulting k-index was greater than 1, and the p-value supported the hypothesis that enough basis functions were used. The fitted GAMs curves for TMF are presented along with approximate 95 % confidence intervals (Simpson, 2018).
3.4 Molecular biomarkers
Marine biomarker analyses were carried out in 123 levels, including 30 published by Oliveira et al. (2018). All analyses were performed following the extraction and analytical methods (Villanueva et al.,1997; Rodrigues et al., 2017). Marine coccolithophorid algae synthesise organic compounds including alkenones (Volkman et al., 1995) (Fig. 3i and j). Seawater temperature changes influence the amounts of di-, tri- and tetra-unsaturated alkenones produced by algae (Brassell et al., 1986). The use of organic solvents to separate the total lipid fraction from sediments allows the sea surface temperature alkenone-based reconstruction ( – SST) (e.g., Villanueva and Grimalt, 1997; Rodrigues et al., 2017). The index (Prahl and Wakeham, 1987) was converted to temperature values using the global calibration equation defined by Müller et al. (1998) with an analytical uncertainty of 0.5 °C (Grimalt et al., 2001). Nevertheless, uncertainties remain, since SST reconstructions may be affected by calibration biases, seasonal and ecological effects related to coccolithophorid production, and potential lateral transport or diagenetic alteration of alkenones (e.g., Conte et al., 2006; Ausín et al., 2022). Despite these caveats, the derived SSTs provide robust indicators of large-scale SST trends. Additionally, tetra-unsaturated alkenone (C37:4) percentages were calculated due to their potential to identify the occurrence of cold freshwater pulses associated with iceberg discharges (Bard et al., 2000; Martrat et al., 2007; Rodrigues et al., 2011, 2017) and therefore, changes in the reorganisation of surface water masses in the North Atlantic (Rodrigues et al., 2017).
The ratio between C29 and C31 n-alkanes was also calculated to understand how epicuticular wax production in terrestrial plants varied through time. This index is generally considered to encompass the dynamic between woody plants and grasses plants of the adjacent continent (Cranwell 1973; Tareq et al., 2005, Bush and McInerney, 2013; Struck et al., 2020). This relation comprises the adaptation of plants by increasing the production of long-chain leaf wax, which reduces water loss during the photosynthetic processes and prevents desiccation promoted by harsh winds or more arid conditions (Bush and McInerney, 2013). Index values > 1 are typically considered to reflect higher quantities of C29 n-alkanes produced by trees and shrubs, while values < 1 are generally considered to indicate higher quantities of C31 n-alkanes by grasses and herbaceous plants (Cranwell, 1973; Rodrigues et al., 2010; Ortiz et al., 2010). However, the interpretation of this index may vary across biomes and depend on source vegetation types, and depositional processes (Carr et al., 2014; Diefendorf and Freimuth, 2017).
4.1 The effect of CO2 on biome changes during the LGM and deglaciation
Whilst a classic interpretation of ecosystem dynamics can be proposed solely considering variations in the main climatic parameters (temperature, precipitation), we hypothesise that changes in pCO2 played an essential role in vegetation change, specifically in the deglacial forest expansion. Here, we evaluate the drivers of vegetation change by explicitly considering the evolution of CO2 through the deglaciation. Our discussion is supported by the present-day environmental and climatic space, considering the temperature and precipitation in which different taxa exist in the Iberian Peninsula and characterising the TMF – Quercus sp., the Heathland (ERI) – Ericaceae family and the semi-desert (STE) landscapes (Fig. S2 in the Supplement).
4.1.1 Last Glacial Maximum (LGM, 23–19 cal kyr BP)
The pollen-based vegetation record from Site U1385 shows that during the LGM (pollen zone U1385-1: 21 500–17 990 cal yr BP, Fig. S1 in the Supplement) a grassland-heathland mosaic dominated the landscape, with semi-desert taxa (STE, ∼ 40 %) and heathland taxa (ERI, ∼ 10 %–20 %) (Figs. 3d, e, 4d), forming a distinctive non-analogue glacial vegetation cover.
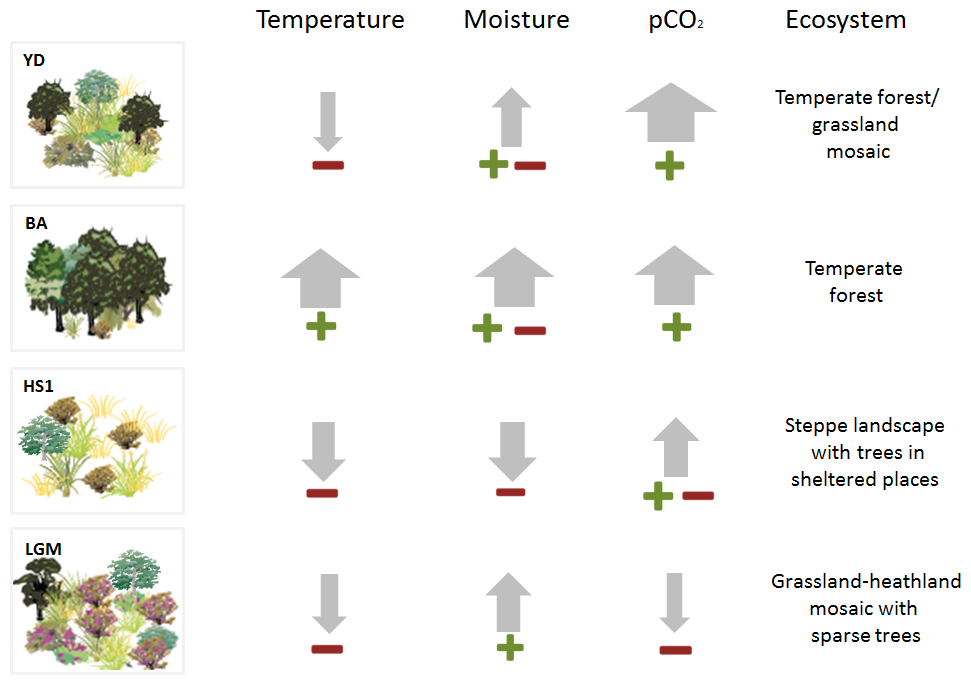
Figure 4Schematic representation of the relative change of climatic inferred parameters (precipitation and temperature) based on pollen-vegetation groups, biomarkers, SST as well as the physiological contribution of CO2 for each period showing a schematic reconstruction of the potential ecosystem scenarios. The perceived temperature used the interpretation of pollen (TMF and STE groups), SST and n-alkanes; the plant available moisture (ERI, TMF and STE).
The prevalence of heath (Erica spp.) in Iberian pollen records underpins the classic view of the LGM in Iberia as a fairly humid interval, certainly compared with the extreme aridity of Heinrich stadials (Roucoux et al., 2005; Naughton et al., 2007; Fletcher and Sánchez-Goñi, 2008; Combourieu-Nebout et al., 2009; Sánchez-Goñi et al., 2009).
Nevertheless, the signals for moisture availability are somewhat complex. Semi-desert taxa, typically found in arid conditions, are abundant, while heathland taxa, associated with more humid environments, reach their maximum in the record (Figs. 3, S2c in the Supplement). Forest taxa are represented in low percentages (5 %–15 %) (Fig. 3c), suggesting cool and relatively dry conditions over the continent. The TMF values are consistent throughout the U1385 record and GAM-fitting to the data compilation (Fig. 3c). Similar patterns are observed across the marine records in southerly locations off the Iberian Peninsula (MD95-2043 – Fletcher and Sánchez Goñi, 2008 and ODP Site 976 – Combourieu Nebout et al., 2009 in the Mediterranean Sea, and SU81-18 – Turon et al., 2003 in the Atlantic Ocean), as well as further North off the Iberian Peninsula (MD99-2331 and MD03-2697 – Naughton et al., 2007, 2016).
Interestingly, the modern environmental space for the Ericaceae group (namely Erica arborea, E. australis, Calluna vulgaris) coincides with that occupied by the Quercus genus, the main constituent of the TMF group (Fig. S2b in the Supplement). This begs the question, if the environmental conditions that support heathland overlap with those for Quercus sp., then why were forests not thriving during the LGM? A possible explanation could be associated with cold atmospheric temperatures (SSTs average ∼ 14.5 °C, Fig. 3j), even if during the LGM the temperatures were not as extreme as the ones observed during the HS1 (Bond et al., 1993; Rasmussen et al., 1996). Hence, in addition to temperature, the lowest levels of CO2 during the LGM (180–190 ppmv), could have been another important controlling factor, as they rank among the lowest concentrations recorded during the history of land plants (Pearson and Palmer, 2000; Tripati et al., 2009). Shao et al. (2018) modelled the global distribution of vegetation types as a function of temperature and precipitation under both modern climatic conditions and LGM CO2 (185 ppm). Their analysis demonstrated pronounced qualitative differences in vegetation patterns, with reduced CO2 levels grasslands were favoured to the detriment of evergreen broadleaf, evergreen and deciduous needle leaf forest. This study, however, did not include heathlands specifically, and it remain unclear whether this group has adaptations permitting better functioning under low CO2 levels. We speculate that drought-adapted traits in Mediterranean Ericaceae especially E. arborea including thick cuticles, small leaf size, large photosynthetic thermal window and deep root system with large diameter and a massive underground lignotuber (Gratani and Varone, 2004) may have been advantageous under challenging trade-off between photosynthesis and water loss under very low pCO2. Consequently, Ericaceae during LGM likely represented a vegetation group particularly resilient to such physiological constraints.
At the same time, the LGM coincides with a precession maximum, a configuration recognised to reduce seasonal contrasts (i.e., reduced summer dryness) and thus favour heathland development in the Iberian Peninsula, as documented in both glacial and interglacial contexts, including the Middle to Late Holocene (Fletcher and Sánchez Goñi, 2008; Margari et al., 2014; Oliveira et al., 2016, 2018; Chabaud et al., 2014; Gomes et al., 2020). Furthermore, heathland ecosystems thrive on acidic, low-nutrient soils, which can develop as a result of altered hydrological cycles during precession maxima. The ecological advantages of Erica also include less demanding edaphic requirements (low nutrient demand), more competitive re-sprouting strategy after disturbance, including fires, as well as a higher dispersal capacity compared with Quercus sp. for example (Pausas et al., 2008). However, these observations do not rule out a key impact of low CO2 on vegetation composition during the LGM.
Diverse vegetation models have been used to understand the influence of climatic parameters and CO2 during the LGM (e.g., Harrison and Prentice, 2003; Woillez et al., 2011; Izumi and Bartlein, 2016; Shao et al., 2018). However, there is a disagreement about the magnitude of the CO2 influence, from being considered to have an equal influence (Izumi and Lézine, 2016) to being less critical than climatic parameters (Woillez et al., 2011; Shao et al., 2018; Chen et al., 2019). Harrison and Prentice (2003) also highlight model differences and the variable regional expression of the influence of CO2 (with higher impact in tropical areas). However, these studies agree that low CO2 had a negative physiological impact on forest development during the LGM in different continents (Jolly and Haxeltine, 1997; Cowling, 1999; Harrison and Prentice, 2003; Woillez et al., 2011; Shao et al., 2018; Chen et al., 2019). Jolly and Haxeltine (1997) used BIOME3 to simulate LGM vs pre-industrial CO2 levels under different climatic conditions scenarios (temperature and precipitation) in tropical Africa; CO2 was considered the primary driver of biome change from tropical montane forests to shrubby heathland ecosystems. This model included a photosynthetic scheme able to simulate plant response to different levels of CO2 and its impact on stomatal conductance and water stress. This study showed that increasing CO2 (above ∼ 190 ppmv), offsets the lower temperatures (changes of −4 to −6 °C), allowing the forest to thrive and replace heathland. However, plants with higher climatic demands (temperature and precipitation), which is the case of most temperate trees, are less competitive under low CO2 conditions, compared with evergreen microphyllous species (e.g., Erica spp.).
Long-term studies considering CO2 limitations on vegetation contrast in their perspectives; Gosling et al. (2022) argue that during the last 500 kyr, precipitation and fire exert the main controls on woody cover in tropical Africa while CO2 effects were relatively small. In Asia, Clément et al. (2024) also emphasize the role of precipitation as the driver of vegetation distribution during interglacials, and that vegetation is not sensitive to CO2 above 250 ppmv (value characterizing most of the interglacials); however, during glacial CO2 conditions (< ∼ 185 ppmv), CO2 is an important factor, favouring the increase of C4 plants. The inclusion of CO2 in climatic reconstructions for LGM for Africa and Europe yields a wetter LGM compared with reconstructions assuming CO2 present-day concentrations (Wu et al., 2007). A similar impact is evident in the Last Glacial moisture reconstruction based on the pollen record of El Cañizar de Villarquemado in eastern Iberia; including a correction for the direct physiological effects of low CO2, yields a wetter reconstruction of glacial climate (Wei et al., 2021). The implications of these experiments are important for the SW Iberian region and may help to solve the apparent contradiction between vegetation (abundance of semi-desertic plants and presence of heathland) and climate simulations, which indicate enhanced winter precipitation over southern Iberian and Northwest Africa due to southward shifting of the wintertime westerlies (Beghin et al., 2016). In the absence of CO2 correction, temperature could also be misinterpreted; the LGM vegetation for Mediterranean sites was simulated and associated with warmer summers under LGM CO2, instead of the colder conditions simulated with present-day levels of CO2 (Guiot et al., 2000). In Europe, pollen reconstruction with steppe vegetation indicated warmer winter temperatures for LGM CO2 compared with the modern CO2 (Wu et al., 2007). The bias could extend to simulations of glacial vegetation; without the CO2 effect, the cover of boreal and temperate forests is reduced, and evergreen forests are overestimated for the LGM (Woillez et al., 2011).
Experiments determining plant thresholds in response to low CO2 have not received as much attention as research on the impact of high CO2 levels (Gerhart and Ward, 2010; Dusenge et al., 2019), and to our knowledge no experimental work currently tests forest development under such low values. However, modelling approaches indicate that in C3 plants, photosynthetic capacity declines sharply once atmospheric CO2 falls below ∼ 300 ppmv, making carbon assimilation increasingly limiting for plant growth (Wagner et al., 1996). When we assess the relationship between CO2, SST and TMF across the LGM and deglaciation events we observe that the LGM (i) corresponds to SSTs below 15.5 °C and CO2 below 225 ppmv, and (ii) that TMF values remain below 20 % (Fig. 5). In African mountain environments, a CO2 threshold of approximately 220 ppmv has been suggested as the minimum above which forests could develop (Dupont et al., 2019). These results suggest that extremely low CO2 below a critical threshold of ∼ 220–225 ppmv, played an important role in limiting forest development during the LGM. However, we emphasize that such thresholds should not be considered universal, as they may depend on plant taxa, edaphic conditions and microclimate. Nevertheless, these values, despite differences in baseline conditions such as insolation, are broadly consistent with other time intervals where Mediterranean forest expansion occurred, for example during MIS 13 at ∼ 216 ppmv (Oliveira et al., 2020) and MIS 18 at ∼ 215 ppmv under relatively high temperatures and increased winter rainfall (Sánchez-Goñi et al., 2023). Temperatures during the LGM in SW Iberia may have been sufficiently mild for forest development with sea surface temperatures of ∼ 15.5 °C (Fig. 3j) aligned with the broader threshold for forest development (Sánchez-Goñi et al., 2008). For this reason, one could speculate that a hypothetical increase in CO2 above the observed critical threshold during the LGM could have permitted forest development in SW Iberia. Thus, while uncertainties remain, the convergence of multiple lines of evidence supports a key role for low CO2 in constraining forest development specially during glacial periods.
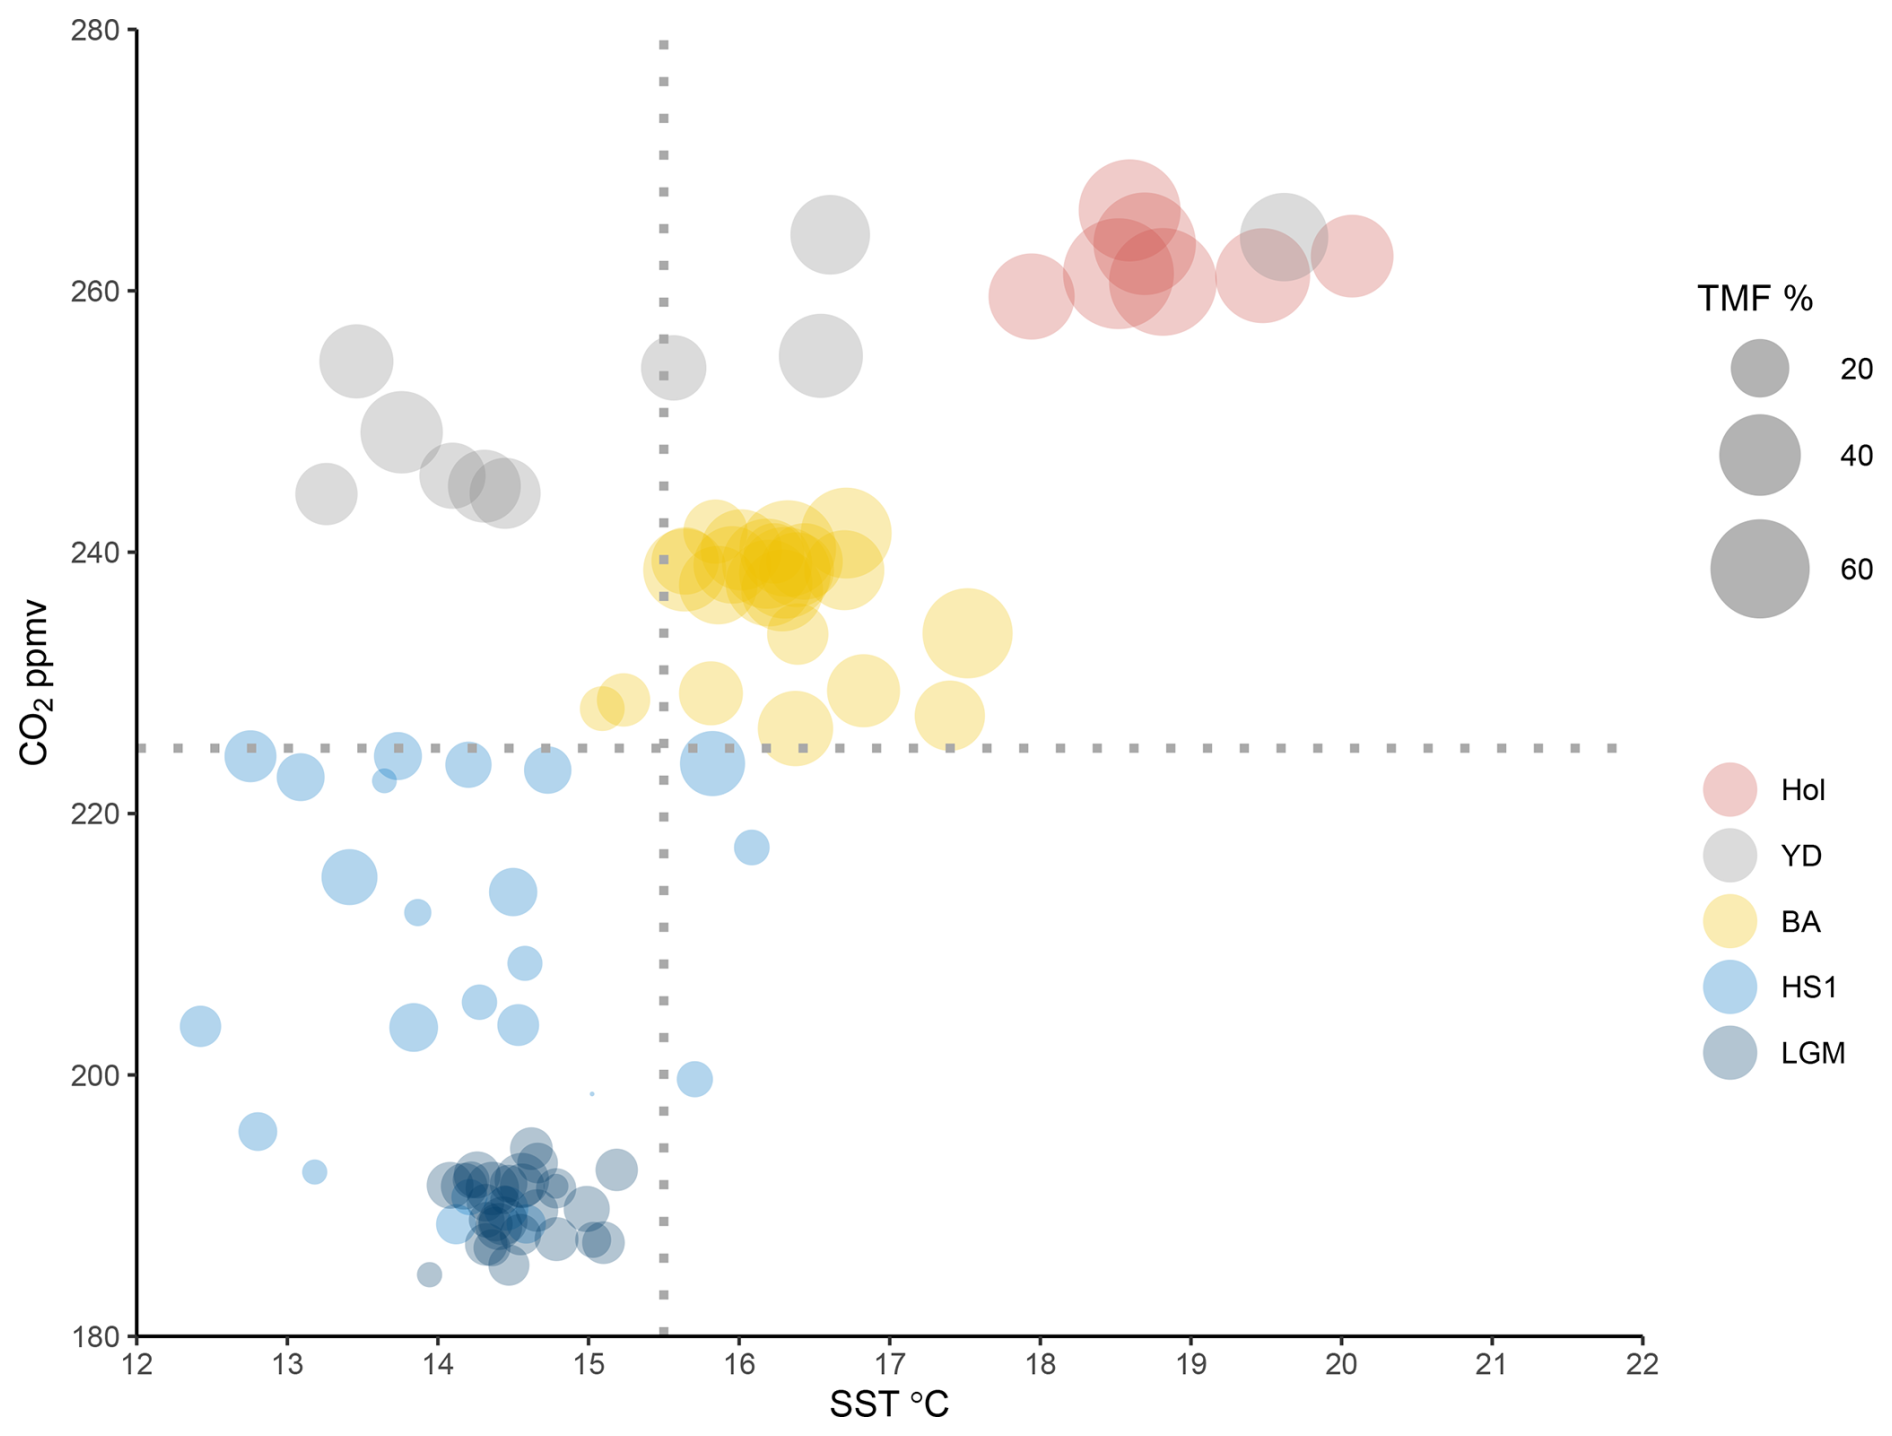
Figure 5Dispersion plot showing the relation between CO2 (Marcott et al., 2014) and SST in relation to TMF % across the different intervals of the Last deglaciation, following the pollen zones boundaries.
4.1.2 Heinrich Stadial 1 (HS1, 18.5–15 cal kyr BP)
During HS1 (pollen zone U1385-2: 17 990–15 230 cal yr BP, Fig. S1 in the Supplement), a Mediterranean steppe landscape (Fig. 3d) with minimum arboreal development (Fig. 3c) corresponded to the lowest SSTs of the record (SST ∼ 12 °C, Fig. 3j). The dominance of semi-desert taxa and minimum TMF (Figs. 3 and 5c) indicate the highest levels of aridity. Additionally, high C37:4 alkenone values (∼ 8.2 %, Fig. 3i) reflect major meltwater pulses, associated with severe cooling in the North Atlantic during HS1. Vegetation signals reinforce this picture of moisture stress. A sharp decrease in heaths (ERI, Fig.3e) and aquatic taxa such as Isoetes (Fig. S1 and Table S1 in the Supplement) suggests significant drying of terrestrial marshes and wetlands. The dominance of STE during HS1 is consistent with records across the Iberian Peninsula (Combourieu Nebout et al., 2002; Roucoux et al., 2005; Naughton et al., 2007, 2016; Fletcher and Sánchez Goñi, 2008) and is reflected also in a long-term minimum in reconstructed forest levels (Fig. 3c).
Throughout HS1, despite the gradual increase of CO2 from ∼ 185 to ∼ 225 ppm between 18.1 to ∼ 16 cal kyr BP (Fig. 3b), this rise was insufficient to counteract the limiting effects of extreme cold and aridity. Simulations with the Weather and Research Forecast model that incorporate a CO2 correction show a reduction in arboreal vegetation and an expansion of sparsely vegetated soils across Iberian region during HS1 compared with the LGM (Ludwig et al., 2018). The simulated precipitation values for SW Iberia (Tagus hydrographic basin catchment), remain below 700 mm yr−1 for HS1, which agrees with the pollen evidence for widespread semi-desert taxa.
Interestingly, the differences between HS1 and LGM concerning temperature, precipitation and CO2 are substantial. While CO2 levels rose modestly, the climatic extremes of HS1 – marked by severe cooling and aridity – likely drove the observed loss of heathland and limited forest development across the peninsula. Moreover, based on pollen data from marine and terrestrial records we do not observe any significant (< 5 % TMF) latitudinal difference when comparing northern (e.g., Peñalba et al., 1997; Pèrez-Obiol and Julia, 1994; Roucoux et al., 2005; Naughton et al., 2007) with southern (e.g., this study; Comborieu Nebout et al., 2002; Fletcher and Sánchez Goñi, 2008) sites. Furthermore, the relationship between CO2, SST and TMF across the HS1 shows scattered values of TMF (below 20 %) occurring at SST below 15.5 °C and CO2 below 225 ppmv (Fig. 5), underscoring the combined climatic and physiological constraints on forest expansion.
4.1.3 Bølling-Allerød (BA, 15-12.5 cal kyr BP)
The BA (pollen zone U1385-3: 15230–12780 cal yr BP; Fig. S1 in the Supplement) had generally more favourable climatic conditions (higher temperatures, higher moisture availability) for TMF development (Fig. 3c) including a minor increase in thermophilous Mediterranean elements (Fig. 3c and f) and a reduction of STE (Fig. 3d). The combination of warming (SST above 16 °C, Fig. 3j) and a dry to wet trend are likely the primary drivers of progressive forest development during the BA. Additionally, the increase of CO2 from ∼ 230 to 245 ppmv should have promoted a “fertilisation effect” during this time interval (Fig. 3b). BIOME3 simulations for African Biomes (Tropical Forest/Ericaceous scrub) with a present climate showed that above 190 ppmv, the increase of CO2 at intervals < 20 ppmv, gradually offsets the negative effect of temperature changes. When CO2 exceeds 250 ppmv with a temperature change of ∼ −6 °C the development of forests expands at expense of ericaceous scrubland (Jolly and Haxeltine, 1997).
Within age uncertainties, abrupt increases in CO2 at 16.3 and 14.8 kyr (Marcott et al., 2014) (Fig. 3b) could be associated with the slight increase of forest at the onset of the BA and the subsequent highest peaks of forest development observed during the BA, respectively (Fig. 3c). Cao et al. (2019), using pollen-based biome reconstruction, suggested that worldwide expansion of forests was a consequence of the increasing CO2 superimposed over the temperature increase between 21 and 14 kyr. Cao et al. (2019) further emphasise the role of CO2 after the LGM driving a general northward expansion of forests and replacement of grassland by temperate forests in Europe. During the BA, considering that temperature and moisture availability in SW Iberia was favourable, increases in CO2 levels (> 225 ppmv) may have amplified TMF expansion during this period (Figs. 4b and 5).
4.1.4 Younger Dryas (YD, 12.9–11.7 cal kyr BP)
The YD (pollen zone U1385-4: 12780–11190 cal yr BP, Fig. S1 in the Supplement) is characterised by an initial weak forest contraction followed by its progressive expansion (Fig. 3c). At the regional scale, the landscape likely consisted of a forest-grassland mosaic, as suggested by the relatively high presence of forest elements coexisting with semi-desert taxa (Figs. 3c, d and 4a). Strong SST cooling (Fig. 3j), (equivalent to LGM SSTs or even cooler), with a minimum of 13.2 °C, without significant freshwater pulses, may have been associated with cooler land surface temperatures. However, this impact may have been muted by the positive effect of higher moisture availability (based on the presence of TMF, Naughton et al., 2019) and/or the increasing trend of CO2 (Fig. 3b). The weak reduction in TMF observed in our record and corroborated by the compiled records (Fig. 3c) contrasts with the steppe environment often described for this interval, especially in the southeast of the Iberian Peninsula (Carrión, 2002; Camuera et al., 2019). A more pronounced forest contraction is observed in the high-altitude terrestrial/lacustrine cores (Quintanar de la Sierra II – Peñalba et al., 1997; and La Roya – Allen et al., 1996) in which the near-disappearance of the forest might reflect the altitudinal adjustments in vegetation belts (Aranbarri et al., 2014). However, the U1385 and numerous Iberian records (e.g., Lake de Banyoles – Perez-Obiol and Julià, 1994; MD03-2697 – Naughton et al., 2007; MD95-2039 – Roucoux et al., 2005; Charco da Candieira – van der Knaap and van Leeuwen, 1997; MD95-2042 – Chabaud et al., 2014; D13882 – Naughton et al., 2019; MD95-2043 – Fletcher and Sánchez Goñi, 2008; ODP Site 976 – Combourieu-Nebout et al., 2002) show a relatively high percentage of TMF during the YD compared to HS1 (Fig. 3c).
Unfortunately, there is a lack of independent precipitation proxies for SW Iberia, and Denniston et al. (2018) highlight the limited reliability of speleothem proxies as indicators of precipitation in this region for this time interval. More widely in the Iberian Peninsula, a double hydrological structure with a drier first phase and wetter second phase was proposed, the latter favouring the expansion of mountain glaciers (García-Ruiz et al., 2016; Baldini et al., 2019). We observe that the notable YD forest development occurred, counterintuitively, in association with similar SSTs to those of the LGM and only slightly higher than those of HS1. Along with higher summer insolation, higher CO2 (> 240 ppmv, Fig. 5) may have been a key factor in supporting forest development. A climate simulation from transient experiments using LOVECLIM, for the site SHAK06-5K/MD01-2444 located near U1385, obtained a weaker AMOC, colder winter temperature, and lower precipitation for the YD compared with the LGM (Cutmore, 2021; Cutmore et al., 2021). This supports the scrutiny of additional factors, notably pCO2 influence on moisture availability for plants, to explain the substantial levels of TMF observed in the Iberian margin records (Fig. 3c). The increase in pCO2 may have enhanced plant productivity and WUE (Cowling and Sykes, 1999; Ward, 2005) during the YD, partially compensating for the impact of atmospheric cooling and drying. Schenk et al. (2018) suggest pCO2 may play an essential role in forest development if enough moisture is available. Tree cover may have been confined to suitable moist microhabitats and areas close to refugia; however, it was clearly less restricted than during earlier cold periods (Svenning et al., 2011), as indicated by the TMF abundances (Fig. 3c). Simulations from vegetation-climate models based on pollen records for biome reconstruction (Shao et al., 2018) and in a dynamic vegetation model (ORCHIDEE) driven by outputs from an AOGCM (Woillez et al., 2011) emphasise the role of increasing CO2 as a critical factor for global forest development during the period including the YD (Shao et al., 2018). Underlying these changes, the increase in summer insolation (Fig. 3a), which contributed to the increase of summer temperatures and winter precipitation in the Mediterranean region (Meijer and Tuenter, 2007), cannot be neglected as a driver of forest development, at least where trees were not excessively water-stressed. However, disentangling the contribution of insolation vs CO2 requires sensitivity experiments, not yet performed. In summary, the persistence of TMF during the YD, despite colder winters and drier summer conditions compared to the BA, is most plausibly explained by the combined interaction between precipitation variability, maximum insolation and increasing CO2 (between ∼ 245 and 265 ppmv) (Fig. 4a).
4.1.5 Early to Middle Holocene (11.7–4.2 cal kyr BP)
Pollen zone U1385-5 (11190–4260 cal yr BP) corresponds to the Early to Middle Holocene. This interval is marked by the expansion of TMF and thermophilous Mediterranean elements, reflecting a regional increase in temperature and precipitation in parallel with warm SSTs (> 18 °C). Despite coarser temporal resolution for this interval, the U1385 record is consistent with nearby records showing a maximum forest development at ∼ 9000 cal yr BP (Fig. 3c). The specific timing of the Holocene forest maximum varied across the Iberian Peninsula along a gradient of regional moisture availability (Gomes et al., 2020). The Early Holocene CO2 exceeded 260 ppmv, representing full interglacial conditions. The combination of coupled interglacial ocean-atmosphere conditions (reflected in high SSTs) and high CO2 supported maximum forest development (Fig. 5). The impact on plant moisture availability compared to the preceding glacial conditions would have been profound, supporting high productivity and further increases in WUE. The progressive lifting of CO2 constraints on photosynthesis throughout the Last Deglaciation may thus represent an important factor underlying forest development in SW Iberia.
4.2 C29 C31 ratio and C3 C4 dynamics: potential and limitations
Long-chain n-alkanes with odd-numbers, such as C29, C31, C33, are epicuticular waxes produced by terrestrial plants. In lake sediments, higher abundance of C29 occurs in catchments with more trees, while higher abundance of C31 is observed in grassy catchments (Meyers, 2003). However, caution is required when interpreting C29 C31 in taxonomic terms because both woody plants (trees and shrubs) and grasses can produce C29 and C31 chain lengths (Ortiz et al., 2010; Bush and McInerney, 2013). Additionally, n-alkane chain-length patterns differ across species and environments, so C29 C31 ratios cannot be interpreted as strict woody vs grass markers (Bush and McInerney, 2013). Insights into the dominance of different plant physiological pathways in response to contrasting levels of CO2 and humidity can be potentially gained by analysing C29 C31 n-alkanes from Site U1385. The C29 C31 ratio shows important variability between climatic phases, with increasing values during the LGM, high values during HS1 and the YD, and lower values during the BA and Holocene (Fig. 3h). The C29 C31 ratio is positively correlated (Pearson's correlation coefficient, r = 0.52, p-value = 2.473 × 10⁻⁸) with the STE pollen group and negatively correlated (r = −0.63, p-value = 2.821 × 10⁻¹²) with TMF (Fig. 3c, d and h), indicating a link between pollen-based vegetation changes and n-alkane chain-length distributions. Notably, the expected simple interpretation of C29 C31 as “trees vs grasses” does not appear to hold for this dataset across the different phases. We propose two possible interpretations, which may explain the observed C29 C31 variability. First a physiological stress response hypothesis: the C29 C31 ratio in this setting may reflect an adaptation of plants to aridity. Leaf-waxes n-alkanes protect plants against the loss of water during the photosynthesis (Post-Beittenmiller, 1996; Jetter et al., 2006). We could expect that arid, cold and windy conditions impose greater physiological stress on woody plants than on grasses. Consequently, increases in the C29 C31 values during HS1 and YD, may suggest that woody plants (TMF and ERI) responded to climatic stress by enhancing leaf wax C29 production as a protective strategy (Fig. 3h). Second, changes in C29 C31 ratio may indicate compositional changes in vegetation, particularly between woody-dominated communities with diverse ecological tolerances – from semi-desert dwarf shrubs such as Artemisia to mesophyll broad-leaved trees. In this context, a prevailing “trees vs grasses” interpretative framework may not adequately represent the Iberian vegetation patterns. We stress that both hypotheses are plausible but require further validation. Nevertheless, the coherent climate signal observed in the U1385 record is encouraging for future studies aimed at linking leaf-wax chemistry of contributing species and vegetation dynamics in this region (Cutmore, 2021; Cutmore et al., 2021). Beyond taxonomic shifts, the link between n-alkane chain-length distributions and the C3 C4 plant dynamic is also relevant. African savannahs are dominated by C4 plants, and C31 n-alkanes have been associated with their presence in past landscapes (Dupont et al., 2019). Worldwide, 80 % of Poaceae (grasses) and Cyperaceae (sedges) use a C4 photosynthetic pathway that is favoured by arid conditions (Sage, 2017). However, pollen analysis cannot discriminate between Poaceae and Cyperaceae pollen morphotypes exclusively or in its majority of C4 plants. We have grouped the Poaceae and the Cyperaceae pollen taxa, noting the inherent limitations of this grouping to represent C4 plants in Iberia as we know that C3 are the dominant grasses across the region (Casas-Gallego et al., 2025) (Fig. 3g). Accordingly, the grouping of Poaceae + Cyperaceae pollen must be interpreted with caution. During the last deglaciation, this group (Poaceae + Cyperaceae) shows relatively high but fluctuating values between the LGM and the BA stabilising thereafter, without a clear correlation with other proxies (TMF, STE, or C29 C31). Thus, we do not find strong evidence for an increased role of grasses/sedges, or of C4 plants specifically, during arid or low CO2 intervals. Experimental studies, show that C3 grasses outperform C4 grasses when temperatures rise by 5 to 15 °C at a low CO2 concentration of 200 ppm. Research on the quantum yield of photosynthesis identified a “crossover temperature” – the point at which C3 and C4 plants perform equally. This crossover depends on both temperature and CO2 levels. Modelling across 0–45 °C and CO2 levels from 150–700 ppm shows that whether C3 or C4 plants are favoured is determined by the interaction between these two factors; however, humidity was not considered in these studies (Ehleringer et al., 1997; Edwards et al., 2010). Most C4 plants are confined to tropical grasslands and savannahs; where they are better adapted to higher temperatures, arid, nutrient poor conditions, and environments subject to intense disturbance caused by animals or fire regimes (Bond et al., 2005; Edwards et al., 2010). Likewise, one should expect that vegetation in SW Iberia after the LGM (Figs. 3 and 5) should be dominated by C3 plants. This interpretation is consistent with the relatively cold SSTs (Fig. 5) and the high percentages of Artemisia spp. (C3 plant) in the pollen record (Fig. S1 in the Supplement). However, it is not possible to completely rule out a role of C4 plants in the glacial vegetation of SW Iberia, because pollen morphology does not allow the separation of these groups. Stable isotope studies on ancient grass pollen were able to discriminate C3 C4 grasses, but single-grain analyses remain technically challenging (Nelson et al., 2016). Further biomarker research is therefore needed to resolve C3 C4 dynamics in temperate – Mediterranean biomes. Current evidence suggests that the C3 C4 shifts documented in African savannahs (e.g., Dupont et al., 2019) are not directly applicable to our study area. Species-level biomarker fingerprinting will be essential to test whether C4 plants played a significant role in Iberian Mediterranean ecosystems during the last deglaciation.
In summary, although future isotopic and biomarker approaches hold great promise for resolving C3 C4 dynamics, the current evidence strongly supports C3 dominance in SW Iberia during the deglaciation. This interpretation is consistent with the modern distribution of plants in the region, where less than 10 % of grasses are C4 (Casas-Gallego et al., 2025), and with the prevailing cool and relatively humid conditions of the LGM and YD, which favour C3 over C4 photosynthesis. Thus, while acknowledging the limitations of pollen-based proxies, the available data indicate that C3 plants were the dominant contributors to the Iberian vegetation signal.
This study presents high-resolution pollen and biomarkers records from Site U1385 off the SW Iberian Margin, providing new insights into vegetation dynamics during key climate transitions of the last deglaciation and the associated CO2 changes. We applied a biomarker proxy (leaf wax C29 C31 ratio), which is positively correlated with the semi-desert pollen curve and negatively correlated with TMF, demonstrating its potential as an indicator of aridity in marine cores of the Western Mediterranean region. The high temporal resolution of the record, combined with a robust radiocarbon chronology, enables consistent and more accurate comparisons with regional datasets, strengthening its contribution for future palaeoenvironmental reconstructions and model simulations.
Rather than simply interpreting our dataset in terms of past temperature and precipitation changes, we examine the U1385 record in the context of modern and palaeo observational and modelling studies that support a significant influence of CO2 on past vegetation distribution and composition. During the LGM, cool temperatures, low seasonality, and physiological drought stress under low CO2 restricted forest growth and favoured heathlands. Traits of Mediterranean Ericaceae, such as deep roots and thick waxy leaves, may have given these plants a competitive advantage. During HS1, woody vegetation was significantly suppressed due to cold and arid conditions, exacerbated by low CO2. The subsequent expansion of temperate Mediterranean forests during the BA was promoted by warmer, wetter conditions and favoured by rising CO2 concentrations. During the Younger Dryas, despite a return to cooler temperatures, forest-grassland mosaics persisted supported by adequate moisture availability and sustained higher CO2 levels.
Furthermore, our study suggests a critical CO2 threshold for forest expansion at ∼ 225 ppmv. Below this value (e.g., LGM and HS1), arboreal populations were generally restricted in their development with the impact of aridification and cooling being detrimental. Above this value, forests expanded (e.g., during the BA) and the effects of adverse climatic conditions (e.g., during the YD) was buffered. This threshold is consistent with observations from Mediterranean to tropical African environments (e.g., Dupont et al., 2019; Oliveira et al.,2020; Koutsodendris et al., 2023; Sánchez-Goñi et al., 2023). The concept should be further tested in regional vegetation models to determine the vegetation response to CO2 fluctuations during past cold periods.
Finally, our findings highlight the importance of CO2 as a key driver of vegetation change in the Mediterranean region through its control on plant moisture-availability and water-use efficiency (Koutsodendris et al., 2023). These palaeodata provide critical context for understanding vegetation responses under future climate scenarios with rising CO2 and shifting precipitation regimes. At the same time, they underscore the need for further research on the relationship between long-chain n-alkanes, vegetation types, and C3 C4 plant dynamics, as the long-chain n-alkanes do not yet provide a reliable basis to disentangle the dynamics between woody plants and grasses in the Mediterranean ecosystems.
The data supporting the findings of this study will be made available upon publication. Interested researchers can access the data by contacting the first author directly or through a publicly accessible data repository.
The supplement related to this article is available online at https://doi.org/10.5194/bg-22-6631-2025-supplement.
SDG, WF, FN and AS contributed to the conception and design of the study, data analysis and interpretation. Also, they were responsible for the grant application to NERC. SDG performed pollen analysis. TR performed biomarkers analysis. AR performed assemblage foraminifers picking for radiocarbon dating and drew Fig. 1. SDG prepared the original draft and wrote the manuscript including figures with the critical input (edition and revision) from all co-authors.
The contact author has declared that none of the authors has any competing interests.
Publisher's note: Copernicus Publications remains neutral with regard to jurisdictional claims made in the text, published maps, institutional affiliations, or any other geographical representation in this paper. While Copernicus Publications makes every effort to include appropriate place names, the final responsibility lies with the authors. Views expressed in the text are those of the authors and do not necessarily reflect the views of the publisher.
This research was supported by the Portuguese Foundation for Science and Technology (FCT) SFRH/BD/128984/2017 PhD grant to Sandra Domingues Gomes, the ULTImATum (IF/01489/2015) and, the Hydroshifts (PTDC/CTA-CLI/4297/2021) projects; CCMAR FCT Research Unit – project UIDB/04326/2020, CCMAR BCC grant (Incentivo/MAR/LA00015/2014) to Filipa Naughton, FCT contract (CEECIND/02208/2017) to Dulce Oliveira, WarmWorld Project (PTDC/CTA-GEO/29897/2017) for Biomarker analyses, and grant (SFRH/BPD/108600/2015) to Teresa Rodrigues. The sixteen radiocarbon dates were obtained through the NERC radiocarbon allocations 2136.1018 and 2199.1019. The contributions of Ludovic Devaux are gratefully acknowledged (Bordeaux 1 University, EPOC, UMR-CNRS 5805) for his assistance in palynological treatments. This study received Portuguese national funds from FCT – Foundation for Science and Technology through projects UIDB/04326/2020 (https://doi.org/10.54499/UIDB/04326/2020) and LA/P/0101/2020 (https://doi.org/10.54499/LA/P/0101/2020).
This research has been supported by the Fundação para a Ciência e a Tecnologia (grant nos. SFRH/BD/128984/2017 and PTDC/CTA-CLI/4297/2021) and the University of Manchester (grant no. SFRH/BD/128984/2017).
This paper was edited by Petr Kuneš and reviewed by two anonymous referees.
Agencia Estatal de Meteorología (AEMET) and Instituto de Meteorologia (IM, Portugal): Atlas Climático Ibérico: Temperatura del aire y precipitación (Experiment Normais 1971–2000), AEMET andIM, Gobierno de España, Madrid and Lisbon, ISBN 978-84-7837-079-5, 2011.
Allen, J. R., Huntley, B., and Watts, W. A.: The vegetation and climate of northwest Iberia over the last 14,000 years, J. Quaternary Sci., 11125–11147, 1996.
Alley, R. B. and Clark, P. U.: The deglaciation of the northern hemisphere: a global perspective, Annu. Rev. Earth Pl. Sc., 27, 149–182, https://doi.org/10.1146/annurev.earth.27.1.149, 1999.
Annan, J. D., Hargreaves, J. C., and Mauritsen, T.: A new global surface temperature reconstruction for the Last Glacial Maximum, Clim. Past, 18, 1883–1896, https://doi.org/10.5194/cp-18-1883-2022, 2022.
Aranbarri, J., González-Sampériz, P., Valero-Garcés, B., Moreno, A., Gil-Romera, G., Sevilla-Callejo, M., García-Prieto, E., Di Rita, F., Mata, M. P., Morellón, M., and Magri, D.: Rapid climatic changes and resilient vegetation during the Lateglacial and Holocene in a continental region of south-western Europe, Global Planet. Change, 114, 50–65, https://doi.org/10.1016/j.gloplacha.2014.01.003, 2014.
Asensi, A. and Díez-Garretas, B.: Coastal Vegetation, in The Vegetation of the Iberian Peninsula, edited by: Loidi, J., Plant and Vegetation, Vol. 13, Springer, Cham, Switzerland, 397–432, https://doi.org/10.1007/978-3-319-54867-8_8, 2017.
Ausín, B., Haghipour, N., Bruni, E., and Eglinton, T.: The influence of lateral transport on sedimentary alkenone paleoproxy signals, Biogeosciences, 19, 613–627, https://doi.org/10.5194/bg-19-613-2022, 2022.
Baldini, L. M., McDermott, F., Cueto, M., Arias, P., and Baldini, J. U. L.: North Iberian temperature and rainfall seasonality over the last two glacial cycles, Quaternary Science Reviews, 221, 105998, https://doi.org/10.1016/j.quascirev.2019.105998, 2019.
Bard, E., Rostek, F., Turon, J. L., and Gendreau, S.: Hydrological impact of Heinrich events in the subtropical northeast Atlantic, Science, 289, 1321–1324, https://doi.org/10.1126/science.289.5483.1321, 2000.
Bartlein, P. J., Harrison, S. P., Brewer, S., Connor, S., Davis, BAS., Gajewski, K., Guiot, J., Harrison-Prentice, T. I., Henderson, A., Peyron, O., and Prentice, I. C.: Pollen-based continental climate reconstructions at 6 and 21 ka: a global synthesis, Clim. Dynam., 37, 775–802, https://doi.org/10.1007/s00382-010-0904-1, 2011.
Beghin, P., Charbit, S., Kageyama, M., Combourieu-Nebout, N., Hatté, C., Dumas, C., and Peterschmitt, J.-Y.: What drives LGM precipitation over the western Mediterranean? A study focused on the Iberian Peninsula and northern Morocco, Clim. Dynam. 46, 2611–2631, https://doi.org/10.1007/s00382-015-2720-0, 2016.
Bennett, K. D.: Documentation for Psimpoll 4.27 and Pscomb 1.03: C programs for plotting and analysing pollen data, http://www.chrono.qub.ac.uk/psimpoll/psimpoll.html (last access: 6 June 2025), 2009.
Berger, A. and Loutre, M.-F.: Insolation values for the climate of the last 10 million years, Quaternary Sci. Rev., 10, 297–317, https://doi.org/10.1016/0277-3791(91)90033-Q, 1991.
Blaauw, M. and Christen, J. A.: Flexible paleoclimate age-depth models using an autoregressive gamma process, Bayesian Anal., 6, 457–474, https://doi.org/10.1214/ba/1339616472, 2011.
Bond, G., Showers, W., Cheseby, M., Lotti, R., Almasi, P., Cullen, H., and Broecker, W. S.: Evidence for massive discharges of icebergs into the North Atlantic Ocean during the last glacial period, Nature, 360, 245–249, https://doi.org/10.1038/360245a0, 1993.
Bond, W. J., Woodward, F. I. and Midgley, G. F.: The global distribution of ecosystems in a world without fire, New Phytologist, 165, 525–538, https://doi.org/10.1111/j.1469-8137.2004.01252.x, 2005.
Brassell, S. C., Eglinton, G., Marlowe, I. T., Pflaumann, U., and Sarnthein, M.: Molecular stratigraphy: a new tool for climatic assessment, Nature, 320, 129–133, https://doi.org/10.1038/320129a0, 1986.
Bush, R. T. and McInerney, F. A.: Leaf wax n-alkane distributions in and across modern plants: implications for paleoecology and chemotaxonomy, Geochim. Cosmochim. Ac., 117, 161–179, 2013.
Camuera, J., Jiménez-Moreno, G., Ramos-Román, M. J., García-Alix, A., Toney, J. L., Anderson, R. S., Jiménez-Espejo, F., Bright, J., Webster, C., Yanes, Y., and Carrión, J. S.: Vegetation and climate changes during the last two glacial-interglacial cycles in the western Mediterranean: A new long pollen record from Padul (southern Iberian Peninsula), Quaternary Sci. Rev., 205, 86–105, https://doi.org/10.1016/j.quascirev.2018.12.013, 2019.
Cao, X., Tian, F., Dallmeyer, A., and Herzschuh, U.: Northern Hemisphere biome changes (> 30° N) since 40 cal ka BP and their driving factors inferred from model-data comparisons, Quaternary Sci. Rev., 220, 291–309, https://doi.org/10.1016/j.quascirev.2019.07.034, 2019.
Carlson, A. E., LeGrande, A. N., Oppo, D. W., Came, R. E., Schmidt, G. A., Anslow, F. S., Licciardi, J. M., and Obbink, E. A.: Rapid early Holocene deglaciation of the Laurentide ice sheet, Nature Geosci., 1, 620–624, https://doi.org/10.1038/ngeo285, 2008.
Carr, A. S., Boom, A., Grimes, H. L., Chase, B. M., Meadows, M. E., and Harris, A.: Leaf wax n-alkane distributions in arid zone South African flora: environmental controls, chemotaxonomy and palaeoecological implications. Org. Geochem., 67, 72–84, https://doi.org/10.1016/j.orggeochem.2013.12.004, 2014.
Carrión, J. S.: Patterns and processes of Late Quaternary environmental change in a montane region of southwestern Europe, Quaternary Sci. Rev., 21, 2047–2066, https://doi.org/10.1016/S0277-3791(02)00010-0, 2002.
Casas-Gallego, M., Postigo-Mijarra, J. M., Sánchez-de Dios, R., Barrón, E., Bruch, A. A., Hahn, K., and Sainz-Ollero, H.: Changes in distribution of the Iberian vegetation since the Last Glacial Maximum: A model-based approach, Quaternary Sci. Rev., 351, 109162, https://doi.org/10.1016/j.quascirev.2024.109162, 2025.
Chabaud, L., Sánchez Goñi, M. F., Desprat, S., and Rossignol, L.: Land-sea climatic variability in the eastern North Atlantic subtropical region over the last 14,200 years: Atmospheric and oceanic processes at different timescales, The Holocene, 24, 787–797, https://doi.org/10.1177/0959683614530439, 2014.
Chen, W., Zhu, D., Ciais, P., Huang, C., Viovy, N., and Kageyama, M.: Response of vegetation cover to CO2 and climate changes between Last Glacial Maximum and pre-industrial period in a dynamic global vegetation model, Quaternary Sci. Rev., 218, 293–305, https://doi.org/10.1016/j.quascirev.2019.06.003, 2019.
Chevalier, M., Davis, B. A. S., Heiri, O., Seppä, H., Chase, B. M., Gajewski, K., Lacourse, T., Telford, R. J., Finsinger, W., Guiot, J., Kühl, N., Maezumi, S. Y., Tipton, J. R., Carter, V. A., Brussel, T., Phelps, L. N., Dawson, A., Zanon, M., Vallé, F., Nolan, C., Mauri, A., de Vernal, A., Izumi, K., Holm ström, L., Marsicek, J., Goring, S., Sommer, P. S., Chaput, M., and Kupriyanov, D.: Pollen-based climate reconstruction tech niques for late Quaternary studies, Earth Sci. Rev., 210, 103384, https://doi.org/10.1016/j.earscirev.2020.103384, 2020.
Chevalier, M., Chase, B. M., Quick, L. J., Dupont, L. M., and Johnson, T. C.: Temperature change in subtropical southeastern Africa during the past 790,000 yr, Geology, 49, 71–75, https://doi.org/10.1130/G47841.1, 2021.
Claussen, M., Selent, K., Brovkin, V., Raddatz, T., and Gayler, V.: Impact of CO2 and climate on Last Glacial Maximum vegetation – A factor separation, Biogeosciences, 10, 3593–3604, https://doi.org/10.5194/bg-10-3593-2013, 2013.
Cleator, S. F., Harrison, S. P., Nichols, N. K., Prentice, I. C., and Roulstone, I.: A new multivariable benchmark for Last Glacial Maximum climate simulations, Clim. Past, 16, 699–712, https://doi.org/10.5194/cp-16-699-2020, 2020.
Clément, C., Martinez, P., Yin, Q., Clemens, S. C., Thirumalai, K., Prasad, S., Anupama, K., Su, Q., Lyu, A., Grémare, A., and Desprat, S.: Greening of India and revival of the South Asian summer monsoon in a warmer world, Commun. Earth Environ., 5, 685, https://doi.org/10.1038/s43247-024-01781-1, 2024.
Combourieu Nebout, N., Peyron, O., Dormoy, I., Desprat, S., Beaudouin, C., Kotthoff, U., and Marret, F.: Rapid climatic variability in the west Mediterranean during the last 25 000 years from high resolution pollen data, Clim. Past, 5, 503–521, https://doi.org/10.5194/cp-5-503-2009, 2009.
Conte, M. H., Sicre, M.-A., Rühlemann, C., Weber, J. C., Schulte, S., Schulz-Bull, D., and Blanz, T.: Global temperature calibration of the alkenone unsaturation index (37) in surface waters and comparison with surface sediments, Geochem. Geophys. Geosyst., 7, Q02005, https://doi.org/10.1029/2005GC001054, 2006.
Cowling, S. A. and Sykes, M. T.: Physiological significance of low atmospheric CO2 for plant-climate interactions, Quaternary Res., 52, 237–242, https://doi.org/10.1006/qres.1999.2065, 1999.
Cowling, S. A.: Simulated effects of low atmospheric CO2 on structure and composition of North American vegetation at the Last Glacial Maximum, Global Ecol. Biogeogr., 8, 81–93, https://doi.org/10.1046/j.1365-2699.1999.00136.x, 1999.
Cranwell, P. A.: Chain-length distribution of n-alkanes from lake sediments in relation to post-glacial environmental change, Freshwater Biology, 3, 259–265, https://doi.org/10.1111/j.1365-2427.1973.tb00921.x, 1973.
Cruz-Silva, E., Harrison, S. P., Prentice, I. C., Marinova, E., Bartlein, P. J., Renssen, H., and Zhang, Y.: Pollen-based reconstructions of Holocene climate trends in the eastern Mediterranean region, Clim. Past, 19, 2093–2108, https://doi.org/10.5194/cp-19-2093-2023, 2023.
Cutmore, A. V.: Insights into the nature of climate and vegetation changes over the last 28,000 years using combined pollen and leaf-wax biomarker analyses from the SW Iberian Margin, Doctoral dissertation, UCL (University College London), https://discovery.ucl.ac.uk/id/eprint/10131446/ (last access: 6 June 2025), 2021.
Cutmore, A., Ausín, B., Maslin, M., Eglinton, T., Hodell, D., Muschitiello, F., and Tzedakis, P. C.: Abrupt intrinsic and extrinsic responses of southwestern Iberian vegetation to millennial-scale variability over the past 28 ka, J. Quat. Sci., 37, 420–440, https://doi.org/10.1002/jqs.3392, 2021.
Denniston, R. F., Houts, A. N., Asmerom, Y., Wanamaker Jr., A. D., Haws, J. A., Polyak, V. J., Thatcher, D. L., Altan-Ochir, S., Borowske, A. C., Breitenbach, S. F. M., Ummenhofer, C. C., Regala, F. T., Benedetti, M. M., and Bicho, N. F.: A stalagmite test of North Atlantic SST and Iberian hydroclimate linkages over the last two glacial cycles, Clim. Past, 14, 1893–1913, https://doi.org/10.5194/cp-14-1893-2018, 2018.
Denton, G. H. and Hughes, T. J.: The Last Great Ice Sheet, Wiley Interscience, New York, 484 pp., ISBN 9780471065383, 1981.
Denton, G. H., Anderson, R. F., Toggweiler, J. R., Edwards, R. L., Schaefer, J. M., and Putnam, A. E.: The last glacial termination, Science, 328, 1652–1656, https://doi.org/10.1126/science.1184119, 2010.
Diefendorf, A. F. and Freimuth, E. J.: Extracting the most from terrestrial plant-derived n-alkyl lipids and their carbon isotopes from the sedimentary record: a review, Org. Geochem., 103, 1–21, https://doi.org/10.1016/j.orggeochem.2016.10.016, 2017.
Dormoy, I., Peyron, O., Combourieu Nebout, N., Goring, S., Kotthoff, U., Magny, M., and Pross, J.: Terrestrial climate variability and seasonality changes in the Mediterranean region between 15000 and 4000 years BP deduced from marine pollen records, Clim. Past, 5, 615–632, https://doi.org/10.5194/cp-5-615-2009, 2009.
Dupont, L. M., Caley, T., and Castañeda, I. S.: Effects of atmospheric CO2 variability of the past 800 kyr on the biomes of southeast Africa, Clim. Past, 15, 1083–1097, https://doi.org/10.5194/cp-15-1083-2019, 2019.
Dusenge, M. E., Duarte, A. G., and Way, D. A.: Plant carbon metabolism and climate change: elevated CO2 and temperature impacts on photosynthesis, photorespiration and respiration, New Phytologist, 221, 32–49, https://doi.org/10.1111/nph.15283, 2019.
Dyke, A. S. and Prest, V. K.: Late Wisconsinan and Holocene history of the Laurentide Ice Sheet, Géogr. Phys. Quat., 41, 237–263, https://doi.org/10.7202/032681ar, 1987.
Edwards, E. J., Osborne, C. P., Strömberg, C. A., Smith, S. A., and C4 Grasses Consortium: The origins of C4 grasslands: integrating evolutionary and ecosystem science, Science, 328, 587–591, https://doi.org/10.1126/science.1177216, 2010.
Ehleringer, J. R., Cerling, T. E., and Helliker, B. R.: C4 photosynthesis, atmospheric CO2, and climate, Oecologia, 112, 285–299, 1997.
Faegri, K., Kaland, P. E. and Krzywinski, K., Textbook of pollen analysis, 4th Edition, John Wiley & Sons Ltd., Chichester, ISBN 0471921785, 1989.
Farquhar, G. D. and Lloyd, J.: Carbon and Oxygen Isotope Effects in the Exchange of Carbon Dioxide between Terrestrial Plants and the Atmosphere, in: Stable Isotopes and Plant Carbon/Water Relations, edited by: Ehleringer, J. R., Hall, A. E., and Farquhar, G. D., Academic Press, New York, 47–70, https://doi.org/10.1016/C2009-0-03312-1, 1993.
Fletcher, W. J. and Sánchez Goñi, M. F.: Orbital-and sub-orbital-scale climate impacts on vegetation of the western Mediterranean basin over the last 48,000 yr, Quaternary Res., 70, 451–464, https://doi.org/10.1016/j.yqres.2008.07.002, 2008.
Fletcher, W. J., Goñi, M. S., Peyron, O., and Dormoy, I.: Abrupt climate changes of the last deglaciation detected in a Western Mediterranean forest record, Clim. Past, 6, 245–264, https://doi.org/10.5194/cp-6-245-2010, 2010a.
Fletcher, W. J., Sánchez Goñi, M. F., Allen, J. R. M., Cheddadi, R., Combourieu-Nebout, N., Huntley, B., Lawson, I., Londeix, L., Magri, D., Margari, V., Müller, U. C., Naughton, F., Novenko, E., Roucoux, K., and Tzedakis, P. C.: Millennial-scale variability during the last glacial in vegetation records from Europe, Quaternary Sci. Rev. 29, 2839–2864, https://doi.org/10.1016/j.quascirev.2009.11.015, 2010b.
García-Ruiz, J. M., Palacios, D., González-Sampériz, P., De Andrés, N., Moreno, A., Valero-Garcés, B., and Gómez-Villar, A.: Mountain glacier evolution in the Iberian Peninsula during the Younger Dryas, Quaternary Sci. Rev., 138, 16–30, https://doi.org/10.1016/j.quascirev.2016.02.012, 2016.
Georget, M., Castéra, M.-H., Devaux, L., Turon, J.-L., Desprat, S., and Sánchez Goñi, M. F.: Protocol for pollen and dinocyst analysis in marine sediments, Protocols.io, https://doi.org/10.17504/protocols.io.x54v92qz4l3e/v1, 2025.
Gerhart, L. M. and Ward, J. K.: Plant responses to low [CO2] of the past, New Phytol., 188, 674–695, https://doi.org/10.1111/j.1469-8137.2010.03441.x, 2010.
Gomes, S. D., Fletcher, W. J., Rodrigues, T., Stone, A., Abrantes, F., and Naughton, F.: Time-transgressive Holocene maximum of temperate and Mediterranean forest development across the Iberian Peninsula reflects orbital forcing, Palaeogeogr. Palaeocl., 550, 109739, https://doi.org/10.1016/j.palaeo.2020.109739, 2020.
Gosling, W. D., Miller, C. S., Shanahan, T. M., Holden, P. B., Overpeck, J. T., and van Langevelde, F.: A Stronger Role for Long-Term Moisture Change Than for CO2 in Determining Tropical Woody Vegetation Change, Science, 376, 653–56, https://doi.org/10.1126/science.abg4618, 2022.
Gratani, L. and Varone, L.: Leaf key traits of Erica arborea L., Erica multiflora L. and Rosmarinus officinalis L. co-occurring in the Mediterranean maquis, Flora-Morphology, Distribution, Functional Ecology of Plants, 199, 58–69, https://doi.org/10.1078/0367-2530-00130, 2004.
Grimalt, J. O., Calvo, E., and Pelejero, C.: Sea surface paleotemperature errors in 37 estimation due to alkenone measurements near the limit of detection, Paleoceanography, 16, 226–232, https://doi.org/10.1029/1999PA000440, 2001.
Grimm, E. C.: CONISS: a FORTRAN 77 program for stratigraphically constrained cluster analysis by the method of incremental sum of squares, Comput. Geosci., 13, 13–35, https://doi.org/10.1016/0098-3004(87)90022-7, 1987.
Guiot, J., Torre, F., Jolly, D., Peyron, O., Boreux, J. J., and Cheddadi, R.: Inverse vegetation modeling by Monte Carlo sampling to reconstruct palaeoclimates under changed precipitation seasonality and CO2 conditions: application to glacial climate in Mediterranean region, Ecol. Model., 127, 119–140, https://doi.org/10.1016/S0304-3800(99)00219-7, 2000.
Harrison, S. P. and Prentice, C. I.: Climate and CO2 controls on global vegetation distribution at the last glacial maximum: analysis based on palaeovegetation data, biome modelling and palaeoclimate simulations, Glob. Chang. Biol., 9, 983–1004, https://doi.org/10.1046/j.1365-2486.2003.00640.x, 2003.
Heaton, T. J., Köhler, P., Butzin, M., Bard, E., Reimer, R. W., Austin, W. E., Ramsey, C. B, Grootes, P. M., Hughen, K. A, Kromer, B., Reimer, P. J., Adkins, J., Burke, A., Cook, M. S., Olsen, J., and Skinner, L. C.: Marine20 – the marine radiocarbon age calibration curve (0–55,000 cal BP), Radiocarbon, 62, 779–820, https://doi.org/10.1017/RDC.2020.68, 2020.
Heusser, L. and Balsam, W. L.: Pollen distribution in the northeast Pacific Ocean, Quaternary Res., 7, 45–62, https://doi.org/10.1016/0033-5894(77)90013-8, 1977.
Hodell, D., Lourens, L., Crowhurst, S., Konijnendijk, T., Tjallingii, R., Jiménez-Espejo, F., Skinner, L., Tzedakis, P. C., Members, T. S. S. P., Abrantes, F., and Acton, G. D.: A reference time scale for Site U1385 (Shackleton Site) on the SW Iberian Margin, Global and Planet. Change, 133, 49–64, https://doi.org/10.1016/j.gloplacha.2015.07.002, 2015.
Huang, J. G., Bergeron, Y., Denneler, B., Berninger, F., and Tardif, J.: Response of forest trees to increased atmospheric CO2, Critical Reviews in Plant Sciences, 26, 265–283, 2007.
Izumi, K. and Lézine, A. M.: Pollen-based biome reconstructions over the past 18,000 years and atmospheric CO2 impacts on vegetation in equatorial mountains of Africa, Quaternary Sci. Rev., 152, 93–103, https://doi.org/10.1016/j.quascirev.2016.09.023, 2016.
Izumi, K. and Bartlein, P. J.: North American paleoclimate reconstructions for the Last Glacial Maximum using an inverse modeling through iterative forward modeling approach applied to pollen data, Geophys. Res. Lett., 43, 10–965, https://doi.org/10.1002/2016GL070152, 2016.
Jetter, R., Kunst, L., and Samuels, A. L.: Composition of plant cuticular waxes, in: Biology of the Plant Cuticle, Annual Plant Reviews, edited by: Riederer, M. and Müller, C., Blackwell, Oxford, 145–181, https://doi.org/10.1002/9780470988718.ch4, 2006.
Jolly, D. and Haxeltine, A.: Effect of Low Glacial Atmospheric CO2 on Tropical African Montane Vegetation, Science, 276, 786–788, https://doi.org/10.1126/SCIENCE.276.5313.786, 1997.
Körner, C.: Biosphere responses to CO2 enrichment, Ecol. Appl., 10, 1590–1619, https://doi.org/10.1890/1051-0761(2000)010[1590:BRTCE]2.0.CO;2, 2000.
Ludwig, P., Shao, Y., Kehl, M., and Weniger, G.-C.: The Last Glacial Maximum and Heinrich event I on the Iberian Peninsula: A regional climate modelling study for understanding human settlement patterns, Glob. Planet. Change, 170, 34–47, https://doi.org/10.1016/J.GLOPLACHA.2018.08.006, 2018.
Lüthi, D., Le Floch, M., Bereiter, B., Blunier, T., Barnola, J.-M., Siegenthaler, U., Raynaud, D., Jouzel, J., Fischer, H., Kawamura, K., and Stocker, T. F.: High-resolution carbon dioxide concentration record 650,000–800,000 years before present, Nature, 453, 379–382, https://doi.org/10.1038/nature06949, 2008.
Koutsodendris, A., Dakos, V., Fletcher, W. J., Knipping, M., Kotthoff, U., Milner, A. M., Müller, U. C., Kaboth-Bahr, S., Kern, O. A., Kolb, L., Vakhrameeva, P., Wulf, S., Christanis, K., Schmiedl, G., and Pross, J.: Atmospheric CO2 forcing on Mediterranean biomes during the past 500 kyrs, Nat. Commun., 14, 1664, https://doi.org/10.1038/s41467-023-37388-x, 2023.
Marcott, S. A., Bauska, T. K., Buizert, C., Steig, E. J., Rosen, J. L., Cuffey, K. M., Fudge, T. J., Severinghaus, J. P., Ahn, J., Kalk, M. L., McConnell, J. R., Sowers, T., Taylor, K. C., White, J. W. C., and Brook, E. J.: Centennial-scale changes in the global carbon cycle during the last deglaciation, Nature, 514, 616–619, https://doi.org/10.1038/nature13799, 2014.
Margari, V., Skinner, L. C., Hodell, D. A., Martrat, B., Toucanne, S., Grimalt, J. O., Gibbard, P. L., Lunkka, J. P., and Tzedakis, P. C.: Land-ocean changes on orbital and millennial time scales and the penultimate glaciation, Geology, 42, 183–186, https://doi.org/10.1130/G35070.1, 2014.
Martrat, B., Grimalt, J. O., Shackleton, N. J., de Abreu, L., Hutterli, M. A., and Stocker, T. F.: Four climate cycles of recurring deep and surface water destabilisations on the Iberian margin, Science, 317, 502–507, https://doi.org/10.1126/science.1139994, 2007.
McAndrews, J. H. and King, J. E.: Pollen of the North American Quaternary: the top twenty, Geoscience and Man, 15, 41–49, https://doi.org/10.2307/3687256, 1976.
Meijer, P. T. and Tuenter, E.: The effect of precession-induced changes in the Mediterranean freshwater budget on circulation at shallow and intermediate depth, Journal of Marine Systems, 68, 349–365, https://doi.org/10.1016/j.jmarsys.2007.01.006, 2007.
Meyers, P. A.: Applications of organic geochemistry to paleolimnological reconstructions: a summary of examples from the Laurentian Great Lakes, Org. Geochem., 34, 261–289, https://doi.org/10.1016/S0146-6380(02)00168-7, 2003.
Monnin, E., Indermühle, A., Dällenbach, A., Flückiger, J., Stauffer, B., Stocker, T. F., Raynaud, D., and Barnola, J. M.: Atmospheric CO2 concentrations over the last glacial termination, Science, 291, 112–114, https://doi.org/10.1126/science.291.5501.112, 2001.
Moore, P. D., Webb, J. A. and Collison, M. E.: Pollen analysis. Blackwell scientific publications, Oxford, 1991.
Morales-Molino, C. and García-Antón, M.: Vegetation and fire history since the last glacial maximum in an inland area of the western Mediterranean Basin (Northern Iberian Plateau, NW Spain), Quaternary Res., 81, 63–77, https://doi.org/10.1016/j.yqres.2013.10.010, 2014.
Morales-Molino, C., Devaux, L., Georget, M., Hanquiez, V., and Goñi, M. F. S.: Modern pollen representation of the vegetation of the Tagus Basin (central Iberian Peninsula), Rev. Palaeobot. Palyno., 276, 104193, https://doi.org/10.1016/j.revpalbo.2020.104193, 2020.
Müller, P., Kirst, G., Ruhland, G., Storch, I. V., and Rosell-Melé, A.: Calibration of the alkenone index based on core-tops the eastern South Atlantic and global ocean (60° N–60° S), Geochim. Cosmochim. Ac., 62, 1757–1772, https://doi.org/10.1016/S0016-7037(98)00097-0, 1998.
Naughton, F., Costas, S., Gomes, S. D., Desprat, S., Rodrigues, T., Goñi, M. S., Renssen, H., Trigo, R., Bronk-Ramsey, C., Oliveira, D., and Salgueiro, E.: Coupled ocean and atmospheric changes during Greenland stadial 1 in southwestern Europe, Quaternary Sci. Rev., 212, 108–120, https://doi.org/10.1016/j.quascirev.2019.03.033, 2019.
Naughton, F., Drago, T., Sánchez-Goñi , M. F., and Freitas, M. C.: Climate variability in the North-Western Iberian Peninsula during the last deglaciation, in: Oceans and the atmospheric carbon content, edited by: Duarte, P. and Santana-Casiano, M., Springer, Dordrecht, 1–22, https://doi.org/10.1007/978-90-481-9821-4_1, 2011.
Naughton, F.,Sanchéz-Goñi, M. S., Desprat, S., Turon, J. L., Duprat, J., Malaizé, B., Joli, C., Cortijo, E., Drago, T., and Freitas, M. C.: Present-day and past (last 25 000 years) marine pollen signal off western Iberia, Marine Micropaleontology, 62, 91–114, 10.1016/j.marmicro.2006.07.006, 2007.
Naughton, F., Sánchez Goñi, M. S., Rodrigues, T., Salgueiro, E., Costas, S., Desprat, S., Duprat, J., Michel, E., Rossignol, L., Zaragosi, S., and Voelker, A. H. L.: Climate variability across the last deglaciation in NW Iberia and its margin, Quaternary Int., 414, 9–22, https://doi.org/10.1016/j.quaint.2015.08.073, 2016.
Nelson, D. M., Urban, M. A., Kershaw, A. P., and Hu, F. S.: Late-Quaternary variation in C3 and C4 grass abundance in southeastern Australia as inferred from δ13C analysis: Assessing the roles of climate, pCO2, and fire, Quaternary Sci. Rev., 139, 67–76, https://doi.org/10.1016/j.quascirev.2016.03.006, 2016.
Oliveira, D., Desprat, S., Rodrigues, T., Naughton, F., Hodell, D., Trigo, R., Rufino, M., Lopes, C., Abrantes, F., and Sánchez Goñi, M. F.: The complexity of millennial-scale variability in southwestern Europe during MIS 11, Quaternary Res., 86, 373–387, https://doi.org/10.1016/j.yqres.2016.09.002, 2016.
Oliveira, D., Desprat, S., Yin, Q., Naughton, F., Trigo, R., Rodrigues, T., Abrantes, F., and Sánchez Goñi, M. F.: Unraveling the forcings controlling the vegetation and climate of the best orbital analogues for the present interglacial in SW Europe, Clim. Dynam., 51, 667–686, https://doi.org/10.1007/s00382-017-3948-7, 2018.
Oliveira, D., Desprat, S., Yin, Q., Rodrigues, T., Naughton, F., Trigo, R. M., and Goñi, M. F. S.: Combination of insolation and ice-sheet forcing drive enhanced humidity in northern subtropical regions during MIS 13, Quaternary Sci. Rev., 247, 106573, https://doi.org/10.1016/j.quascirev.2020.106573, 2020.
Ortiz, J. E., Torres, T., Delgado, A., Llamas, J. F., Soler, V., Valle, M., Julià, R., Moreno, L., and Díaz-Bautista, A.: Palaeoenvironmental changes in the Padul Basin (Granada, Spain) over the last 1 Ma based on the biomarker content, Palaeogeogr. Palaeocl., 298, 286–299, https://doi.org/10.1016/j.palaeo.2010.10.003, 2010.
Pausas, J. G., Llovet, J., Rodrigo, A., and Vallejo, R.: Are wildfires a disaster in the Mediterranean basin? – A review, Int. J. Wildland Fire, 17, 713–723, https://doi.org/10.1071/WF07151, 2008.
Pearson, P. N. and Palmer, M. R.: Atmospheric carbon dioxide concentrations over the past 60 million years, Nature, 406, 695–699, https://doi.org/10.1038/35021000, 2000.
Peñalba, M. C., Arnold, M., Guiot, J., Duplessy, J. C., and Beaulieu, J.-L.: Termination of the last glaciation in the Iberian Peninsula inferred from the pollen sequence of Quintanar de la Sierra, Quaternary Res., 48, 205–214, https://doi.org/10.1006/qres.1997.1922,1997.
Pèrez-Obiol, R. and Julià, R.: Climatic change on the Iberian Peninsula recorded in a 30,000-yr pollen record from Lake Banyoles, Quaternary Res., 41, 91–98, https://doi.org/10.1006/qres.1994.1010, 1994.
Peyron, O., Guiot, J., Cheddadi, R., Tarasov, P., Reille, M., de Beaulieu, J. L., Bottema, S., and Andrieu, V.: Climatic reconstruction in Europe for 18,000 yr BP from pollen data, Quaternary Res., 49, 183–196, https://doi.org/10.1006/qres.1997.1961, 1998.
Piao, S., Wang, X., Park, T., Chen, C., Lian, X. U., He, Y., Bjerke, J. W., Chen, A., Ciais, P., Tømmervik, H., and Nemani, R. R.: Characteristics, drivers and feedbacks of global greening, Nat. Rev. Earth Environ., 1, 14–27, https://doi.org/10.1038/s43017-019-0001-x, 2020.
Post-Beittenmiller, D.: Biochemistry and molecular biology of wax production in plants, Annu. Rev. Plant Biol., 47, 405–430, https://doi.org/10.1146/annurev.arplant.47.1.405, 1996.
Prahl, F. G. and Wakeham, S. G.: Calibration of unsaturation patterns in long-chain ketone compositions for palaeotemperature assessment, Nature, 330, 367–369, https://doi.org/10.1038/330367a0, 1987.
Prentice, I. C., Cleator, S. F., Huang, Y. H., Harrison, S. P., and Roulstone, I.: Reconstructing ice-age palaeoclimates: Quantifying low-CO2 effects on plants, Glob. Planet. Change, 149, 166–176, https://doi.org/10.1016/J.GLOPLACHA.2016.12.012, 2017.
Prentice, I. C., Villegas-Diaz, R., and Harrison, S. P.: Accounting for atmospheric carbon dioxide variations in pollen-based reconstruction of past hydroclimates, Global Planet. Change, 211, 103790, https://doi.org/10.1016/j.gloplacha.2022.103790, 2022.
R Development Core Team R: A Language and Environment for Statistical Computing. R Foundation for Statistical Computing, Vienna, Austria, https://www.R-project.org/ (last access: 25 June 2025), 2020.
Randall, D. A., Wood, R. A., Boucher, O., et al.: Climate models and their evaluation, in: Climate Change 2013: The Physical Science Basis. Contribution of Working Group I to the Fifth Assessment Report of the Intergovernmental Panel on Climate Change, edited by: Stocker, T. F., Qin, D., Plattner, G.-K., et al., Cambridge University Press, Cambridge, United Kingdom and New York, NY, USA, 2013.
Rasmussen, T. L., Thomsen, E., Labeyrie, L., and van Weering, T. C. E.: Circulation changes in the Faeroe-Shetland Channel correlating with cold events during the last glacial period (58–10 ka), Geology, 24, 937–940, https://doi.org/10.1130/0091-7613(1996)024<0937:CCITFS>2.3.CO;2, 1996.
Reille, M.: Pollen et spores d'Europe et d'Afrique du nord: Laboratoire de botanique historique et palynologie, URA CNRS, Marseille, France, 543 pp., https://doi.org/10.1016/0034-6667(94)90010-8, 1992.
Reille, M.: Pollen et spores d'Europe et d'Afrique du Nord (Vol. 2), Laboratoire de Botanique historique et Palynologie, URA CNRS, Marseille, France, ISBN 2950717519, 1995.
Rivas-Martínez, S., Penas, Á., del Río, S., Díaz González, T. E., and Rivas-Sáenz, S.: Bioclimatology of the Iberian Peninsula and the Balearic Islands, in The Vegetation of the Iberian Peninsula, edited by: Loidi, J., Plant and Vegetation, vol. 12, Springer, Cham, Switzerland, 29–80, https://doi.org/10.1007/978-3-319-54784-8_2, 2017.
Rodrigues, T., Grimalt, J. O., Abrantes, F., Naughton, F., and Flores, J. A.: The last glacial-interglacial transition (LGIT) in the western mid-latitudes of the North Atlantic: Abrupt sea surface temperature change and sea level implications, Quaternary Sci. Rev., 29, 1853–1862, https://doi.org/10.1016/j.quascirev.2010.04.004, 2010.
Rodrigues, T., Alonso-García, M., Hodell, D. A., Rufino, M., Naughton, F., Grimalt, J. O., Voelker, A. H. L., and Abrantes, F.: A 1-Ma record of sea surface temperature and extreme cooling events in the North Atlantic: A perspective from the Iberian Margin, Quaternary Sci. Rev., 172, 118–130, https://doi.org/10.1016/j.quascirev.2017.07.004, 2017.
Royer, D. L.: Stomatal density and stomatal index as indicators of paleoatmospheric CO2 concentration, Review of Palaeobotany and Palynology, 114, 1–28, https://doi.org/10.1016/S0034-6667(00)00074-9, 2001.
Roucoux, K. H., de Abreu, L., Shackleton, N. J., and Tzedakis, P. C.: The response of NW Iberian vegetation to North Atlantic climate oscillations during the last 65 kyr, Quat. Sci. Rev., 24, 1637–1653, https://doi.org/10.1016/j.quascirev.2004.08.022, 2005.
Sage, R. F.: A portrait of the C4 photosynthetic family on the 50th anniversary of its discovery: species number, evolutionary lineages, and Hall of Fame, J. Exp. Bot., 68, e11–e28, https://doi.org/10.1093/jxb/erx005, 2017.
Sánchez-Goñi, M. F., Landais, A., Cacho, I., Duprat, J., and Rossignol, L.: Contrasting intrainterstadial climatic evolution between high and middle North Atlantic latitudes: A close-up of Greenland Interstadials 8 and 12, Geochemistry, Geophysics, Geosystems, 10, Q04U04, https://doi.org/10.1029/2008GC002369, 2009.
Sánchez Goñi, M. F., Extier, T., Polanco-Martínez, J. M., Zorzi, C., Rodrigues, T., and Bahr, A.: Moist and warm conditions in Eurasia during the last glacial of the Middle Pleistocene Transition, Nature Communications, 14, 2700, https://doi.org/10.1038/s41467-023-38361-4, 2023.
Schenk, F., Väliranta, M., Muschitiello, F., Tarasov, L., Heikkilä, M., Björck, S., Brandefelt, J., Johansson, A., Näslund, J.-O., and Wohlfarth, B.: Warm summers during the Younger Dryas cold reversal, Nature Communications, 9, 1634, https://doi.org/10.1038/s41467-018-04071-5, 2018.
Shakun, J. D., Clark, P. U., He, F., Marcott, S. A., Mix, A. C., Liu, Z., Otto-Bliesner, B., Schmittner, A., and Bard, E.: Global warming preceded by increasing carbon dioxide concentrations during the last deglaciation, Nature, 484, 49–54, https://doi.org/10.1038/nature10915, 2012.
Shao, Y., Anhäuser, A., Ludwig, P., Schlüter, P., and Williams, E.: Statistical reconstruction of global vegetation for the last glacial maximum, Glob. Planet. Change, 168, 67–77, https://doi.org/10.1016/j.gloplacha.2018.06.002, 2018.
Simpson, G. L.: Modelling palaeoecological time series using generalised additive models, Front. Eco. Evo., 6, 149, https://doi.org/10.3389/fevo.2018.00149, 2018.
Stockmarr, J. A.: Tablets with spores used in absolute pollen analysis, Pollen spores, 13, 615–621, 1971.
Street-Perrott, F. A., Huang, Y., Perrott, A., Eglinton, G., Barker, P., Khelifa, L. B., Harkness, D. D., and Olago, D. O.: Impact of lower atmospheric carbon dioxide on tropical mountain ecosystems, Science, 278, 1422–1426, https://doi.org/10.1126/science.278.5342.1422, 1997.
Struck, J., Bliedtner, M., Strobel, P., Schumacher, J., Bazarradnaa, E., and Zech, R.: Leaf wax n-alkane patterns and compound-specific δ13C of plants and topsoils from semi-arid and arid Mongolia, Biogeosciences, 17, 567–580, https://doi.org/10.5194/bg-17-567-2020, 2020.
Svenning, J.C., Fløjgaard, C., Marske, K.A., Nógues-Bravo, D., and Normand, S.: Applications of species distribution modelling to paleobiology, Quaternary Sci. Rev., 30, 2930-2947, https://doi.org/10.1016/j.quascirev.2011.06.012, 2011.
Tareq, S. M., Tanoue, E., Tsuji, H., Tanaka, N., and Ohta, K.: Hydrocarbon and elemental carbon signatures in a tropical wetland: Biogeochemical evidence of forest fire vegetation changes, Chemosphere, 59, 1655–1665, https://doi.org/10.1016/j.chemosphere.2005.02.019, 2005.
Tarroso, P., Carrión, J., Dorado-Valiño, M., Queiroz, P., Santos, L., Valdeolmillos-Rodríguez, A., Célio Alves, P., Brito, J. C., and Cheddadi, R.: Spatial Climate Dynamics in the Iberian Peninsula since 15 000 yr BP, Clim. Past, 12, 1137–1149, https://doi.org/10.5194/cp-12-1137-2016, 2016.
Tognetti, R., Cherubini, P., and Innes, J. L.: Comparative stem-growth rates of Mediterranean trees under background and naturally enhanced ambient CO2 concentrations, New Phytol., 146, 59–74, https://doi.org/10.1046/j.1469-8137.2000.00620.x, 2008.
Toucanne, S., Zaragosi, S., Bourillet, J. F., Naughton, F., Cremer, M., Eynaud, F., and Dennielou, B.: Activity of the turbidite levees of the Celtic–Armorican margin (Bay of Biscay) during the last 30 000 years: imprints of the last European deglaciation and Heinrich events, Mar. Geol., 247, 84–103, https://doi.org/10.1016/j.margeo.2007.08.006, 2008.
Tripati, A. K., Roberts, C. D., and Eagle, R. A.: Coupling of CO2 and Ice Sheet Stability Over Major Climate Transitions of the Last 20 Million Years, Science, 326, 1394–1397, https://doi.org/10.1126/science.1178296, 2009.
Turon, J. L., Lézine, A. M., and Denèfle, M.: Land-sea correlations for the last glaciation inferred from a pollen and dinocyst record from the Portuguese margin, Quaternary Res., 59, 88–96, https://doi.org/10.1016/S0033-5894(02)00018-2, 2003.
Van der Knaap, W. O. and Van Leeuwen, J. F. N.: Late Glacial and early Holocene vegetation succession, altitudinal vegetation zonation, and climatic change in the Serra da Estrela, Portugal, Rev. Palaeobot. Palynol., 97, 239–285, https://doi.org/10.1016/S0034-6667(97)00008-0, 1997.
Villanueva, J. and Grimalt, J.O.: Gas Chromatographic Tuning of the Paleothermometer, Anal. Chem., 69, 3329–3332, https://doi.org/10.1021/ac9700383, 1997.
Volkman, J. K., Barrerr, S. M., Blackburn, S. I., and Sikes, E. L.: Alkenones in Gephyrocapsa oceanica: Implications for studies of paleoclimate, Geochim. Cosmochim. Ac., 59, 513–520, https://doi.org/10.1016/0016-7037(95)00325-T, 1995.
Wagner, F., Below, R., de Klerk, P., Dilcher, D. L., Joosten, H., Kürschner, W. M., and Visscher, H.: A natural experiment on plant acclimation: lifetime stomatal frequency response of an individual tree to annual atmospheric CO2 increase, Proc. Natl. Acad. Sci. USA, 93, 11705–11708, https://doi.org/10.1073/pnas.93.21.11705, 1996.
Ward, J. K.: Evolution and growth of plants in a low CO2 world, in: A history of atmospheric CO2 and its effects on plants, animals, and ecosystems, edited by: Ehleringer, J. R., Cerling, T. E., and Dearing, M. D., Springer, New York, 232–257, https://doi.org/10.1007/0-387-27048-5_11, 2005.
Wei, D., González-Sampériz, P., Gil-Romera, G., Harrison, S. P., and Prentice, I. C.: Seasonal temperature and mois ture changes in interior semi-arid Spain from the last inter glacial to the Late Holocene, Quaternary Res., 101, 143–155, https://doi.org/10.1017/qua.2020.108, 2021.
Williams, J. W., Jackson, S. T., and Kutzbach, J. E.: Dissimilarity analyses of late-Quaternary pollen data and CCM1 simulations, Ecology, 82, 3346–3362, https://doi.org/10.1890/0012-9658(2001)082[3346:DAOLQV]2.0.CO;2, 2001.
Woillez, M., Kageyama, M., Krinner, G., de Noblet-Ducoudré, N., Viovy, N., and Mancip, M.: Impact of CO2 and climate on the Last Glacial Maximum vegetation: results from the ORCHIDEE/IPSL models, Clim. Past, 7, 557–577, https://doi.org/10.5194/cp-7-557-2011, 2011.
Wood, S. N.: Generalised Additive Models: An Introduction with R, 2nd Edn., Chapman and Hall/CRC Press, New York, 496 pp., https://doi.org/10.1201/9781315370279, 2017.
Wu, H., Guiot, J., Brewer, S., and Guo, Z.: Climatic changes in Eurasia and Africa at the last glacial maximum and mid-Holocene: reconstruction from pollen data using inverse vegetation modelling, Clim. Dyn., 29, 211–229, https://doi.org/10.1007/s00382-007-0231-3, 2007.