the Creative Commons Attribution 4.0 License.
the Creative Commons Attribution 4.0 License.
 | 24 Nov 2025
Technical note: In situ photosynthesis-irradiance curve determination in peatlands with a modulated-light skirt-chamber
Julio A. Salas-Rabaza
Brenda Riquelme del Río
Jorge F. Perez-Quezada
Cristian Gajardo
Matías Troncoso-Villar
Peatlands play a crucial role in the global carbon cycle, and among several key processes, it is essential to characterize photosynthesis–irradiance (PI) curves, which describe the relationship between light availability and carbon assimilation through photosynthetic activity. Traditional approaches such as eddy covariance, portable photosynthesis systems, and chambers provide valuable data at ecosystem, leaf, and mesoscales, respectively. Chamber-based measurements are particularly useful at intermediate scales, as they capture photosynthetic activity of whole plant assemblages while integrating microhabitat and belowground processes. However, conventional chambers typically require the installation of collars, involving cutting and trenching of vegetation that may alter fluxes; this often necessitates a delay period before reliable measurements can begin and reduces the portability and applicability of chamber methods in remote peatlands. In a previous companion study, we introduced the skirt-chamber, a minimally invasive method for greenhouse gas flux measurements. Building on that design, we developed a modulated-light skirt-chamber specifically for PI curve determination. This chamber enables in situ characterization of photosynthetic responses under natural light conditions using adjustable shading screens, while preserving portability and minimizing disturbance. Field tests in a subantarctic Sphagnum bog demonstrated that the generated PI curves fit established models and closely matched eddy covariance measurements. The modulated-light skirt-chamber therefore provides a cost-effective and flexible tool for studying carbon dynamics in low-stature peatland ecosystems, with promising applications in heterogeneous landscapes.
- Article
(5263 KB) - Full-text XML
- Companion paper
-
Supplement
(1617 KB) - BibTeX
- EndNote


Peatlands play a crucial role in the global carbon cycle as the largest terrestrial carbon reservoir (Yu, 2011; Charman et al., 2013), storing approximately 644 gigatons (Gt) of carbon across 399 million ha (Leifeld and Menichetti, 2018; Page et al., 2011). They also act as significant carbon sinks, sequestering around 0.1 Gt of carbon annually, primarily through photosynthesis, and are increasingly recognized as key Nature-based Solutions for climate change mitigation (Frolking et al., 2006; Griscom et al., 2017; UNEP, 2019). However, peatlands not only capture but also release greenhouse gases, emitting carbon dioxide (CO2) through respiration and methane (CH4) (Abdalla et al., 2016). Due to these contrasting fluxes, peatlands can function as net sources or sinks of greenhouse gases globally, depending on temporal and spatial scales. A key process regulating this balance is photosynthesis, which is driven by photosynthetically active radiation (PAR). The relationship between photosynthesis (P) and irradiance (I) is commonly represented as a PI curve, widely used in ecological and physiological studies. PI curves are fundamental for characterizing peatland carbon dynamics and determining whether a peatland functions as a net sink or source of greenhouse gases at a given time and location.
Several methods have been used to assess the impact of irradiance on photosynthetic rates at different spatial scales. Among these, aboveground techniques such as eddy covariance (EC) continuously measure net ecosystem exchange (NEE) of CO2, allowing inference of gross primary productivity (GPP) and ecosystem respiration (Reco; Baldocchi et al., 2024; Holl et al., 2019). Overall, EC methods provide broad spatial and temporal coverage but cannot resolve fine-scale flux variability, such as photosynthetic activity, as they integrate fluxes over larger areas. At the leaf scale, PI curves have been determined using infrared gas analyzers (IRGA), which directly measure CO2 assimilation, or chlorophyll fluorescence methods, which provide an indirect assessment of photosynthetic efficiency (Herrmann et al., 2020; Ye et al., 2013). These methods allow for controlled assessments of photosynthetic responses to varying light conditions at the leaf scale but face challenges in extrapolating localized measurements to the ecosystem scale due to plant diversity and spatial heterogeneity in peatlands (Kangas et al., 2014; Bengtsson et al., 2016). A third method uses chambers, which are enclosures positioned on the ground surface where changes in gas concentration provide information on CO2 exchange (emissions or uptake). With the addition of light sensors, chambers can also be used to evaluate the effects of irradiance on photosynthesis (Frolking et al., 1998; Bubier et al., 1998; Badorek et al., 2011; Perez-Quezada et al., 2010). Chamber-based measurements have therefore been particularly useful in assessing photosynthetic activity at a scale that bridges leaf-level measurements from IRGA systems and ecosystem level fluxes from EC. This approach provides important insights into the complex dynamics of peatland bogs and fens, which are characterized by diverse plant species, distinct microhabitats, and underground processes that influence gas exchange at the local scale (Rydin and Jeglum, 2013).
Despite their utility, chamber methods often require relatively complex and costly setups. They typically involve specialized sensors, precise environmental controls, and airtight enclosures installed on collars that penetrate the ground. The use of collars frequently necessitates vegetation cutting and trenching, which can disturb gas exchange; a common strategy is to introduce a delay period of one or more days before measurements begin (Heinemeyer et al., 2011). Thus, both the complexity of chamber setups and the time required for installation limit the number of sites that can be sampled during a campaign. To address these challenges, Thalasso et al. (2023) introduced the skirt-chamber, a minimally invasive and portable chamber for measuring CO2 and CH4 exchange in peatlands. This design, based on a chamber with a plastic film skirt expanded around it and sealed to the ground by a steel chain, avoids trenching or cutting vegetation and enables reliable determination of greenhouse gas fluxes without a delay period and at lower cost compared to standard chambers. The present study builds on that initial design by introducing a modulated-light skirt-chamber, which allows natural light penetration and controlled light modulation using screens of varying transparency. This new chamber retains portability while enabling in situ PI curve determination under natural light conditions, accounting for the entire plant community and the complex underground processes enclosed within the chamber perimeter. While the concept of the skirt-chamber is broadly applicable, the design tested in the present study is best suited to Sphagnum-dominated bogs with low vegetation. Its application in fen ecosystems with taller vegetation may require design adaptations. We tested this chamber in a Sub-Antarctic Sphagnum magellanicum bog on Navarino Island, Chile (54.9° S), to assess its feasibility for field applications.
2.1 Modulated-light skirt-chamber concept
The modulated-light skirt-chamber (Fig. 1) was specifically developed to determine PI curves in peatlands and similar wetland ecosystems. This design represents a significant advancement over previous chamber concepts (Thalasso et al., 2023; Riquelme del Río et al., 2024), incorporating novel features to enhance accuracy and applicability in natural settings. Although similar to chambers commonly used to measure soil and ecosystem fluxes (Heinemeyer et al., 2011), it differs in that it does not use a collar, a rigid frame inserted into the ground to create a sealed interface on which the chamber itself is mounted. In standard chambers, collars are indeed commonly used to prevent direct gas exchange between the chamber volume and the atmosphere. However, collars require ground insertion, which involves cutting or compacting the soil and vegetation, potentially altering natural fluxes and disturbing the ecosystem. Instead, the modulated-light skirt-chamber is placed directly on the ground, with a flexible plastic film (skirt) deployed around its base to enhance ground contact. While the absence of a collar minimizes ecosystem disturbance and allows for rapid deployment, it also prevents a perfect seal, necessitating a mathematical correction for gas leakage (Sect. S1, Supplement).
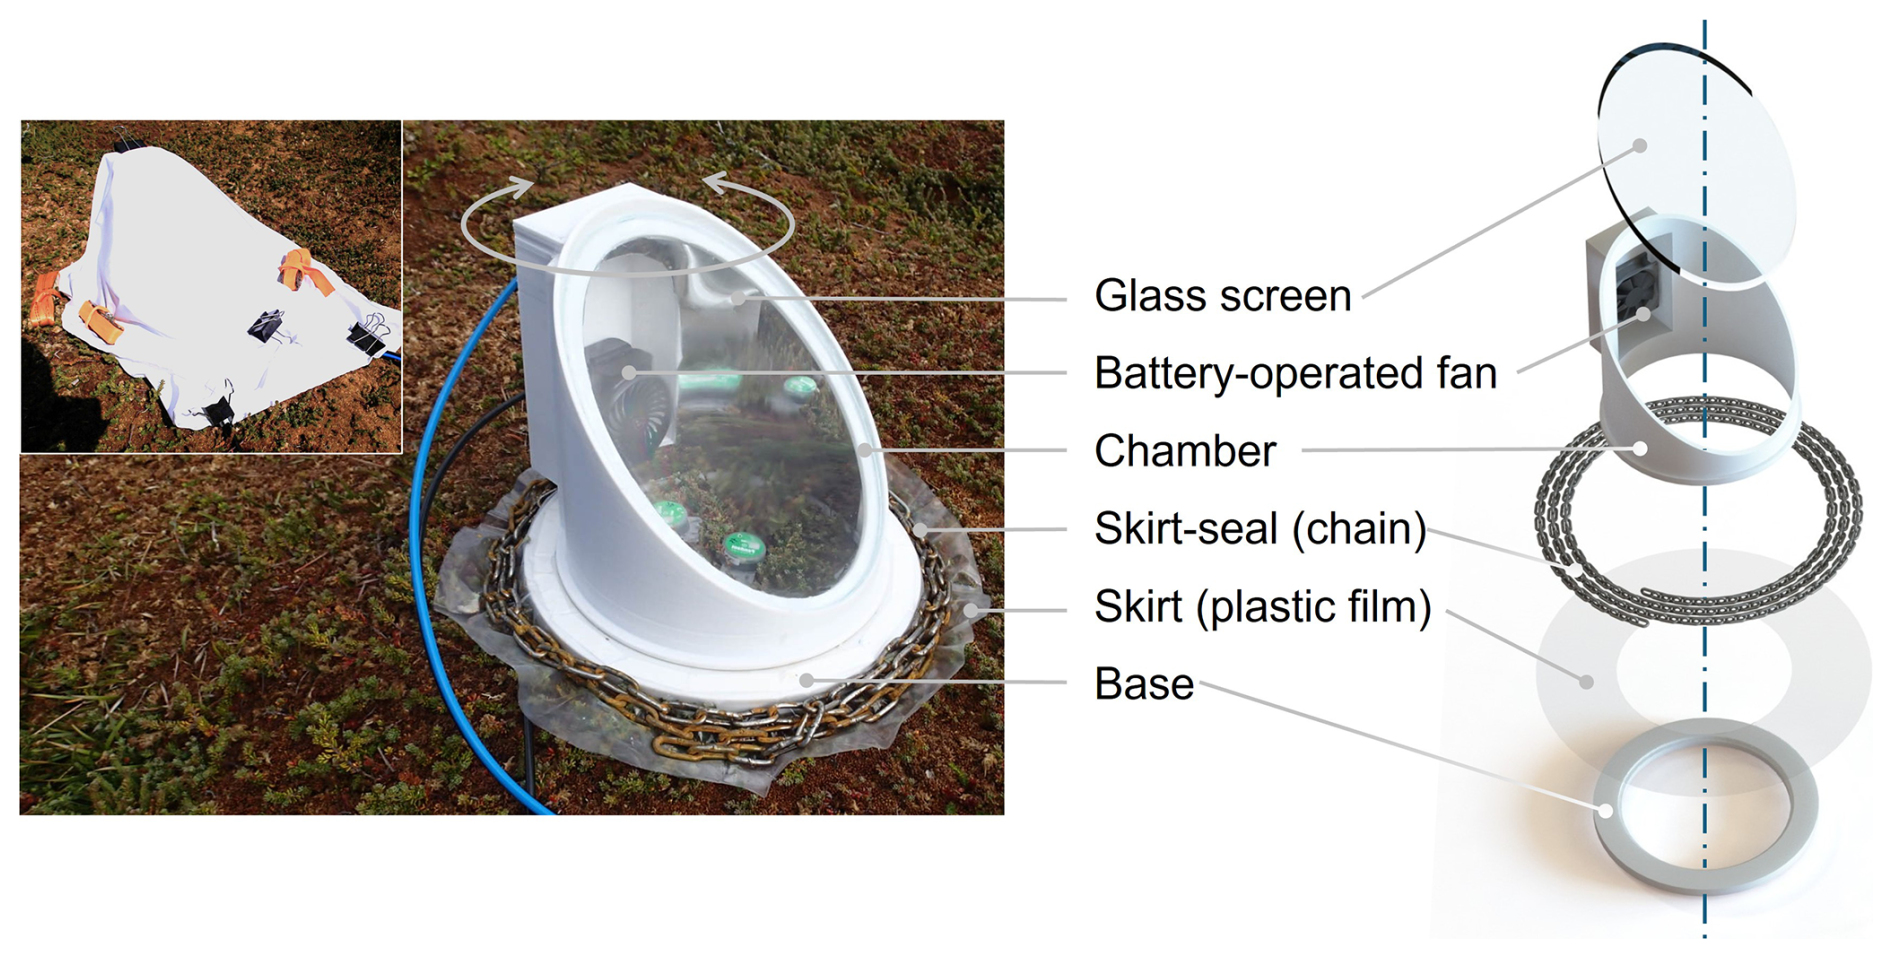
Figure 1Photograph (left) and exploded view (right) of the modulated-light skirt-chamber placed on the peatland surface, showing the main components. The inset in the photograph shows the skirt-chamber covered with an example of fabric used to modulate light intensity. Photos taken by the authors, exploded view by Ana López Aguado.
The modulated-light skirt-chamber, equipped with a transparent window, measures photosynthetic activity by monitoring CO2 exchange between the ground and the chamber. PI curves are derived from CO2 flux (; µmol m−2 s−1) under different light intensities, modulated using white fabrics that reduce brightness without significantly altering the natural light spectrum. To account for gas leakage at the ground-chamber interface, CO2 flux calculations are performed using a complete mass balance (Eq. 1, detailed in Sect. S1 of the Supplement). This approach ensures accurate estimation of net gas exchange by considering both CO2 release from the ground and any leakage to the atmosphere.
In Eq. (1) (Sect. S1, Supplement), represents the actual CO2 concentration inside the chamber (µmol m−3), while is the CO2 concentration of the air at ground level outside the chamber that enters due to leaks (µmol m−3). θC is the mean gas residence time in the chamber due to leakage (s), determined experimentally (as described below), VC is the chamber volume (m3), and AC represents the area of the chamber in contact with the ground (m2). Both and , required to solve Eq. (1), can be monitored using any CO2 gas analyzer. In this study, we used an ultraportable greenhouse gas analyzer (UGGA, model 915-0011-1000, ABB, USA), which records CO2 and CH4 concentrations at a frequency of 1 Hz. Notably, this analyzer has a measurement cavity where incoming gas mixes with previously sampled gas. This mixing causes a dilution effect, leading to a slight discrepancy between the measured concentration and the actual . However, this effect can be corrected as described in Sect. S1. Equation (1) also relies on accurately determining θC, which is experimentally derived by injecting a pulse of a tracer gas into the chamber. This pulse causes a sudden increase in tracer concentration, followed by an asymptotic return to steady state, allowing quantification of the dilution rate caused by leaks (details in Sect. S2). For this purpose, CH4 was selected as the tracer gas because it is detected by the UGGA, does not interfere with measurements, and can be conveniently transported to the field in small vials. With all variables defined, can be determined explicitly at any time during chamber deployment, without requiring steady-state conditions. Instead, the method relies on solving the mass balance dynamically.
2.2 Modulated-light skirt-chamber design
The modulated-light skirt-chamber (Fig. 1) is a 3D-printed chamber composed of two main components: a base, to which the skirt is attached, and the chamber cavity, where gas emitted from the ground accumulates. To ensure homogeneous gas distribution, the chamber cavity includes a small fan housed in an external 180 × 40 mm drawer-like compartment, which is attached to the chamber and connected to its interior. This design prevents shadows from the fan and optimizes light distribution over the ground surface. The chamber also features an oblique 9 mm-thick glass window, positioned at a 40° angle from the horizontal, enhancing direct sunlight exposure in high-latitude regions. Its internal surface is lined with a reflective film (Q-BICS, Mexico) to maximize light dispersion. During field deployment, the chamber was connected in a closed loop to the UGGA using 6 mm outside diameter polyurethane tubing (PUN-H-6X1-DUO, Festo, Mexico). When deployed, the base was placed directly on the ground, and the plastic skirt was extended around it. A steel chain (0.27 kg m−1) was then positioned above the skirt, encircling the base three times to ensure proper ground contact. Once the base was secured, the chamber cavity was placed on top, allowing it to be rotated, opened, or closed without disturbing the base, facilitating easy adjustments toward sunlight or shade as needed. Light intensity (I) was measured using two light/temperature data loggers (MX2202, Hobo, USA) positioned at ground level within the chamber. These sensors occupied approximately 5.7 % of the chamber's ground area, a negligible impact on measurements. Prior to deployment, the light data loggers were calibrated against a PAR Quantum Sensor (LI-190R, Li-Cor, USA) over 60 h of continuous data collection (Fig. S1).
2.3 Measurement protocol
All PI curve determinations followed a four-step protocol. First, the chamber base was positioned on the ground. Second, the CO2 concentration at ground level ( in Eq. 1) was measured for 3 min by placing the UGGA influent tubing under the skirt-chain to sample air. Third, the chamber was closed for three to 4 min, during which two to four light conditions were tested, each lasting at least 1 min, without intermediate ventilation. Light intensity was controlled by covering the chamber with 1 × 1 m fabric pieces (the light transmittance of ten fabrics used is provided in Table S1 in the Supplement). During this step, approximately 1 mL of CH4 (Linde, Chile) was injected into the chamber through a septum in the UGGA waste line using a plastic syringe to determine θC, as described in Sect. S2. The injected CH4 (100 % vol) was pre-stored in a 120 mL serological bottle, with the extracted volume replaced by atmospheric air after each injection. Finally, the chamber was opened and left open for 2 min before repeating the procedure as needed.
This procedure avoided intermediate ventilation between light levels, which ensured a more accurate determination of θC. Because a methane pulse was injected after each chamber closure and its decay monitored over the entire closure period, θC could be quantified with higher precision while simultaneously applying different light conditions. This approach also reduced the number of θC determinations required, thereby minimizing data processing effort.
During the campaign, the protocol was refined to improve data quality. Initially, 15 shade levels were tested in groups of three, with each level lasting 1 min. However, due to minimal differences in irradiance, the approach was refined to six shade levels, tested in groups of two, with each level lasting 2 min. One condition always included measuring in total darkness using a dark, thick, plastic-coated fabric.
2.4 Study site, campaign, and flux measurements
The selected study site is an ombrotrophic elevated peatland (bog) primarily covered by Sphagnum magellanicum moss. Located at 54.940° S, 67.644° W, about 2 km west of Puerto Williams along the northern coast of Navarino Island, southern Chile, it lies at an elevation of 20 m above sea level and covers an area of 4.6 ha. The terrain is characterized by hummocky features with scattered patches of vascular plants, lichens, and bare peat areas lacking live Sphagnum cover. Peat depth varies between 3 and 10 m, averaging 8 ± 1 m at the experimental sites. Although not submerged, the water table remained near the surface, typically between 0.1 and 0.6 m deep. Fieldwork was conducted from 5 to 15 March 2023, coinciding with the end of the summer season. Measurements were taken between 10:00 and 16:00 LT, ensuring at least 2.5 h after sunrise and before sunset. Over the course of the campaign, 27 sets of measurements were taken at random locations across different vegetation covers and topographies, with three sites measured twice to assess repeatability (Table S2, dominant species and type of relief).
2.5 Ancillary measurements
Net ecosystem exchange of CO2 (NEE) was measured during the study period using an eddy covariance system (EC), composed of an enclosed infrared gas analyzer (model LI-7200, LI-COR Biosciences, 2022, Lincoln, Nebraska, USA) to measure CO2 and water vapor concentration, and a 3-D sonic anemometer (model Windmaster, Gill Instruments, Lymington, UK) that measures wind speed (m s−1) at 10 Hz. Fluxes were computed using the EddyPro software, which was used to apply statistical, instrumental, footprint, and spectral corrections to the data. Secondly, we applied a post-processing methodology that included a quality screening of physically possible values, a first biometeorological gap-filling using linear regressions with ERA5 data as predictors, friction velocity threshold filtering, and the gap-filling procedure Marginal Distribution sampling. For details of the corrections applied to EC data, see Perez-Quezada et al. (2024).
2.6 Data treatment and statistical analysis
All collected data were used to generate PI curves. Instantaneous and light intensity data were filtered to remove chamber ventilation periods, operational disturbances, and the first 10 s of each light condition to minimize noise. The double derivative in Eq. (1) introduced significant noise, which was mitigated using a weighted moving average smoothing technique at each calculation step (Eq. 2).
Among the various PI curve models published in the literature, we compared several models that can be grouped into two categories: those that consider photoinhibition and those that do not. Given the similarity among models within each of these categories, we selected one representative model from each. Specifically, we chose the model of Bernard and Rémond (2012), depicted in Eq. (3), and a Monod-derived model (Jones et al., 2014), which can be analogously applied to the relationship between light intensity and photosynthetic rates, depicted in Eq. (4). The latter is mathematically equivalent to the Michaelis–Menten-type hyperbolic function widely applied in ecological studies, including for modelling PI curves in eddy covariance and chamber studies (Falge et al., 2001).
where GPPmax is the maximum gross primary production (µmol m−2 s−1), I is light intensity (µmol m−2 s−1), α describes light-use efficiency which is also the initial slope of the PI curve, Iopt is the optimal light intensity before photoinhibition, and K is the half-saturation constant. The Bernard-Rémond model explicitly accounts for photoinhibition, making it suitable for conditions where excessive light reduces photosynthetic efficiency. In contrast, the Monod-derived model focuses on light limitation and does not incorporate photoinhibition. In this model, the initial slope at the origin is GPP, which we denote as β, analogous to α in the Bernard and Rémond model.
Model calibration minimized Root Mean Square Error (RMSE) using Excel's Solver function with the Generalized Reduced Gradient (GRG) nonlinear solving method, applied to the complete and I datasets (472–902 data points per experiment across 27 chamber deployments) and averaged data for each irradiance condition (6–14 conditions). A model fit was accepted if R2 ≥ 0.5 and p ≤ 0.05. Levene's test assessed variance consistency between duplicate and non-duplicate measurements. All analyses were performed using OriginPro (Version 2016, OriginLab Corporation, 2016, USA), with Tukey's HSD test for statistical significance.
3.1 PI curves
Figure 2 presents an example of data obtained during the deployment of the modulated-light skirt-chamber, showing light intensity inside and outside the chamber (Fig. 2a), chamber CO2 concentration (; Fig. 2b), and the corresponding instantaneous across six light levels (sunlight, total darkness, and four shade levels; Fig. 2c). A decrease in light intensity led to an increase in , which was numerically converted into higher , reflecting the impact of light on photosynthesis and generating a PI curve (Fig. 3a). Among 27 deployments, 20 met the acceptance criteria (R2 ≥ 0.5, p ≤ 0.05), yielding a 74 % success rate. Eight representative curves are shown in the main text (Figs. 2–4), while the remaining 12 accepted curves are presented in Supplement (Fig. S2). The cases that did not meet the acceptance criteria are shown in Fig. S3.
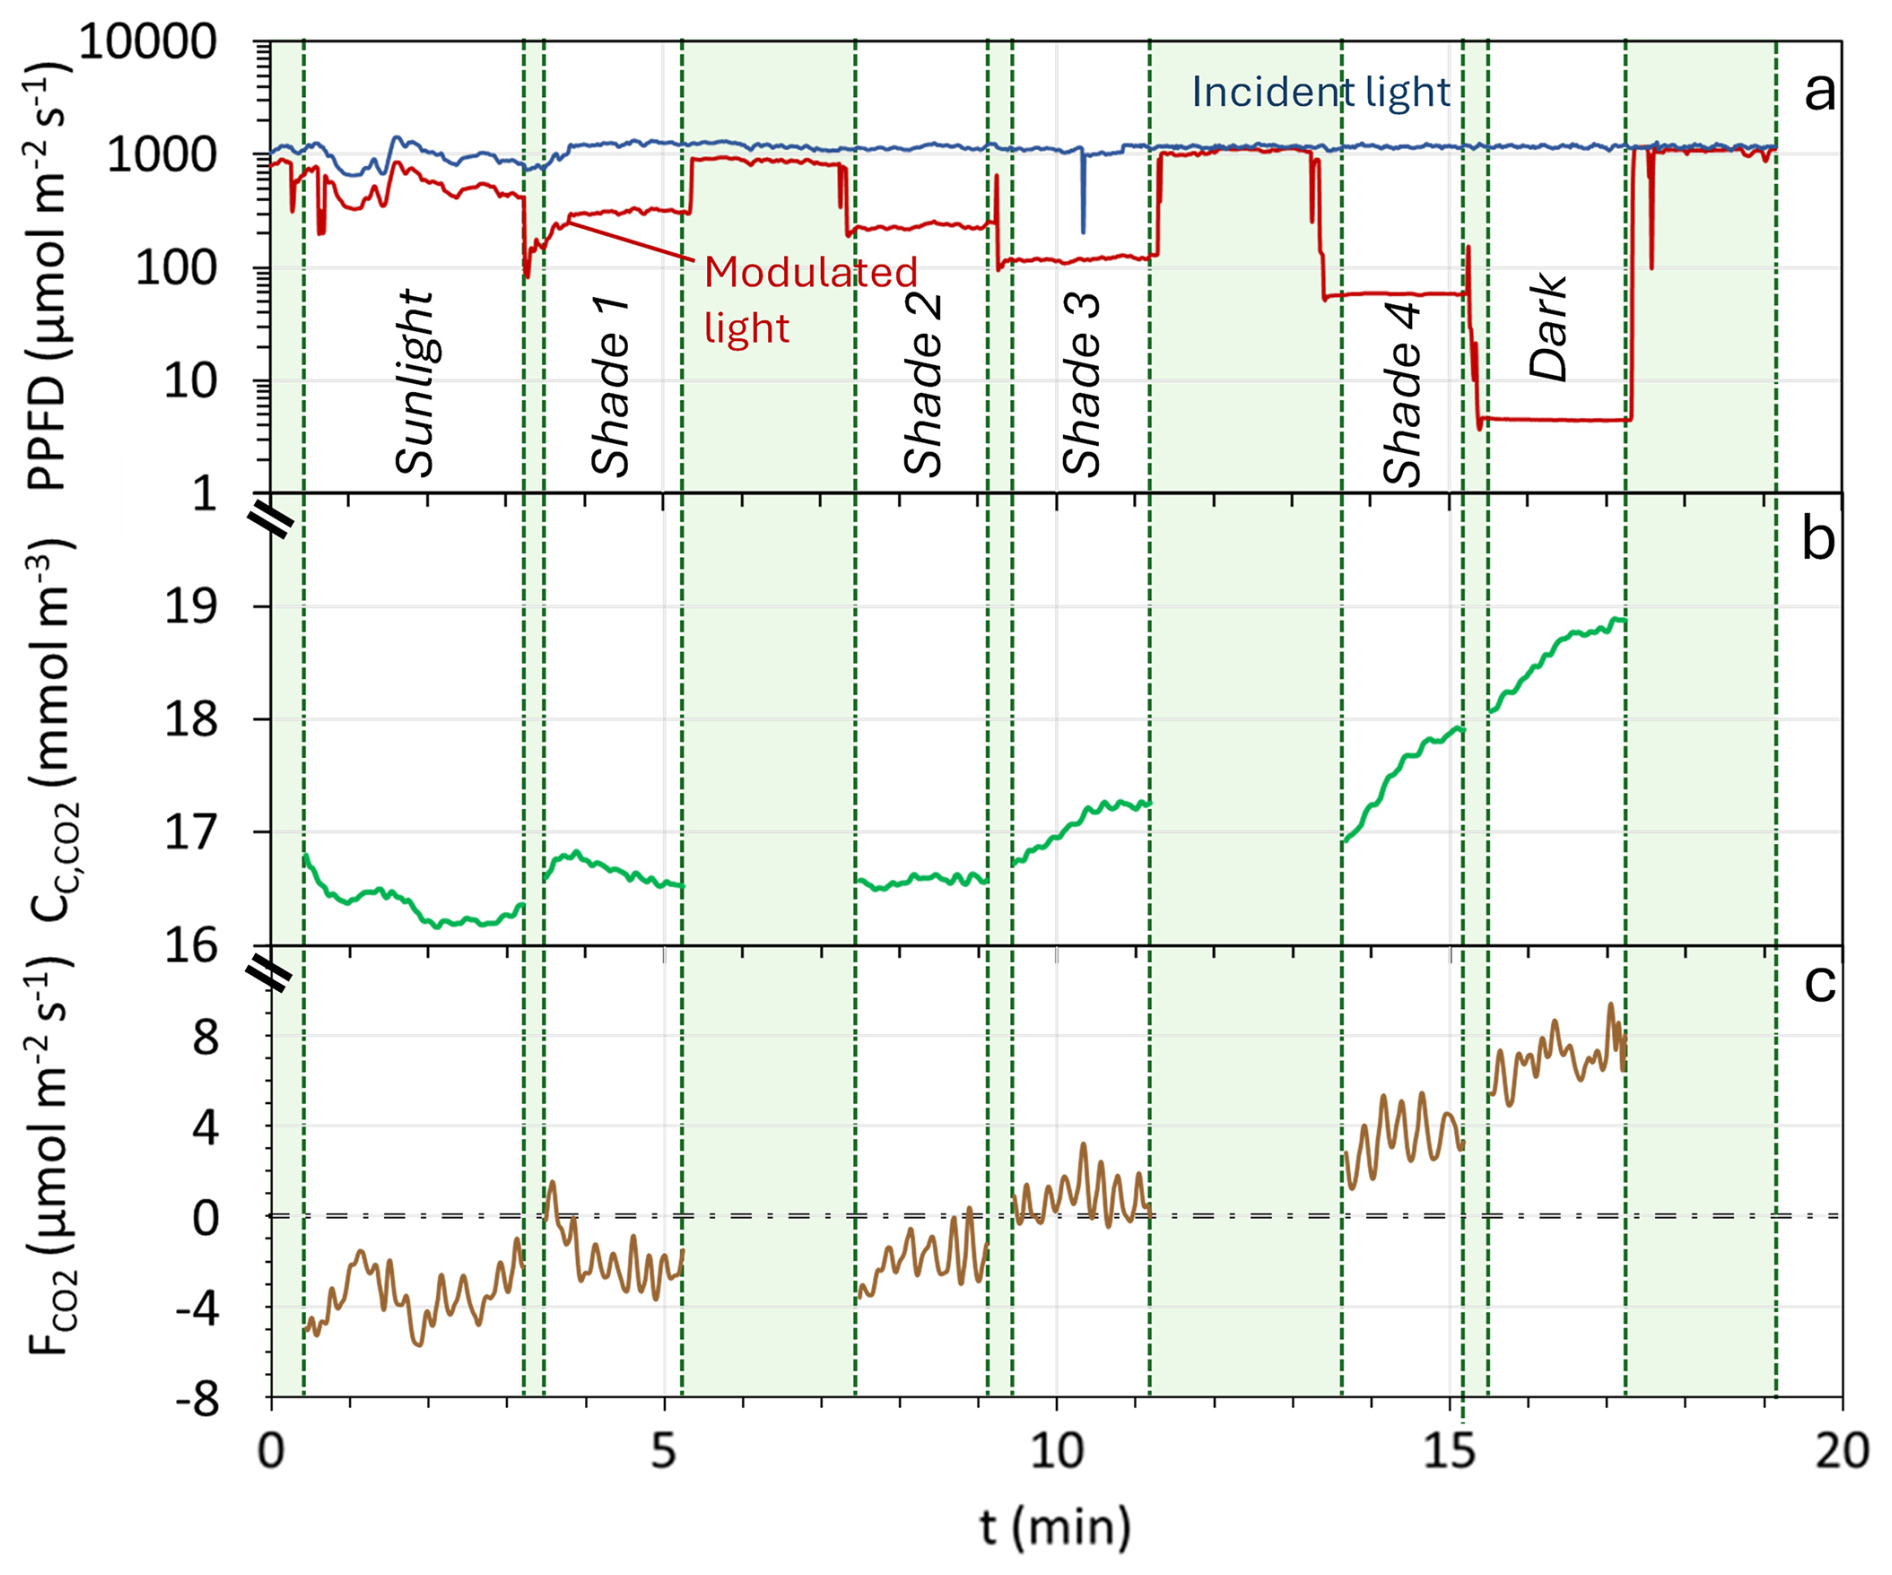
Figure 2Example of data obtained during the determination of a Photosynthesis-Irradiance (PI) curve. (a) Irradiance (Photosynthetic Photon Flux Density; PPFD) inside the chamber (red continuous line) and outside the chamber (blue continuous line). (b) CO2 concentration within the chamber (green continuous line). (c) Flux of CO2 () measured during the experiment. The green-shaded areas represent exclusion periods, which are transition periods between different levels of shading and/or chamber openings for ventilation.
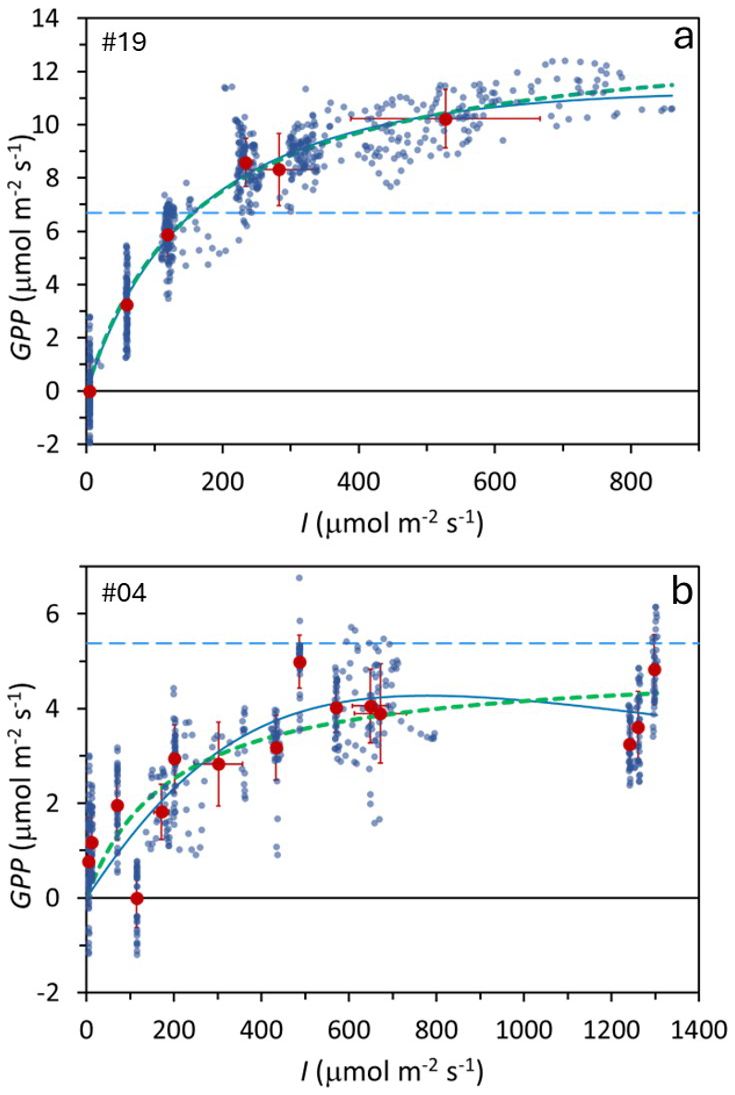
Figure 3Examples of two Photosynthesis–Irradiance (PI) curves from two subantarctic peatland bog locations. Small blue points: individual measurements; large dark-red points: mean values under each irradiance level. Error bars show one standard deviation. Thick green dotted line: Monod model fit; thin blue continuous line: Bernard–Rémond model fit; light blue dashed line: respiration (Reco). Experiment numbers (upper left corner) correspond to Table 1, where model parameters and statistics are provided.
Figure 3 shows two examples of PI curves under different experimental conditions: one using six shade levels (Fig. 3a) and the other 15 (Fig. 3b). Both met statistical criteria, but the 6-shade level approach yielded significantly better R2 and p-values than the 15-shade level scenario (p < 0.05), indicating that longer measurement periods per shade level improve accuracy more than increasing the number of levels with shorter exposures.
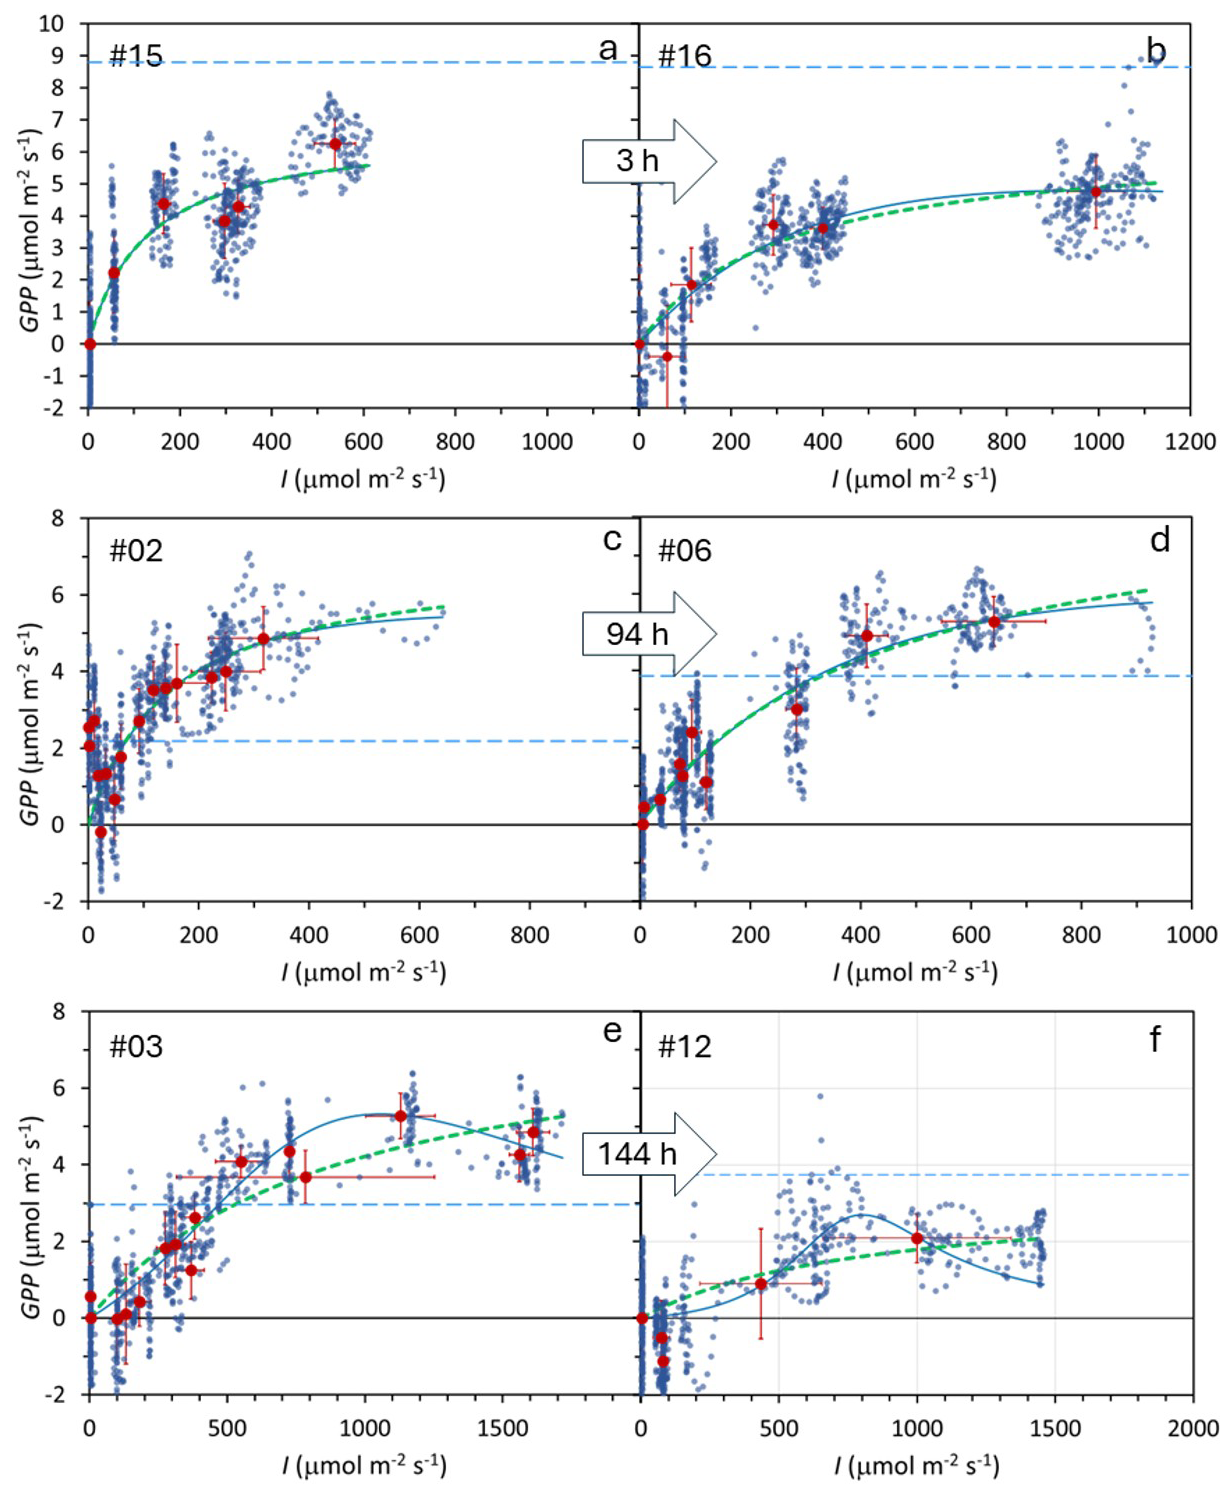
Figure 4Duplicate determination of the Photosynthesis–Irradiance (PI) curves at three locations in a subantarctic peatland bog. Each location includes two time replicates, with a time interval of 3 h (a–b), 94 h (c–d), and 144 h (e–f), as indicated within the arrows. Small blue points: individual measurements; large dark-red points: mean values under each irradiance level. Error bars show one standard deviation. Thick green dotted line: Monod model fit; thin blue continuous line: Bernard–Rémond model fit; light blue dashed line: respiration (Reco). Experiment numbers (upper left corner) correspond to Table 1, where model parameters and statistics are provided.
3.2 Time replicates
Duplicate PI curve experiments were conducted at three locations with time intervals ranging from 3 to 144 h (Fig. 4), showing similar trends in all cases. To assess measurement repeatability, we analyzed the variation in GPPmax and K from the Monod model across these duplicate pairs. The mean variation for GPPmax was 38.6 %, while the coefficient of variation among non-duplicate measurements was 94.4 %. Similarly, for K, variation within duplicate pairs was 64.3 %, compared to a 210 % coefficient of variation among non-duplicates, suggesting that measurements for both parameters are relatively consistent when repeated. However, Levene's test indicated no significant difference between duplicates and non-duplicates.
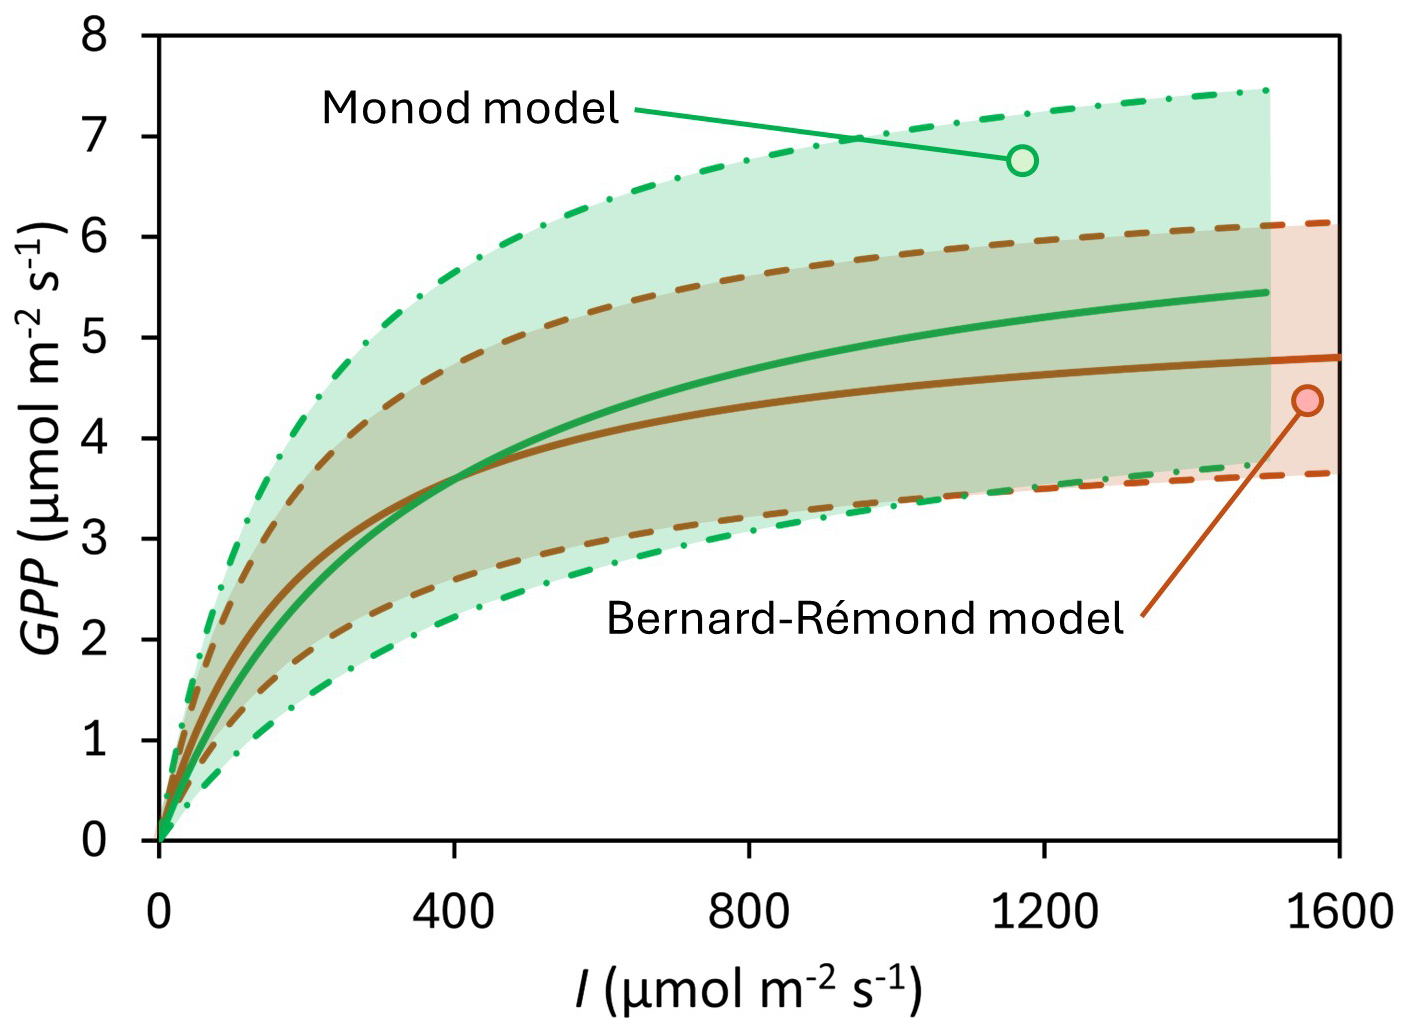
Figure 5Central tendency of the Photosynthesis-Irradiance (PI) curves modeled using the Bernard-Rémond model (red line and light-colored red area delimited with dashed lines) and the Monod model (green line and light-colored green area delimited with dash-dot lines).
3.3 PI curves and model parameters
In only 6 cases (#03, 04, 12, 13, 14, 20; 30 % of the cases), did we observe experimental irradiance levels exceeding the Iopt values predicted by the Bernard-Rémond model, indicating potential photoinhibition. In the remaining 14 cases (70 %), no indicator of photoinhibition was observed, and the Iopt of the Bernard-Rémond model served more as an adjustment parameter than as a meaningful physiological threshold reflecting a true biological phenomenon. Notably, an indicator of this is the fact that some of the Iopt values were 3 to 4 orders of magnitude above realistic solar irradiance (Table 1). This observation aligns with previous reports, such as measurements made with an EC tower by Suyker et al. (1997) in a boreal fen, which showed not only the absence of photoinhibition at irradiance levels up to 1800 µmol m−2 s−1 but also that light saturation occurred above 1000–1200 µmol m−2 s−1. These findings are further supported by lab measurements in peatland bryophytes at irradiances up to 2000 µmol m−2 s−1, which showed no signs of light inhibition (Hájek, 2014).
Table 1Best-fitting parameters of the Bernard-Rémond and the Monod models, observed over 20 locations where GPP was measured in situ using the modulated-light skirt-chamber. #: PI curve code; Imax: maximum irradiance observed during the experiment; ; SD: standard deviation; Reco: Respiration rate.
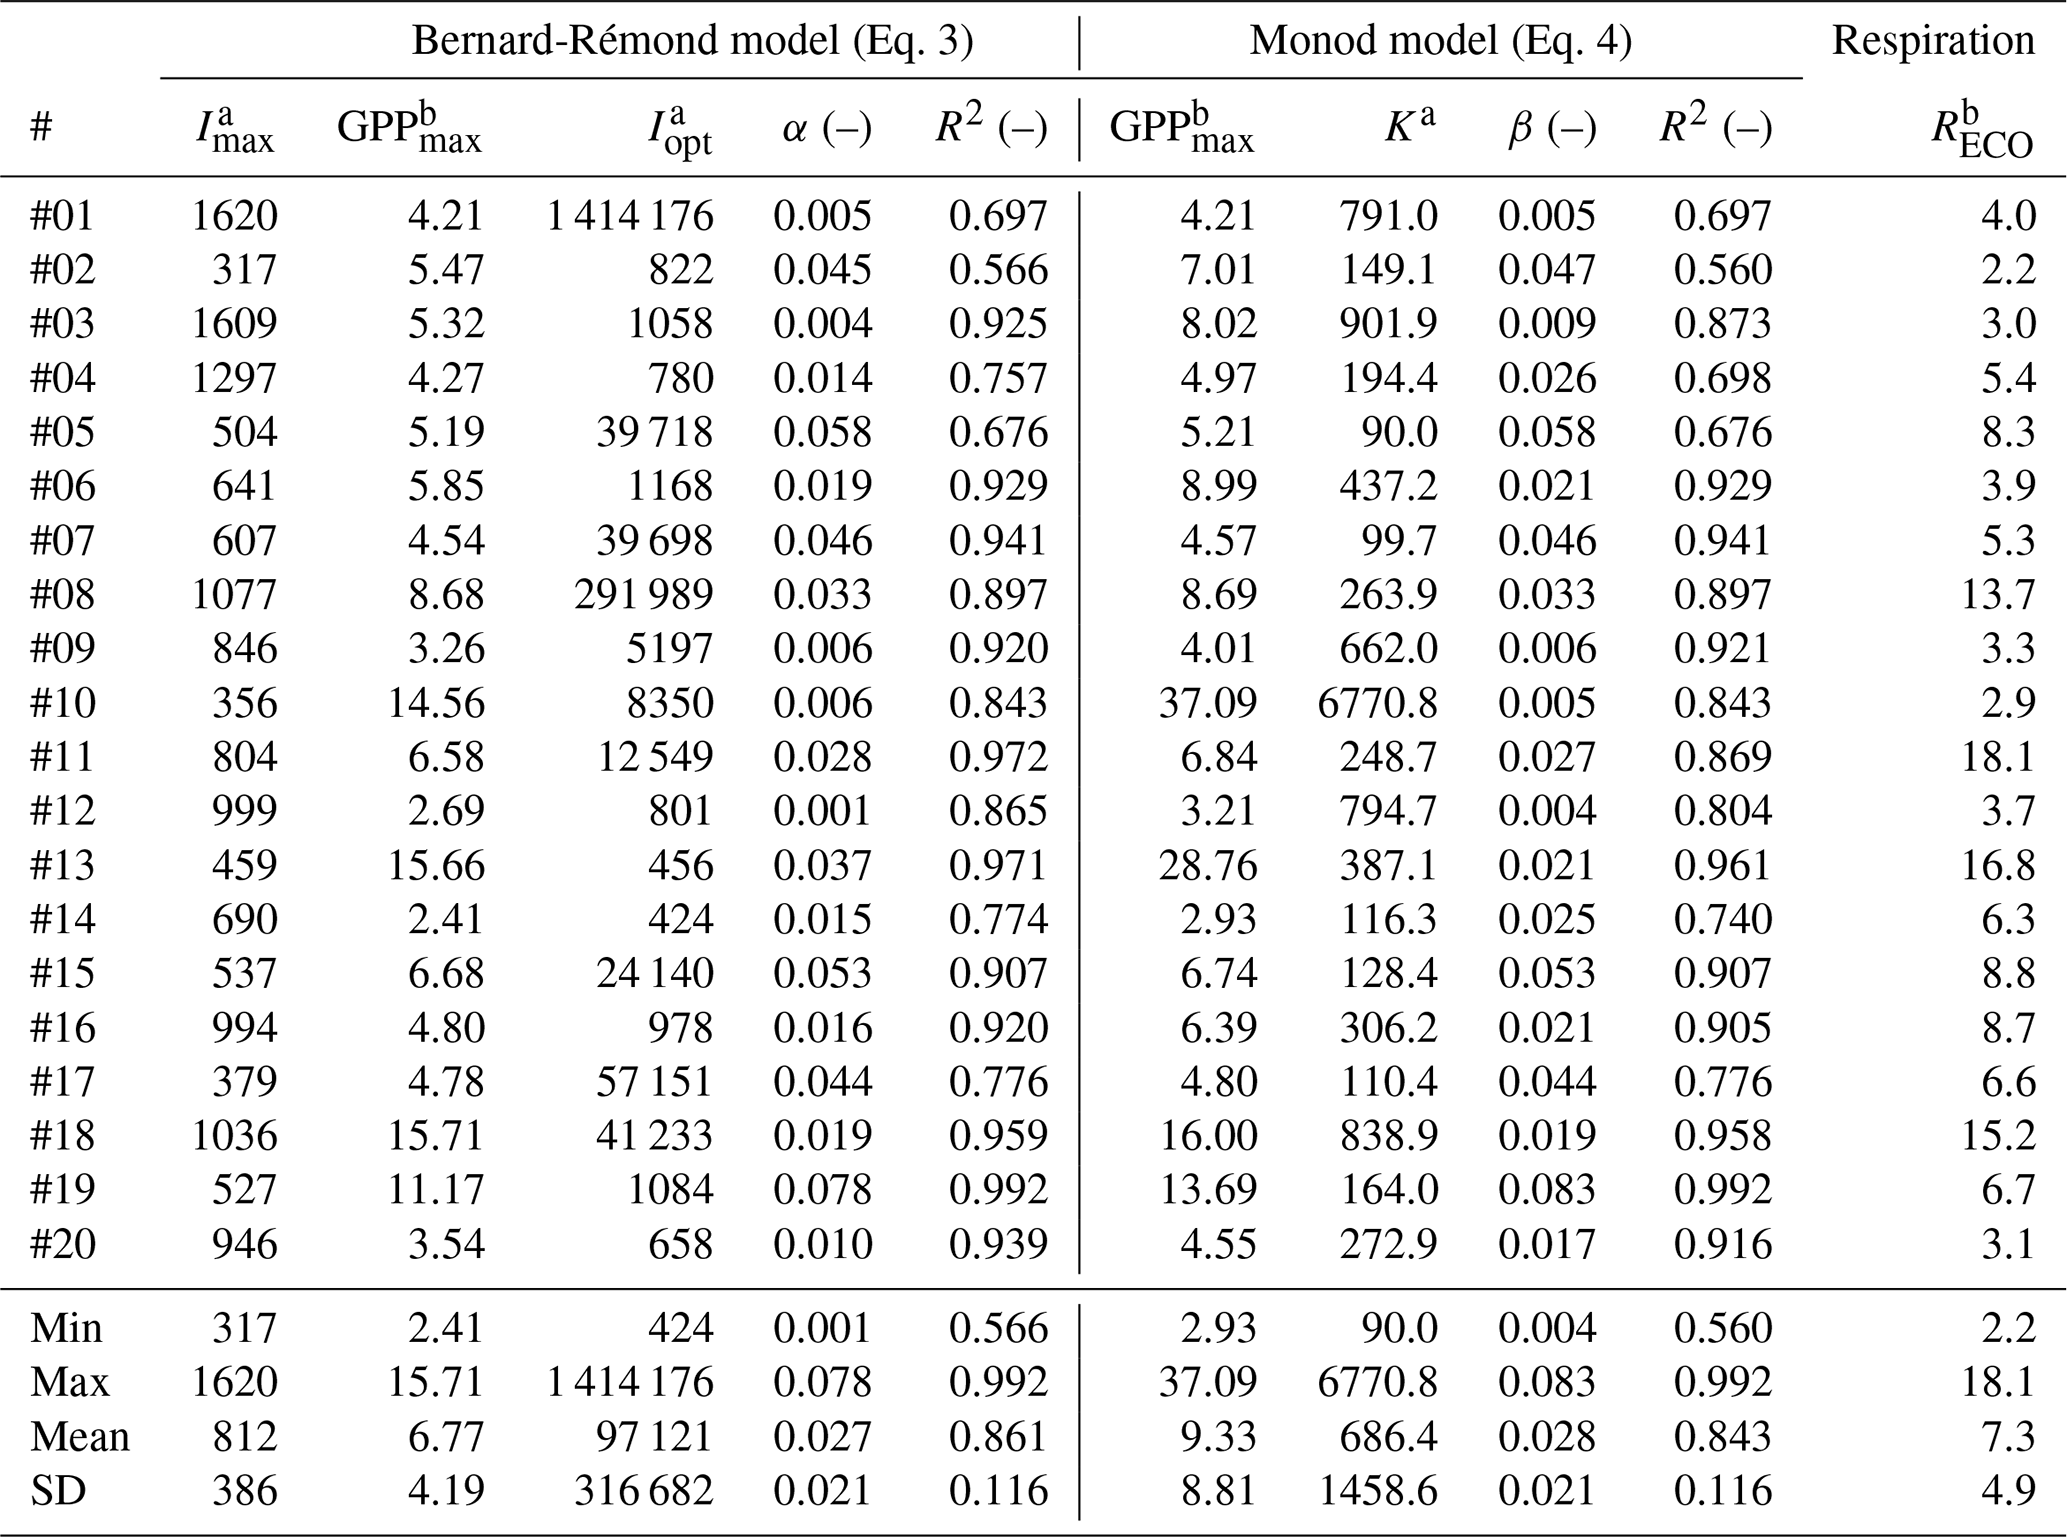
a µmol photons m−2 s−1; b µmol CO2 m−2 s−1.
The slope at the origin of the PI curves is a crucial parameter that reflects how efficiently a plant or ecosystem can convert light into chemical energy (via photosynthesis) under low light conditions. This is particularly relevant for C3 plants, such as many moss species with low photosynthetic activity that are commonly found in peatlands (Aro and Gerbaud, 1984). This parameter is expressed as α in most models, including the Bernard-Rémond model, and as β in the Monod model. In our study, the mean values of α (0.027 ± 0.021) and β (0.028 ± 0.021) showed no significant difference. These values fall within the ranges previously reported in peatlands, including 0.009–0.036 from northern bogs and fens (Shurpali et al., 1995; Suyker et al., 1997; Satriawan et al., 2023). Moreover, our results are consistent with theoretical expectations: the maximum possible quantum yield for terrestrial plants is approximately 0.1 µmol CO2 fixed per µmol photons absorbed (Farquhar et al., 1980; Björkman and Demmig, 1987). Thus, the values obtained here represent realistic light-use efficiencies for peatland vegetation under field conditions.
Similarly, GPPmax is another important parameter in modeling PI curves. In our study, the GPPmax estimated by the Bernard-Rémond model was not significantly different from the GPPmax obtained through fitting of the Monod model, with mean values of 6.77 ± 4.19 and 9.33 ± 8.81 µmol m−2 s−1, respectively (Table 1; Fig. 5). As observed for α, our data fell within the ranges reported by the same authors cited in the previous paragraph, all determined using an EC tower. Specifically, Suyker et al. (1997) reported a GPPmax of 10.6–17.1 µmol m−2 s−1 in a boreal fen, while Shurpali et al. (1995) and Satriawan et al. (2023) reported ranges of 1.59–6.36 and 5.28–6.52 µmol m−2 s−1, respectively, in northern bogs. Also, in our study, K was highly variable, with a CV of 200 %. Excluding one outlier (#10), the mean K was 417 ± 364 µmol m−2 s−1, which is close, for instance, to values previously reported: 382 µmol m−2 s−1 (Hájek, 2014) and 484 µmol m−2 s−1 (Suyker et al., 1997).
3.4 Respiration rates
Respiration rates (Reco) exceeded GPPmax in most experiments, leading to net CO2 emissions (positive NEE). Only six cases (#02, 03, 06, 13, 19, 20; 30 %) showed net CO2 capture at higher irradiances. Overall, the mean Reco of 7.3 ± 4.9 µmol CO2 m−2 s−1 was not significantly different from GPPmax in the Bernard-Rémond and Monod models (Table 1). This suggests that respiration largely offset photosynthetic carbon assimilation, limiting net CO2 uptake. EC measurements confirmed net CO2 emissions, with consistently positive NEE during the campaign (5–15 March) and local maxima coinciding with chamber deployment days (Fig. 6a). Additionally, NEE determined by EC was highest between 10:00 and 16:00, when most chamber measurements were taken (Fig. 6b). These findings highlight the contrasting dynamics of respiration and photosynthesis in peatlands, with significant seasonal and diel fluctuations (Flanagan, 2014; Satriawan et al., 2023; Peng et al., 2024). Similarly, studies indicate that peatlands can function as either carbon sinks or sources following long-term patterns. For instance, a peatland in northern Patagonia was reported to act as a carbon emitter in 6 of 8 years (Perez-Quezada et al., 2024).
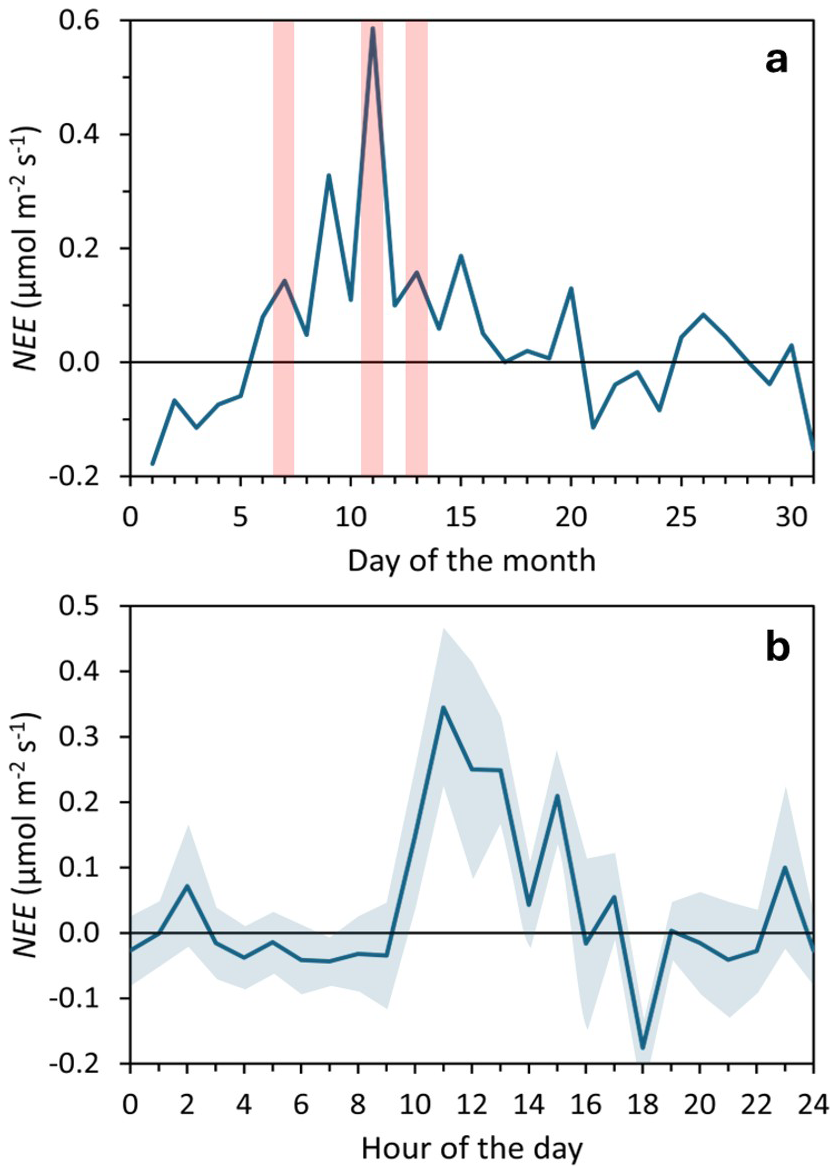
Figure 6Net Ecosystem Exchange (NEE) measured using an eddy covariance tower during March 2023. (a) Daily mean NEE, with light red shaded areas indicating the days of Photosynthesis-Irradiance Curve determinations. (b) Hourly mean NEE, averaged over the 31 d, with light blue shaded areas indicating the standard error.
3.5 Strengths and weaknesses of the method
Compared to the eddy covariance (EC) method, the gold standard for high-temporal-resolution peatland gas exchange measurements, the modulated-light skirt-chamber has certain limitations. A primary drawback is the significant experimental effort, as it requires manual deployment at each location, whereas EC operates unsupervised for extended periods. Another limitation is its reliance on natural light, which may not coincide with peak irradiance, especially under suboptimal conditions (e.g., cloud cover). The median maximum irradiance during chamber deployments was 747 ± 386 µmol m−2 s−1, only 46 % of the absolute maximum recorded during the campaign. The method may also be affected by temperature fluctuations within the chamber's enclosed air volume. During our study, temperature shifts of 2–3 °C were recorded by light/temperature Hobo dataloggers. However, these loggers are optimized for water temperature rather than air, preventing precise assessment of this effect. To mitigate temperature impacts, total enclosure time was limited to 3–4 min, with full solar irradiance applied for no more than 1 min. Future studies should use a more accurate air temperature sensor to improve monitoring. In addition, strategies to further limit chamber warming should be considered. Active cooling systems, such as Peltier elements, have been proposed in recent studies (e.g., Jentzsch et al., 2024) and could be adapted for use in the modulated-light skirt-chamber. Incorporating such systems would help maintain near-ambient conditions during measurements, thereby reducing the risk of temperature-induced biases in gas flux estimates.
A weakness of the method is exemplified by the 26 % of failed deployments (Fig. S3). Part of these failures were attributable to excessive leakage that increased measurement noise. This excessive leakage was linked to the vegetation itself: some vegetation types, such as Ericaceae (Table S2), formed a dense layer of intertwined fibrous and lignin-rich tissues, through which air flowed easily, thereby increasing gas exchange between the chamber and the atmosphere. Another common reason for failure to determine PI curves was fluctuating or insufficient irradiance under cloudy conditions. One weakness of the way we applied the skirt-chamber method is that light intensity was logged inside the chamber and processed afterward during analysis. Although this provided accurate irradiance values for PI curve construction, the lack of real-time monitoring limited the operator's ability to respond to rapid irradiance fluctuations. Real-time PAR monitoring would provide immediate feedback on irradiance conditions, allowing operators to repeat measurements when sudden changes occur. Notably, not all failures in determining PI curves can be ascribed to methodological weaknesses. Two of the failed cases occurred in bare peat areas (Table S2), where little or no photosynthetic activity was expected. Overall, while these issues reflect practical challenges of field measurements in heterogeneous environments, they do not undermine the overall reliability of the method.
An important question regarding the applicability of the chamber is whether the method can be used in submerged areas, a common feature in many peatlands. Our study sites did not include permanently inundated conditions, and we cannot confirm chamber performance under such circumstances. We anticipate that in submerged or near-saturated zones, the skirt would form a seal with the water surface, and the chamber would function similarly to a static closed chamber, with gas accumulating inside due to little or no leakage. In such cases, deployment time should be limited to avoid large CO2 concentration changes that could alter respiration or photosynthesis kinetics. Direct testing under these conditions will be an important next step to extend the applicability of the method.
Another potential limitation of the skirt-chamber method is that it requires the presence of an operator, which may cause site disturbance when stepping close to the chamber, particularly in wet or water-saturated areas where pressure is readily transmitted through the peat matrix. In a separate study (not part of this work), we observed that operator proximity could influence ebullition events: gas release was triggered when stepping close to the chamber but avoided when maintaining a distance of 40–50 cm. To mitigate this issue, we recommend practices that distribute operator weight, such as the use of snowshoes (as applied here) or pressure-distributing boards. Although this effect does not compromise the chamber design itself, it highlights the importance of maintaining sufficient operator distance to minimize disturbance during measurements.
A practical issue that may arise is condensation on the chamber window under high irradiance. In our field tests, this was only observed during the highest light condition (direct sun, without shading fabrics), and it lasted for less than 2 min, producing only slight condensation. Such condensation could, in principle, scatter direct irradiance and reduce overall transmission, but in this study any potential effect was minimized because light intensity was measured inside the chamber. Given its short duration and limited extent, the impact on PI curve determination was considered negligible.
Although CH4 was used as a tracer gas to determine the chamber residence time (θC), this did not preclude the estimation of CH4 fluxes. Fluxes were calculated from the CH4 concentration record prior to the pulse injection, during which concentrations were monitored for approximately 1 min. This time window was sufficient for flux determination, and it can be extended in future applications when CH4 emissions are a core objective.
The modulated-light skirt-chamber was designed with several attributes in mind. First, it was built in two sections so that the chamber could be rotated without disturbing the skirt-base, allowing the operator to select between shaded and direct sun exposure. Second, the truncated cylinder shape was selected to optimize light exposure inside the chamber. Third, the chamber was made fully 3-D printable to simplify fabrication and ensure reproducibility. Fourth, the truncated cylinder design was selected to reduce the surface area exposed to sun, compared to a cubic shape, thereby minimizing potential temperature issues. Nevertheless this careful design, our field experience indicated that the practical benefits of the selected design were less pronounced than expected, and alternative geometries – including conventional transparent chambers – could also be effectively combined with a skirt-base, provided that they allow for easy opening, closing, and aeration.
Finally, we note that the modulated-light skirt-chamber tested in this study is particularly suited to Sphagnum-dominated bogs with low vegetation. In fen ecosystems with taller or denser vegetation, obtaining effective measurements may require design modifications and/or adaptations of the method.
Despite its drawbacks, the modulated-light skirt-chamber demonstrated strong consistency with well-established models. The R2 values ranged from 0.57 to 0.99, with p-values below 0.05, indicating a good to excellent fit to the Bernard-Rémond and Monod models. Additionally, all parameters determined with this method aligned with previously reported peatland values using above-ground techniques, reinforcing its reliability. While above-ground methods capture whole-ecosystem dynamics, the modulated-light skirt-chamber enables detailed, site-specific assessments of carbon fluxes, including plant light response and underground bioprocesses. Furthermore, EC requires costly equipment and time-intensive installation, limiting its practicality for multi-site studies. In contrast, the chamber method is installation-free, highly flexible, and significantly more cost-effective, with expenses primarily related to the gas analyzer. Compared to leaf-level measurements, the modulated-light skirt-chamber accounts for the entire plant community and the complex underground processes enclosed within the chamber perimeter, providing a more integrated perspective on site-specific carbon dynamics. We see it as particularly useful in environments where microtopography, vegetation diversity, or soil conditions create localized carbon flux variations. Its affordability and versatility make it ideal for comparative studies and fieldwork across diverse landscapes. Moreover, the modulated-light skirt-chamber could be of particular interest when combined with remote sensing tools for high spatial resolution mapping of carbon fluxes, as recently exemplified by Walcker et al. (2025) through drone-based approaches.
The modulated-light skirt-chamber is a valuable tool for studying peatland photosynthetic dynamics. By bridging the scale gap between leaf-level and ecosystem-scale observations, it provides a unique opportunity to investigate carbon dynamics at an intermediate scale, often overlooked by traditional methods. Despite limitations this method showed strong consistency with established models. Furthermore, its portability, cost efficiency, and ability to provide localized insights into carbon dynamics make it well-suited for comparative studies across diverse landscapes. As with any method, refinements, such as improved temperature measurement accuracy, will further enhance its applicability and reliability. Overall, the modulated-light skirt-chamber holds significant promise for advancing our understanding of peatland carbon dynamics, particularly in heterogeneous environments where fine-scale variability plays a critical role in ecosystem functioning.
The dataset supporting this study is publicly available in Mendeley Data at https://doi.org/10.17632/crhk97t7cy.1 (Thalasso et al., 2025).
The supplement related to this article is available online at https://doi.org/10.5194/bg-22-7137-2025-supplement.
FT: conceptualization, coordination, fieldwork and laboratory work, investigation, formal analysis, methodology, data management, writing (original draft), funding acquisition. JASR: fieldwork and laboratory work, investigation, methodology, writing (review and editing). BRR: fieldwork and laboratory work, logistical support, writing (review and editing). JFPQ: fieldwork and laboratory work (EC tower), supervision, writing (review and editing). CG: fieldwork and laboratory work (EC tower), data curation, writing (review and editing). MTV: data curation, visualization, writing (review and editing). All authors contributed to and approved the final version of the manuscript.
The contact author has declared that none of the authors has any competing interests.
Publisher's note: Copernicus Publications remains neutral with regard to jurisdictional claims made in the text, published maps, institutional affiliations, or any other geographical representation in this paper. While Copernicus Publications makes every effort to include appropriate place names, the final responsibility lies with the authors. Views expressed in the text are those of the authors and do not necessarily reflect the views of the publisher.
This study was financially supported by the “Agencia Nacional de Investigación y Desarrollo” (ANID, Chile) through several funding programs (see Financial Support section). The authors thank Ana I. López Aguado for the technical drawing (Fig. 1). Special thanks are extended to Dr. Francisca Massardo, Director of the “Centro Subantártico Cabo de Hornos”, as well as to Alexis Savaria Monges and the center's staff for their technical and logistical support. The authors acknowledge the use of OpenAI's ChatGPT (version 5), which was employed solely for language editing purposes.
This research has been supported by the Agencia Nacional de Investigación y Desarrollo (ANID, Chile) through the CHIC program (grant no. FB210018), the IEB program (grant no. FB210006), Fondequip grant no. EQM200198, Fondecyt grant nos. 3220809 and 1251027, and the Millennium Science Initiative Program (grant no. ICN2021_002).
This paper was edited by Nicolas Brüggemann and reviewed by two anonymous referees.
Abdalla, M., Hastings, A., Truu, J., Espenberg, M., Mander, Ü., and Smith, P.: Emissions of methane from northern peatlands: A review of management impacts and implications for future management options, Ecol. Evol., 6, 7080–7102, https://doi.org/10.1002/ece3.2469, 2016.
Aro, E. M. and Gerbaud, A.: Photosynthesis and photorespiration in mosses, in: Advances in Photosynthesis Research, edited by: Sybesma, C., Advances in Agricultural Biotechnology, vol. 3, Springer, Dordrecht, https://doi.org/10.1007/978-94-017-4973-2_198, 1984.
Badorek, T., Tuittila, E.-S., Ojanen, P., and Minkkinen, K.: Forest floor photosynthesis and respiration in a drained peatland forest in southern Finland, Plant Ecol. Divers., 4, 227–241, https://doi.org/10.1080/17550874.2011.644344, 2011.
Baldocchi, D., Novick, K., Keenan, T., and Torn, M.: AmeriFlux: Its impact on our understanding of the “breathing of the biosphere”, after 25 years, Agr. Forest Meteorol., 348, 109929, https://doi.org/10.1016/j.agrformet.2024.109929, 2024.
Bengtsson, F., Granath, G., and Rydin, H.: Photosynthesis, growth, and decay traits in Sphagnum – a multispecies comparison, Ecol. Evol., 6, 3325–3341, https://doi.org/10.1002/ece3.2119, 2016.
Bernard, O. and Rémond, B.: Validation of a simple model accounting for light and temperature effect on microalgal growth, Bioresour. Technol., 123, 520–527, https://doi.org/10.1016/j.biortech.2012.07.022, 2012.
Björkman, O. and Demmig, B.: Photon yield of O2 evolution and chlorophyll fluorescence characteristics at 77 K among vascular plants of diverse origins, Planta, 170, 489–504, https://doi.org/10.1007/BF00402983, 1987.
Bubier, J. L., Crill, P. M., Moore, T. R., Savage, K., and Varner, R. K.: Seasonal patterns and controls on net ecosystem CO2 exchange in a boreal peatland complex, Global Biogeochem. Cycles, 12, 703–714, https://doi.org/10.1029/98GB02426, 1998.
Charman, D. J., Beilman, D. W., Blaauw, M., Booth, R. K., Brewer, S., Chambers, F. M., Christen, J. A., Gallego-Sala, A., Harrison, S. P., Hughes, P. D. M., Jackson, S. T., Korhola, A., Mauquoy, D., Mitchell, F. J. G., Prentice, I. C., van der Linden, M., De Vleeschouwer, F., Yu, Z. C., Alm, J., Bauer, I. E., Corish, Y. M. C., Garneau, M., Hohl, V., Huang, Y., Karofeld, E., Le Roux, G., Loisel, J., Moschen, R., Nichols, J. E., Nieminen, T. M., MacDonald, G. M., Phadtare, N. R., Rausch, N., Sillasoo, Ü., Swindles, G. T., Tuittila, E.-S., Ukonmaanaho, L., Väliranta, M., van Bellen, S., van Geel, B., Vitt, D. H., and Zhao, Y.: Climate-related changes in peatland carbon accumulation during the last millennium, Biogeosciences, 10, 929–944, https://doi.org/10.5194/bg-10-929-2013, 2013.
Falge, E., Baldocchi, D., Olson, R., Anthoni, P., Aubinet, M., Bernhofer, C., Burba, G., Ceulemans, R., Clement, R., Dolman, H., Granier, A., Gross, P., Grünwald, T., Hollinger, D., Jensen, N.-O., Katul, G., Keronen, P., Kowalski, A., Lai, C. T., Law, B. E., Meyers, T., Moncrieff, J., Moors, E., Munger, J. W., Pilegaard, K., Rannik, Ü., Rebmann, C., Suyker, A., Tenhunen, J., Tu, K., Verma, S., Vesala, T., Wilson, K., and Wofsy, S.: Gap filling strategies for defensible annual sums of net ecosystem exchange, Agric. For. Meteorol., 107, 43–69, https://doi.org/10.1016/S0168-1923(00)00225-2, 2001.
Farquhar, G. D., von Caemmerer, S., and Berry, J. A. A biochemical model of photosynthetic CO2 assimilation in leaves of C3 species, Planta, 149, 78–90, https://doi.org/10.1007/BF00386231, 1980.
Flanagan, L. B.: Interacting controls on ecosystem photosynthesis and respiration in contrasting peatland ecosystems, in: Photosynthesis in Bryophytes and Early Land Plants, edited by: Hanson, D. and Rice, S., Advances in Photosynthesis and Respiration, vol. 37, Springer, Dordrecht, https://doi.org/10.1007/978-94-007-6988-5_14, 2014.
Frolking, S., Roulet, N., and Fuglestvedt, J.: How northern peatlands influence the Earth's radiative budget: Sustained methane emission versus sustained carbon sequestration, J. Geophys. Res.-Biogeosci., 111, G01008, https://doi.org/10.1029/2005JG000091, 2006.
Frolking, S. E., Bubier, J. L., Moore, T. R., Ball, T., Bellisario, L. M., Bhardwaj, A., Carroll, P., Crill, P. M., Lafleur, P. M., and McCaughey, J. H.: Relationship between ecosystem productivity and photosynthetically active radiation for northern peatlands, Global Biogeochem. Cycles, 12, 115–126, https://doi.org/10.1029/97GB03367, 1998.
Griscom, B. W., Adams, J., Ellis, P. W., Houghton, R. A., Lomax, G., Miteva, D. A., Schlesinger, W. H., Shoch, D., Siikamäki, J. V., Smith, P., Woodbury, P., Zganjar, C., Blackman, A., Campari, J., Conant, R. T., Delgado, C., Elias, P., Gopalakrishna, T., Hamsik, M. R., Herrero, M., Kiesecker, J., Landis, E., Laestadius, L., Leavitt, S. M., Minnemeyer, S., Polasky, S., Potapov, P., Putz, F. E., Sanderman, J., Silvius, M., Wollenberg, E., and Fargione, J.: Natural climate solutions, Proc. Natl. Acad. Sci. USA, 114, 11645–11650, https://doi.org/10.1073/pnas.1710465114, 2017.
Hájek, T.: Physiological ecology of peatland bryophytes, in: Photosynthesis in Bryophytes and Early Land Plants, edited by: Hanson, D. and Rice, S., Advances in Photosynthesis and Respiration, vol. 37, Springer, Dordrecht, https://doi.org/10.1007/978-94-007-6988-5_13, 2014.
Heinemeyer, A., Di Bene, C., Lloyd, A. R., Tortorella, D., Baxter, R., Huntley, B., Gelsomino, A., and Ineson, P.: Soil respiration: implications of the plant-soil continuum and respiration chamber collar-insertion depth on measurement and modelling of soil CO2 efflux rates in three ecosystems, European Journal of Soil Science, 62, 82–94, https://doi.org/10.1111/j.1365-2389.2010.01331.x, 2011.
Herrmann, H. A., Schwartz, J. M., and Johnson, G. N.: From empirical to theoretical models of light response curves – linking photosynthetic and metabolic acclimation, Photosynth. Res., 145, 5–14, https://doi.org/10.1007/s11120-019-00681-2, 2020.
Holl, D., Pancotto, V., Heger, A., Camargo, S. J., and Kutzbach, L.: Cushion bogs are stronger carbon dioxide net sinks than moss-dominated bogs as revealed by eddy covariance measurements on Tierra del Fuego, Argentina, Biogeosciences, 16, 3397–3423, https://doi.org/10.5194/bg-16-3397-2019, 2019.
Jentzsch, K., Männistö, E., Marushchak, M. E., Korrensalo, A., van Delden, L., Tuittila, E.-S., Knoblauch, C., and Treat, C. C.: Shoulder season controls on methane emissions from a boreal peatland, Biogeosciences, 21, 3761–3788, https://doi.org/10.5194/bg-21-3761-2024, 2024.
Jones, C. T., Craig, S. E., Barnett, A. B., MacIntyre, H. L., and Cullen, J. J.: Curvature in models of the photosynthesis-irradiance response, J. Phycol., 50, 341–355, https://doi.org/10.1111/jpy.12164, 2014.
Kangas, L., Maanavilja, L., Hájek, T., Juurola, E., Chimner, R. A., Mehtätalo, L., and Tuittila, E.-S.: Photosynthetic traits of Sphagnum and feather moss species in undrained, drained, and rewetted boreal spruce swamp forests, Ecol. Evol., 4, 381–396, https://doi.org/10.1002/ece3.939, 2014.
Leifeld, J. and Menichetti, L.: The underappreciated potential of peatlands in global climate change mitigation strategies, Nat. Commun., 9, 1071, https://doi.org/10.1038/s41467-018-03406-6, 2018.
LI-COR Biosciences: EddyPro software, Version 7.0.9, LI-COR Biosciences, Lincoln, Nebraska, USA, https://www.licor.com/products/eddy-covariance/eddypro (last access: 14 November 2025), 2022.
OriginLab Corporation: OriginPro, Version 2016, OriginLab orporation, Northampton, MA, USA, 2016.
Page, S. E., Rieley, J. O., and Banks, C. J.: Global and regional importance of the tropical peatland carbon pool, Glob. Change Biol., 17, 798–818, https://doi.org/10.1111/j.1365-2486.2010.02279.x, 2011.
Peng, C., Li, H., Yang, N., and Lu, M. A.: Comparison of greenhouse gas emission patterns in different water levels in peatlands, Water, 16, 985, https://doi.org/10.3390/w16070985, 2024.
Perez-Quezada, J. F., Saliendra, N. Z., Akshalov, K., Johnson, D. A., and Laca, E. A.: Land use influences carbon fluxes in Northern Kazakhstan, Rangeland Ecol. Manag., 63, 82–93, https://doi.org/10.2111/08-106.1, 2010.
Perez-Quezada, J. F., Trejo, D., Lopatin, J., Aguilera, D., Osborne, B., Galleguillos, M., Zattera, L., Celis-Diez, J. L., and Armesto, J. J.: Comparison of carbon and water fluxes and the drivers of ecosystem water use efficiency in a temperate rainforest and a peatland in southern South America, Biogeosciences, 21, 1371–1389, https://doi.org/10.5194/bg-21-1371-2024, 2024.
Riquelme del Río, B. R., Sepulveda-Jauregui, A., Salas-Rabaza, J. A., Mackenzie, R., and Thalasso, F.: Fine-scale spatial variability of greenhouse gas emissions from a Subantarctic peatland bog, Environ. Sci. Technol., 58, 7393–7402, https://doi.org/10.1021/acs.est.3c10746, 2024.
Rydin, H. and Jeglum, J. K.: The biology of peatlands, 2nd edn., Oxford University Press, 398 pp., https://doi.org/10.1093/acprof:osobl/9780199602995.001.0001, 2013.
Satriawan, T. W., Nyberg, M., Lee, S.-C., Christen, A., Black, T. A., Johnson, M. S., Nesic, Z., Merkens, M., and Knox, S. H.: Interannual variability of carbon dioxide (CO2) and methane (CH4) fluxes in a rewetted temperate bog, Agric. For. Meteorol., 342, 109696, https://doi.org/10.1016/j.agrformet.2023.109696, 2023.
Shurpali, N. J., Verma, S. B., Kim, J., and Arkebauer, T. J.: Carbon dioxide exchange in a peatland ecosystem, J. Geophys. Res., 100, 319–326, https://doi.org/10.1029/95JD01227, 1995.
Suyker, A. E., Verma, S. B., and Arkebauer, T. J.: Season-long measurement of carbon dioxide exchange in a boreal fen, J. Geophys. Res., 102, 29021–29028, https://doi.org/10.1029/96JD03877, 1997.
Thalasso, F., Riquelme, B., Gómez, A., Mackenzie, R., Aguirre, F. J., Hoyos-Santillan, J., Rozzi, R., and Sepulveda-Jauregui, A.: Technical note: Skirt chamber – an open dynamic method for the rapid and minimally intrusive measurement of greenhouse gas emissions from peatlands, Biogeosciences, 20, 3737–3749, https://doi.org/10.5194/bg-20-3737-2023, 2023.
Thalasso, F., Salas-Rabaza, J. A., and Riquelme del Río, B.: Photosynthesis-irradiance curve in peatlands with a modulated-light skirt-chamber, Mendeley Data, V1 [data set], https://doi.org/10.17632/crhk97t7cy.1, 2025.
UNEP (United Nations Environment Programme): Resolution 4/16. Conservation and sustainable management of peatlands – resolution adopted by the United Nations Environment Assembly on 15 March 2019, https://wedocs.unep.org/20.500.11822/30675 (last access: 23 November 2024), 2019.
Walcker, R., Le Lay, C., Gandois, L., Elgar, E., and Jassey, V. E. J.: High-resolution mapping of peatland CO2 fluxes using drone multispectral images, Ecol. Inform., 86, 103060, https://doi.org/10.1016/j.ecoinf.2025.103060, 2025.
Ye, Z.-P., Suggett, D. C. J., Robakowski, P., and Kang, H.-J.: A mechanistic model for the photosynthesis–light response based on the photosynthetic electron transport of photosystem II in C3 and C4 species, New Phytol., 199, 110–120, https://doi.org/10.1111/nph.12242, 2013.
Yu, Z.: Holocene carbon flux histories of the world's peatlands: Global carbon cycle implications, Holocene, 21, 761–774, https://doi.org/10.1177/0959683610386982, 2011.