the Creative Commons Attribution 4.0 License.
the Creative Commons Attribution 4.0 License.
 | 25 Nov 2025
Including different mesozooplankton feeding strategies in a biogeochemical ocean model impacts global ocean biomass and carbon cycle
Lisa Di Matteo
Fabio Benedetti
Sakina-Dorothée Ayata
Olivier Aumont
Mesozooplankton present a wide range of functionally diverse heterotrophic organisms ranging from 200 µm to 2 cm that are essential to marine ecosystems and biogeochemical cycles. In most ocean biogeochemical models, mesozooplankton are represented as a single compartment along with microzooplankton (<0.2 mm), thereby overlooking their large functional diversity. Yet, observational and modelling studies relying on functional trait-based approaches showed how important the functional traits diversity of marine zooplankton is in driving ecosystem dynamics and biogeochemical cycles.
Here, we use such a functional trait-based approach by modelling the effect of various mesozooplankton feeding strategies on the ocean carbon cycle, using the global ocean biogeochemical model PISCES. Three new mesozooplankton functional types (PFTs) and their associated trade-offs were integrated into PISCES: cruisers (active swimmers feeding on suspension particles), ambushers (passive suspension feeder, relying on a sit-and-wait strategy) and flux-feeders (passively feeding on particles). An additional foraging effort was implemented for cruisers to account for the optimization of their active behaviour. Our new configuration shows that these functional groups have distinct latitudinal and vertical distributions: the two suspension feeding groups (cruisers and ambushers) share the epipelagic zone, with ambushers being the dominant group globally (0.11 Gt C yr−1, 54.8 % of total mesozooplankton in the top 150 m) and cruise feeders (0.03 Gt C yr−1) prevailing in the productive regions near the poles. Meanwhile, flux-feeders (0.06 Gt C yr−1) dominate in the mesopelagic zone of coastal regions. The change of parameters, thus trade-offs, in our sensitivity experiments also shows how we can modulate and even reverse the latitudinal pattern of suspension feeders. Finally, we demonstrate how the deep-dwelling flux-feeders directly affect carbon export at depth more strongly by consuming the particles that would otherwise be transported to deeper layers (the carbon export increases by 40.8 % when flux-feeders are removed). This study emphasizes the necessity for a better integration of the trophic strategies of this planktonic compartment within global biogeochemical models.
- Article
(16761 KB) - Full-text XML
- BibTeX
- EndNote


Marine zooplankton are heterotrophic organisms that drift along ocean currents and are essential components of ocean biodiversity (Ratnarajah et al., 2023; Le Quéré et al., 2016). They encompass more than 28 000 species (Bucklin et al., 2021) covering a wide variety of organisms whose size range between <1 mm to >1 m. Within zooplankton, one of the most studied size classes encompasses the mesozooplankton, which ranges from 0.2 to 20 mm (Sieburth et al., 1978) and include organisms such as copepods, pteropods, and other small invertebrates (Steinberg and Landry, 2017). Mesozooplankton play crucial roles in marine ecosystem functioning, particularly through their major contribution to energy transfer from primary producers towards higher trophic levels, for whom they are an essential food source (Verity and Smetacek, 1996; Steinberg and Landry, 2017). Additionally, they actively contribute to the biological carbon pump (Ratnarajah et al., 2023; Steinberg and Landry, 2017). In particular, they produce particulate organic matter as carcasses, molt, particles from sloppy feeding and large fecal pellets that rapidly sink into the water column (Turner, 2002). Through their diel vertical migrations, mesozooplankton also actively transport carbon to different ocean layers (Kelly et al., 2019; Aumont et al., 2018). This migrating behaviour is estimated to account for 15 %–20 % of global carbon export (Pinti et al., 2023; Nowicki et al., 2022) and promotes the sequestration of carbon at depth, thus contributing to global climate regulation (Steinberg and Landry, 2017). Within the mesozooplankton, copepods also contribute to carbon export through the seasonal lipid pump (Jónasdóttir et al., 2015).
These various contributions of mesozooplankton to biogeochemical cycles depend on the expression of numerous functional traits and their trade-offs (Litchman et al., 2013). Functional traits are defined as individual characteristics of organisms (such as body size, feeding strategy, trophic regime, or migratory behaviour) that influence individual fitness and ecosystem functioning (Violle et al., 2007; Martini et al., 2021). For instance, body size has been described as a “master” trait (Kiørboe et al., 2018a; Orenstein et al., 2022) and has gained attention to classify zooplankton and study the impact of various size classes in the trophic web. Several studies showed how environmental conditions control mesozooplankton growth rate and body size which, in turn, influence the expression of other functional traits (Hébert et al., 2016; Kiørboe and Hirst, 2014). The distribution of temperature or prey availability (Brun et al., 2016) affects the fundamental functions of organisms (Litchman et al., 2013) and directly impacts ecosystem dynamics through variations in metabolic traits, body size (Evans et al., 2020), preferred prey size (Almeda et al., 2018), amplitude of the diel vertical migrations (Kelly et al., 2019; Aumont et al., 2018) or fecal pellets size (Steinberg and Landry, 2017; Uye and Kaname, 1994; Stamieszkin et al., 2015). Because zooplankton diversity is commonly studied from a taxonomic point of view and organized through size classes due to sampling constraints (Ratnarajah et al., 2023), potentially important functional traits such as feeding strategies (Kiørboe, 2011) have been overlooked. Yet, variations in feeding strategies has implications for ecological functions such as energy uptake, predation risk, energetic losses and mate finding, inducing trade-offs between gains and costs, and implying variations in ecosystem dynamics and biodiversity distribution (Stukel et al., 2019; Kiørboe, 2011; Litchman et al., 2013). Feeding strategies have been classified based on factors such as motility, food preferences, and physiological and environmental requirements, with distinct strategies emerging according to the behaviour and predatory modes of the organisms (Kiørboe, 2011). For example, ambush feeders are stationary organisms that passively wait to encounter preys while active cruise feeders are organisms that swim through the water and modulate their foraging effort to capture preys detected at a distance. Feeding-current feeders generate a current to capture preys that are detected remotely, whereas flux-feeders are capable of collecting sinking particles (Litchman et al., 2013; Kiørboe, 2011; Ohman, 2019).
Over the past few decades, many methods have been developed to study the diversity of mesozooplankton: by imaging the organisms (Ohman, 2019) after they have been collected using plankton nets, as well as with in situ cameras like the Underwater Vision Profiler (UVP), which represents a less intrusive method (Picheral et al., 2022), through acoustics (Parra et al., 2019), genomics (Karsenti et al., 2011) or modelling (Kiørboe et al., 2018a). Ocean biogeochemical models have proven to be a valuable tool to quantify carbon fluxes within planktonic ecosystems at both regional and global scales (Gentleman et al., 2003; Fennel et al., 2022). Despite the increasing complexity of these models over the years (Gentleman, 2002), the representation of functional diversity in zooplankton in biogeochemical models remains crude and zooplankton are still usually represented through a few size classes, for instance micro-, meso- and macro-zooplankton (Le Quéré et al., 2005; Clerc et al., 2023), Therefore, accurately modelling the zooplankton-mediated processes of the biological carbon pump, such as zooplankton grazing (Rohr et al., 2023; Chenillat et al., 2021), remains a huge challenge that needs to be tackled as the responses of the ocean carbon cycle to ongoing climatic stressors remain highly uncertain (Henson et al., 2022). To develop marine ecosystem models, plankton organisms that share similar characteristics and similar ecological and biogeochemical functions have been classified into Plankton Functional Types (PFTs) (Le Quéré et al., 2005). Functional traits-based approaches thus offer new opportunities to unravel the relation between the diversity of zooplankton traits, their trade-offs and marine ecosystem functioning (Martini et al., 2021; Barton et al., 2013; Kiørboe et al., 2018a, b). More recently, a variety of modelling frameworks have been developed to enable more elaborate representations of zooplankton functional diversity (Negrete-García et al., 2022; Serra-Pompei et al., 2020; Chenillat et al., 2021). In particular, recent studies on the feeding strategies of mesozooplankton have demonstrated the challenges of such a representation, where similar traits are represented through a large range of parameters based on different hypotheses (Visser, 2007; Serra-Pompei et al., 2020). The behavioural adaptation emerges as a consequence of trade-offs between energy acquisition, predation risk, metabolic loss and the modulation of the foraging effort (Visser, 2007; Kiørboe, 2011; Kiørboe et al., 2018a; Van Someren Gréve et al., 2017). Variations in mesozooplankton community composition thus have impacts on the global, regional and vertical distribution of the feeding traits (Brun et al., 2016). These biogeographies may even contradict one another depending on the modelling framework. For example, the niche modelling study by Benedetti et al. (2023) shows an opposite distribution of ambushers and cruisers compared to the dynamic model of Prowe et al. (2019). Such discrepancies can lead to variations in the trophic web dynamics and the amplitude of carbon export to the deep ocean, as highlighted by Stukel et al. (2019).
In this study, we focus on three specific feeding strategies to provide insights into the role of mesozooplankton in the global ocean and, more broadly, in the functioning of marine ecosystems. We address the following questions: (i) Do different mesozooplankton feeding strategies display various biogeographies and what are their underlying drivers? and (ii) How does this diversity of feeding strategies affect ecosystem dynamics and impact the global ocean carbon cycle? To answer these questions, we include three mesozooplankton feeding strategies (i.e. cruise-feeders, ambush-feeders and flux-feeders) into a new version of the PISCES biogeochemical model, which is coupled with the NEMO ocean dynamical model on a global scale. Using this modelling framework, we examine the spatial and temporal distribution of these three feeding strategies and analyze their effects on ecosystem dynamics and carbon cycle. We first compare the model outputs with existing observations to confirm that it accurately represents the realised distribution of plankton biomass and then describe the biomass distribution of the newly-included mesozooplankton groups. We then focus on the emergent biogeography and seasonality of the feeding traits. Finally, we investigate the impact of considering these three distinct feeding strategies on global biomass of lower trophic layers (microzooplankton and phytoplankton) and on carbon export through several sensitivity experiments.
2.1 Biogeochemical model description
In this study, we performed ocean simulations based on the offline version of the coupled physical/biogeochemical model NEMO-PISCES. NEMO (Nucleus for European Modelling of the Ocean) version 4.2 (Madec et al., 2023) is a model of global ocean circulation comprised of three major components: the ocean dynamical code OPA (Madec et al., 2023), the sea-ice model SI3 (Vancoppenolle et al., 2023), and the marine biogeochemical model PISCES (Pelagic Interaction Scheme for Carbon and Ecosystem Studies, Aumont et al., 2015, Fig. 1a).
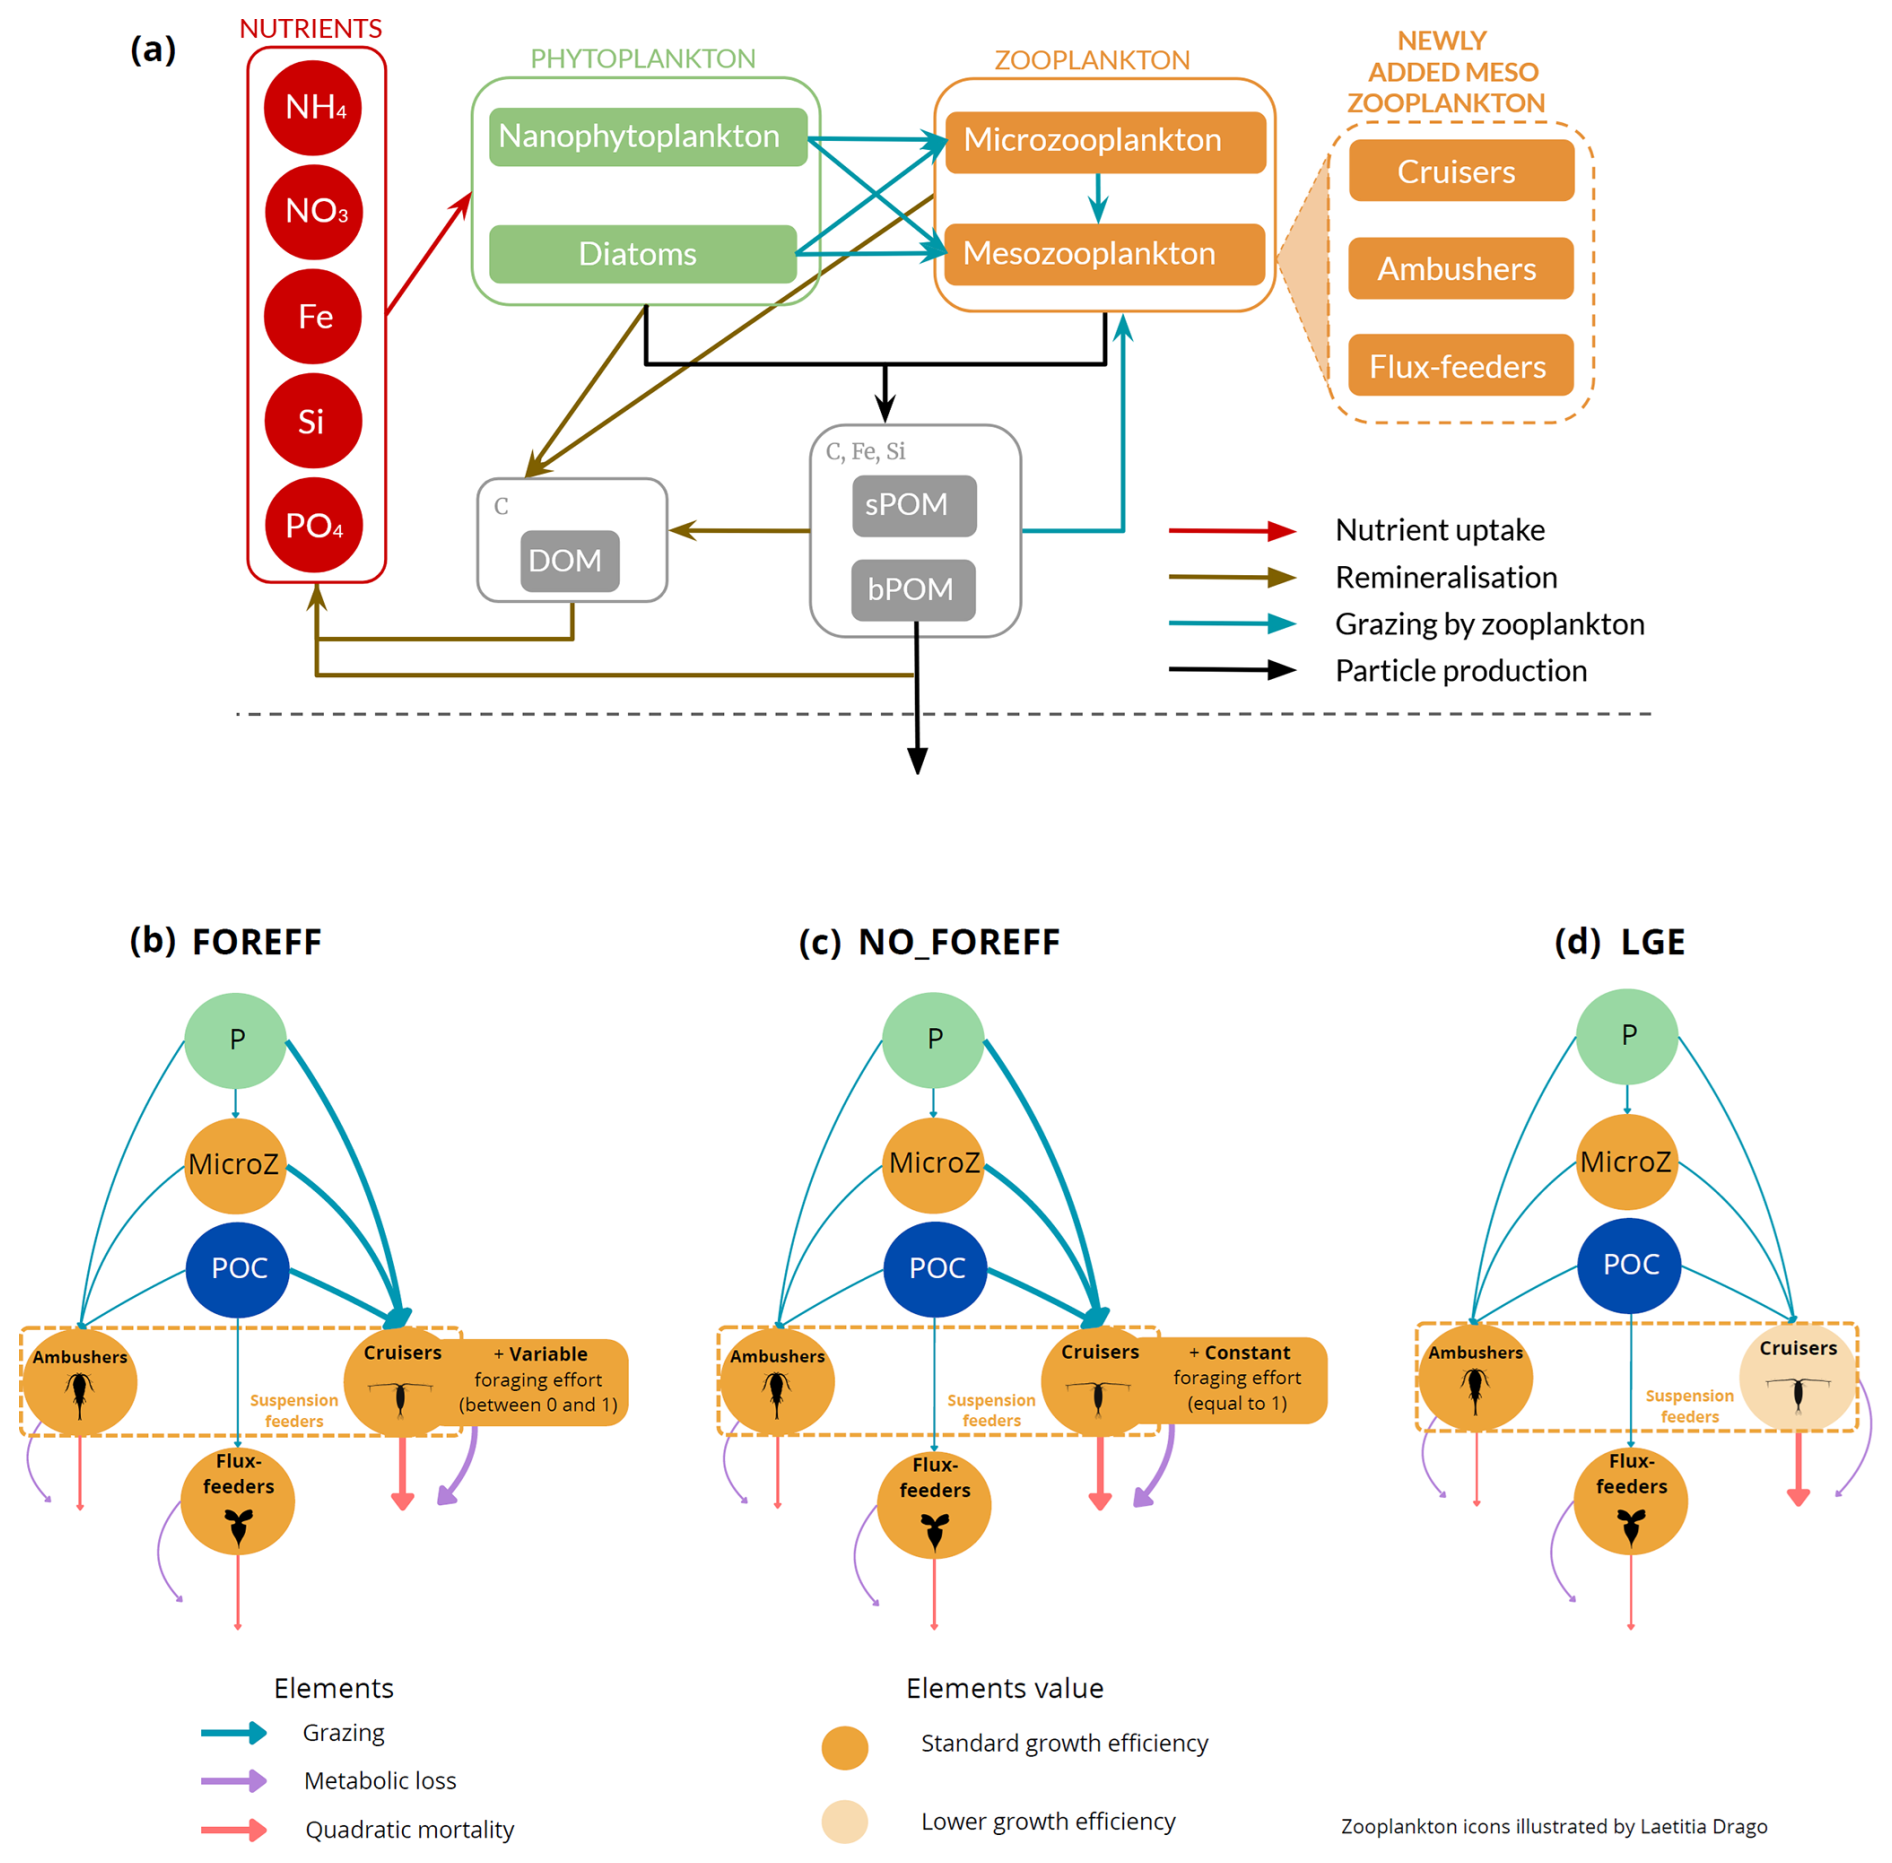
Figure 1(a) Architecture of the PISCES biogeochemical model, omitting the oxygen and the carbonate system for the sake of clarity. In the FOREFF (FORaging EFFort) configuration presented in this study, three mesozooplankton functional groups are considered. They are represented in the top right corner of the figure. POM is for particulate organic matter and DOM is for dissolved organic matter. Figure adapted from Aumont et al. (2015). (b) FOREFF reference configuration, (c) NO_FOREFF experiment, and (d) LGE experiment. The thickness of the lines account for the intensity of the grazing rate or flux-feeding rate (blue), metabolic loss parameter (purple) and quadratic mortality parameter (red). The transparent orange shading for cruisers in LGE (d) accounts for the lower growth efficiency . NO_FOREFF (c) is the same as FOREFF (b) but with a constant foraging effort equals to 1. P stands for phytoplankton, MicroZ for microzooplankton and POC for particulate organic carbon.
The ocean dynamics simulated by NEMO is used as forcing to the PISCES model. PISCES simulates marine biological productivity, plankton dynamics and biogeochemical fluxes. The standard version (PISCES-STD) includes 24 prognostic variables with five nutrients (i.e. nitrate, silicate, phosphate, ammonium and iron) and four plankton compartments: two phytoplankton groups (diatoms and nanophytoplankton) and two zooplankton size-classes: microzooplankton and mesozooplankton. PISCES-STD integrates a detailed representation of the biogeochemical cycles of carbon, dissolved and particulate organic matter (with two size classes: sPOC for the carbon content of small organic particles (1–100 µm) and bPOC for the carbon content of big organic particles (100–5000 µm), total alkalinity and dissolved oxygen Aumont et al., 2015). In PISCES-STD, phytoplankton growth is constrained by light availability, temperature, and nutrients (N, P, Fe, and Si) concentrations. Phytoplankton and small organic particles are consumed by both zooplankton groups and mesozooplankton additionally feed on microzooplankton and large particles. PISCES-STD considers mesozooplankton as a single PFT, where the flux-feeding mode is implicitly accounted for in addition to the explicit representation of suspension feeding (Aumont et al., 2015): mesozooplankton are parametrized as a single population with a proportion of flux-feeders that is calculated as the ratio of flux-feeding to total mesozooplankton grazing and has a Holling type II functional response.
In this study, we chose to represent three PFTs for the mesozooplankton compartment, with distinct feeding strategies to differentiate active organisms from passive ones, while also differentiating suspension feeders from flux-feeders (Fig. 1). Compared to PISCES-STD, we explicitly modelled a flux-feeding mesozooplankton compartment and further separated the suspension feeding mesozooplankton into two separate compartments: active cruise-feeders and passive ambush-feeders. Cruisers (also called cruise-feeders, CF) account for both cruise feeders sensus stricto and feeding-current feeders, though we do not explicitly distinguish between the two of them in our study, as their diets are assumed identical here (Kiørboe, 2011). From this point on, we refer to them as cruisers–organisms that actively swim or generate feeding currents to encounter prey and mates, similar to calanoid copepods (Kiørboe, 2011). This active behaviour increases predation risk but also enhances the likelihood of encountering prey items (Kiørboe, 2011; Kiørboe et al., 2015; Serra-Pompei et al., 2020).
Ambushers (AF) are organisms that adopt a sit-and-wait strategy (Kiørboe, 2011; Almeda et al., 2018). They wait motionless for motile prey items to pass within their reach or they capture their prey directly colliding with them (Almeda et al., 2018). Despite having a lower feeding efficiency and lower probabilities of finding mates, this strategy has the advantage of a much lower mortality rate (up to an order of magnitude; Van Someren Gréve et al., 2017) as well as lower metabolic expenses (Kiørboe et al., 2015). In our study, we do not distinguish between active ambushers that capture their preys by active attacks (Kiørboe, 2011), like Oithonid copepods and chaetognaths, and passive ambushers that passively capture their prey, like ctenophores or foraminifera.
Flux-feeders (FF) are predominantly passive organisms, such as pteropods (but they could also represent active feeders like copepods of the Temora and Oncaea genera), that feed on rapidly sinking organic particles (Stukel et al., 2019). They inhabit the interface between the euphotic zone and deeper waters, acting as “gatekeepers” of the mesopelagic zone by regulating carbon transfer in the water column (Stukel et al., 2019). This feeding strategy also contributes to lower mortality rates and higher growth efficiency.
In the new configuration developed in this study, called FOREFF (for FORaging EFFort), the three main feeding strategies of mesozooplankton are considered, each of them being represented by one PFT. Their dynamics follows Eq. (1):
In this equation, MX represents the mesozooplankton biomass of one of the three newly modelled feeding groups X (AF, CF, and FF) based on a Michaelis–Menten parameterization with no switching and a threshold, to avoid extinction of mesozooplankton at very low food concentration (Aumont et al., 2015). The first right-hand term represents growth, where σunass is the non-assimilated fraction of ingested food, is the growth efficiency, represents the ingested matter by mesozooplankton, is the temperature dependence and Δ(O2) is an oxygen factor. A full description of the equations for is provided in the Appendix A2. The second term represents mesozooplankton metabolic losses due to basal respiration and swimming activity, at a rate and where Km is a half-saturation constant. The last term represents mortality by density-dependent processes such as predation and diseases, with the quadratic mortality coefficient . Here we choose a formulation of quadratic mortality corresponding to predation by a generalist predator: the predation pressure on one group depends on the total mesozooplankton biomass. Consequently, the more advantageous a strategy is in a given region, the more it tends to outcompete and exclude alternative strategies. A full description of the parameters and their values is given in Table 1. Both suspension feeders feed indiscriminately on small living organisms and particulate marine snow, similar to the standard representation of mesozooplankton in Aumont et al. (2015). Only flux-feeders feed exclusively on particles, due to their feeding mode. All three terms have the same temperature dependence with a Q10 set to 2.14 (Aumont et al., 2015) and as we assume that mesozooplankton are unable to cope with anoxic waters, the growth rate and quadratic mortality are reduced and the metabolic losses are enhanced in oxygen depleted regions (Δ(O2), Aumont et al., 2015).
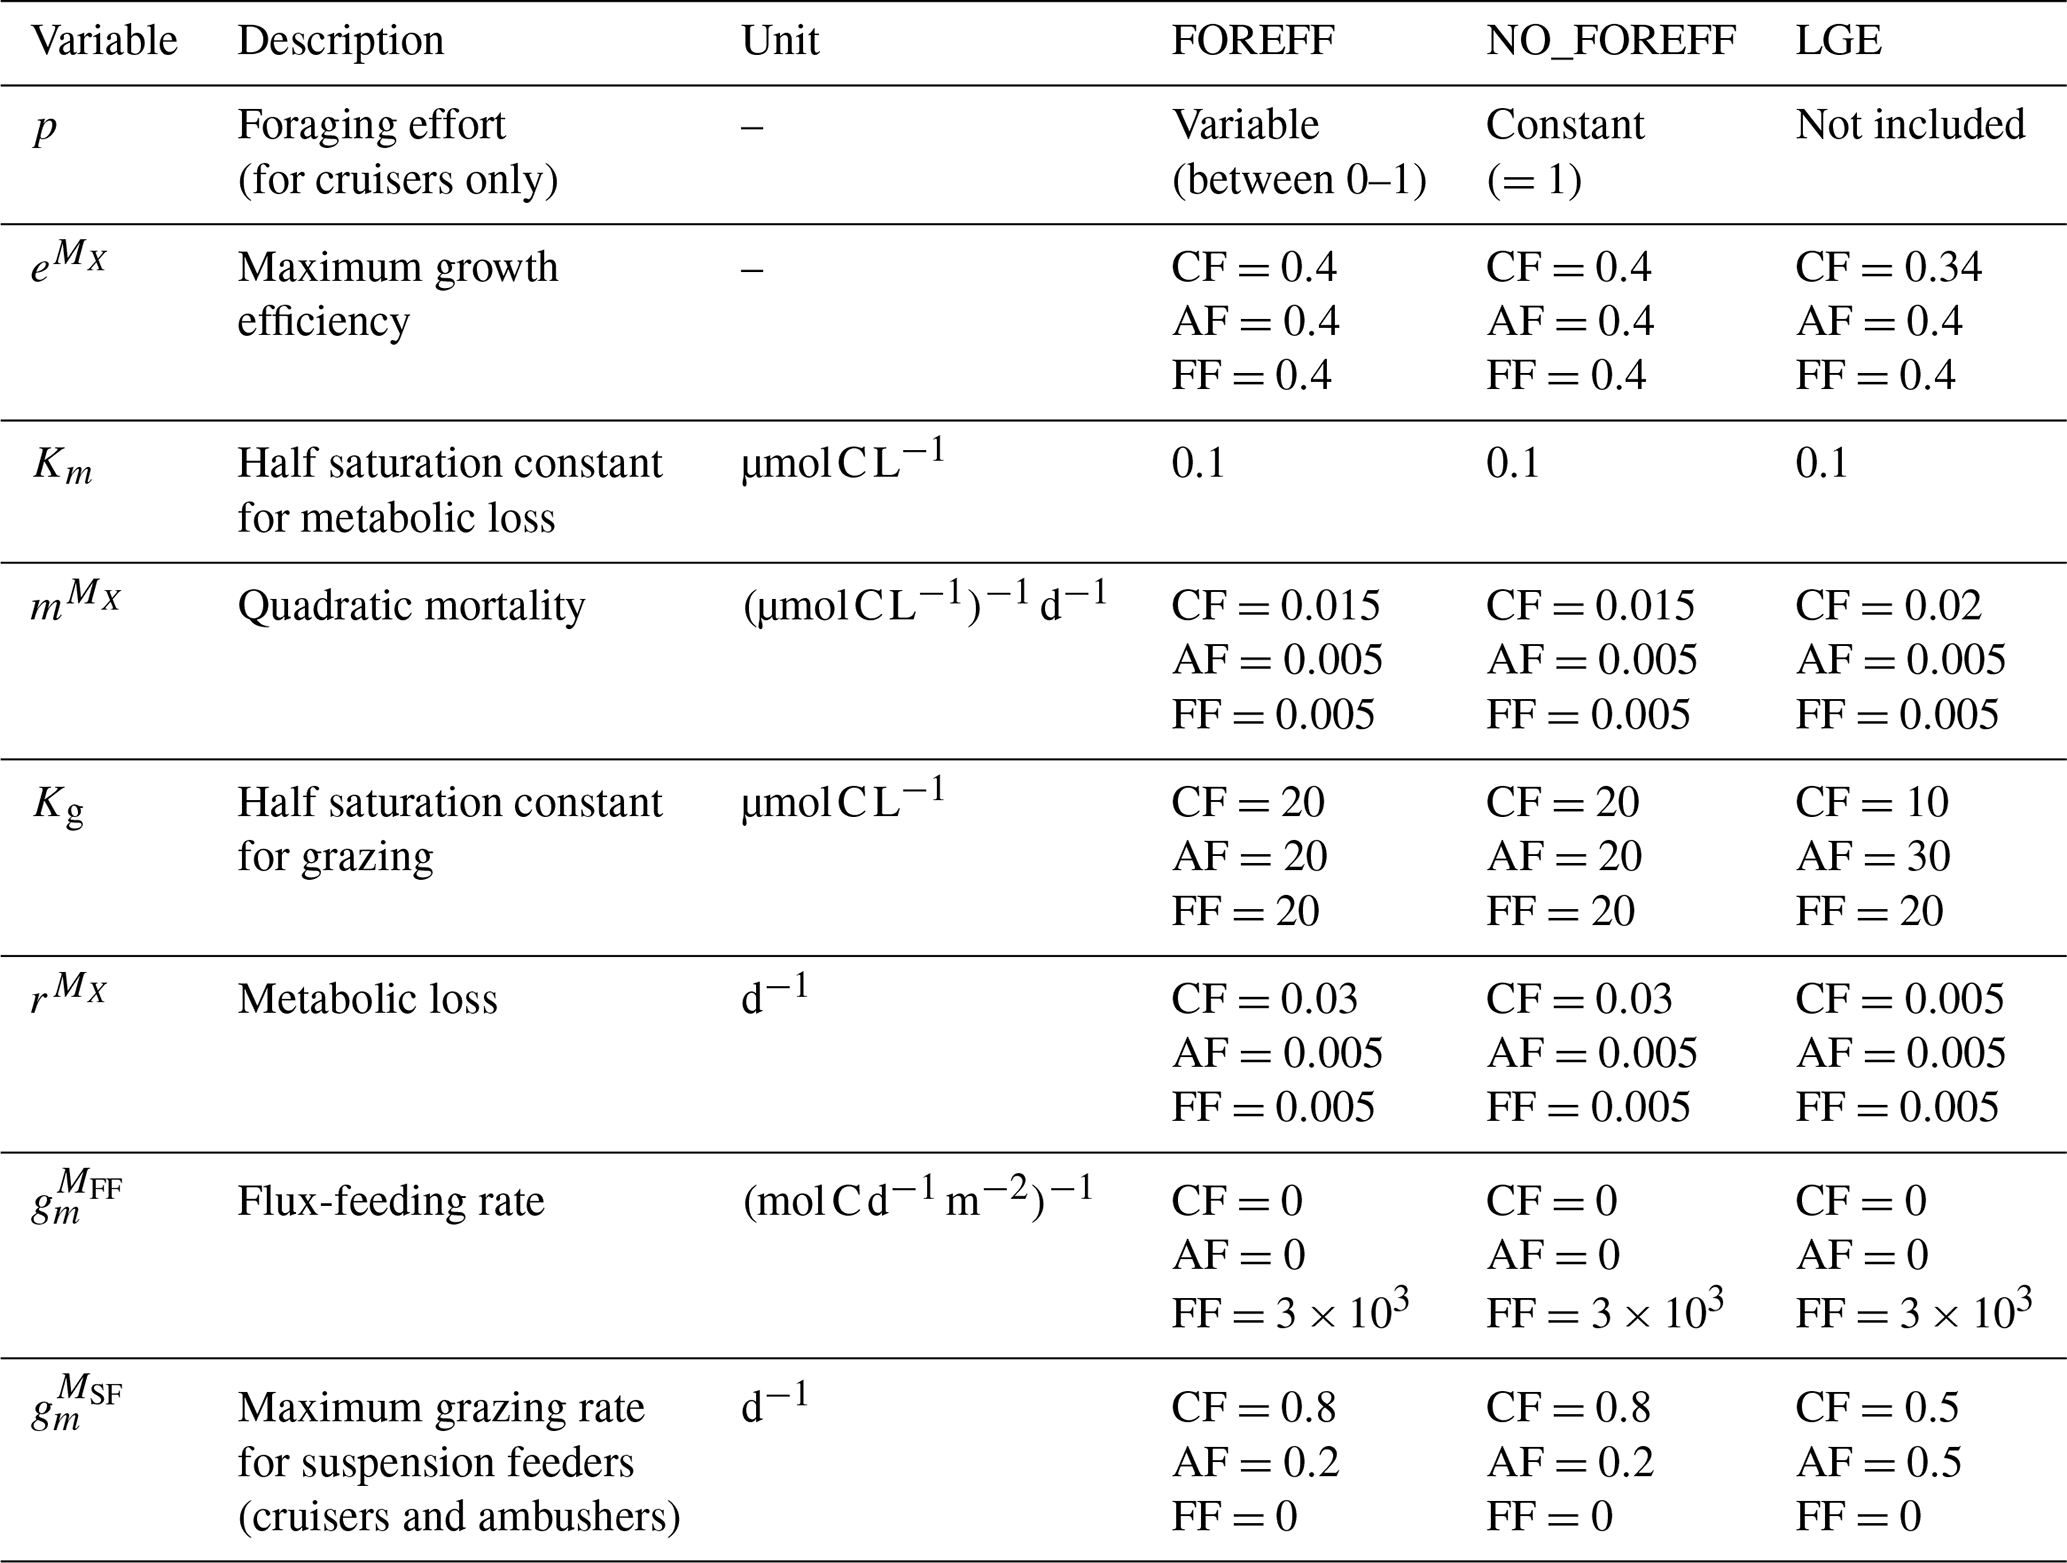
Table 1Parameters used in the equation for mesozooplankton dynamics in the new version of PISCES (FOREFF), the experiment with constant foraging effort (NO_FOREFF) and the modified values used for the LGE experiment (“Low Growth Efficiency” experiment, where the maximum grazing rate is similar for both suspension feeders (SF: cruisers and ambushers) and the growth efficiency is lower for cruisers). The parameters for FOREFF are also used for the KILL_AF, KILL_CF and KILL_FF (all three similar to FOREFF but one mesozooplankton group is killed in each) experiments. MX represents the mesozooplankton biomass of one of the three newly modelled feeding groups X: CF: cruisers, AF: ambushers, FF: flux-feeders.
In addition to the explicit representation of these three PFTs (Fig. 1), the FOREFF configuration implements a non-dimensional foraging effort p for active organisms (i.e. cruisers). The foraging effort p varies between 0–1 and represents an optimization of the fitness via the fraction of time spent foraging. The parameter is adapted from Kiørboe et al. (2018a) and implemented in Eq. (1) (see Appendix A2 for more details). It is based on the assumption that ambushers have an invariant foraging effort due to their passive behaviour, while cruisers may modify their swimming activity in response to prey abundance to reduce the cost and risk of searching for prey items and optimize their fitness (Tiselius et al., 1997; Kiørboe et al., 2018a). The foraging effort of cruisers varies in response to prey density (see Fig. 2 for the theoretical curve) in order to maximize their fitness, balancing food intake, predation risk, and the metabolic cost of searching for food (Kiørboe et al., 2018a; Werner and Anholt, 1993; van Someren Gréve et al., 2019). Thus, at high prey densities, cruisers reduce their foraging effort to lower both predation risk and metabolic expenditure, while at intermediate prey densities, the foraging effort reaches its maximum value of 1. At low prey densities, the foraging effort decreases, implying that cruisers no longer swim or swim very little but do not have access to food, so they eventually die. Moreover, the foraging effort is set to zero when the prey concentration falls below a minimum threshold concentration Rmin (see Eq. A10), as in Kiørboe et al. (2018a). In our case, this threshold is 1.56 mmol m−3, which corresponds to the minimum prey concentration at which the energetic gain from foraging offsets the maintenance costs of cruisers.
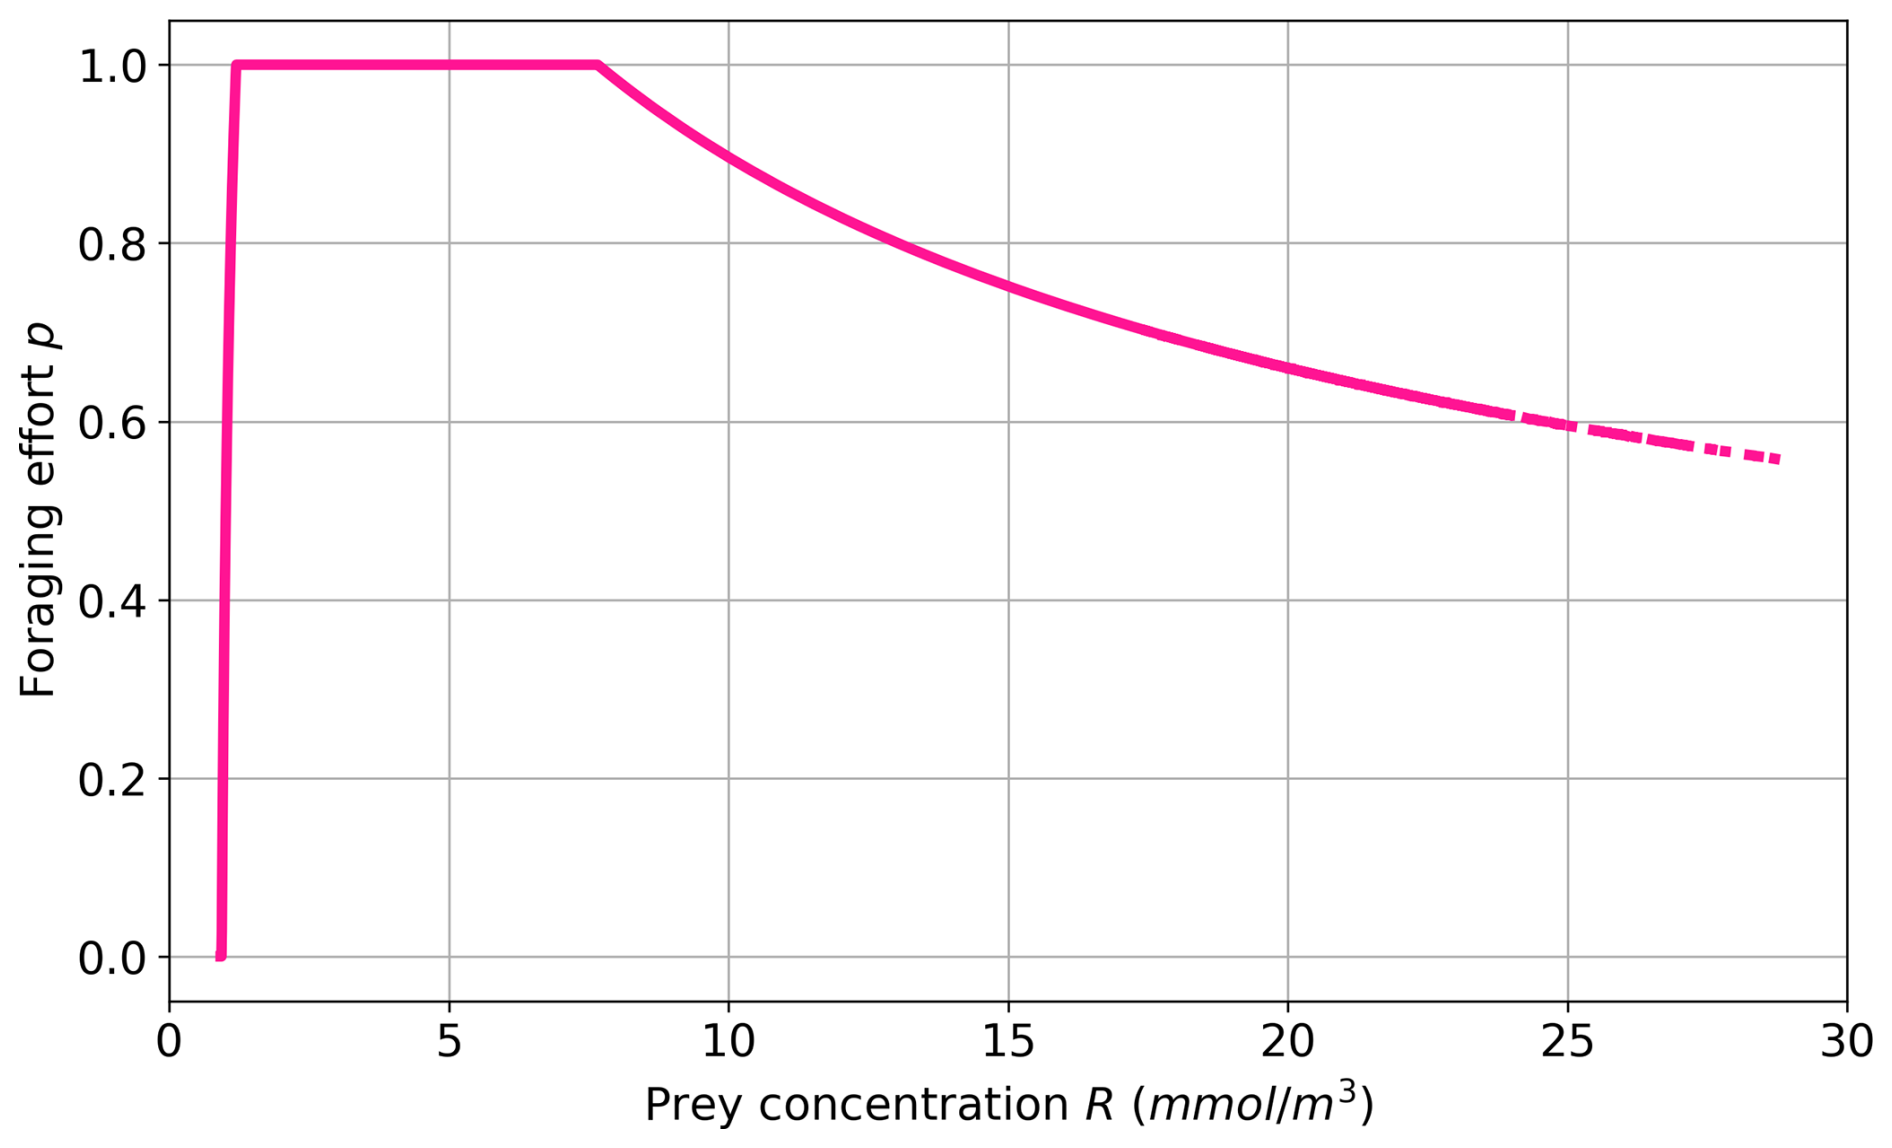
Figure 2Foraging effort vs. prey concentration based on the parameter set of FOREFF (Table 1).
To represent these feeding strategies and incorporate the foraging effort, model parameters (Table 1) are adjusted as follows to reflect trade-offs between growth, reproduction, and survival (Barton et al., 2013; Kiørboe et al., 2018a, 2015).
Since cruisers swim continuously to encounter prey items, they face a higher predation risk than ambushers (Kiørboe et al., 2015). Consequently, their quadratic mortality parameter is set three times higher than the one of ambushers (0.015 , Almeda et al., 2018; Van Someren Gréve et al., 2017, see Table 1). The metabolic losses parameter of cruisers is also set higher (0.03 d−1), to account for the increased energetic expenses due to active feeding (Eq. A4) introduced from Kiørboe (2011). Additionally, we differentiate the maximum grazing rates for cruisers and ambushers , based on the data analysis from Serra-Pompei et al. (2020). Higher maximum grazing rates are assigned to cruisers than ambushers (0.8 and 0.2 d−1, respectively).
2.2 Sensitivity experiments
Five sensitivity experiments were conducted to investigate the relative impact of feeding strategies and the effect of foraging effort on ocean biogeochemistry and ecosystem functioning. A visual representation of the various configurations and sensitivity experiments (FOREFF, NO_FOREFF, LGE and KILL_XX experiments) can be found in the Appendix A1.
The first experiment (i.e. NO_FOREFF) is carried out to investigate the impact of foraging effort. NO_FOREFF is the same as FOREFF except that cruisers have a foraging effort set to a constant value of one.
The second experiment (i.e. Low Growth Efficiency, LGE) is less similar to the basic FOREFF model as it is based on a different set of hypotheses and does not include a variable foraging effort for cruisers. In LGE, parameters are adapted to differentiate active and passive feeding strategies through their efficiency at capturing prey items (see Table 1). This experiment is set to study a different way to represent the trade-offs between the metabolic cost associated to swimming, grazing capacity and mortality from predation. In LGE, the feeding efficiency of cruisers is estimated to be three to ten times higher than the feeding efficiency of ambushers. Thus, their half-saturation constant for grazing (Kg) is set to 10 µmol C L−1 whereas that of ambushers is set to 30 µmol C L−1. Furthermore, active feeding is thought to increase metabolic losses by 15 %–25 % (Morris et al., 1985). We represent this process by decreasing the maximum growth efficiency of cruisers from 0.4 to 0.34 (Vlymen, 1970; Alcaraz and Strickler, 1988). The quadratic mortality for cruisers is set to be four times higher than for ambushers (0.02 , following Van Someren Gréve et al., 2017) to reflect higher predation risks inherent to cruise-feeding. Finally, we assume that the basal metabolism is the same for all groups, meaning that their respiration parameter is identical.
The last three experiments (i.e. KILL_AF, KILL_CF and KILL_FF) include the foraging effort for cruisers, have similar parameters to FOREFF (see Table 1) and are designed to eliminate one PFT, respectively ambushers, cruisers and flux-feeders, by setting their maximum grazing rate (or flux-feeding rate) to zero. This way, we are able to get more insights about the relative impact of each group on ecosystem dynamics and their contribution to the carbon cycle.
To characterize and compare the biogeography of the two suspension-feeding groups (cruisers and ambushers, Kiørboe, 2011) across experiments, a dominance index is defined based on their biomass MX (Eq. 2). This index is calculated at each time step and on every vertical level, then averaged over the year and the top 150 m. Positive values close to 1 indicate a dominance toward cruisers, negative values close to −1 signify a dominance toward ambushers, and values around 0 suggest a co-dominance of the two groups.
To evaluate how mesozooplankton feeding strategies impact biogeochemical fluxes, we focused on carbon export. We investigated carbon export at 150 and 1000 m (respectively C150 and C1000), and calculated the efficiency of carbon transfer from 150 to 1000 m (Eq. 3), which indicates how efficiently sinking organic matter is exported to the deep ocean.
2.3 Model setup
Simulations were run offline for 20 years using the coupled model NEMO-PISCES. The configuration and circulation are the same as in Aumont et al. (2015). We used the ORCA-2 global configuration of NEMO, which has a spatial horizontal resolution of 2° that increases to 0.5° latitudinal resolution at the equator. Along the vertical dimension, it has 31 vertical levels, with a thickness increasing from 10 m at the surface to 500 m at 5000 m. Nitrate, phosphate, silicate, and oxygen are initialized from the climatology of the World Ocean Atlas 2009 (Garcia et al., 2013, 2010), DIC and alkalinity from GLODAP-v1 (Key et al., 2004) and iron and DOC are initialized from an existing quasi-steady state simulation (Aumont et al., 2015).
2.4 Comparison with observations
The reference FOREFF simulation was evaluated against in situ data. To do so, we used the Biomass Distribution Models (BDM)-ensemble developed by Clerc (2024) in Clerc et al. (2024) that estimates monthly fields of mesozooplankton biomass for the global epipelagic ocean. Data from the monthly climatology from MAREDAT (MARine Ecosystem DATa, Buitenhuis et al., 2013) re-gridded on the ORCA2 grid and integrated over the top 200 m was used to train the BDMs pipeline. Monthly satellite data from the Ocean Colour Climate Change Initiative project (OC-CCI, Sathyendranath et al., 2019) were re-gridded on the ORCA2 grid, and are used to evaluate the surface fields of chlorophyll a concentration. The modelled fields of mesozooplankton biomass were annually averaged and integrated over 200 m. For surface chlorophyll, a mask corresponding to the seasonal lack of data is applied to the modelled data.
Field-based estimates of global biomass are lacking for the three mesozooplankton PFTs (Buitenhuis et al., 2013). Therefore we have evaluated the quality of our PFT-specific fields against observations in a more indirect fashion. To do so, we used the global distribution maps of copepod functional groups published by Benedetti et al. (2023). Benedetti et al. (2023) defined eleven functional groups (FGs) based on five species-level functional traits (i.e. body size, trophic group, feeding mode, myelination and spawning mode) and modelled the distribution of these groups across the global surface ocean based on field occurrences and species distribution models. The maps of Benedetti et al. (2023) estimate where the environment is most suitable for the copepod functional groups to be present or not (i.e. habitat suitability indices). They do not aim to represent actual biomass patterns, but they are useful to compare the biogeography of copepod PFTs based on in situ observations. Here, we focused on the copepod functional groups that best correspond to the suspension feeders (cruisers and ambushers) we modelled. The following functional groups (FG) of Benedetti et al. (2023) were used to evaluate the biogeography of our cruisers: FG1 (small, myelinated cruise-feeding herbivores), FG5 (medium size, current/cruise-feeding carnivores) and FG6 (large myelinated current-feeding herbivores). For ambushers, we considered: FG4 (small, amyelinated ambush-feeding carnivores), FG8 (small, amyelinated ambush/current-feeding carnivores) and FG10 (large, amyelinated ambush-feeding omnivores). For both cruisers and ambushers, we pooled together and summed the habitat suitability indices of their corresponding copepod functional groups and then calculated the dominance index following Eq. (2). This way, we obtained a map of the dominance index that is comparable to the one based on our model projections for the global surface ocean.
3.1 Global distribution of mesozooplankton and chlorophyll
Our modelled fields of mean annual total mesozooplankton biomass concentration and surface chlorophyll concentration are in line with observations (Fig. 3). The Pearson correlation coefficient between observed and modelled mesozooplankton biomass concentration is equal to 0.49 (see Table 2). Regions of high mesozooplankton biomass concentrations are correctly simulated although biomass is slightly overestimated compared to observations (Fig. 3a and c), which is indicated by a positive bias (+0.05 mmol m−3, Table 2). The modelled mean annual mesozooplankton biomass concentration is coherent with previous studies, where higher concentrations are found in the subpolar regions such as in the Northern Atlantic and Pacific oceans (Strömberg et al., 2009; Serra-Pompei et al., 2022; Drago et al., 2022).
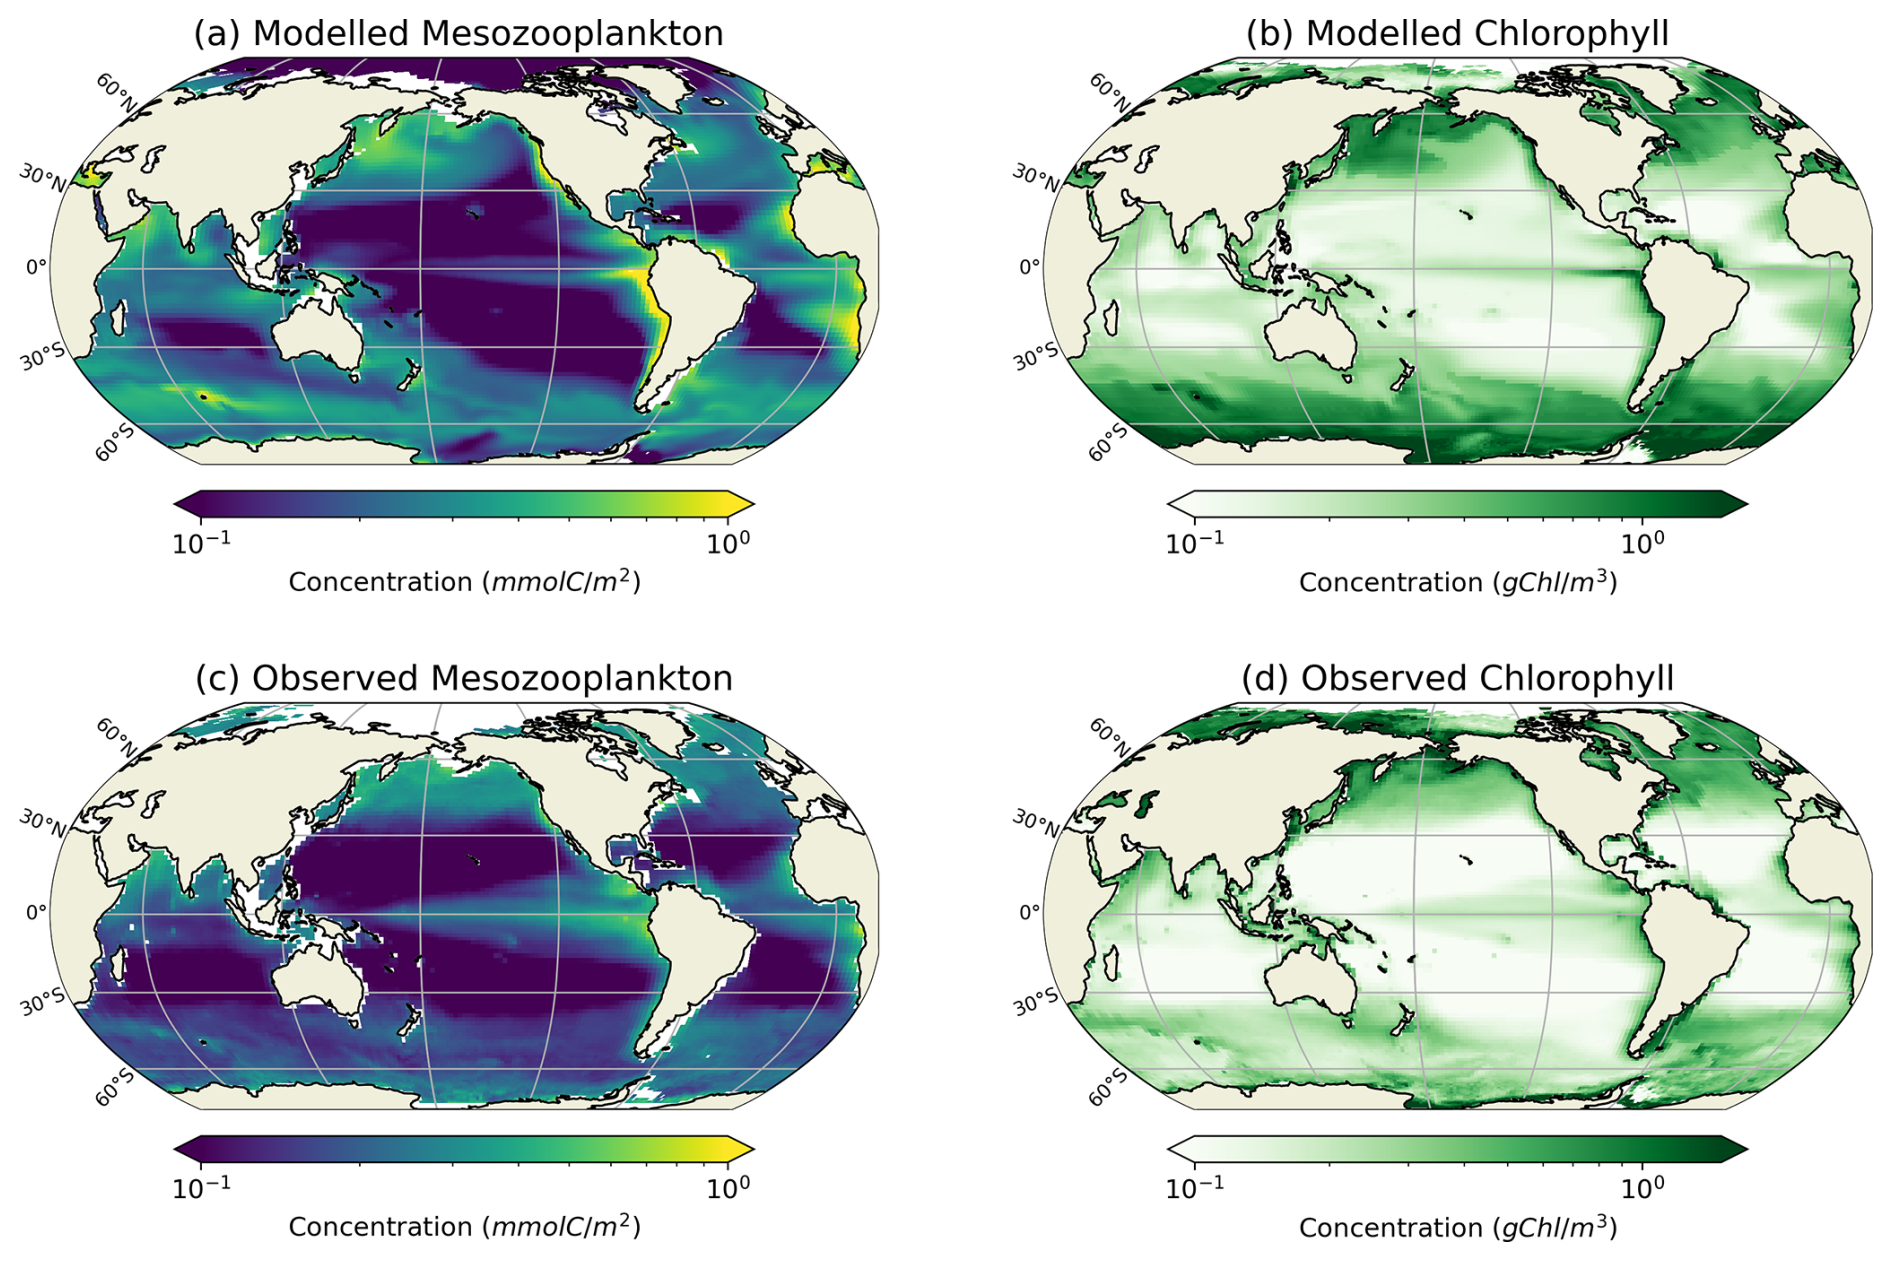
Figure 3Comparison between modelled (a, b) and observed (c, d) log-scaled mean annual mesozooplankton biomass concentration integrated over the top 200 m and mean annual surface chlorophyll concentration. (a) Total modelled mesozooplankton concentration, (b) modelled chlorophyll, (c) observed mesozooplankton biomass obtained from the BDM pipeline trained on the MAREDAT annual climatology made by Clerc et al. (2024), and (d) observed chlorophyll concentration from OC-CCI (ESA). Mesozooplankton biomass are expressed in mmol C m−3 and chlorophyll concentration in g Chl m−3.
Table 2Statistics of the comparison of our modelled fields of mesozooplankton and phytoplankton (i.e. chlorophyll) biomass concentration against observations on a global mean annual scale. Mesozooplankton biomass observations were sourced from the annual climatology made by Clerc et al. (2024) and based on MAREDAT. Surface chlorophyll biomass observations were sourced from the Ocean Colour Climate Change Initiative (OC-CCI) data. Mesozooplankton was integrated over 200 m.
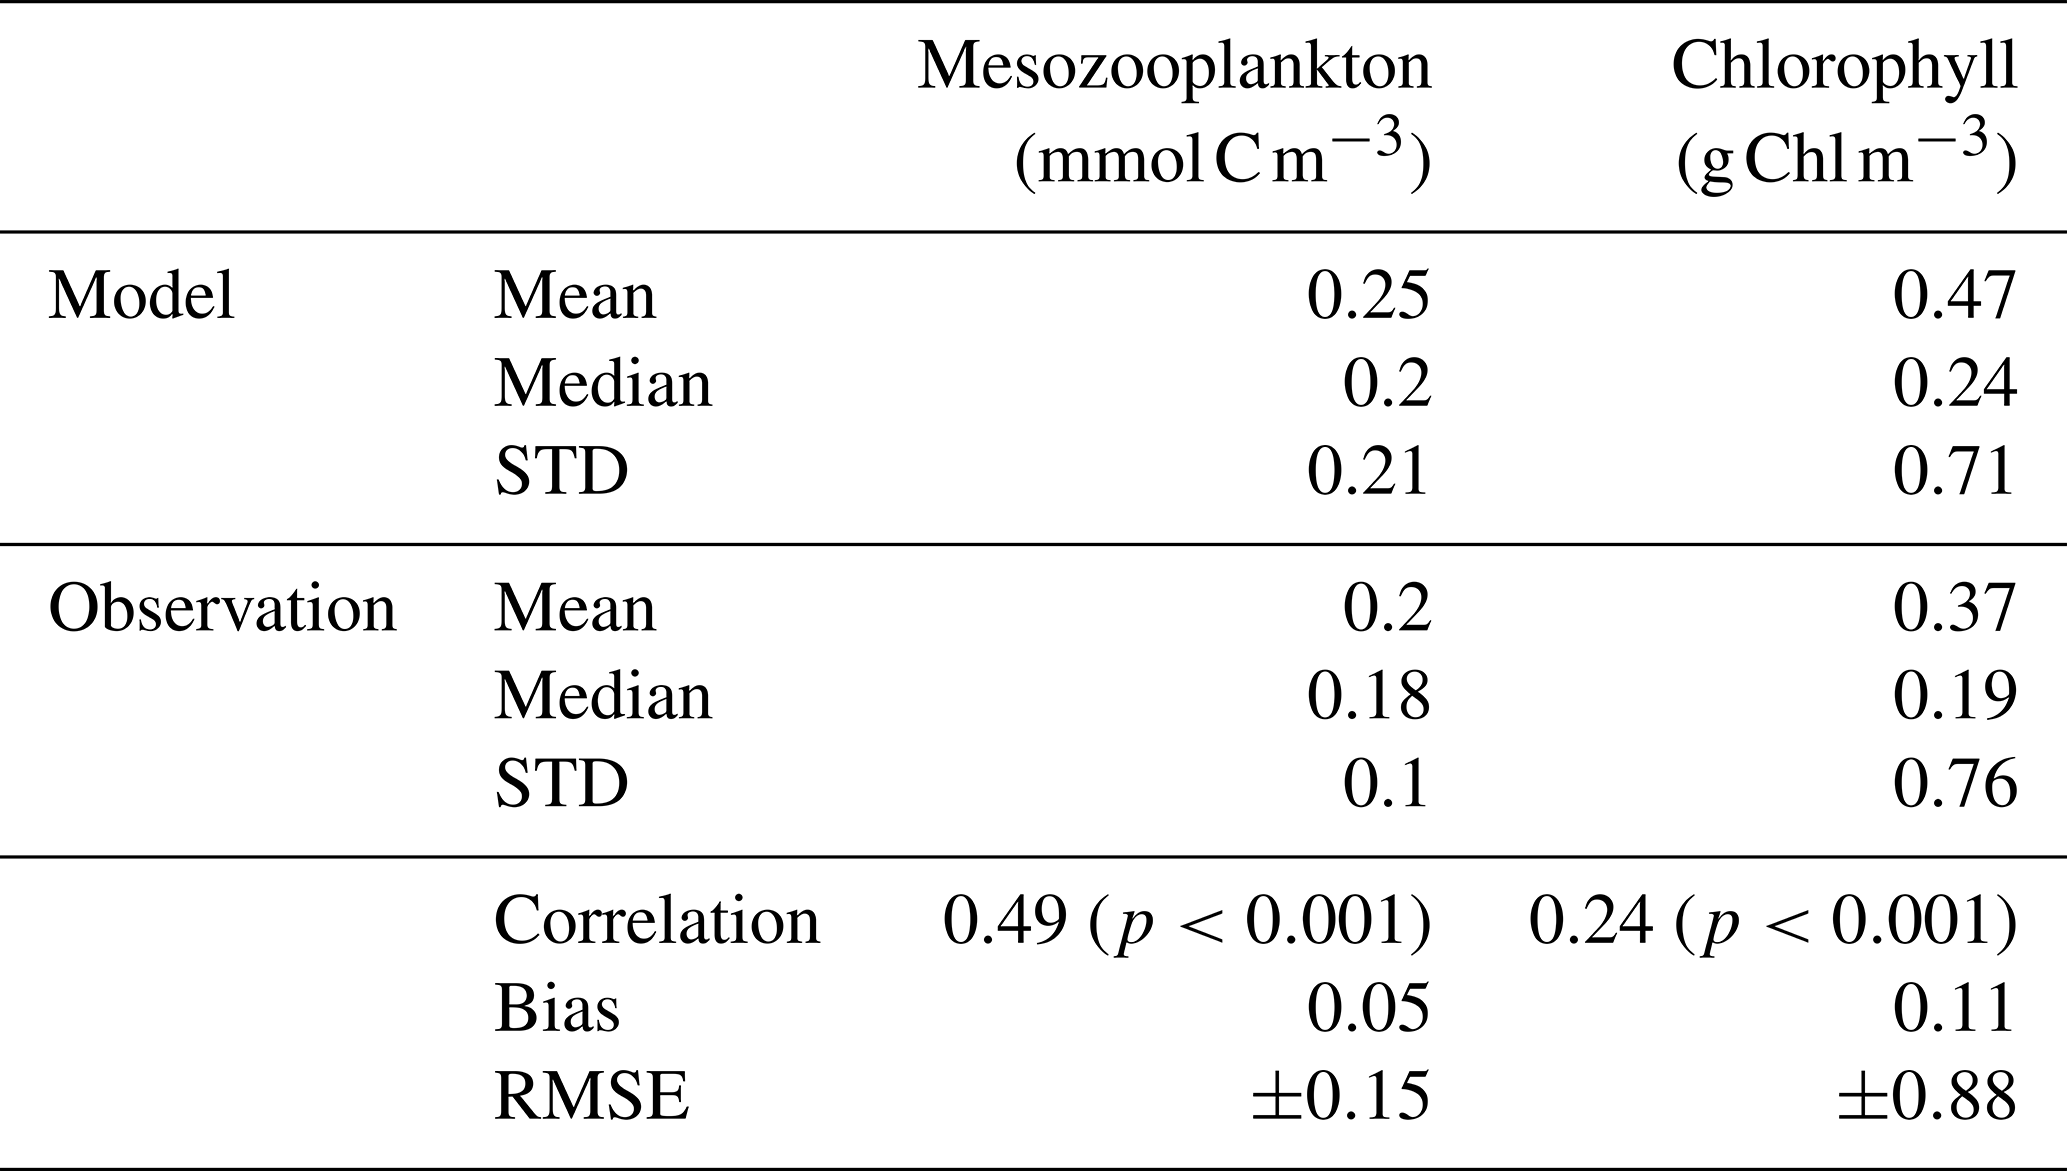
Our model also reproduces the regions of high phytoplankton biomass (Pearson correlation coefficient =0.24) although it overestimates the concentration of surface chlorophyll as evidenced by a positive bias (+0.11 g Chl m−3, Table 2), especially in the Southern Ocean (Fig. 3b).
3.2 Mesozooplankton biomass and biogeography
3.2.1 Global modelled biomass and mesozooplankton grazing
The total integrated plankton biomass within the first 150 m is estimated at 1.25 Gt C, with mesozooplankton accounting for 16 % of this total biomass (0.2Gt C) and primary producers contributing to 42.7 %. The predicted mesozooplankton biomass is consistent with previous estimates, which report values of approximately 0.19 Gt C (Moriarty and O'Brien, 2013) or 0.12±0.07 Gt C (Liu et al., 2024) for the upper 200 m (in our study, the total mesozooplankton biomass over this depth range is estimated at 0.24 Gt C). Ambushers are the dominant mesozooplankton group at global scale (Fig. 4b), representing 54.8 % of total mesozooplankton, with a simulated integrated biomass of 0.11 Gt C and a mean global concentration of 0.154 mmol C m−3 over the top 150 m. Flux-feeders are especially abundant in coastal regions (Fig. 4c, with an integrated biomass of 0.06 Gt C and a mean global concentration of 0.077 mmol C m−3), and cruisers are only present in productive regions and at high latitudes (Fig. 4a). Their integrated biomass over the top 150 m is significantly lower (0.03 Gt C, with a mean concentration of 0.093 mmol C m−3) and remains consistently below the average biomass of ambushers, no matter the depth layer. Over the top 500 m, we find a total integrated mesozooplankton biomass of 0.36 Gt C, which is 11.7 % lower than the biomass estimated by Drago et al. (2022) from in situ imaging (0.403 Gt C over the top 500 m). Over this layer, our model predicts that flux-feeders are the most abundant group (integrated biomass of 0.19 Gt C against 0.12 Gt C for ambushers and 0.04 Gt C for cruisers), reflecting their increasing abundance in deeper waters.
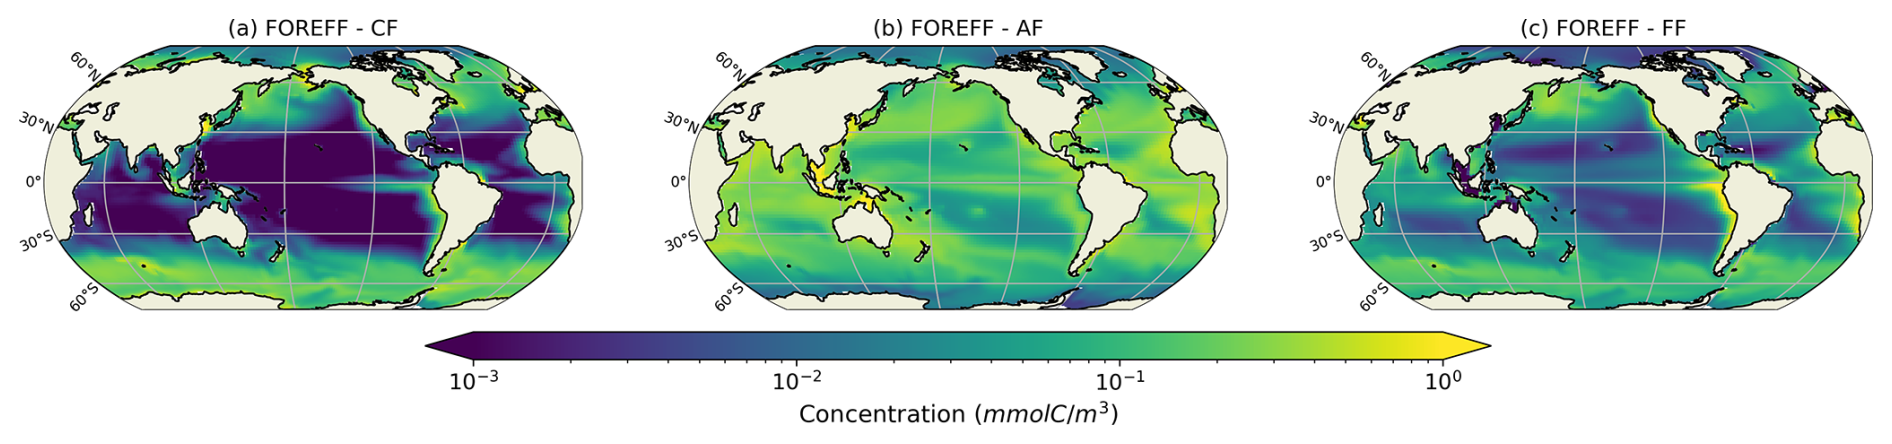
Figure 4Log scale annual mean concentrations of the mesozooplankton feeding strategies (cruisers: CF, ambushers: AF and flux-feeders: FF) for the different experiments averaged over the top 150 m.
The globally integrated total mesozooplankton grazing in the top 150 m amounts to 7.91 Gt C yr−1, with ambushers contributing to 52 % of this amount (Fig. 5 and see Table 3), in line with their larger abundance at global scale (Fig. 4b). This estimate of the total grazing falls within the range reported by similar studies, including 5.5 Gt C yr−1 (Calbet, 2001), 11.2 Gt C yr−1 (Aumont et al., 2015), and the range provided by Hernández-León and Ikeda (2005) (). Grazing by flux-feeders is highest below the euphotic layer, consistent with their feeding behaviour (Stukel et al., 2019). Although their integrated global biomass in the top 150 m is only 0.06 Gt C, it peaks around 150 m depth, surpassing the biomass of suspension feeders (cruisers and ambushers) below 100 m, as previously noted. This is further highlighted by their greater grazing below 100 m, which remains higher than that of suspension feeders at all depths below 100 m (Fig. 5, yellow curve).
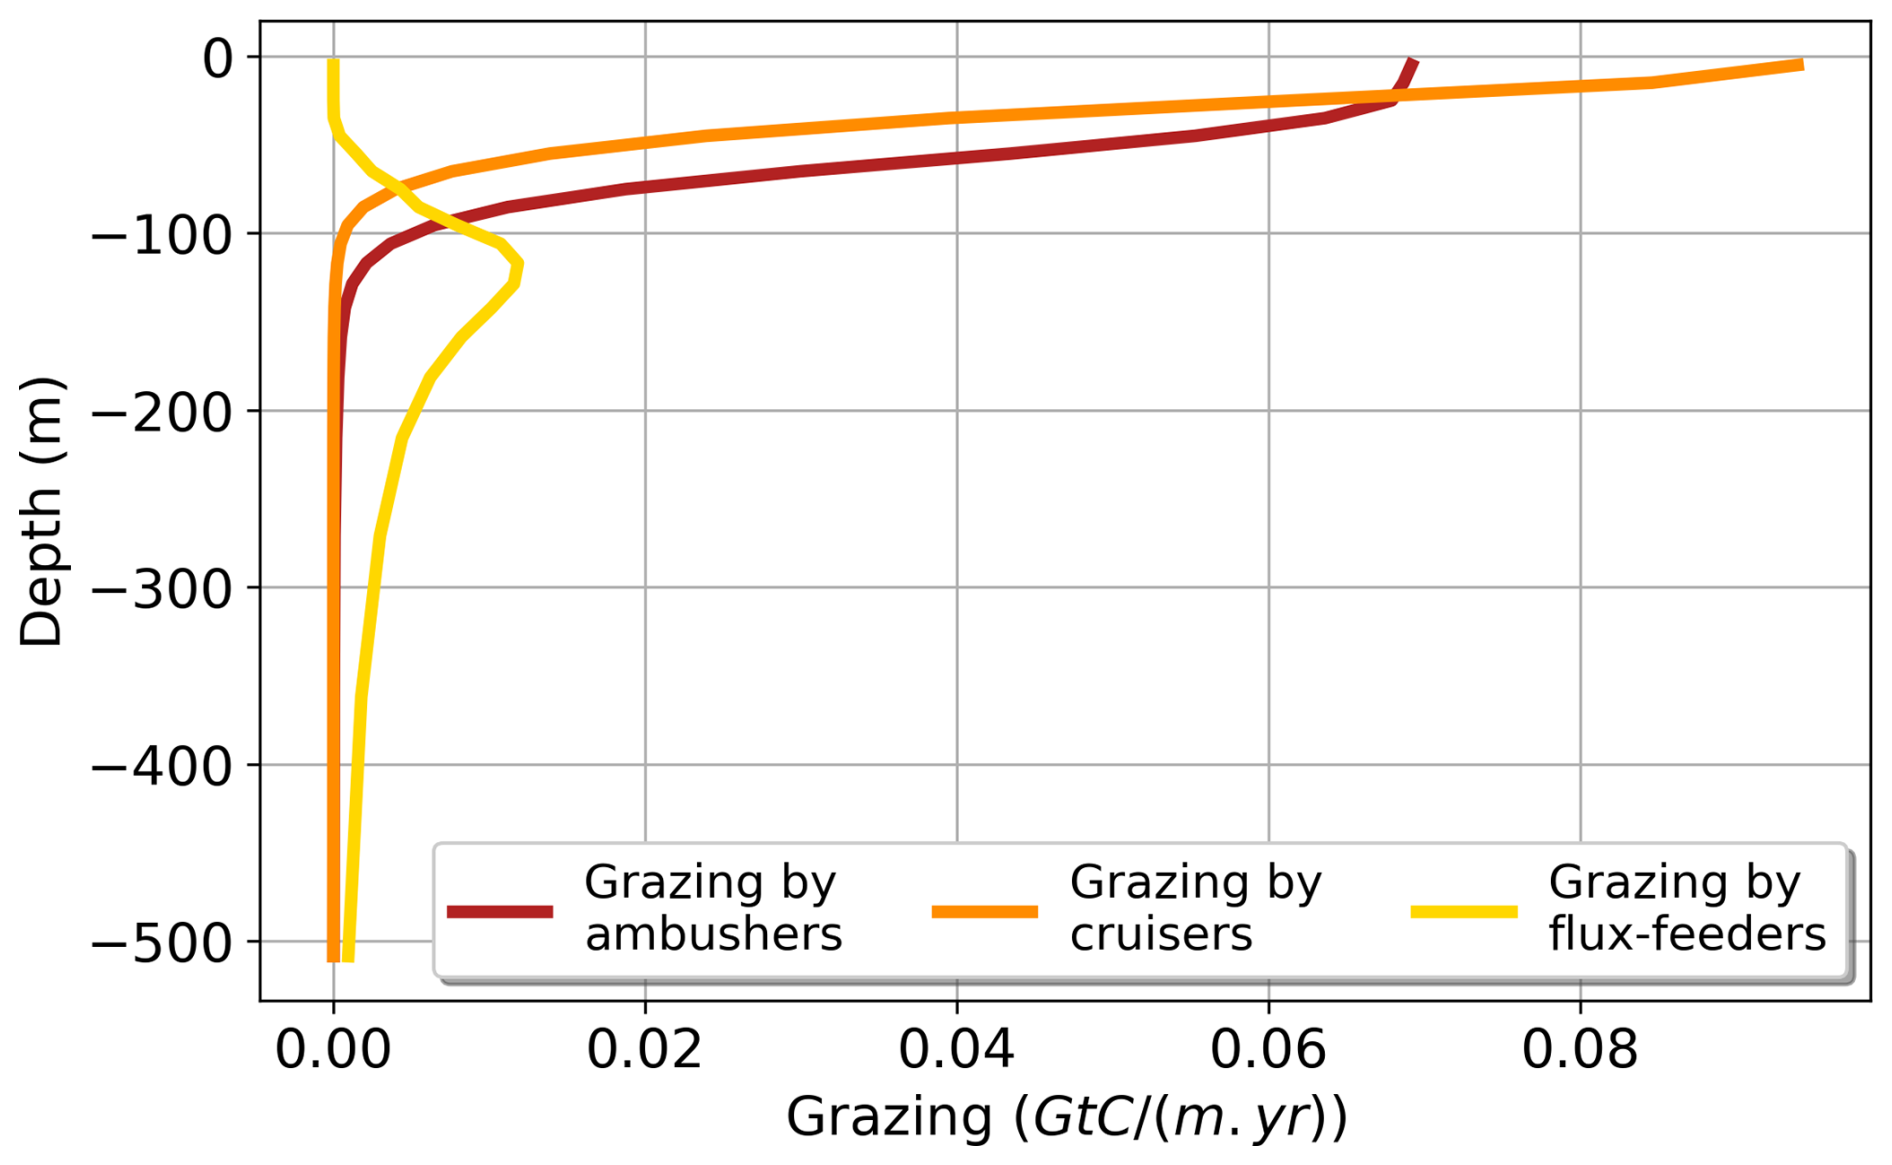
Figure 5Annual mean of the modelled grazing rate (Gt C (m yr)−1) of the different mesozooplankton groups (ambushers in red, cruisers in orange, and flux-feeders in yellow) along the vertical dimension from 0 to 500 m deep.
In the upper 30 m, cruisers exhibit higher grazing rates than ambushers (0.08 Gt C (m yr)−1 for cruisers and 0.07 Gt C (m yr)−1 for ambushers; Fig. 5, red and orange curves) despite their lower integrated biomass (0.04 Gt C for ambushers and 0.02 Gt C for cruisers). This result is consistent with the higher maximum grazing rates assigned to cruisers with respect to ambushers (see Table 1). Nevertheless, the higher grazing rates of cruisers are insufficient to offset their higher metabolic needs and higher mortality by predation, which explains their overall lower global biomass.
3.2.2 Biogeography of suspension feeders (cruisers and ambushers)
We focus here on the biogeography of the two groups of suspension feeders (ambushers and cruisers, Fig. 6a and d) in the top 150 m. As they feed on prey items in suspension in the water column, cruisers and ambushers are found in the surface layers where their prey are the most abundant overall (Fig. 5 red and orange curves). The spatial distribution of both groups appears to be broadly consistent with the literature (Benedetti et al., 2023): cruisers dominate over ambushers at high latitudes and in the very productive regions, such as the Eastern Boundary Upwelling systems (e.g. the Humboldt and Benguela current Systems). In contrast, ambushers are the most abundant at lower latitudes in regions characterized by weak seasonality and low nutrients concentrations (Figs. 6a and d and 4 for mesozooplankton concentrations). When zonally averaged over the top 150 m, there is no significant vertical variation in the dominance patterns between the two feeding mode groups (Fig. 6d). Thus, when one group dominates at the surface, it also dominates throughout the entire euphotic layer. The trade-offs that control the two suspension feeding modes drive the emergent biogeography highlighted above. The passive behaviour of ambushers results in a lower grazing rate but also reduced energy expenditure from swimming and much lower predation mortality. This allows them to thrive in regions of low productivity, compared to cruisers. In contrast, cruisers face higher predation risks and increased energetic costs due to their continuous swimming behaviour. To offset these drawbacks, they rely on a higher grazing rate, which leads to greater food intake, allowing them to thrive in more productive regions, such as in high latitudes (Fig. 6a).
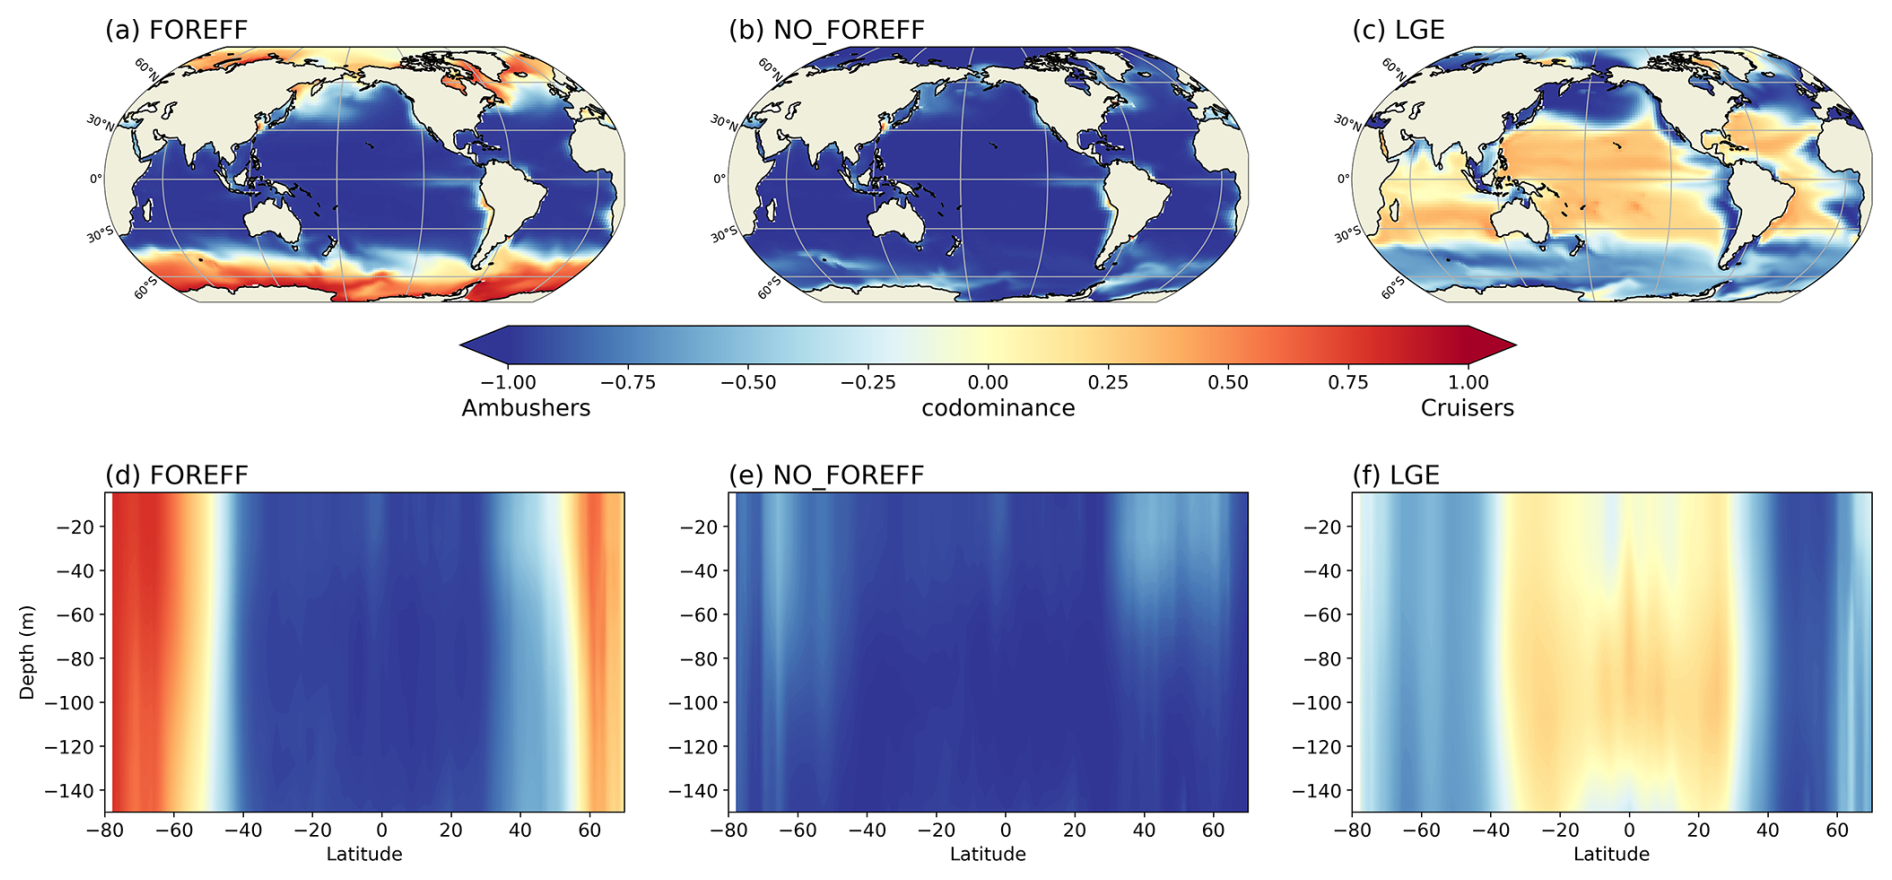
Figure 6Annual mean of the dominance index between cruisers (CF) and ambushers (AF), averaged over 150 m (a–c) and zonally averaged (d–f) for the different experiments: (a, d) reference (FOREFF), (b, e) constant foraging effort (NO_FOREFF), and (c, f) same growth rate for suspension feeders but lower growth efficiency for cruisers (LGE).
3.3 Distribution of foraging effort for active suspension feeders (cruisers) and seasonality of suspension feeders (cruisers and ambushers)
In addition to explicitly modelling cruisers, ambushers, and flux-feeders, the main novelty of our study is to model the foraging effort of cruisers which represents the effort invested into searching for prey items as a function of their availability. As active behaviours account for a higher predation risk, this foraging effort is also an asset to increase their overall fitness, while avoiding predators (Kiørboe, 2024).
Figure 7a illustrates the foraging effort of cruisers averaged over the top 150 m. Consistent with Fig. 2, the foraging is zero in highly oligotrophic regions. This suggests that cruisers would decrease or cease their foraging and eventually die in the least productive regions, such as the subtropical gyres, due to insufficient prey availability to meet their metabolic needs. The impact on cruisers concentration has been shown on Fig. 6a, where ambushers completely outclass cruisers in regions of low productivity (see also Fig. 4a). The foraging effort peaks around one in regions with intermediate productivity to maximize ingestion and declines in areas of high prey concentrations. In very productive regions, the decrease in foraging effort suggests that cruisers are able to save energy and reduce their predation risk while benefiting from abundant prey concentrations.
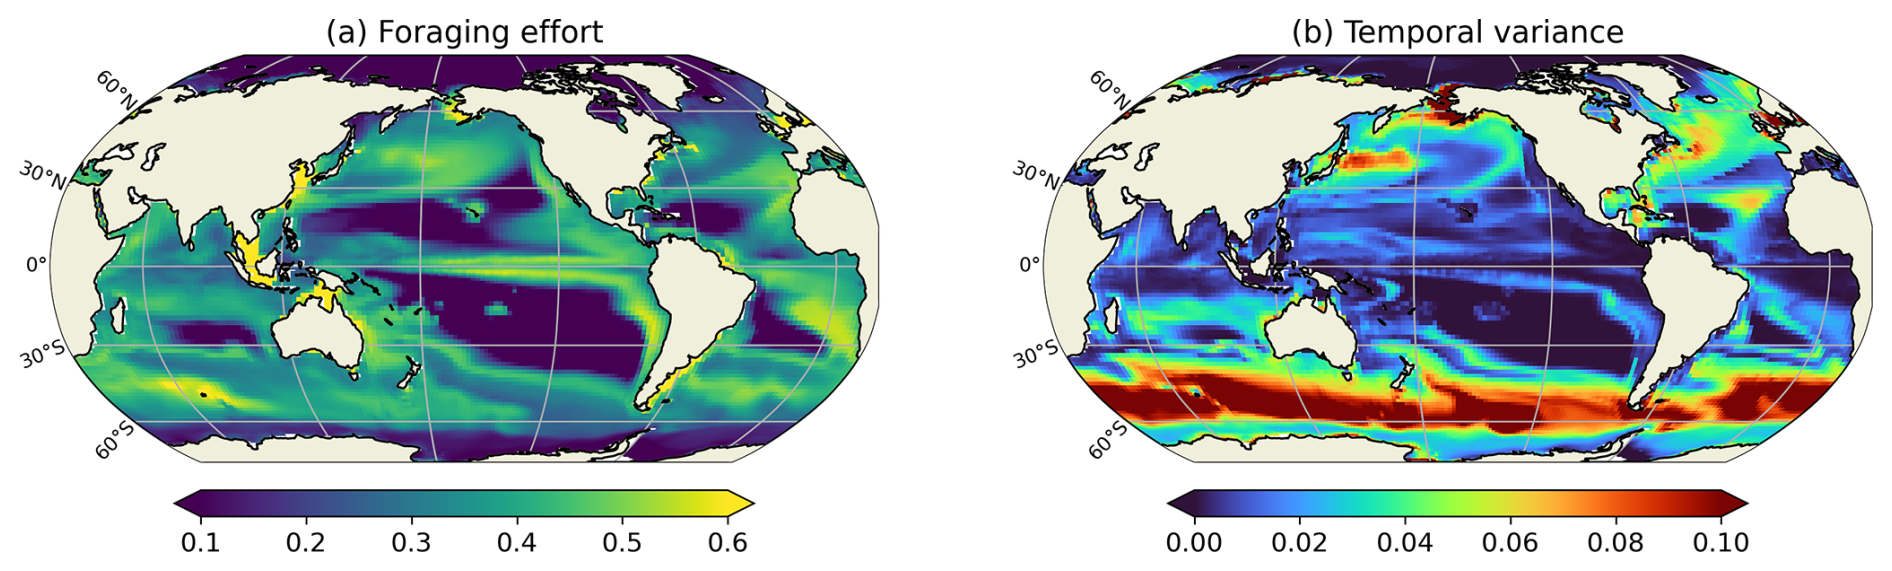
Figure 7(a) Annual mean of the foraging effort (unitless) for cruisers and (b) temporal variance of the foraging effort, averaged on the top 150 m.
The seasonal variation of the foraging effort over the year is presented through a map of its temporal variance (Fig. 7b). The highest seasonal variations are found at high latitudes and decrease towards the equator. High latitudes are characterized by strong seasonal variations in the prey concentration (for instance in the Southern Ocean, prey concentration varies from 3.33 mmol C m−3 during the seasonal bloom to 0.22 mmol m−3 in Austral winter), which leads consequently to important variations in the foraging effort of cruisers. During winter, when phytoplankton and microzooplankton concentrations are very low, the foraging effort decreases to zero. Conversely, during the favourable season, the foraging effort remains close to 1, except during the spring bloom when prey concentration may locally become sufficiently high to trigger its down regulation (Fig. 7). Seasonal variations are smaller yet still important at the edges of the subtropical gyres. These variations are caused by their seasonal spatial contraction and expansion which leads prey abundance to fluctuate around the minimum prey concentration required to sustain a non-zero foraging effort (i.e. Rmin, see Eq. A10). At the center of the subtropical gyres, prey concentration remains below Rmin all year long, resulting in a consistently null foraging effort and no seasonal variability. In the highly productive regions of the low latitudes, such as the eastern boundary upwelling systems, prey abundance remain always high all year long. Consequently, the foraging effort displays very modest variations in these productive regions, as evidenced in Fig. 7.
To investigate the seasonality of suspension feeders (cruisers and ambushers), we focus on the Southern Ocean (south of 60° S), where strong variations are observed, in accordance with the temporal variance of the foraging effort (Fig. 7b). This region, with its highly seasonal environment, is examined to explore the relationship between the biomass of suspension feeders and the foraging effort (Fig. 7b). Cruisers consistently dominate over ambushers in these regions throughout the year (Fig. 6a). Overall, we find that if one group of suspension feeders dominates in a region, it dominates all year long. Therefore, our model does not predict alternation between suspension feeders (see Appendix, Fig. A8). In the Southern Ocean, both cruisers and their foraging effort exhibit a similar seasonal pattern (Fig. 8, blue and orange dots) peaking in March at 0.41 mmol C m−3 and 0.4 respectively. The favourable season is also characterized by a very large spatial variability of both the biomass and the foraging effort. During this season, prey concentration in the Southern Ocean increases (to reach a maximum of 3.3 mmol C m−3, with a minimum of 0.22 mmol C m−3 in Austral winter). This resulting larger pool of prey items combined with an enhanced foraging effort boosts the concentration of cruisers. The large spatial variability underscores the contrast between HNLC regions and highly productive areas near Antarctica, as well as downstream of islands and plateaus. Following the summer period, cruisers' biomass steadily declines, until it reaches its minimum in November (0.065 mmol C m−3, i.e. 84 % lower than its maximum summer value). Yet, cruisers remain four times more abundant than ambushers (0.016 mmol C m−3). Ambushers biomass remains low throughout the year (0.023 mmol C m−3) and presents weak seasonality (Fig. 8, in red). A small peak of ambushers (0.03 mmol m−3) occurs after the seasonal bloom, in April. Similar temporal patterns are observed at high Northern latitudes (>60° N, not shown here), with a peak of foraging effort and of cruisers' concentration in August, followed by a peak of ambushers later in October. At low latitudes (between 0–30° N/S, not shown here), seasonal variations are much lower (less than 20 % for ambushers) as these regions are mainly characterized by low productivity in the gyres throughout the year, except in Eastern Boundary Upwelling systems. Ambushers largely dominate over cruisers such that no successive dominance is observed in these regions as well (see Appendix, Fig. A8).
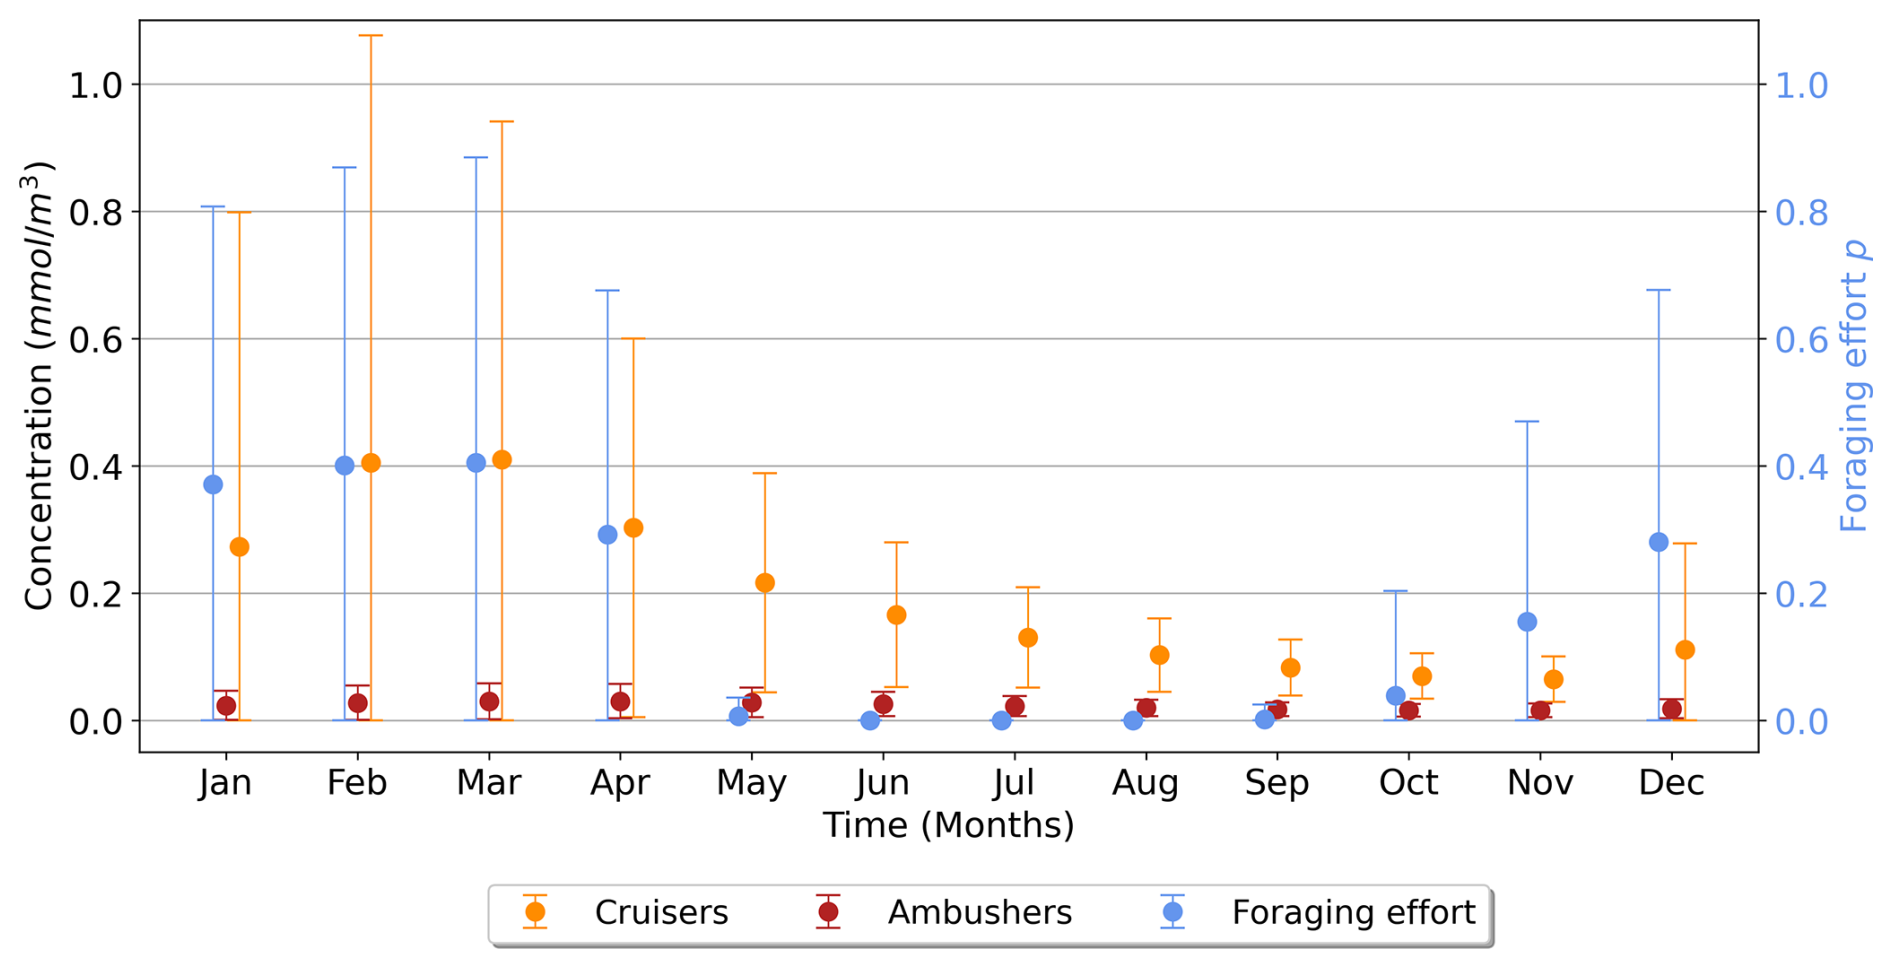
Figure 8Time series (in months) over the high latitudes of the Southern Ocean (>60° S) for the suspension feeders' concentration (cruisers in orange, ambushers in red, in mmol C m−3) and the foraging effort (unitless, in blue), averaged over the top 150 m. The vertical bars represent the standard deviation.
3.4 Sensitivity experiments
In this section, we first compare the reference simulation FOREFF with two experiments with three PFTs: (i) NO_FOREFF, which is similar to FOREFF but with a constant foraging effort for cruisers (set to its maximum value of 1) and (ii) LGE (Low Growth Efficiency, for cruisers), in which both suspension feeders have the same maximum grazing rate, but cruisers are assigned a lower half-saturation constant for grazing and reduced growth efficiency. Next, we examine the impact of removing one of the feeding groups in FOREFF, hence reducing the representation of mesozooplankton from three to two PFTs.
3.4.1 Impact of a constant foraging effort on global biomass (NO_FOREFF experiment)
By keeping the foraging effort of cruisers to its maximum value of 1 (i.e. NO_FOREFF), the biogeography of suspension feeders (Fig. 6b and e) differs moderately from the one predicted in FOREFF. Cruisers are largely outcompeted by ambushers on a global scale, but remain slightly dominant at high latitudes and in the most productive regions of the low and mid-latitudes (Fig. 6b). At depth, the dominance of cruisers is also strongly diminished at high latitudes: the dominance of ambushers is only lower in the top 100 m in the Southern Hemisphere and in the top 60 m in the Northern Hemisphere, indicating a trend toward co-dominance in these regions (Fig. 6e). Even if cruisers become widely dominated by ambushers in this experiment, they are still present in the same regions as in the reference FOREFF simulation (see Appendix, Fig. A4a and d), but their concentration is lower while the concentration of ambushers is higher than in the reference FOREFF simulation (Fig. 9d and e, light blue dotted curves). The NO_FOREFF experiment indicates that maintaining a constant foraging effort at its maximum value is too restrictive for cruisers at low and high prey availability. In regions where prey abundance is very low all year long, active organisms lose too much energy to their swimming activity, failing to gather enough resources during the more favourable season to survive. In regions of high productivity, this leads to a strong mortality of cruisers by predation, making them less successful than in FOREFF.
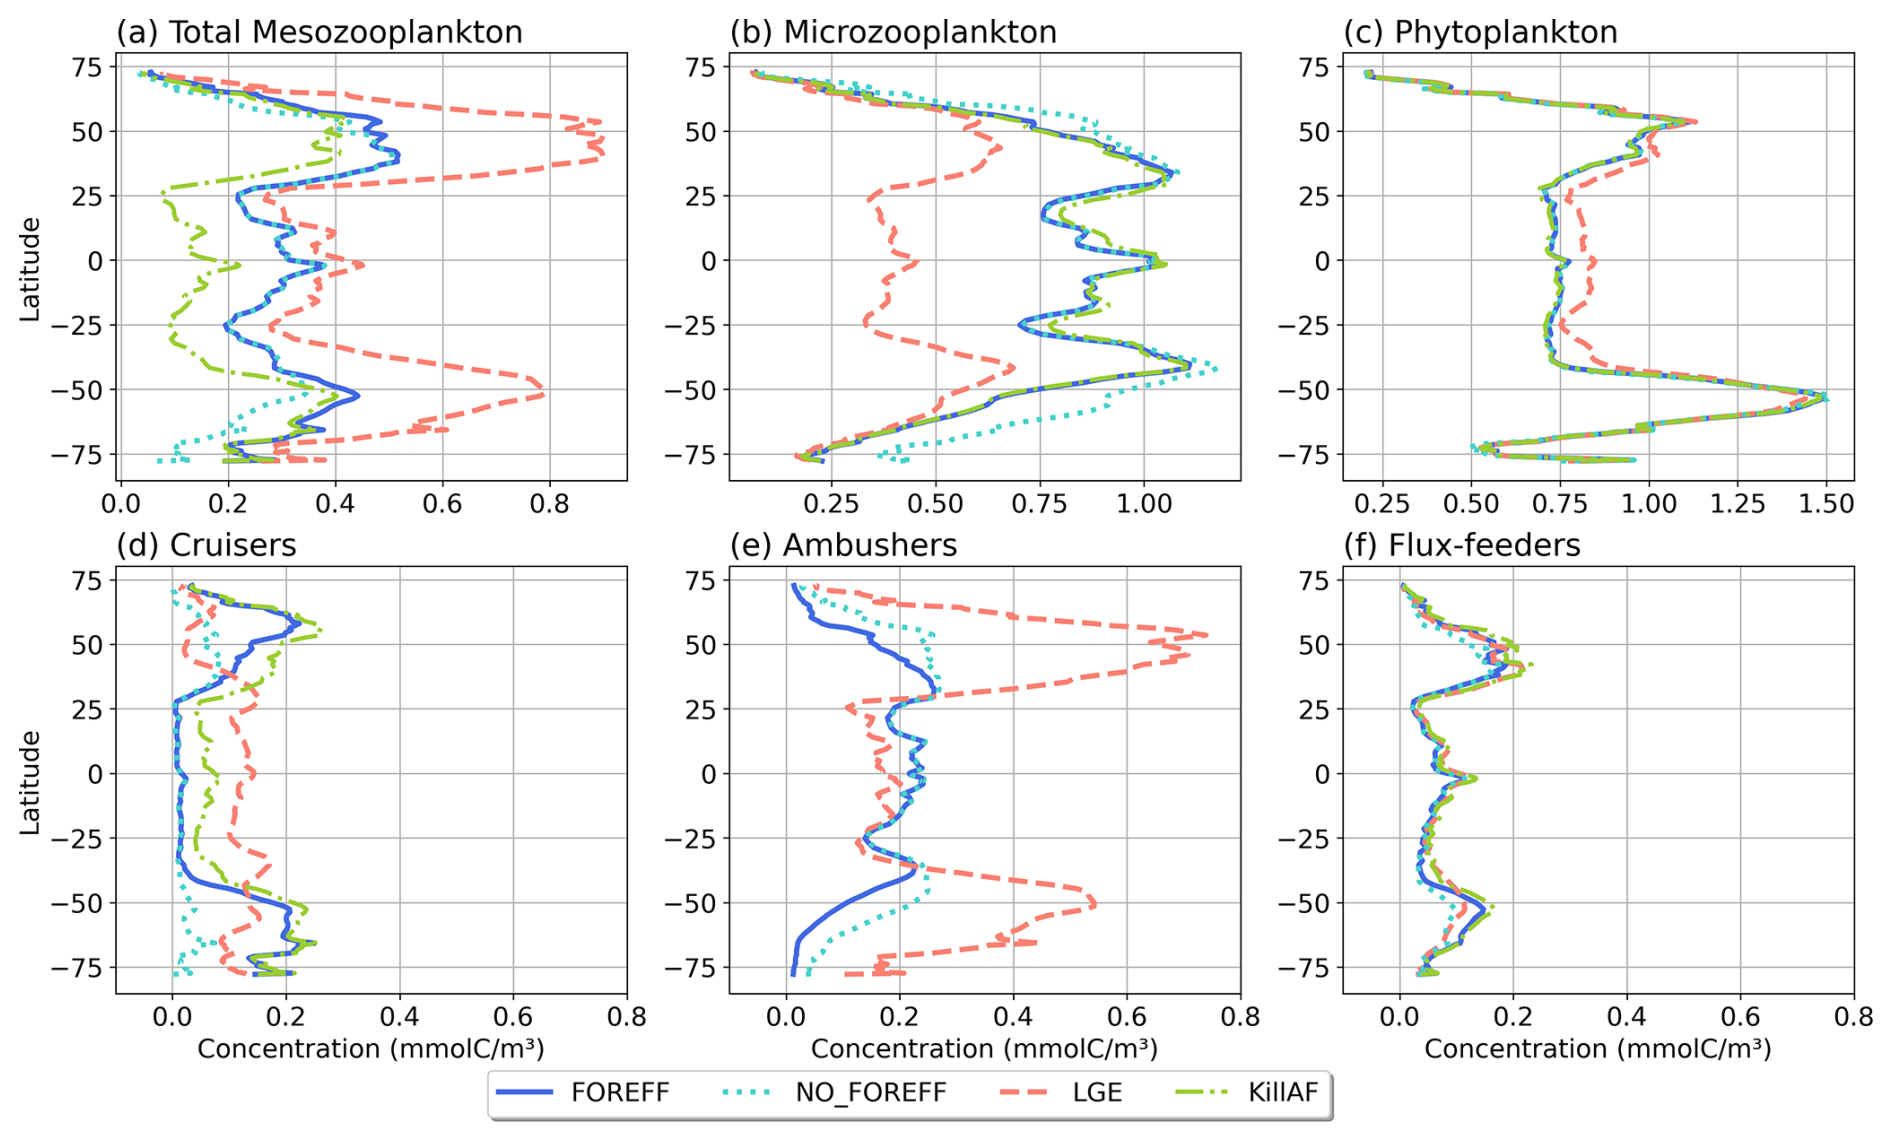
Figure 9Annual and zonal (averaged over 150 m depth) mean biomass of (a) total mesozooplankton, (b) microzooplankton, (c) phytoplankton, (d) cruisers, (e) ambushers, and (f) flux-feeders for the different experiments (in mmol C m−3): FOREFF in dark blue line, NO_FOREFF in dotted blue is similar to FOREFF but with constant foraging effort, LGE (Low Growth Efficiency) in dashed pink corresponds to same growth rate for suspension feeders but lower growth efficiency for cruisers, and KILL_AF in dash and dotted green is similar to FOREFF but ambushers are removed.
Despite important differences in the spatial patterns of dominance, the zonally average distribution of total mesozooplankton biomass in NO_FOREFF remains similar to FOREFF (Fig. 9a, dark blue and light blue dotted curves), except in the mid to high latitudes of both hemispheres, especially south of 40° S where total mesozooplankton biomass is lower. In these regions, the biomass of cruisers is strongly reduced, a decrease that is only partly compensated by an increase in ambushers. Globally, cruisers concentration is 71.7 % lower in this experiment with constant forging effort whereas it is 24.2 % higher for ambushers (Fig. 9e). The biomass of flux-feeders is also significantly decreased (−16.1 %) in the mid to high latitudes as a consequence of a lower export of organic matter below 150 m (see Sect. 3.5). Overall, the global mesozooplankton concentration in this experiment decreases by 13 %, with a total integrated biomass over 150 m of 0.16 Gt C, including 74.2 % of ambushers and only 6.7 % of cruisers. Furthermore, the decline in cruisers driven by their constant foraging effort, along with the reduction in flux-feeders due to decreased carbon export, results in lower grazing by both groups (Table 3 and Appendix, Fig. A5b). As a result, total grazing by mesozooplankton declines in the NO_FOREFF simulation, which explains the increase in microzooplankton biomass (+12.5 %, Fig. 9b), while phytoplankton biomass presents almost no variation (−0.6 %, Fig. 9c).
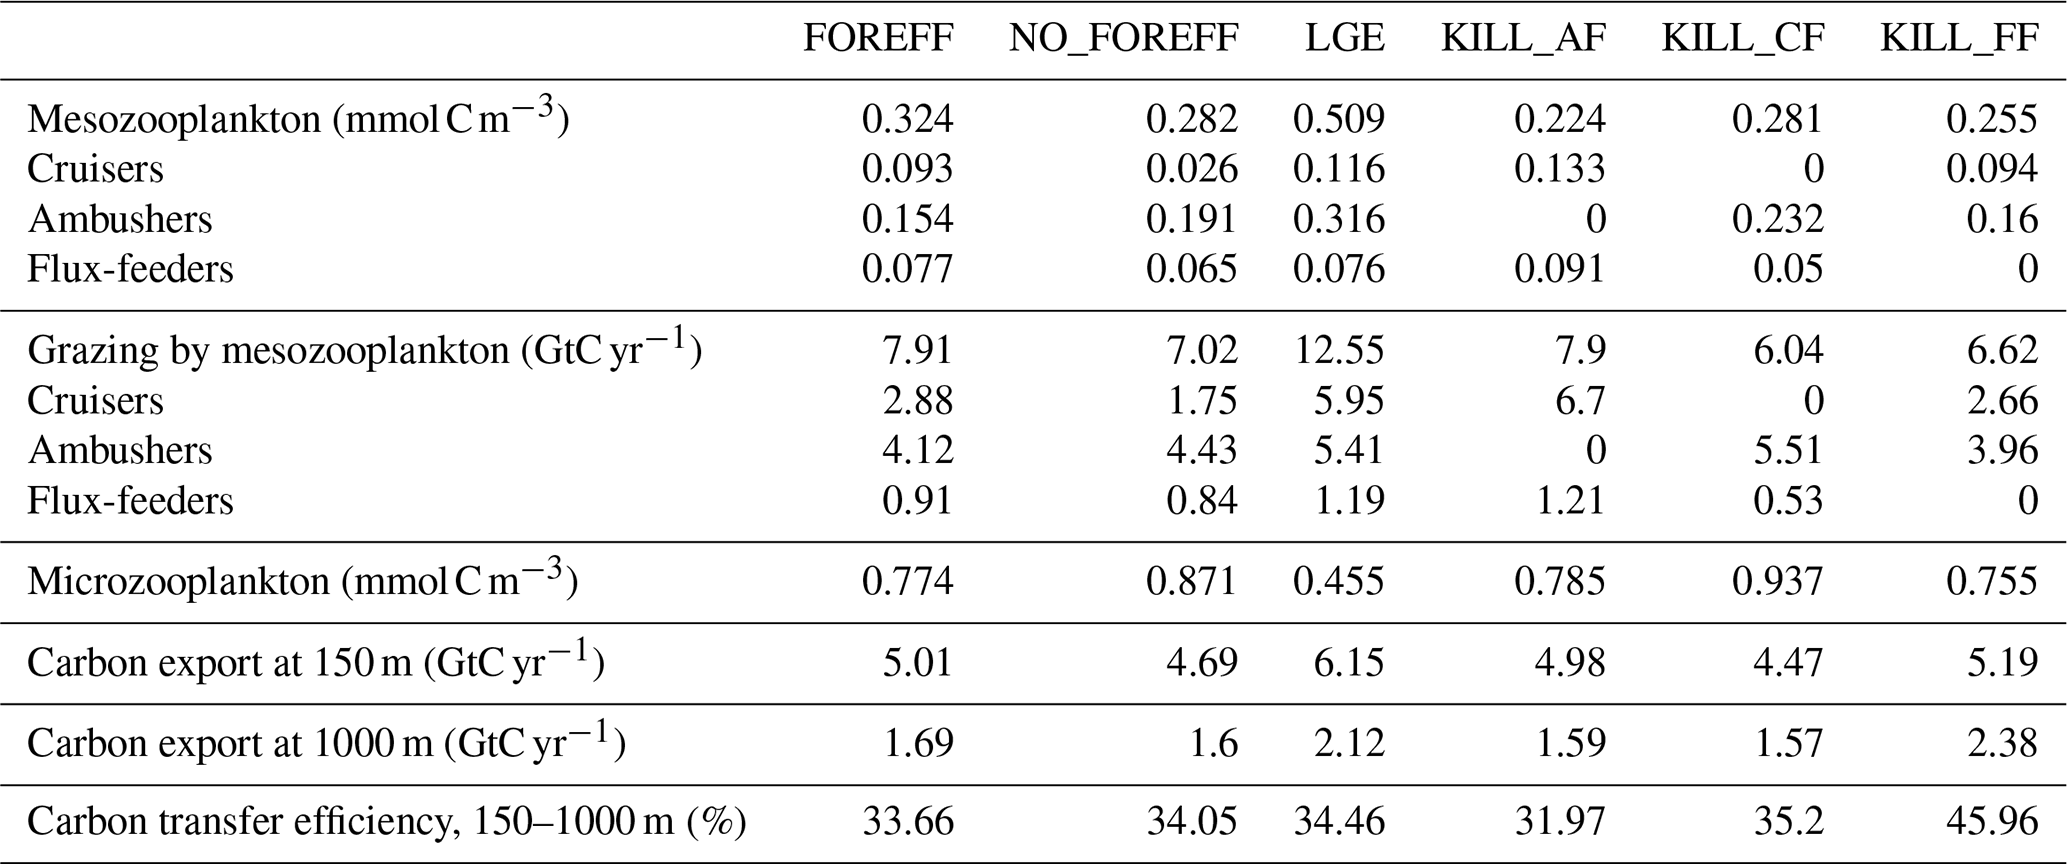
Table 3Summary statistics of mean total zooplankton biomass concentration and mean total carbon flux at depth obtained for the different model simulations. Micro- and meso- zooplankton are averaged over 150 m and mesozooplankton grazing is integrated over 150 m. The carbon export values correspond to the globally integrated sinking flux of organic carbon. Carbon transfer efficiency is defined as the ratio of carbon flux at 1000 m relative to the flux at 150 m. FOREFF is the reference simulation. NO_FOREFF is similar to FOREFF but with a constant foraging effort for cruisers. In LGE (Low Growth Efficiency, for cruisers), both suspension feeders have the same maximum grazing rate, but cruisers are assigned a lower half-saturation constant for grazing and reduced growth efficiency. KILL_AF is similar to FOREFF but ambushers are removed. KILL_CF is similar to FOREFF but cruisers are removed. KILL_FF is similar to FOREFF but flux-feeders are removed.
3.4.2 Impact of the parameters variation for 3 PFTs on global biomass (LGE experiment)
In the LGE experiment, the spatial distributions of ambushers and cruisers present a reversed biogeography compared to the reference FOREFF simulation: cruisers now dominate at low latitudes in oligotrophic regions whereas ambushers dominate at higher latitudes and in productive regions (Fig. 6c). In low productivity regions, cruisers are outcompeted by ambushers in the FOREFF experiment as their foraging effort drops down to zero (i.e. they stop feeding), which is not the case in the LGE experiment. In comparison to NO_FOREFF, cruisers perform better in LGE thanks to their increased ingestion rate, as their half-saturation constant is reduced by a factor of 2 while their maximum ingestion rate is only divided by 1.6. Furthermore, respiration resulting from their active feeding behaviour is a fraction of ingestion, which remains very low in oligotrophic regions. Respiration is therefore much lower than in NO_FOREFF, where it is constant and independent of food availability. In LGE, cruisers also outperform ambushers, as they consume three times more food due to their lower half-saturation constant for grazing (three times lower), while maintaining the same maximum grazing rate. Their metabolic loss due to their active feeding mode is only slightly increased and predatory loss remains secondary in these oligotrophic regions since we assumed a quadratic parametrization for mortality. In more productive regions, changes in dominance patterns are primarily attributed to the greater success of ambushers in LGE, while the performance of cruisers is less affected compared to NO_FOREFF. Ambushers have a maximum grazing rate that is now identical to that of cruisers and thus 2.5 times higher than in FOREFF and NO_FOREFF and an unchanged mortality by predation. At high food levels, they ingest thus more food comparatively to FOREFF and NO_FOREFF while still experiencing a much lower mortality by predation which is critical. Additionally, because each mesozooplankton group experiences quadratic mortality based on their total concentration, the significantly higher biomass of ambushers increases overall mortality rates, disproportionately affecting cruisers and further reinforcing ambusher dominance.
The total biomass integrated over 150 m in the LGE experiment increases compared to FOREFF reaching 0.27 Gt C, with 0.16 Gt C for ambushers (69 % of the total mesozooplankton biomass), 0.07 Gt C for cruiser (26 %) and 0.04 Gt C for flux-feeders (15 %). As a result, this set of parameters leads to an increased mesozooplankton grazing of +57.7 %. Notably, grazing is higher for cruisers near the surface in the reference simulation (FOREFF) but rapidly decreases below the levels of ambushers at depth (Fig. 5, orange and red curves). In contrast, in the experiment where suspension feeders are assigned the same grazing rate (i.e. LGE), grazing by cruisers at the surface is initially lower than that of ambushers but remains nearly constant, only decreasing at around 80 m depth (see Appendix, Fig. A5c, orange curve), resulting in overall higher grazing levels.
A large increase in mean annual total mesozooplankton concentration is observed in LGE compared to FOREFF, especially at high latitudes (+56.9 %, Fig. 9a, dashed pink and dark blue curves). The biomass of both suspension feeding groups increases (+24.6 % for cruisers and +105.5 % for ambushers, Fig. 9d and e). However, the latitudinal pattern for the concentration of cruisers presents an increase of that group at low latitudes, and a decrease at high latitudes. Meanwhile, ambushers concentration decreases at low latitudes and increases strongly in the high latitudes and in the productive regions of the low latitudes, resulting in the pattern observed in Fig. 6c. The increase in mesozooplankton biomass concentration leads to a global reduction in microzooplankton concentration within the top 150 m (−41.2 %, Fig. 9b) due to enhanced mesozooplankton grazing. As a result, phytoplankton biomass concentration increases by +5.3 %, (Fig. 9c) thanks to this relaxation of microzooplankton grazing.
3.4.3 Impact of considering only two PFTs on global biomass (KILL_AF, KILL_CF and KILL_FF experiments)
Eliminating ambushers (KILL_AF, Fig. 9, green dash-dotted curves) results in the largest decrease in total mesozooplankton biomass (−31 %, Fig. 9a), especially at low latitudes where ambushers are the dominant mesozooplankton group in the reference experiment FOREFF. However, removing one feeding group favours the remaining two since the quadratic mortality depends on the sum of all three groups. In the absence of competition from ambushers, the grazing of cruisers increases as there is more food available for the remaining groups (Fig. A5d) and the biomass concentration of cruisers increases significantly (+42 %, Fig. 9d), with this increase primarily occurring at low to mid-latitudes. Nevertheless, their greater concentration does not fully offset the loss of ambushers, resulting in a net decrease in total mesozooplankton biomass. Flux-feeders also experience an increase in biomass as they are no longer out-competed by ambushers (+18.2 %), particularly at depth in productive regions (Fig. 9f, green dash-dotted curve). Total grazing by mesozooplankton remains globally unchanged (less than 1 %). Consequently, removing ambushers has almost no impact on microzooplankton and phytoplankton biomass concentration (less than 1.5 % for both), except for a slight increase in the low latitudes for microzooplankton (Fig. 9b, green dash-dotted curve).
When removing the cruisers (KILL_CF, not shown here, see Appendix, Fig. A6, orange dash-dotted curves), mesozooplankton biomass also decreases (−13.3 %), yet less than in the KILL_AF experiment. This decrease is primarily observed at high latitudes, where cruisers were the most abundant and where they are partly replaced by ambushers as evidenced by their 51 % increase in biomass concentration. Furthermore, ambushers produce fewer big particles due to their lower grazing efficiency which, together with a strong competition with flux-feeders in the lower part of the euphotic zone, leads to a significant reduction in flux-feeder biomass concentration (−36.6 %). Removing the cruisers makes ambushers the sole suspension feeding group. As a result, they are able to reach their maximum grazing levels (see Table 3). However, total grazing by mesozooplankton is lowered compared to the reference FOREFF configuration (−23.5 %), leading to a strong increase in microzooplankton biomass concentration (+21.1 %).
When removing flux-feeders (KILL_FF experiment, not shown here, see Appendix, Fig. A6), variations in ecosystem dynamics remained similar although less pronounced. Total mesozooplankton biomass decreases by 21.2 %, a change largely attributable to the direct removal of flux-feeders, as changes in cruisers and ambushers biomass concentration are small, respectively +1.2 % and +4.3 %. Contrary to the other two experiments (KILL_AF and KILL_CF), the lack of replacement of flux-feeders by any group of suspension feeders (cruisers or ambushers) is explained by their distinct feeding mode. Feeding mainly on rapidly sinking, weakly abundant large particles, flux-feeders predominantly reside at depth where food levels are anyhow insufficient to sustain ambushers and cruisers.
3.5 Impact of considering several mesozooplankton feeding behaviours on the global carbon cycle
Distinguishing three mesozooplankton feeding groups impacts the amount of carbon export at depth (Table 3). In the reference FOREFF configuration, total carbon export is 5.01 Gt C yr−1 at 150 m and 1.69 Gt C yr−1 at 1000 m. The spatial pattern of the amount of carbon exported at depth is similar to the one obtained by Henson et al. (2012), with highest export in productive regions and at high latitudes (Fig. 10a). These global carbon export values are within the range of recent independent studies (DeVries and Weber, 2017), but they are lower than values found in previous PISCES-based model studies (6.9 Gt C yr−1 at 150 m depth by Aumont et al., 2015, or 7.71 Gt C yr−1 at 100 m depth by Clerc et al., 2023). In our model, the global carbon transfer efficiency, defined as the carbon flux at 1000 m relative to the flux at 150 m, reaches a proportion of about 33.7 % (Table 3).
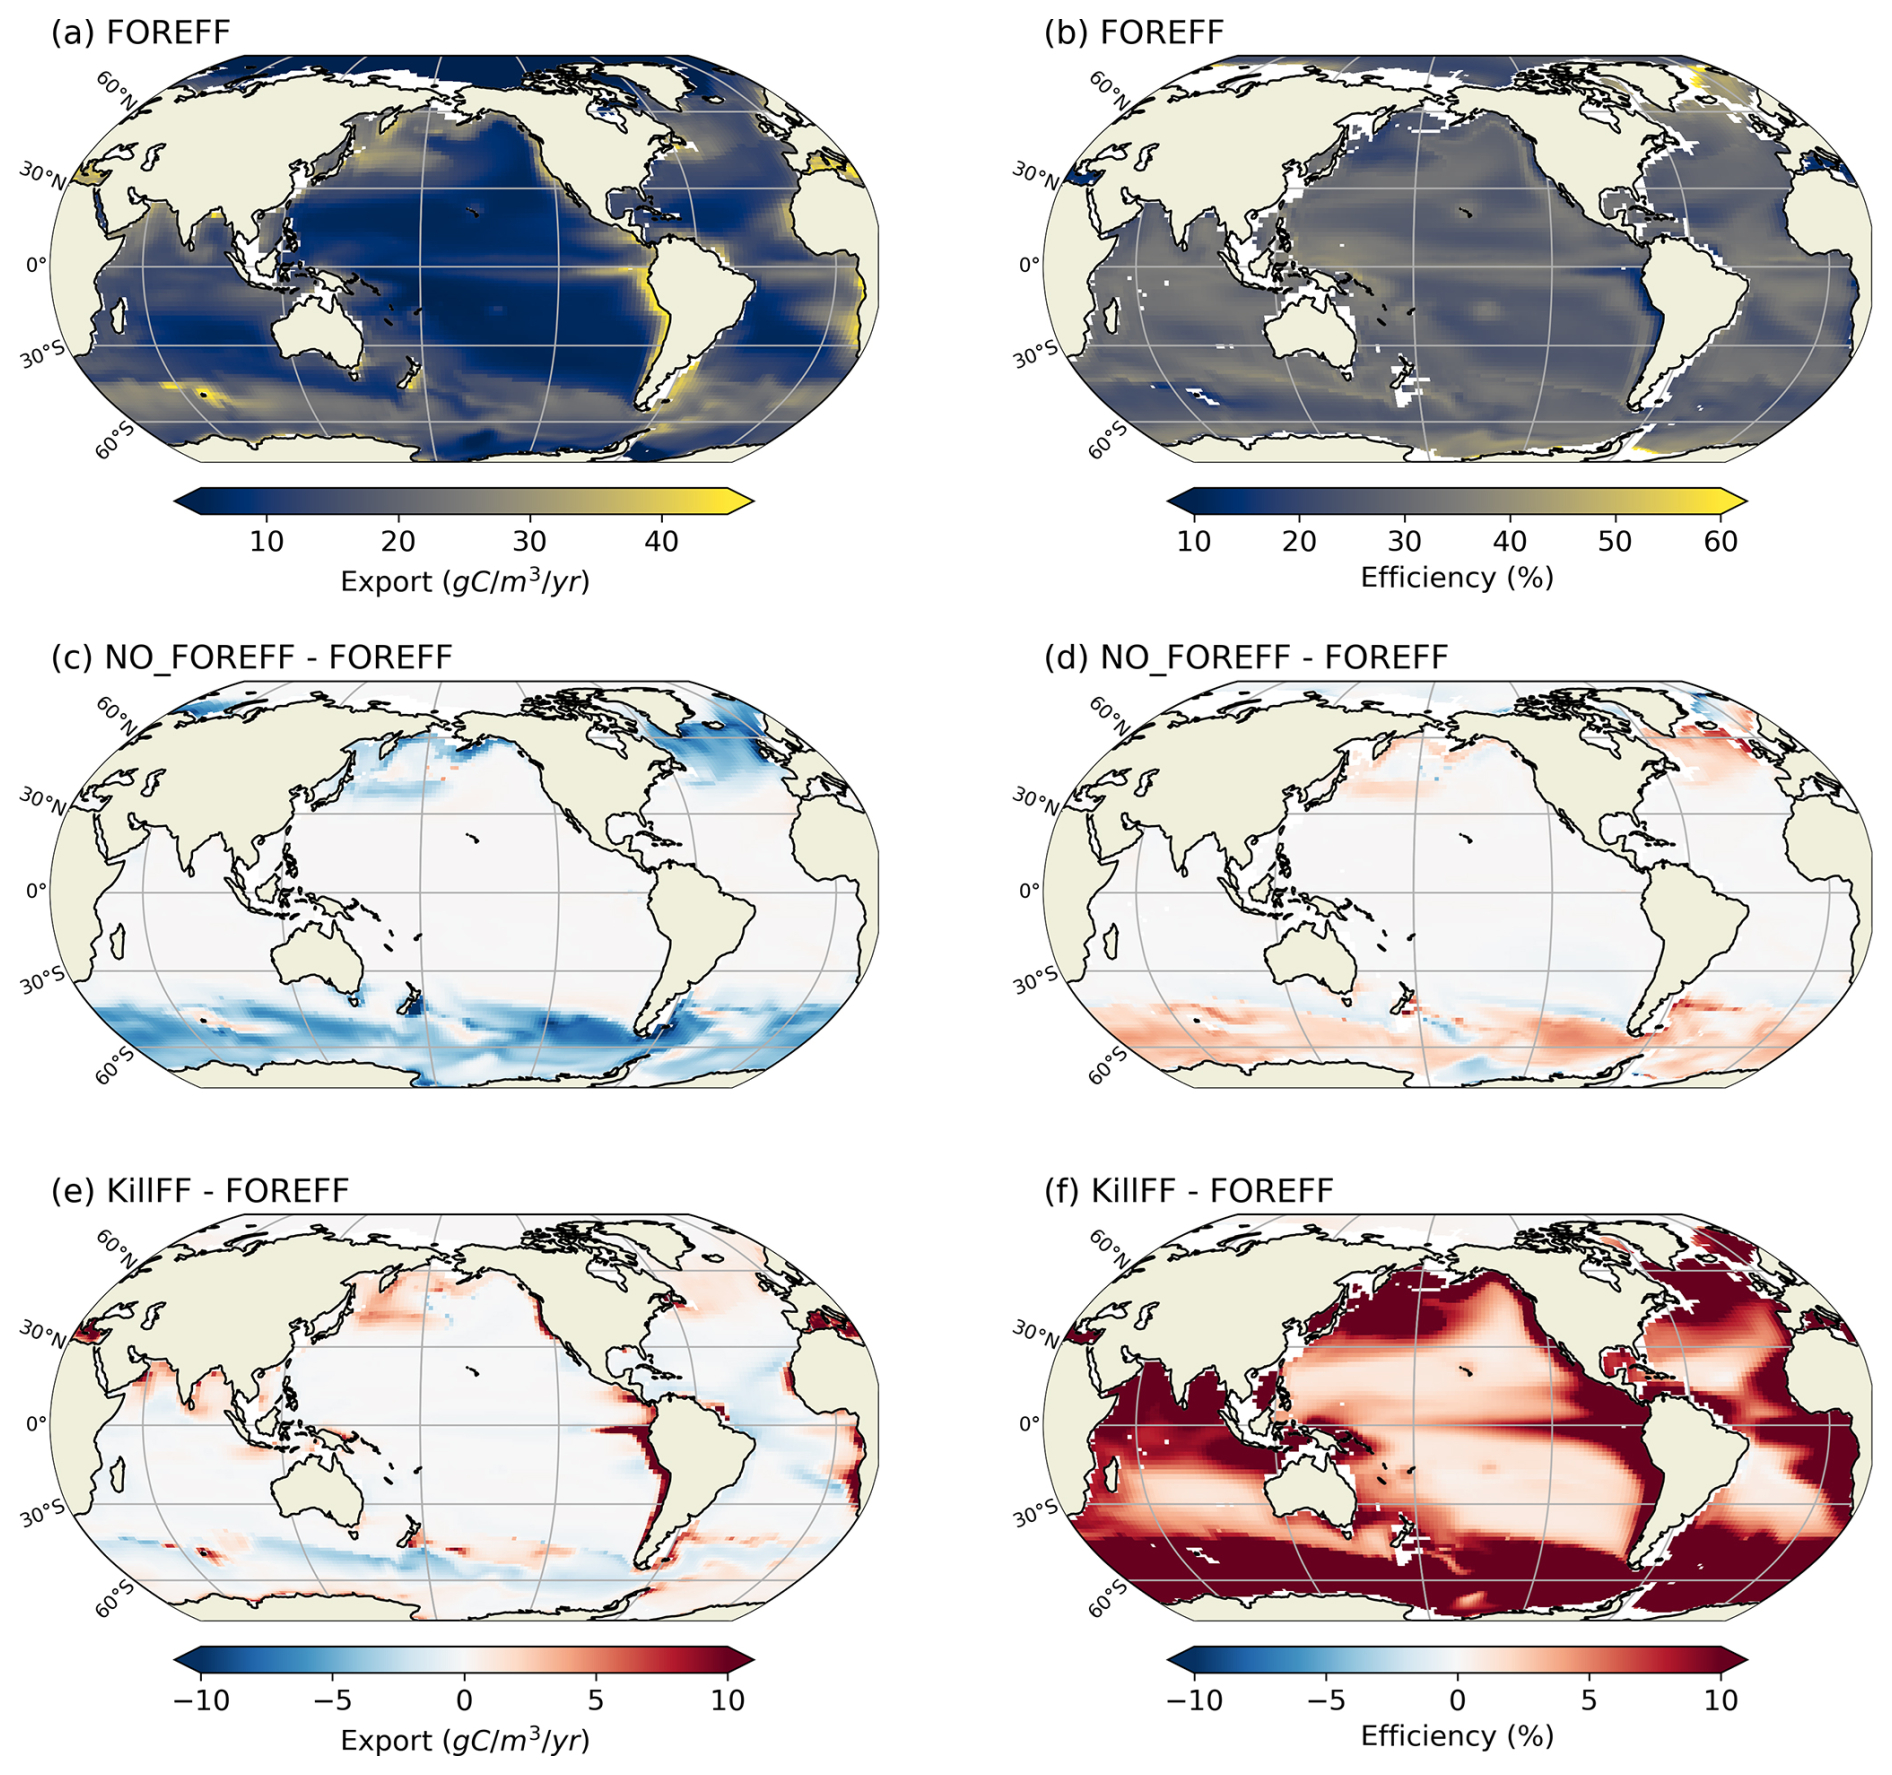
Figure 10Annual mean of carbon export at 150 m (a, c, e, in ) and of carbon transfer efficiency between 150–1000 m (b, d, f, in %). (a, b) Values obtained for the reference FOREFF simulation. (c, d) Differences between FOREFF and NO_FOREFF (similar to FOREFF but without a variable foraging effort). (e, f) Differences between FOREFF and KILL_FF (similar to FOREFF but flux-feeders are killed).
In our reference FOREFF simulation, carbon transfer efficiency is maximum (up to 50 %) in the productive areas at high latitudes, intermediate (around 30 %–35 %) in regions of moderate productivity at mid and low latitudes, and minimum (less than 30 %) in highly oligotrophic regions (center of the gyres) and in the Eastern Boundary Upwelling Systems (less than 10 %). The latter corresponds to those regions where flux-feeders thrive (see flux-feeders concentration averaged between 150–1000 m in the Appendix Fig. A10a), as they are able to efficiently feed on abundant sinking particles, hence lowering the carbon export at depth (Fig. 10b).
Variations in carbon export across different model experiments are controlled by two main factors. First, the production of organic particles in the upper ocean, which partly depends on the relative contributions of the two suspension feeding modes. Suspension feeders influence production both directly, through differences in grazing intensity and mortality losses, and indirectly, by modulating microzooplankton biomass and primary productivity. Second, the fate of sinking organic particles, and thus the transfer efficiency, is affected by flux-feeders. According to our experiments, an increase in grazing by suspension feeding mesozooplankton leads to a higher export at 150 m (Table 3). This result is expected since suspension feeding mesozooplankton are the main source of large organic particles through both fecal pellet production and mortality. Furthermore, cruisers appear to be more efficient at sustaining export than ambushers. This is demonstrated by the experiments NO_FOREFF and KILL_CF, both of which result in a significant reduction in export at 150 m of −6.41 % and −11 %, respectively (Table 3). Spatially, the most substantial decreases in export in NO_FOREFF and KILL_CF occur at high latitudes, where a sharp decline in export (−48.8 % and −60 %, respectively) aligns with a significant reduction in cruisers abundance (Fig. 10c for NO_FOREFF and Fig. A9i in the Appendix for KILL_CF). In contrast, the variation of carbon export is much smaller when ambushers are eliminated (KILL_AF). Spatially, this corresponds to moderate increases in export in productive regions, balanced by moderate decreases in less productive areas (see Appendix, Fig. A9g).
In all experiments, absolute changes in average transfer efficiency remain relatively modest globally (less than 5.5 %), except when flux-feeders are eliminated. In the latter case, average transfer efficiency is strongly increased from 33.66 % to 45.96 % (KILL_FF, Table 3 and Fig. 10f). The KILL_FF experiment demonstrates the critical role played by flux-feeding on the fate of the particulate organic matter sinking down in the mesopelagic domain. Spatially, the impact of flux-feeders is maximum in productive regions such as upwelling systems and the high latitudes (Fig. 10f), where their abundance in the mesopelagic domain is high thanks to a higher concentration of organic particles exported from the upper ocean (see Appendix, Fig. A10f). In the other experiments, such as NO_FOREFF and KILL_CF, a decrease in flux-feeders concentration at depth generally leads to an increase in the transfer efficiency and vice versa (see Appendix, Figs. A10 and A9).
We implemented three mesozooplankton feeding strategies in the marine biogeochemical model PISCES: one group of flux-feeders and two groups of suspension feeders (i.e. cruisers and ambushers). The different model experiments show that suspension feeders predominate in the epipelagic layer while flux-feeders thrive more at depths lower than 100 m where they substantially decrease the amount of particles sinking to the mesopelagic domain. In most of the regions, ambushers prevail over cruisers thanks to their lower metabolic expanses and lower predation risk. Yet, cruisers may outcompete ambushers in the most productive regions thanks to their higher grazing rates. We also explicitly considered the cost of the foraging of cruisers, where cruisers have access to a larger range of prey despite a higher predation risk due to their active behaviour and higher metabolic costs when actively foraging. Indeed, their foraging effort allows them to better optimize their search for food, since they save their energy and avoid predation in the least and most productive regions.
4.1 Comparison with previous studies and data on the biogeography of copepod feeding strategies
Theoretical modelling studies on feeding strategies of zooplankton have shown various biogeographies for these organisms (Prowe et al., 2019; Visser, 2007). For instance, the model proposed by Prowe et al. (2019) focuses on encounter rates between zooplankton and their prey, which are controlled by trade-offs between motility, body size, and predation risk. Their model predicts a stronger competition among suspension feeders at high latitudes, where ambushers tend to dominate over cruisers. It is also the case in our Low Growth Efficiency (LGE) experiment, where ambushers dominate in productive regions and exclude cruisers (Fig. 6c). Similarly, Visser (2007) and Visser et al. (2008) showed how trade-offs, specifically the net energy gain vs. predation (Visser, 2007), allow to predict the biogeography of these organisms. They suggest that more passive suspension feeders, such as ambushers, would dominate in regions characterized by higher prey levels, higher turbulence and higher predation risk. Conversely, cruisers would perform better at intermediate or lower food levels as well as at lower levels of turbulence (Visser, 2007; Kiørboe, 2011). This leads to a pattern similar to our LGE experiment as well. These modelling studies suggest that ambushers would dominate on a global scale, particularly at high latitudes and in areas with high prey densities. This overall dominance of ambushers is a consistent finding across all our experiments (Fig. 6, top row, and Table 3). However, the preference for a passive ambushing strategy in regions with higher prey concentrations is simulated only in our LGE experiment (Fig. 6c).
To our knowledge, the study by Serra-Pompei et al. (2020) is the only modelling work that predicts a biogeography similar to that simulated in our experiments FOREFF and NO_FOREFF. This study examines the distribution of passive and active organisms alongside their body size, demonstrating that small passive-feeding organisms tend to dominate in low-productivity environments, whereas large active-feeding organisms prevail in more productive systems. Consistent with our findings in FOREFF and NO_FOREFF, the study also shows that active feeding strategies are entirely eliminated under low food availability. However, a key distinction from our work and the work of Serra-Pompei et al. (2020) is their explicit representation of the mesozooplankton size distribution, which plays a crucial role in shaping the predicted biogeography. Among small organisms, passive feeding consistently emerges as the dominant strategy, explaining its prevalence in low-productivity environments. By contrast, large organisms, which thrive in highly productive systems, are hypothesized to be exclusively active feeders due to their high sinking speeds, rendering a passive strategy unviable.
Our predicted biogeography (Fig. 4) can also be compared to recent observational studies, particularly the global surface distribution of copepod functional groups established by Benedetti et al. (2023). This study integrates species-level occurrence observations, species distribution modelling and a species-level functional trait data, providing an empirical biogeographical perspective on suspension feeders. In Benedetti et al. (2023), ambushers and cruisers are classified into three distinct functional groups each (see Sect. 2.4). They observe a spatial pattern of active and passive organisms similar to that predicted in our FOREFF experiment. Their co-dominance index (Fig. 11) suggests that, as in FOREFF, active organisms dominate over passive ones at high latitudes and in highly productive regions such as the Eastern Boundary Upwelling Systems. However, the observed biogeography exhibits greater co-dominance than our model predictions, as indicated by co-dominance index values closer to zero (Fig. 11). Notably, in the oligotrophic subtropical gyres, active feeders are not completely absent in contrast with what we found in FOREFF.
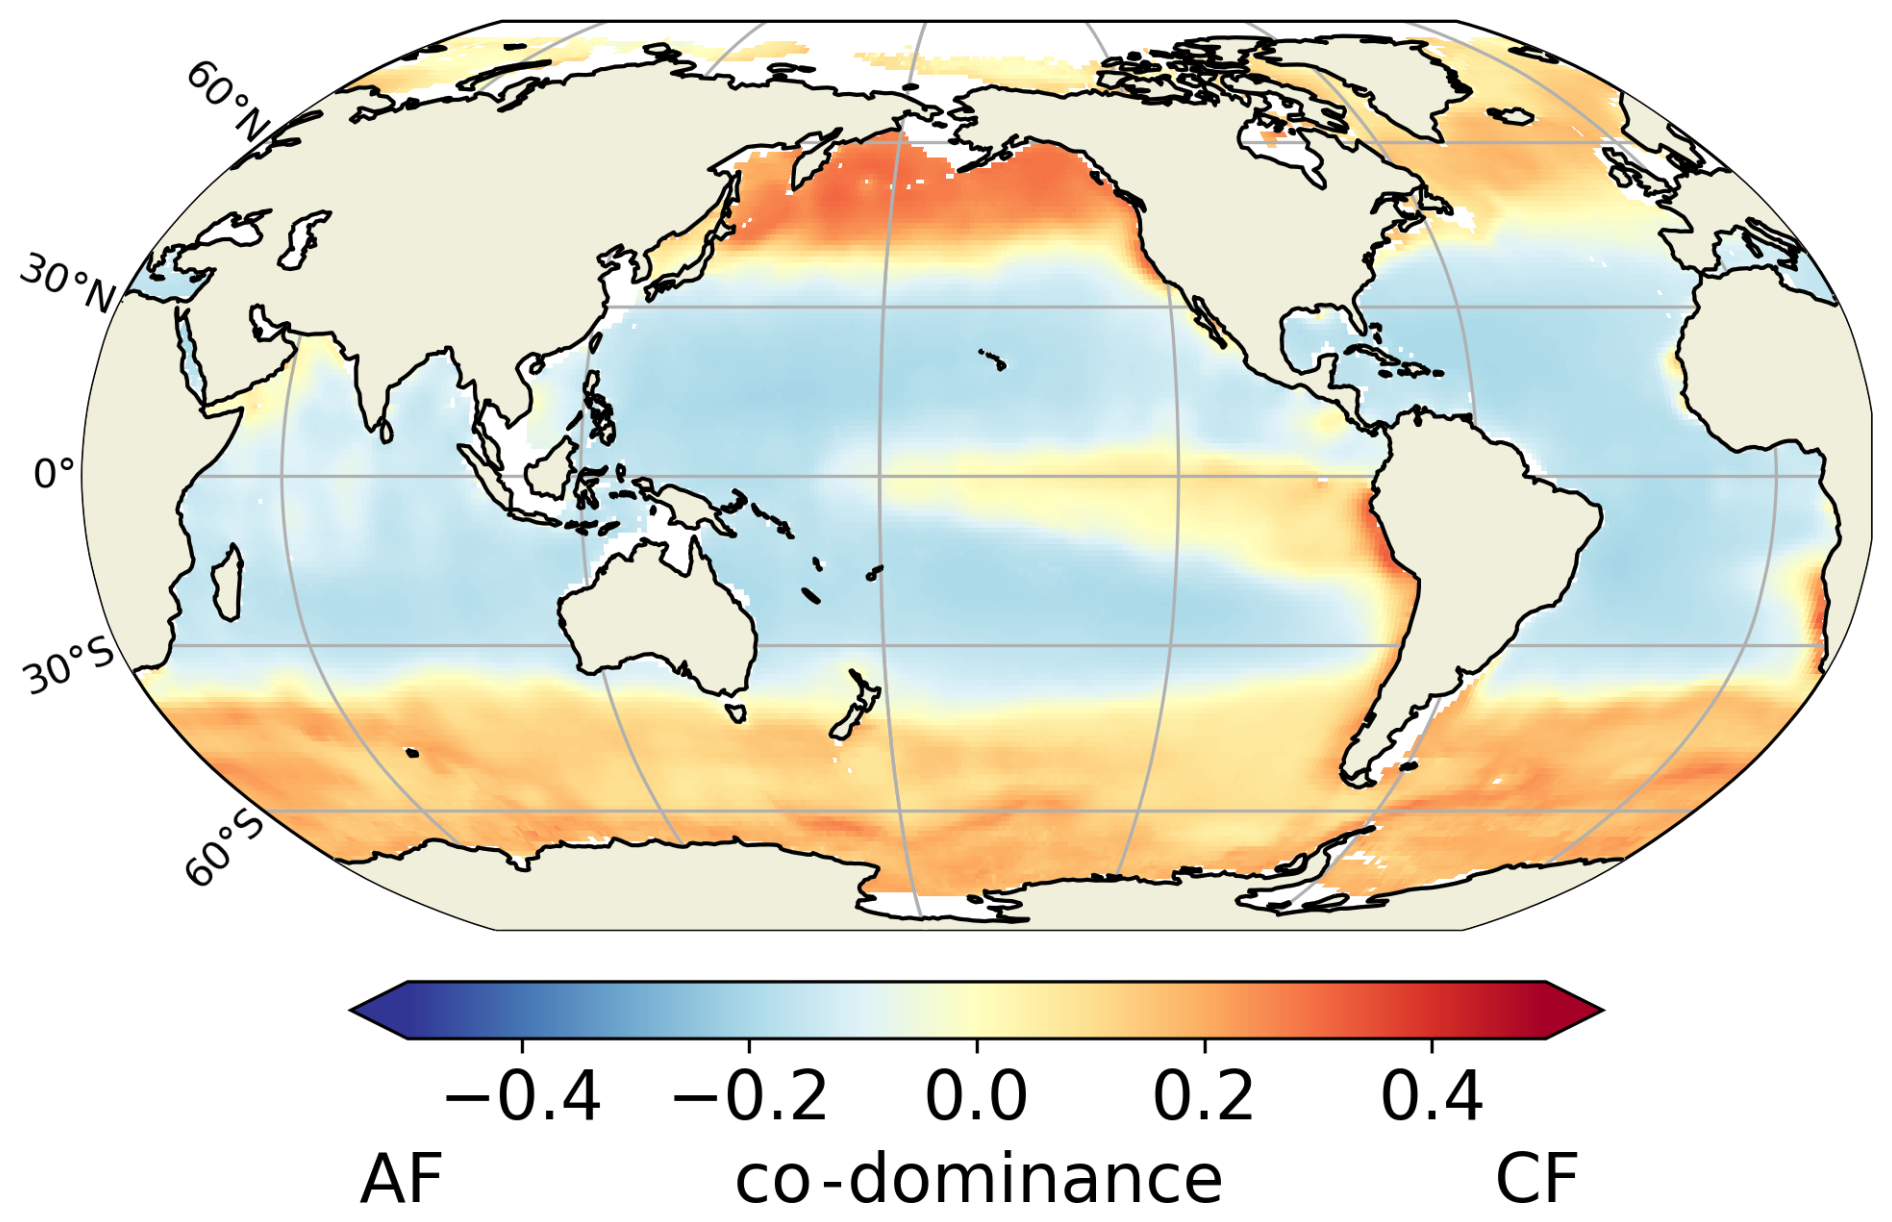
Figure 11Mean annual co-dominance index for projections of the Community Weighted Mean (CWM) traits values for the global surface ocean of cruise-feeders (CF) and ambush feeders (AF). This map is based on the copepod functional groups biogeography modelled by Benedetti et al. (2023).
However, caution is required when comparing the observation-based biogeography from Benedetti et al. (2023) to our modelling results. Their study is based on presence data and habitat suitability indices estimated from species distribution models, and hence it does not consider biomass which is the property simulated by our model. The fact that their approach is based on presence and habitat suitability rather than biomass, may introduce bias and underestimate the relative proportions of the different groups.
4.2 Competition between suspension feeders in the experiments with 3 PFTs
Cruise-feeding and ambush-feeding mesozooplankton display distinct spatial biomass distribution but similar vertical profiles. Both groups are more concentrated in surface layers, whereas flux-feeders are found in the deeper part of the euphotic zone and prevail in the mesopelagic and bathypelagic domains. In the euphotic zone, ambushers are found everywhere and dominate over cruisers except in productive regions and at high latitudes, as mentioned above (see Sect. 4.1). The different experiments showed a strong sensitivity of the biogeography of the suspension feeding groups to the assumptions made on the trade-offs between the energy obtained from feeding and invested into competing functions such as growth, reproduction and survival (Martini et al., 2021; Kiørboe, 2011; Kiørboe et al., 2015; Van Someren Gréve et al., 2017).
In the reference configuration of our study (i.e. FOREFF), adaptive behaviour is incorporated using the theoretical framework proposed by Kiørboe et al. (2018a). Comparing this reference setup to the NO_FOREFF sensitivity experiment provides insights into the effects of variable adaptive foraging effort. In productive regions with high prey concentrations, such as low-latitude upwelling systems and high latitudes, reduced foraging effort explains the dominance of cruisers over ambushers (Figs. 7a and 6a), as minimizing predation losses becomes more critical than maximizing energy gain. When food levels are low (<1.5 mmol C m−3), cruisers stop feeding because saving energy becomes critical. In the subtropical gyres, cruise feeders are outcompeted by ambushers and even completely eliminated when foraging effort is kept to its maximum value, because food availability is never sufficient to sustain their metabolic needs. At high latitudes, reduced metabolic expenditure resulting from ceasing foraging enables cruisers to better endure the winter and, hence, maintains a sufficient population to outcompete ambushers when preys becomes abundant in the spring (Fig. 8). This is evident from the sharp decline in their abundance predicted in the NO_FOREFF experiment (Fig. 9d). The ability of mesozooplankton to adjust their foraging effort thus plays a crucial role in their success in seasonally productive regions, such as high latitudes and low-latitude upwelling systems. However, even in regions where active feeders dominate, ambushers are never entirely excluded (see Appendix, Fig. A4b). Thus, ambush feeding remains a viable predation strategy across all regions of the upper ocean, unlike active feeding modes, as already shown in previous studies (Prowe et al., 2019; Becker et al., 2021).
In the LGE experiment, we assumed different hypotheses than in the reference experiment FOREFF. While keeping the same maximum grazing rate for both suspension feeding groups (cruisers and ambushers), we assigned to cruisers a lower half-saturation constant for grazing to reflect their superior foraging efficiency and a lower gross growth efficiency to represent their higher metabolic needs relative to ambushers (Kiørboe, 2011; Kiørboe et al., 2015; Alcaraz and Strickler, 1988). Under these assumptions and the parameters values prescribed in the LGE experiment, cruisers are outcompeted by ambushers in productive regions and high latitudes (see Table 3 and Appendix, Figs. A5c and A7c). This outcome is driven by the fact that cruisers experience a predation mortality rate four times higher than that of ambushers, requiring them to assimilate at least four times more food to remain competitive. Yet, with a lower gross growth efficiency and a half-saturation constant only three time lower, such assimilation level remains unachievable.
Our various configurations implement a common set of trade-offs related to feeding modes in different manners: active organisms are more efficient foragers and reproducers but experience a greater predation risk and higher metabolic losses. So far, there are still too little experimental data enabling us to quantitatively constrain these trade-offs accurately. Furthermore, previous theoretical and laboratory studies provide a broad range of possible parameter values for representing mesozooplankton feeding modes, adding to the challenge of accurately constraining these dynamics (Kiørboe, 2011; Morris et al., 1985; Vlymen, 1970; Van Someren Gréve et al., 2017). This challenge is reflected through important variations in our experiments, such as the spatial and temporal repartition of the suspension feeding groups and the impact on carbon export. This strong sensitivity of zooplankton and its role in plankton ecosystem dynamics and carbon cycle has been previously evidenced (Chenillat et al., 2021; Van Someren Gréve et al., 2017; Rohr et al., 2023).
Two parameters were particularly important in our modelling experiments: the maximum grazing rate of suspension feeders (cruisers and ambushers) and the quadratic mortality rate . A higher maximum grazing rate for cruisers was required to reproduce a biogeography where they dominate in high-latitude and highly productive regions, but are outcompeted in low-productivity areas. A similar biogeography was found by Serra-Pompei et al. (2020) who made the same assumption. When similar maximum grazing rates are prescribed, cruisers are generally outcompeted except at low food and turbulence levels as found in previous modelling studies (Prowe et al., 2019; Visser et al., 2008; Visser, 2007). The assumed excess in predation risk due to an active feeding mode, i.e. the value of , is also a key parameter. When maximum grazing rates are identical for both cruisers and ambushers, a high excess risk leads to an exclusion of the former in highly productive regions and at high latitudes (as in our LGE experiment), whereas a weak excess risk results in a domination by cruisers everywhere in the surface ocean.
4.3 Contribution of flux-feeders to ecosystem dynamics and carbon flux
We find flux-feeding mesozooplankton to be more abundant below the euphotic zone where they outcompete the suspension feeding modes (Fig. 5, Jackson, 1993). This is not surprising since the main source of energy for mesozooplankton in the mesopelagic layer is the flux of sinking organic particles, making flux-feeding the most advantageous mesozooplankton feeding strategy. In particular, they prefer large, rapidly sinking particles, as the particle flux constrains the probability of feeding and flux-feeders would clear large particles more efficiently than smaller ones, that sink more slowly (Jackson, 1993; Kiørboe, 2011). In the interior of the ocean, the abundance and vertical distribution of flux-feeders closely align with the flux of particles. Their abundance peaks in highly productive areas and declines with depth, mirroring the particle flux, which is itself influenced by flux-feeders. The depth at which flux-feeders become dominant depends on the euphotic depth and therefore, on surface productivity (the euphotic depth being shallower in productive zones and deeper in oligotrophic regions, Stemmann et al., 2004). As a result, in the top 150 m (see Appendix, Fig. A4, right panels), the vertically integrated biomass of flux-feeders is comparable to that of suspension feeders in the highly productive regions where the euphotic depth is shallow and the flux of particles elevated (Stukel et al., 2019).
Stukel et al. (2019) showed that suspension feeders do not significantly affect carbon export at depth due to insufficient clearance rates. In contrast, flux-feeders play a major role in regulating deep-sea carbon export, influencing both the vertical attenuation and the overall magnitude of particle flux (Steinberg and Landry, 2017; Stukel et al., 2019). In our study, we show that carbon export and transfer efficiency are strongly influenced by flux-feeders. This is particularly true in highly productive areas such as the Eastern Boundary Upwelling Systems, where flux-feeders are very abundant (see Appendix, Fig. A4, right panels) and where the carbon efficiency is minimal (Fig. 10b). Our different experiments show that an increase in flux-feeders abundance decreases carbon efficiency and vice versa, which is especially evident in the experiment where flux-feeders are removed (KILL_FF). This experiment simulates the highest carbon transfer efficiency values (Fig. 10f) due to the absence of flux-feeders' grazing on particles. It thus highlights the key role that these organisms play in the water column, in particular in highly productive regions: they decrease the efficiency of carbon export, increase the remineralization of particles in the upper mesopelagic zone and thus favour productivity in the upper ocean.
Another key process affecting the fate of organic particles in the ocean interior is their degradation by heterotrophic bacteria (Buesseler and Boyd, 2009; Nguyen et al., 2022). Bressac et al. (2024) recently showed that flux-feeders have a greater influence on flux attenuation than bacteria in the upper mesopelagic zone, as bacterial degradation accounts for only 7 %–29 % of flux attenuation. We also compare the remineralization of particulate organic carbon by bacterial activity and by flux-feeder grazing (not shown here; see Appendix, Fig. A11). Our results indicate that, on a global scale and between 150–1000 m, bacterial activity has a greater impact than flux-feeder grazing (see Appendix, Fig. A11a and b). However, regionally, the dominance index between flux-feeders and bacterial activity reveals a stronger influence of flux-feeders in coastal and highly productive regions (see Appendix, Fig. A11c), with a tendency towards co-dominance in regions of intermediate productivity and at high latitudes. This highlights that, in areas where flux-feeders are abundant within the 150–1000 m depth range, their activity surpasses bacterial activity, underlining the key role flux-feeders play in the carbon cycle.
4.4 Model limitations
As in any theoretical modelling exercise, our results strongly rely on our hypotheses and parameter choices. Even though this study was designed to investigate the impact of mesozooplankton functional diversity on ecosystem dynamics and carbon fluxes through their feeding modes, the mesozooplankton compartment was only expanded to three coarse feeding strategies. However, observations reveal greater diversity in these feeding modes. Among cruise-feeding zooplankton, some organisms generate feeding currents such as the copepod Temora longicornis, to either filter prey items from the current or capture them when entrapped (Kiørboe, 2011). Others swim actively, such as the copepod Centropages hamatus and employ raptorial strategies upon detecting prey items using chemotactic, rheotactic, or visual cues, which influence both detection efficiency and dietary preferences. Similarly, within ambushers, Kiørboe (2011) distinguished between passive ambush feeders that encounter and capture prey items passively such as Oithona nana or Acartia tonsa copepods (Almeda et al., 2018) and active ambush feeders that actively attack their prey such as ciliates of the Mesodinium genus (Kiørboe, 2011). This wide diversity in the foraging techniques and detection modes controls the feeding efficiency and the types of prey that are ingested by mesozooplankton, a diversity that is only crudely represented in our modelling framework. Thus, our model and experiments underestimate the diversity of feeding strategies by considering only three main groups.
This large diversity in the feeding strategies and their success finds its source in the foraging but also in the defence trade-offs which reflect the fundamental dilemma between eating and being eaten (Tilman, 1990; Cadier et al., 2019; Werner and Anholt, 1993). Here, we use a simple representation of these trade-offs between gains (ingestion) and losses (metabolic costs and predatory risk) from a specific set of hypotheses solely based on the foraging activity. Yet, other factors modulate the behavioural strategy of the zooplanktonic organisms. For instance, mate seeking leads to a systematic higher mortality by predation in males, particularly among ambushers, such as Oithona copepods (Almeda et al., 2017; Kiørboe, 2008). Additionally, zooplankton can mitigate their mortality risk through defensive adaptations such as chemical signalling and morphological changes to reduce ingestion likelihood, as well as avoidance and escape behaviours – like seeking spatial refuges, performing diurnal vertical migrations or forming swarms for euphausiids – to decrease predators' chances of successful encounters and captures (Ohman, 1988). For instance, diurnal vertical migration performed by active feeders such as Calanoid copepods, is an efficient defence strategy (Ohman, 1990) and may reduce lateral transport that may contribute to their success in very productive upwelling systems (Batchelder et al., 2002; Atkinson et al., 2018).
In our study, we assumed that mesozooplankton are not able to switch from one feeding strategy to another. In other words, organisms are assigned an obligate feeding strategy which cannot change depending on the abiotic or biotic conditions. Yet, some zooplankton taxa, such as Acarcia tonsa copepods (Kiørboe et al., 1996), can switch from one to another predation mode, for instance as a function of prey abundance (as it is the case for A. tonsa) and type (Tiselius and Jonsson, 1990; Benedetti et al., 2016). Integrating this flexibility in our model might change the dynamics of the zooplankton community, notably inducing more co-dominance of the predation modes since there would be a very rapid switch in occurrence of the feeding mode, whereas, in our approach, a change in the dominance by a feeding mode is only achieved through a change in the relative abundance of specialized functional groups. Representing this ability to switch and having more co-dominance would also lead to predicting seasonal alternations among suspension feeders, which is not the case here, as both groups have the same prey preferences. Thus, in our modelling framework, variations in the relative abundance of different prey types cannot induce such alternations. Yet, introducing a generalist feeding group capable of dynamically adjusting its feeding strategy would require a detailed understanding of the trade-offs between generalist and specialist feeding strategies. To our knowledge, these trade-offs have not been quantified so far. While some modelling studies did explore the dynamics of adaptive feeding strategies, we are unaware of any that integrate both obligate and facultative feeding strategies (Mariani et al., 2013; Kenitz et al., 2017).
Observations and laboratory experiments also suggest that ambushers tend to consume larger, more motile preys such as microzooplankton or dinoflagellates, while cruisers prefer smaller less motile preys (Almeda et al., 2018; Kiørboe, 2011). In our modelling experiments, prey preferences are not modified from the standard configuration of the PISCES model (PISCES-STD), which includes only one PFT for mesozooplankton. Consequently, we assume that both suspension feeding groups share the same diet. Allowing for differences in prey preferences is another perspective that could lead to a different spatial and temporal distribution of cruisers and ambushers. It could also modify the structure and composition of the prey community through a trophic trait cascade (Kenitz et al., 2017). However, this approach would require accurate representation of the dynamics of both microzooplankton and phytoplankton, in particular a description of their motility capacities (Buitenhuis et al., 2010; Schmoker et al., 2013).
Finally, body size is a master trait that impacts metabolic losses, ingestion rates, diet and predatory losses (Kiørboe, 2016; Serra-Pompei et al., 2022) and that also interacts with feeding strategies. Additionally, it plays a crucial role in shaping diurnal vertical migration patterns and fecal pellet size, as larger body size is associated with deeper migrations and increased fecal pellet size. Both factors significantly impact carbon export, particularly its effectiveness in sequestering carbon in the ocean (Ohman and Romagnan, 2016; Aumont et al., 2018; Stamieszkin et al., 2015).
Body size also governs sinking speed, which, according to Stokes' Law, increases with the square of the organism's equivalent spherical diameter. For ambushers, the length of repositioning jumps scales approximately with body length, meaning jump frequency should scale with their body length (Kiørboe et al., 2010). As a consequence, ambush feeding mode becomes increasingly risky and energetically more costly for larger organisms, making it less advantageous. Serra-Pompei et al. (2020) showed that above a size of about 1 mm, ambush feeding is systematically outcompeted by active feeding modes, as they would lose too much energy in swimming to maintain their position in the water column. Observations also suggest that ambushers are rare among large copepods, while active organisms are found among smaller and larger copepods (Benedetti et al., 2023 and see Appendix, Fig. A13). Additionally, the study by Benedetti et al. (2023) also considered organism size as a major trait. The biogeography they predicted for active organisms varies depending on their body size whereas more similar spatial distributions are obtained for passive organisms, no matter their size. Furthermore, in the trait dataset used by Benedetti et al. (2023), the majority of large copepod species corresponds to active organisms such as cruisers, while for the smallest copepods species, there is no clear dominance between passive and active organisms (see Appendix, Fig. A13). This is correlated with Fig. 5 of Benedetti et al. (2023), where the largest copepods are found at high latitudes, and would thus correspond to their cruisers (Fig. 5b and k of Benedetti et al., 2023), while the smallest ones are found at lower latitudes and would correspond to ambushers (Fig. 5b and i of Benedetti et al., 2023).
Therefore, dividing suspension feeders into at least two size classes and including DVM and/or fecal pellet production in our model could provide a more realistic representation of pelagic ecosystems, with larger cruisers contributing more to carbon export through deeper migrations and larger fecal pellets.
Mesozooplankton are frequently considered as a single compartment in marine biogeochemical models. Their wide diversity of traits and the multiple ecological functions they ensure in marine ecosystems are thus insufficiently resolved. To tackle this issue and evaluate its impacts on our understanding of the biological carbon pump, we integrated three distinct feeding strategies in the PISCES biogeochemical model. The simulated fields of total plankton biomass were positively evaluated against observational data and we showed that suspension feeders (cruisers and ambushers) are most abundant in the surface layers with ambushers being the dominant group while flux-feeders thrive at depth. The resulting biogeography depends on the trade-offs between ingestion, respiration and mortality by predation and the hypotheses we made, based on the current knowledge of mesozooplankton diversity in feeding behaviours. This spatial repartition of the feeding strategies also depends on the chosen parameters, such as quadratic mortality and grazing rates, which affects lower trophic levels such as microzooplankton and phytoplankton. However, there is still a great deal of uncertainty in quantifying these trade-offs, making it difficult to understand and interpret the biogeography. Additionally, we showed that the representation of flux-feeders plays a major role on carbon export at depth due to their position in the water column. Then, making this group explicit leads to a better understanding of the fate of carbon at depth as flux-feeders have direct implications on sinking particles.
While the lack of representation of mesozooplankton functional diversity (in grazing for instance) is considered as the greatest uncertainty in climate projections of carbon cycle (Rohr et al., 2023), this study showed the importance of various predation strategies on a global scale and the necessity to enhance the representation of mesozooplankton functional diversity in biogeochemical models. It also underlined the need for more in situ and experimental quantitative data, to better quantify the trade-offs between functional traits and thus better constrain our modelling framework. Data obtained in controlled laboratory experiments would for instance allow us to better represent and parameterize predation strategies in biogeochemical models, hence contributing to better evaluating the impact of feeding strategies on global biomass and biogeochemical fluxes. Such representation does not drastically modify the marine biogeochemistry at global scale. Hence, if computing cost is a concern and details in the mesozooplankton description are not a priority, this more detailed representation can likely be omitted. However, if mesozooplankton dynamics are central, for instance when investigating higher trophic levels (Mitra et al., 2014), this configuration is certainly worth considering. Furthermore, an interesting perspective would be to use this configuration in the context of climate projections to investigate how mesozooplankton biogeography would evolve under climate change, as well as evaluate the projected changes in ecosystem-driven carbon fluxes.
A1 Sensitivity experiments
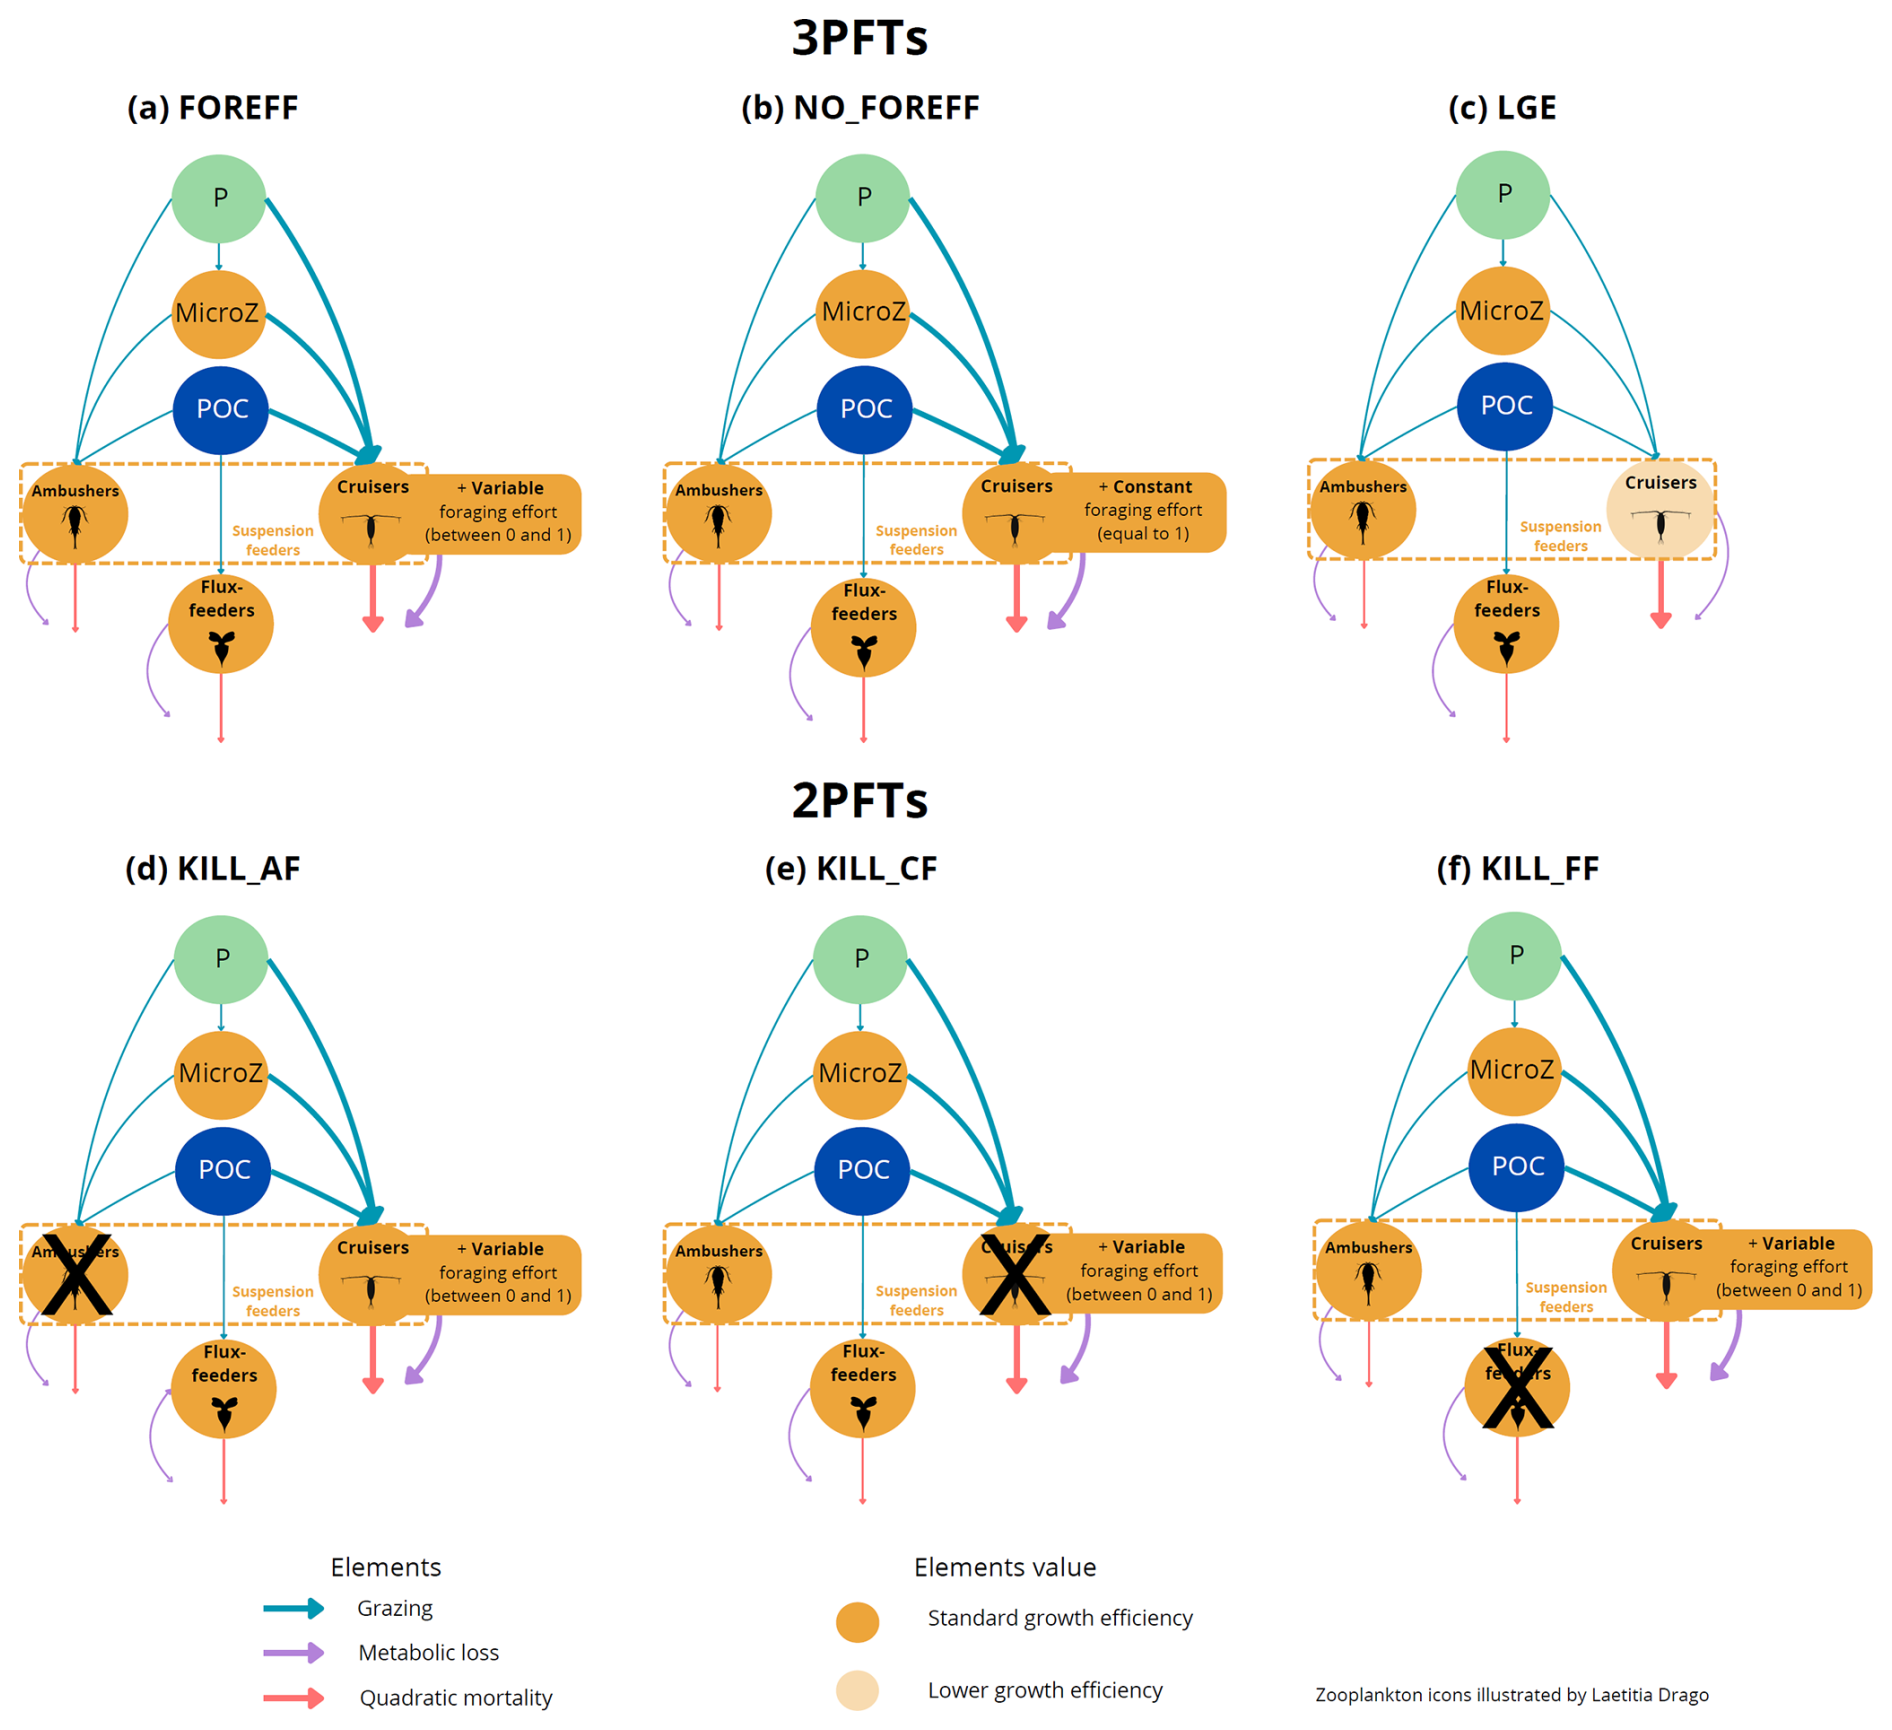
Figure A1(a) FOREFF reference configuration, (b) NO_FOREFF experiment, and (c) LGE experiment. The thickness of the lines account for the intensity of the grazing rate or flux-feeding rate (blue), metabolic loss parameter (purple) and quadratic mortality parameter (red). The transparent orange shading for cruisers in LGE (c) accounts for the lower growth efficiency . NO_FOREFF (b) is the same as FOREFF (a) but with a constant foraging effort equals to 1. The KILL_XX experiments (where XX accounts for CF (cruisers), AF (ambushers) and FF (flux-feeders)) are the same as FOREFF (a) but one group is removed. P stands for phytoplankton and Z for microzooplankton.
A2 Mesozooplankton dynamics
Mesozooplankton grazing for suspension feeders (cruisers and ambushers) in PISCES is concentration-dependant and based on a Michaelis–Menten parameterization with no switching and a threshold (Aumont et al., 2015; Gentleman et al., 2003).
Where the different preys are nanophytoplankton (P), diatoms (D), microzooplankton (Z) and small organic particles (sPOC). represent the grazing rate of suspension feeders on the different preys I:
Where F is the food availability of each prey I, Flim is a food limitation term, Kg is the half-saturation constant for grazing, PI is the preference on prey I (set to 0.3 for nanophytoplankton and sPOC and 1 for diatoms and microzooplankton, Aumont et al., 2015) and is a food threshold. p is the foraging effort for cruisers. It is thus only implemented in the grazing formulation of cruisers and defined in Eq. (A4).
Flux-feeding is accounted for such that it depends on the product of the concentration of particles by the sinking speed.
Where is the flux-feeding on small and big particles I (sPOC and bPOC) and is the flux-feeding rate.
The foraging effort of cruisers p is computed as follows:
With:
In Eqs. (A5) and (A6), and represent the background metabolism and mortality rates. and represent the specific metabolic costs and mortality risk of active feeding. ρ represents the scaled resource concentration (with R the prey concentration) and fc is the scaled standard metabolism (Kiørboe et al., 2018a).
The foraging effort is adapted from Eq. (8) of Kiørboe et al. (2018a). In our study, it is implemented in Flim (Eq. A2) and in the respiration and quadratic mortality terms of Eq. (1). Hence, the equations for the two mortality terms of cruisers are now defined as:
The foraging effort varies in response to prey density (as shown on Fig. 2) to optimize the fitness of cruisers, so it decreases to zero in regions of low resource concentration to minimize the net energy loss of cruisers (Kiørboe et al., 2018a). This way, the foraging effort differs from zero only if the prey concentration R is greater than a minimum prey concentration Rmin:
A3 Comparison between model and observations
Figure A3 presents the surface nitrate from our study (Fig. A3a) and from the World Ocean Atlas climatology (Fig. A3b). The model represents particularly well the surface nitrate, with a correlation of 0.9 (p<0.001) and a positive bias of 1.7 mmol m−3. The global distribution is accurately represented as well, with a maximum of nitrate in the Southern Ocean, and a slight overestimation at high latitudes in the Northern Hemisphere.
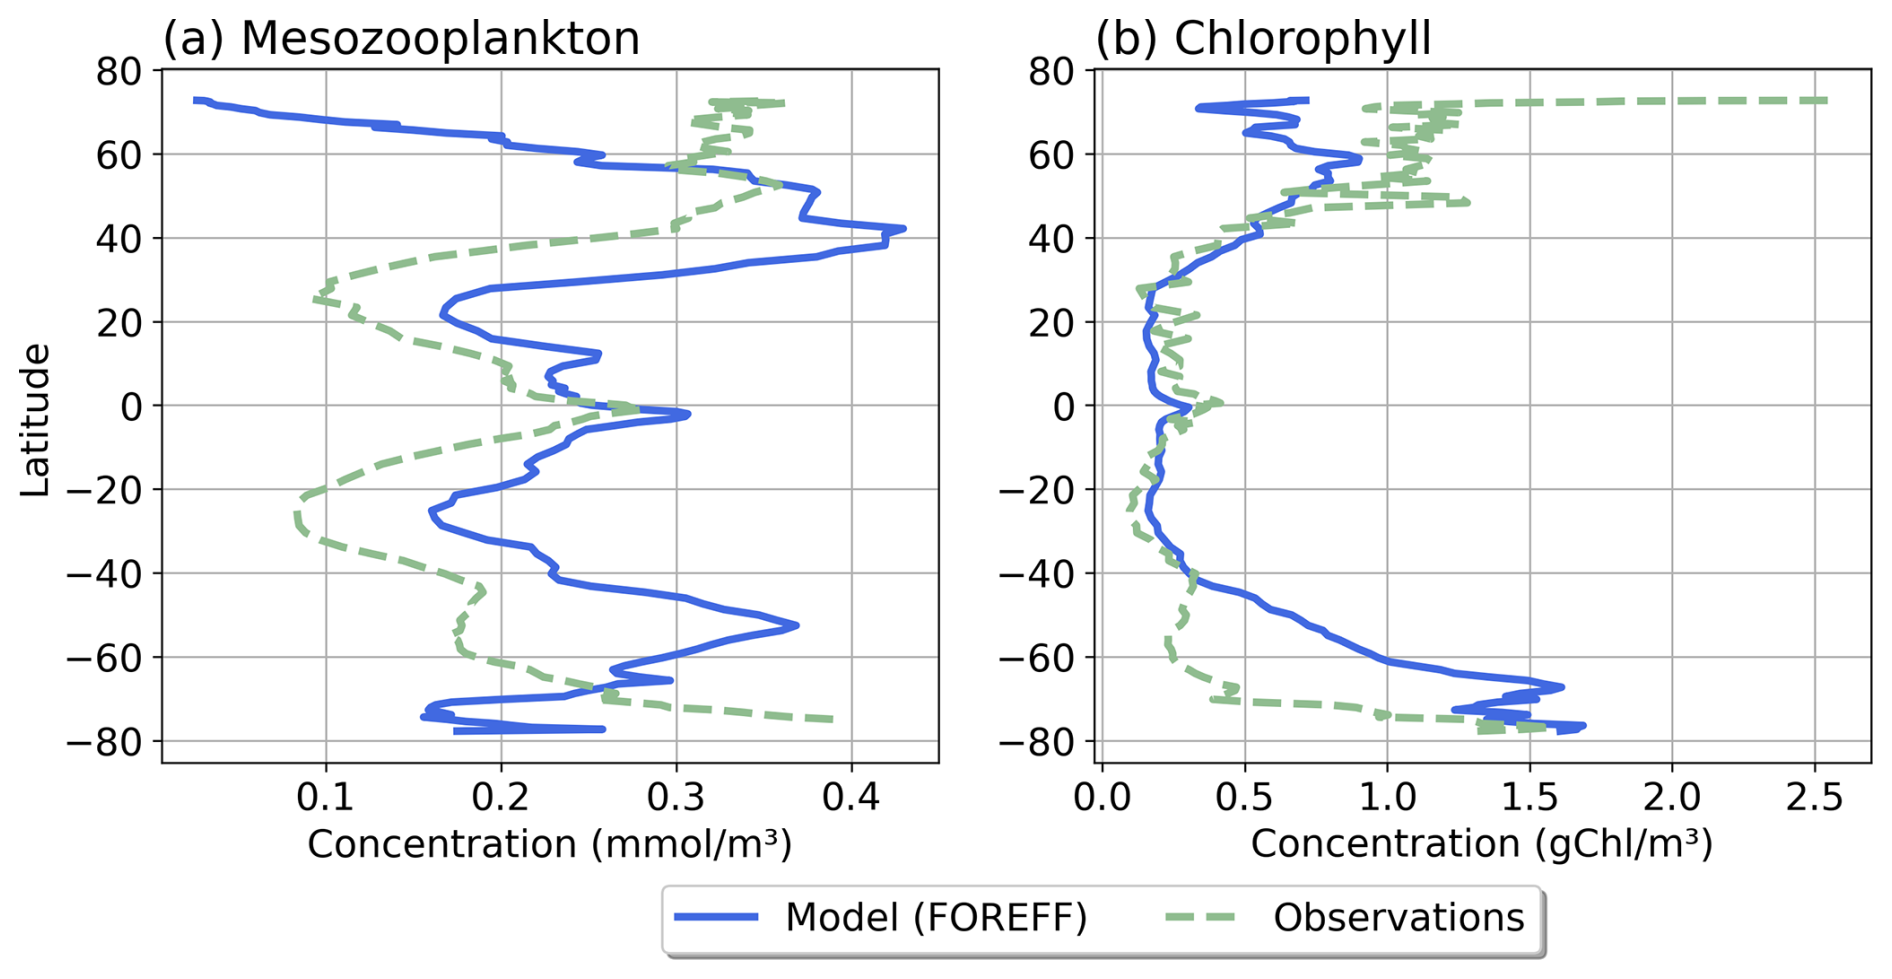
Figure A2Annual and zonal mean of (a) mesozooplankton integrated over 200 m and (b) surface chlorophyll for the FOREFF configuration (blue curves) and the observations (green curves).
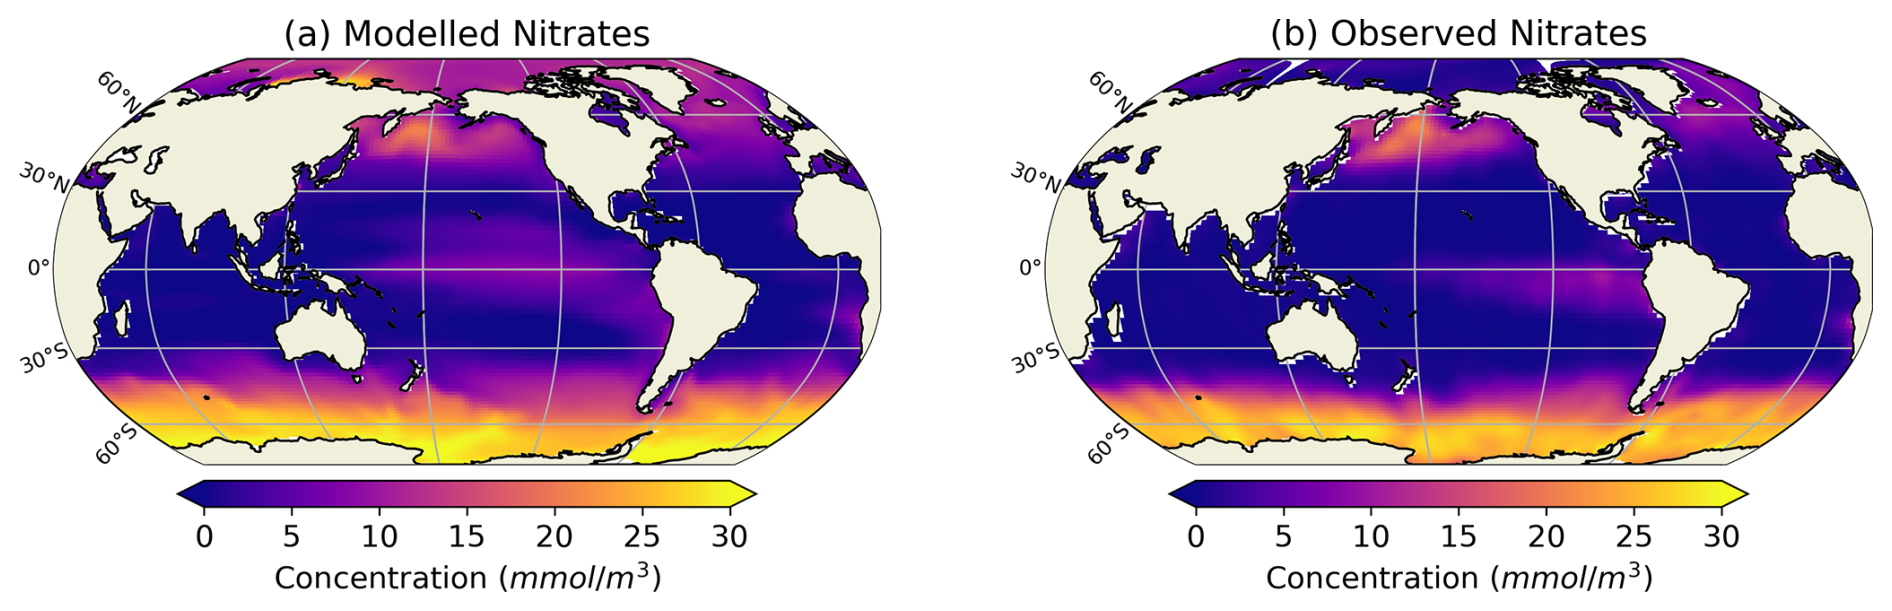
Figure A3Comparison between modelled and observed annual average surface nitrate. Observed surface nitrate are from World Ocean Atlas (Garcia et al., 2010).
A4 Mesozooplankton concentrations
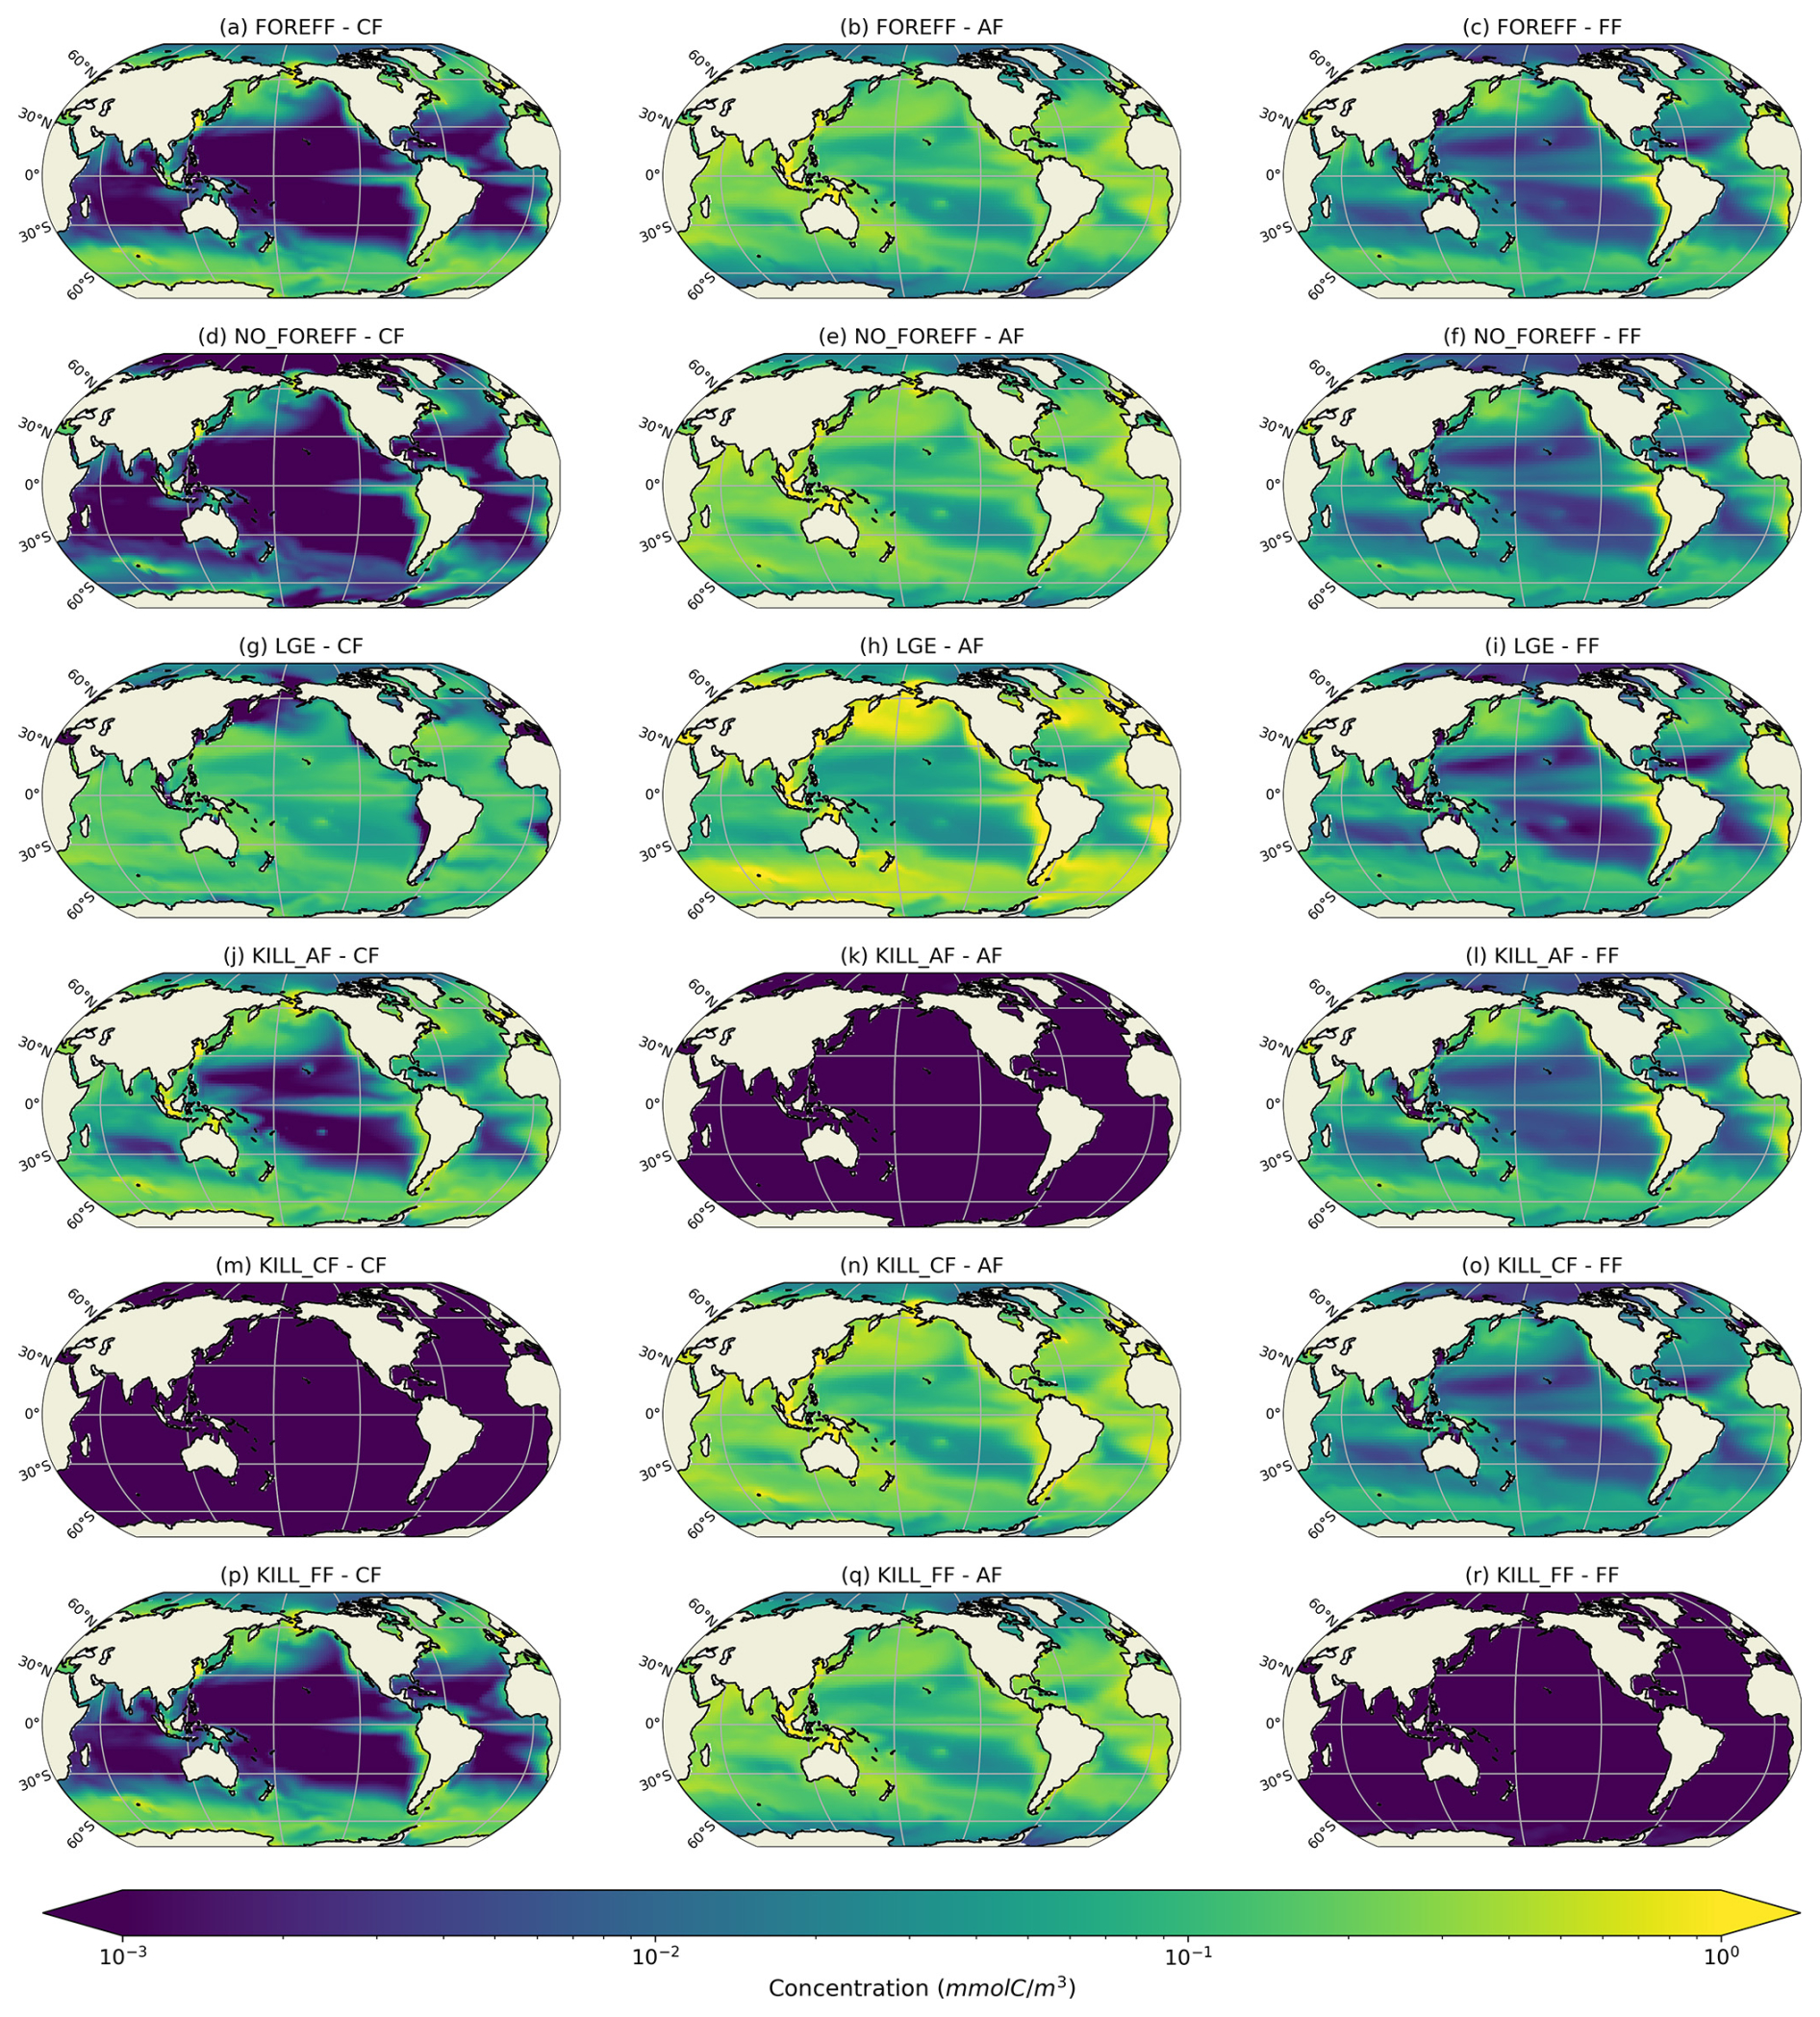
Figure A4Log scale annual mean concentrations of the mesozooplankton feeding strategies (cruisers: CF, ambushers: AF and flux-feeders: FF) for the different experiments averaged over the top 150 m.
A5 Mesozooplankton grazing at depth
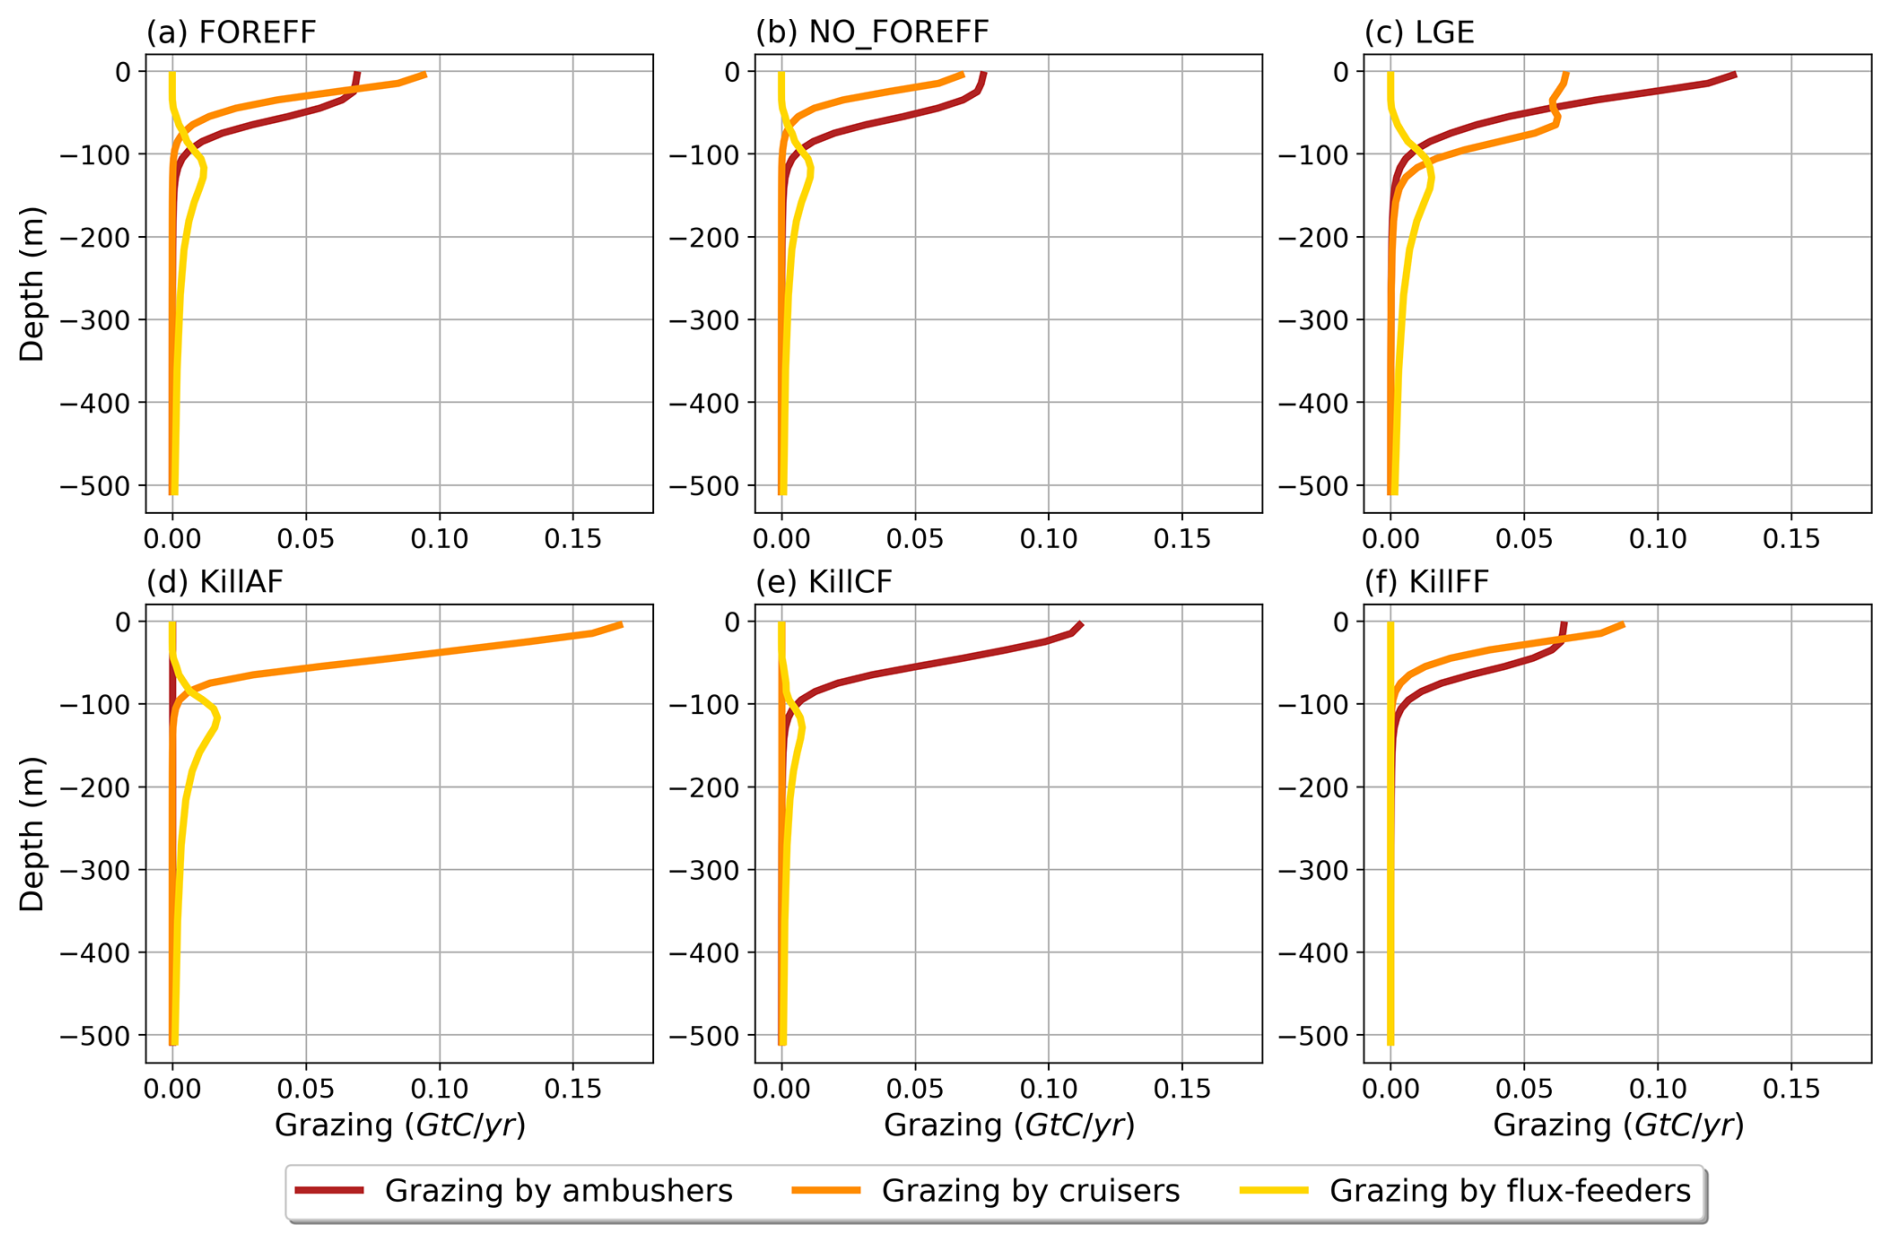
Figure A5Annual and spatial mean of the total modelled grazing fluxes (in Gt C yr−1) for the different mesozooplankton groups in (a) FOREFF, (b) NO_FOREFF, (c) LGE, (d) KILL_AF, (e) KILL_CF, and (f) KILL_FF.
A6 Biomass variation
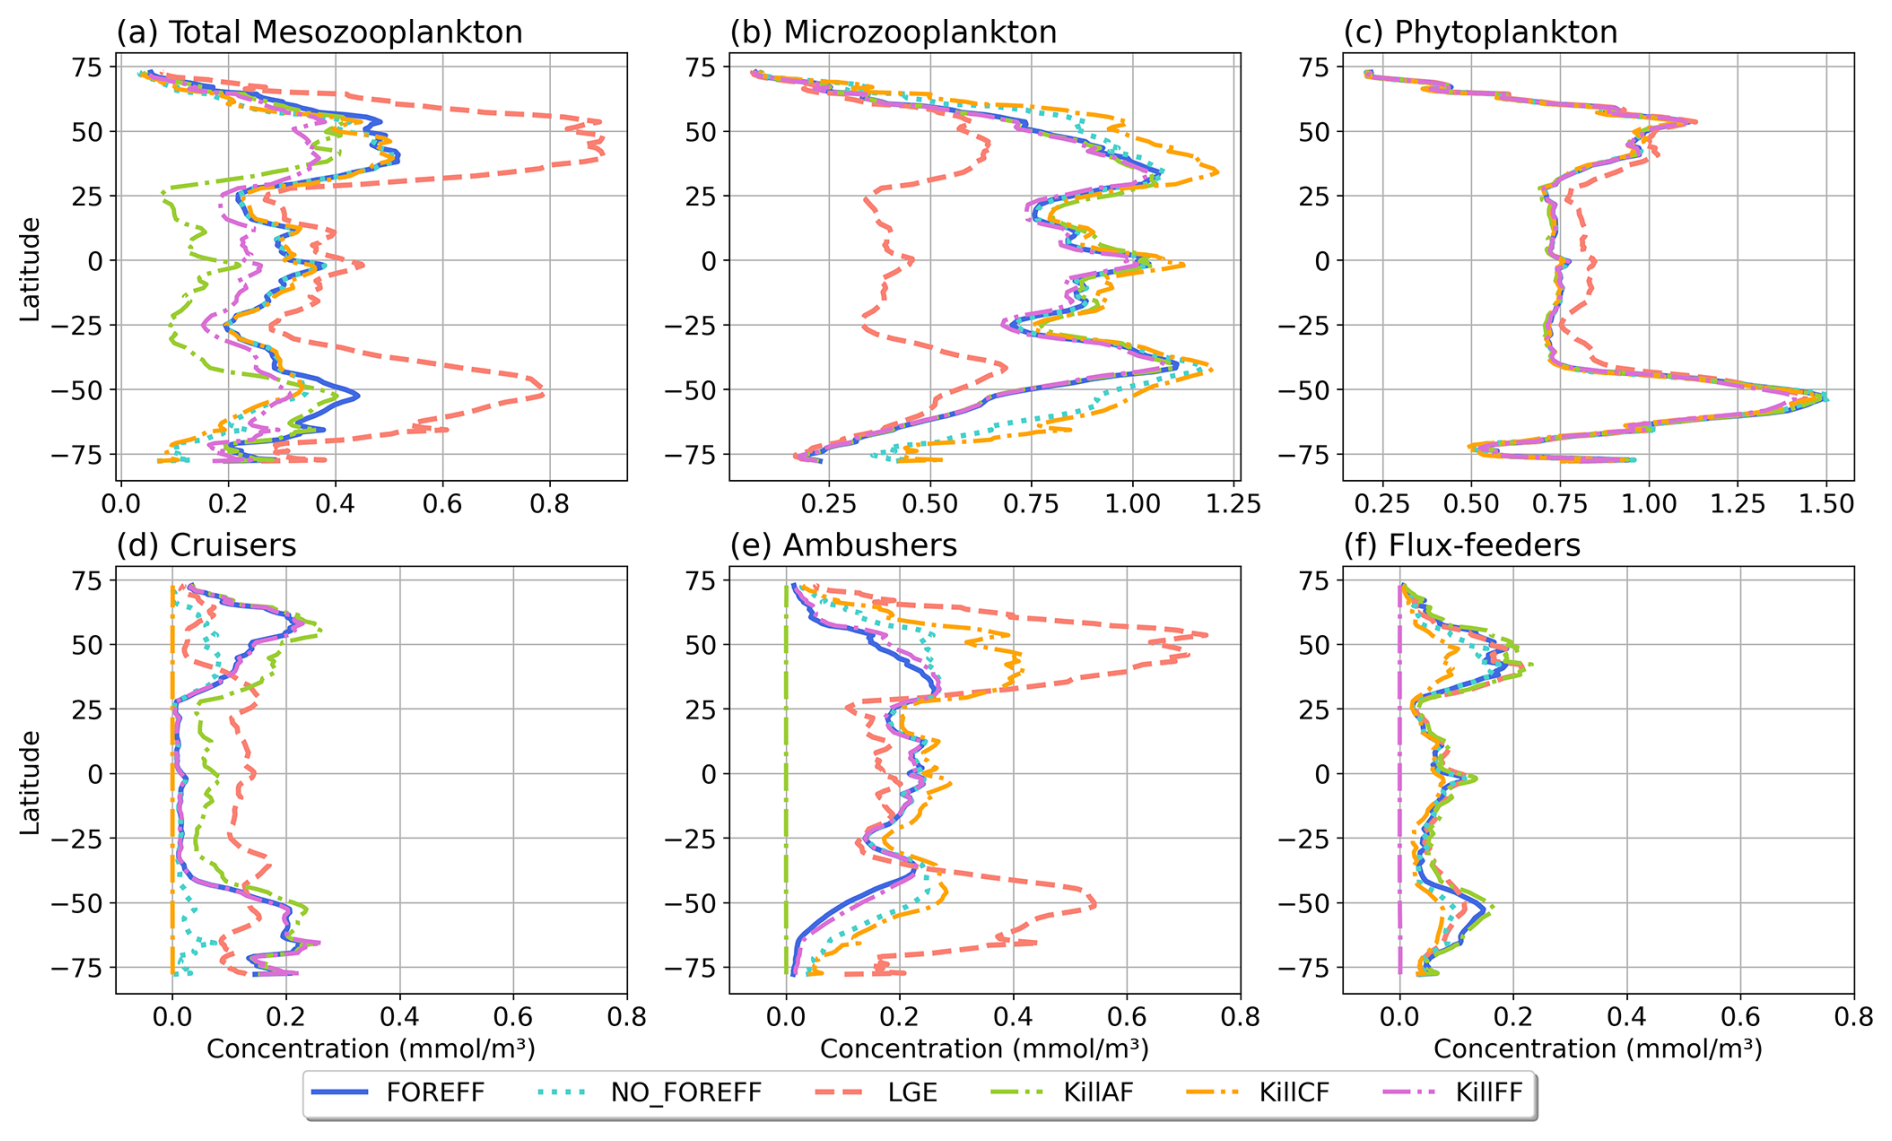
Figure A6Annual and zonal average calculated over 150 m for different tracers in different experiments. (a) Total mesozooplankton, (b) microzooplankton, (c) phytoplankton, (d) cruisers, (e) ambushers, and (f) flux-feeders.
A7 Seasonal variation of suspension feeders (cruisers and ambushers)
Figure A7 presents the seasonality in the Southern Hemisphere for every three PFTs experiment. In FOREFF (Fig. A7a), a peak of cruisers (orange curve) occurs in late winter (March), a little before the peak in ambushers (red curve). A similar pattern is obtained in NO_FOREFF (Fig. A7b), with the peak of cruisers and ambushers occurring at the same period, but with much lower concentrations of cruisers, and slightly higher concentrations of ambushers compared to FOREFF. Thus cruisers become dominated by ambushers most of the year, except during the seasonal peak in March and April, where cruisers are more abundant than ambushers. In LGE (Fig. A7c), the seasonal variation of ambushers is much higher as they dominate in these regions, and their concentration peaks in March, when cruisers also peak.
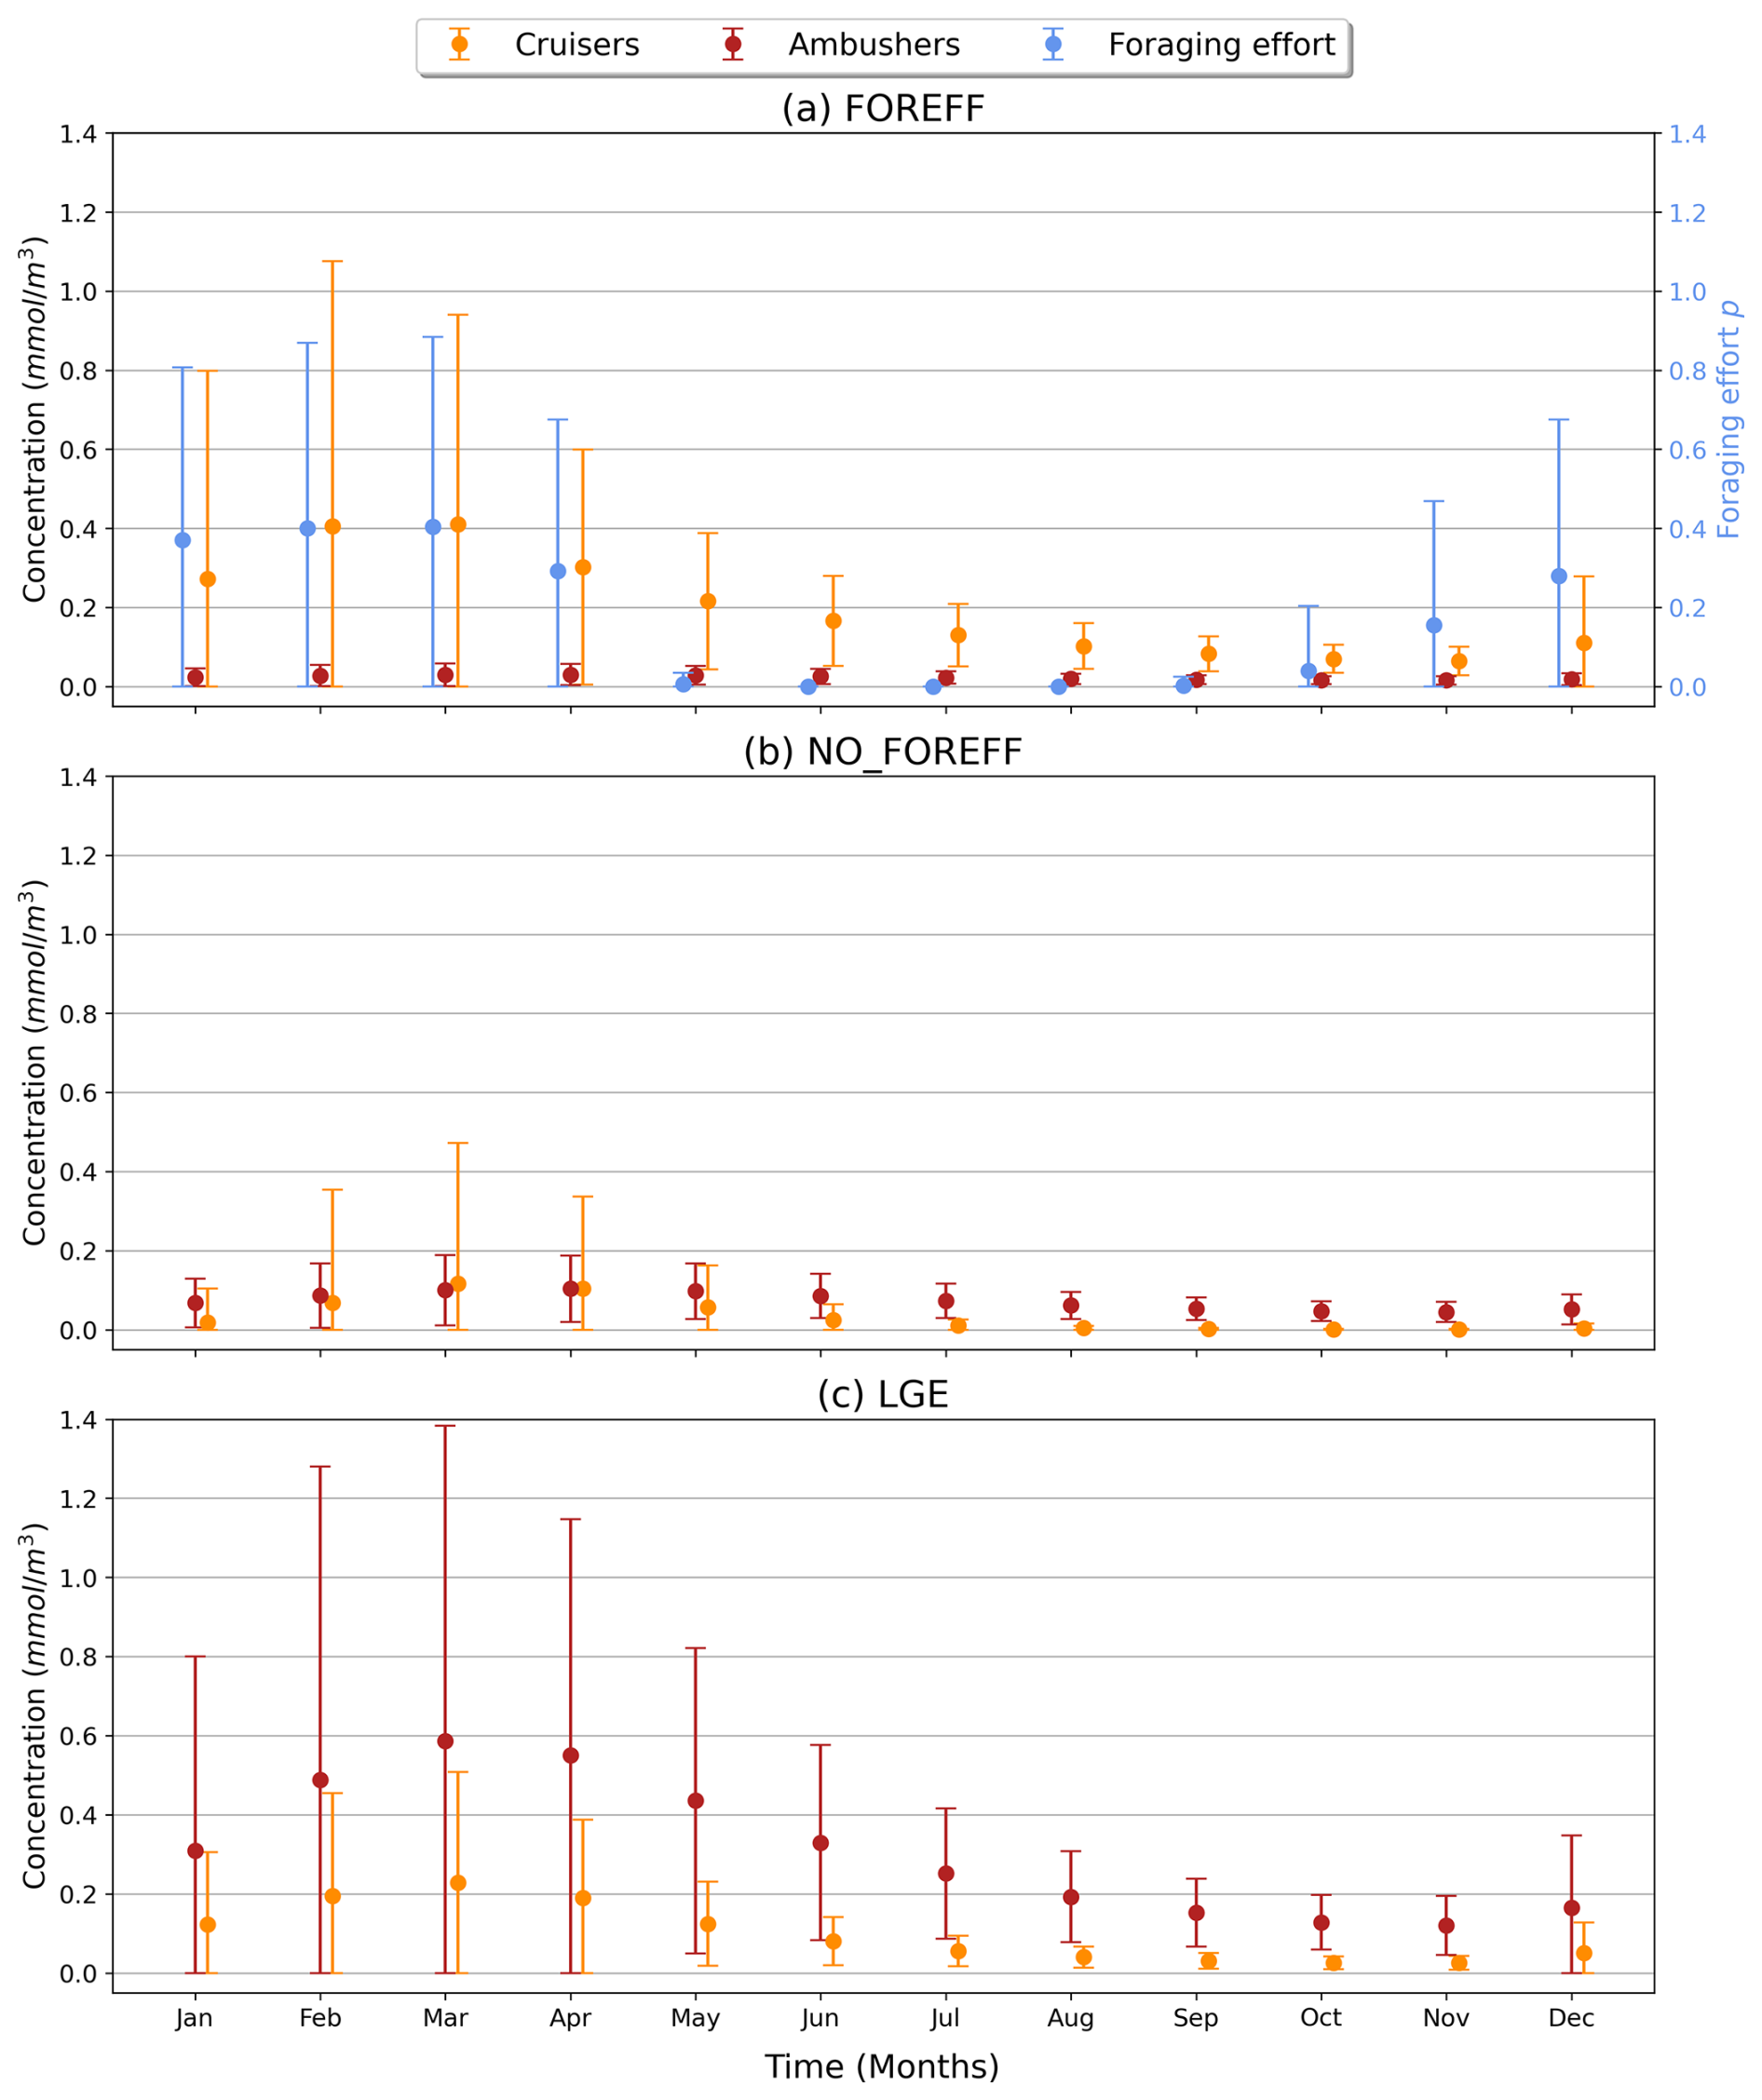
Figure A7Time series (in months) averaged over the top 150 m of cruisers (orange) and ambushers (red) in Southern latitudes (>60° S) for (a) FOREFF, (b) NO_FOREFF, and (c) LGE.
On Fig. A8, we assigned the value one to each point on the grid and in time where the concentration of ambushers (averaged over 150 m) is larger than that of cruisers, zero else. While resembling the dominance index (Fig. 6a), this map indicates where we have a dominance of ambushers all year long (values close to one, red shading) or of cruisers (values close to zero, white shading). We see that there are very few regions with intermediate values (between 0.3–0.7), meaning that there are few regions where there is a seasonal succession of the dominance between the suspension feeders. Thus in general, when one group dominates, it does so all year long.
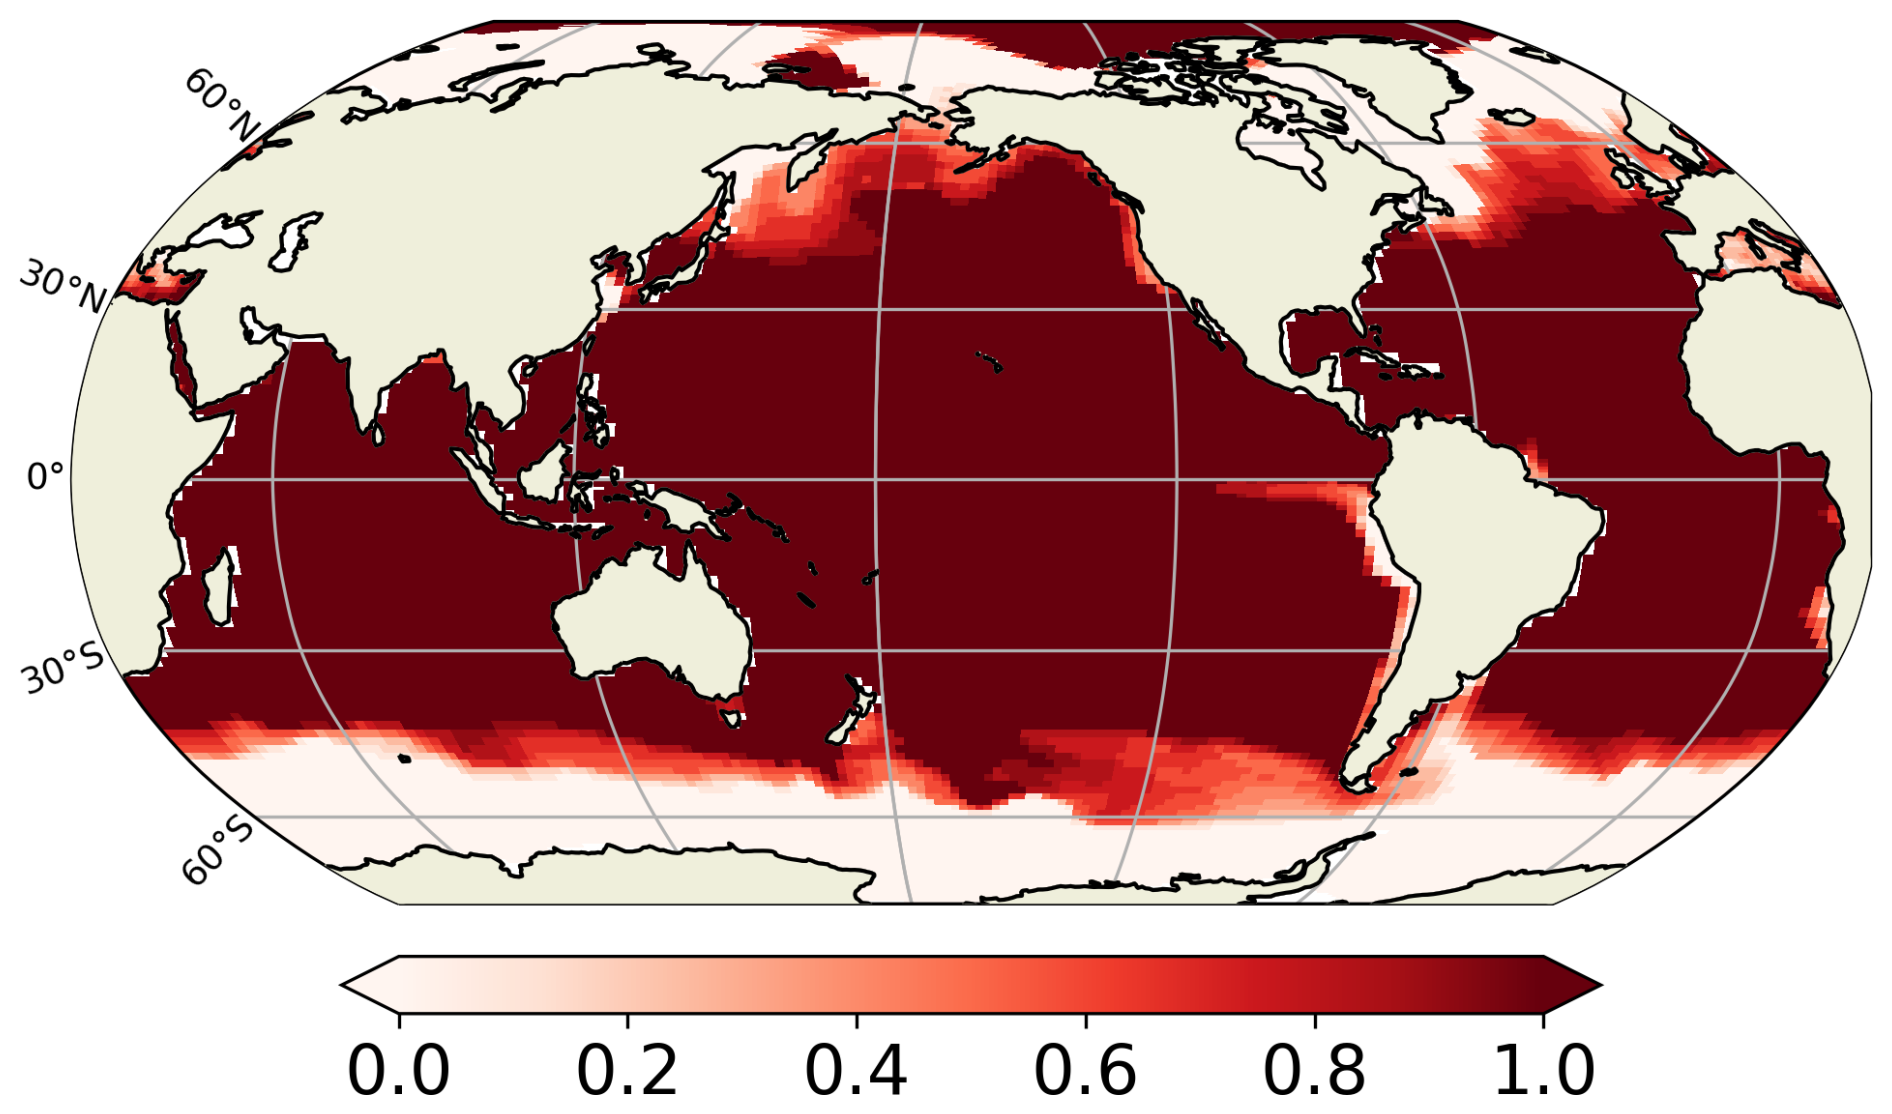
Figure A8Annual mean of the dominance of ambushers over cruisers, averaged over 150 m.
A8 Impact of flux-feeders on carbon cycle
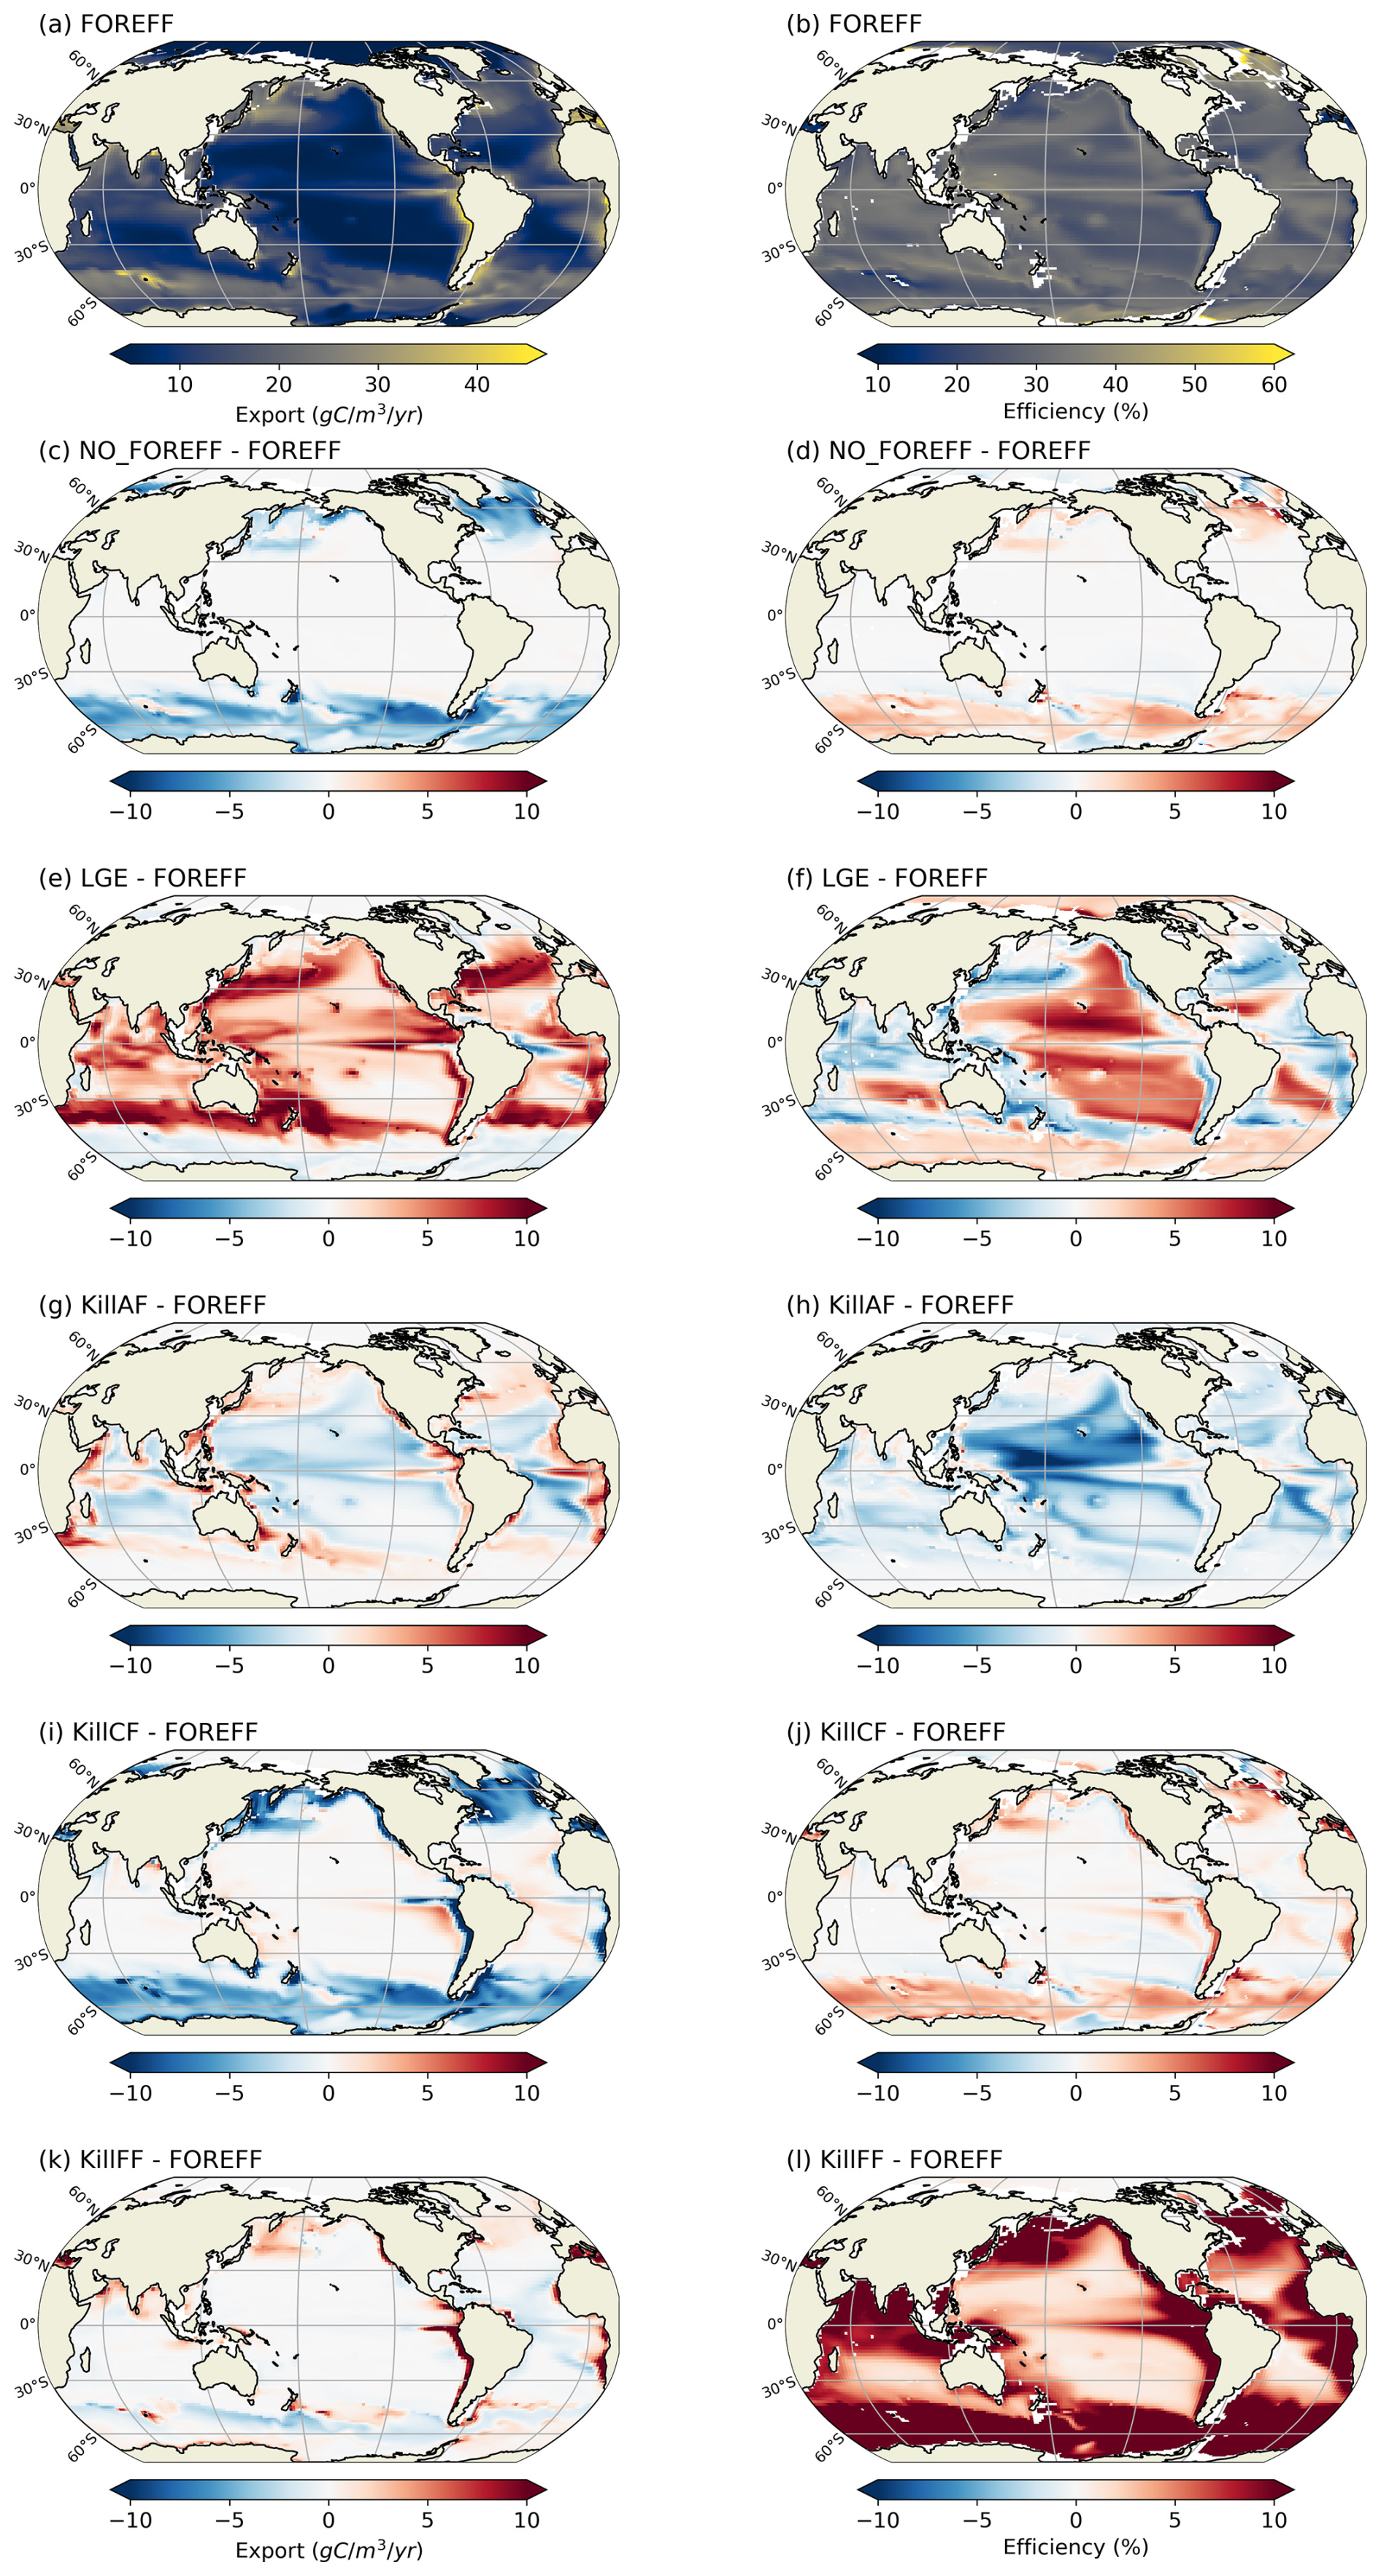
Figure A9Annual mean of (a) FOREFF carbon export at 150 m difference in carbon export and (b) FOREFF carbon transfer efficiency between 150–1000 m. Difference between FOREFF and (c, d) NO_FOREFF, (e, f) LGE, (g, h) KILL_AF, (i, j) KILL_CF, and (k, l) KILL_FF in carbon export over 150 m (left) and carbon transfer efficiency between 150–1000 m (right).
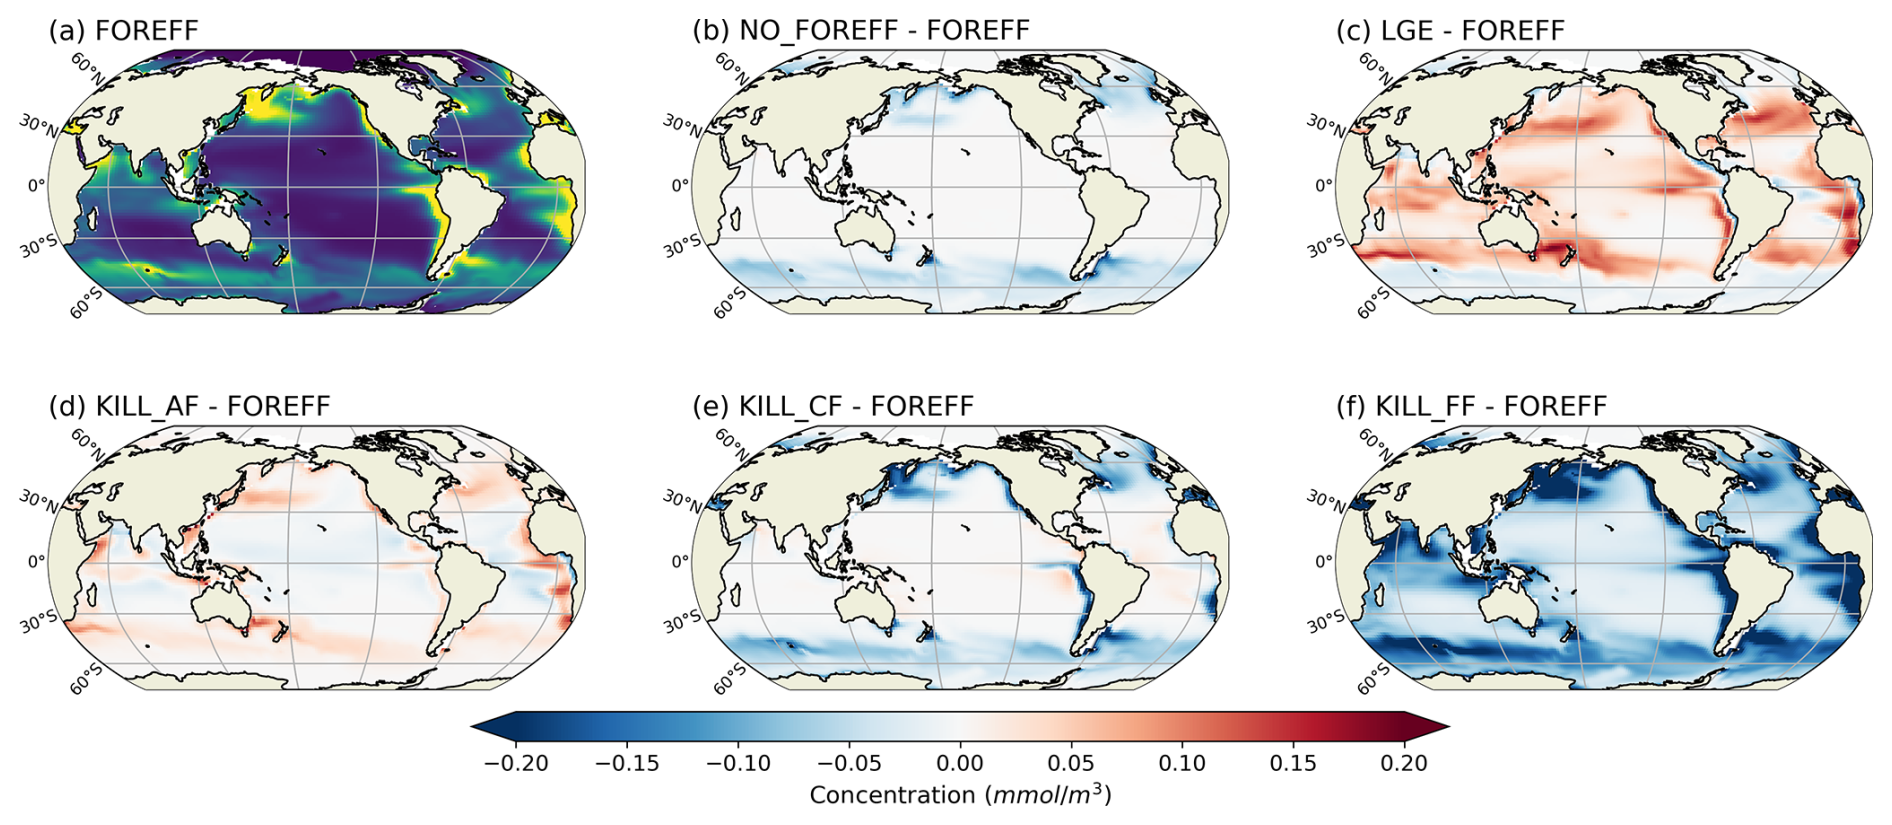
Figure A10Annual mean flux-feeders concentration averaged between 150–1000 m (a) and difference in flux-feeders concentration averaged between 150–1000 m for (b) NO_FOREFF - FOREFF, (c) LGE - FOREFF, (d) KILL_AF - FOREFF, (e) KILL_CF - FOREFF, and (f) KILL_FF - FOREFF.
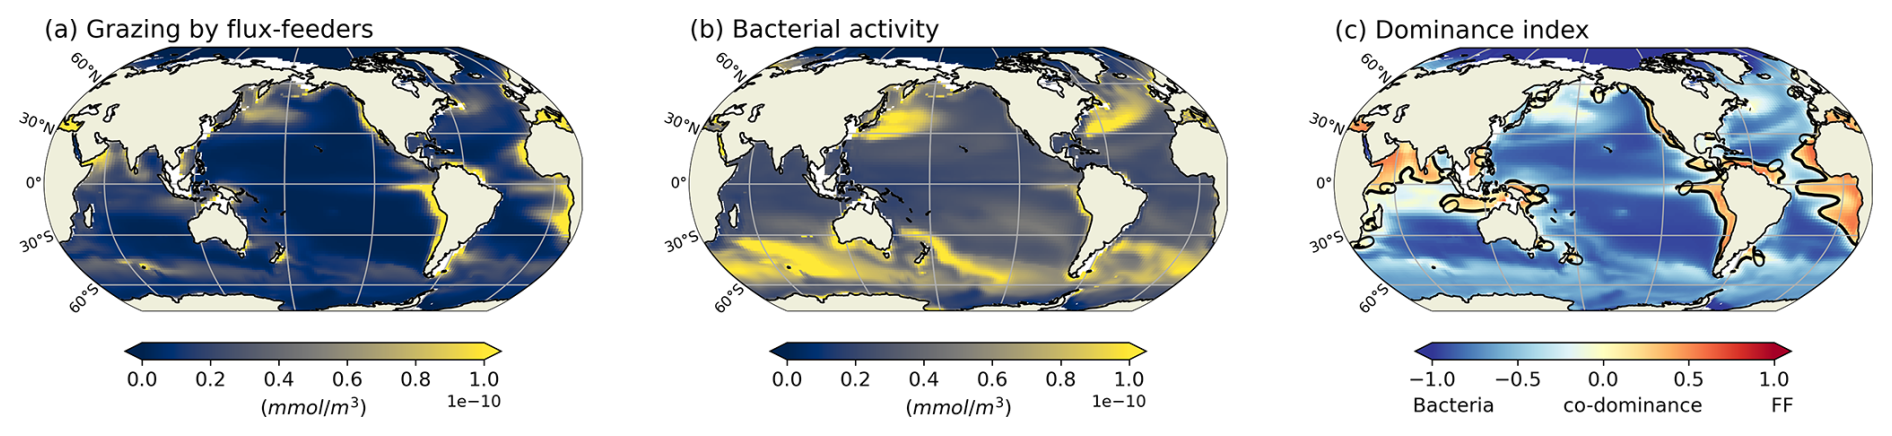
Figure A11Annual mean (a) grazing by flux-feeders, (b) bacterial activity, and (c) dominance index between the effect of flux-feeders and bacterial activities, averaged between 150–1000 m. Regions in blue indicate a larger bacterial activity, while regions in red indicate a larger flux-feeders activity. The black line indicates where the index is 0, i.e. where we obtain a co-dominance between the effect of flux-feeders and the effect of bacterial activity.
A9 Ecosystem dynamics
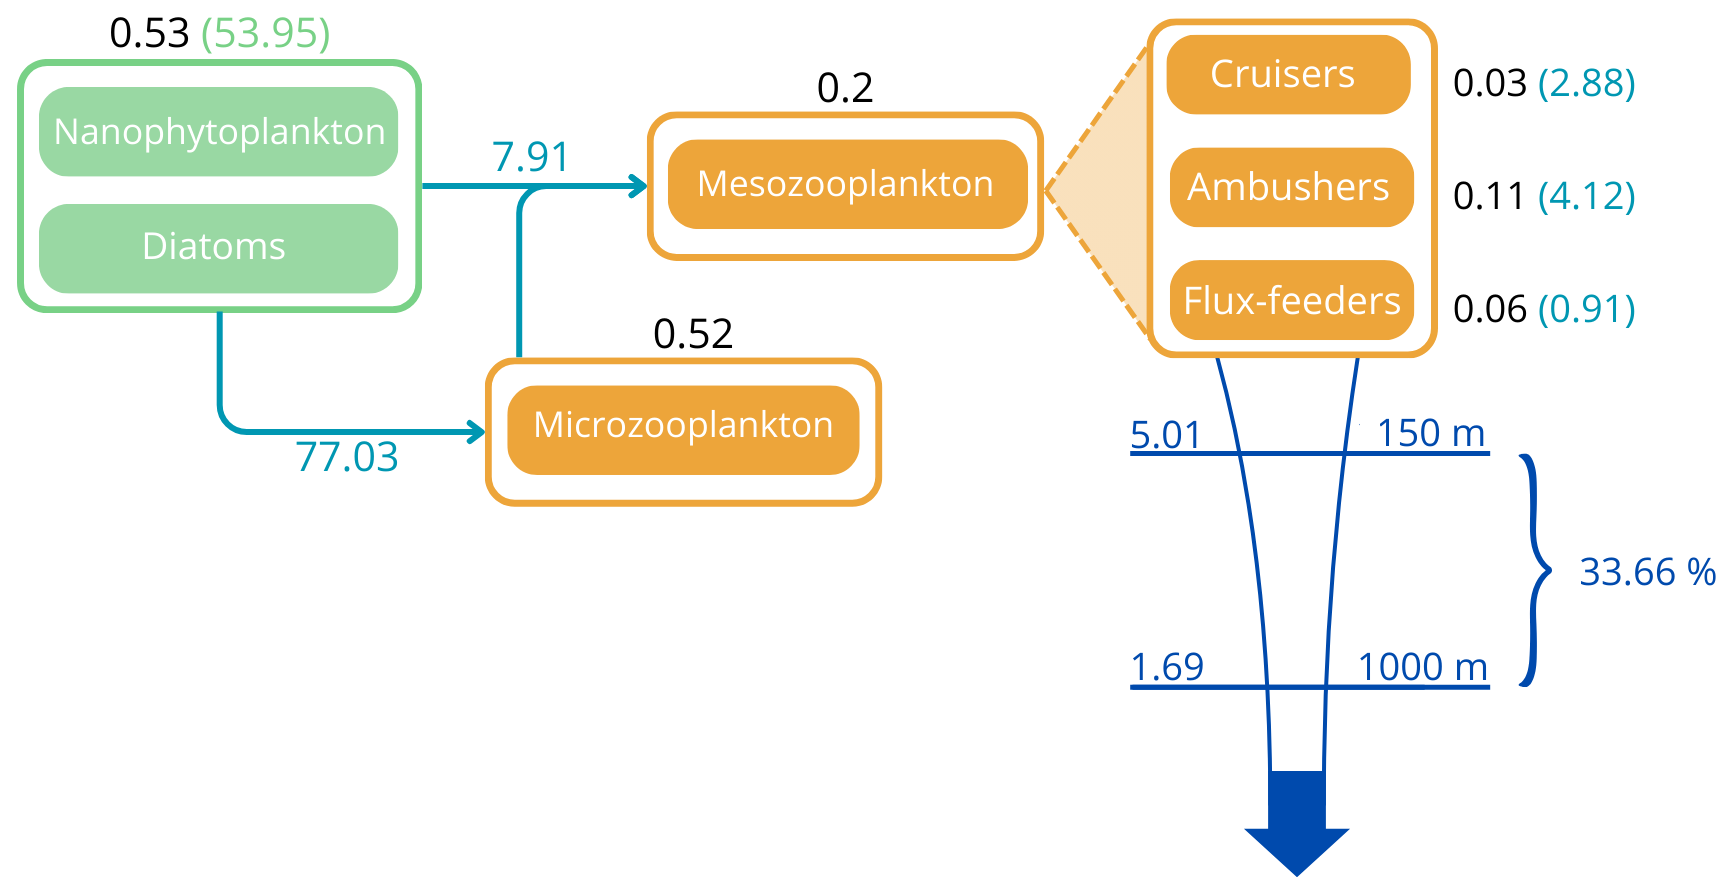
Figure A12Representation of the global ecosystem dynamics in the FOREFF configuration. Values are in Gt C yr−1. Values in black correspond to the biomass of each plankton group integrated over the top 150 m. Values in blue correspond to grazing by zooplankton and in green to phytoplankton primary production, integrated over the top 150 m. Values in dark blue correspond to carbon export and efficiency.
A10 Copepod distribution from Benedetti et al. (2023)
Figure A13 represents the relative proportion of the feeding modes for small (25th quantile) and big (75th quantile) copepods, from the Benedetti et al. (2023) dataset. Among the small copepods, there is no clear dominance of active feeding strategy. However, in the largest copepods, there is a clear dominance of active suspension feeders (i.e. cruisers and current feeders), while passive organisms such as ambushers' proportion is very low.
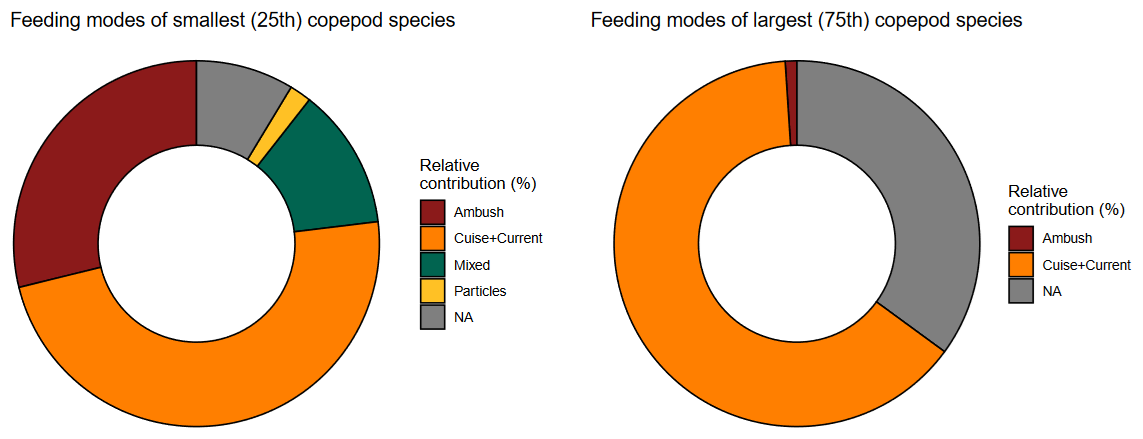
Figure A13Relative proportion of feeding modes for small (25th quantile) and large (75th) copepods, based on the dataset from Benedetti et al. (2023).
The code and model output needed to reproduce the figures are openly available from Zenodo (https://doi.org/10.5281/zenodo.15065240, Di Matteo et al., 2025).
LDM, SDA, and OA conceived the study. LDM developed the model, processed model outputs, performed the analysis and wrote the paper with the help of SDA and OA. SDA provided funding for the PhD project of LDM. All co-authors (LDM, FB, SDA, OA) contributed significantly to the improvement of the manuscript.
The contact author has declared that none of the authors has any competing interests.
Publisher's note: Copernicus Publications remains neutral with regard to jurisdictional claims made in the text, published maps, institutional affiliations, or any other geographical representation in this paper. While Copernicus Publications makes every effort to include appropriate place names, the final responsibility lies with the authors. Views expressed in the text are those of the authors and do not necessarily reflect the views of the publisher.
The French co-authors wish to thank French public taxpayers who fund their salaries. This research was funded by the French Agence Nationale de la Recherche (ANR), under grant ANR-22-CE02-0023-1 (project TRAITZOO), especially through a PhD grant to Lisa Di Matteo. Sakina-Dorothée Ayata also acknowledges support from the NECCTON project, which has received funding from Horizon Europe RIA under grant agreement no. 101081273. The authors thank the Ifremer DATARMOR computation cluster on which the numerical simulations were performed and the ESPRI (Ensemble de Services Pour la Recherche à l'IPSL) computing and data centre (https://mesocentre.ipsl.fr/, last access: 27 March 2025), which is supported by CNRS, Sorbonne Université, École Polytechnique, and CNES and through national and international grants. They also thank Renaud Person (IRD, LOCEAN) for his help in setting up the simulations.
A CC-BY public copyright license has been applied by the authors to the present document and will be applied to all subsequent versions up to the Author Accepted Manuscript arising from this submission, in accordance with the grant's open access conditions.
This research has been supported by the Agence Nationale de la Recherche (grant no. ANR-22-CE02-0023-1).
This paper was edited by Mark Lever and reviewed by Ken H. Andersen and two anonymous referees.
Alcaraz, M. and Strickler, J. R.: Locomotion in copepods: pattern of movements and energetics of Cyclops, Hydrobiologia, 167, 409–414, https://doi.org/10.1007/BF00026333, 1988. a, b
Almeda, R., van Someren Gréve, H., and Kiørboe, T.: Behavior is a major determinant of predation risk in zooplankton, Ecosphere, 8, e01668, https://doi.org/10.1002/ecs2.1668, 2017. a
Almeda, R., van Someren Gréve, H., and Kiørboe, T.: Prey perception mechanism determines maximum clearance rates of planktonic copepods, Limnol. Oceanogr., 63, 2695–2707, https://doi.org/10.1002/lno.10969, 2018. a, b, c, d, e, f
Atkinson, A., Polimene, L., Fileman, E. S., Widdicombe, C. E., McEvoy, A. J., Smyth, T. J., Djeghri, N., Sailley, S. F., and Cornwell, L. E.: Comment. What drives plankton seasonality in a stratifying shelf sea? Some competing and complementary theories, Limnol. Oceanogr., 63, 2877–2884, https://doi.org/10.1002/lno.11036, 2018. a
Aumont, O., Ethé, C., Tagliabue, A., Bopp, L., and Gehlen, M.: PISCES-v2: an ocean biogeochemical model for carbon and ecosystem studies, Geosci. Model Dev., 8, 2465–2513, https://doi.org/10.5194/gmd-8-2465-2015, 2015. a, b, c, d, e, f, g, h, i, j, k, l, m
Aumont, O., Maury, O., Lefort, S., and Bopp, L.: Evaluating the potential impacts of the diurnal vertical migration by marine organisms on marine biogeochemistry, Global Biogeochem. Cy., 32, 1622–1643, https://doi.org/10.1029/2018GB005886, 2018. a, b, c
Barton, A. D., Pershing, A. J., Litchman, E., Record, N. R., Edwards, K. F., Finkel, Z. V., Kiørboe, T., and Ward, B. A.: The biogeography of marine plankton traits, Ecol. Lett., 16, 522–534, https://doi.org/10.1111/ele.12063, 2013. a, b
Batchelder, H. P., Edwards, C. A., and Powell, T. M.: Individual-based models of copepod populations in coastal upwelling regions: implications of physiologically and environmentally influenced diel vertical migration on demographic success and nearshore retention, Prog. Oceanogr., 2–4, 307–333, 2002. a
Becker, É. C., Mazzocchi, M. G., de Macedo-Soares, L. C. P., Costa Brandão, M., and Santarosa Freire, A.: Latitudinal gradient of copepod functional diversity in the South Atlantic Ocean, Prog. Oceanogr., 199, 102710, https://doi.org/10.1016/j.pocean.2021.102710, 2021. a
Benedetti, F., Gasparini, S., and Ayata, S.-D.: Identifying copepod functional groups from species functional traits, J. Plankton Res., 38, 159–166, https://doi.org/10.1093/plankt/fbv096, 2016. a
Benedetti, F., Wydler, J., and Vogt, M.: Copepod functional traits and groups show divergent biogeographies in the global ocean, J. Aircraft, 50, 8–22, https://doi.org/10.1111/jbi.14512, 2023. a, b, c, d, e, f, g, h, i, j, k, l, m, n, o, p, q, r, s
Bressac, M., Laurenceau-Cornec, E. C., Kennedy, F., Santoro, A. E., Paul, N. L., Briggs, N., Carvalho, F., and Boyd, P. W.: Decoding drivers of carbon flux attenuation in the oceanic biological pump, Nature, 633, 587–593, https://doi.org/10.1038/s41586-024-07850-x, 2024. a
Brun, P., Payne, M. R., and Kiørboe, T.: Trait biogeography of marine copepods – an analysis across scales, Ecol. Lett., 19, 1403–1413, https://doi.org/10.1111/ele.12688, 2016. a, b
Bucklin, A., Peijnenburg, K. T. C. A., Kosobokova, K. N., O'Brien, T. D., Blanco-Bercial, L., Cornils, A., Falkenhaug, T., Hopcroft, R. R., Hosia, A., Laakmann, S., Li, C., Martell, L., Questel, J. M., Wall-Palmer, D., Wang, M., Wiebe, P. H., and Weydmann-Zwolicka, A.: Toward a global reference database of COI barcodes for marine zooplankton, Mar. Biol., 168, 78, https://doi.org/10.1007/s00227-021-03887-y, 2021. a
Buesseler, K. and Boyd, P.: Shedding light on processes that control particle export and flux attenuation in the twilight zone of the open ocean, Limnol. Oceanogr., 54, https://doi.org/10.4319/lo.2009.54.4.1210, 2009. a
Buitenhuis, E. T., Rivkin, R. B., Sailley, S., and Le Quéré, C.: Biogeochemical fluxes through microzooplankton, Global Biogeochem. Cy., 24, https://doi.org/10.1029/2009GB003601, 2010. a
Buitenhuis, E. T., Vogt, M., Moriarty, R., Bednaršek, N., Doney, S. C., Leblanc, K., Le Quéré, C., Luo, Y.-W., O'Brien, C., O'Brien, T., Peloquin, J., Schiebel, R., and Swan, C.: MAREDAT: towards a world atlas of MARine Ecosystem DATa, Earth Syst. Sci. Data, 5, 227–239, https://doi.org/10.5194/essd-5-227-2013, 2013. a, b
Cadier, M., Andersen, K. H., Visser, A. W., and Kiørboe, T.: Competition–defense tradeoff increases the diversity of microbial plankton communities and dampens trophic cascades, Oikos, 128, 1027–1040, https://doi.org/10.1111/oik.06101, 2019. a
Calbet, A.: Mesozooplankton grazing effect on primary production: a global comparative analysis in marine ecosystems, Limnol. Oceanogr., 46, 1824–1830, https://doi.org/10.4319/lo.2001.46.7.1824, 2001. a
Chenillat, F., Rivière, P., and Ohman, M. D.: On the sensitivity of plankton ecosystem models to the formulation of zooplankton grazing, PLoS One, 16, e0252033, https://doi.org/10.1371/journal.pone.0252033, 2021. a, b, c
Clerc, C., Bopp, L., Benedetti, F., Vogt, M., and Aumont, O.: Including filter-feeding gelatinous macrozooplankton in a global marine biogeochemical model: model–data comparison and impact on the ocean carbon cycle , Biogeosciences, 20, 869–895, https://doi.org/10.5194/bg-20-869-2023, 2023. a, b
Clerc, C.: Supplementary materials for “Effects of mesozooplankton growth and reproduction on plankton and organic carbon dynamics in a marine biogeochemical model”, Zenodo [data set], https://doi.org/10.5281/zenodo.12166409, 2024. a
Clerc, C., Bopp, L., Benedetti, F., Knecht, N., Vogt, M., and Aumont, O.: Effects of mesozooplankton growth and reproduction on plankton and organic carbon dynamics in a marine biogeochemical model, Global Biogeochem. Cy., 38, e2024GB008153, https://doi.org/10.1029/2024GB008153, 2024. a, b, c
Di Matteo, L., Ayata, S.-D., Aumont, O., and Benedetti, F.: Supplementary material for “Including different mesozooplankton feeding strategies in a biogeochemical ocean model impacts global ocean biomass and carbon cycle”, Zenodo [data set], https://doi.org/10.5281/zenodo.15065240, 2025. a
DeVries, T. and Weber, T.: The export and fate of organic matter in the ocean: new constraints from combining satellite and oceanographic tracer observations, Global Biogeochem. Cy., 31, 535–555, https://doi.org/10.1002/2016GB005551, 2017. a
Drago, L., Panaíotis, T., Irisson, J.-O., Babin, M., Biard, T., Carlotti, F., Coppola, L., Guidi, L., Hauss, H., Karp-Boss, L., Lombard, F., McDonnell, A. M. P., Picheral, M., Rogge, A., Waite, A. M., Stemmann, L., and Kiko, R.: Global distribution of zooplankton biomass estimated by in situ imaging and machine learning, Frontiers in Marine Science, 9, 894372, https://doi.org/10.3389/fmars.2022.894372, 2022. a, b
Evans, L. E., Hirst, A. G., Kratina, P., and Beaugrand, G.: Temperature-mediated changes in zooplankton body size: large scale temporal and spatial analysis, Ecography, 43, 581–590, https://doi.org/10.1111/ecog.04631, 2020. a
Fennel, K., Mattern, J. P., Doney, S. C., Bopp, L., Moore, A. M., Wang, B., and Yu, L.: Ocean biogeochemical modelling, Nature Reviews Methods Primers, 2, 76, https://doi.org/10.1038/s43586-022-00154-2, 2022. a
Garcia, H. E., Locarnini, R. A., Boyer, T. P., Antonov, J. I., Zweng, M. M., Baranova, O. K., and Johnson, D. R.: World Ocean Atlas 2009, Vol. 4: Nutrients (Phosphate, Nitrate, Silicate), edited by: Levitus, S., NOAA Atlas NESDIS 71, U.S. Government Printing Office, Washington, D.C., 398 pp., 2010. a, b
Garcia, H., Locarnini, R., Boyer, T., Antonov, J., Mishonov, A., Baranova, O., Zweng, M., Reagan, J., and Johnson, D.: World Ocean Atlas 2009, Vol. 3: Dissolved Oxygen, Apparent Oxygen Utilization, and Oxygen Saturation, 70, 2013. a
Gentleman, W.: A chronology of plankton dynamics in silico: how computer models have been used to study marine ecosystems, Hydrobiologia, 480, 69–85, https://doi.org/10.1023/A:1021289119442, 2002. a
Gentleman, W., Leising, A., Frost, B., Strom, S., and Murray, J.: Functional responses for zooplankton feeding on multiple resources: a review of assumptions and biological dynamics, Deep-Sea Res. Pt. II, 50, 2847–2875, https://doi.org/10.1016/j.dsr2.2003.07.001, 2003. a, b
Henson, S., Sanders, R., and Madsen, E.: Global patterns in efficiency of particulate organic carbon export and transfer to the deep ocean, Global Biogeochem. Cy., 26, 1028, https://doi.org/10.1029/2011GB004099, 2012. a
Henson, S. A., Laufkötter, C., Leung, S., Giering, S. L. C., Palevsky, H. I., and Cavan, E. L.: Uncertain response of ocean biological carbon export in a changing world, Nat. Geosci., 15, 248–254, https://doi.org/10.1038/s41561-022-00927-0, 2022. a
Hernández-León, S. and Ikeda, T.: A global assessment of mesozooplankton respiration in the ocean, J. Plankton Res., 27, 153–158, https://doi.org/10.1093/plankt/fbh166, 2005. a
Hébert, M.-P., Beisner, B. E., and Maranger, R.: A meta-analysis of zooplankton functional traits influencing ecosystem function, Ecology, 97, 1069–1080, https://doi.org/10.1890/15-1084.1, 2016. a
Jackson, G. A.: Flux feeding as a mechanism for zooplankton grazing and its implications for vertical particulate flux, Limnol. Oceanogr., 38, 1328–1331, https://doi.org/10.4319/lo.1993.38.6.1328, 1993. a, b
Jónasdóttir, S. H., Visser, A. W., Richardson, K., and Heath, M. R.: Seasonal copepod lipid pump promotes carbon sequestration in the deep North Atlantic, P. Natl. Acad. Sci. USA, 112, 12122–12126, https://doi.org/10.1073/pnas.1512110112, 2015. a
Karsenti, E., Acinas, S. G., Bork, P., Bowler, C., Vargas, C. D., Raes, J., Sullivan, M., Arendt, D., Benzoni, F., Claverie, J.-M., Follows, M., Gorsky, G., Hingamp, P., Iudicone, D., Jaillon, O., Kandels-Lewis, S., Krzic, U., Not, F., Ogata, H., Pesant, S., Reynaud, E. G., Sardet, C., Sieracki, M. E., Speich, S., Velayoudon, D., Weissenbach, J., Wincker, P., and the Tara Oceans Consortium: A Holistic Approach to Marine Eco-Systems Biology, PLoS Biol., 9, e1001177, https://doi.org/10.1371/journal.pbio.1001177, 2011. a
Kelly, T. B., Davison, P. C., Goericke, R., Landry, M. R., Ohman, M. D., and Stukel, M. R.: The importance of mesozooplankton diel vertical migration for sustaining a mesopelagic food web, Frontiers in Marine Science, 6, https://doi.org/10.3389/fmars.2019.00508, 2019. a, b
Kenitz, K. M., Visser, A. W., Mariani, P., and Andersen, K. H.: Seasonal succession in zooplankton feeding traits reveals trophic trait coupling, Limnol. Oceanogr., 62, 1184–1197, https://doi.org/10.1002/lno.10494, 2017. a, b
Key, R. M., Kozyr, A., Sabine, C. L., Lee, K., Wanninkhof, R., Bullister, J. L., Feely, R. A., Millero, F. J., Mordy, C., and Peng, T.-H.: A global ocean carbon climatology: results from Global Data Analysis Project (GLODAP), Global Biogeochem. Cy., 18, https://doi.org/10.1029/2004GB002247, 2004. a
Kiørboe, T.: Optimal swimming strategies in mate-searching pelagic copepods, Oecologia, 155, 179–192, https://doi.org/10.1007/s00442-007-0893-x, 2008. a
Kiørboe, T.: How zooplankton feed: mechanisms, traits and trade-offs, Biological Reviews, 86, 311–339, https://doi.org/10.1111/j.1469-185X.2010.00148.x, 2011. a, b, c, d, e, f, g, h, i, j, k, l, m, n, o, p, q, r, s, t, u
Kiørboe, T.: Foraging mode and prey size spectra of suspension-feeding copepods and other zooplankton, Mar. Ecol. Prog. Ser., 558, 15–20, https://doi.org/10.3354/meps11877, 2016. a
Kiørboe, T.: Organismal trade offs and the pace of planktonic life, Biological Reviews, brv.13108, https://doi.org/10.1111/brv.13108, 2024. a
Kiørboe, T. and Hirst, A. G.: Shifts in mass scaling of respiration, feeding, and growth rates across life-form transitions in marine pelagic organisms, Am. Nat., 183, E118–E130, https://doi.org/10.1086/675241, 2014. a
Kiørboe, T., Saiz, E., and Viitasalo, M.: Prey switching behaviour in the planktonic copepod Acartia tonsa, Mar. Ecol. Prog. Ser., 143, 65–75, https://doi.org/10.3354/meps143065, 1996. a
Kiørboe, T., Jiang, H., and Colin, S. P.: Danger of zooplankton feeding: the fluid signal generated by ambush-feeding copepods, P. Roy. Soc. B-Biol. Sci., 277, 3229–3237, https://doi.org/10.1098/rspb.2010.0629, 2010. a
Kiørboe, T., Ceballos, S., and Thygesen, U. H.: Interrelations between senescence, life-history traits, and behavior in planktonic copepods, Ecology, 96, 2225–2235, https://doi.org/10.1890/14-2205.1, 2015. a, b, c, d, e, f
Kiørboe, T., Saiz, E., Tiselius, P., and Andersen, K. H.: Adaptive feeding behavior and functional responses in zooplankton, Limnol. Oceanogr., 63, 308–321, https://doi.org/10.1002/lno.10632, 2018a. a, b, c, d, e, f, g, h, i, j, k, l, m
Kiørboe, T., Visser, A., and Andersen, K. H.: A trait-based approach to ocean ecology, ICES J. Mar. Sci., 75, 1849–1863, https://doi.org/10.1093/icesjms/fsy090, 2018b. a
Le Quéré, C., Harrison, S. P., Colin Prentice, I., Buitenhuis, E. T., Aumont, O., Bopp, L., Claustre, H., Cotrim Da Cunha, L., Geider, R., Giraud, X., Klaas, C., Kohfeld, K. E., Legendre, L., Manizza, M., Platt, T., Rivkin, R. B., Sathyendranath, S., Uitz, J., Watson, A. J., and Wolf Gladrow, D.: Ecosystem dynamics based on plankton functional types for global ocean biogeochemistry models, Glob. Change Biol., 11, 2016–2040, https://doi.org/10.1111/j.1365-2486.2005.1004.x, 2005. a, b
Le Quéré, C., Buitenhuis, E. T., Moriarty, R., Alvain, S., Aumont, O., Bopp, L., Chollet, S., Enright, C., Franklin, D. J., Geider, R. J., Harrison, S. P., Hirst, A. G., Larsen, S., Legendre, L., Platt, T., Prentice, I. C., Rivkin, R. B., Sailley, S., Sathyendranath, S., Stephens, N., Vogt, M., and Vallina, S. M.: Role of zooplankton dynamics for Southern Ocean phytoplankton biomass and global biogeochemical cycles, Biogeosciences, 13, 4111–4133, https://doi.org/10.5194/bg-13-4111-2016, 2016. a
Litchman, E., Ohman, M. D., and Kiørboe, T.: Trait-based approaches to zooplankton communities, J. Plankton Res., 35, 473–484, https://doi.org/10.1093/plankt/fbt019, 2013. a, b, c, d
Liu, K., Xu, Z., Liu, X., Huang, B., Liu, H., and Chen, B.: Modelling global mesozooplankton biomass using machine learning, Prog. Oceanogr., 229, 103371, https://doi.org/10.1016/j.pocean.2024.103371, 2024. a
Madec, G., Bell, M., Blaker, A., Bricaud, C., Bruciaferri, D., Castrillo, M., Calvert, D., Chanut, J., Clementi, E., Coward, A., Epicoco, I., Éthé, C., Ganderton, J., Harle, J., Hutchinson, K., Iovino, D., Lea, D., Lovato, T., Martin, M., Martin, N., Mele, F., Martins, D., Masson, S., Mathiot, P., Mele, F., Mocavero, S., Müller, S., Nurser, A. J. G., Paronuzzi, S., Peltier, M., Person, R., Rousset, C., Rynders, S., Samson, G., Téchené, S., Vancoppenolle, M., and Wilson, C.: NEMO Ocean Engine Reference Manual, Zenodo [code], https://doi.org/10.5281/zenodo.8167700, 2023. a, b
Mariani, P., Andersen, K. H., Visser, A. W., Barton, A. D., and Kiørboe, T.: Control of plankton seasonal succession by adaptive grazing, Limnol. Oceanogr., 58, 173–184, https://doi.org/10.4319/lo.2013.58.1.0173, 2013. a
Martini, S., Larras, F., Boyé, A., Faure, E., Aberle, N., Archambault, P., Bacouillard, L., Beisner, B. E., Bittner, L., Castella, E., Danger, M., Gauthier, O., Karp-Boss, L., Lombard, F., Maps, F., Stemmann, L., Thiébaut, E., Usseglio-Polatera, P., Vogt, M., Laviale, M., and Ayata, S.-D.: Functional trait-based approaches as a common framework for aquatic ecologists, Limnol. Oceanogr., 66, 965–994, https://doi.org/10.1002/lno.11655, 2021. a, b, c
Mitra, A., Castellani, C., Gentleman, W. C., Jónasdóttir, S. H., Flynn, K. J., Bode, A., Halsband, C., Kuhn, P., Licandro, P., Agersted, M. D., Calbet, A., Lindeque, P. K., Koppelmann, R., Møller, E. F., Gislason, A., Nielsen, T. G., and St. John, M.: Bridging the gap between marine biogeochemical and fisheries sciences; configuring the zooplankton link, Prog. Oceanogr., 129, 176–199, https://doi.org/10.1016/j.pocean.2014.04.025, 2014. a
Moriarty, R. and O'Brien, T. D.: Distribution of mesozooplankton biomass in the global ocean, Earth Syst. Sci. Data, 5, 45–55, https://doi.org/10.5194/essd-5-45-2013, 2013. a
Morris, M. J., Gust, G., and Torres, J. J.: Propulsion efficiency and cost of transport for copepods: a hydromechanical model of crustacean swimming, Mar. Biol., 86, 283–295, https://doi.org/10.1007/BF00397515, 1985. a, b
Negrete-García, G., Luo, J. Y., Long, M. C., Lindsay, K., Levy, M., and Barton, A. D.: Plankton energy flows using a global size-structured and trait-based model, Prog. Oceanogr., 209, 102898, https://doi.org/10.1016/j.pocean.2022.102898, 2022. a
Nguyen, T. T. H., Zakem, E. J., Ebrahimi, A., Schwartzman, J., Caglar, T., Amarnath, K., Alcolombri, U., Peaudecerf, F. J., Hwa, T., Stocker, R., Cordero, O. X., and Levine, N. M.: Microbes contribute to setting the ocean carbon flux by altering the fate of sinking particulates, Nat. Commun., 13, 1657, https://doi.org/10.1038/s41467-022-29297-2, 2022. a
Nowicki, M., DeVries, T., and Siegel, D. A.: Quantifying the carbon export and sequestration pathways of the ocean's biological carbon pump, Global Biogeochem. Cy., 36, e2021GB007083, https://doi.org/10.1029/2021GB007083, 2022. a
Ohman, M. D.: Behavioral responses of zooplankton to predation, B. Mar. Sci., 43, 530–550, 1988. a
Ohman, M. D.: The demographic benefits of diel vertical migration by zooplankton, Ecol. Monogr., 60, 257–281, https://doi.org/10.2307/1943058, 1990. a
Ohman, M. D.: A sea of tentacles: optically discernible traits resolved from planktonic organisms in situ, ICES J. Mar. Sci., 76, 1959–1972, https://doi.org/10.1093/icesjms/fsz184, 2019. a, b
Ohman, M. D. and Romagnan, J.-B.: Nonlinear effects of body size and optical attenuation on Diel Vertical Migration by zooplankton, Limnol. Oceanogr., 61, 765–770, https://doi.org/10.1002/lno.10251, 2016. a
Orenstein, E. C., Ayata, S.-D., Maps, F., Becker, É. C., Benedetti, F., Biard, T., de Garidel-Thoron, T., Ellen, J. S., Ferrario, F., Giering, S. L. C., Guy-Haim, T., Hoebeke, L., Iversen, M. H., Kiørboe, T., Lalonde, J.-F., Lana, A., Laviale, M., Lombard, F., Lorimer, T., Martini, S., Meyer, A., Möller, K. O., Niehoff, B., Ohman, M. D., Pradalier, C., Romagnan, J.-B., Schröder, S.-M., Sonnet, V., Sosik, H. M., Stemmann, L. S., Stock, M., Terbiyik-Kurt, T., Valcárcel-Pérez, N., Vilgrain, L., Wacquet, G., Waite, A. M., and Irisson, J.-O.: Machine learning techniques to characterize functional traits of plankton from image data, Limnol. Oceanogr., 67, 1647–1669, https://doi.org/10.1002/lno.12101, 2022. a
Parra, S. M., Greer, A. T., Book, J. W., Deary, A. L., Soto, I. M., Culpepper, C., Hernandez, F. J., and Miles, T. N.: Acoustic detection of zooplankton diel vertical migration behaviors on the northern Gulf of Mexico shelf, Limnol. Oceanogr., 64, 2092–2113, https://doi.org/10.1002/lno.11171, 2019. a
Picheral, M., Catalano, C., Brousseau, D., Claustre, H., Coppola, L., Leymarie, E., Coindat, J., Dias, F., Fevre, S., Guidi, L., Irisson, J. O., Legendre, L., Lombard, F., Mortier, L., Penkerch, C., Rogge, A., Schmechtig, C., Thibault, S., Tixier, T., Waite, A., and Stemmann, L.: The Underwater Vision Profiler 6: an imaging sensor of particle size spectra and plankton, for autonomous and cabled platforms, Limnol. Oceanogr.-Meth., 20, 115–129, https://doi.org/10.1002/lom3.10475, 2022. a
Pinti, J., DeVries, T., Norin, T., Serra-Pompei, C., Proud, R., Siegel, D. A., Kiørboe, T., Petrik, C. M., Andersen, K. H., Brierley, A. S., and Visser, A. W.: Model estimates of metazoans' contributions to the biological carbon pump, Biogeosciences, 20, 997–1009, https://doi.org/10.5194/bg-20-997-2023, 2023. a
Prowe, A. E. F., Visser, A. W., Andersen, K. H., Chiba, S., and Kiørboe, T.: Biogeography of zooplankton feeding strategy, Limnol. Oceanogr., 64, 661–678, https://doi.org/10.1002/lno.11067, 2019. a, b, c, d, e
Ratnarajah, L., Abu-Alhaija, R., Atkinson, A., Batten, S., Bax, N. J., Bernard, K. S., Canonico, G., Cornils, A., Everett, J. D., Grigoratou, M., Ishak, N. H. A., Johns, D., Lombard, F., Muxagata, E., Ostle, C., Pitois, S., Richardson, A. J., Schmidt, K., Stemmann, L., Swadling, K. M., Yang, G., and Yebra, L.: Monitoring and modelling marine zooplankton in a changing climate, Nat. Commun., 14, 564, https://doi.org/10.1038/s41467-023-36241-5, 2023. a, b, c
Rohr, T., Richardson, A. J., Lenton, A., Chamberlain, M. A., and Shadwick, E. H.: Zooplankton grazing is the largest source of uncertainty for marine carbon cycling in CMIP6 models, Communications Earth and Environment, 4, 1–22, https://doi.org/10.1038/s43247-023-00871-w, 2023. a, b, c
Sathyendranath, S., Brewin, R., Brockmann, C., Brotas, V., Calton, B., Chuprin, A., Cipollini, P., Couto, A., Dingle, J., Doerffer, R., Donlon, C., Dowell, M., Farman, A., Grant, M., Groom, S., Horseman, A., Jackson, T., Krasemann, H., Lavender, S., Martinez-Vicente, V., Mazeran, C., Mélin, F., Moore, T., Müller, D., Regner, P., Roy, S., Steele, C., Steinmetz, F., Swinton, J., Taberner, M., Thompson, A., Valente, A., Zühlke, M., Brando, V., Feng, H., Feldman, G., Franz, B., Frouin, R., Gould, R., Hooker, S., Kahru, M., Kratzer, S., Mitchell, B., Muller-Karger, F., Sosik, H., Voss, K., Werdell, J., and Platt, T.: An ocean-colour time series for use in climate studies: the experience of the Ocean-Colour Climate Change Initiative (OC-CCI), Sensors, 19, 4285, https://doi.org/10.3390/s19194285, 2019. a
Schmoker, C., Hernández-León, S., and Calbet, A.: Microzooplankton grazing in the oceans: impacts, data variability, knowledge gaps and future directions, J. Plankton Res., 35, 691–706, https://doi.org/10.1093/plankt/fbt023, 2013. a
Serra-Pompei, C., Soudijn, F., Visser, A. W., Kiørboe, T., and Andersen, K. H.: A general size- and trait-based model of plankton communities, Prog. Oceanogr., 189, 102473, https://doi.org/10.1016/j.pocean.2020.102473, 2020. a, b, c, d, e, f, g, h
Serra-Pompei, C., Ward, B. A., Pinti, J., Visser, A. W., Kiørboe, T., and Andersen, K. H.: Linking plankton size spectra and community composition to carbon export and its efficiency, Global Biogeochem. Cy., 36, e2021GB007275, https://doi.org/10.1029/2021GB007275, 2022. a, b
Sieburth, J. M., Smetacek, V., and Lenz, J.: Pelagic ecosystem structure: heterotrophic compartments of the plankton and their relationship to plankton size fractions 1, Limnol. Oceanogr., 23, 1256–1263, https://doi.org/10.4319/lo.1978.23.6.1256, 1978. a
Stamieszkin, K., Pershing, A. J., Record, N. R., Pilskaln, C. H., Dam, H. G., and Feinberg, L. R.: Size as the master trait in modeled copepod fecal pellet carbon flux, Limnol. Oceanogr., 60, 2090–2107, https://doi.org/10.1002/lno.10156, 2015. a, b
Steinberg, D. K. and Landry, M. R.: Zooplankton and the ocean carbon cycle, Annu. Rev. Mar. Sci., 9, 413–444, https://doi.org/10.1146/annurev-marine-010814-015924, 2017. a, b, c, d, e, f
Stemmann, L., Jackson, G., and Ianson, D.: A vertical model of particle size distributions and fluxes in the midwater column that includes biological and physical processes – Part I: Model formulation, Deep-Sea Res. Pt. I, 51, 865–884, https://doi.org/10.1016/j.dsr.2004.03.001, 2004. a
Strömberg, K. H. P., Smyth, T. J., Allen, J. I., Pitois, S., and O'Brien, T. D.: Estimation of global zooplankton biomass from satellite ocean colour, J. Marine Syst., 78, 18–27, https://doi.org/10.1016/j.jmarsys.2009.02.004, 2009. a
Stukel, M. R., Ohman, M. D., Kelly, T. B., and Biard, T.: The roles of suspension-feeding and flux-feeding zooplankton as gatekeepers of particle flux into the mesopelagic ocean in the Northeast Pacific, Frontiers in Marine Science, 6, 397, https://doi.org/10.3389/fmars.2019.00397, 2019. a, b, c, d, e, f, g, h
Tilman, D.: Constraints and tradeoffs: toward a predictive theory of competition and succession, Oikos, 58, 3–15, https://doi.org/10.2307/3565355, 1990. a
Tiselius, P. and Jonsson, P. R.: Foraging behaviour of six calanoid copepods: observations and hydrodynamic analysis, Mar. Ecol. Prog. Ser., 66, 23–33, 1990. a
Tiselius, P., Jonsson, P. R., Kuurtvedt, S., Olsen, E. M., and Jørstud, T.: Effects of copepod foraging behavior on predation risk: an experimental study of the predatory copepod Pareuchaeta norvegica feeding on Acartia clausi and A. tonsa (Copepoda), Limnol. Oceanogr., 42, 164–170, https://doi.org/10.4319/lo.1997.42.1.0164, 1997. a
Turner, J. T.: Zooplankton fecal pellets, marine snow and sinking phytoplankton blooms, Aquat. Microb. Ecol., 27, 57–102, https://doi.org/10.3354/ame027057, 2002. a
Uye, S.-i. and Kaname, K.: Relations between fecal pellet volume and body size for major zooplankters of the Inland Sea of Japan, Journal of Oceanography, 50, 43–49, https://doi.org/10.1007/BF02233855, 1994. a
Van Someren Gréve, H., Almeda, R., and Kiørboe, T.: Motile behavior and predation risk in planktonic copepods, Limnol. Oceanogr., 62, 1810–1824, https://doi.org/10.1002/lno.10535, 2017. a, b, c, d, e, f, g
van Someren Gréve, H., Kiørboe, T., and Almeda, R.: Bottom-up behaviourally mediated trophic cascades in plankton food webs, P. Roy. Soc. B-Biol. Sci., 286, 20181664, https://doi.org/10.1098/rspb.2018.1664, 2019. a
Vancoppenolle, M., Rousset, C., Blockley, E., Aksenov, Y., Feltham, D., Fichefet, T., Garric, G., Guémas, V., Iovino, D., Keeley, S., Madec, G., Massonnet, F., Ridley, J., Schroeder, D., and Tietsche, S.: SI3, the NEMO Sea Ice Engine, Zenodo [code], https://doi.org/10.5281/zenodo.7534900, 2023. a
Verity, P. and Smetacek, V.: Organism life cycles, predation, and the structure of marine pelagic ecosystems, Mar. Ecol. Prog. Ser., – MAR ECOL-PROGR SER, 130, 277–293, https://doi.org/10.3354/meps130277, 1996. a
Violle, C., Navas, M.-L., Vile, D., Kazakou, E., Fortunel, C., Hummel, I., and Garnier, E.: Let the concept of trait be functional!, Oikos, 116, 882–892, https://doi.org/10.1111/j.0030-1299.2007.15559.x, 2007. a
Visser, A. W.: Motility of zooplankton: fitness, foraging and predation, J. Plankton Res., 29, 447–461, https://doi.org/10.1093/plankt/fbm029, 2007. a, b, c, d, e, f, g
Visser, A. W., Mariani, P., and Pigolotti, S.: Swimming in turbulence: zooplankton fitness in terms of foraging efficiency and predation risk, J. Plankton Res., 31, 121–133, https://doi.org/10.1093/plankt/fbn109, 2008. a, b
Vlymen, W. J.: Energy expenditure of swimming copepods, Limnol. Oceanogr., 15, 348–356, https://doi.org/10.4319/lo.1970.15.3.0348, 1970. a, b
Werner, E. E. and Anholt, B. R.: Ecological consequences of the trade-off between growth and mortality rates mediated by foraging activity, Am. Nat., 142, 242–272, https://doi.org/10.1086/285537, 1993. a, b