the Creative Commons Attribution 4.0 License.
the Creative Commons Attribution 4.0 License.
 | 16 Apr 2018
Impact of salinity on element incorporation in two benthic foraminiferal species with contrasting magnesium contents
Esmee Geerken
Lennart Jan de Nooijer
Inge van Dijk
Gert-Jan Reichart
Accurate reconstructions of seawater salinity could provide valuable constraints for studying past ocean circulation, the hydrological cycle and sea level change. Controlled growth experiments and field studies have shown the potential of foraminiferal Na ∕ Ca as a direct salinity proxy. Incorporation of minor and trace elements in foraminiferal shell carbonate varies, however, greatly between species and hence extrapolating calibrations to other species needs validation by additional (culturing) studies. Salinity is also known to impact other foraminiferal carbonate-based proxies, such as Mg ∕ Ca for temperature and Sr ∕ Ca for sea water carbonate chemistry. Better constraints on the role of salinity on these proxies will therefore improve their reliability. Using a controlled growth experiment spanning a salinity range of 20 units and analysis of element composition on single chambers using laser ablation-Q-ICP-MS, we show here that Na ∕ Ca correlates positively with salinity in two benthic foraminiferal species (Ammonia tepida and Amphistegina lessonii). The Na ∕ Ca values differ between the two species, with an approximately 2-fold higher Na ∕ Ca in A. lessonii than in A. tepida, coinciding with an offset in their Mg content (∼ 35 mmol mol−2 versus ∼ 2.5 mmol mol−1 for A. lessonii and A. tepida, respectively). Despite the offset in average Na ∕ Ca values, the slopes of the Na ∕ Ca–salinity regressions are similar between these two species (0.077 versus 0.064 mmol mol−1 change per salinity unit). In addition, Mg ∕ Ca and Sr ∕ Ca are positively correlated with salinity in cultured A. tepida but show no correlation with salinity for A. lessonii. Electron microprobe mapping of incorporated Na and Mg of the cultured specimens shows that within chamber walls of A. lessonii, Na ∕ Ca and Mg ∕ Ca occur in elevated bands in close proximity to the primary organic lining. Between species, Mg banding is relatively similar, even though Mg content is 10 times lower and that variation within the chamber wall is much less pronounced in A. tepida. In addition, Na banding is much less prominent in this species than it is in A. lessonii. Inter-species differences in element banding reported here are hypothesized to be caused by differences in biomineralization controls responsible for element uptake.
- Article
(4646 KB) - Full-text XML
-
Supplement
(345 KB) - BibTeX
- EndNote


Sea water salinity varies over time and space as a function of continental ice volume, evaporation, precipitation and river runoff. Salinity reconstructions could provide important constraints on past ocean circulation, the hydrological cycle and glacial–interglacial sea level changes. Currently, most reconstructions of salinity are indirect and based on the correlation between salinity and δ18Owater, assuming this relationship to be constant over space and time (Rohling and Bigg, 1998). An independent salinity proxy may reduce the uncertainties inherently associated with such approaches (Rohling and Hilgen, 2007) and should preferably be based on one of the main components of sea water salinity, for instance sodium (Na). Results from a culture study showed that the sodium content of foraminiferal calcite (Na ∕ Cacc) correlates positively and linearly with salinity for the benthic low-Mg, symbiont-barren species Ammonia tepida, with a sensitivity of 0.22 mmol mol−1 for every change of 1 salinity unit between salinities 30 and 38.6 (Wit et al., 2013). Various culture studies earlier showed that also Mg ∕ Ca is affected by salinity but responds more strongly to changes in temperature (Lea et al., 1999; Dissard et al., 2010b; Nürnberg et al., 1996; Hönisch et al., 2013). Although an effect of salinity on foraminiferal Sr ∕ Cacc has been reported in some studies (Kısakürek et al., 2008; Dissard et al., 2010b; Wit et al., 2013), other studies did not find a relation between salinity and foraminiferal Sr ∕ Ca (Dueñas-Bohórquez et al., 2009; Diz et al., 2012; Allen et al., 2016), which led to the hypothesis that foraminiferal Sr ∕ Ca mainly reflects sea water inorganic carbon chemistry (Keul et al., 2017) in addition to its response to temperature (Lea et al., 1999; Raja et al., 2007). Hence, an independent salinity proxy would not only be useful for constraining past (changes in) salinity but would also improve temperature reconstructions based on Mg ∕ Cacc and reconstructions of past sea water carbonate chemistry based on Sr ∕ Ca.
Following the culture-based Na ∕ Cacc–salinity calibration for A. tepida (Wit et al., 2013), a culture study with planktonic symbiont-bearing species also showed a significant linear relationship for Globigerinoides ruber (Allen et al., 2016). Although no significant relationship was observed in this study for G. sacculifer (Allen et al., 2016), a recent field calibration observed positive linear relationships for both these species (Mezger et al., 2016). Still, the Na ∕ Ca–salinity sensitivities observed between the different species and studies differed considerably (ranging from a change in 0.074 to 0.66 mmol mol−1 in Na ∕ Cacc for a change in 1 salinity unit). Whereas Wit et al. (2013) suggested an incorporation mechanism similar to that observed in inorganic calcite, field and culture studies also show that different species of foraminifera have varying calcite chemistries, thereby resulting in the need of species-specific calibrations similar to many other foraminiferal trace-metal-based proxies (e.g. Elderfield and Ganssen, 2000; Rosenthal et al., 2000; Anand et al., 2003; Bemis et al., 1998; Toyofuku et al., 2011). For example, Mg ∕ Cacc values are different between groups of low-Mg, high-Mg hyaline and porcelaneous foraminifera (Toyofuku et al., 2000; Segev and Erez, 2006; Raja et al., 2007), which also seems to be reflected in other co-precipitated cations (De Nooijer et al., 2017). Hence, calibration of Na ∕ Cacc as a function of salinity for other species is not only necessary to test the applicability of this novel proxy for other groups of foraminifera but also allows testing whether monovalent cations follow the inter-species trends described for divalent cations (Terakado et al., 2010).
Here we calibrated Na, Mg and Sr incorporation in the intermediate-Mg calcite benthic foraminiferal species Amphistegina lessonii and the low-Mg calcite species Ammonia tepida over a salinity range of 20 units (from 25 to 45). We thus compare the El ∕ Ca versus salinity trends in a tropical, symbiont-bearing species (A. lessonii) to a temperate intertidal symbiont-barren species (A. tepida) and both of them to existing calibrations. The chemical composition of newly formed calcite was determined by laser ablation inductively coupled plasma mass spectrometry (LA-Q-ICP-MS), providing insights into concentrations and variability therein between specimens and between single chambers. To investigate intra-specimen variability at the scale of the chamber wall we also performed electron probe micro-analysis (EPMA), mapping the Ca, Na and Mg distribution throughout the chamber wall for specimens of both species cultured.
2.1 Culture media preparation and chemistry
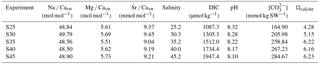
In total, 50 L of sea water with a salinity of 50 was prepared by sub-boiling 0.2 µm filtered North Atlantic sea water for 48 h at 45 ∘C. Subsequently, culture media were obtained by diluting this high-salinity sea water with double de-ionized sea water (∼ 18 MΩ) in batches of approximately 10 L with salinity increasing from 25 to 45 in steps of 5 units, resulting in five unique salinity conditions. Using a single batch of concentrated sea water to subsequently dilute to the desired salinities ensures constant element to Ca ratios. Salinity of the media was measured with a salinometer (VWR CO310), based on conductivity. Culture media were stored in Nalgene containers and kept in the dark at 10 ∘C. Sea water pH was determined with a pH meter (pH110, VWR). Subsamples were taken prior to and at the end of the experiment and analysed for DIC and element concentrations to monitor the effect of sub-boiling on the sea water's inorganic carbon chemistry and element composition (Table 1). Subsamples for DIC were collected in headspace-free vials and conserved with a saturated HgCl2 solution (10 µL HgCl2/10 mL sample). DIC measurements were performed on an autoanalyser spectrometric system TRAACS 800; Stoll et al. (2001). This analysis requires only a small amount of sample, while yielding high accuracy (±2 µmol kg−1) and precision (±1.5 µmol kg−1). The minor and major elemental composition of the culture media was measured using a sector field ICP-MS (Element2, Thermo Scientific) by sampling 1 mL from the culture media and dilution by a factor 300 with 0.14 M HNO3 (Table 1).
Table 1Experiment culture media measurements per salinity condition. Carbonate ion concentrations and saturation state with respect to calcite (at 25 ∘C) were calculated using CO2SYS (Van Heuven et al., 2011) and the equilibrium constants K1 and K2 of Mehrbach et al. (1973), as reformulated by Dickson and Millero (1987).
2.2 Collection of foraminifera and culture setup
Surface sediment samples containing foraminifera (A. lessonii) were collected from the Indo-Pacific Coral Reef aquarium in Burgers' Zoo (Arnhem, the Netherlands; Ernst et al., 2011) and a tidal flat near Den Oever, the Wadden Sea (A. tepida, genotype T6; Hayward et al., 2004). Sediment was stored in aerated aquaria at 25 ∘C (A. lessonii) and 10 ∘C (A. tepida) with a day/night cycle of 12 h/12 h, similar to conditions in the coral reef aquarium and Wadden Sea, respectively. From both stocks, living specimens, recognized by chambers that were filled with yellow cytoplasm and pseudopodial activity, were isolated.
The culture protocol was the same for both species to facilitate comparison of obtained element ∕ Ca ratios between species. Since our specimens of A. tepida are from a location with a much larger temperature range than where A. lessonii is derived from (Ernst et al., 2011; Van Aken, 2008; De Nooijer et al., 2014a), both species were incubated at 25 ∘C. Living specimens were placed in groups of 25 individuals in Petri dishes with approximately 70 mL of North Atlantic surface sea water (0.2 µm filtered) and fed with fresh cells of the algae Dunaliella salina. After reproduction, which occurred in approximately two-thirds of all incubated specimens in both species, 2–3 chambered juveniles were isolated. The use of specimens from reproduction events guarantees that virtually all chambers present at the end of the experiment were produced under the culture conditions (De Nooijer et al., 2014a). Strains of specimens of the reproduction events were divided over Petri dishes (resulting in 2–10 individuals per dish) with approximately 10 mL of culture medium and stored in a temperature-controlled incubator set at 25 ∘C with a day/night cycle of 12 h/12 h. The culture media in the Petri dishes were replaced once every week, after which specimens were fed with 1 mL of concentrated and freeze-dried Dunaliella salina diluted with the culture medium for each salinity condition, to minimize changes in salinity when feeding the foraminifers. The amount of food was adjusted so that it was not depleted after a week, at the same time not resulting in an excess of debris and hence reduce bacterial growth. Petri dishes were sealed with a lid to minimize evaporation. After 6–8 weeks, specimens were harvested and transferred to microvials to clean the specimens' carbonate shells from cell material. Specimens were cleaned with an adapted version of the Barker protocol (Barker et al., 2003), only applying the organic removal/oxidation step, in which NaOH was replaced with NH4OH, in order to avoid Na contamination of our samples. Organic matter was removed by adding 1 % H2O2 buffered with 0.1 M NH4OH at 90 ∘C and gentle ultrasonication (80 kHz, 50 % power, in degas mode) for 1 min, which is known not to affect obtained Mg ∕ Ca and Sr ∕ Ca (Barker et al., 2003). Specimens were subsequently rinsed three times with double de-ionized water and dried in a laminar flow cabinet, after which their size was determined (i.e. the maximum diameter crossing the centre of the specimen). The specimens were thereafter stored until geochemical analyses (LA-Q-ICP-MS; Sect. 2.2.2 and EPMA; Sect. 2.4).
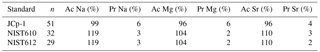
Table 2Accuracies (Ac) and precisions (Pr) for Na, Mg and Sr for the various standards analysed.
2.3 Foraminiferal calcite chemistry
Specimens were fixed on a laser ablation stub using double-sided tape, carefully positioning them to allow ablation of the last chambers (Supplement S1). Element concentrations of individual chambers were measured with LA-ICP-MS (Reichart et al., 2003). The last 1–3 chambers of each specimen were ablated using a circular spot with a diameter of 60 µm (A. tepida) and 80 µm (A. lessonii) (NWR193UC, New Wave Research) in a helium environment in a New Wave TV2 dual-volume cell (cup volume of ∼ 1 cm3) at a repetition rate of 6 Hz and an energy density of approximately 1 J cm−2. The aerosol was transported to a quadrupole ICP-MS (iCap, Thermo Scientific) on a helium flow at a rate of 0.7 L min−1, with 0.4 L min−1 Argon make-up gas being added before entering the torch. Nitrogen gas was added at a rate of 5 mL min−1 to enhance sensitivity of the analysis. Before entering the torch, the aerosol ∕ Ar ∕ He mixture passed through an in-house-made smoothing device to reduce temporal variations in signal strength. Monitored masses included 7Li, 11B, 23Na, 24Mg, 25Mg, 27Al, 43Ca, 44Ca, 60Ni, 66Zn, 88Sr, 137Ba and 238U, with one full cycle through the different masses taking 120 ms. Calibration was performed against a MACS-3 (synthetic calcium carbonate) pressed powder carbonate standard with 43Ca as an internal standard. Count rates for the different masses were directly translated into element ∕ Cacc (El ∕ Cacc) ratios. Internal precision based on MACS-3 is 4 % for Na, 3 % for Mg and 4 % for Sr. Accuracy and relative analytical errors, based on measuring international standards JCp-1 coral (Porites sp.) powder and the NIST (National Institute of Standards and Technology) SRM 610 and SRM 612 (glass), are listed in Table 2. The relatively large offset between the glass standards and the pressed powders (both MACS-3 and JCp-1) is known not to influence obtained El ∕ Cacc ratios when either one is used as a calibration standard (Hathorne et al., 2008), but due to the similar matrix, MACS-3 was chosen as the calibration standard.
In total, 675 chambers were measured (336 for Amphistegina and 339 for Ammonia), resulting in between 52 and 125 single-chamber measurements per salinity condition per species. These measurements were done on the last three (final or F, penultimate or F-1 and pre-penultimate or F-2) chambers of these specimens (see Table 3 for number of specimens and average number of spots per specimen). Element concentrations were calculated from the time-resolved (i.e. ablation depth) profiles using an adapted version of the SILLS (Signal Integration for Laboratory Laser Systems; Guillong et al., 2008) package for MATLAB (for details see Van Dijk et al., 2017a), while taking care to exclude contaminations potentially present on chamber walls (examples of profile selection: Dueñas-Bohórquez et al., 2011; Wit et al., 2013; Mewes et al., 2014; Mezger et al., 2016; Van Dijk et al., 2017b). Measurements with ablation yields or integrations times < 5 s were excluded from further analysis.
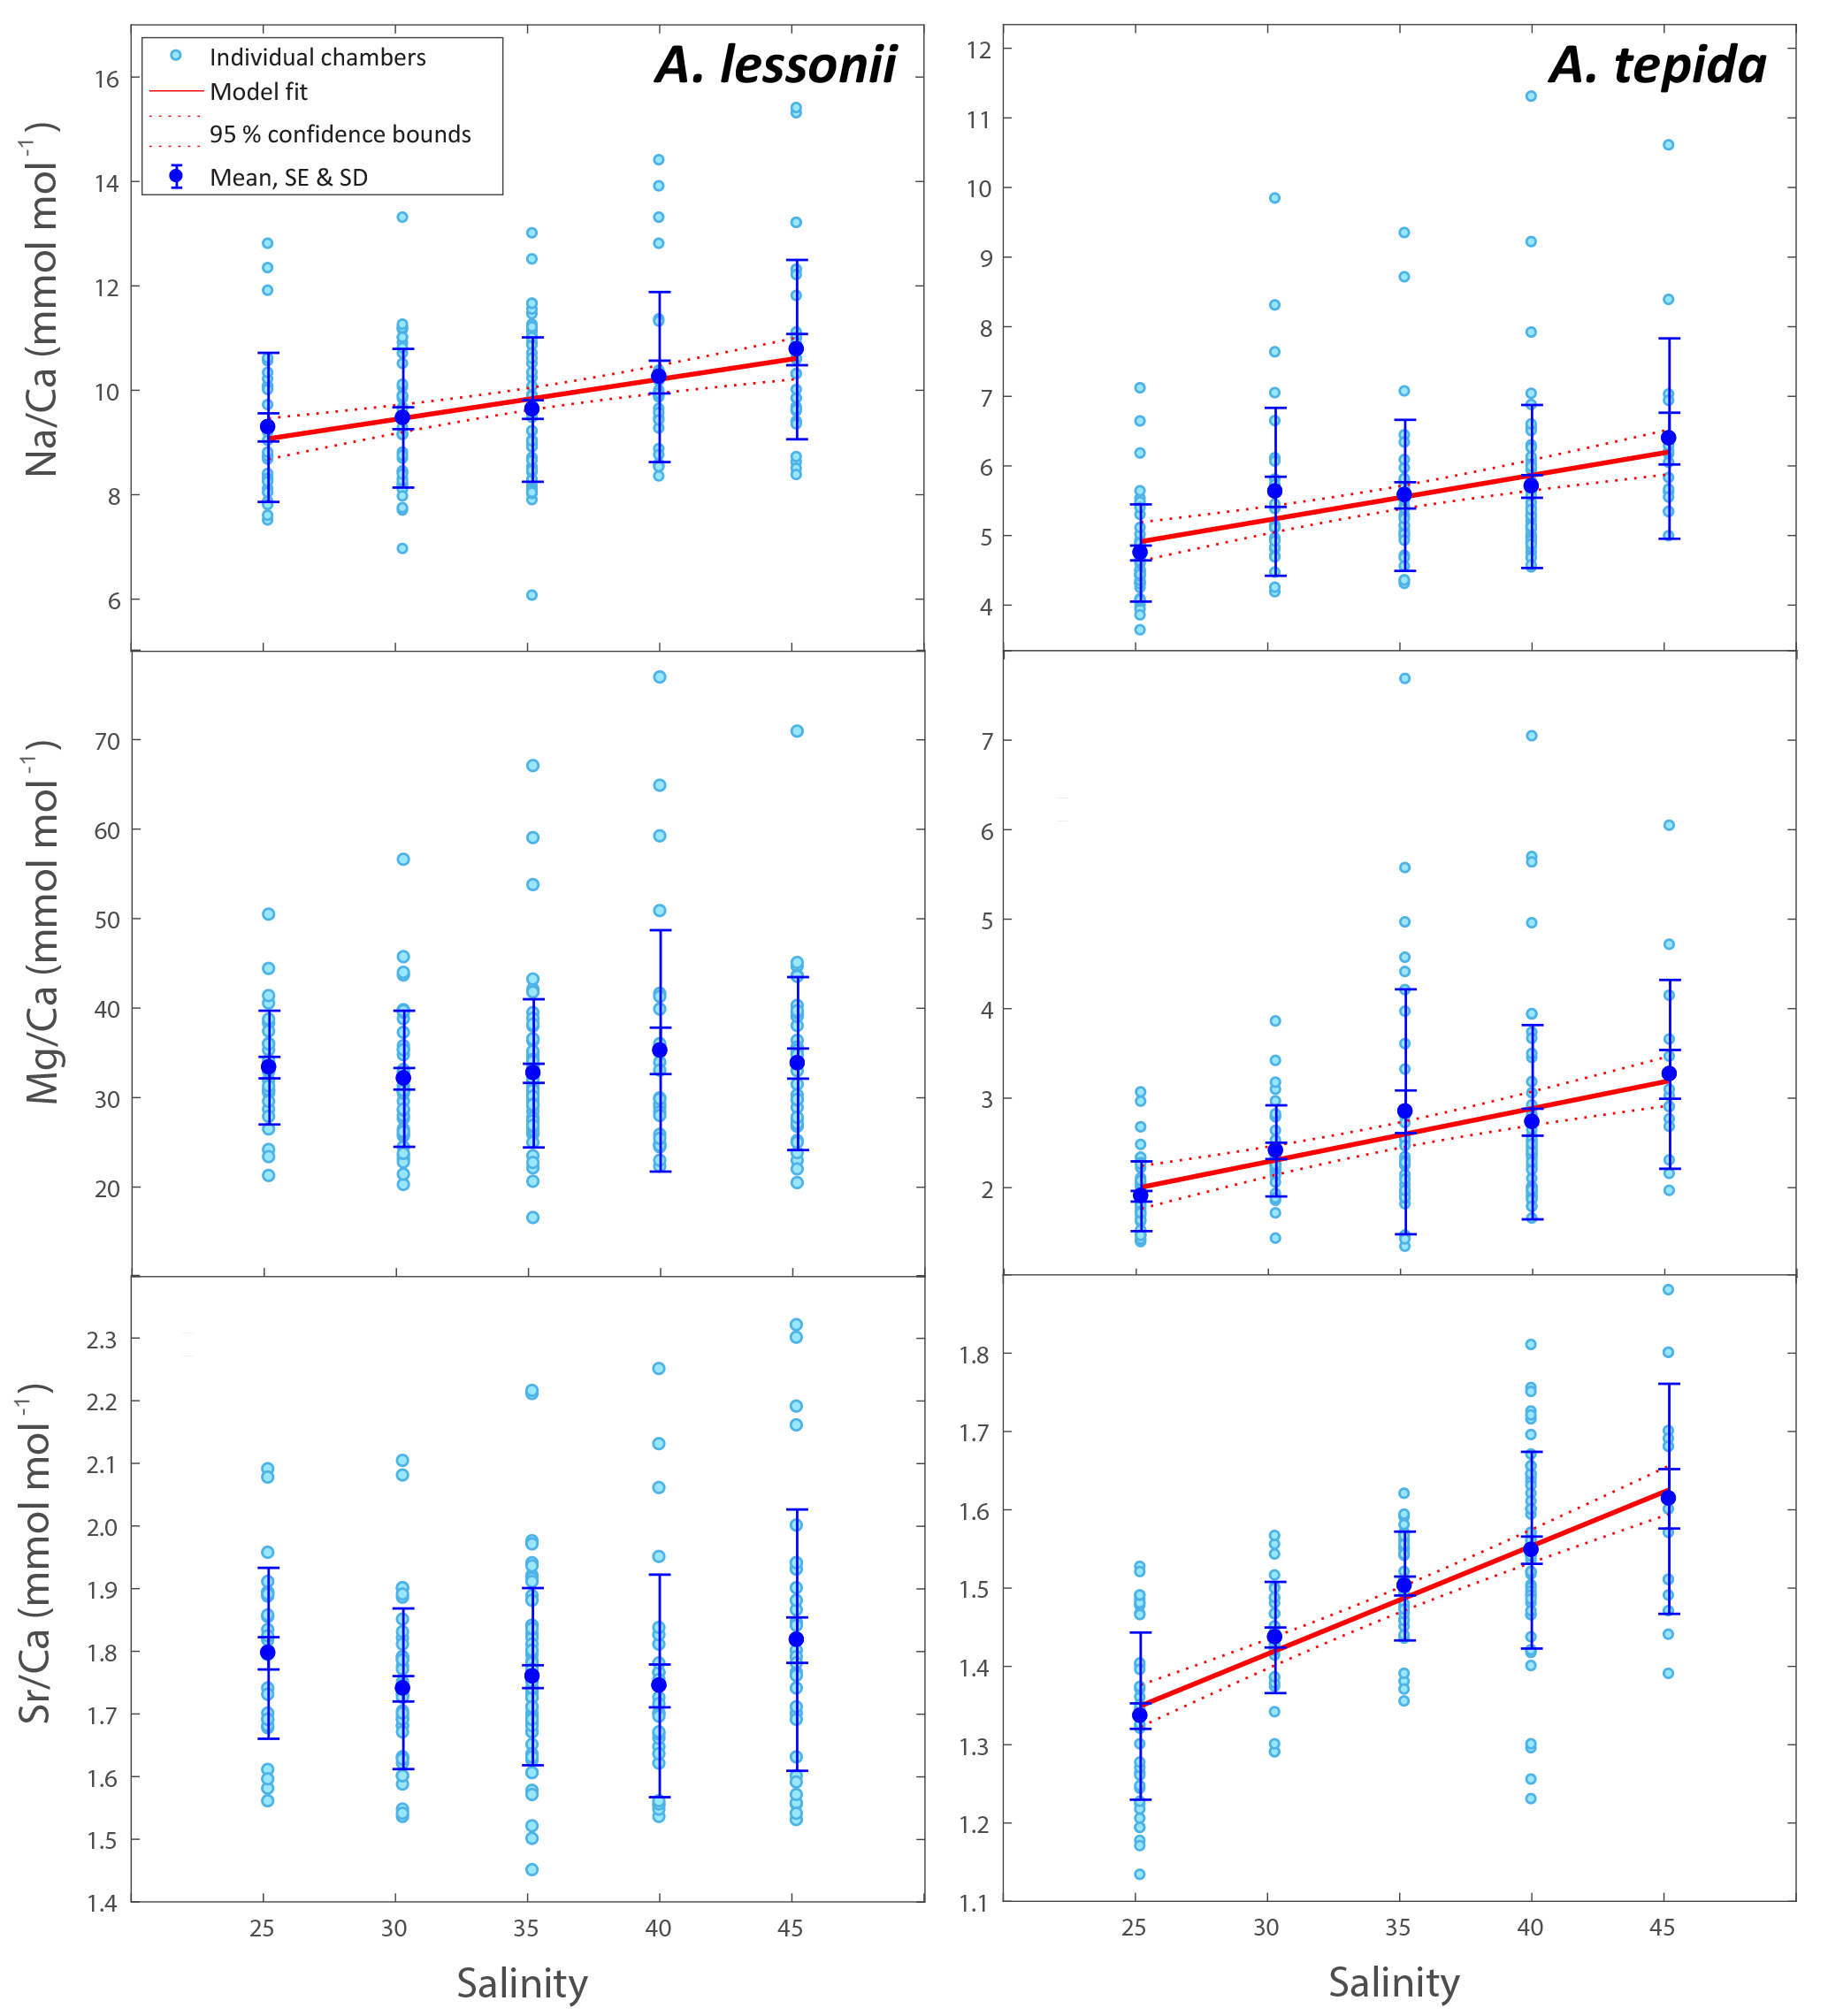
Figure 1Foraminiferal Na ∕ Cacc, Mg ∕ Cacc and Sr ∕ Cacc versus salinity. Light blue dots represent the average per specimen (n=359 for A. lessonii, n=339 for A. tepida, with 2–3 measured chambers per individual) and dark blue dots indicate the mean, with inner error bars indicating the standard error and outer error bars the standard deviation for each treatment. The linear regression model (red line) is based on the mean of individuals, with the 95 % confidence interval of the regression in dashed lines.
The LA measurements were also used to investigate the co-occurrence of elements within specimens. Since there is variability in Ca counts between the laser ablation measurements, single-spot-based element ∕ Cacc ratios may cause spurious correlation due to coupled differences in Ca counts. To test whether observed correlations between Na ∕ Cacc, Sr ∕ Cacc and Mg ∕ Cacc, based on single spots, are due to the use of a common denominator (Ca), we performed a Monte Carlo simulation. In short, the correlation coefficients between randomly drawn single-spot Mg concentration, divided by measured Ca, and measured Na ∕ Cacc concentrations were compared to the correlation coefficient of measured Na ∕ Cacc and Mg ∕ Cacc concentration ratios in our dataset. By using a kernel fit of the measured data set to draw the random data set and using the measured Ca as a common denominator we effectively simulate the spurious correlation. The Monte Carlo results show that inter-element correlations are not spurious, since the measured correlation coefficient is significantly higher then the distribution of the correlation coefficients between 10 000 randomly drawn El1 concentrations/measured Ca concentration and measured El2 ∕ Ca concentrations (Supplement S2).
Furthermore, to test whether Sr ∕ Cacc and Na ∕ Cacc variability in A. lessonii is not caused by variability in Mg content due to a potential closed-sum effect (since high amounts of incorporated Mg cations could reduce the Ca content of the shell and hence result in apparently elevated Sr ∕ Cacc and Na ∕ Cacc), we calculated maximum variability due to the sole effect of Mg substitution. For A. lessonii, variability (standard deviation) of ±0.09 mmol mol−1 in Na ∕ Cacc and ±0.016 mmol mol−1 in Sr ∕ Cacc around the mean could be caused by variability in Mg ∕ Cacc (assuming Mg substitutes for Ca in the calcite lattice, and Mg plus Ca approximates 1 mol per mol calcite). This may have influenced the Sr ∕ Cacc and Na ∕ Cacc regression slopes over salinity and also the calculated inter-element correlation coefficients, but only by a maximum of ±1 % for both elements, which is considerably lower than the total observed variability within the dataset of 16 and 9 %, respectively.
2.4 Electron microprobe mapping
To investigate variation of element distribution across the chamber wall, a number of cultured specimens were prepared for electron microprobe analysis (EPMA). From each of the five salinity conditions, six specimens from both species were selected and embedded in resin (Araldite 2020) in an aluminium ring (diameter 1 cm) in a vacuum chamber. Samples were polished with a final polishing step using a diamond emulsion with grains of 0.04 µm. This procedure resulted in exposure of a cross section of the foraminiferal chamber wall from which areas for EPMA mapping were selected (Supplement S1). These areas were selected for being perpendicular to the shell outer surface, resulting in pores completely crossing the exposed chamber wall. Elemental distributions were mapped in chambers prior to F-3 to study the element distribution across the various layers of calcite (lamella) produced with the addition of each new chamber in rotaliid foraminifera (Reiss, 1957, 1960). Elemental distribution in the shell wall was measured using a field emission electron probe micro-analyser (JEOL JXA-8530F HyperProbe) at 7.0 kV with a dwell time of 350 ms, using a spot diameter of 80 nm and a step size between 0.1538 µm and 0.4072 µm (130 × 130 pixels).
Spatial resolution of the EPMA mapping was determined using the software package CASINO (monte CArlo SImulation of electroN trajectory in SOlids, v 2.48). With the input parameters identical as used in our analysis (80 nm spot size, beam current 7 keV, etc.), the simulated surface radius of the backscattered electrons (i.e. the spatial resolution) equals 590 nm. Semi-quantitative El ∕ Cacc profiles were calculated by averaging the El ∕ Cacc intensities parallel to the banding direction and applying a constant calibration factor obtained from LA-ICP-MS measurements on the same specimen, similar to the procedure of Eggins et al. (2004). We did not use the depth-resolved laser ablation profiles for this purpose but used the average value from the profiles for correlation with the EPMA-derived intensities.
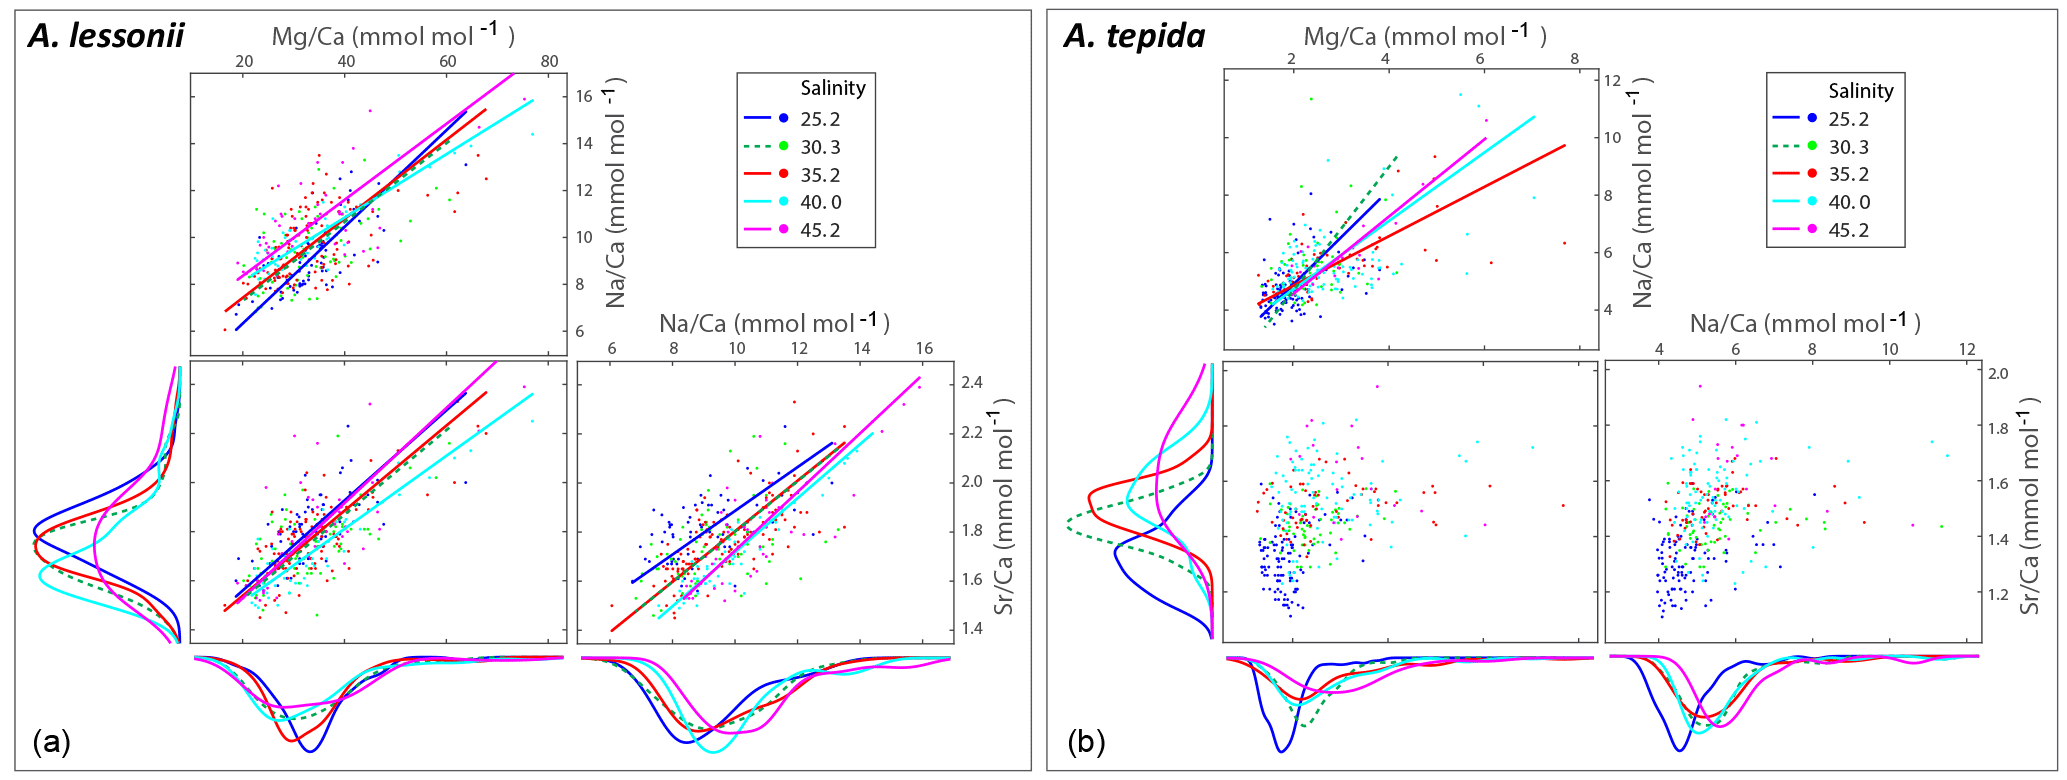
Figure 2Individual chamber LA-ICP-MS analyses showing correlations between foraminiferal Mg ∕ Cacc, Sr ∕ Cacc and Na ∕ Cacc for A. tepida (a) and A. lessonii (b) per salinity condition. Significant orthogonal linear regressions are indicated with a line, colour coded for salinity (see legend). Correlation coefficients, slope and intercepts of these regressions can be found in Supplement S3. In short, within salinity conditions, element ratios are strongly correlated with each other in A. lessonii, whereas in A. tepida, element ratios do not (strongly) correlate with each other. When combining all single-spot data in A. tepida, element ratios correlate amongst each other because the incorporation of all three elements increases with salinity, shifting the distributions to higher values. In A. lessonii, only the Na ∕ Cacc distributions shift towards higher values with increasing salinity, whereas Mg ∕ Cacc and Sr ∕ Cacc distributions are relatively similar between salinity conditions.
3.1 Foraminiferal calcite element ratios and partitioning coefficients as a function of salinity
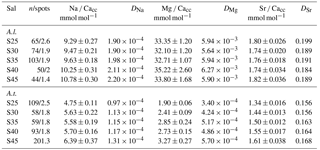
Per treatment, from lowest to highest salinity, average Na ∕ Cacc of the newly formed calcite varied between 9.3 and 10.8 mmol mol−1 for A. lessonii and between 4.7 and 6.4 mmol mol−1 (highest salinity) for A. tepida (Fig. 1), with a corresponding partition coefficient (note that partition coefficients are “apparent”, not taking into account speciation/activity of Na) ranging from 1.90 × 10⁻⁴ to 2.20 × 10⁻⁴ and from 0.97 × 10⁻⁴ to 1.30 × 10⁻⁴ for Amphistegina and Ammonia, respectively (Table 3). For both species, sets of single-specimen Na ∕ Cacc show slightly skewed distributions towards higher Na ∕ Cacc for all salinities (Kolmogorov–Smirnov test, at the 95 % confidence level). Combining all specimens (based on the average of single-spot measurements per specimen), Na ∕ Cacc shows a positive linear relationship with salinity for both A. lessonii and A. tepida (Na ∕ Ca, F1, 186 =20.9, p<0.001 for A. lessonii and Na ∕ Ca, , p<0.001 for A. tepida; Fig. 1). The observed average relative standard deviation between specimens in Na ∕ Cacc at each of the five salinities is 15 % for A. lessonii and 20 % for A. tepida. The variance in Na ∕ Cacc between individual specimens explained by salinity is η2=0.08 for A. lessonii and η2=0.14 for A. tepida.
Specimen averages of Mg ∕ Cacc and Sr ∕ Cacc correlate positively with salinity in A. tepida (Mg ∕ Ca and Sr ∕ Cacc = , , p<0.001), whereas neither ratio correlates with salinity in A. lessonii. Average relative standard deviations for the five salinity conditions per element are 27 % for Mg ∕ Cacc and 9 % for Sr ∕ Cacc in A. lessonii and 32 % in Mg ∕ Cacc and 7 % for Sr ∕ Cacc for A. tepida. In A. lessonii, the proportion of variance in Sr ∕ Cacc explained by salinity is η2=0.04 (p<0.01) (Mg ∕ Cacc not significant) and for A. tepida, the proportion of variance in Sr ∕ Cacc explained by salinity is η2=0.44 and in Mg ∕ Caccη2=0.19 (p<0.001).
Single-spot analyses on Ammonia tepida show that Na ∕ Cacc and Mg ∕ Cacc are significantly correlated within the salinity treatments, except for condition S=30 (Fig. 2). For the individual salinity treatments, single-spot Sr ∕ Cacc and Mg ∕ Cacc, as well as Na ∕ Cacc and Sr ∕ Cacc are not correlated significantly with each other, except for S=25. Between salinity treatments, distributions in this species shift towards higher Na ∕ Cacc, Sr ∕ Cacc and Mg ∕ Cacc values with increasing salinity, although for the range between 30 and 40 Na ∕ Cacc distributions remain rather similar (Fig. 2). For Amphistegina lessonii, distributions of Sr ∕ Cacc and Mg ∕ Cacc ratios overlap largely between salinities, and only Na ∕ Cacc distributions shift towards higher values (Fig. 2). Within each salinity condition, however, single-spot Na ∕ Cacc, Mg ∕ Cacc and Sr ∕ Cacc in this species are positively correlated amongst each other, whereby the Na ∕ Cacc intercept of these relationships increases with increasing salinity (Fig. 2 and Supplement S3).
Table 3Average El ∕ Cacc ratios of the foraminiferal calcite (based on average of average specimens value per salinity (Sal) condition (S25–S45)) ± standard error and corresponding apparent partitioning coefficients, defined as DEl = (El ∕ Cacc) ∕ (El ∕ CaSeawater) for A. lessonii (A.l.) and A. tepida (A.t.). “n/spots” stands for number of specimens and average number of spots per specimen.
3.2 Size and chamber effect on Na ∕ Cacc and inter-specimen variance
Specimens of A. lessonii produced most new chambers at salinities of 25, 30 and 35, closest to the salinity in their “natural” habitat (Burgers' Zoo aquarium, salinity 33.9–34.3; Ernst et al., 2011). Size averages are not significantly different between these salinity treatments, based on a Kruskal–Wallis test, whereas specimens grown at salinities of 40 and 45 were significantly smaller than those from lower salinities, reflecting lower chamber addition rates over the course of the culturing experiment at higher salinity (Fig. 3). With all specimens combined, Na ∕ Cacc is not significantly related to size in A. lessonii. Specimens of A. tepida produced less chambers at salinity 45, possibly because such a high salinity is probably close to its tolerance levels (Murray, 2014), even though this species is adapted to relatively large salinity shifts in their tidal flat habitat. Specimens in the lower-salinity groups (25, 30, 35) grew larger compared to specimens grown in two of the highest-salinity groups (Fig. 3). Combining all specimens, Na ∕ Cacc is significantly related to size in A. tepida, yet with a small slope (−0.003) and just within the 95 % confidence interval (p=0.04).
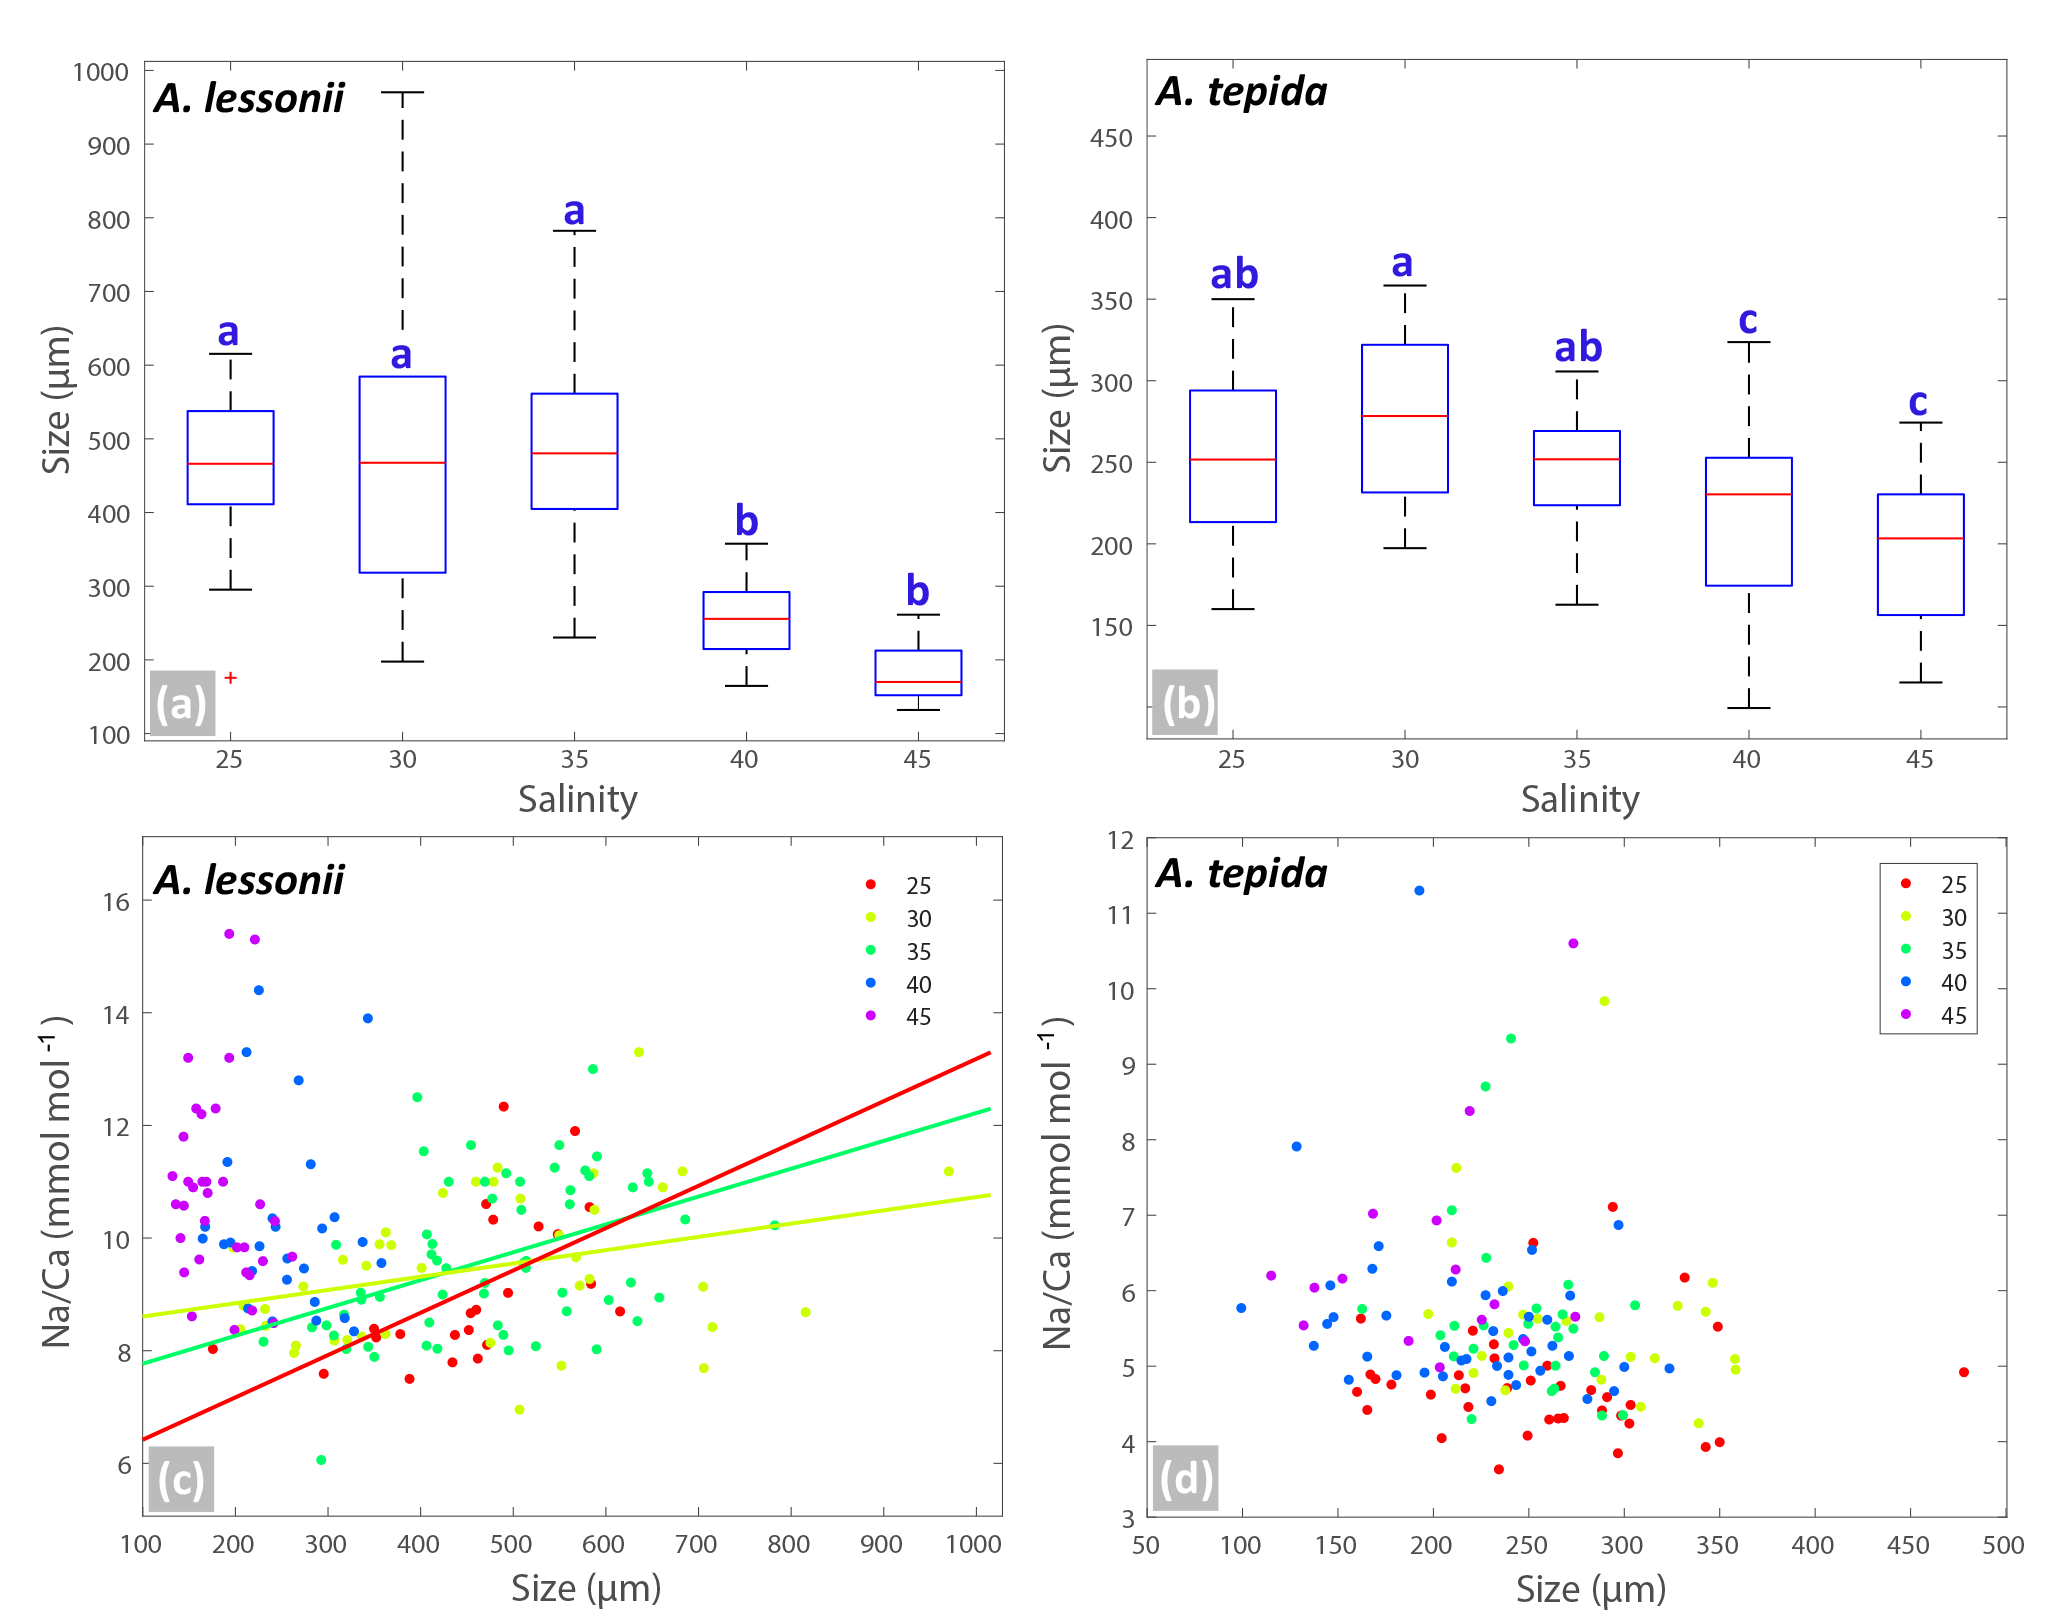
Figure 3Box plots (a, b) showing the size distributions (median, first and third quartiles, minimum and maximum values) for each salinity condition – n=24, 40, 60, 27, 33 for A. lessonii and n=38, 24, 28, 41, 15 for A. tepida. Letters a, b, c indicate significant different population means, based on ANOVA (p<0.001). Panels (c, d) show the Na ∕ Ca values against size measurements per individual, colour coded per salinity condition (see legend), for A. lessonii and A. tepida. Significant linear regression lines are plotted for A. lessonii.
Within each salinity tested, single-chambered Na ∕ Cacc is slightly positively related to size for the specimens of A. lessonii cultured at salinities 25 (slope = 0.008, R2=0.32, p<0.01), 30 (slope = 0.002, R2=0.11, p<0.05) and 35 (slope = 0.005, R2=0.18, p<0.001). For the same species, Mg ∕ Cacc is positively correlated with size at salinities 25, 30 and 35, with a similar slope of 0.03 (p<0.05). Sr ∕ Cacc also shows a positive relationship to size within salinities 25, 30 and 35 with slopes of 0.0007, 0.0003, and 0.0005 (p<0.001) respectively. For A. tepida, there is only a slight negative correlation between size and Sr ∕ Cacc for specimens cultured at salinity 25 (slope = , p<0.001) and no significant correlation for the other conditions, or between size and Na ∕ Cacc and Mg ∕ Cacc in any of the salinities.
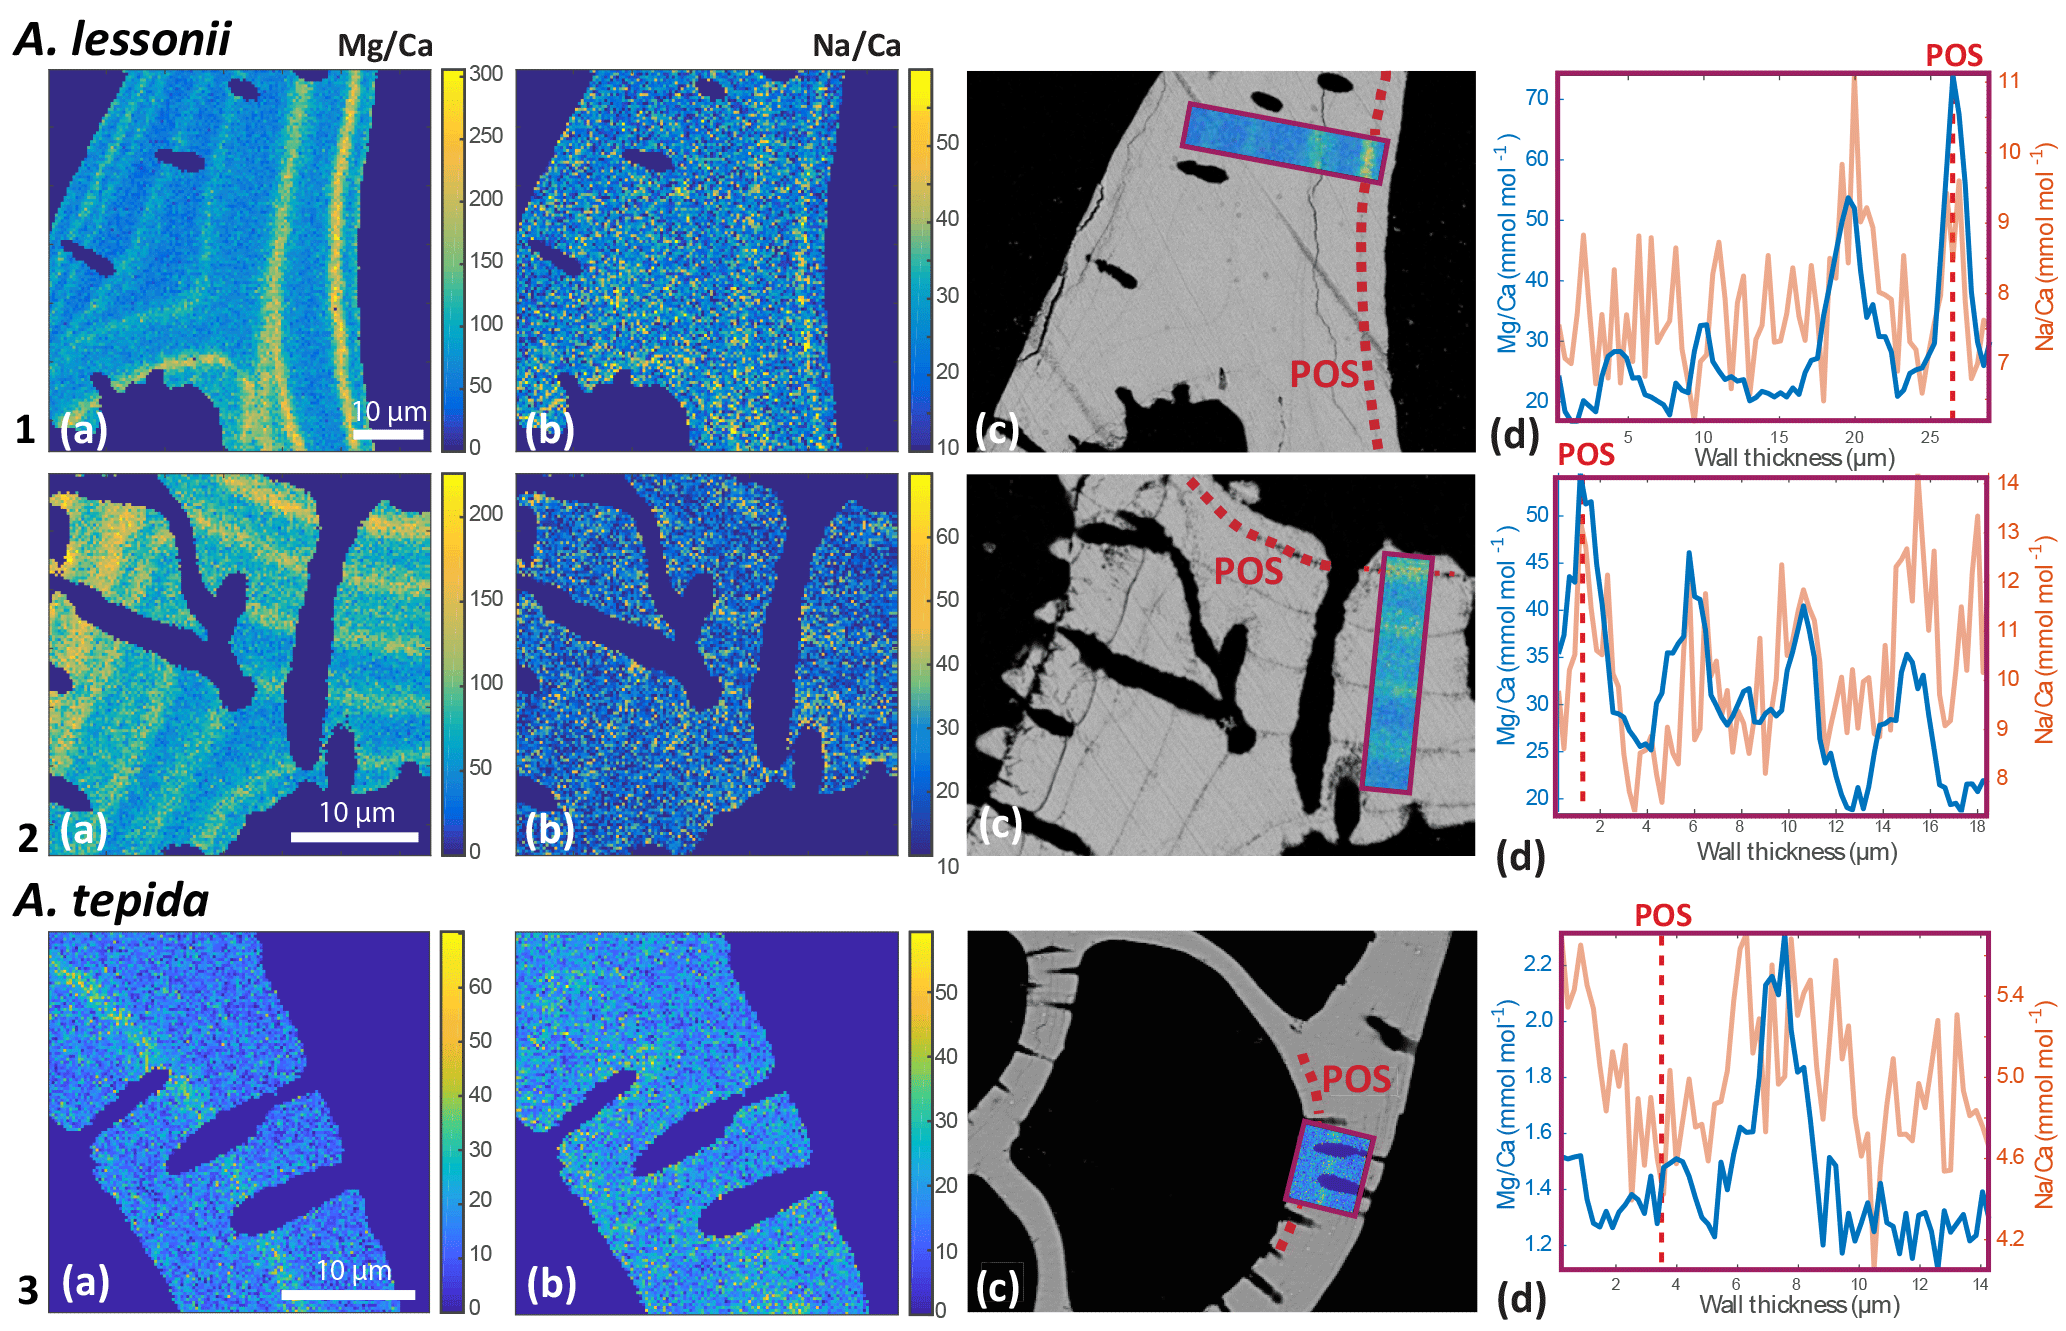
Figure 4Foraminiferal Mg ∕ Cacc (panels a) and Na ∕ Cacc (panels b) intensity ratio maps, obtained with EPMA, for two specimens of A. lessonii grown at a salinity of 30 (row 1) and 25 (row 2) and one specimen of A. tepida (row 3). Panels (d) show profiles for Mg ∕ Ca (blue) and Na ∕ Ca (red), based on averaged EPMA ratios scaled to LA-ICP-MS measurements of the same specimen, of an averaged lateral profile area through the chamber wall perpendicular to the lamella separated by organic linings (purple rectangles in c). The transect area is indicated with a purple rectangle, on top of a backscatter SEM image (c), showing that the high El ∕ Ca bands overlap with the primary organic sheet (POS, marked with dashed red line) and subsequent organic linings. See Supplement S4 for the results for three more specimens.
At the lowest salinity, Na ∕ Cacc in the F chamber (newest chamber) shows slight (0.9 mmol mol−1 Na ∕ Ca higher median) but significantly higher values than the F-2 chambers for A. lessonii (multicomparison test based on Kruskal–Wallis test, p < 0.05). For specimens of A. lessonii cultured at other salinities and for A. tepida at any of the salinities tested, no significant correlations between Na ∕ Cacc and chamber position were observed (note that only chamber positions F to F-2 were taken into account, as for the lower chamber position sample numbers were insufficient). Furthermore, chamber position shows no significant effect on Mg ∕ Cacc and Sr ∕ Cacc.
To further investigate the variance between and within individuals, a multiway ANOVA was performed to investigate the effect on Na ∕ Cacc per salinity condition. Inter-individual variance is significant and larger than the variance between chamber groups and intra-individual variance in all salinity groups, with the between-individual variability accounting for of the variance (p<0.001) for A. lessonii and A. tepida, respectively. The variance due to chamber position is not significant and the remaining intra-individual variance accounts for for A. lessonii and A. tepida, respectively.
3.3 Elemental distributions in the chamber wall
EPMA maps of cross-sectioned chamber walls of A. lessonii show that, within the resolution limits of the technique, bands of elevated Na ∕ Cacc intensities overlap with zones of elevated Mg ∕ Cacc (Fig. 4 and Supplement S4). Mg bands show higher amplitudes than Na bands but clearly coincide spatially. Comparing EPMA maps with the backscatter SEM image of the exposed sections shows that the bands with the highest Na ∕ Cacc and Mg ∕ Cacc occur in the proximity of the organic linings, which are clearly visible in the backscatter SEM image (Fig. 4), with a number of high Na- and Mg-rich bands with slightly lower maximum intensities occurring towards the outer chamber surface coinciding with subsequent organic linings. For A. tepida, one band of elevated Mg ∕ Cacc is visible, coinciding with the POS with no clear Na ∕ Cacc banding being detected.
4.1 The effect of salinity and DIC on Na ∕ Cacc, Mg ∕ Cacc and Sr ∕ Cacc
The single-specimen Na ∕ Cacc data of the cultured A. lessonii and A. tepida both correlate positively with salinity (Table 3, Fig. 1). This is in line with previous calibrations (for Ammonia tepida, Wit et al., 2013; for cultured Globigerinoides ruber, Allen et al., 2016; for field-collected G. ruber and G. sacculifer, Mezger et al., 2016). However, our Na ∕ Ca–salinity calibration for A. tepida is somewhat less sensitive than that observed earlier for the same species (Wit et al., 2013). An offset in Na ∕ Cacc values between calibrations for a single species has been reported previously for the planktonic G. ruber and G. sacculifer (e.g. Mezger et al., 2016; Allen et al., 2016). Such an apparent discrepancy between studies may be caused by differences between cultures or in situ conditions in one of the conditions not focussed on (e.g. carbon chemistry, light intensity). Alternatively, subtle analytical differences (e.g. differences in cleaning procedures), statistical reasons (for example differences in the number of analyses or sample size) or the effect of genotypic variability on element incorporation (Sadekov et al., 2016) may also play a role. Although the calibration presented here consists of many more data points compared to those in Wit et al. (2013), we do not want to dismiss the latter as several parameters (like cleaning procedures or the source of the seawater used for the culture media) inherently vary (marginally) between studies. As such the difference observed between studies merely illustrates the potential range for this species.
Contrasts in sensitivities such as observed for Na ∕ Cacc between calibrations also apply to Mg ∕ Cacc and Sr ∕ Cacc, both of which here show an increase with salinity in A. tepida but not in A. lessonii (Fig. 1). Previous culturing experiments with Ammonia tepida, however, showed a smaller sensitivity of Mg ∕ Cacc to salinity (0.029–0.0044 mmol mol−1 change per salinity unit; Dissard et al., 2010b) than that reported here (0.06). Still, all these sensitivities are considerably lower than that reported in Kısakürek et al. (2008) for the planktonic G. ruber (0.23 when Mg ∕ Cacc is assumed to increase linearly with salinity) but in the same range as that reported by Nürnberg et al. (1996) for G. sacculifer (0.05). The sensitivity of Sr ∕ Cacc to salinity in A. tepida (0.014; Table 3) is comparable to that for O. universa (0.008; Lea et al., 2008) and G. ruber (0.02; Kisakürek et al., 2008) and similar to the significant effect of salinity on Sr incorporation in the same species (0.01–0.02, depending on temperature) found by Dissard et al. (2010b).
Sea water carbonate chemistry is an additional factor potentially affecting trace metal uptake (e.g. Lea et al., 1999; Keul et al., 2017; Russell et al., 2004). Since salinity and dissolved inorganic carbon concentration in the culture media co-varied in our experiments similar to the natural environment (Table 1), Na ∕ Cacc in our cultured specimens also correlates positively to sea water [DIC]. However, sodium incorporation has been shown to be independent from changes in carbonate chemistry in cultured Amphistegina gibbosa and several other benthic hyaline and porcelaneous species (Van Dijk et al., 2017a). Additionally, Allen et al. (2016) also found no significant effect of carbonate chemistry (i.e. varying [CO]) on Na incorporation in cultured G. ruber, suggesting that the variability in Na ∕ Cacc observed here in A. lessonii can be attributed to changes in salinity rather than [DIC]. However, future studies should disentangle the impacts of DIC and salinity on Na ∕ Ca, in order to increase proxy confidence in areas where Na ∕ Ca and DIC relationships differ from the global average. Previous studies showed that Sr ∕ Cacc correlates positively to [DIC] in A. tepida (Keul et al., 2017), which may account for part of the correlation between Sr ∕ Cacc and salinity reported here for this species. The published sensitivity of Sr ∕ Cacc to [DIC] is approximately 2 × 10⁻⁵ mmol mol−1 change in Sr ∕ Cacc for every 1 µmol kg−1 change in [DIC], likely representing the maximum potential effect of DIC on Sr partitioning given that others found no significant effect (Dissard et al., 2010a). For a change in ∼ 850 µmol kg−1 (Table 1), this would amount to an increase in Sr ∕ Cacc of 0.019 mmol mol−1 (Keul et al., 2017) over the salinity range studied here, thereby accounting for approximately 7 % of the total observed change in Sr ∕ Cacc (Table 3). Inorganic carbon chemistry is known to affect growth rates and shell weights in benthic foraminifera (Dissard et al., 2010a; Keul et al., 2013), which in turn may affect incorporation of Sr and Mg, hence providing a mechanistic link between inorganic carbon chemistry and element partitioning.
El ∕ Ca ratios of specimens of both species grown within each salinity condition are characterized by a relatively large variability. In the overall data set, salinity only explains around 8 % of the variation in Na incorporation for A. lessonii and 14, 19 and 44 % of Na, Mg and Sr incorporation in A. tepida. Nevertheless, for A. lessonii, the Na ∕ Ca mean values (which translates to the values obtained from traditional solution-ICP-MS) fit the regression model relatively well (Fig. 1). However, given the low sensitivity, many specimens are required to reduce the uncertainty (Supplement S5). This is reflected by the relatively wide prediction bounds for the Na ∕ Ca–salinity regressions, indicating an uncertainty associated with a single Na ∕ Cacc measurement. The relatively large inter-specimen variability in element ∕ Cacc ratios has been reported and discussed before (e.g. Sadekov et al., 2008; De Nooijer et al., 2014a), but the cause for this variability remains to be identified.
4.2 Inter-specimen, inter-species and intra-shell El ∕ Cacc variability
Single-chamber measurements show that Na ∕ Cacc for both species varies between chambers (i.e. specimens) with a RSD (relative standard deviation) of 15–20 %, despite identical culture conditions (Fig. 1). Since the analytical error on Na ∕ Cacc accounts for approximately 2 % (Table 2), a large portion of the observed variability between specimens must be due to ontogeny and/or inter-specimen differences in biomineralization controls (De Nooijer et al., 2014a).
Foraminiferal shell sizes at salinities 40 and 45 are significantly smaller than those cultured at lower salinities. When combining data from all salinities, however, there is no (A. lessonii) or only a very small (A. tepida) negative correlation between Na ∕ Cacc and shell size, as opposed to a more substantial negative correlation as observed by Wit et al. (2013). In fact, there appears to be a growth optimum around salinity of 30–35, whereas growth at higher salinities might be hampered (Fig. 3). This may indicate that the earlier observed negative correlation between size and Na ∕ Ca was the result of indirect co-variation with salinity rather than a causal relationship resulting in lower Na ∕ Ca values in smaller specimens. This is corroborated by our observation that, for individuals grown at a similar salinity, the relationship between Na ∕ Cacc and size is either slightly positive or absent. Hence, size unlikely affects the observed inter-specimen variability in Na ∕ Cacc, which is supported by the absence of a correlation between chamber position (and hence ontogenetic stage) and Na ∕ Cacc. This implies that measuring specimens of different size fractions or measuring different or multiple chambers should not significantly affect the application of the Na ∕ Cacc salinity proxy. However, sufficient specimens (n>30, for an error margin < 5 % at the 95 % confidence level; Sadekov et al., 2008; De Nooijer et al., 2014a) are required for measurements. As most variability is between individuals rather than between chambers (Sect. 3.3), analysing more chambers of the same specimen would increase the accuracy of the measurement but not improve the precision of the salinity estimate, given the large inter-specimen variability. Without a major effect of ontogeny, physiological processes at the organismal level are more likely to cause observed large inter-specimen variability in Na ∕ Cacc; however, these processes remain poorly understood.
In A. lessonii, single-spot Na ∕ Cacc, Sr ∕ Cacc and Mg ∕ Cacc are correlated amongst each other within each salinity condition (Fig. 2). Correlation coefficients between the three element ratios are similar for the different salinities, with a superimposed increase in the Na ∕ Cacc relative to that of Mg ∕ Cacc and Sr ∕ Cacc with increasing salinity (Supplement S3). In contrast, single-spot Sr ∕ Cacc and Mg ∕ Cacc in A. tepida are not correlated, whereas incorporation of all these elements increases significantly with salinity. Within salinities Mg ∕ Cacc and Na ∕ Cacc are significantly correlated in four out of the five salinities, but with much lower correlation coefficients compared to A. lessonii (Fig. 2 and Supplement S3). However, between the different salinities these elements are correlated in A. tepida, implying that for A. tepida salinity is one of the actual parameters controlling Na ∕ Cacc, Mg ∕ Cacc and Sr ∕ Cacc element uptake.
Within conditions, the correlations between both Sr ∕ Cacc and Na ∕ Cacc with Mg ∕ Cacc in A. lessonii differ from the correlation of Sr ∕ Cacc with Mg ∕ Cacc (correlation absent) and Na ∕ Cacc with Sr ∕ Cacc (weaker correlation) for A tepida. The differences between the correlations likely reflects differences in their calcification pathway (e.g. transport of ions to the site of calcification) and/or might be explained by differences in lattice strain due to the higher Mg content in A. lessonii, whereas this effect is expected to be less prominent in low-Mg species such as A. tepida (Evans et al., 2015). Differences in the calcification pathway may also explain why Sr ∕ Cacc and Mg ∕ Cacc are correlated with salinity in A. tepida, but not in A. lessonii (Sect. 4.1).
In both species, Mg is found to be elevated in bands located close to the primary organic sheet and to other organic layers (Fig. 4), present in rotaliid species due to their lamellar calcification mode (Reiss, 1957, 1960). This is similar to reports of within-chamber wall banding in many elements in other species (Branson et al., 2016; Eggins et al., 2004; Sadekov et al., 2005; Paris et al., 2014; Spero et al., 2015; Fehrenbacher et al., 2017; Kunioka et al., 2006; Steinhardt et al., 2015; Hathorne et al., 2009). In planktonic species element banding has been related to diurnal light–dark cycles rather than the addition of a new lamella with chamber addition (Spero et al., 2015; Fehrenbacher et al., 2017). Whether, in the species studied here, chamber addition (and hence element banding) is related to day–night cycles remains to be investigated. As in other studies, the Na and Mg bands are spatially correlated (Fig. 4). For Ammonia tepida, the banding in both elements is less pronounced than for Amphistegina lessonii, which is likely related to the (much) lower average Mg ∕ Cacc and Na ∕ Cacc ratios in the former species. Alternatively, as the observations are close to the spatial resolution of the method, the observed pattern could also be due to the band's width being smaller in A. tepida compared to A. lessonii.
4.3 Biomineralization controls on element uptake
How elements are transported to the site of calcification and what the role of sea water vacuolization, leakage, trans-membrane transport of ions, pH regulation and precipitation rate is, and how this differs between species and specimens, remain to be discovered. The overall element composition of the calcite precipitated by A. lessonii suggests that the calcification process of this species may more closely resemble inorganic calcite precipitation from sea water, compared to that in Ammonia tepida and other low-Mg calcite precipitating species. As a result, more elements (like Mg) are incorporated and crystal lattice strain in intermediate-Mg calcite species is elevated, which may promote incorporation of other elements through stress compensation (Mucci and Morse, 1983; Mewes et al., 2015). This would explain the observed inter-element correlations within salinities. Another difference between the species studied here may be caused by differences in CaCO3 phase shifts during calcite precipitation (e.g. Bots et al., 2012; De Yoreo et al., 2015). A metastable vaterite pre-cursor phase recently found in two planktonic species may explain the low Mg incorporation relative to inorganic calcite (Jacob et al., 2017). The higher Mg contents of A. lessonii could be related to the (partial) absence of a vaterite–calcite transformation in this species. An amorphous calcium carbonate (ACC) pre-cursor phase has been observed in other marine biomineralizing organisms (e.g. Weiner et al., 2003; Giuffre et al., 2015) and often been hypothesized to play a role in foraminiferal calcification (Erez, 2003; De Nooijer et al., 2014b), although it has not yet been directly detected. A higher Mg concentration at the site of calcification could hypothetically result in a phase shift from ACC directly into to calcite, whereby Mg is stabilizing the ACC, as described by Littlewood et al. (2017). In inorganic calcite, the absence of a vaterite precursor phase also enhances the incorporation of other metals incompatible with calcite, such as Sr (Littlewood et al., 2017), and a similar process could hypothetically contribute to inter-species differences in element partitioning similar to that observed here. Although the strong fractionation against Mg in A. tepida could reflect double fractionation through a vaterite–calcite transformation (Jacob et al., 2017) the low-Mg content might as well reflect a more enclosed site of calcification, whereby ions are mainly transported trans-membrane (Nehrke et al., 2013; De Nooijer et al., 2014b). However, the experiments here do not allow distinguishing between these (and other) potential mechanisms. Trans-membrane transport (TMT) of Ca2+ and concomitant leakage of Mg2+ and Sr2+ might be more sensitive to differences in ionic strength and element concentrations, hence possibly explaining the salinity effect on the incorporation of these elements in A. tepida, whereas it does not in A. lessonii, assuming that TMT contributes relatively more to the supply of ions to the site of calcification in this species compared to A. lessonii, which might be relatively more dependent on sea water vacuolization. However, since there are many, both biotic and abiotic, mechanisms that can (simultaneously) influence (coupled) element partitioning, it is challenging to resolve the exact mechanism responsible for inter-specimen and inter-species differences in El ∕ Ca.
The spatial correlation between the intra-shell distributions of Mg and Na, associated with the organic linings, suggests a coupled control on these elements during the calcification process, which is in line with the observed inter-specimen correlations. This suggests that incorporation of these cations is influenced by similar biomineralization mechanisms, related to sea water vacuolization (Erez, 2003; Bentov and Erez, 2006), trans-membrane transport of elements (Nehrke et al., 2013), the lattice-strain effect (Evans et al., 2015) and/or metastable precursor phases (Jacob et al., 2017). The relative contributions of these mechanisms might differ between species, resulting in the observed differences in element incorporation and different inter-element correlations between species. Differences in the efficiency of such processes between specimens might cause the observed inter-specimen variability, whereas changes in these processes during the calcification time could be responsible for the observed correlation between elements within the chamber wall.
By extending existing calibrations of the Na ∕ Cacc–salinity proxy to the intermediate-Mg calcite precipitating benthic foraminifer Amphistegina lessonii, we show that the Na ∕ Cacc increase as a function of salinity is similar to that in previously studied species. The absolute Na ∕ Cacc for A. lessonii is, however, higher than that in Ammonia tepida. In A. tepida, Mg ∕ Cacc and Sr ∕ Cacc are positively correlated with salinity, whereas they are not impacted by salinity in A. lessonii. Within each salinity, single-chamber Na ∕ Cacc and Mg ∕ Cacc are positively correlated in A. tepida, whereas single-chamber Sr ∕ Cacc is not correlated with either Mg ∕ Cacc or Na in this species. For A. lessonii, all Sr ∕ Cacc, Mg ∕ Cacc and Na ∕ Cacc combinations are positively correlated at the single-chamber level. Electron microprobe analysis mapping of Na and Mg within chamber walls of cultured specimens shows that in A. lessonii, Na ∕ Cacc and Mg ∕ Cacc occur in elevated bands in close proximity to the primary organic lining. For specimens of A. tepida, Mg banding appears similar to that in A. lessonii, whereas Na banding is less prominent in this species. These results suggest that biomineralization controls on incorporated elements differ between species.
The data on which this publication is based can be found through the following DOI: https://doi.org/10.4121/uuid:9e21d27d-b203-42f1-9ae3-2fa6b4791fc7 (Geerken and de Nooijer, 2018).
The supplement related to this article is available online at: https://doi.org/10.5194/bg-15-2205-2018-supplement.
GJR, LJdN and EG designed the culture experiment and EG and IvD carried them out. EG and IvD prepared the foraminiferal samples and analysed the specimens using EPMA. EG analysed the data and prepared the manuscript with contributions from all co-authors.
The authors declare that they have no conflict of interest.
We would like to thank Wim Boer for assistance with LA-ICP-MS measurements,
Patrick Laan for sea water measurements and Karel Bakker for DIC
measurements. We kindly thank Max Janse (Burgers' Zoo, Arnhem) for providing
stock specimens of A. lessonii and Kirsten Kooijmans (NIOZ) for
providing cultures of Dunaliella salina. Sergei Matveev is thanked
for assistance with the electron microprobe analysis and Leonard Bik for
assistance with polishing the samples. This work was carried out under the
programme of the Netherlands Earth System Science Centre (NESSC), financially
supported by the Ministry of Education, Culture and Science (OCW) (grant no.
024.002.001) and Darwin Centre for Biogeosciences (programme
3020).
Edited by: Hiroshi
Kitazato
Reviewed by: three anonymous referees
Allen, K. A., Hönisch, B., Eggins, S. M., Haynes, L. L., Rosenthal, Y., and Yu, J.: Trace element proxies for surface ocean conditions: A synthesis of culture calibrations with planktic foraminifera, Geochim. Cosmochim. Ac., 193, 197–221, 2016.
Anand, P., Elderfield, H., and Conte, M. H.: Calibration of Mg ∕ Ca thermometry in planktonic foraminifera from a sediment trap time series, Paleoceanography, 18, 1050, https://doi.org/10.1029/2002kpa000846, 2003.
Barker, S., Greaves, M., and Elderfield, H.: A study of cleaning procedures used for foraminiferal Mg ∕ Ca paleothermometry, Geochem. Geophy. Geosy., 4, 8407, https://doi.org/10.1029/2003GC000559, 2003.
Bemis, B. E., Spero, H. J., Bijma, J., and Lea, D. W.: Reevaluation of the oxygen isotopic composition of planktonic foraminifera: Experimental results and revised paleotemperature equations, Paleoceanography, 13, 150–160, https://doi.org/10.1029/98pa00070, 1998.
Bentov, S. and Erez, J.: Impact of biomineralization processes on the Mg content of foraminiferal shells: A biological perspective, Geochem. Geophy. Geosy., 7, Q01P08, https://doi.org/10.1029/2005gc001015, 2006.
Bots, P., Benning, L. G., Rodriguez-Blanco, J.-D., Roncal-Herrero, T., and Shaw, S.: Mechanistic insights into the crystallization of amorphous calcium carbonate (ACC), Cryst. Growth Des., 12, 3806–3814, 2012.
Branson, O., Bonnin, E. A., Perea, D. E., Spero, H. J., Zhu, Z., Winters, M., Hönisch, B., Russell, A. D., Fehrenbacher, J. S., and Gagnon, A. C.: Nanometer-Scale Chemistry of a Calcite Biomineralization Template: Implications for Skeletal Composition and Nucleation, P. Natl. Acad. Sci. USA, 113, 12934–12939, 2016.
De Nooijer, L. J., Hathorne, E. C., Reichart, G. J., Langer, G., and Bijma, J.: Variability in calcitic Mg ∕ Ca and Sr ∕ Ca ratios in clones of the benthic foraminifer Ammonia tepida, Mar. Micropaleontol., 107, 32–43, https://doi.org/10.1016/j.marmicro.2014.02.002, 2014a.
De Nooijer, L. J., Spero, H. J., Erez, J., Bijma, J., and Reichart, G. J.: Biomineralization in perforate foraminifera, Earth-Sci. Rev., 135, 48–58, https://doi.org/10.1016/j.earscirev.2014.03.013, 2014b.
de Nooijer, L. J., Brombacher, A., Mewes, A., Langer, G., Nehrke, G., Bijma, J., and Reichart, G.-J.: Ba incorporation in benthic foraminifera, Biogeosciences, 14, 3387–3400, https://doi.org/10.5194/bg-14-3387-2017, 2017.
De Yoreo, J. J., Gilbert, P. U., Sommerdijk, N. A., Penn, R. L., Whitelam, S., Joester, D., Zhang, H., Rimer, J. D., Navrotsky, A., and Banfield, J. F.: Crystallization by particle attachment in synthetic, biogenic, and geologic environments, Science, 349, aaa6760, https://doi.org/10.1126/science.aaa6760, 2015.
Dickson, A. and Millero, F.: A comparison of the equilibrium constants for the dissociation of carbonic acid in seawater media, Deep-Sea Res. Pt. A, 34, 1733–1743, 1987.
Dissard, D., Nehrke, G., Reichart, G. J., and Bijma, J.: Impact of seawater pCO2 on calcification and Mg ∕ Ca and Sr ∕ Ca ratios in benthic foraminifera calcite: results from culturing experiments with Ammonia tepida, Biogeosciences, 7, 81–93, https://doi.org/10.5194/bg-7-81-2010, 2010a.
Dissard, D., Nehrke, G., Reichart, G. J., and Bijma, J.: The impact of salinity on the Mg ∕ Ca and Sr ∕ Ca ratio in the benthic foraminifera Ammonia tepida: Results from culture experiments, Geochim. Cosmochim. Ac., 74, 928–940, https://doi.org/10.1016/j.gca.2009.10.040, 2010b.
Diz, P., Barras, C., Geslin, E., Reichart, G.-J., Metzger, E., Jorissen, F., and Bijma, J.: Incorporation of Mg and Sr and oxygen and carbon stable isotope fractionation in cultured Ammonia tepida, Mar. Micropaleontol., 92, 16–28, 2012.
Dueñas-Bohórquez, A., Da Rocha, R. E., Kuroyanagi, A., Bijma, J., and Reichart, G.-J.: Effect of salinity and seawater calcite saturation state on Mg and Sr incorporation in cultured planktonic foraminifera, Mar. Micropaleontol., 73, 178–189, 2009.
Dueñas-Bohórquez, A., Da Rocha, R. E., Kuroyanagi, A., De Nooijer, L. J., Bijma, J., and Reichart, G. J.: Interindividual variability and ontogenetic effects on Mg and Sr incorporation in the planktonic foraminifer Globigerinoides sacculifer, Geochim. Cosmochim. Ac., 75, 520–532, https://doi.org/10.1016/j.gca.2010.10.006, 2011.
Eggins, S. M., Sadekov, A., and De Deckker, P.: Modulation and daily banding of Mg ∕ Ca in Orbulina universa tests by symbiont photosynthesis and respiration: a complication for seawater thermometry?, Earth Planet. Sc. Lett., 225, 411–419, https://doi.org/10.1016/j.epsl.2004.06.019, 2004.
Elderfield, H. and Ganssen, G.: Past temperature and δ18O of surface ocean waters inferred from foraminiferal Mg ∕ Ca ratios, Nature, 405, 442–445, https://doi.org/10.1038/35013033, 2000.
Erez, J.: The source of ions for biomineralization in foraminifera and their implications for paleoceanographic proxies, Biomineralization, 54, 115–149, https://doi.org/10.2113/0540115, 2003.
Ernst, S., Janse, M., Renema, W., Kouwenhoven, T., Goudeau, M. L., and Reichart, G. J.: Benthic foraminifera in a large indo-pacific coral reef aquarium, J. Foramin. Res., 41, 101–113, 2011.
Evans, D., Erez, J., Oron, S., and Müller, W.: Mg ∕ Ca-temperature and seawater-test chemistry relationships in the shallow-dwelling large benthic foraminifera Operculina ammonoides, Geochim. Cosmochim. Ac., 148, 325–342, 2015.
Fehrenbacher, J. S., Russell, A. D., Davis, C. V., Gagnon, A. C., Spero, H. J., Cliff, J. B., Zhu, Z., and Martin, P.: Link between light-triggered Mg-banding and chamber formation in the planktic foraminifera Neogloboquadrina dutertrei, Pacific Northwest National Laboratory (PNNL), Richland, WA (US), Environmental Molecular Sciences Laboratory (EMSL), 2017.
Geerken, E. and de Nooijer, L. J.: Salinity Experiment, https://doi.org/10.4121/uuid:9e21d27d-b203-42f1-9ae3-2fa6b4791fc7, 2018.
Giuffre, A. J., Gagnon, A. C., De Yoreo, J. J., and Dove, P. M.: Isotopic tracer evidence for the amorphous calcium carbonate to calcite transformation by dissolution–reprecipitation, Geochim. Cosmochim. Ac., 165, 407–417, 2015.
Guillong, M., Meier, D. L., Allan, M. M., Heinrich, C. A., and Yardley, B. W.: Appendix A6: SILLS: A MATLAB-based program for the reduction of laser ablation ICP-MS data of homogeneous materials and inclusions, Mineralogical Association of Canada Short Course, 40, 328–333, 2008.
Hathorne, E. C., James, R. H., Savage, P., and Alard, O.: Physical and chemical characteristics of particles produced by laser ablation of biogenic calcium carbonate, J. Anal. Atom. Spectrom., 23, 240–243, 2008.
Hathorne, E. C., James, R. H., and Lampitt, R. S.: Environmental versus biomineralization controls on the intratest variation in the trace element composition of the planktonic foraminifera G. inflata and G. scitula, Paleoceanography, 24, PA4204, https://doi.org/10.1029/2009pa001742, 2009.
Hayward, B. W., Holzmann, M., Grenfell, H. R., Pawlowski, J., and Triggs, C. M.: Morphological distinction of molecular types in Ammonia–towards a taxonomic revision of the world's most commonly misidentified foraminifera, Mar. Micropaleontol., 50, 237–271, 2004.
Hönisch, B., Allen, K. A., Lea, D. W., Spero, H. J., Eggins, S. M., Arbuszewski, J., Rosenthal, Y., Russell, A. D., and Elderfield, H.: The influence of salinity on Mg ∕ Ca in planktic foraminifers–Evidence from cultures, core-top sediments and complementary δ18O, Geochim. Cosmochim. Ac., 121, 196–213, 2013.
Jacob, D., Wirth, R., Agbaje, O., Branson, O., and Eggins, S.: Planktic foraminifera form their shells via metastable carbonate phases, Nat. Commun., 8, 1265, https://doi.org/10.1038/s41467-017-00955-0, 2017.
Keul, N., Langer, G., de Nooijer, L. J., and Bijma, J.: Effect of ocean acidification on the benthic foraminifera Ammonia sp. is caused by a decrease in carbonate ion concentration, Biogeosciences, 10, 6185–6198, https://doi.org/10.5194/bg-10-6185-2013, 2013.
Keul, N., Langer, G., Thoms, S., De Nooijer, L. J., Reichart, G.-J., and Bijma, J.: Exploring foraminiferal Sr ∕ Ca as a new carbonate system proxy, Geochim. Cosmochim. Ac., 202, 374–386, 2017.
Kısakürek, B., Eisenhauer, A., Böhm, F., Garbe-Schönberg, D., and Erez, J.: Controls on shell Mg ∕ Ca and Sr ∕ Ca in cultured planktonic foraminiferan, Globigerinoides ruber (white), Earth Planet. Sc. Lett., 273, 260–269, 2008.
Kunioka, D., Shirai, K., Takahata, N., Sano, Y., Toyofuku, T., and Ujiie, Y.: Microdistribution of Mg ∕ Ca, Sr ∕ Ca, and Ba ∕ Ca ratios in Pulleniatina obliquiloculata test by using a NanoSIMS: Implication for the vital effect mechanism, Geochem. Geophy. Geosy., 7, Q12P20, https://doi.org/10.1029/2006gc001280, 2006.
Lea, D. W., Mashiotta, T. A., and Spero, H. J.: Controls on magnesium and strontium uptake in planktonic foraminifera determined by live culturing, Geochim. Cosmochim. Ac., 63, 2369–2379, https://doi.org/10.1016/s0016-7037(99)00197-0, 1999.
Littlewood, J. L., Shaw, S., Peacock, C. L., Bots, P., Trivedi, D., and Burke, I. T.: Mechanism of Enhanced Strontium Uptake into Calcite via an Amorphous Calcium Carbonate Crystallization Pathway, Crys. Growth Des., 17, 1214–1223, 2017.
Mehrbach, C., Culberson, C., Hawley, J., and Pytkowicx, R.: Measurement of the apparent dissociation constants of carbonic acid in seawater at atmospheric pressure, Limnol. Oceanogr., 18, 897–907, 1973.
Mewes, A., Langer, G., De Nooijer, L. J., Bijma, J., and Reichart, G. J.: Effect of different seawater Mg2+ concentrations on calcification in two benthic foraminifers, Mar. Micropaleontol., 113, 56–64, https://doi.org/10.1016/j.marmicro.2014.09.003, 2014.
Mewes, A., Langer, G., Reichart, G.-J., De Nooijer, L. J., Nehrke, G., and Bijma, J.: The impact of Mg contents on Sr partitioning in benthic foraminifers, Chem. Geol., 412, 92–98, 2015.
Mezger, E., De Nooijer, L. J., Boer, W., Brummer, G., and Reichart, G. J.: Salinity controls on Na incorporation in Red Sea planktonic foraminifera, Paleoceanography, 31, 1562–1582, 2016.
Mucci, A. and Morse, J. W.: The incorporation of Mg2+ and Sr2+ into calcite overgrowths: influences of growth rate and solution composition, Geochim. Cosmochim. Ac., 47, 217–233, https://doi.org/10.1016/0016-7037(83)90135-7, 1983.
Murray, J. W.: Ecology and palaeoecology of benthic foraminifera, Routledge, Abingdon, UK, 2014.
Nehrke, G., Keul, N., Langer, G., de Nooijer, L. J., Bijma, J., and Meibom, A.: A new model for biomineralization and trace-element signatures of Foraminifera tests, Biogeosciences, 10, 6759–6767, https://doi.org/10.5194/bg-10-6759-2013, 2013.
Nürnberg, D., Bijma, J., and Hemleben, C.: Assessing the reliability of magnesium in foraminiferal calcite as a proxy for water mass temperatures, Geochim. Cosmochim. Ac., 60, 803–814, 1996.
Paris, G., Fehrenbacher, J. S., Sessions, A. L., Spero, H. J., and Adkins, J. F.: Experimental determination of carbonate-associated sulfate delta S-34 in planktonic foraminifera shells, Geochem. Geophy. Geosy., 15, 1452–1461, https://doi.org/10.1002/2014gc005295, 2014.
Raja, R., Saraswati, P. K., and Iwao, K.: A field-based study on variation in Mg ∕ Ca and Sr ∕ Ca in larger benthic foraminifera, Geochem. Geophy. Geosy., 8, Q10012, https://doi.org/10.1029/2006GC001478, 2007.
Reichart, G. J., Jorissen, F., Anschutz, P., and Mason, P. R. D.: Single foraminiferal test chemistry records the marine environment, Geology, 31, 355–358, https://doi.org/10.1130/0091-7613(2003)031<0355:sftcrt>2.0.co;2, 2003.
Reiss, Z.: The Bilamellidea, nov. superfam., and remarks on Cretaceous globorotaliids, Contrib. Cushman. Found. Foram. Res., 8, 127–145, 1957.
Reiss, Z.: Structure of so-called Eponides and some other rotaliiform foraminifera, State of Israel, Ministry of Development, Geological Survey, 1960.
Rohling, E. and Bigg, G. R.: Paleosalinity and δ18O: A critical assessment, Paleoceanography, 103, 1307–1318, 1998.
Rohling, E. and Hilgen, F.: The eastern Mediterranean climate at times of sapropel formation: a review, Neth. J. Geosci., 70, 253–264, 2007.
Rosenthal, Y., Lohmann, G. P., Lohmann, K. C., and Sherrell, R. M.: Incorporation and preservation of Mg in Globigerinoides sacculifer: Implications for reconstructing the temperature and 18O/16O of seawater, Paleoceanography, 15, 135–145, https://doi.org/10.1029/1999pa000415, 2000.
Russell, A. D., Hönisch, B., Spero, H. J., and Lea, D. W.: Effects of seawater carbonate ion concentration and temperature on shell U, Mg, and Sr in cultured planktonic foraminifera, Geochim. Cosmochim. Ac., 68, 4347–4361, 2004.
Sadekov, A. Y., Eggins, S. M., and De Deckker, P.: Characterization of Mg ∕ Ca distributions in planktonic foraminifera species by electron microprobe mapping, Geochem. Geophy. Geosy., 6, Q12P06, https://doi.org/10.1029/2005gc000973, 2005.
Sadekov, A., Eggins, S. M., De Deckker, P., and Kroon, D.: Uncertainties in seawater thermometry deriving from intratest and intertest Mg ∕ Ca variability in Globigerinoides ruber, Paleoceanography, 23, PA1215, https://doi.org/10.1029/2007pa001452, 2008.
Sadekov, A. Y., Darling, K. F., Ishimura, T., Wade, C. M., Kimoto, K., Singh, A. D., Anand, P., Kroon, D., Jung, S., and Ganssen, G.: Geochemical imprints of genotypic variants of Globigerina bulloides in the Arabian Sea, Paleoceanography, 31, 1440–1452, 2016.
Segev, E. and Erez, J.: Effect of Mg ∕ Ca ratio in seawater on shell composition in shallow benthic foraminifera, Geochem. Geophy. Geosy., 7, Q02P09, https://doi.org/10.1029/2005gc000969, 2006.
Spero, H. J., Eggins, S. M., Russell, A. D., Vetter, L., Kilburn, M. R., and Hönisch, B.: Timing and mechanism for intratest Mg/Ca variability in a living planktic foraminifer, Earth Planet. Sc. Lett., 409, 32–42, https://doi.org/10.1016/j.epsl.2014.10.030, 2015.
Steinhardt, J., De Nooijer, L. L., Brummer, G. J., and Reichart, G. J.: Profiling planktonic foraminiferal crust formation, Geochem. Geophy. Geosy., 16, 2409–2430, 2015.
Stoll, M. H. C., Bakker, K., Nobbe, G. H., and Haese, R. R.: Continuous-flow analysis of dissolved inorganic carbon content in seawater, Anal. Chem., 73, 4111–4116, https://doi.org/10.1021/ac010303r, 2001.
Terakado, Y., Ofuka, Y., and Tada, N.: Rare earth elements, Sr, Ba, Fe, and major cation concentrations in some living foraminiferal tests collected from Iriomote Island, Japan: An exploration for trace element behavior during biogenic calcium carbonate formation, Geochem. J., 44, 315–322, 2010.
Toyofuku, T., Kitazato, H., Kawahata, H., Tsuchiya, M., and Nohara, M.: Evaluation of Mg ∕ Ca thermometry in foraminifera: Comparison of experimental results and measurements in nature, Paleoceanography, 15, 456–464, https://doi.org/10.1029/1999pa000460, 2000.
Toyofuku, T., Suzuki, M., Suga, H., Sakai, S., Suzuki, A., Ishikawa, T., De Nooijer, L. J., Schiebel, R., Kawahata, H., and Kitazato, H.: Mg ∕ Ca and δ18O in the brackish shallow-water benthic foraminifer Ammonia “beccarii”, Mar. Micropaleontol., 78, 113–120, 2011.
Van Aken, H. M.: Variability of the water temperature in the western Wadden Sea on tidal to centennial time scales, J. Sea Res., 60, 227–234, 2008.
van Dijk, I., de Nooijer, L. J., and Reichart, G.-J.: Trends in element incorporation in hyaline and porcelaneous foraminifera as a function of pCO2, Biogeosciences, 14, 497–510, https://doi.org/10.5194/bg-14-497-2017, 2017a.
Van Dijk, I., De Nooijer, L. J., Wolthers, M., and Reichart, G.-J.: Impacts of pH and [CO] on the incorporation of Zn in foraminiferal calcite, Geochim. Cosmochim. Ac., 197, 263–277, 2017b.
Van Heuven, S., Pierrot, D., Rae, J., Lewis, E., and Wallace, D.: MATLAB program developed for CO2 system calculations, Oak Ridge, Tennessee: Carbon Dioxide Information Analysis Center, Oak Ridge National Laboratory, US Department of Energy, ORNL/CDIAC-105b, 2011.
Weiner, S., Levi-Kalisman, Y., Raz, S., and Addadi, L.: Biologically formed amorphous calcium carbonate, Connect. Tissue Res., 44, 214–218, 2003.
Wit, J. C., de Nooijer, L. J., Wolthers, M., and Reichart, G. J.: A novel salinity proxy based on Na incorporation into foraminiferal calcite, Biogeosciences, 10, 6375–6387, https://doi.org/10.5194/bg-10-6375-2013, 2013.