the Creative Commons Attribution 4.0 License.
the Creative Commons Attribution 4.0 License.
 | 04 Jul 2018
Technical note: In situ measurement of flux and isotopic composition of CO2 released during oxidative weathering of sedimentary rocks
Guillaume Soulet
Robert G. Hilton
Mark H. Garnett
Mathieu Dellinger
Thomas Croissant
Mateja Ogrič
Sébastien Klotz
Oxidative weathering of sedimentary rocks can release carbon dioxide (CO2) to the atmosphere and is an important natural CO2 emission. Two mechanisms operate – the oxidation of sedimentary organic matter and the dissolution of carbonate minerals by sulfuric acid. It has proved difficult to directly measure the rates at which CO2 is emitted in response to these weathering processes in the field, with previous work generally using methods which track the dissolved products of these reactions in rivers. Here we design a chamber method to measure CO2 production during the oxidative weathering of shale bedrock, which can be applied in erosive environments where rocks are exposed frequently to the atmosphere. The chamber is drilled directly into the rock face and has a high surface-area-to-volume ratio which benefits measurement of CO2 fluxes. It is a relatively low-cost method and provides a long-lived chamber (several months or more). To partition the measured CO2 fluxes and the source of CO2, we use zeolite molecular sieves to trap CO2 “actively” (over several hours) or “passively” (over a period of months). The approaches produce comparable results, with the trapped CO2 having a radiocarbon activity (fraction modern, Fm) ranging from Fm = 0.05 to Fm = 0.06 and demonstrating relatively little contamination from local atmospheric CO2 (Fm = 1.01). We use stable carbon isotopes of the trapped CO2 to partition between an organic and inorganic carbon source. The measured fluxes of rock-derived organic matter oxidation (171 ± 5 mgC m−2 day−1) and carbonate dissolution by sulfuric acid (534±16 mgC m−2 day−1) from a single chamber were high when compared to the annual flux estimates derived from using dissolved river chemistry in rivers around the world. The high oxidative weathering fluxes are consistent with the high erosion rate of the study region. We propose that our in situ method has the potential to be more widely deployed to directly measure CO2 fluxes during the oxidative weathering of sedimentary rocks, allowing for the spatial and temporal variability in these fluxes to be determined.
- Article
(22251 KB) - Full-text XML
-
Supplement
(218 KB) - BibTeX
- EndNote


The stock of carbon contained within sedimentary rocks is vast, with ∼ 1.25×10⁷ PgC contained within organic matter and ∼ 6.53×10⁷ PgC as carbonate minerals (Sundquist and Visser, 2005). If these rocks are exposed to Earth's oxygenated surface, for instance during rock uplift, erosion and exhumation, oxidative weathering can result in a release of carbon dioxide (CO2) from the lithosphere to the atmosphere (Petsch et al., 2000). There are two main processes to consider: (i) the oxidation of rock-derived organic carbon (Berner and Canfield, 1989; Petsch, 2014), which can be expressed by the (geo)respiration of organic matter:
and (ii) the oxidation of sulfide minerals (e.g. pyrite) which produces sulfuric acid, which can chemically weather carbonate minerals and release CO2 (Calmels et al., 2007; Li et al., 2008; Torres et al., 2014) by the following reaction:
or
In the case of Reactions (R1) and (R2), CO2 is released to the atmosphere at the site of chemical weathering. In the case of Reaction (R3), CO2 is released to the atmosphere over a timescale equivalent to that of the precipitation of carbonate in the ocean (∼ 104 to 106 years; Berner and Berner, 2012).
The fluxes of carbon transferred to the atmosphere in response to both oxidative weathering processes are thought to be as large as that released by volcanic degassing, but the absolute fluxes remain uncertain (Li et al., 2008; Petsch, 2014). As such, both processes act to govern the levels of atmospheric CO2 and O2, and hence Earth's climate, over geological timescales (Berner and Canfield, 1989; Torres et al., 2014). The oxidation of rock-derived organic carbon may also contribute to modern biological cycles, especially rock substrate that is rich in organic carbon (Bardgett et al., 2007; Copard et al., 2007; Keller and Bacon, 1998; Petsch et al., 2001). Various approaches have been adopted to better quantify these major geological CO2 sources. These include the use of geochemical proxies in rivers, which indirectly track the CO2 emissions from the oxidative weathering of sedimentary rocks at the catchment scale. For instance, the trace element rhenium has been used to compare relative rates of rock-derived organic carbon oxidation (Jaffe et al., 2002) and estimate the corresponding fluxes of CO2 across river catchments (Dalai et al., 2002; Hilton et al., 2014; Horan et al., 2017). Another approach has been to measure the loss of radiocarbon-depleted organic matter in river sediments during their transfer across the floodplains of large river basins (Bouchez et al., 2010; Galy et al., 2008). In the case of sulfuric-acid-weathering of carbonate minerals, the dissolved sulfate flux can be informative if the source of has been assessed using sulfur and oxygen isotopes (Calmels et al., 2007; Hindshaw et al., 2016; Spence and Telmer, 2005) and/or using the dissolved inorganic carbon flux and its stable carbon isotope composition (δ13C) (Galy and France-Lanord, 1999; Li et al., 2008; Spence and Telmer, 2005).
It should be possible to directly measure the flux of CO2 emanating from sedimentary rocks in response to oxidative weathering. Keller and Bacon (1998) explored such an approach in a 7 m deep soil on till, suggesting geo-respiration of Cretaceous age organic matter was an important source of CO2 at depth. However, this research has not to our knowledge been replicated, nor applied in erosive landscapes where sedimentary rocks are frequently exposed to weathering by erosion processes (Blair et al., 2003; Hilton et al., 2011). In these locations, oxidative weathering fluxes are thought to be very high (Calmels et al., 2007; Hilton et al., 2014; Petsch et al., 2000). One of the challenges of tracking CO2 directly is that flux measurements must be combined with the isotopic composition (12C, 13C and 14C) of the CO2 (Keller and Bacon, 1998). Only with that information can the measured CO2 flux be partitioned into the component derived from the oxidation of rock-derived carbon and that derived from the dissolution of carbonate (in addition to inputs from the modern plant and soil biosphere, and atmospheric inputs).
The objective of this paper is to provide a detailed proof-of-concept study of methods we have designed which can: (1) make direct measurements of the flux of CO2 released during the oxidative weathering of sedimentary rocks; and (2) trap the CO2 produced during weathering in order to measure its isotope composition, and partition the source of the CO2 flux between rock-derived organic carbon and carbonate. Here we outline one approach to address these research gaps which adapts a chamber-based method to measure CO2 fluxes. We provide the first examples of its application to trap CO2 and use the isotope composition to directly quantify the fluxes of CO2 from oxidative weathering.
2.1 Study area
The study location is within the Laval catchment, part of the IRSTEA Draix Bléone Experimental Observatory and the Réseau des Bassins Versants network, located near the town of Draix, Alpes-de-Haute-Provence, France. The small catchment (0.86 km2) is heavily instrumented, with continuous monitoring of rainfall, river water discharge, river solid load transport, total dissolved fluxes and physical erosion rates over the last 4 decades (Cras et al., 2007; Mathys et al., 2003). These measurements provide hydrodynamic and geomorphic context for any studies of oxidative weathering. The lithology of the catchment is composed of black Jurassic marine marls (from the Bajocian to the Callovo-Oxfordian stages), which contain inorganic carbon and organic matter (Graz et al., 2012). Sulfide minerals are widespread as disseminated pyrite and veins which outcrop in the catchment (Cras et al., 2007). The rock-strength, climate and geomorphic setting combine to produce a badland-type morphology with very steep and dissected slopes.
Erosion rates are very high, with sediment export fluxes of 11 200 t km−2 yr−1 on average during the period 1985 to 2005 AD (with a minimum of 4400 t km−2 yr−1 in 1989 and a maximum of 21 100 t km−2 yr−1 in 1992) (Graz et al., 2012; Mathys et al., 2003). Assuming a regolith bulk density of ∼ 1 to 1.5 t m−3 (Mathys and Klotz, 2008; Oostwoud Wijdenes and Ergenzinger, 1998), this equates to a physical erosion rate of ∼ 7 to 10 mm yr−1 on average, but that can reach maximum values of 14 to 20 mm yr−1. These features limit the development of soils, and bare rock outcrops represent 68 % of the catchment surface area (i.e. 0.58 km2) (Cras et al., 2007; Mathys et al., 2003). As a result, it is easy to find regolith and rock surfaces that are devoid of soils and roots, and where sedimentary rocks are directly exposed to the oxygen-rich atmosphere. These are key parts of the landscape contributing to weathering, solute production (Cras et al., 2007) and sediment production (Graz et al., 2012; Mathys et al., 2003; Oostwoud Wijdenes and Ergenzinger, 1998). Bare rock outcrops are characterized by the development of weathered marls and regolith. Regolith typically extends to at least ∼ 20 cm with the following characteristics: (i) the upper ∼ 3 cm is loose detrital cover composed of millimetre-to-centimetre-sized fragments of marls, (ii) from ∼ 3 to ∼ 10 cm is the loosened upper regolith which is somewhat fragmented, (iii) from ∼ 10 to 20 cm is the compact lower regolith which retains the marl structure but not its cohesion, and (iv) at depths more than ∼ 20 cm is the marl bedrock (unweathered marl) (Maquaire et al., 2002; Mathys and Klotz, 2008; Oostwoud Wijdenes and Ergenzinger, 1998). Lateral variation in the regolith thickness exists with larger thicknesses on crests, intermediate in gullies and minimal in talwegs (Maquaire et al., 2002). Marl bedrock porosity ranges between 0.17 and 0.23 (Traveletti et al., 2012).
2.2 Natural oxidation and CO2 accumulation chambers
In order to measure the flux of CO2 produced by oxidative weathering of sedimentary rocks and accumulate enough CO2 to perform stable carbon isotope and radiocarbon measurements, we use accumulation chambers (e.g. Billett et al., 2006; Hardie et al., 2005). These have been extensively used to measure soil respiration (e.g. Hahn et al., 2006; Hardie et al., 2005) and CO2 evasion by streams and rivers (e.g. Billett et al., 2006; Borges et al., 2004), but have not yet been used to examine rock–atmosphere interactions. Because most fine-grained sedimentary rocks have a degree of competency, accumulation chambers can be made by directly drilling into the rock. Here we use a rock drill to make 40 cm long chambers with an inner diameter of 29 mm. Our aim was to minimize the volume of the chamber while maximizing the surface of exchange with the surrounding rock.
The rock powder left inside the chamber after its drilling was blown away using a compressed-air gun in order to minimize the presence of potentially reactive dust. Then, after measuring the dimensions of the chamber, its entrance is fitted with a small PVC tube (∼ 3 cm diameter, ∼ 3 cm long), which allows a tight seal with an inserted rubber stopper containing two holes. Two Pyrex® tubes (ID = 3.4 mm and OD = 5 mm; one of 12 cm long and one of 7 cm long) are inserted through the rubber stopper. The differential length is to improve airflow in the chamber while in operation. The sections of the Pyrex® tubes sticking out of the chamber are fitted with Tygon® tubing (E-3603; Saint-Gobin, France). To isolate the accumulation chamber from the atmosphere as well as possible, the Tygon® tubing is sealed with WeLock® clips (Scandinavia Direct Ltd, UK) and silicone sealant (Unibond® Outdoor) is placed around the entrance of the chamber (the 3 cm diameter PVC tubing and the rubber stopper) (Fig. 1). The newly installed chamber is left for ∼ 2 days to allow the sealant to fully dry. Here we acknowledge that a perfect seal is impossible, due to the natural rock fracturing around the chamber. Table 1 summarizes the dimensions of an example chamber drilled and sealed in the field on 13 December 2016.
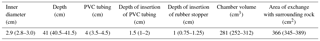
Table 1Dimensions of a typical chamber, given as ranges: median (minimum–maximum). Chamber H6 was drilled on 13 December 2016 in the catchment of the Laval stream (Draix, France; 44.14061∘ N, 06.36289∘ E).
Drilling introduces an oxygen-rich atmosphere in the chamber and surrounding marl regolith and bedrock (similar to outcropping marls exposed to the atmosphere). If gaseous O2 is consumed (e.g. by Reaction R1), this would create a gradient in the partial pressure of O2 (pO2) whereby the atmosphere surrounding the rock and chamber is of higher pO2. Given the natural porosity and permeability of the shale bedrock, any diffusion of O2 is likely to be into the chamber. This should act continuously to fuel the chamber with oxygen. In contrast, if CO2 is produced inside the chamber (by Reactions R1 and R2) then the partial pressure of CO2 (pCO2) will exceed that of the atmosphere. The result is that for chambers where oxidative weathering is occurring, the ingress of “contamination” by atmospheric CO2 should be minimal, and there should be a supply of O2 for reactions. These inferences can be tested using a pO2 probe and by trapping CO2 and measuring its isotope composition.
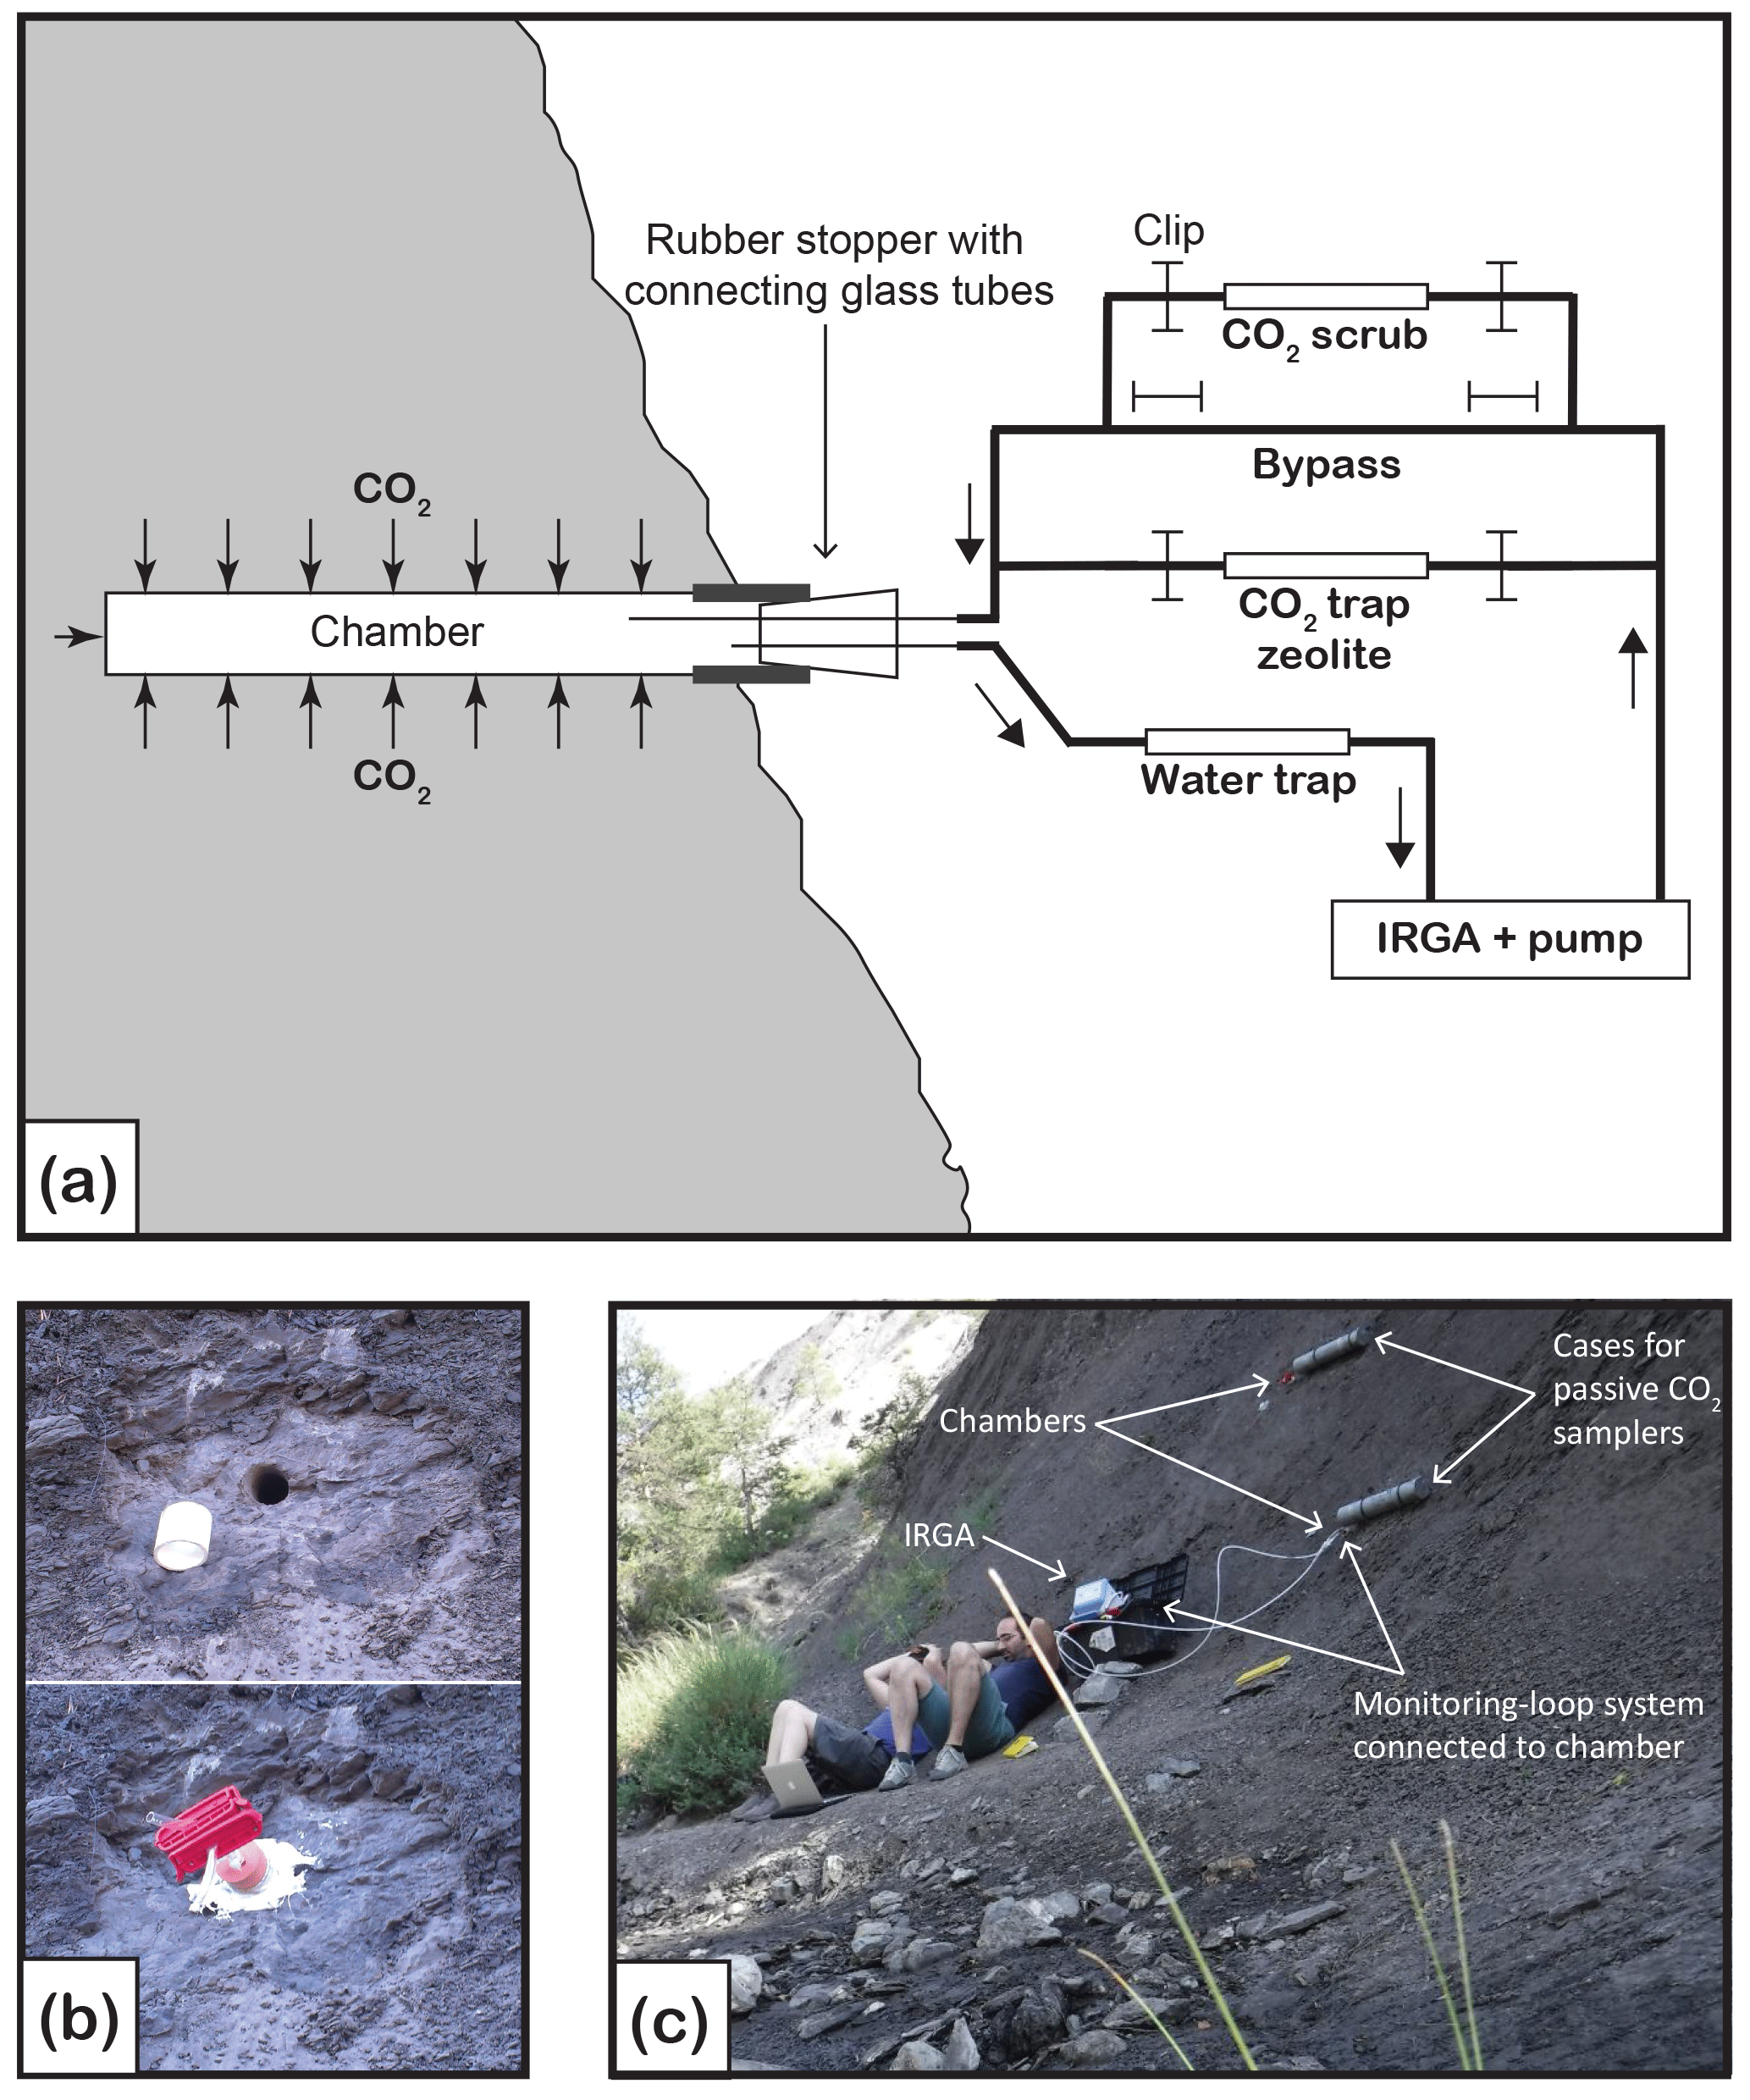
Figure 1(a) Schematic diagram of the closed-loop monitoring–sampling system connected to the natural weathering chamber. Gas-flow pathways are controlled by opening and closing the clips. Clips removed from the bypass allow pCO2 in the chamber to be monitored (IRGA stands for infrared gas analyzer), thus measuring CO2 flux and ensuring that enough CO2 accumulated in the chamber for 14C analysis. To remove CO2 from the line before connecting to the chamber, clips are moved from the CO2 scrub (soda lime). When connected to the chamber, the CO2 scrub can be used to lower the CO2 concentration before flux measurement. To collect CO2 for isotope analyses, clips are removed from the zeolite molecular sieve cartridge. (b) Pictures showing the chamber design. Top picture is the chamber (H6), diameter 2.9 cm, drilled in the rock on a cleared surface, with white PVC tubing inserted at the outlet. Bottom picture shows the rubber stopper fitted in the PVC tubing. Two glass tubes go through the rubber stopper and are fitted with Tygon tubing, sealed with the red clips, and the exterior of the chamber is sealed with outdoor sealant. (c) View of the field site showing two chambers (top chamber is H6 and lower chamber is H4). The lower chamber is connected to the closed-loop system and is being monitored for flux measurement. The two large grey PVC tubes attached to the rock on the right of the chambers are cases in which zeolite molecular sieves are installed and left for months when connected to the chamber for passive CO2 trapping.
In this example we aimed to measure oxidation of sedimentary rocks and intended to minimize the role of CO2 produced by root respiration. Therefore, the chambers were drilled on cleared rock surface, devoid of visible roots. The rock powder produced when drilling the chambers was collected, freeze-dried and ground in the laboratory to fine powder for measurement of its organic and inorganic carbon content and its isotopic composition.
2.3 CO2 flux measurements
A closed-loop CO2 sampling system similar to the molecular sieve sampling system (MS3) described in Hardie et al. (2005) was used for CO2 flux measurements and CO2 sampling (Fig. 1). The system incorporated the following components: an air filter; a water trap (cartridge filled with magnesium perchlorate); a portable infrared gas analyser (IRGA) equipped with an internal air pump, calibrated to a pCO2 range of 0 to 5000 ppmv and installed with an pO2 probe (EGM-5, PP Systems, USA); a CO2 scrub (cartridge filled with soda lime); a bypass; and a set of WeLock® clips that allow the air flow to be diverted through the bypass or the CO2 scrubber cartridge. Optionally a zeolite molecular sieve sampling cartridge can be inserted in the line (see Sect. 2.4).
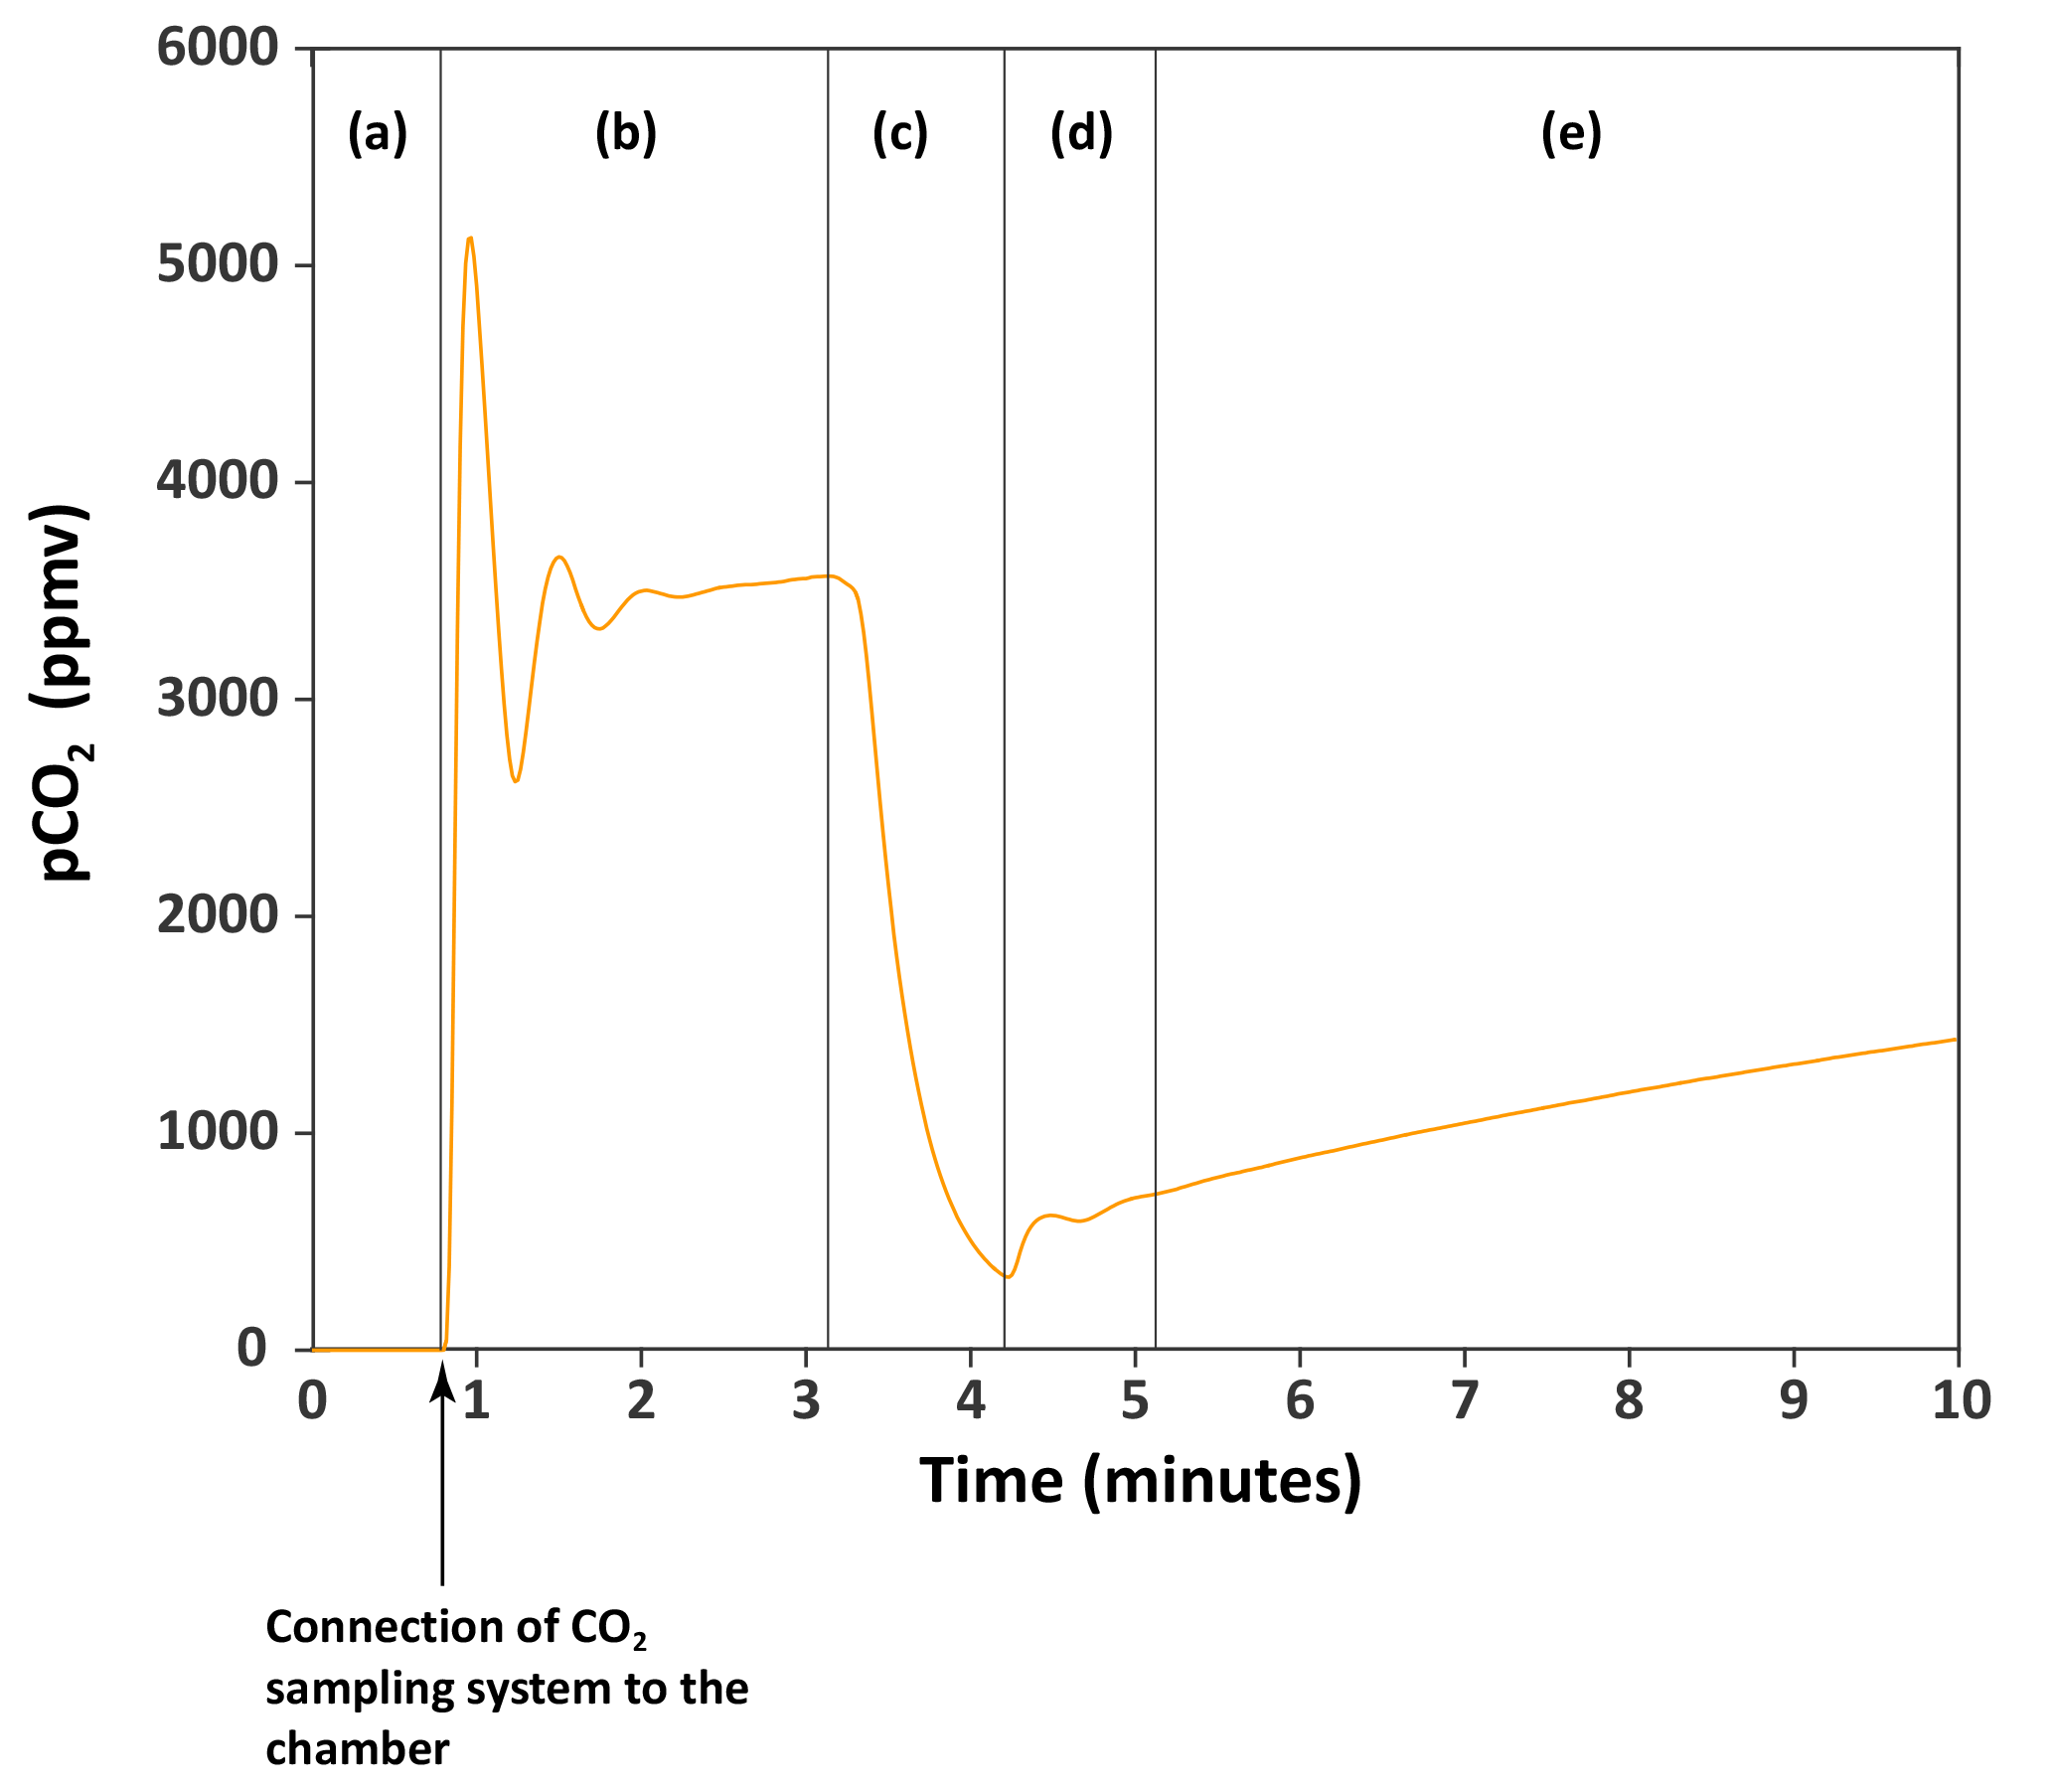
Figure 2An example of the monitoring of the CO2 accumulating in a chamber. The orange curve is the partial pressure of CO2 (pCO2, in parts per million volume) through time in chamber H6 on 27 March 2017. (a) The CO2 sampling–monitoring system is not connected to the chamber. Atmospheric CO2 has been removed from the system (pCO2 = 0 ppm) using the CO2 scrub cartridge. (b) The closed-loop monitoring system has been connected to the chamber. pCO2 increases to reach a maximum value of ∼ 5100 ppm, then drops and equilibrates to ∼ 3500 ppm. This pattern reflects the increase in the total volume (by the volume of the CO2 sampling–monitoring system) which decreases pCO2 and requires some time for the pCO2 to equilibrate. We determined that when connected to the chamber, the maximum value of pCO2 read is 0.94 the actual pCO2 in the chamber. (c) The CO2 in the chamber is lowered (scrubbed with the CO2 scrub, or trapped with the zeolite molecular sieve) to near-atmospheric pCO2. (d) Residual CO2 that in the chamber homogenized with the rest of the total volume “artificially” increasing pCO2 quickly. (e) pCO2 in chamber is monitored, reflecting the flux of CO2 from the rock surface to the chamber.
Before each CO2 flux measurement, the Tygon® tubes exiting the chamber were fitted with auto-shutoff Quick Couplings™ (Colder Products Company, USA), and the CO2 contained within the sampling system was removed using the CO2 scrubber cartridge. When no CO2 is left in the sampling system (as indicated by the IRGA), the air flow is diverted through the bypass, and the system connected to the chamber (Fig. 2). The use of the auto-shutoff couplings prevents atmospheric contamination at the moment of connection to the chamber. Then, pCO2 in the chamber is lowered to near-atmospheric pCO2 by guiding the air flow through the CO2 scrubber cartridge. We let the CO2 accumulate in the chamber for several minutes (typically 10 min) by guiding the air flow through the bypass (Fig. 2). This operation can be repeated several times to provide multiple measurements of CO2 flux over a period of hours (Fig. 3). The CO2 evolution in the chamber typically shows a curvature, the curve flattening with time and higher concentration (Fig. 3). In order to calculate the CO2 flux, we first convert the pCO2 measurements into the mass of carbon contained in the chamber:
where m is the mass of carbon in the chamber (mgC), pCO2 is the concentration of CO2 in the chamber in ppm (cm3 m−3), and V is the total volume (cm3), i.e. the sum of the volume of the chamber (VCh) and the volume of the CO2 sampling system (VL) when air flows through the bypass. Factor A converts centimetres cubed of CO2 into milligrams of carbon, depending on temperature and pressure following the ideal gas law:
where P is the pressure (Pa) as measured by the IRGA, MC is the molar mass of carbon (g mol−1), R is the gas constant (m3 Pa K−1 mol−1) and T is the temperature (K) in the chamber. Then the rate (q, in mgC min−1) at which carbon accumulates in the chamber is calculated using an exponential model (described below; Pirk et al., 2016) and converted into a flux of carbon (Q in mgC m−2 day−1) emitted to the atmosphere under the form of CO2 using
where 1440 converts mgC min−1 into mgC day−1, and S (m2) is the inner surface area of the chamber exchanging with the surrounding rock. To calculate the rate of accumulation of carbon (q) in the chamber we use the exponential model described by Pirk et al. (2016):
where is the carbon mass change in the chamber with time. Parameter m0 is the mass of carbon in the chamber at the beginning of the CO2 accumulation and that should be close to the mass of carbon in the chamber at atmospheric pCO2. The constant λ (in units of time, here in min−1) describes the sum of all processes which are proportional to the carbon mass difference and is responsible for the curvature of the carbon mass accumulation evolution (Fig. 3). The model does not a priori assume any process to be responsible for the curvature (Pirk et al., 2016). In the case of the measurement of CO2 flux in soils, the curvature (λ) relates to leakages, diffusivity from soil CO2 into the chamber headspace and photosynthesis (Kutzbach et al., 2007). In the case of our chambers drilled in rock, since it is assumed that there is no possibility of photosynthesis, λ likely relates to the diffusivity of carbon from the rock to the chamber headspace and to the chamber leakiness. Equation (7) is solved by fitting the following function to the data (Fig. 3b):
Several parameters lead to uncertainties in the flux calculations. They are all related to the conversion of pCO2 to mass of carbon (Table 1): (i) the volume of the chamber (VCh), (ii) the surface area of exchange with the surrounding rock (S), (iii) the volume of the closed-loop system when air flows through the bypass (VL was determined to be 127.8±0.5 cm3 through an experiment of successive CO2 dilution in a known volume), and (iv) the temperature in the chamber was assumed to range from 0 to 20 ∘C over the course of the experiment. We estimated the relative uncertainty on the measured flux using a Monte Carlo simulation of error propagation using the ranges listed above and in Table 1. The resulting relative uncertainty on the measured flux was estimated to be within ±2.5 %. An additional relative uncertainty linked to the rate of CO2 accumulation in the chamber (parameter q obtained through fitting the exponential model to the data) ranges between 0.5 and 1.0 %. Altogether, the final relative uncertainty determined with our Monte Carlo simulation of error propagation was found to be within ±3 %. In the case that the relative standard deviation on multiple flux measurements is higher than 3 %, we adopt the standard deviation as the uncertainty.
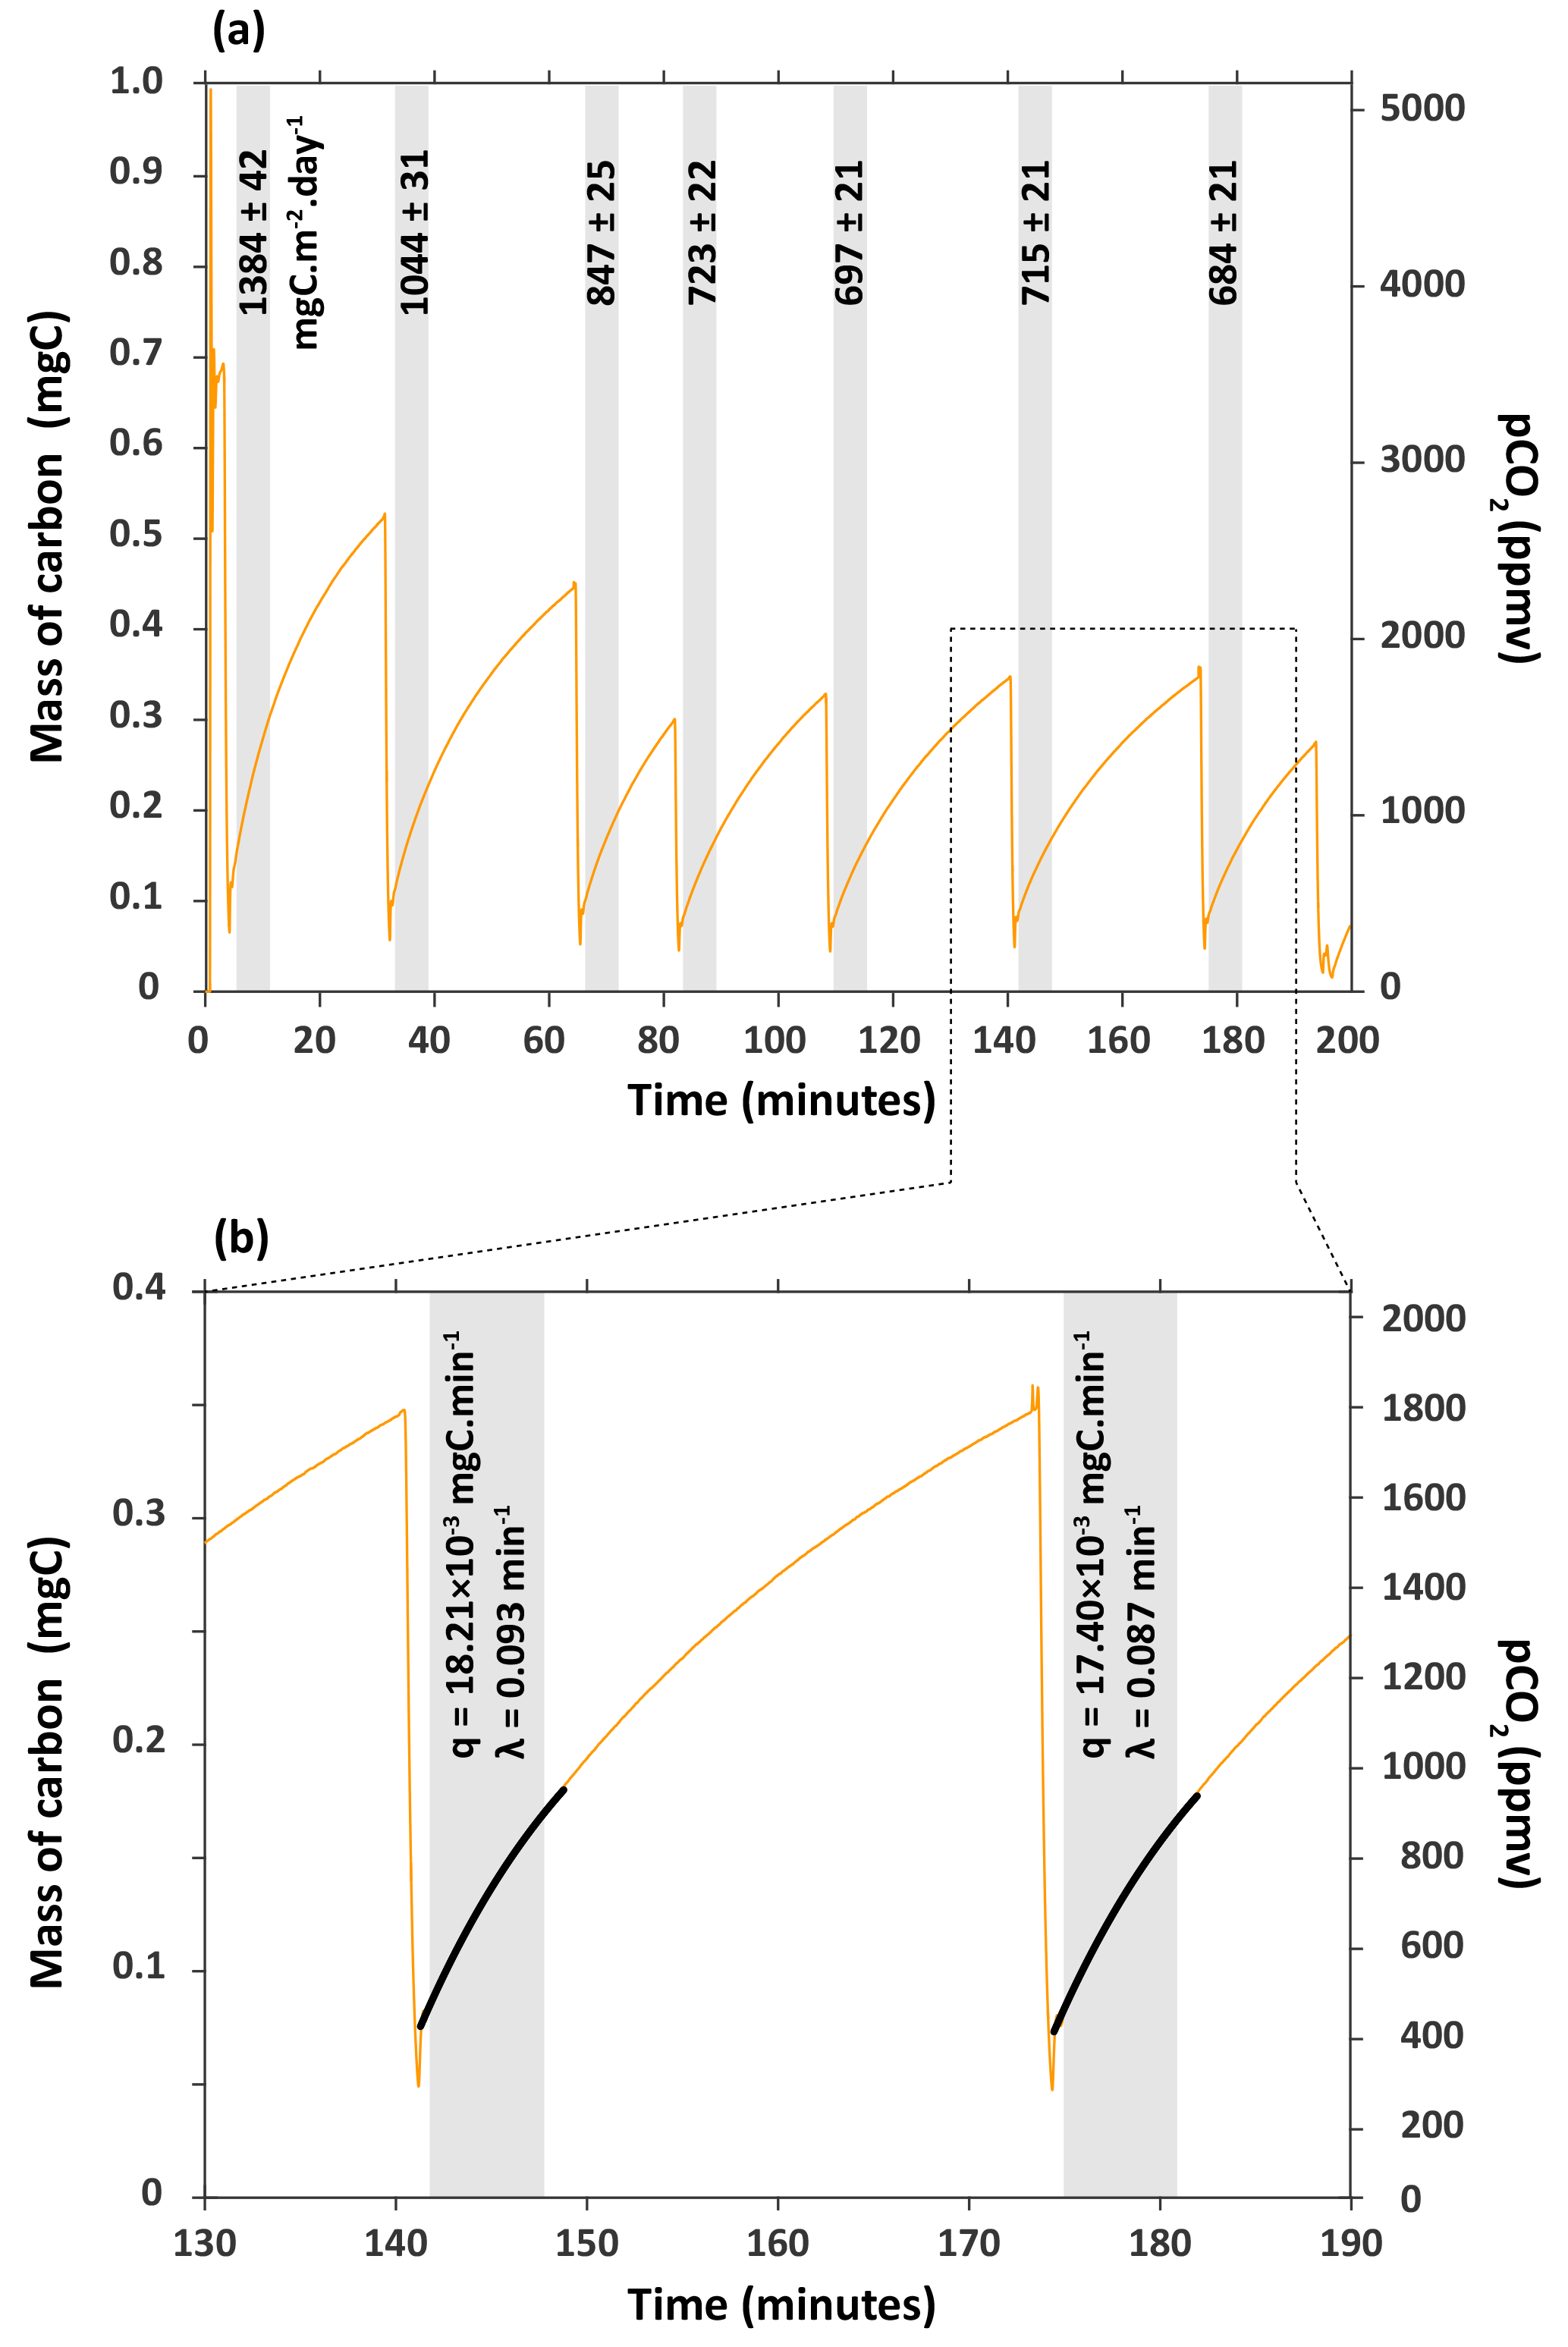
Figure 3(a) Series of carbon flux measurements for chamber H6 on 27 March 2017. CO2 concentration (pCO2) was converted into mass of carbon (mgC) following Eqs. (1) and (2). Flux of CO2 – the numbers associated to shaded boxes – are given in milligrams of carbon per square metre per day (mgC m−2 day−1). (b) Close-up of how fluxes were calculated from the rate of carbon accumulation (parameter q) by fitting the exponential model described in Eqs. (4) and (5) for 6 min (shaded box).
2.4 CO2 sampling and isotopic analysis
CO2 evading the rock accumulates in the chamber and can be sampled using a zeolite molecular sieve trap (Garnett et al., 2009; Garnett and Hardie, 2009; Hardie et al., 2005). Zeolites have a high affinity for polar molecules such as H2O and CO2, and are widely used to separate CO2 from air at ambient temperature and pressure. The gas trapped by the zeolite sieve can be extracted in the laboratory at high temperature for CO2 purification and isotope analysis (Garnett and Murray, 2013; Hardie et al., 2005). The type of zeolite (13X) and the design of the cartridge containing the zeolite are described by Hardie et al. (2005) and Garnett et al. (2009). In our study the CO2 was sampled “actively” – i.e. using the CO2 sampling system coupled to the pump incorporated in the IRGA to force the air through the zeolite molecular sieve cartridge (Fig. 1) following Hardie et al. (2005). Two approaches can be used. The first involves connection of the line to the chamber for the duration of trapping, which was used on 27 March 2017. Each removal of CO2 onto the trap can be controlled to return the chamber to ambient atmospheric pCO2, allowing for a subsequent measurement of CO2 flux (Fig. 3). The second approach allows pCO2 to accumulate in the chamber, before attaching the scrubbed line and sampling the CO2, which we tested on 30 March 2017. The benefit of the latter method is that it allows the gas line and IRGA to be used for other tasks while in the field, but may be more susceptible to atmospheric inputs during the connection of lines.
The CO2 was also sampled “passively”, when the zeolite molecular sieve is connected to the chamber for several months following the procedure described in Garnett et al. (2009) (Fig. 4). This approach has the benefit of providing an integrative view of CO2 production over longer periods of time. A passive trap was installed on 15 December 2017 (2 days after the chamber was constructed) and removed on 26 March 2017 (101 days after its installation) for chamber H6. Based on previous work (Garnett et al., 2009; Garnett and Hardie, 2009; Garnett and Hartley, 2010), it is expected that the passive trap method can lead to a fractionation of the stable carbon isotope composition (δ13C) of 4.2±0.3 ‰ associated with the diffusion of CO2 from the chamber to the zeolite trap. In addition, a sample of local atmospheric CO2 was also collected by actively circulating the atmosphere sampled at ∼ 3 m elevation above the valley floor through a zeolite molecular sieve.
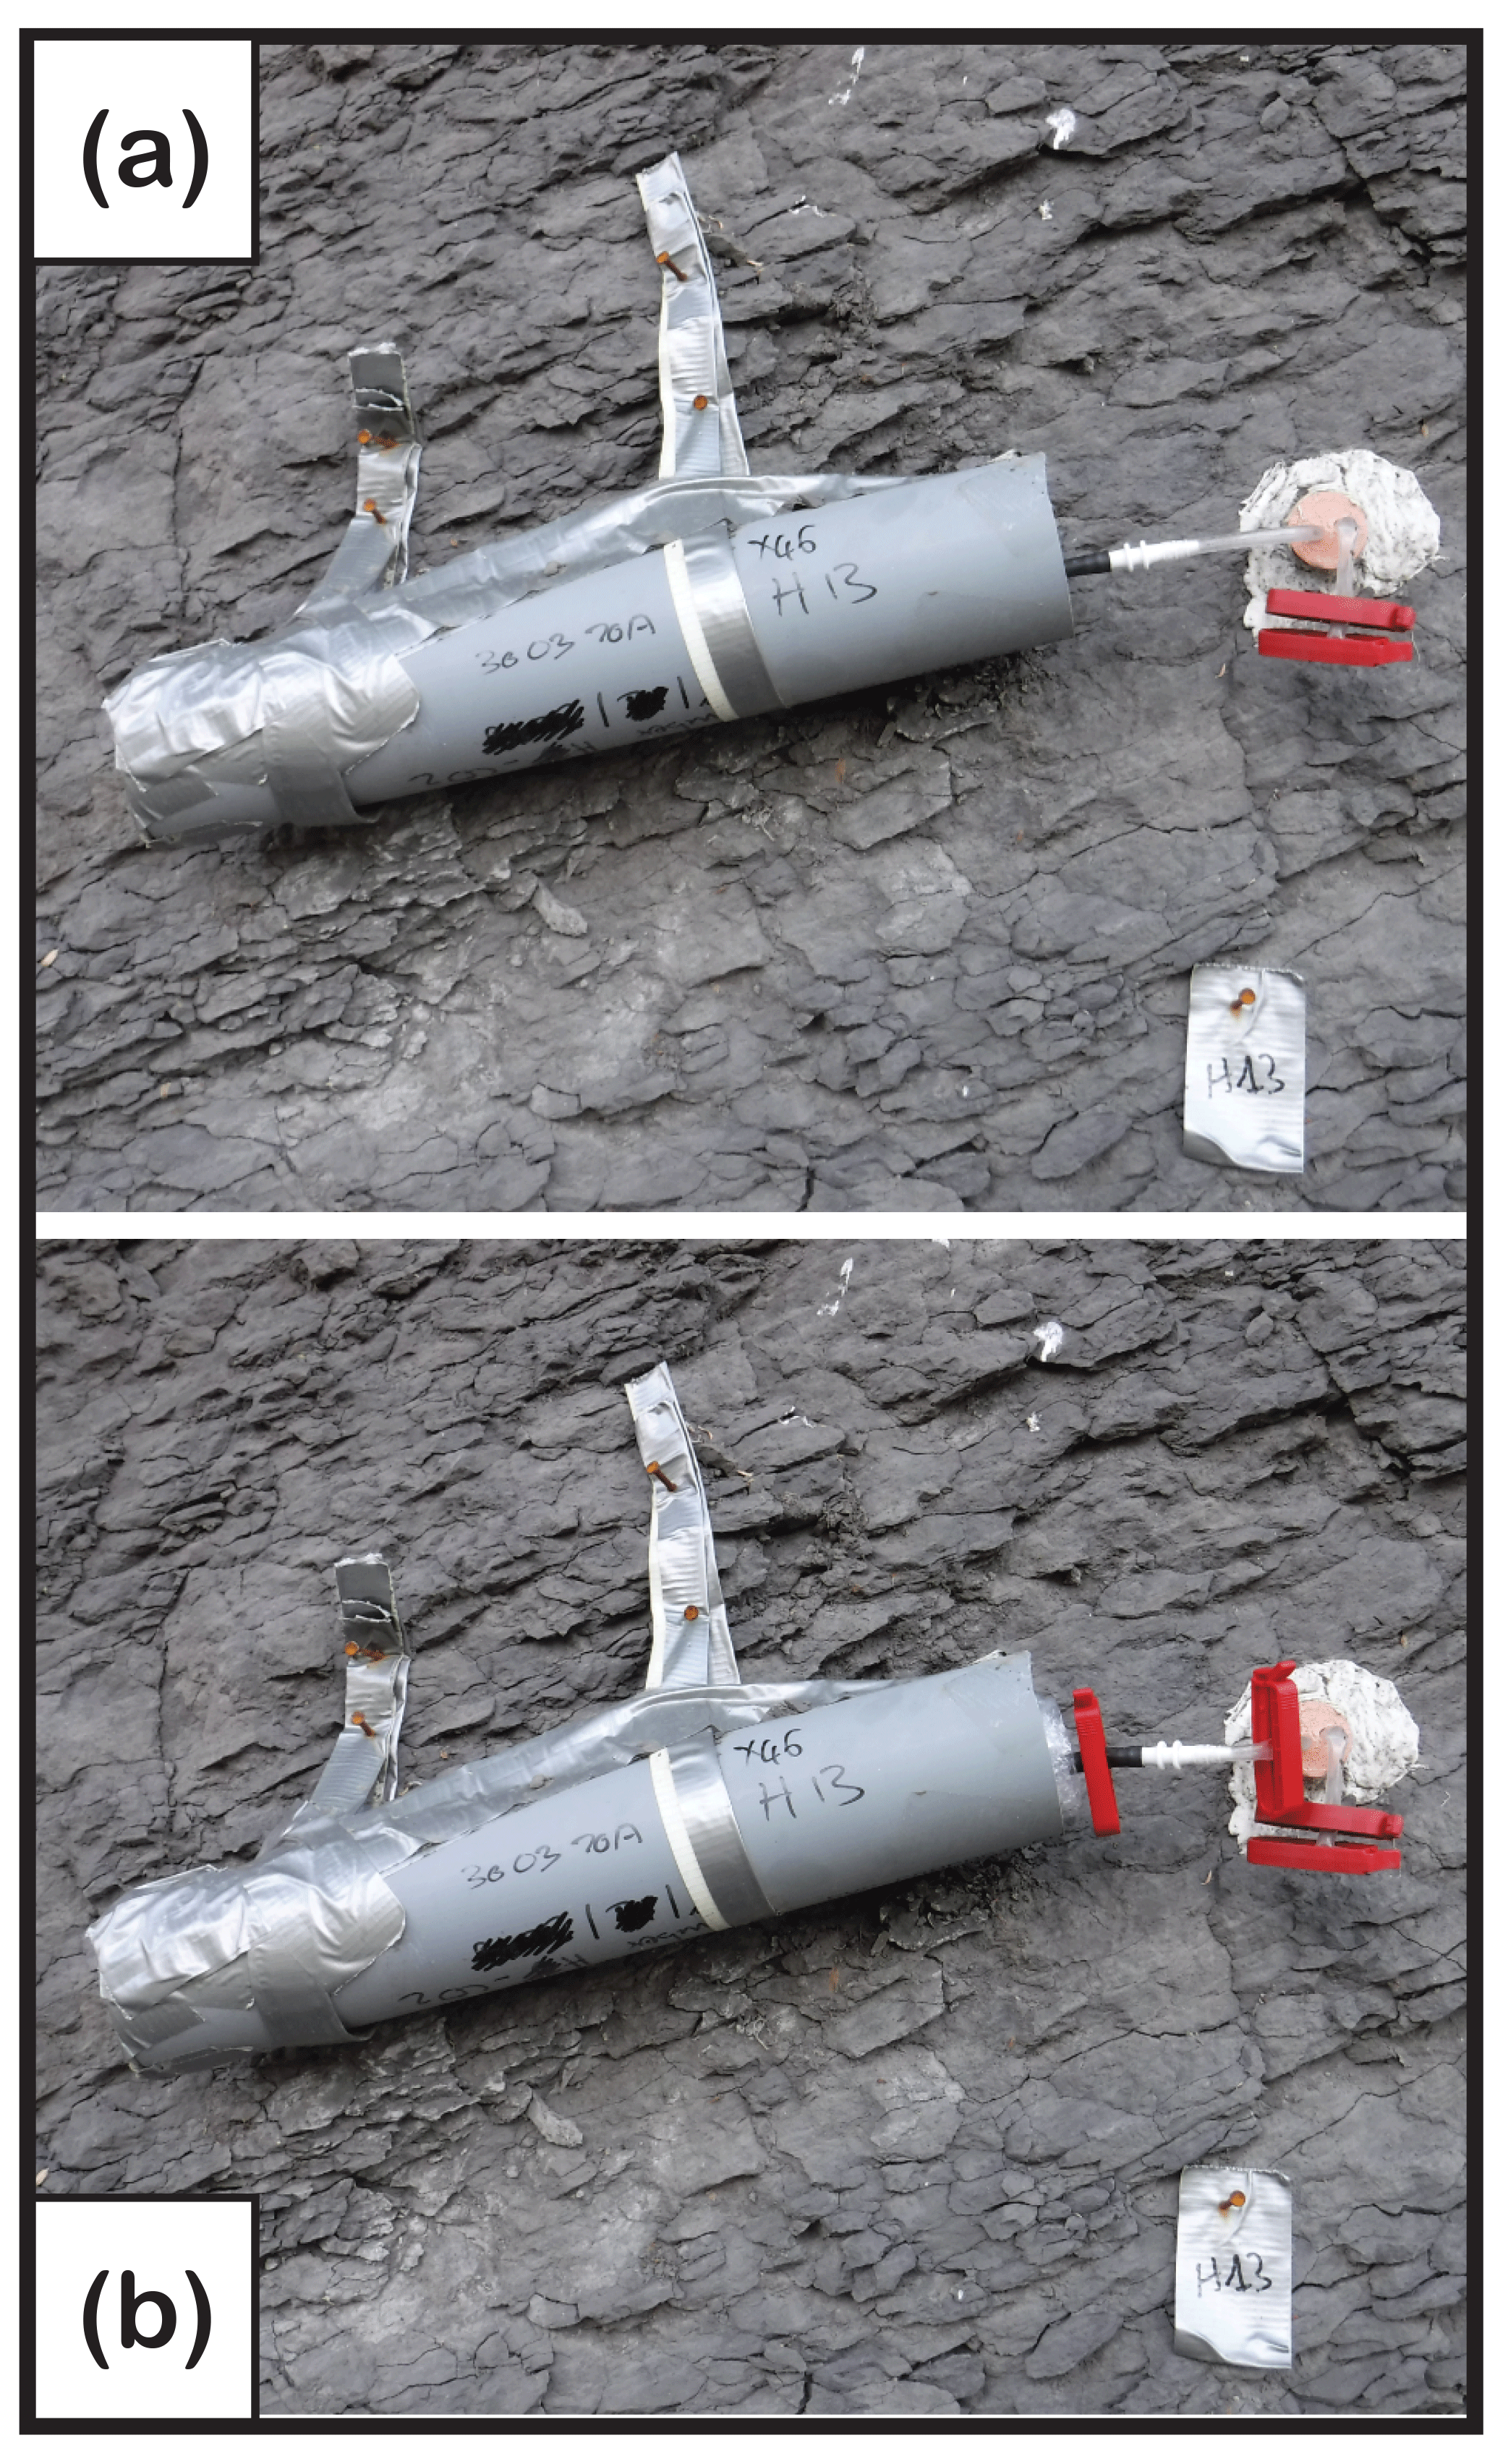
Figure 4(a) Zeolite molecular sieve connected to a chamber for passive CO2 trapping. The zeolite molecular sieve is encased in the grey PVC tubing and connected for months to the chamber using a white connector. (b) Zeolite molecular sieve ready to be disconnected from chamber. The red clips are positioned so that they seal both the zeolite molecular sieve and the chamber.
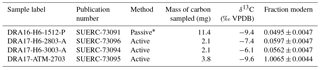
After sample collection the zeolite molecular sieves were sealed with WeLock® clips on either end before being disconnected from the sampling system (active or passive) and returned to the NERC Radiocarbon Facility (East Kilbride, UK) for CO2 recovery. The CO2 collected was desorbed from the zeolite by heating (425 ∘C) and cryogenically purified (Garnett and Murray, 2013). One aliquot of the recovered CO2 was used for stable carbon isotope composition (δ13C) measurement using isotope ratio mass spectrometry (IRMS; Thermo Fisher Delta V; results expressed relative to the Vienna Pee Dee Belemnite (VPDB) standard). A further aliquot was converted to graphite and analysed for 14C ∕ 12C ratio using accelerator mass spectrometry at the Scottish Universities Environmental Research Centre (SUERC). Radiocarbon measurements were, following convention, corrected for isotopic fractionation using the measured sample IRMS δ13C values, and reported in the form of the fraction modern, Fm (ASN/AON in Stuiver and Polach, 1977; corresponding to 14aN in Mook and van der Plicht, 1999, or F14C in Reimer et al., 2004; Table 2).
Table 2Isotopic composition of the CO2 sampled with the zeolite molecular sieves.
* Sampled passively for 100.84 days.
2.5 Partitioning the sources of CO2
As the chamber was drilled away from the obvious influence of root respiration, the CO2 emitted from the rock should originate from (i) the oxidation of the organic carbon contained within the rock mass following Reaction (R1), and/or from (ii) the dissolution of the carbonate minerals by sulfuric acid following Reaction (R2). Some of the CO2 collected in active or passive zeolite molecular sieves might also originate from atmospheric CO2, i.e. the ambient air (see discussion below). To correct for possible atmospheric contamination, and partition the sources of CO2, we solve the following isotope mass balance system:
where fAtm is the mass fraction of CO2 originating from the atmosphere, fRock OC is that originating from the oxidation of the rock-derived organic carbon, and fCarb is that originating from carbonate dissolution by sulfuric acid. Subscript “Chamber” stands for the CO2 sampled from the chambers (i.e. trapped in the zeolite molecular sieves). The terms δ13C and Fm stand for the stable carbon isotope and radiocarbon compositions of the three possible sources of CO2 listed above and of the CO2 sampled in the chamber.
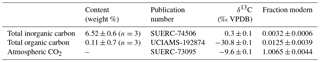
Table 3 shows the δ13C and Fm values of the three possible sources of CO2 involved in the isotope mass balance. These values were measured in the laboratory. The δ13CAtm and FmAtm values were measured from the atmospheric CO2 sample actively trapped in a zeolite molecular sieve (see Sect. 2.4). The stable carbon isotope composition of the rock-derived organic carbon (δ13CRock OC) was obtained by IRMS after inorganic carbon removal from the powdered rock samples by HCl fumigation, followed by closed-tube combustion to produce CO2. The stable carbon isotope composition of the carbonates (δ13CCarb) was obtained after dissolution of the carbonates of the powdered rock samples by phosphoric acid in vacuumed vessels following standard procedures at NERC Radiocarbon Facility. Since the rock-derived organic carbon and carbonates were formed millions of years ago they do not contain radiocarbon any longer, and their fraction modern (FmRock OC and FmCarb) levels should be close to the AMS background as confirmed by our measurements (Table 3). Consequently, when solving the isotope mass balance, FmRock OC and FmCarb were set to 0.
Table 3Geochemical compositions of the end-members involved in the isotopic mass balance (Eq. 6) were measured from the rock sampled during the drilling of chamber H6*, and from an atmospheric CO2 sampled actively with a zeolite molecular sieve (Table 2).
* In-house label of this sample was DRA16-78.
Here we present the results (Tables 2, 3 and 4 and Figs. 2 and 3) obtained from a natural weathering chamber (H6) drilled in a rock face at 2 m elevation above the Laval stream (Fig. 1) in December 2016. Our aim is to assess the feasibility of the method, in terms of: (i) measuring the fluxes of CO2, (ii) collecting sufficient mass of CO2 for isotope analysis (to partition between organic and inorganic derived CO2), and (iii) checking the role of atmospheric CO2 contamination for both the active and passive CO2 sampling methods. We discuss the results from chamber H6 in the context of using this method more widely to better quantify rates of oxidative weathering and associated CO2 release.
3.1 Flux measurements
A total of 3 months after the installation of the chamber H6, CO2 fluxes were measured alongside a series of zeolite-trapping events on 27 March 2017 (Fig. 3). If the chamber was perfectly isolated from the atmosphere, then we might expect the rate of carbon accumulation ( to be constant. However, the rate of carbon accumulation decreases with time, which indicates that the chamber is not perfectly sealed, as expected. This has some important implications. First, the leak rate depends on the pCO2 gradient between the chamber and the atmosphere. Since this gradient is positive in the chamber (Fig. 2) (, then CO2 likely diffuses from the chamber to the atmosphere. This has the advantage that it naturally minimizes any atmospheric CO2 contamination. Conversely, since the CO2 production is linked to the consumption of O2, then the O2 gradient is expected to be negative (, and thus atmospheric O2 naturally diffuses inside the chamber. This means that the chamber can be closed for months and still contain gaseous O2. Our measurements of O2 using the EGM-5 O2 probe suggest that the chamber had a similar pO2 as that contained in the ambient atmosphere of the catchment (the chamber value was 96 to 99 % of the atmosphere pO2).
The fluxes of CO2 measured in this chamber on 27 March 2017 decreased from 1384±42 to 684±21 mgC m−2 day−1 with the number of times we extracted the CO2 from the chamber (Fig. 3). The flux becomes approximately constant after three CO2 extractions during zeolite trapping, with an average of 705±15 mgC m−2 day−1 (1sd, n=4) for the last four flux measurements that are indistinguishable from each other within 2σ (Fig. 3). This observation might be explained by the fact that over time (days to months), CO2 accumulates not only in the chamber, but also in the regolith- or rock-connected pores surrounding the chamber in the lower compact regolith (Maquaire et al., 2002). Weathering reactions are likely to occur not only at the chamber–rock interface, but also into the rock mass over several centimetres as the weathered regolith extends to depths of up to 20 cm (Maquaire et al., 2002; Mathys and Klotz, 2008; Oostwoud Wijdenes and Ergenzinger, 1998).
When CO2 is first extracted from the chamber, the CO2 stored in the surrounding pores quickly refills the chamber. It appears that after three extractions this CO2 is depleted, meaning that the more constant values correspond to the actual flux of CO2 through the surface area of the chamber. We would therefore recommend that flux measurements are made on such a chamber following ∼ 3 to 4 removals of CO2, or adapted to less or more removals based on the results obtained after a series of flux measurements.
It has to be noted that the mass of carbon (mC) recovered on the zeolite molecular sieve during the period of passive trapping (Δt) cannot be directly and simply used to inform the flux of carbon through the chamber. This is because the rate of carbon trapping (mC ∕ Δt) follows the first Fick's law (Bertoni et al., 2004) and hence depends on the partial pressure of CO2 in the chamber rather than on the flux itself. It is thus not trivial to assess the flux from the rate of carbon passive trapping (mC ∕ Δt) as the flux itself may change through time. Similar reasons prevented the direct use of the amount of passively trapped CO2 to estimate flux rates in previous studies (Hartley et al., 2013). Nevertheless, the rate at which CO2 is trapped on the zeolite molecular sieve (mC ∕ Δt) is still qualitatively informative about CO2 flux when compared to other sampling periods when CO2 is passively trapped (see the Appendix for further information).
3.2 Isotope measurements and isotopic fractionation
3.2.1 Active sampling method
The atmospheric CO2 was sampled on 27 March 2017, yielding a δ13C of −9.6 ‰ and a 14C activity of Fm = 1.0065±0.0044. From chamber H6, we actively sampled CO2 twice on 27 March 2017 (by in line trapping, Fig. 3) and on 29 March 2017 (by repeated trapping over the course of a day) both yielding ∼ 2.1 mgC. The 14C activities (Fm of 0.0597±0.0047 and 0.0562±0.0047, respectively) were identical within measurement uncertainty. Because the CO2 originating from rock-derived organic matter and carbonate minerals is devoid of 14C, as confirmed by 14C measurements of the organic carbon and carbonate of the rock from the studied chamber (Table 3), the atmospheric CO2 input (fAtm) can be calculated as . The Fm from both samples shows that only ∼ 5.5 to 6 % of the CO2 trapped was of atmospheric origin and that the two active trapping methods produce comparable results. The δ13C compositions (−7.4 and −6.1 ‰, respectively) were within the range expected for a mixture of organic- and inorganic-carbon-derived CO2, but differed by ∼ 1 ‰ for these two traps (Table 2).
It has been shown that active trapping of CO2 from headspace chambers does not induce any δ13C fractionation because of near complete recovery of the CO2 present in the chamber (Hardie et al., 2005). Thus, the difference in the δ13C composition between our two actively trapped CO2 samples may reflect different relative rates of carbonate dissolution by sulfuric acid versus organic matter oxidation over a daily timescale. Such changes in the δ13C composition of the CO2 sampled from field-based chambers on soils or streams have already been observed and may stem from natural environmental changes over the course of the experiments (Garnett and Hartley, 2010; Garnett et al., 2016). We cannot exclude that some diffusive processes (Davidson, 1995) within the rocks surrounding the drilled chambers or some leakage around the chamber entrance may have induced the observed 1 ‰ difference between our two actively trapped CO2 samples. However, these samples were collected from the exact same chamber that is likely characterized by the same diffusive processes and leakage over days. If so, the observed 1 ‰ is likely due to natural environmental changes in the CO2 production rather than due to diffusive processes or leaks.
3.2.2 Passive sampling method
From chamber H6, the CO2 sample passively trapped for 101 days from mid-December 2016 to late March 2017 yielded ∼ 11.4 mgC. The sieve cartridges have been shown to reliably trap > 100 mL CO2 (Garnett et al., 2009; i.e. > ∼ 50 mgC), so the 11.4 mgC from H6 represents less than a quarter of the sieve capacity, suggesting that passive sieves can be left for at least ∼ 6 months without becoming saturated with CO2 at this field site (in reality, saturation by water vapour may be more likely to be a limiting factor). The Fm was 0.0495±0.0047, which is very similar to the active trapping results, with only ∼ 5 % atmospheric CO2 contamination. This is perhaps surprising since the trap was left exposed in the natural environment for 3 months. However, it results from the high pCO2 present in the chamber throughout the time period, driving a net diffusive transfer of CO2 from chamber to the zeolite sieve. It suggests the components used to make the chamber and its linkages are not susceptible to major leaks.
The δ13C composition of the passively trapped CO2 was −9.4 ‰ and has to be corrected for a fractionation factor of 4.2±0.3 ‰ associated with the passive trapping method (Garnett and Hardie, 2009; Garnett and Hartley, 2010) to provide the actual average δ13C composition of the CO2 during the duration of the experiment (here ∼ 3 months). This fractionation is due to the diffusive transport of CO2 through air from the chamber to the zeolite molecular sieve (Davidson, 1995). The δ13C composition of the passively trapped CO2 sample displays a 2.0 and 3.3 ‰ depletion when compared to the δ13C values obtained with the actively trapped CO2 samples. This suggests that fractionation during passive trapping actually occurred, in agreement with earlier studies (Garnett et al., 2009; Garnett and Hardie, 2009; Garnett and Hartley, 2010). However, the δ13C difference between actively and passively trapped CO2 samples is less than the expected 4.2 ‰ value. It has to be noted that the passive sampling method averages ∼ 3 months of CO2 δ13C composition in the chamber, while the active sampling method averages only a few hours. Thus, the apparent “mismatch” may be due to naturally changing CO2 δ13C composition over timescales shorter than ∼ 3 months and likely of the order of hours to days. This shows that both active and passive methods are complementary methods, enabling us to explore different timescales of sedimentary rock weathering.
3.2.3 The source of the CO2: rock-derived organic carbon oxidation vs. carbonate dissolution by sulfuric acid
We solved the isotope mass balance Eq. (6) for the actively trapped CO2 samples from 27 March 2017 and 30 March 2017, and for the passively trapped CO2 sample (Table 4). The δ13C of the passively trapped CO2 was corrected using the published 4.2±0.3 ‰ fractionation factor (Garnett and Hardie, 2009; Garnett and Hartley, 2010) prior to calculations, and the 14C activity of both the rock-derived organic carbon and carbonate end-member were set to 0, as their measured Fm were close to instrumental background (Table 3). We found very similar results for the three trapped CO2 samples, yielding 5 to 6 % of CO2 from atmospheric contamination, 71 to 79 % of CO2 from the dissolution of the carbonates by sulfuric acid and 16 to 23 % of CO2 from the oxidation of rock-derived organic matter (details in Table 4).
Table 4Isotope mass balance results.
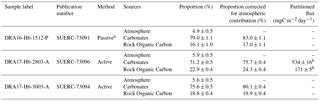
a Before solving isotope mass balance, the δ13C of the passive sample was corrected for a fractionation factor of 4.2±0.3 ‰ (Garnett and Hardie, 2009; Garnett and Hartley, 2010)
b From a measured bulk CO2 flux of 705±21 mgC m−2 day−1.
The proportion of the CO2 derived from the oxidation of rock organic carbon (fRock OC) and that derived from the dissolution of carbonate by sulfuric acid (fCarb) are corrected for the contamination of atmospheric CO2 before the partitioning of the measured CO2 flux. Corrected proportions (, where subscript “x” is “Rock OC”, or “Carb”) are calculated based on the proportions (fx) found after solving the isotope mass balance as follows:
This shows 17 to 24 % CO2 from rock-derived organic carbon and 76 to 83 % CO2 from carbonate dissolution (Table 4). Therefore, for chamber H6 on 27 March 2017 for which we simultaneously measured the bulk CO2 flux (705±21 mgC m−2 day−1), these proportions equate to a flux of 171±5 mgC m−2 day−1 derived from the natural oxidation of rock organic matter, and a flux of 534±16 mgC m−2 day−1 derived from the dissolution of carbonates by sulfuric acid (Table 4).
At the scale of chamber H6, these flux measurements imply that over a year ∼ 109 g of rock would be weathered by sulfuric acid to produce the carbonate-derived CO2 flux (i.e. 7.1 gC produced in 1 year from a rock with 6.52 wt % of inorganic carbon). In contrast, ∼ 2080 g of sedimentary rock would need to have been oxidized to produce the rock-organic carbon CO2 flux (i.e. 2.3 gC produced in 1 year from a rock with 0.11 wt % of organic carbon). The dissolution of carbonate depends on the oxidation of sulfides, and may therefore only occur locally where sulfides are concentrated. Based on these first measurements from one chamber, the oxidation of organic carbon appears to occur more homogeneously in the rock mass.
3.3 First-order comparison with other methods estimating CO2 fluxes
To our knowledge, we report here the first attempt to directly measure the CO2 flux emitted during weathering of sedimentary rocks, and trap this CO2 to partition its sources using stable carbon isotopes and radiocarbon. We acknowledge that our chamber method has not been replicated, representing a limitation to our study. Nevertheless, our study is a field-based experiment, where many environmental parameters (e.g. temperature, precipitation, water content in the unsaturated zone) will have an impact on the weathering and erosion of the studied marls. Hence we expect that the CO2 flux we measured in March 2017 and its isotopic composition will be different from measurements carried out at another times of the year. Similarly, due to the marl geochemical heterogeneities (e.g. inorganic and organic carbon contents, as well as content in sulfide mineral), the CO2 flux and its isotopes could be expected to vary from one chamber to another. It is thus impossible to replicate the exact same results we present here. We propose that future work should aim to monitor numerous chambers over seasonal changes in environmental conditions.
While wary of these caveats, in the following sections we compare our results with other methods, to test the order of magnitudes of the CO2 flux we obtained using our cylindrical chambers against previously published estimates from other regions of the world. While this exercise is challenging due to major differences in the way the CO2 fluxes were estimated and in the surface area and timescales (local estimates at a fixed time vs. regional estimates averaged over months or years), it is informative to assess the reliability of our method.
3.3.1 Rock-derived organic carbon oxidation
The flux of CO2 originating from the oxidation of rock-derived organic carbon is difficult to assess. To our knowledge, there has only been one direct estimate of 0.5 gC m−2 yr−1 using modelling of vadose CO2 and its isotopes in Saskatchewan (Canada) (Keller and Bacon, 1998). This is 120 times lower than our estimate in the chamber H6 of the Laval catchment (i.e. 171 ± 5 mgC m−2 day−1 scaled to a year, giving 62±2 gC m−2 yr−1). This might be explained by the much lower erosion rates of the Canadian site, with deep soils and stable geomorphology, compared to the Laval catchment where erosion continuously exposes rocks to oxidative weathering (Graz et al., 2012).
CO2 fluxes derived from the oxidation of rock organic carbon have been indirectly estimated using geochemical proxies, such as dissolved rhenium fluxes in rivers (Dalai et al., 2002; Hilton et al., 2014; Horan et al., 2017). Our direct measurements obtained from a single chamber (H6) (62±2 gC m−2 yr−1) are of the same order of magnitude as that calculated in highly erosive Taiwanese catchments using dissolved rhenium yields and the loss of rock organic carbon from soils (5 to 35 gC m−2 yr−1) (Hilton et al., 2014; Hemingway et al., 2018). It is clearly too early to directly relate these fluxes. It is likely that individual chambers have different CO2 fluxes (possibly depending on heterogeneities in the rock physical and geochemical properties, temperature, water supply to the unsaturated zone), and that CO2 fluxes from a single chamber may vary throughout the year. Nevertheless, our proof-of-concept study suggests that direct measurements are consistent with proxy-based methods. The spatial variability in oxidation rates and its variability throughout the year are important questions which can be tested with the chamber method we describe here.
3.3.2 Carbonate dissolution by sulfuric acid
Inorganic carbon was the main source of the CO2 flux measured during our experiment (i.e. 534±16 mgC m−2 day−1 scaled to a year, giving 195±6 gC m−2 yr−1). The dissolution of carbonate minerals by sulfuric acid (i.e. by oxidized sulfide minerals) is the simplest explanation (Calmels et al., 2007). An implication of this result is that in the Laval catchment, carbonates are weathered preferentially according to Reaction (R2), i.e. releasing CO2 to the atmosphere at the weathering site. This statement is supported by the average anion concentrations in the Laval stream in 2002 (Cras et al., 2007) that gives a low bicarbonate-to-sulfate ratio ( ∕ ratio of ∼ 0.35). At first order (i.e. assuming that sulfate is exclusively derived from oxidized sulfides), this observation supports the fact that carbonate weathering preferentially produces gaseous CO2 (Reaction R2, i.e. ∕ ratio equal to 0) instead of dissolved inorganic carbon (Reaction R3, i.e, ∕ ratio equal to 2) at the weathering site. Because carbonate minerals are highly reactive, this means that the sulfuric acid weathering of carbonate minerals could produce a local CO2 flux which starts to approach the rates of respiration in modern soils (e.g. Pirk et al. 2016).
The published river ion data can be used to estimate the weathering of carbonate minerals by sulfuric acid. From the average Ca2+ and concentrations measured in 2002 and the average runoff (Cras et al., 2007), assuming that the weathering of carbonates produced only gaseous CO2, we estimate a flux of CO2 to the atmosphere of 19 to 37 gC m−2 yr−1. These values could be refined by measurement of sulfur and oxygen isotopes of to partition sulfate source (Calmels et al., 2007). The river ion flux estimate is much lower than our direct measurement. This is likely due to the fact that we compare here an isolated (metre-scale) measurement to a catchment-scale average estimate which takes into account regions that have lower erosion and weathering rates. A complementary explanation would be that the flux of CO2 emitted during weathering may change seasonally as a response to changes in temperature and water content in the unsaturated zone. Thus, the flux we measured directly would be lower if averaged over the course of a year, hence including winter with expected lower fluxes. This necessitates monitoring over months.
Our local direct measurement is higher than the annual flux estimate obtained for a similar highly erosive catchment in Taiwan (Liwu River) using dissolved river chemistry of ∼ 20 gC m−2 yr−1 (Calmels et al., 2011; Das et al., 2012; Torres et al., 2014). These values are much higher than that of less erosive major river systems like the Mackenzie River in Canada (Calmels et al., 2007; Torres et al., 2014) (< 1 gC m−2 yr−1) or the Ganges–Brahmaputra river system in India (< 1 gC m−2 yr−1) (Galy and France-Lanord, 1999; Torres et al., 2014) and supports an important control of physical erosion in the weathering of carbonates via oxidative weathering of sulfides. Our chamber-based method provides a new way to quantify this process in the field and assess the spatial and temporal variability in CO2 production by this weathering process.
Here, we present a reliable, innovative and relatively inexpensive way to measure the flux of CO2 produced during the oxidative weathering of sedimentary rocks. The ability to trap the CO2 using active or passive zeolite molecular sieves is essential, since its carbon isotopic composition (12C, 13C, 14C) is mandatory to assess for atmospheric CO2 inputs, before partitioning the CO2 flux between that from oxidation of rock-derived organic carbon and carbonate dissolution by sulfuric acid. The passive method to trap the CO2, i.e. leaving zeolite molecular sieve connected to a chamber for days to months, is useful to provide a time-integrative sample of CO2 produced during weathering. This paper is a proof of concept of the oxidative weathering of rocks: (i) rock-derived organic carbon is oxidized and CO2 is released directly to the atmosphere and its flux can be large enough to be directly measurable; (ii) the oxidation of sulfides contained in the rocks produces sulfuric acid and dissolves carbonates, and in the Laval catchment this phenomenon releases CO2 directly to the atmosphere and its flux can be locally large.
Raw data and flux resulting from exponential fitting of data are available in the Supplement.
Here we explain how the mass of CO2 accumulated on the passive traps over several months may be compared to short-term flux measurements made during the active trapping method. Passive sampling is a practical application of Fick's first law (Bertoni et al., 2004). In our case it is related to the diffusion (D) of CO2 molecules in air caused by the gradient of CO2 partial pressure between that of the chamber (pCO2,Ch) and that of the zeolite trap (pCO2,zeolite). This diffusion is defined for a length of time (Δt) and is limited to the internal side of the tube linking the chamber to the zeolite trap, i.e. the diffusion path characterized by the tube length (L) and tube section area (a). It results in the trapping of a certain mass of carbon (mC) in the zeolite trap. In this case, first Fick's law may be written as follows:
R is the gas constant, T is temperature, P is pressure and MC is the molar mass of carbon. Factor 106 × RT ∕ PMC converts grams of carbon to cubic centimetres of CO2, and pCO2 is here in parts per million (cm3 m−3). Note that the pCO2, zeolite in the zeolite trap is equal to 0 ppm, since the zeolite is the CO2 absorber. The equation thus reduces to
Equation (A2) can be used to reconstruct the average partial pressure of CO2 in the chamber pCO2,Ch during the sampling duration (Δt). Equation (A2) also indicates that the passive trapping is only directly linked to the partial pressure in the chamber over the sampling length of time Δt. In other words, passive sampling is not related in a simple way to the flux of CO2 through the chamber.
In order to relate long-term passive sampling to short-term CO2 flux measurements, we assume that the evolution of the pCO2 in the chamber can be described following an exponential law (Pirk et al., 2016; see Eqs. 4 and 5 of main text), and we can describe the pCO2,Ch in the chamber based on other parameters:
VCh is the volume of the chamber, q is the initial rate of carbon accumulation in the chamber, m0 is the initial mass of carbon in the chamber (a value that corresponds to 400 ppm of CO2 in the volume of the chamber), and λ, per unit of time, is the parameter that describes the diffusive processes responsible for the non-linear accumulation of carbon in the chamber. In the case of long-term passive sampling Δt is very large (∼ 3 months and thus ∼ 150 000 min). Thus, exp(−λΔt) tends to 0 and Eq. (A3) simplifies to
Note that Eq. (A4) can be written only if we assume that the initial rate of carbon accumulating in the chamber (q) does not change over time. This assumption may be violated because q is unlikely to stay constant over time for various reasons including natural variability in CO2 production and also changes in the diffusive processes (parameter λ) when pCO2 builds up in the chamber. Equating Eqs. (A2) and (A4), we obtain
Hence, we can derive the rate at which carbon accumulates into the chamber based on the passive trapping parameters and λ, which is measured in the field over short time periods (i.e. during the short-term flux measurements when CO2 is actively trapped – see Eqs. 4 and 5 in the main text):
The flux can be inferred from the later equation using the internal surface area of the chamber (S). If q was in mgC min−1, then the flux of carbon Q in mgC m2 day−1 is
We can determine most of the parameters of Eq. (A6) independently from the short-term flux (Q or q) measurements, except for λ. For instance mC, m0, VCh, S, Δt, a and L can be measured and D (diffusion of CO2 in air) can be inferred from the literature. However, λ is determined using the short-term flux measurements, along with the flux (i.e. Q or q). Thus, estimating the flux of CO2 based on the rate of carbon passively trapped in the zeolite trap (mC ∕ Δt) is not independent from the short-term CO2 flux measurements. Hence, comparing a CO2 flux inferred from the mass of carbon mC recovered using the passive trap and calculated using Eqs. (A6) and (A7), and the CO2 flux actually measured during our short-term experiments, is somewhat circular because they are not determined independently from each other.
For longer monitoring of field work sites, the mass of carbon trapped is still qualitatively informative. This is because mC and the rate carbon trapping per unit of time (mC ∕ Δt) are proportional to the flux of carbon Q to the chamber and parameter λ. This is illustrated easily by writing equation Eq. (A7) differently:
where the left-hand part of Eq. (A8) are the parameters measured during passive trapping and the right-hand part of Eq. (A8) are the parameters measured during short-term flux measurements. Interpretations of changes in mC ∕ Δt thus give qualitative constraint on CO2 fluxes over time. Future work might investigate whether the parameter λ can be characterized for a chamber independently from the active CO2 flux measurements. If it can, the passive trap method can be used not only qualitatively (e.g. to look for changes in the mass of CO2 collected on passive traps through time), but quantitatively (i.e. the monthly time-integrated CO2 flux).
The supplement related to this article is available online at: https://doi.org/10.5194/bg-15-4087-2018-supplement.
RGH conceived the research and designed the study with GS and MHG. GS, RGH and SK carried out chamber installation. GS carried out flux measurements and sample collection with on-field assistance of RGH, MD and MO. GS, RGH, MHG and TC analysed the data. GS, RGH and MHG interpreted the data. GS wrote the paper with inputs from RGH and MHG. All co-authors commented on the paper.
The authors declare that they have no conflict of interest.
This research was funded by a European Research Council Starting Grant to
Robert G. Hilton (ROC-CO2 project, grant 678779) and by the Natural
Environment Research Council (NERC) Radiocarbon Facility (East Kilbride). We
thank staff at NERC RCF and SUERC. We thank Anne-Eléonore Paquier and
Clément Flaux for assistance on field in December 2016. We thank
Jérôme Gaillardet and Caroline Le Bouteiller for collaborative access
to the infrastructure at the Draix Bléone Observatory, (IRSTEA). Camille
Cros and an anonymous reviewer are thanked for their comments which improved
the paper.
Edited by: Sébastien
Fontaine
Reviewed by: Camille Cros and one anonymous referee
Bardgett, R. D., Richter, A., Bol, R., Garnett, M. H., Bäumler, R., Xu, X., Lopez-Capel, E., Manning, D. A. C., Hobbs, P. J., Hartley, I. R., and Wanek, W.: Heterotrophic microbial communities use ancient carbon following glacial retreat, Biol. Lett., 3, 487–490, https://doi.org/10.1098/rsbl.2007.0242, 2007.
Berner, E. K. and Berner, R. A.: Global environment: Water, air, and geochemical cycles, Princeton University Press, 488 pp., 2012.
Berner, R. A. and Canfield, D. E.: A new model for atmospheric oxygen over Phanerozoic time, Am. J. Sci., 289, 333–361, https://doi.org/10.2475/ajs.289.4.333, 1989.
Bertoni, G., Ciuchini, C., and Tappa, R.: Measurement of long-term average carbon dioxide concentrations using passive diffusion sampling, Atmos. Environ., 38, 1625–1630, https://doi.org/10.1016/j.atmosenv.2003.12.010, 2004.
Billett, M. F., Garnett, M. H., and Hardie, S. M. L.: A Direct Method to Measure 14CO2 Lost by Evasion from Surface Waters, Radiocarbon, 48, 61–68, https://doi.org/10.1017/S0033822200035396, 2006.
Blair, N. E., Leithold, E. L., Ford, S. T., Peeler, K. A., Holmes, J. C., and Perkey, D. W.: The persistence of memory: the fate of ancient sedimentary organic carbon in a modern sedimentary system, Geochim. Cosmochim. Ac., 67, 63–73, https://doi.org/10.1016/S0016-7037(02)01043-8, 2003.
Borges, A. V., Delille, B., Schiettecatte, L.-S., Gazeau, F., Abril, G., and Frankignoulle, M.: Gas transfer velocities of CO2 in three European estuaries (Randers Fjord, Scheldt, and Thames), Limnol. Oceanogr., 49, 1630–1641, https://doi.org/10.4319/lo.2004.49.5.1630, 2004.
Bouchez, J., Beyssac, O., Galy, V., Gaillardet, J., France-Lanord, C., Maurice, L., and Moreira-Turcq, P.: Oxidation of petrogenic organic carbon in the Amazon floodplain as a source of atmospheric CO2, Geology, 38, 255–258, https://doi.org/10.1130/G30608.1, 2010.
Calmels, D., Gaillardet, J., Brenot, A., and France-Lanord, C.: Sustained sulfide oxidation by physical erosion processes in the Mackenzie River basin: Climatic perspectives, Geology, 35, 1003–1006, https://doi.org/10.1130/G24132A.1, 2007.
Calmels, D., Galy, A., Hovius, N., Bickle, M., West, A. J., Chen, M.-C., and Chapman, H.: Contribution of deep groundwater to the weathering budget in a rapidly eroding mountain belt, Taiwan, Earth Planet. Sc. Lett., 303, 48–58, https://doi.org/10.1016/j.epsl.2010.12.032, 2011.
Copard, Y., Amiotte-Suchet, P., and Di-Giovanni, C.: Storage and release of fossil organic carbon related to weathering of sedimentary rocks, Earth Planet. Sc. Lett., 258, 345–357, https://doi.org/10.1016/j.epsl.2007.03.048, 2007.
Cras, A., Marc, V., and Travi, Y.: Hydrological behaviour of sub-Mediterranean alpine headwater streams in a badlands environment, J. Hydrol., 339, 130–144, https://doi.org/10.1016/j.jhydrol.2007.03.004, 2007.
Dalai, T. K., Singh, S. K., Trivedi, J. R., and Krishnaswami, S.: Dissolved rhenium in the Yamuna River System and the Ganga in the Himalaya: Role of black shale weathering on the budgets of Re, Os, and U in rivers and CO2 in the atmosphere, Geochim. Cosmochim. Ac., 66, 29–43, https://doi.org/10.1016/S0016-7037(01)00747-5, 2002.
Das, A., Chung, C.-H., and You, C.-F.: Disproportionately high rates of sulfide oxidation from mountainous river basins of Taiwan orogeny: Sulfur isotope evidence, Geophys. Res. Lett., 39, L12404, https://doi.org/10.1029/2012GL051549, 2012.
Davidson, G. R.: The stable isotopic composition and measurement of carbon in soil CO2, Geochim. Cosmochim. Ac., 59, 2485–2489, https://doi.org/10.1016/0016-7037(95)00143-3, 1995.
Galy, A. and France-Lanord, C.: Weathering processes in the Ganges-Brahmaputra basin and the riverine alkalinity budget, Chem. Geol., 159, 31–60, https://doi.org/10.1016/S0009-2541(99)00033-9, 1999.
Galy, V., Beyssac, O., France-Lanord, C., and Eglinton, T.: Recycling of Graphite During Himalayan Erosion: A Geological Stabilization of Carbon in the Crust, Science, 322, 943–945, https://doi.org/10.1126/science.1161408, 2008.
Garnett, M. H. and Hardie, S. M. L.: Isotope (14C and 13C) analysis of deep peat CO2 using a passive sampling technique, Soil Biol. Biochem., 41, 2477–2483, https://doi.org/10.1016/j.soilbio.2009.09.004, 2009.
Garnett, M. H. and Hartley, I. P.: A passive sampling method for radiocarbon analysis of atmospheric CO2 using molecular sieve, Atmos. Environ., 44, 877–883, https://doi.org/10.1016/j.atmosenv.2009.12.005, 2010.
Garnett, M. H. and Murray, C.: Processing of CO2 Samples Collected Using Zeolite Molecular Sieve for 14C Analysis at the NERC Radiocarbon Facility (East Kilbride, UK), Radiocarbon, 55, 410–415, https://doi.org/10.1017/S0033822200057532, 2013.
Garnett, M. H., Billett, M. F., Gulliver, P., and Dean, J. F.: A new field approach for the collection of samples for aquatic 14CO2 analysis using headspace equilibration and molecular sieve traps: the super headspace method, Ecohydrology, 9, 1630–1638, https://doi.org/10.1002/eco.1754, 2016.
Garnett, M. H., Hartley, I. P., Hopkins, D. W., Sommerkorn, M., and Wookey, P. A.: A passive sampling method for radiocarbon analysis of soil respiration using molecular sieve, Soil Biol. Biochem., 41, 1450–1456, https://doi.org/10.1016/j.soilbio.2009.03.024, 2009.
Graz, Y., Di-Giovanni, C., Copard, Y., Mathys, N., Cras, A., and Marc, V.: Annual fossil organic carbon delivery due to mechanical and chemical weathering of marly badlands areas, Earth Surf. Process. Land., 37, 1263–1271, https://doi.org/10.1002/esp.3232, 2012.
Hahn, V., Högberg, P., and Buchmann, N.: 14C – A tool for separation of autotrophic and heterotrophic soil respiration, Glob. Chang. Biol., 12, 972–982, https://doi.org/10.1111/j.1365-2486.2006.001143.x, 2006.
Hardie, S. L. M. L., Garnett, M. H. H., Fallick, A. E. E., Rowland, A. P. P., and Ostle, N. J. J.: Carbon dioxide capture using a zeolite molecular sieve sampling system for isotopic studies (13C and 14C) of respiration, Radiocarbon, 47, 441–451, https://doi.org/10.2458/azu_js_rc.v.2838, 2005.
Hartley, I. P., Garnett, M. H., Sommerkorn, M., Hopkins, D. W., and Wookey, P. A.: The age of CO2 released from soils in contrasting ecosystems during the arctic winter, Soil Biol. Biochem., 63, 1–4, https://doi.org/10.1016/j.soilbio.2013.03.011, 2013.
Hemingway, J. D., Hilton, R. G., Hovius, N., Eglinton, T. I., Haghipour, N., Wacker, L., Chen, M.-C., and Galy, V. V.: Microbial oxidation of lithospheric organic carbon in rapidly eroding tropical mountain soils, Science, 360, 209–212, https://doi.org/10.1126/science.aao6463, 2018.
Hilton, R. G., Galy, A., Hovius, N., Horng, M. J., and Chen, H.: Efficient transport of fossil organic carbon to the ocean by steep mountain rivers: An orogenic carbon sequestration mechanism, Geology, 39, 71–74, https://doi.org/10.1130/G31352.1, 2011.
Hilton, R. G., Gaillardet, J., Calmels, D., and Birck, J. L.: Geological respiration of a mountain belt revealed by the trace element rhenium, Earth Planet. Sc. Lett., 403, 27–36, https://doi.org/10.1016/j.epsl.2014.06.021, 2014.
Hindshaw, R. S., Heaton, T. H. E., Boyd, E. S., Lindsay, M. R., and Tipper, E. T.: Influence of glaciation on mechanisms of mineral weathering in two high Arctic catchments, Chem. Geol., 420, 37–50, https://doi.org/10.1016/j.chemgeo.2015.11.004, 2016.
Horan, K., Hilton, R. G., Selby, D., Ottley, C. J., Gröcke, D. R., Hicks, M., and Burton, K. W.: Mountain glaciation drives rapid oxidation of rock-bound organic carbon, Sci. Adv., 3, e1701107, https://doi.org/10.1126/sciadv.1701107, 2017.
Jaffe, L. A., Peucker-Ehrenbrink, B., and Petsch, S. T.: Mobility of rhenium, platinum group elements and organic carbon during black shale weathering, Earth Planet. Sc. Lett., 198, 339–353, https://doi.org/10.1016/S0012-821X(02)00526-5, 2002.
Keller, C. K. and Bacon, D. H.: Soil respiration and georespiration distinguished by transport analyses of vadose CO2, 13CO2, and 14CO2, Global Biogeochem. Cy., 12, 361–372, https://doi.org/10.1029/98GB00742, 1998.
Kutzbach, L., Schneider, J., Sachs, T., Giebels, M., Nykänen, H., Shurpali, N. J., Martikainen, P. J., Alm, J., and Wilmking, M.: CO2 flux determination by closed-chamber methods can be seriously biased by inappropriate application of linear regression, Biogeosciences, 4, 1005–1025, https://doi.org/10.5194/bg-4-1005-2007, 2007.
Li, S. L., Calmels, D., Han, G., Gaillardet, J., and Liu, C. Q.: Sulfuric acid as an agent of carbonate weathering constrained by δ13C DIC: Examples from Southwest China, Earth Planet. Sc. Lett., 270, 189–199, https://doi.org/10.1016/j.epsl.2008.02.039, 2008.
Maquaire, O., Ritzenthaler, A., Fabre, D., Ambroise, B., Thiery, Y., Truchet, E., Malet, J.-P., and Monnet, J.: Caractérisation des profils de formations superficielles par pénétrométrie dynamique à énergie variable?: application aux marnes noires de Draix (Alpes-de-Haute-Provence, France), Comptes Rendus Geosci., 334, 835–841, https://doi.org/10.1016/S1631-0713(02)01788-1, 2002.
Mathys, N. and Klotz, S.: Draix: A field laboratory for research on hydrology and erosion in mountain areas, in: Proceedings of the 4th Canadian Conference on Geohazards: From Causes to Management, edited by: Locat, D.D., Perret, D., and Turmel, D., 594, 2008.
Mathys, N., Brochot, S., Meunier, M., and Richard, D.: Erosion quantification in the small marly experimental catchments of Draix (Alpes de Haute Provence, France), Calibration of the ETC rainfall-runoff-erosion model, CATENA, 50, 527–548, https://doi.org/10.1016/S0341-8162(02)00122-4, 2003.
Mook, W. G. and van der Plicht, J.: Reporting 14C Activities and Concentrations, Radiocarbon, 41, 227–239, https://doi.org/10.1017/S0033822200057106, 1999.
Oostwoud Wijdenes, D. J. and Ergenzinger, P.: Erosion and sediment transport on steep marly hillslopes, Draix, Haute-Provence, France: an experimental field study, CATENA, 33, 179–200, https://doi.org/10.1016/S0341-8162(98)00076-9, 1998.
Petsch, S. T.: Weathering of Organic Carbon, in: Treatise on Geochemistry, 12, 217–238, Elsevier, Amsterdam, 2014.
Petsch, S. T., Berner, R. A., and Eglinton, T. I.: A field study of the chemical weathering of ancient sedimentary organic matter, Org. Geochem., 31, 475–487, 2000.
Petsch, S. T., Eglinton, T. I., and Edwards, K. J.: 14C-Dead Living Biomass: Evidence for Microbial Assimilation of Ancient Organic Carbon During Shale Weathering, Science, 292, 1127–1131, https://doi.org/10.1126/science.1058332, 2001.
Pirk, N., Mastepanov, M., Parmentier, F.-J. W., Lund, M., Crill, P., and Christensen, T. R.: Calculations of automatic chamber flux measurements of methane and carbon dioxide using short time series of concentrations, Biogeosciences, 13, 903–912, https://doi.org/10.5194/bg-13-903-2016, 2016.
Reimer, P. J., Brown, T. A., and Reimer, R. W.: Discussion: reporting and calibration of post-bomb 14C data, Radiocarbon, 46, 1299–1304, https://doi.org/10.1017/S0033822200033154, 2004.
Spence, J. and Telmer, K.: The role of sulfur in chemical weathering and atmospheric CO2 fluxes: Evidence from major ions, δ13CDIC, and δ34SSO4 in rivers of the Canadian Cordillera, Geochim. Cosmochim. Ac, 69, 5441–5458, https://doi.org/10.1016/j.gca.2005.07.011, 2005.
Stuiver, M. and Polach, H. A.: Discussion Reporting of 14C Data, Radiocarbon, 19, 355–363, https://doi.org/10.1017/S0033822200003672, 1977.
Sundquist, E. T. and Visser, K.: Geologic history of the carbon cycle, Biogeochemistry, 8, 425–472, 2005.
Torres, M. A., West, A. J., and Li, G.: Sulphide oxidation and carbonate dissolution as a source of CO2 over geological timescales, Nature, 507, 346–349, https://doi.org/10.1038/nature13030, 2014.
Travelletti, J., Sailhac, P., Malet, J.-P., Grandjean, G., and Ponton, J.: Hydrological response of weathered clay-shale slopes: water infiltration monitoring with time-lapse electrical resistivity tomography, Hydrol. Process., 26, 2106–2119, https://doi.org/10.1002/hyp.7983, 2012.