the Creative Commons Attribution 4.0 License.
the Creative Commons Attribution 4.0 License.
 | 18 Jul 2018
The Arctic picoeukaryote Micromonas pusilla benefits synergistically from warming and ocean acidification
Clara Jule Marie Hoppe
Clara M. Flintrop
Björn Rost
In the Arctic Ocean, climate change effects such as warming and ocean acidification (OA) are manifesting faster than in other regions. Yet, we are lacking a mechanistic understanding of the interactive effects of these drivers on Arctic primary producers. In the current study, one of the most abundant species of the Arctic Ocean, the prasinophyte Micromonas pusilla, was exposed to a range of different pCO2 levels at two temperatures representing realistic current and future scenarios for nutrient-replete conditions. We observed that warming and OA synergistically increased growth rates at intermediate to high pCO2 levels. Furthermore, elevated temperatures shifted the pCO2 optimum of biomass production to higher levels. Based on changes in cellular composition and photophysiology, we hypothesise that the observed synergies can be explained by beneficial effects of warming on carbon fixation in combination with facilitated carbon acquisition under OA. Our findings help to understand the higher abundances of picoeukaryotes such as M. pusilla under OA, as has been observed in many mesocosm studies.
- Article
(989 KB) - Full-text XML
-
Supplement
(202 KB) - BibTeX
- EndNote


With the progress in using molecular tools to describe marine biodiversity in recent decades, the scientific community has become increasingly aware of the underestimated importance of picoeukaryotes, for both primary and export production of the world's oceans (Richardson and Jackson, 2007; Worden and Not, 2008). Larger phytoplankton such as diatoms are efficient vectors for carbon export due to aggregate formation and ingestion by large zooplankton, leading to the production of fast-settling faecal pellets (Sherr et al., 2003). In contrast, picoeukaryotes are mainly grazed by smaller heterotrophic protists such as ciliates, which have a low carbon retention, excrete relatively more dissolved material and thus fuel recycled production (Sherr and Sherr, 2002). Hence, changes in the relative abundance of pico- and nanoeukaryotes can have large implications for food webs and biogeochemistry (Worden et al., 2015).
Picoeukaryotes tend to dominate low nutrient environments, which is often attributed to their high surface : volume ratios and mixotrophic capacities (Raven, 1998; McKie-Krisberg and Sanders, 2014). The low nutrient concentrations in the Arctic surface ocean, for example, cause picoeukaryotes to be particularly successful in this region. In fact, the globally occurring prasinophyte Micromonas pusilla is considered the most abundant species in the Arctic ocean (Šlapeta et al., 2006; Lovejoy et al., 2007; Marquardt et al., 2016). In this environment, strong stratification causes low nutrient concentrations throughout the summer and autumn months (Tremblay et al., 2015), and the occurrence of the polar night requires organisms to either form resting stages or to have heterotrophic capacities (Tremblay et al., 2009; Lovejoy, 2014; Berge et al., 2015; Vader et al., 2015).
Climate change effects manifest faster in the Arctic than anywhere else on the planet (Stocker, 2014). In this region, for example, temperatures are rising more than twice as fast as throughout the rest of the globe (Miller et al., 2010). The concurrent rapid reduction in ice cover allows for more light penetration and longer growing seasons, while increased stratification due to ice melt and warming constrain nutrient supply to surface waters, both of which will change the dynamics of primary production (Arrigo et al., 2008; Wassmann and Reigstad, 2011). Ocean acidification (OA) is also especially pronounced in the Arctic Ocean, because low temperatures and alkalinity make the system sensitive to anthropogenic CO2 loading (AMAP, 2013; Qi et al., 2017). Picoeukaryotes such as M. pusilla may benefit from these changes and are considered potential winners of climate change. In the Canadian Arctic, for example, picoeukaryote abundances are increasing as surface waters get warmer, fresher and more oligotrophic (Li et al., 2009). Regarding OA effects, the majority of studies on natural phytoplankton assemblages have shown that picoeukaryotes, particularly M. pusilla, increase in relative abundance with increasing pCO2 levels (Engel et al., 2008; Meakin and Wyman, 2011; Newbold et al., 2012; Brussaard et al., 2013; Hussherr et al., 2017; Schulz et al., 2017). Despite the evident sensitivity of M. pusilla to changes in pCO2 levels, a detailed assessment of the OA effects, their interaction with warming as well as the underlying mechanisms in this important species is still missing.
Like all photosynthetic organisms, cells of M. pusilla need to maintain a balance between energy sources (i.e. light harvesting by the photosynthetic apparatus) and sinks (most importantly carbon fixation in the Calvin cycle) to prevent harmful levels of excitation pressure on the photosynthetic electron transport chain (Behrenfeld et al., 2008). Light harvesting and electron transport in the photosystems are largely independent of changes in temperature and pCO2 (Mock and Hoch, 2005; Hoppe et al., 2015), but the impact of these drivers on energy sinks can potentially affect the energy balance of the cell: the beneficial effects of elevated pCO2 observed in phytoplankton are thought to be caused by increased diffusive CO2 supply, reduced CO2 leakage or lowered costs to operate their CO2 concentrating mechanisms (Rost et al., 2008; Bach et al., 2013). Elevated temperatures, however, can change enzyme kinetics, including those involved in the Calvin cycle, thus leading to a larger sink of excitation energy (Maxwell et al., 1994; Toseland et al., 2013). Hence, both ocean warming and acidification potentially increase the efficiency of photosynthesis and biomass production, at least up to the organisms' respective optimum levels. Above these levels, temperatures and proton concentrations start to disrupt enzymatic processes, increase the investment into pH homeostasis, and impair the delicate regulation of cellular processes (Levitt, 1980; Taylor et al., 2001; Flynn et al., 2012). Thus, the complex balance between beneficial and detrimental effects will determine whether the combination of warming and OA will synergistically promote or deteriorate phytoplankton growth and biomass build-up.
In the current study, we aim to investigate the responses of an Arctic M. pusilla strain to warming and OA. To this end, M. pusilla was grown at four pCO2 levels ranging from pre-industrial to future scenarios (180–1400 µatm) under 2 and 6 ∘C, which represent the magnitude of the projected future temperature increase in this region (Collins et al., 2013), but also the current spring and summer temperatures in the environment where the strain was isolated (Hegseth et al., 2018).
2.1 Culture conditions
Monoclonal cultures of the picoeukaryote Micromonas pusilla (Butcher) Manton & Parke (isolated in 2014 by Klara Wolf in Kongsfjorden, Svalbard, 79∘ N; local temperature range −1.5 to 8 ∘C) taxonomic identification confirmed by rDNA sequencing of SSU, LSU and ITS sequences) were grown in 1 L glass bottles in semi-continuous dilute-batch cultures (maximum 129 000 cells mL−1; diluted every 3–4 days) under constant irradiances of 150 ± 26 . Media consisted of 0.2 µm sterile-filtered Arctic seawater with a salinity of 32.7 enriched with macronutrients, trace metals and vitamins according to F∕2R medium (Guillard and Ryther, 1962). Light intensities were provided by daylight lamps (Philips Master TL-D 18 W; emission peaks at wavelengths of 440, 560 and 635 nm), adjusted by neutral density screens and monitored using a LI-1400 data logger (Li-Cor) equipped with a 4π sensor (Walz). Cells were growing at four different CO2 partial pressures (pCO2; 180, 380, 1000 and 1400 µatm) and two temperatures (2.2 ± 0.3 and 6.3 ± 0.2 ∘C). Cultures were acclimated to these conditions for at least seven generations prior to sampling.
Different pCO2 conditions were achieved by aeration of the incubation bottles with air of the respective pCO2 levels delivered through sterile 0.2 µm air filters (Midisart 2000, Sartorius Stedim) for 24 h prior to inoculation. Gas mixtures were generated using a gas flow controller (CGM 2000 MCZ Umwelttechnik), in which CO2-free air (< 1 ppmv CO2; Dominick Hunter) was mixed with pure CO2 (Air Liquide Deutschland). The pCO2 levels in the gas mixtures were regularly monitored with a non-dispersive infrared analyzer system (LI6252, LI-COR Biosciences), calibrated with CO2-free air and purchased gas mixtures of 150 ± 10 and 1000 ± 20 ppmv CO2 (Air Liquide Deutschland).
2.2 Carbonate chemistry
Samples for total alkalinity (AT) were filtered through 0.7 µm glass fibre filters (GF/F, Whatman) and stored in borosilicate bottles at 3 ∘C. AT was estimated from duplicate potentiometric titration (Brewer et al., 1986) using a TitroLine alpha plus (Schott Instruments). AT values were corrected for systematic errors based on measurements of certified reference materials (CRMs provided by Andrew Dickson, Scripps, USA; batch no. 111; reproducibility ± 5 µmol kg−1). Total dissolved inorganic carbon (CT) samples were filtered through 0.2 µm cellulose-acetate filters (Sartorius Stedim) and stored in gas-tight borosilicate bottles at 3 ∘C. CT was measured colorimetrically in triplicates with a QuAAtro autoanalyzer (Seal; Stoll et al., 2001). The analyser was calibrated with NaHCO3 solutions (with a salinity of 35, achieved by addition of NaCl) to achieve concentrations ranging from 1800 to 2300 µmol CT kg−1. CRMs were used for corrections of errors in instrument performance such as baseline drifts (reproducibility ± 8 µmol kg−1). Seawater pHtotal was measured potentiometrically with a two-point calibrated glass reference electrode (IOline, Schott Instruments). An internal TRIS-based reference standard (Dickson et al., 2007) was used to correct for variability on electrode performance (reproducibility ± 0.015 pH units). Following recommendations by Hoppe et al. (2012), seawater carbonate chemistry including pCO2 was calculated from AT and pH using CO2SYS (Pierrot et al., 2006). The dissociation constants of carbonic acid of Mehrbach et al. (1973), as refitted by Dickson and Millero (1987), were used for calculations. Dissociation constants for KHSO4 were taken from Dickson (1990).
2.3 Growth, elemental composition and production rates
Samples for cell counts were fixed with glutaraldehyde (0.5 % final concentration). After gentle mixing, samples were stored at room temperature in the dark for 15 min, and subsequently frozen in liquid nitrogen and stored at −80 ∘C. Prior to analysis, samples were thawed on ice and mixed thoroughly. After addition of 10 µL SybrGreen working solution (dissolved in DMSO) and 10 µL YG beads working solution (1 µm Fluoresbrite calibration beads grade YG, Polyscience), samples were counted on an Accuri C6 flow cytometer (BD Biosciences) equipped with a blue solid-state laser (488 nm excitation wavelength) run on medium fluidics settings (35 µL min−1; 16 µm core size) with a limit of 50 000 events or 250 µL. Analysis was performed based on red (FL3 channel, > 670 nm) and green (FL1 channel, 533 ± 30 nm) fluorescence, as well as sideward and forward light scattering. Specific growth rates constants (μ) were determined from exponential fits of cell counts over 4 consecutive days.
Particulate organic carbon (POC) and nitrogen (PON) were measured after filtration onto precombusted (15 h, 500 ∘C) GF/F filters (Whatman), stored at −20 ∘C and dried for at least 12 h at 60 ∘C prior to sample preparation. Analysis was performed using a CHNS-O elemental analyser (Euro EA 3000, HEKAtech). Contents of POC and PON were corrected for blank measurements and normalised to filtered volume and cell densities to yield cellular quotas. Production rates of POC were calculated by multiplying the cellular quota with the division rate constant k of the respective incubation. Samples for determination of chlorophyll a (Chl a) were filtered onto GF/F filters (Whatman), immediately placed into liquid nitrogen and stored at −80 ∘C until analysis. Chl a was subsequently extracted in 8 mL 90 % acetone at 4 ∘C over night. Chl a concentrations were determined on a fluorometer (TD-700, Turner Designs), using an acidification step (1 M HCl) to determine phaeopigments (Knap et al., 1996).
2.4 Variable Chl a fluorescence
Photophysiological characteristics, based on photosystem II (PSII) variable Chl a fluorescence, were measured using a fast repetition rate fluorometer (FRRf; FastOcean PTX, Chelsea Technologies) in combination with a FastAct Laboratory system (Chelsea Technologies). The excitation wavelength of the fluorometer's light-emitting diodes (LEDs) was 450 nm, and the applied light intensity was 21 587 . The FRRf was used in single turnover mode, with a saturation phase comprising 100 flashlets on a 2 µs pitch and a relaxation phase comprising 40 flashlets on a 50 µs pitch. Measurements from all replicates (n=3) were conducted in a temperature-controlled chamber (± 0.2 ∘C) at the respective treatment temperature.
Table 1Seawater carbonate chemistry at the end of the experiments (n=3; mean ± 1 SD). CO2 partial pressure (pCO2) and dissolved CO2 concentrations were calculated from total alkalinity (AT) and pHtotal at 2 or 6 ∘C, a salinity of 32.7 using CO2SYS (Pierrot et al., 2006), and phosphate and silicate concentrations of 10 and 100 µmol kg−1, respectively. NA indicates that values are not available for this specific treatment.
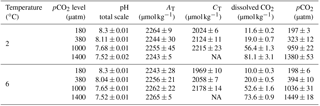
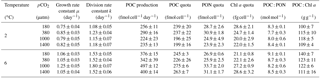
Table 2Growth rate constants μ, division rate constants k, POC production rates and cellular quota of Chl a, and POC and PON as well as their ratios of M. pusilla at the end of the experiment under the different treatment conditions (n=3; mean ± 1 SD). Results from statistical analysis can be found in Table S2.
After subtraction of a blank value, the minimum (F0 and for light- and dark-acclimated measurements, respectively) and maximum Chl a fluorescence (Fm, and for light- and dark-acclimated measurements, respectively) were estimated from iterative algorithms for the induction (Kolber et al., 1998) and relaxation phase (Oxborough, 2012) after 15 min of dark acclimation, which was sufficient to achieve a dark-acclimated state (data not shown). All fluorescence parameters were calculated by standard equations (Genty et al., 1989; Maxwell and Johnson, 2000). Maximum quantum yields of PSII (apparent PSII photochemical quantum efficiency; Fv∕Fm) were calculated as
Fluorescence-based photosynthesis–irradiance curves (PI) were conducted at six irradiances (I) between 33 and 672 , with an acclimation time of 10 min per light step. Electron transfer rate (ETR, measured in ) through PSII for each light step was calculated as follows:
Following the suggestion by Silsbe and Kromkamp (2012), the light-use efficiency (α, ) and the maximum electron transfer rates per RCII (ETRmax, ) were estimated by fitting the data to the model by Webb et al. (1974):
The light saturation index (Ek, ) was then calculated as ETRmax ∕ α. Maximum non-photochemical quenching (NPQ) of Chl a fluorescence at irradiances of 672 (i.e. the highest irradiance step of the PI curve) were calculated using the normalised Stern–Volmer coefficient, also termed NSV, as described in McKew et al. (2013):
where is the differences between measured and maximal fluorescence (Suggett et al., 2010). was measured after each light step (with a duration of 90 s).
2.5 Statistics
All data are given as the mean of three biological replicates with ± 1 standard deviation. To test for significant differences between the treatments, two-way analyses of variance (ANOVA) with additional normality (Kolmogorov–Smirnov) and post hoc (Holm–Šidák) tests were performed. The significance level was set to 0.05. Statistical analyses were performed with the program SigmaPlot (Systat Software Inc, Version 12.5).
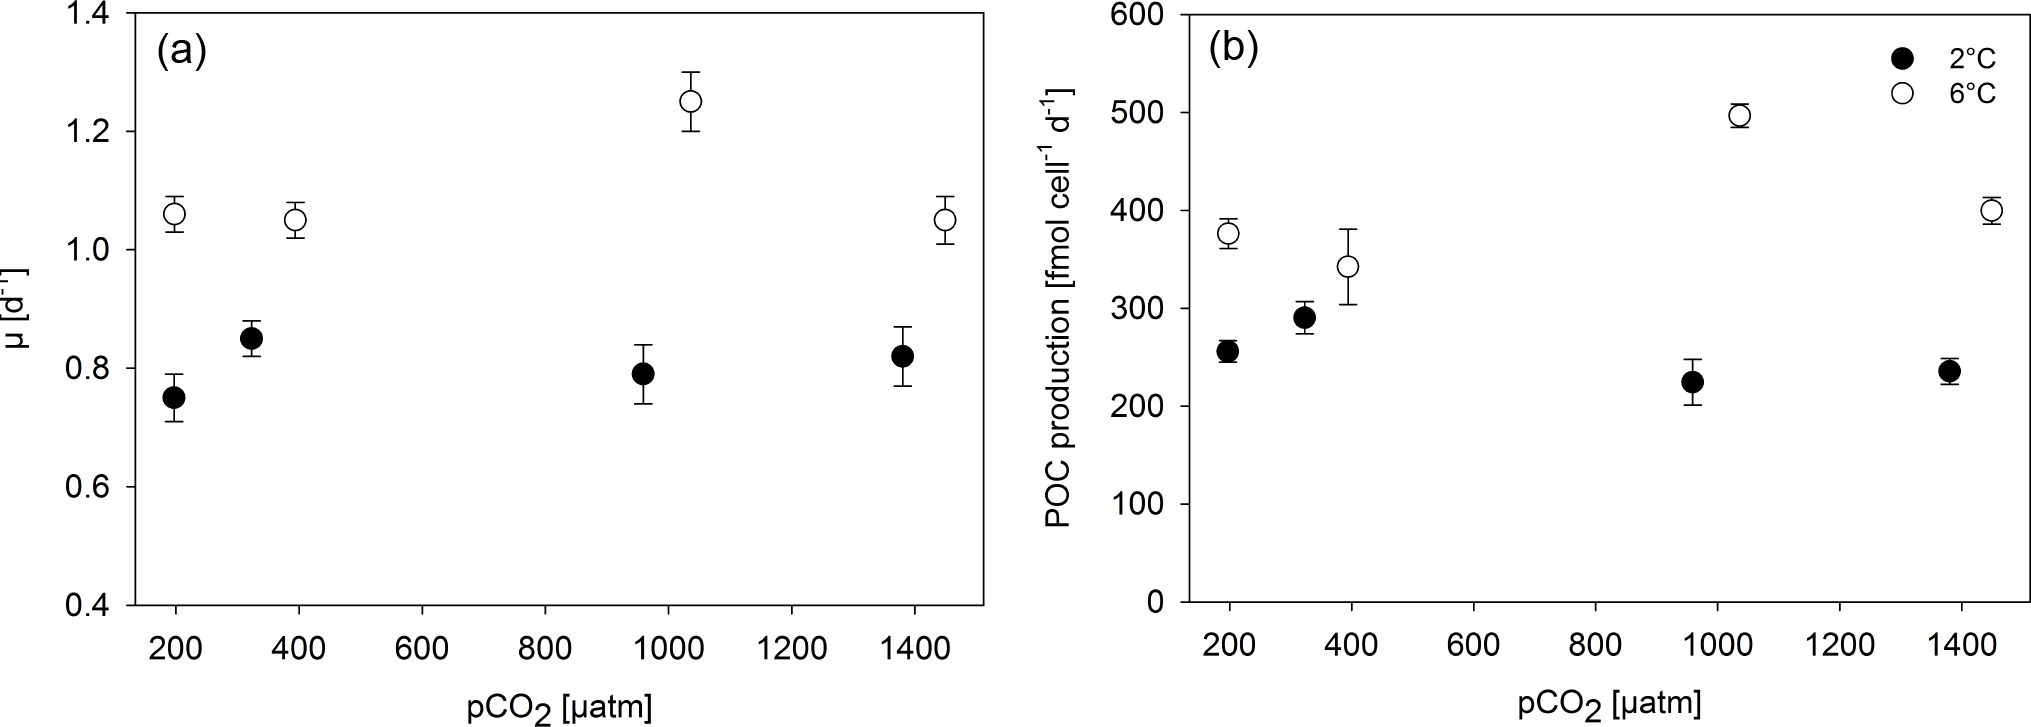
Figure 1Specific growth rate constant μ (a) and POC production (b) of M. pusilla under low (filled symbols) and high (open symbols) temperatures as a function of pCO2 (n=3; mean ± 1 SD). Results from statistical analysis can be found in Table S2.
3.1 Carbonate chemistry
Regular dilution of cultures with a pre-aerated seawater medium kept carbonate chemistry stable over the course of the experiment. More specifically, in each bottle the drift in AT and CT compared to initial values was ≤ 3 and ≤ 4 %, respectively (data not shown). Final carbonate chemistry in the 2 ∘C treatments yielded pCO2 levels of 197 ± 3, 323 ± 12, 959 ± 22 and 1380 ± 53 µatm (Table 1). In the 6 ∘C treatments, pCO2 levels were 198 ± 6, 394 ± 10, 1036 ± 31 and 1449 ± 18 µatm. Please note that the same pCO2 level translates into differing dissolved CO2 concentrations at different temperatures due to the temperature dependency of the carbonate system. Specifically, the treatment pCO2 values translated into up to 13 % lower dissolved CO2 concentrations in the 6 ∘C compared to the 2 ∘C treatment (Table 1; see Fig. S1 in the Supplement). Concurrently, the pCO2 levels at 2 ∘C corresponded to pHtotal values of 8.30 ± 0.01, 8.11 ± 0.01, 7.68 ± 0.01 and 7.52 ± 0.02, respectively. In the 6 ∘C treatment, pHtotal values of the four pCO2 treatments were 8.30 ± 0.01, 8.04 ± 0.01, 7.65 ± 0.01 and 7.52 ± 0.01, respectively.
3.2 Growth and biomass build-up
Growth rates constants of exponentially growing M. pusilla cultures were significantly affected by the applied treatments (Fig. 1, Tables 2, S1 in the Supplement). Depending on the pCO2 level, temperature increased growth by 20 to 60 % with an average of 0.80 day−1 under low and 1.10 day−1 under high temperature conditions (two-way ANOVA, F=328, p<0.001). Overall, there was also a positive pCO2 effect on growth (two-way ANOVA, F=9, p=0.001), even though no linear trends with either pCO2 or [CO2] were observed (Figs. 1, S1). The observed pCO2 responses also differed between temperature levels, indicating a significant interaction between both drivers (two-way ANOVA, F=12, p<0.001): under low temperature, growth increased significantly from 180 to 380 µatm pCO2 (post hoc, t=3.1, p=0.04), while there was a declining yet insignificant trend in growth with further increases in pCO2. Under high temperature, growth was significantly higher under 1000 compared to lower (180 µatm; post hoc, t=5.6, p<0.001) and higher pCO2 levels (1400 µatm; post hoc, t=5.9, p<0.001). Thus, warming shifted the optimum pCO2 range for growth to higher levels (Fig. 1a).
This trend was also observed in terms of POC production rates (Fig. 1b, Table 2), with significant effects of temperature (Table S1; two-way ANOVA, F=356, p<0.001), pCO2 (two-way ANOVA, F=7, p=0.003), and their interaction (two-way ANOVA, F=29, p<0.001). At low temperatures, higher production rates were observed at 180 and 380 µatm compared to those at 1000 and 1400 µatm pCO2 (post hoc tests, t=3.5, p=0.016 and t=3.0, p=0.046, respectively). At high temperatures, POC production rates were significantly higher at 1000 µatm than at all other pCO2 levels (post hoc tests, e.g. t=9.1, p<0.001 for 380 vs. 1000 µatm and t=7.4, p<0.001 for 1000 vs. 1400 µatm), again indicating an upward shift in the pCO2 optimum with warming.
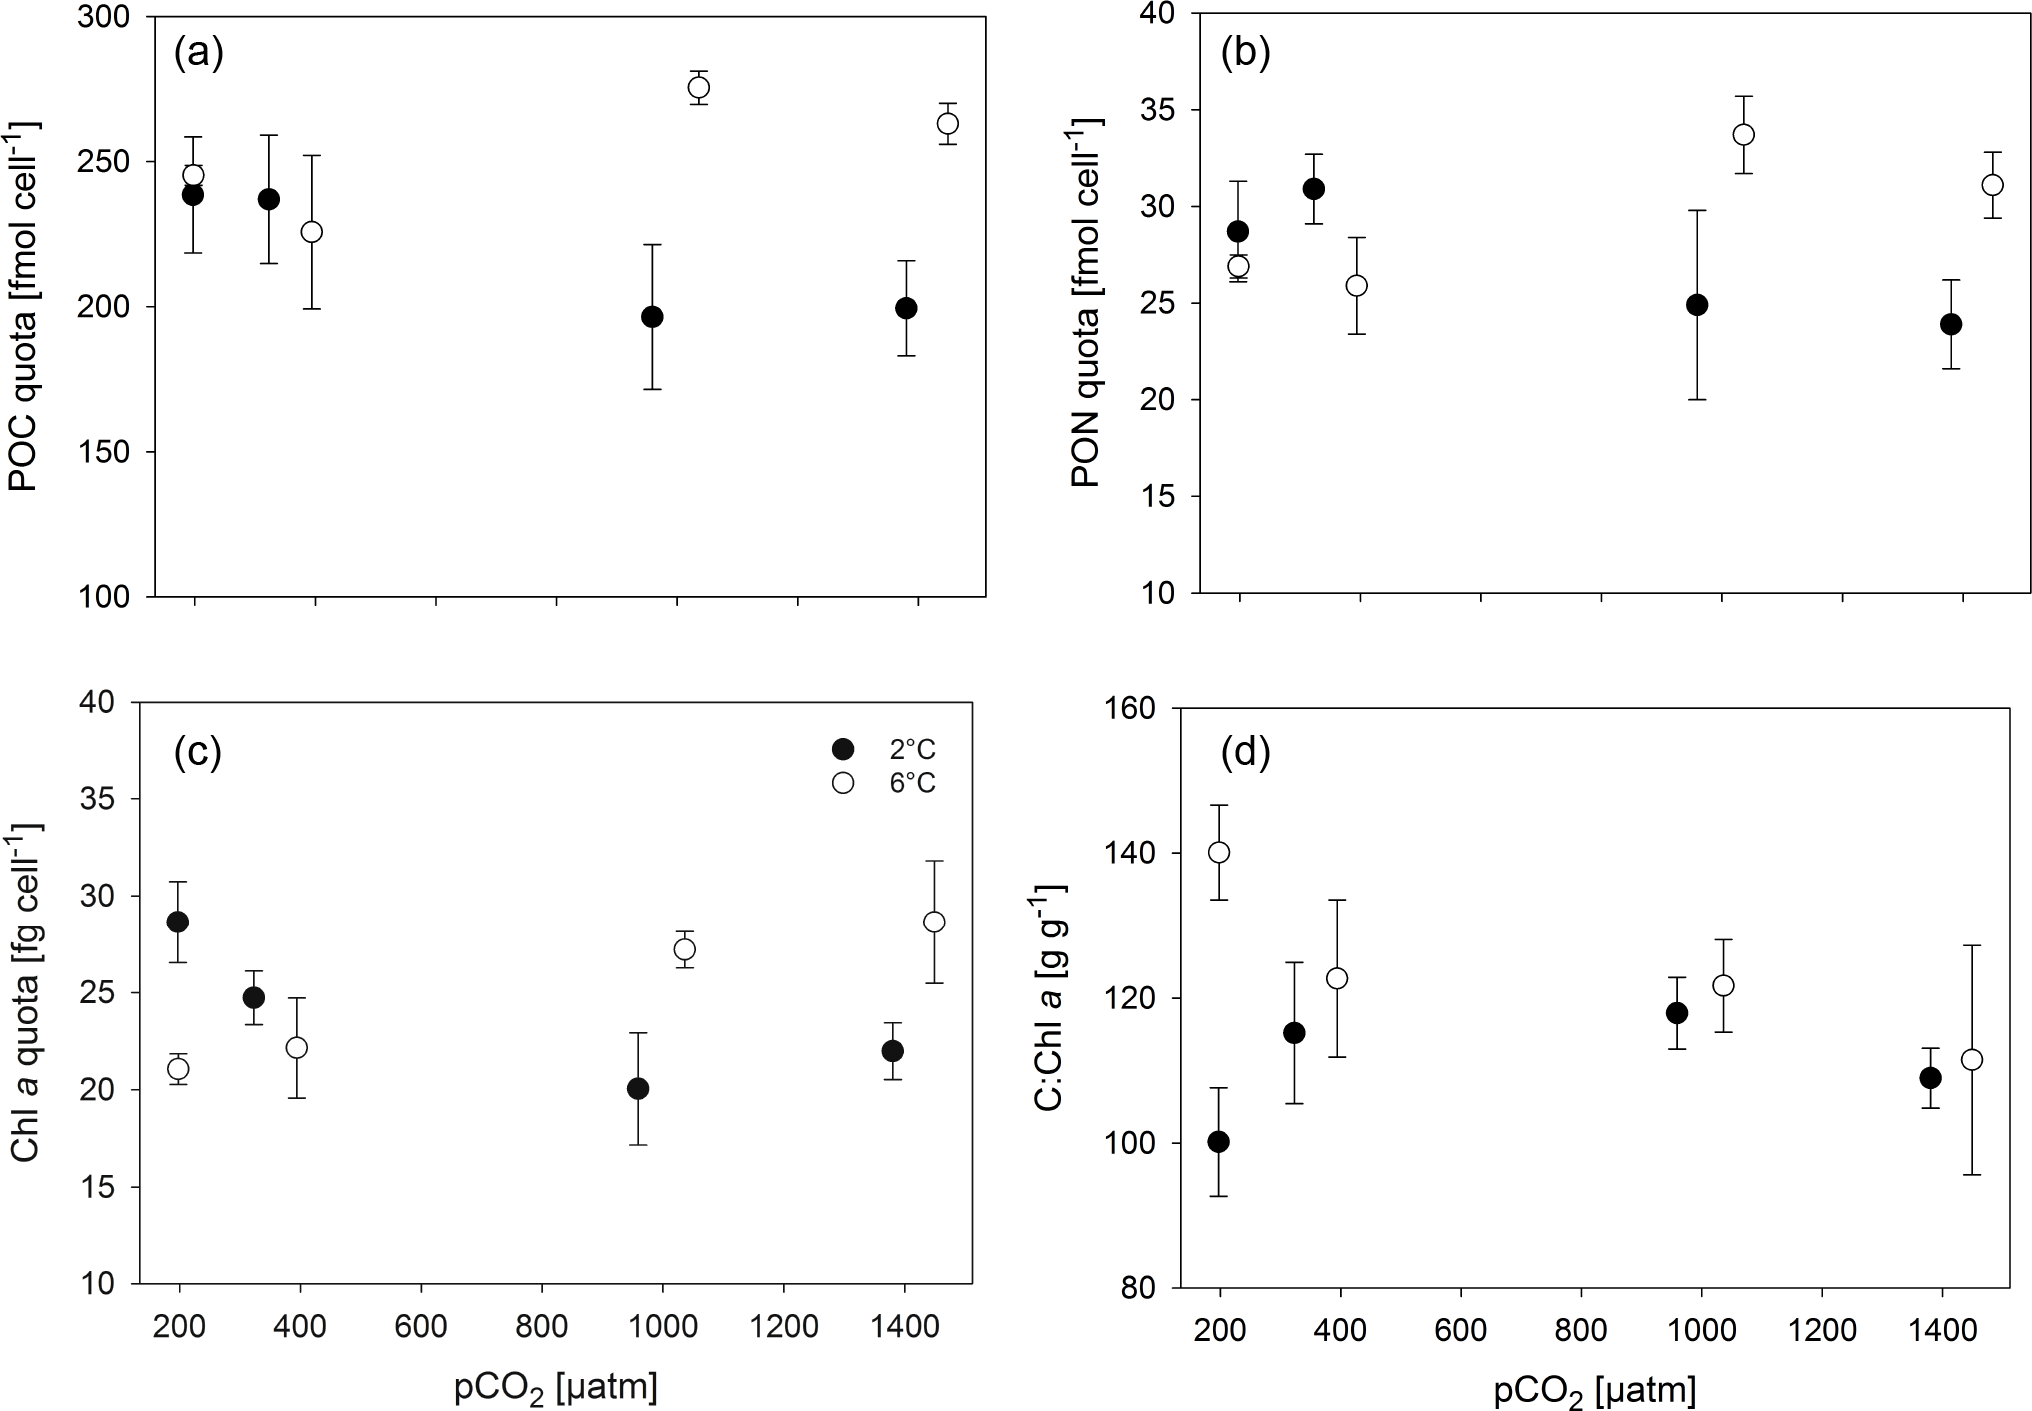
Figure 2Cellular composition, i.e. POC (a), PON (b) and Chl a quota (c) as well as C : Chl a ratios (d), of M. pusilla under low (filled symbols) and high (open symbols) temperatures as a function of pCO2 (n=3; mean ± 1 SD). Results from statistical analysis can be found in Table S2.
3.3 Cellular composition
Overall, POC quotas (Fig. 2a, Tables 2, S1) were significantly higher under elevated compared to low temperatures (two-way ANOVA, F=24, p<0.001), but no overarching trend with pCO2 was observed. Under low temperatures, cells had significantly higher POC quotas at low pCO2 levels (180 and 380 µatm) compared to high pCO2 levels (1000 and 1400 µatm; all four post hoc tests were significant, e.g. 380 vs. 1000 µatm: t=2.8, p=0.033). This trend reversed under high temperatures, where POC quota were highest under 1000 and 1400 µatm (post hoc test, t=3.5, p=0.024). Thus, temperature and pCO2 levels exhibited a significant interactive effect on POC quota (two-way ANOVA, F=10, p<0.001).
Similar trends were observed in terms of cellular PON quota (Fig. 2b, Tables 2, S1), where temperature (two-way ANOVA, F=5, p=0.045) and its interaction with pCO2 (two-way ANOVA, F=10, p<0.001) significantly affected the results. Here, opposing pCO2 effects under different temperatures were more subtle, with PON quotas under low temperatures only being significantly decreased between 380 and 1400 µatm (post hoc test, t=3.3, p=0.027), while under high temperatures PON quotas significantly increased from 180 and 380 to 1000 µatm pCO2 (post hoc tests, t=3.7, p=0.012 and t=2.8, p=0.028, respectively).
Regarding cellular Chl a quota, there were no significant effects of temperature or pCO2 alone (Fig. 2c, Tables 2, S1), but a significant interaction between the two drivers was found (two-way ANOVA, F=18, p<0.001): under low temperatures, Chl a quotas decreased from low (180 µatm) to high pCO2 levels (1000 and 1400 µatm; post hoc tests, t=5.0, p<0.001 and t=3.9, p=0.006, respectively). Under high temperatures, the opposite trend was observed, where Chl a quotas increased from low (180 and 380 µatm) to high pCO2 levels (1000 and 1400 µatm; all four post hoc tests significant, e.g. 380 vs. 1000 µatm: t=3.0, p=0.027).
Molar C:N ratios of the biomass (Tables 2, S1) increased with temperature (two-way ANOVA, F=14, p=0.002), yet this overall difference was mainly driven by results at low pCO2 levels (180 and 380 µatm; post hoc tests, t=2.7, p=0.017 and t=3.5, p=0.003, respectively). By itself, pCO2 did not significantly affect C:N ratios.
The ratios of C : Chl a (Fig. 2d, Tables 2, S1) were elevated under high compared to low temperature conditions (two-way ANOVA, F=14, p=0.002), an effect that was most pronounced at pCO2 levels of 180 µatm (post hoc test, t=5.5, p<0.001). While there was no effect of pCO2 on C : Chl a at low temperature, C : Chl a decreased with increasing pCO2 at high temperature (two-way ANOVA, interaction term, F=6, p=0.007; 180 vs. 1400 µatm at 6 ∘C post hoc test, t=3.9, p=0.008).
Table 3FRR fluorometrical PSII photochemistry measurements – PSII quantum yield efficiency Fv∕Fm (dimensionless), functional absorption cross section (σPSII) (nm−2 PSII−1), rate of PSII re-opening (τES, ms), maximum non-photochemical quenching at 672 (NPQmax, dimensionless), maximum light-use efficiency (initial slope α, ), maximal absolute electron transfer rates through PSII (ETRmax, ), and the light saturation index (EK, ) under the different temperature and pCO2 treatments (n=3; mean ± 1 SD). Results from statistical analyses can be found in Table S2.
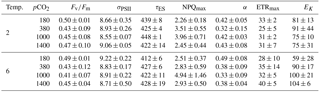
3.4 Chl a fluorescence-based photophysiology
The effects of the applied treatments on photophysiology were studied by means of FRRf, which investigates photochemistry at photosystem II (PSII). No effects of the applied treatments were observed in most parameters investigated (Tables 3, S1). This was true for the dark-acclimated quantum yield efficiency of PSII (Fv∕Fm), which was similar in all treatments with values of 0.45 ± 0.06, as well as for absorption cross sections of PSII light harvesting (σPSII).
Furthermore, the fitted parameters of FRRf-based PI curves (α, ETRmax and EK) were independent of the experimental treatments (Tables 3, S1). In contrast, the rate constant of the reopening of PSII reaction centres (τES; Tables 3, S1) was slightly yet significantly smaller under high temperatures (two-way ANOVA, F=6, p=0.029), even though this overall response also depended on the applied pCO2 levels (two-way ANOVA, interaction term, F=4, p=0.033).
Maximum non-photochemical quenching (NPQmax; Tables 3, S1) increased significantly with pCO2 (Table S1; two-way ANOVA, F=0, p=0.002) while temperature had no effect. Post hoc tests revealed that this response was mainly driven by high NPQmax values at 1000 µatm, which were significantly higher than in any other pCO2 treatment (e.g. t=4.1, p=0.006 for 380 vs. 1000 µatm and t=3.1, p=0.030 for 1000 vs. 1400 µatm).
4.1 Micromonas pusilla benefits from warming
We observed a strong stimulation of growth rates and biomass build-up with increasing temperature (Fig. 1, Table 2). Even though the isolate stems from 1.8 ∘C water temperature, the beneficial effects of warming from 2 to 6 ∘C are not surprising: M. pusilla is known to dominate Arctic phytoplankton assemblages in the summer and autumn situations (Lovejoy et al., 2007; Marquardt et al., 2016) when surface temperatures of 6 ∘C or more can be reached (Hegseth et al., 2018). Our results are also in line with mesocosm experiments that indicate stimulatory effects of warming on picoplankton abundances (Daufresne et al., 2009; Sommer et al., 2015) as well as with the temperature optimum of 6–8 ∘C observed for another Arctic strain of M. pusilla (Lovejoy et al., 2007).
Below the temperature optimum of a cell, warming causes an acceleration of the entire metabolism, as enzymatic reactions run faster under these conditions (Eppley, 1972; Brown et al., 2004). In this study, warming caused higher growth rates, POC quotas and biomass production (Fig. 2, Tables 2, S1), indicating that particularly the fixation and storage of carbon was facilitated by increasing temperature. Electron transport processes, however, were largely independent of temperature (Tables 3, S1). Thus, temperature affected the balance between electron transport (“light reaction”) and carbon fixation in the Calvin cycle (“dark reactions”). Especially under relatively low temperatures, as investigated here, warming can decrease the excitation pressure on the electron transport chain of the photosystems by increasing the temperature-limited turnover rates of enzyme reactions such as RuBisCO (Mock and Hoch, 2005). Thus, cells grown under low temperatures need to invest relatively more energy into biosynthesis than into photochemistry compared to cells grown under high temperatures (Toseland et al., 2013). While it has been shown that Antarctic diatoms can compensate for slow RuBisCO kinetics by increasing the expression of this enzyme (Young et al., 2014), it is unknown whether such acclimation responses also occur in prasinophytes. Regarding the C : Chl a ratio, this can be taken as an indicator of how many resources the cell retains as carbon biomass (e.g. structural and storage compounds) relative to how much is invested into its light harvesting capacities (Halsey and Jones, 2015). In this study, the strong temperature-dependent increase in C : Chl a (Fig. 2, Table S1) under potentially limiting pCO2 levels of 180 µatm suggests that under warming, the balance between light harvesting and carbon fixation was indeed more beneficial for biomass build-up. Furthermore, elevated temperature significantly decreased τES (Tables 3, S1), which can serve as a proxy of the rate at which downstream processes can remove electrons from PSII (Kolber et al., 1998). Thus, our results indicate that the drainage of electrons into carbon fixation was faster under warmer conditions, explaining the higher growth and biomass production under these conditions.
4.2 Warming shifts CO2 optima towards higher pCO2 levels
Under 6 ∘C and pCO2 levels expected to be reached by the end of this century, OA had a significantly positive effect on growth and biomass build-up (Fig. 1). This finding is in line with previous studies, which have shown that picoeukaryotes can benefit strongly from OA in both laboratory and mesocosm studies (Meakin and Wyman, 2011; Newbold et al., 2012; Schaum et al., 2012; Brussaard et al., 2013; Maat et al., 2014; Schulz et al., 2017). Such positive response to OA could indicate that picoeukaryotes such as M. pusilla are mainly dependent on diffusive CO2 supply and thus directly benefit from higher CO2 concentrations (Brussaard et al., 2013; Schulz et al., 2013, 2017). While this could be related to the large surface-to-volume ratio of small cells, opposite trends within the group of diatoms (i.e. higher sensitivity of larger compared to smaller diatoms; Wu et al., 2014; Sett et al., 2018) suggest more complex underlying mechanisms at play.
Despite this overall effect, growth rates of M. pusilla tended to follow a non-linear response curve over the tested range of glacial to elevated future pCO2 levels (i.e. 180 to 1400 µatm), i.e. growth increased with increasing pCO2 from low to intermediate, but decreased again under the highest pCO2 levels (Fig. 1). Such an optimum behaviour can be expected for most environmental drivers (Harley et al., 2017) and has previously been observed in response to OA (Sett et al., 2014; Wolf et al., 2018). The response patterns in these studies were attributed to a combination of beneficial effects of rising pCO2 under potentially carbon-limiting conditions for photosynthesis, and negative effects of declining pH on cellular homeostasis and enzyme performance, which manifest mainly at high pCO2 (Bach et al., 2013). This non-linearity in the observed pCO2 effects emphasises the importance of experiments with more than two pCO2 levels in order to properly describe OA-response patterns of organisms.
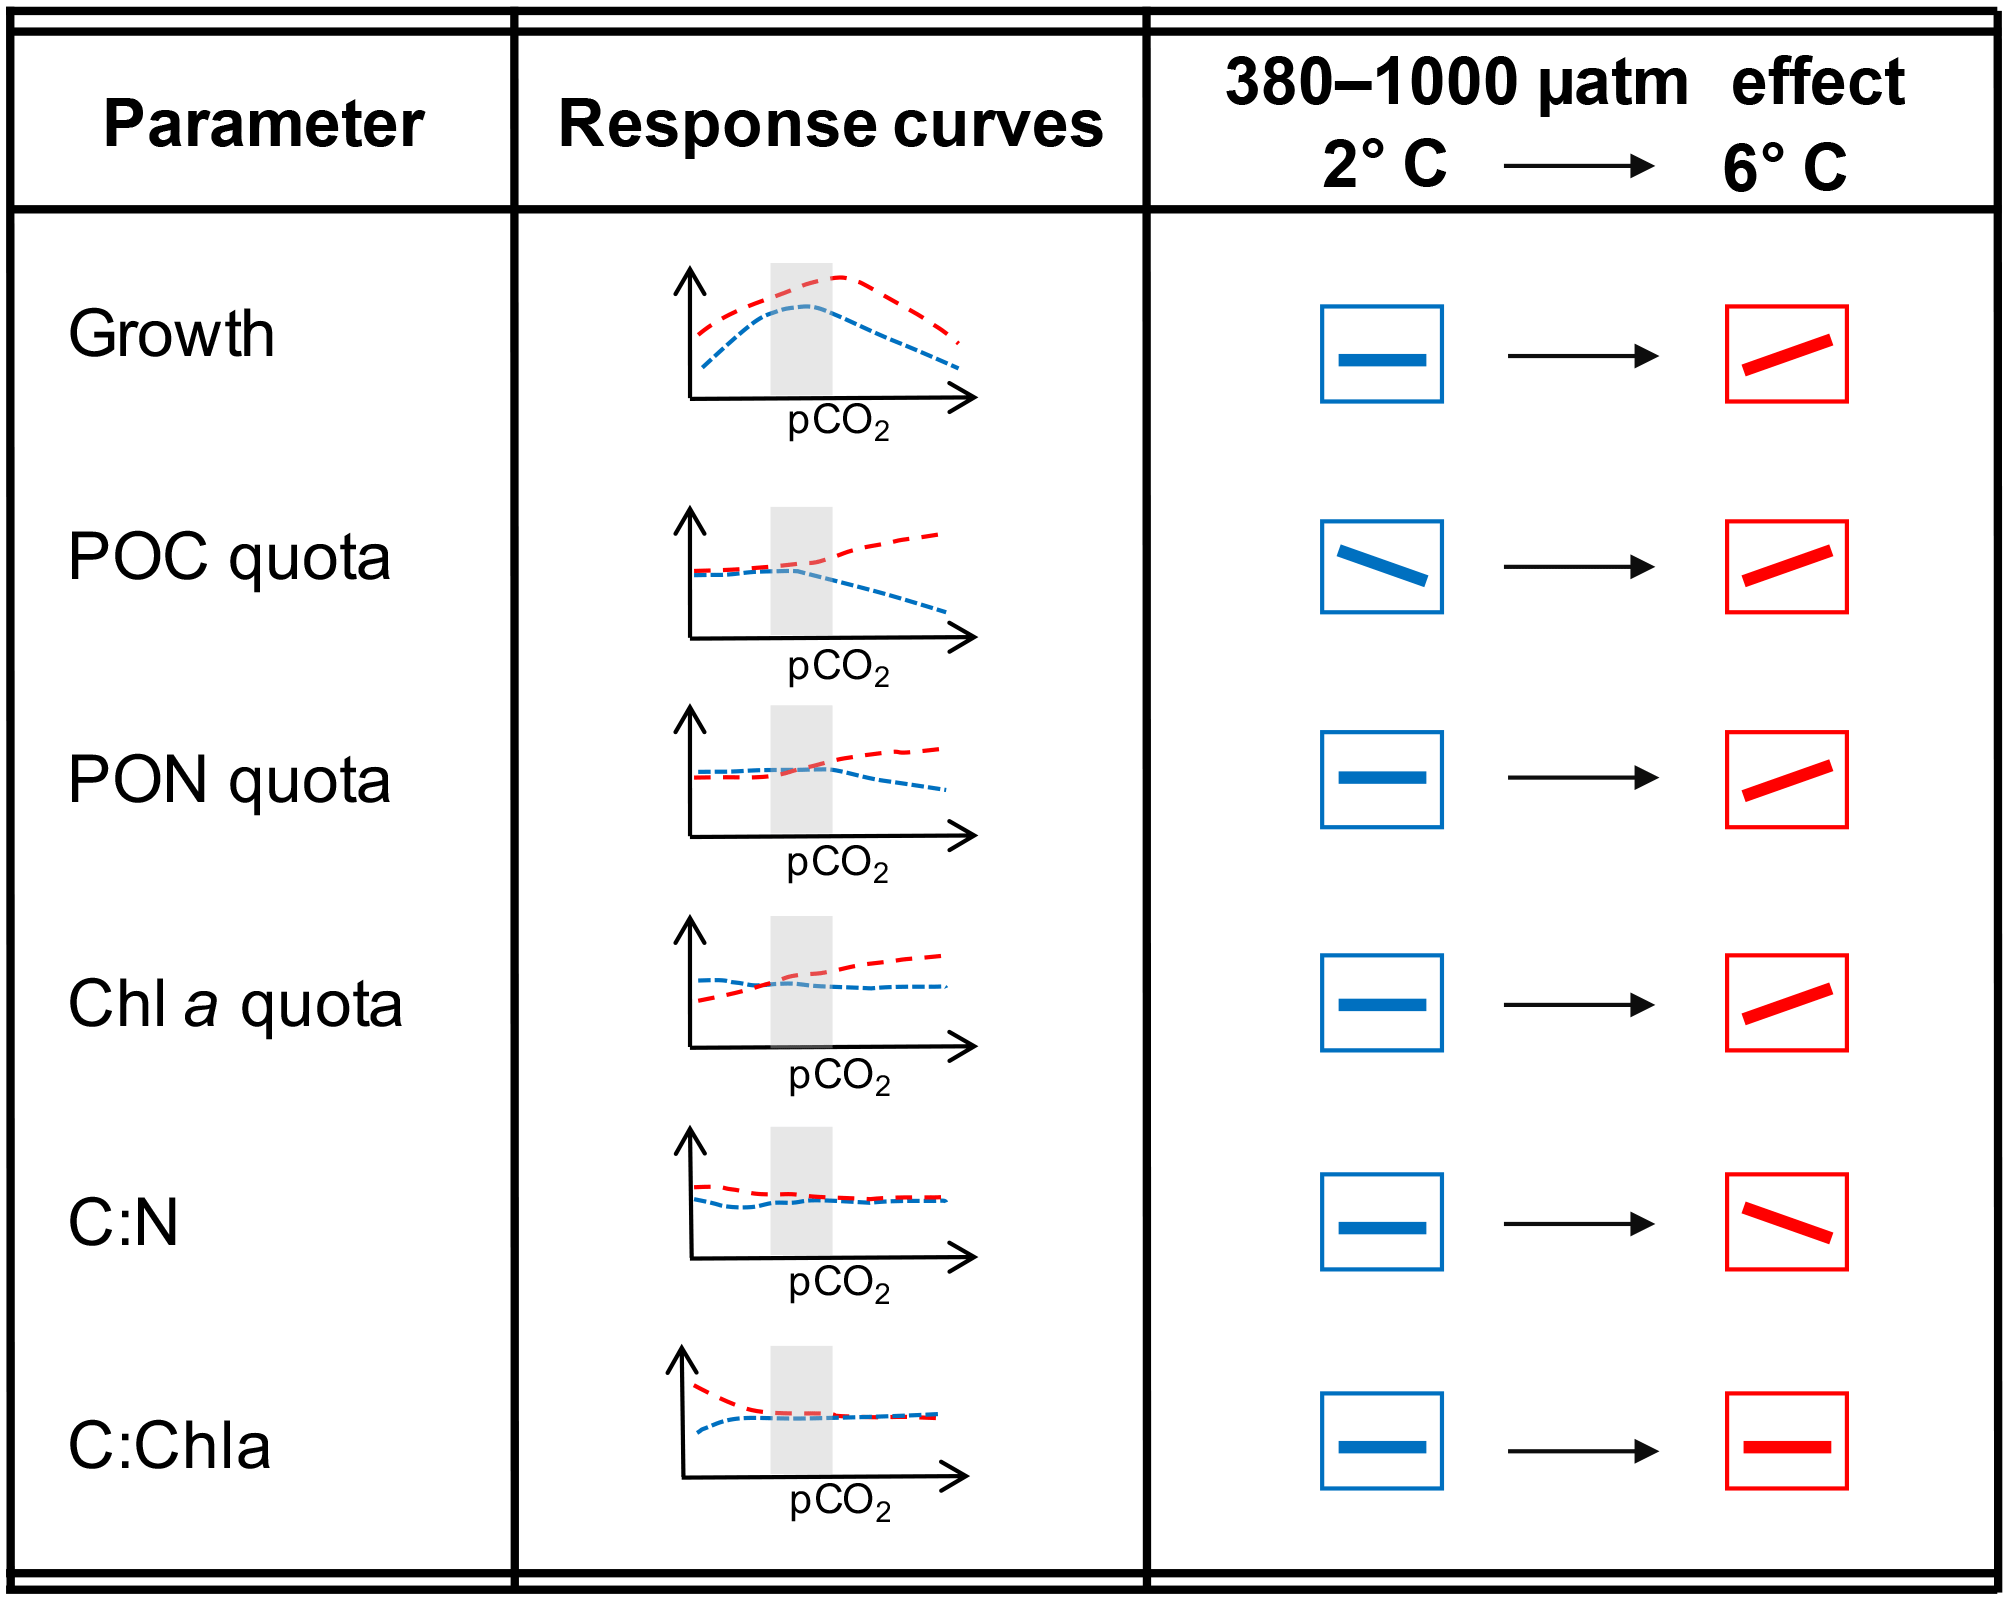
Figure 3Schematic illustration of results for both temperatures over the entire range of pCO2 levels as well as focusing on the responses between 380 and 1000 µatm (as the representation for commonly used OA treatments) and their modulation by temperature.
On a more general level, apparent discrepancies between OA studies can be attributed to actual differences in the environmental settings and their interactive effects with pCO2 (Riebesell and Gattuso, 2015). When comparing the two most commonly applied pCO2 levels, i.e. the present-day and the anticipated end-of-century situation, the effects of OA on most of the investigated physiological parameters are reversed under 6 compared to 2 ∘C (Fig. 3). This illustrates how difficult it is to infer responses to OA from experiments applying only one set of environmental conditions. It is also noteworthy that the combination of OA and warming led to more densely packed cells (no change in cell size based on flow cytometric measurements; data not shown) with similar stoichiometry compared to the control treatment (Table 2). This indicates that cells managed to cope well with the experienced future conditions. Furthermore, warming altered the OA-dependent change in most of the investigated parameters in a direction that indicates higher fitness compared to low temperatures (e.g. higher growth rates and higher elemental quota; Fig. 3; Hoppe et al., 2018b). Thus, the increase in growth under future compared to ambient conditions was larger than what would be expected by the respective responses to warming and OA in isolation, indicating synergistic beneficial effects of both drivers.
4.3 Potential mechanism underlying the interaction between warming and OA
The observed synergistic effects could be explained by their specific impacts on carbon acquisition and fixation. As outlined in the introduction, light and dark reaction of photosynthesis need to be balanced to achieve high biomass production while avoiding photodamage (Behrenfeld et al., 2008). According to our data, this balance is shifted towards higher biomass production rates under warming and OA.
At higher temperatures, seawater CO2 concentrations were lower than under colder conditions (Table 1; Zeebe and Wolf-Gladrow, 2001). At the same time, warming from 2 to 6 ∘C caused up to 60 % higher growth and 110 % higher biomass build-up rates (Fig. 1, Table 2). Furthermore, the decrease in τES indicates a faster transfer of photochemical energy into downstream processes such as RuBisCO activity (Table 3). Increased carbon demand in concert with lower carbon supply at higher temperatures thus increases the risk of CO2 shortage in the cell, which in turn causes OA to have larger effects than at colder temperatures. Moreover, warming changes the kinetics of carbon fixation, with RuBisCO increasing its maximum turnover rates but decreasing its affinity for CO2 (Young et al., 2014). At higher temperatures, cells thus have the potential for higher carboxylation rates provided sufficient CO2 is available (Kranz et al., 2015). Under elevated pCO2 levels, diffusive CO2 supply increases and/or costs for active carbon acquisition decrease. Consequently, the positive effect of increasing temperature on the carbon fixation rate can develop its full potential under OA.
In conclusion, elevated catabolic activity under warmer conditions can explain the observed upward shift in the CO2 optimum of growth with increasing temperature (Fig. 1), as the corresponding higher carbon demand causes CO2 fixation to saturate under higher pCO2 levels. In combination with a faster and more efficient machinery for pH homeostasis at elevated temperatures (Morgan-Kiss et al., 2006), this could explain why declining growth rates were only observed at relatively higher pCO2 levels compared to those under low temperature conditions (Fig. 2).
4.4 Implications for the current and future Arctic pelagic ecosystem
Picoeukaryotes such as M. pusilla are considered to be potential winners of climate change: they are not only thriving in warmer, more stratified environments, which are predicted to further expand in the future, but also seem to benefit from OA (Li et al., 2009; Schulz et al., 2017). Our results for M. pusilla confirm beneficial effects of warming and OA on growth and biomass production under nutrient-replete conditions (Fig. 1, Table 2). Hence, in warmer spring conditions of the future, this species may experience growth stimulation under OA, potentially increasing its importance early in the growing season. Currently, M. pusilla already dominates Arctic phytoplankton assemblages in the nutrient-limited summer and autumn situations, which were not investigated in this study. Regarding the importance of nutrient availability, laboratory experiments found beneficial OA effects on M. pusilla primary production to persist also under P limitation (Maat et al., 2014), while in a mesocosm community, OA-dependent increases in M. pusilla abundances disappeared when the system ran into P and N co-limitation (Engel et al., 2008). Thus, it remains to be seen how the combined effects of warming and OA manifest under low nutrient conditions as well as how the responses may depend on sources and types of nutrients (e.g. mixing-delivered nitrate vs. regenerated ammonium).
A species' success in the environment does not only depend on individual performance, but also on how it compares to that of competing species. When we compare our results with the responses of the Arctic diatom Thalassiosira hyalina, isolated from the same location and exposed to the same experimental conditions (Wolf et al., 2018), the diatom had higher growth rates than the picoeukaryote under most treatment conditions, as can be expected for nutrient-replete conditions (Sarthou et al., 2005). The relative increase in growth rates from ambient (2 or 3 ∘C and 380 µatm pCO2) to future conditions (6 ∘C and 1000 µatm pCO2) was, however, much higher for M. pusilla than for T. hyalina. The fact that our experiments were conducted under nutrient-replete conditions, which typically favour diatoms over picoeukaryotes, may indicate an even stronger increase in fitness (Collins et al., 2014) and could mean that M. pusilla gains another competitive advantage over phytoplankton like diatoms in the future, in addition to those resulting from changes in stratification (Li et al., 2009). Thus, our findings suggest higher picoplankton contribution to future Arctic phytoplankton assemblages under non-limiting conditions, e.g. early in the growing season when picoeukaryotes can already contribute quite substantially to the phytoplankton standing stocks (Marquardt et al., 2016; Paulsen et al., 2015). How such competition between diatoms and picoeukaryotes would manifest under nutrient-depleted conditions that strongly favour M. pusilla is currently unknown.
Even though picoeukaryotes seem to contribute more to the downward export of organic matter than previously assumed (Waite et al., 2000; Richardson and Jackson, 2007), in comparison to diatoms for example, they are less efficient vectors for carbon export to depth and have a lower energy transfer along trophic levels (Sherr et al., 2003). Consequently, Arctic food webs dominated by picoeukaryotes would look very different from those fuelled by diatom production (Sherr et al., 2003; Paulsen et al., 2015). Due to its motility and capability to grow mixotrophically, M. pusilla is characterized by an exceptionally high cellular C:N ratio compared to other Arctic phytoplankton (Table 2; Halsey et al., 2014; McKie-Krisberg and Sanders, 2014). An increased importance of this species would thus not only affect the food web due to its small size and concurrent grazer preferences, but also in terms of food quality (van de Waal and Boersma, 2012). The expected higher growth rates and thus abundances of this species may thus strengthen the Arctic microbial food web. Together with a concurrent weakening of the classical diatom-fuelled food web, this could have severe implications for the flow of energy and nutrients through future marine Arctic ecosystems (Post, 2016).
This study is the first to show synergistic effects of warming and OA on M. pusilla, one of the most abundant species of the worlds' oceans. Individually, both warming and OA cause more efficient biomass build-up under nutrient-replete conditions. Beneficial effects manifest, however, even more strongly in combination, when facilitated carbon acquisition (e.g. due to higher diffusive CO2 supply) co-occurs with higher fixation rates (e.g. due to higher turnover-rates of RuBisCO). Our results provide an explanation for the observations of previous mesocosm studies, which indicated beneficial effects of OA and warming on M. pusilla and other picoeukaryotes. Characterising the responses of this key Arctic species to warming and OA will help to develop mechanistic phytoplankton functional types and more realistic model representation of phytoplankton assemblages as well as their responses to multiple drivers. Future studies are needed to elucidate further multifactorial environmental changes, addressing both abiotic (e.g. changes in light and nutrients) as well as biotic (e.g. heterotrophy, competition, grazers, viruses) interactions.
The raw data of this study are available in the PANGAEA data repository with the identifier https://doi.org/10.1594/PANGAEA.892370 (Hoppe et al., 2018a).
The supplement related to this article is available online at: https://doi.org/10.5194/bg-15-4353-2018-supplement.
CJMH and BR designed the study. CJMH and CMF conducted the experiment. CJMH analysed the data and prepared the paper with contributions from BR and CMF.
The authors declare that they have no conflict of interest.
We are grateful for field support by the 2014/15 station team of the AWIPEV
base in Ny-Ålesund (Svalbard) as well as Klara Wolf's help with strain
isolation and maintenance of M. pusilla cultures. We thank Uwe John and Nancy Kühne
for sequencing and help with the molecular strain identification.
Furthermore, Laura Wischnewski, Anja Terbrüggen and Marcel Machnik are
acknowledged for their help with sample analyses.
The article processing charges for this open-access
publication
were covered by a Research
Centre of the Helmholtz Association.
Edited by: Katja Fennel
Reviewed by: Douglas Campbell and two anonymous referees
AMAP: AMAP Assessment 2013: Arctic Ocean Acidification, Arctic Monitoring and Assessment Programme (AMAP), Oslo, Norway, 99, 2013.
Arrigo, K. R., van Dijken, G., and Pabi, S.: Impact of a shrinking Arctic ice cover on marine primary production, Geophys. Res. Lett., 35, L19603, https://doi.org/10.1029/2008gl035028, 2008.
Bach, L. T., Mackinder, L. C. M., Schulz, K. G., Wheeler, G., Schroeder, D. C., Brownlee, C., and Riebesell, U.: Dissecting the impact of CO2 and pH on the mechanisms of photosynthesis and calcification in the coccolithophore Emiliania huxleyi, New Phytol., 199, 121–134, https://doi.org/10.1111/nph.12225, 2013.
Behrenfeld, M. J., Halsey, K. H., and Milligan, A. J.: Evolved physiological responses of phytoplankton to their integrated growth environment, Philos. T. R. Soc. B, 363, 2687–2703, https://doi.org/10.1098/rstb.2008.0019, 2008.
Berge, J., Daase, M., Renaud, P. E., Ambrose Jr., W. G., Darnis, G., Last, K. S., Leu, E., Cohen, J. H., Johnsen, G., Moline, M. A., Cottier, F., Varpe, Ø., Shunatova, N., Bałazy, P., Morata, N., Massabuau, J.-C., Falk-Petersen, S., Kosobokova, K., Hoppe, C. J. M., Węsławski, J. M., Kukliński, P., Legeżyńska, J., Nikishina, D., Cusa, M., Kędra, M., Włodarska-Kowalczuk, M., Vogedes, D., Camus, L., Tran, D., Michaud, E., Gabrielsen, T. M., Granovitch, A., Gonchar, A., Krapp, R., and Callesen, T. A.: Unexpected Levels of Biological Activity during the Polar Night Offer New Perspectives on a Warming Arctic, Curr. Biol., 25, 2555–2561, https://doi.org/10.1016/j.cub.2015.08.024, 2015.
Brewer, P. G., Bradshaw, A. L., and Williams, R. T.: Measurement of total carbon dioxide and alkalinity in the North Atlantic ocean in 1981, in: The Changing Carbon Cycle – A Global Analysis edited by: Trabalka, J. R. and Reichle, D. E., Springer Verlag, Heidelberg Berlin, 358–381, 1986.
Brown, J. H., Gillooly, J. F., Allen, A. P., Savage, V. M., and West, G. B.: Toward a metabolic theorie of ecology, Ecology, 85, 1771–1789, https://doi.org/10.1890/03-9000, 2004.
Brussaard, C. P. D., Noordeloos, A. A. M., Witte, H., Collenteur, M. C. J., Schulz, K., Ludwig, A., and Riebesell, U.: Arctic microbial community dynamics influenced by elevated CO2 levels, Biogeosciences, 10, 719–731, https://doi.org/10.5194/bg-10-719-2013, 2013.
Collins, M., Knutti, R., Arblaster, J., Dufresne, J.-L., Fichefet, T., Friedlingstein, P., Gao, X., Gutowski, W., Johns, T., and Krinner, G.: Long-term climate change: projections, commitments and irreversibility, in: Climate Change 2013: The Physical Science Basis, IPCC Working Group I Contribution to AR5, edited by: IPCC, Cambridge University Press, Cambridge, 2013.
Collins, S., Rost, B., and Rynearson, T. A.: Evolutionary potential of marine phytoplankton under ocean acidification, Evol. Appl., 7, 140–155, https://doi.org/10.1111/eva.12120, 2014.
Daufresne, M., Lengfellner, K., and Sommer, U.: Global warming benefits the small in aquatic ecosystems, P. Natl. Acad. Sci. USA, 106, 12788–12793, https://doi.org/10.1073/pnas.0902080106, 2009.
Dickson, A. G.: Standard potential of the reaction: AgCl(s) + 1/2 H2(g) = Ag(s) + HCl(aq), and the standard acidity constant of the ion in synthetic seawater from 273.15 to 318.15 K, J. Chem. Thermodyn., 22, 113–127, https://doi.org/10.1016/0021-9614(90)90074-Z, 1990.
Dickson, A. G. and Millero, F. J.: A comparison of the equilibrium constants for the dissociation of carbonic acid in seawater media, Deep-Sea Res., 34, 1733–1743, 1987.
Dickson, A. G., Sabine, C. L., and Christian, J. R.: Guide to best practices for ocean CO2 measurements, North Pacific Marine Science Organization, Sidney, British Columbia, 191, 2007.
Engel, A., Schulz, K. G., Riebesell, U., Bellerby, R., Delille, B., and Schartau, M.: Effects of CO2 on particle size distribution and phytoplankton abundance during a mesocosm bloom experiment (PeECE II), Biogeosciences, 5, 509–521, https://doi.org/10.5194/bg-5-509-2008, 2008. .
Eppley, R. W.: Temperature and phytoplankton growth in the sea, Fish. B.-NOAA, 70, 1063–1085, 1972.
Flynn, K. J., Blackford, J. C., Baird, M. E., Raven, J. A., Clark, D. R., Beardall, J., Brownlee, C., Fabian, H., and Wheeler, G. L.: Changes in pH at the exterior surface of plankton with ocean acidification, Nat. Clim. Change, 2, 510–513, 2012.
Genty, B., Briantais, J.-M., and Baker, N. R.: The relationship between the quantum yield of photosynthetic electron transport and quenching of chlorophyll fluorescence, BBA-Gen. Subjects, 990, 87–92, https://doi.org/10.1016/s0304-4165(89)80016-9, 1989.
Guillard, R. R. L. and Ryther, J. H.: Studies of marine planktonic diatoms. I. Cyclothella nana Hustedt and Detonula confervacea Cleve, Can. J. Microbiol., 8, 229–239, 1962.
Halsey, K., Milligan, A., and Behrenfeld, M.: Contrasting Strategies of Photosynthetic Energy Utilization Drive Lifestyle Strategies in Ecologically Important Picoeukaryotes, Metabolites, 4, 260–280, 2014.
Halsey, K. H. and Jones, B. M.: Phytoplankton Strategies for Photosynthetic Energy Allocation, Annu. Rev. Mar. Sci., 7, 265–297, https://doi.org/10.1146/annurev-marine-010814-015813, 2015.
Harley, C. D. G., Connell, S. D., Doubleday, Z. A., Kelaher, B., Russell, B. D., Sarà, G., and Helmuth, B.: Conceptualizing ecosystem tipping points within a physiological framework, Ecol. Evol., 7, 6035–6045, https://doi.org/10.1002/ece3.3164, 2017.
Hegseth, E. N., Assmy, P., Wiktor, J., Kristiansen, S., Leu, E., Tverberg, V., Gabrielsen, G. W., Skogseth, R., and Cottier, F. R.: Phytoplankton seasonal dynamics in Kongsfjorden, Svalbard and the adjacent shelf, in: The Ecosystem of Kongsfjorden, Svalbard, edited by: Hop, H. and Wiencke, C., Springer, Berlin, in press, 2018.
Hoppe, C. J. M., Langer, G., Rokitta, S. D., Wolf-Gladrow, D. A., and Rost, B.: Implications of observed inconsistencies in carbonate chemistry measurements for ocean acidification studies, Biogeosciences, 9, 2401–2405, https://doi.org/10.5194/bg-9-2401-2012, 2012.
Hoppe, C. J. M., Holtz, L.-M., Trimborn, S., and Rost, B.: Ocean acidification decreases the light-use efficiency in an Antarctic diatom under dynamic but not constant light, New Phytol., 207, 159–171, https://doi.org/10.1111/nph.13334, 2015.
Hoppe, C. J. M., Flintrop, C., and Rost, B.: Interactive effects of warming and ocean acidification on the Arctic picoeukaryote Micromonas pusilla, PANGAEA, https://doi.org/10.1594/PANGAEA.892370, DOI registration in progress, 2018a.
Hoppe, C. J. M., Wolf, K. K. E., Schuback, N., Tortell, P. D., and Rost, B.: Compensation of ocean acidification effects in Arctic phytoplankton assemblages, Nat. Clim. Change, 8, 529–533, https://doi.org/10.1038/s41558-018-0142-9, 2018b.
Hussherr, R., Levasseur, M., Lizotte, M., Tremblay, J.-É., Mol, J., Thomas, H., Gosselin, M., Starr, M., Miller, L. A., Jarniková, T., Schuback, N., and Mucci, A.: Impact of ocean acidification on Arctic phytoplankton blooms and dimethyl sulfide concentration under simulated ice-free and under-ice conditions, Biogeosciences, 14, 2407–2427, https://doi.org/10.5194/bg-14-2407-2017, 2017.
Knap, A., Michaels, A., Close, A., Ducklow, H., and Dickson, A.: Protocols for the Joint Global Ocean Flux Study (JGOFS) Core Measurements, UNESCO, Paris, France, 170, 1996.
Kolber, Z. S., Prasil, O., and Falkowski, P. G.: Measurements of variable chlorophyll fluorescence using fast repetition rate techniques. I. Defining methodology and experimental protocols, Biochem. Biophys. Acta, 1367, 88–106, 1998.
Kranz, S. A., Young, J. N., Hopkinson, B. M., Goldman, J. A. L., Tortell, P. D., and Morel, F. M. M.: Low temperature reduces the energetic requirement for the CO2 concentrating mechanism in diatoms, New Phytol., 205, 192–201, https://doi.org/10.1111/nph.12976, 2015.
Levitt, J.: Responses of Plants to Environmental Stress, Volume 1: Chilling, Freezing, and High Temperature Stresses, Academic Press, Cambridge, USA, 1980.
Li, W. K. W., McLaughlin, F. A., Lovejoy, C., and Carmack, E. C.: Smallest Algae Thrive As the Arctic Ocean Freshens, Science, 326, 539, https://doi.org/10.1126/science.1179798, 2009.
Lovejoy, C.: Changing Views of Arctic Protists (Marine Microbial Eukaryotes) in a Changing Arctic, Acta Protozool., 53, 91–100, https://doi.org/10.4467/16890027ap.14.009.1446, 2014.
Lovejoy, C., Vincent, W. F., Bonilla, S., Roy, S., Martineau, M.-J., Terrado, R., Potvin, M., Massana, R., and Pedrós-Alió, C.: Distribution, phylogeny, and growth of cold-adapted picoprasinophytes in Arctic Seas, J. Phycol., 43, 78–89, https://doi.org/10.1111/j.1529-8817.2006.00310.x, 2007.
Maat, D. S., Crawfurd, K. J., Timmermans, K. R., and Brussaard, C. P. D.: Elevated CO2 and Phosphate Limitation Favor Micromonas pusilla through Stimulated Growth and Reduced Viral Impact, Appl. Environ. Microb., 80, 3119–3127, https://doi.org/10.1128/aem.03639-13, 2014.
Marquardt, M., Vader, A., Stübner, E. I., Reigstad, M., and Gabrielsen, T. M.: Strong Seasonality of Marine Microbial Eukaryotes in a High-Arctic Fjord (Isfjorden, in West Spitsbergen, Norway), Appl. Environ. Microb., 82, 1868–1880, https://doi.org/10.1128/aem.03208-15, 2016.
Maxwell, D. P., Falk, S., Trick, C. G., and Huner, N.: Growth at Low Temperature Mimics High-Light Acclimation in Chlorella vulgaris, Plant Physiol., 105, 535–543, https://doi.org/10.1104/pp.105.2.535, 1994.
Maxwell, K. and Johnson, G. N.: Chlorophyll fluorescence a practical guide, J. Exp. Bot., 51, 659–668, https://doi.org/10.1093/jexbot/51.345.659, 2000.
McKew, B. A., Davey, P., Finch, S. J., Hopkins, J., Lefebvre, S. C., Metodiev, M. V., Oxborough, K., Raines, C. A., Lawson, T., and Geider, R. J.: The trade-off between the light-harvesting and photoprotective functions of fucoxanthin-chlorophyll proteins dominates light acclimation in Emiliania huxleyi (clone CCMP 1516), New Phytol., 200, 74–85, https://doi.org/10.1111/nph.12373, 2013.
McKie-Krisberg, Z. M. and Sanders, R. W.: Phagotrophy by the picoeukaryotic green alga Micromonas: implications for Arctic Oceans, ISME J., 8, 1953–1961, https://doi.org/10.1038/ismej.2014.16, 2014.
Meakin, N. G. and Wyman, M.: Rapid shifts in picoeukaryote community structure in response to ocean acidification, ISME J., 5, 1397–1405, 2011.
Mehrbach, C., Culberson, C. H., Hawley, J. E., and Pytkowicz, R. M.: Measurement of the apparent dissociation constants of carbonic acid in seawater at atmospheric pressure, Limnol. Oceanogr., 18, 897–907, https://doi.org/10.4319/lo.1973.18.6.0897, 1973.
Miller, G. H., Alley, R. B., Brigham-Grette, J., Fitzpatrick, J. J., Polyak, L., Serreze, M. C., and White, J. W. C.: Arctic amplification: can the past constrain the future?, Quaternary Sci. Rev., 29, 1779–1790, https://doi.org/10.1016/j.quascirev.2010.02.008, 2010.
Mock, T. and Hoch, N.: Long-Term Temperature Acclimation of Photosynthesis in Steady-State Cultures of the Polar Diatom Fragilariopsis cylindrus, Photosynth. Res., 85, 307–317, https://doi.org/10.1007/s11120-005-5668-9, 2005.
Morgan-Kiss, R. M., Priscu, J. C., Pocock, T., Gudynaite-Savitch, L., and Huner, N. P. A.: Adaptation and Acclimation of Photosynthetic Microorganisms to Permanently Cold Environments, Microbiol. Mol. Biol. R., 70, 222–252, https://doi.org/10.1128/mmbr.70.1.222-252.2006, 2006.
Newbold, L. K., Oliver, A. E., Booth, T., Tiwari, B., DeSantis, T., Maguire, M., Andersen, G., van der Gast, C. J., and Whiteley, A. S.: The response of marine picoplankton to ocean acidification, Environ. Microbiol. 14, 2293–2307, https://doi.org/10.1111/j.1462-2920.2012.02762.x, 2012.
Oxborough, K.: FastPro8 GUI and FRRf3 systems documentation, Chelsea Technologies Group Ltd, West Molesey, UK, 2012.
Paulsen, M. L., Riisgaard, K., Frede, T., St John, M., and Nielsen, T. G.: Winter- spring transition in the subarcticAtlantic: microbial response to deep mixingand pre-bloom production, Aquat. Microb. Ecol., 76, 49–69, 2015.
Pierrot, D. E., Lewis, E., and Wallace, D. W. R.: MS Exel Program Developed for CO2 System Calculations, edited by: ORNL/CDIAC-105aCarbon Dioxide Information Analysis Centre, O. R. N. L., US Department of Energy, Oak Ridge, Tennessee, 2006.
Post, E.: Implications of earlier sea ice melt for phenological cascades in arctic marine food webs, Food Webs, 13, 60–66,, https://doi.org/10.1016/j.fooweb.2016.11.002, 2016.
Qi, D., Chen, L., Chen, B., Gao, Z., Zhong, W., Feely, R. A., Anderson, L. G., Sun, H., Chen, J., Chen, M., Zhan, L., Zhang, Y., and Cai, W.-J.: Increase in acidifying water in the western Arctic Ocean, Nat. Clim. Change, 7, 195–199, https://doi.org/10.1038/nclimate3228, 2017.
Raven, J.: The twelfth Tansley Lecture. Small is beautiful: the picophytoplankton, Funct. Ecol., 12, 503–513, 1998.
Richardson, T. L. and Jackson, G. A.: Small Phytoplankton and Carbon Export from the Surface Ocean, Science, 315, 838–840, https://doi.org/10.1126/science.1133471, 2007.
Riebesell, U. and Gattuso, J.-P.: Lessons learned from ocean acidification research, Nat. Clim. Change, 5, 12–14, 2015.
Rost, B., Zondervan, I., and Wolf-Gladrow, D.: Sensitivity of phytoplankton to future changes in ocean carbonate chemistry: Current knowledge, contradictions and research needs, Mar. Ecol. Prog. Ser., 373, 227–237, https://doi.org/10.3354/meps07776, 2008.
Sarthou, G., Timmermans, K. R., Blain, S., and Tréguer, P.: Growth physiology and fate of diatoms in the ocean: a review, J. Sea Res., 53, 25–42, https://doi.org/10.1016/j.seares.2004.01.007, 2005.
Schaum, E., Rost, B., Millar, A. J., and Collins, S.: Variation in plastic responses of a globally distributed picoplankton species to ocean acidification, Nat. Clim. Change, 3, 298–302, https://doi.org/10.1038/nclimate1774, 2012.
Schulz, K. G., Bellerby, R. G. J., Brussaard, C. P. D., Büdenbender, J., Czerny, J., Engel, A., Fischer, M., Koch-Klavsen, S., Krug, S. A., Lischka, S., Ludwig, A., Meyerhöfer, M., Nondal, G., Silyakova, A., Stuhr, A., and Riebesell, U.: Temporal biomass dynamics of an Arctic plankton bloom in response to increasing levels of atmospheric carbon dioxide, Biogeosciences, 10, 161–180, https://doi.org/10.5194/bg-10-161-2013, 2013.
Schulz, K. G., Bach, L. T., Bellerby, R. G. J., Bermúdez, R., Büdenbender, J., Boxhammer, T., Czerny, J., Engel, A., Ludwig, A., Meyerhöfer, M., Larsen, A., Paul, A. J., Sswat, M., and Riebesell, U.: Phytoplankton Blooms at Increasing Levels of Atmospheric Carbon Dioxide: Experimental Evidence for Negative Effects on Prymnesiophytes and Positive on Small Picoeukaryotes, Frontiers in Marine Science, 4, 64, https://doi.org/10.3389/fmars.2017.00064, 2017.
Sett, S., Bach, L. T., Schulz, K. G., Koch-Klavsen, S., Lebrato, M., and Riebesell, U.: Temperature Modulates Coccolithophorid Sensitivity of Growth, Photosynthesis and Calcification to Increasing Seawater pCO2, PLoS One, 9, e88308, https://doi.org/10.1371/journal.pone.0088308, 2014.
Sett, S., Schulz, K. G., Bach, L. T., and Riebesell, U.: Shift towards larger diatoms in a natural phytoplankton assemblage under combined high-CO2 and warming conditions, J. Plankton Res., https://doi.org/10.1093/plankt/fby018, 2018.
Sherr, E. B. and Sherr, B. F.: Significance of predation by protists in aquatic microbial food webs, Antonie Leeuwenhoek, 81, 293–308, https://doi.org/10.1023/a:1020591307260, 2002.
Sherr, E. B., Sherr, B. F., Wheeler, P. A., and Thompson, K.: Temporal and spatial variation in stocks of autotrophic and heterotrophic microbes in the upper water column of the central Arctic Ocean, Deep-Sea Res. Pt. I, 50, 557–571, https://doi.org/10.1016/S0967-0637(03)00031-1, 2003.
Silsbe, G. M. and Kromkamp, J. C.: Modeling the irradiance dependency of the quantum efficiency of photosynthesis, Limnol. Oceanogr.-Methods, 10, 645–652, 2012.
Šlapeta, J., López-García, P. N., and Moreira, D.: Global Dispersal and Ancient Cryptic Species in the Smallest Marine Eukaryotes, Mol. Biol. Evol., 23, 23–29, https://doi.org/10.1093/molbev/msj001, 2006.
Sommer, U., Paul, C., and Moustaka-Gouni, M.: Warming and ocean acidification effects on phytoplankton – from species shifts to size shifts within species in a mesocosm experiment, PLoS One, 10, e0125239, https://doi.org/10.1371/journal.pone.0125239, 2015.
Stocker, T.: Climate change 2013: the physical science basis: Working Group I contribution to the Fifth assessment report of the Intergovernmental Panel on Climate Change, Cambridge University Press, Cambridge, UK, 2014.
Stoll, M. H. C., Bakker, K., Nobbe, G. H., and Haese, R. R.: Continous-Flow Analysis of Dissolved Inorganic Carbon Content in Seawater, Anal. Chem., 73, 4111–4116, 2001.
Suggett, D. J., Borowitzka, M. A., and Prášil, O. E.: Chlorophyll a Fluorescence in Aquatic Sciences: Methods and Applications, Developments in Applied Phycology, Springer, Dordrecht, 326 p., 2010.
Taylor, A. R., Chrachri, A., Wheeler, G., Goddard, H., and Brownlee, C.: A Voltage-Gated H+ Channel Underlying pH Homeostasis in Calcifying Coccolithophores, PLoS Biol., 9, e1001085, https://doi.org/10.1371/journal.pbio.1001085, 2001.
Toseland, A., Daines, S. J., Clark, J. R., Kirkham, A., Strauss, J., Uhlig, C., Lenton, T. M., Valentin, K., Pearson, G. A., Moulton, V., and Mock, T.: The impact of temperature on marine phytoplankton resource allocation and metabolism, Nat. Clim. Change, 3, 979–984, https://doi.org/10.1038/nclimate1989, 2013.
Tremblay, G., Belzile, C., Gosselin, M., Poulin, M., Roy, S., and Tremblay, J. E.: Late summer phytoplankton distribution along a 3500 km transect in Canadian Arctic waters: strong numerical dominance by picoeukaryotes, Aquat. Microb. Ecol., 54, 55–70, 2009.
Tremblay, J.-É., Anderson, L. G., Matrai, P., Coupel, P., Bélanger, S., Michel, C., and Reigstad, M.: Global and regional drivers of nutrient supply, primary production and CO2 drawdown in the changing Arctic Ocean, Prog. Oceanogr., 139, 171–196, https://doi.org/10.1016/j.pocean.2015.08.009, 2015.
Vader, A., Marquardt, M., Meshram, A. R., and Gabrielsen, T. M.: Key Arctic phototrophs are widespread in the polar night, Polar Biol., 38, 13–21, https://doi.org/10.1007/s00300-014-1570-2, 2015.
van de Waal, D. and Boersma, M.: Ecological stoichiometry in aquatic ecosystems, in: Encyclopedia of Life Support Systems (EOLSS), Developed under the Auspices of the UNESCO, edited by: UNESCO-EOLSS Joint Committee, Eolss Publishers, Oxford, UK, 2012.
Waite, A. M., Safi, K. A., Hall, J. A., and Nodder, S. D.: Mass sedimentation of picoplankton embedded in organic aggregates, Limnol. Oceanogr., 45, 87–97, https://doi.org/10.4319/lo.2000.45.1.0087, 2000.
Wassmann, P. and Reigstad, M.: Future Arctic Ocean seasonal ice zones and implications for pelagic-benthic coupling, Oceanography, 24, 220–231, https://doi.org/10.5670/oceanog.2011.74, 2011.
Webb, W., Newton, M., and Starr, D.: Carbon dioxide exchange of Alnus rubra, Oecologia, 17, 281–291, https://doi.org/10.1007/bf00345747, 1974.
Wolf, K., Hoppe, C. J. M., and Rost, B.: Resilience by diversity: Large intraspecific differences in climate change responses of an Arctic diatom, Limnol. Oceanogr., 63, 397–411, https://doi.org/10.1002/lno.10639, 2018.
Worden, A. Z. and Not, F.: Ecology and diversity of picoeukaryotes, Microbial Ecology of the Oceans, second edn., John Wiley & Sons, Hoboken, USA, 159–205, 2008.
Worden, A. Z., Follows, M. J., Giovannoni, S. J., Wilken, S., Zimmerman, A. E., and Keeling, P. J.: Rethinking the marine carbon cycle: Factoring in the multifarious lifestyles of microbes, Science, 347, 1257594, https://doi.org/10.1126/science.1257594, 2015.
Wu, Y., Campbell, D. A., Irwin, A. J., Suggett, D. J., and Finkel, Z. V.: Ocean acidification enhances the growth rate of larger diatoms, Limnol. Oceanogr., 59, 1027–1034, https://doi.org/10.4319/lo.2014.59.3.1027, 2014.
Young, J. N., Goldman, J. A. L., Kranz, S. A., Tortell, P. D., and Morel, F. M. M.: Slow carboxylation of Rubisco constrains the rate of carbon fixation during Antarctic phytoplankton blooms, New Phytol., 205, 172–181, https://doi.org/10.1111/nph.13021, 2014.
Zeebe, R. E. and Wolf-Gladrow, D. A.: CO2 in Seawater: Equilibrium, Kinetics, Isotopes, Elsevier Science, Amsterdam, 2001.