the Creative Commons Attribution 4.0 License.
the Creative Commons Attribution 4.0 License.
 | 06 Sep 2018
Synthetic ozone deposition and stomatal uptake at flux tower sites
Jason A. Ducker
Christopher D. Holmes
Trevor F. Keenan
Silvano Fares
Allen H. Goldstein
Ivan Mammarella
J. William Munger
Jordan Schnell
We develop and evaluate a method to estimate O3 deposition and stomatal O3 uptake across networks of eddy covariance flux tower sites where O3 concentrations and O3 fluxes have not been measured. The method combines standard micrometeorological flux measurements, which constrain O3 deposition velocity and stomatal conductance, with a gridded dataset of observed surface O3 concentrations. Measurement errors are propagated through all calculations to quantify O3 flux uncertainties. We evaluate the method at three sites with O3 flux measurements: Harvard Forest, Blodgett Forest, and Hyytiälä Forest. The method reproduces 83 % or more of the variability in daily stomatal uptake at these sites with modest mean bias (21 % or less). At least 95 % of daily average values agree with measurements within a factor of 2 and, according to the error analysis, the residual differences from measured O3 fluxes are consistent with the uncertainty in the underlying measurements.
The product, called synthetic O3 flux or SynFlux, includes 43 FLUXNET sites in the United States and 60 sites in Europe, totaling 926 site years of data. This dataset, which is now public, dramatically expands the number and types of sites where O3 fluxes can be used for ecosystem impact studies and evaluation of air quality and climate models. Across these sites, the mean stomatal conductance and O3 deposition velocity is 0.03–1.0 cm s−1. The stomatal O3 flux during the growing season (typically April–September) is 0.5–11.0 nmol O3 m−2 s−1 with a mean of 4.5 nmol O3 m−2 s−1 and the largest fluxes generally occur where stomatal conductance is high, rather than where O3 concentrations are high. The conductance differences across sites can be explained by atmospheric humidity, soil moisture, vegetation type, irrigation, and land management. These stomatal fluxes suggest that ambient O3 degrades biomass production and CO2 sequestration by 20 %–24 % at crop sites, 6 %–29 % at deciduous broadleaf forests, and 4 %–20 % at evergreen needleleaf forests in the United States and Europe.
- Article
(1729 KB) - Full-text XML
-
Supplement
(2670 KB) - BibTeX
- EndNote


Surface ozone (O3) is toxic to both people and plants. Present-day and recent historical O3 levels reduce carbon sequestration in the biosphere (Reich and Lassoie, 1984; Guidi et al., 2001; Sitch et al., 2007; Ainsworth et al., 2012), perturb the terrestrial water cycle (Lombardozzi et al., 2012, 2015), and cause around $ 25 billion in annual crop losses (Reich and Amundson, 1985; Van Dingenen et al., 2009; Avnery et al., 2011; Tai et al., 2014). The basic plant responses to O3 injury are well established from controlled exposure experiments (e.g., Wittig et al., 2009; Ainsworth et al., 2005, 2012; Hoshika et al., 2015), but few datasets are available to quantify O3 fluxes and responses for whole ecosystems or plant functional types that are represented within regional and global biosphere and climate models. The eddy covariance method has been widely used to measure land–atmosphere fluxes of carbon, water, and energy and evaluate their representation in models (Baldocchi et al., 2001; Bonan et al., 2011), but few towers measure O3 fluxes (Munger et al., 1996; Fowler et al., 2001; Keronen et al., 2003; Gerosa et al., 2004; Lamaud et al., 2009; Fares et al., 2010; Stella et al., 2013; Zona et al., 2014). A recent review identified just 78 field measurements of O3 fluxes over vegetation during the last 4 decades, many lasting just a few weeks (Silva and Heald, 2018). This paper demonstrates a reliable method to estimate O3 fluxes at 103 eddy covariance flux towers spanning over 2 decades to enable O3 impact studies on ecosystem scales.
The land surface is a terminal sink for atmospheric O3 due to the reactivity of O3 with unsaturated organic molecules and the modest solubility of O3 in water. Surface deposition is 20 % of the total loss in tropospheric O3, making it an important control on air pollution (Wu et al., 2007; Young et al., 2013; Kavassalis and Murphy, 2017). This O3 deposition flux includes stomatal uptake into leaves, where O3 can cause internal oxidative damage, and less harmful non-stomatal deposition to plant cuticles, stems, bark, soil, and standing water (Fuhrer, 2000; Zhang et al., 2002; Ainsworth et al., 2012). O3 can also react with biogenic volatile organic compounds, particularly terpenoid compounds, in the plant canopy air, and this process is commonly included in non-stomatal deposition (Kurpius and Goldstein, 2003). The deposition flux (mol O3 m−2 s−1) can be described as
where χ and χ0 are the O3 mole fractions (mol mol−1) in the atmosphere and at the surface, respectively, n is the molar density of air (mol m−3), and vd is a deposition velocity (m s−1) that expresses the net vertical O3 transport between the height where χ is measured and the surface. is defined positive for flux towards the ground. Equation (1) reasonably assumes that χ0=0 because terrestrial surfaces have abundant organic compounds that react with and destroy O3. The deposition velocity can be decomposed into resistances (s m−1) for aerodynamic transport (ra), diffusion in the quasi-laminar layer (rb), stomatal uptake (rs), and non-stomatal deposition (rns) (Wesely, 1989):
For stomatal and non-stomatal processes, the rates are often expressed as conductances (m s−1), which are the inverse of the resistances: and . The sum of stomatal and non-stomatal conductances is the vegetation canopy conductance, . The stomatal O3 flux is the portion of that enters the stomata, and can be described as
To construct the synthetic O3 flux, or SynFlux, we use measurements of O3 concentration and standard eddy covariance flux measurements to derive nearly all of the terms in Eqs. (1)–(3) from surface observations, using some additional information from remote sensing and models. This enables the estimation of and , as described in Sect. 2. Section 3 evaluates the method against observations at three sites that measure and examines the importance of stomatal and non-stomatal deposition. Section 4 uses SynFlux to assess the spatial patterns of O3 uptake to vegetation and to compare flux-based metrics of O3 damage with concentration-based metrics. Finally, we discuss the strengths, limitations, and implications of our approach in Sect. 5.
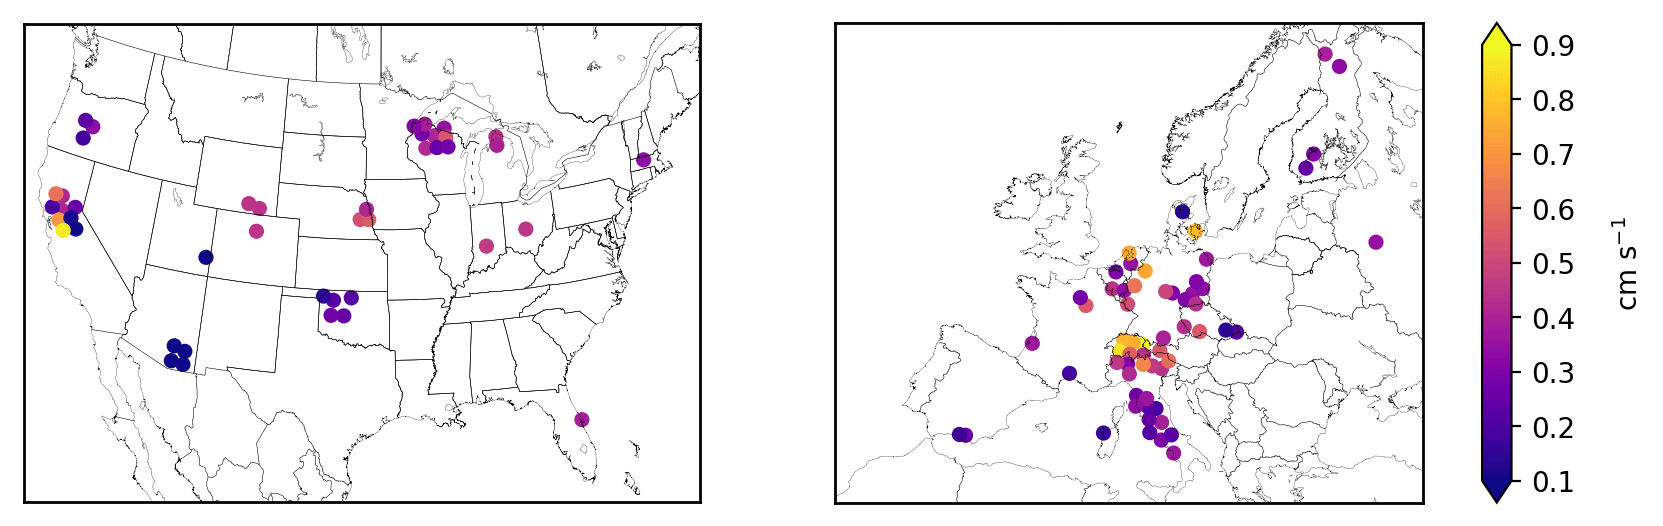
Figure 1Mean stomatal conductance for O3 (gs) during daytime in the growing season at FLUXNET2015 sites in the United States and Europe. Symbols of some sites have been moved slightly to reduce overlap and improve legibility.
2.1 SynFlux: synthetic O3 flux
The FLUXNET2015 dataset (Pastorello et al., 2017) aggregates measurements of land–atmosphere fluxes of CO2, H2O, momentum, and heat at sites around the world (http://fluxnet.fluxdata.org/data/fluxnet2015-dataset; last access: 24 February 2017). Measurements are made with the eddy covariance method on towers above vegetation canopies (Baldocchi et al., 2001; Anderson et al., 1984; Goldstein et al., 2000) with consistent gap filling (Reichstein et al., 2005; Vuichard and Papale, 2015) and quality control across sites (Pastorello et al., 2014). Flux and meteorological quantities are reported in half-hour intervals. We analyze data from all sites in the United States and Europe in the FLUXNET2015 Tier 1 dataset. This analysis is restricted to the US and Europe because these regions have dense O3 monitoring networks, described below. There are 103 sites meeting these criteria, all listed in Table S1 in the Supplement with references to full site descriptions. Three of these sites – Blodgett Forest, Harvard Forest, and Hyytiälä Forest – measure O3 flux with the eddy covariance method, which we will use in Sect. 3 to evaluate our methods.
SynFlux aims to constrain O3 deposition and stomatal uptake as much as possible from measured water, heat, and momentum fluxes, in contrast to other methods (Finkelstein et al., 2000; Mills et al. 2011; Schwede et al., 2011; Yue et al., 2014) that rely more heavily on atmospheric models or parameterizations of stomatal conductance. From the eddy covariance measurements, we derive the resistance components of Eq. (2) using methods similar to past studies (Kurpius and Goldstein, 2003; Gerosa et al., 2005; Fares et al., 2010). The aerodynamic and quasi-laminar layer resistances (ra and rb, respectively) are derived from measured wind speed, friction velocity, and fluxes of sensible and latent heat every half hour using Monin–Obukhov similarity theory (Foken, 2017). The stomatal conductance for O3 (gs) is derived from the measured water vapor flux and meteorological data every half hour with the inverted Penman–Monteith equation (Monteith, 1981; Gerosa et al., 2007). Supplement S1 provides further details of the resistance and conductance calculations. Some studies instead calculate gs from gross primary productivity (Lamaud et al., 2009; El-Madany et al., 2017), but that method is less widely used than the Penman–Monteith approach adopted here. The Penman–Monteith method of calculating stomatal conductance has been successfully applied across FLUXNET sites previously (Medlyn et al., 2017; Novick et al., 2016; Knauer et al., 2017; Lin et al., 2018). Those studies and others caution that, since evapotranspiration measurements include evaporation from ground, the stomatal conductance could be overestimated. While there are methods for quantifying and removing the evaporative fraction of evapotranspiration from eddy covariance data (Wang et al., 2014; Zhou et al., 2016; Scott and Biederman, 2017), a more common approach is to restrict analysis to conditions when transpiration dominates. We follow this second approach, analyzing only daytime data during the growing season, and use filtering criteria similar to Knauer et al. (2017). We define daytime as Sun elevation angle above 4∘ and the growing season as days when gross primary productivity (GPP) exceeds 20 % of the annual maxima in GPP. To avoid complications to the Penman–Monteith equation from wet canopies, we exclude times when dew may be present (RH > 80 %), and days with precipitation (> 5 mm). We also exclude the top and bottom 1 % of gs values, which include many unrealistic outliers (e.g., ). Figure 1 shows the mean stomatal conductance during the growing season at all sites.
The terms in Eqs. (1)–(3) that cannot be derived from FLUXNET2015 measurements are O3 mole fraction and non-stomatal conductance. The O3 mole fraction is taken from a gridded dataset of hourly O3 measurements that spans the contiguous United States and Europe (Schnell et al., 2014). This dataset has 1∘ spatial resolution, so some differences from measured O3 abundances at individual sites are inevitable. Schnell et al. (2014) estimated these errors to be 6–9 ppb (rms) or about 15 % of summer mean O3 in the US and similar in Europe. Figure 2 shows that the daytime gridded O3 concentrations correlate well with observations at three flux tower sites where O3 was measured (R2=0.63–0.87) and have modest negative bias (5–10 ppb, −12 % to −28 %), consistent with the accuracy reported by Schnell et al. (2014). We use the Zhang et al. (2003) parameterization of non-stomatal conductance, which accounts for O3 deposition to leaf cuticles and ground and was developed from measurements in the eastern United States. The parameterization requires leaf-area index, which we take from satellite remote sensing (Claverie et al., 2014, 2016), snow depth, which we take from MERRA2 reanalysis (GMAO, 2015; Gelaro et al., 2017), and standard meteorological data provided by FLUXNET2015. Uncertainties in these variables are described in Sect. 2.4. Performance of the non-stomatal parameterization is examined in Sect. 3.2.
Table 1Description of sites that measure O3 flux and their daytime growing season conditions*.
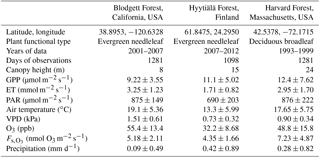
* Values are mean ± standard deviation of daily averages, using daytime observations only. GPP is gross primary productivity. ET is evapotranspiration. PAR is photosynthetically active radiation. VPD is vapor pressure deficit. is observation-derived stomatal O3 flux.
Figure 3 shows the stomatal O3 flux at each site calculated with Eq. (3), and then averaged over the growing season. Figure S1 shows the corresponding total O3 flux (Eq. 1). We refer to these products as the “synthetic” total O3 flux () and synthetic stomatal O3 flux (). Superscript “syn” distinguishes these synthetic quantities from the observed total O3 flux () and observation-derived stomatal O3 flux (), which are only available at a few sites. Together, we refer to and as SynFlux. In total, the measurements required to calculate are O3 mole fraction, sensible and latent heat fluxes, friction velocity, temperature, pressure, humidity, canopy height, and leaf-area index. There are 43 sites in the US and 60 sites in Europe within the FLUXNET Tier 1 database with sufficient measurements to calculate .
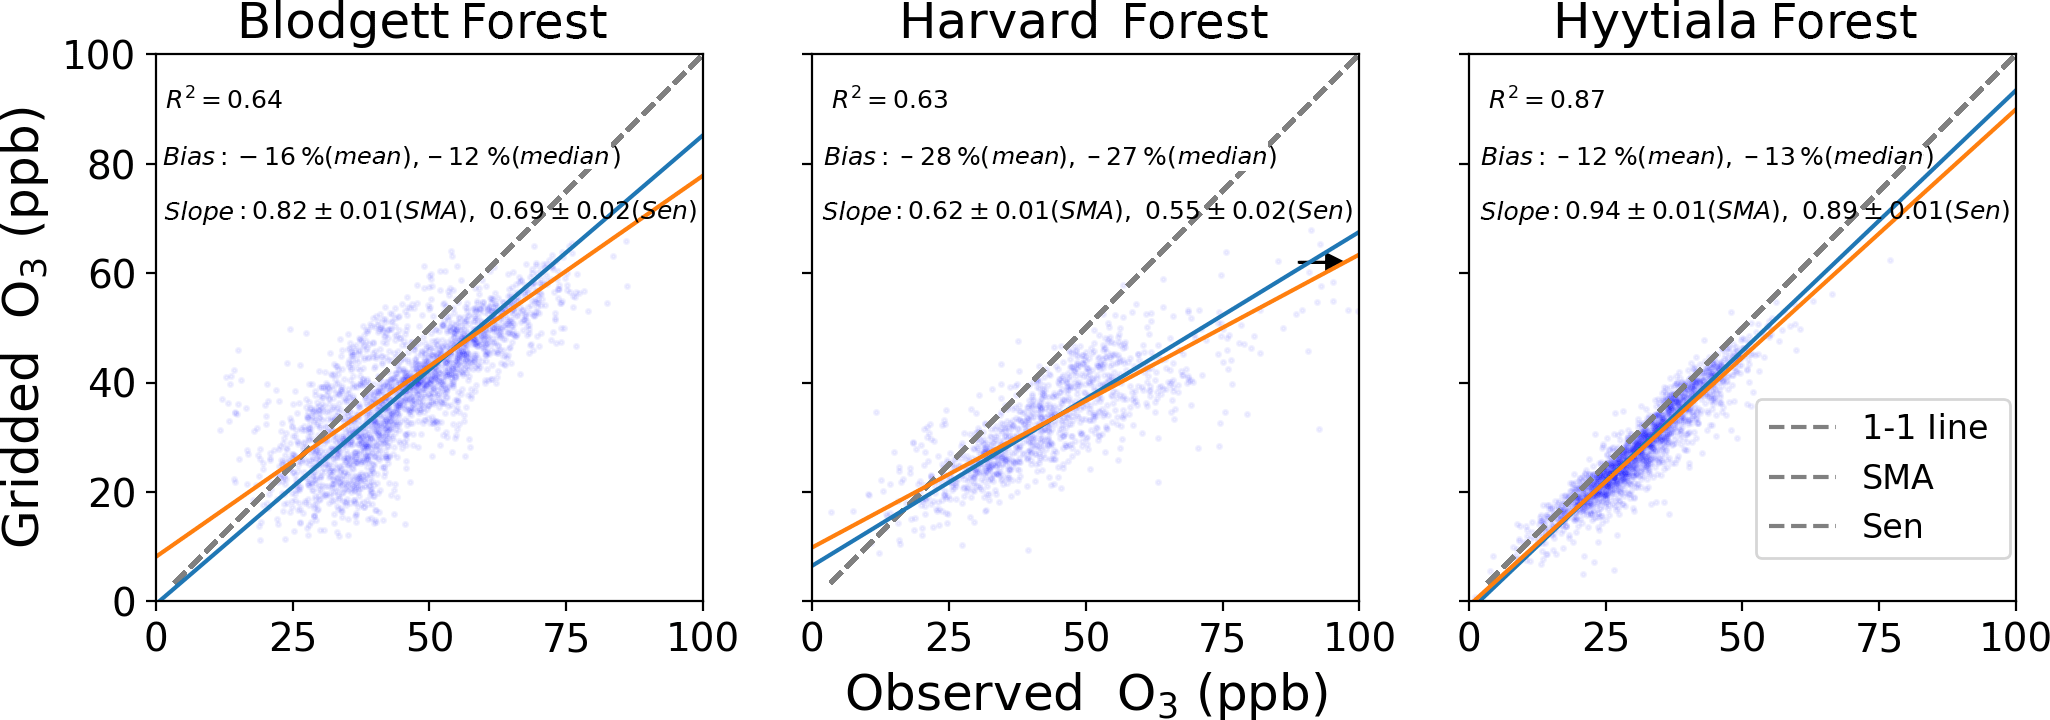
Figure 2Gridded and observed daily daytime O3 concentrations at Blodgett, Harvard, and Hyytiälä forests. Inset numbers provide the coefficient of determination (R2), mean and median bias, the standard major axis (SMA) slope, the Thiel–Sen (Sen) slope, and the 68 % confidence interval of the slopes. The black arrow points towards outliers that are not shown.
2.2 Observed O3 flux
We evaluate SynFlux and its inputs at three sites where O3 flux measurements are available: Harvard Forest, Massachusetts, United States (Munger et al., 1996); Blodgett Forest, California, United States (Fares et al., 2010); and Hyytiälä Forest, Finland (Keronen et al., 2003; Mammarella et al., 2007; Rannik et al., 2009). These forest sites sample a range of environmental and ecosystem conditions summarized in Table 1. All three sites have at least 6 years of half-hourly or hourly flux measurements. Two sites are evergreen needleleaf forests (Blodgett and Hyytiälä), while one is a deciduous broadleaf forest containing some scattered stands of evergreen needleleaf trees (Harvard). Climate also differs across these sites. Blodgett Forest has a Mediterranean climate with cool, wet winters and hot, dry summers. Hyytiälä and Harvard forests have cold winters and wetter summers, with Harvard Forest being the warmer of the two.
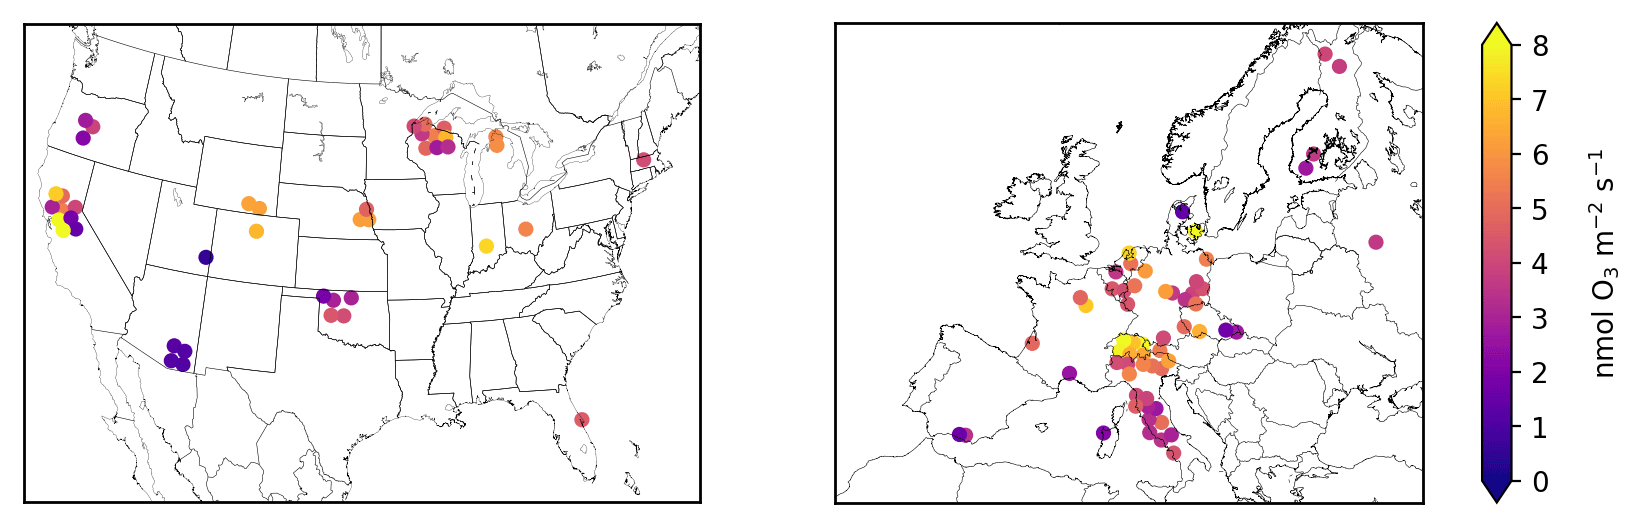
Figure 3Mean synthetic stomatal O3 flux (, Sect. 2.1) during the daytime growing season at FLUXNET2015 sites in the United States and Europe. Symbols of some sites have been moved slightly to reduce overlap and improve legibility.
Harvard Forest water vapor flux measurements were recalibrated for this work based on matching water vapor mixing ratio measured by the flux sensor to levels calculated from ambient relative humidity and air temperature, resulting in a 30 % increase in evapotranspiration during the 1990s and no change since 2006. In addition, we remove sub-canopy evaporation from the measured water vapor flux before the Penman–Monteith calculation. Based on past measurements at these sites, the sub-canopy fraction of evapotranspiration is 20 % at Hyytiälä Forest and 10 % at Harvard Forest in summer (Moore et al., 1996; Launiainen et al., 2005). We are unable to make this correction at all FLUXNET sites since water vapor flux is typically measured only above canopy.
At these three sites, observation-derived vd, gns, and can be derived from the measurements with methods that differ slightly from Sect. 2.1. O3 deposition velocity is inferred from measurements of O3 concentration and flux via . Resistance or conductance terms ra, rb, and gs are calculated as described in Sect. 2.1, and then both canopy and non-stomatal conductance are derived from observations via and , respectively. With those values, Eq. (3) gives the observation-derived stomatal O3 flux. Synthetic and observation-derived stomatal O3 fluxes are both calculated with Eq. (3) and use the same observation-derived gs, ra, and rb but different values of gns,vd, and O3 mole fraction.
2.3 Gap filling for friction velocity
The FLUXNET2015 dataset uses gap filling for most flux and meteorological measurements (Vuichard and Papale, 2015), but not for friction velocity (u∗), which is required to calculate vd and . Filling this one variable would significantly reduce the fraction of missing data in our analysis. Monin–Obukhov similarity theory predicts that friction velocity will be proportional to wind speed in the surface layer, for a given roughness length and stability regime (Foken, 2017). On this basis, we regress the available friction velocity measurements against wind speed and net radiation (a proxy for stability) separately for each site and month (a proxy for vegetation roughness). This gap filling was possible at 91 sites that report net radiation measurements.
The predicted friction velocities from the regression model are correlated with available observations (R2 > 0.5) and have minimal mean bias (±10 %) at 85 out of 91 eligible sites (Fig. S3 in the Supplement), with most sites (63 out of 91) showing strong correlations (R2 > 0.7). At the remaining six sites with lower regression model performance (R2 < 0.5) we do not use u∗ gap filling. The u∗ gap filling increases the number of estimates by 1 %–20 %. Time periods with u∗ gaps have no significant bias in meteorological conditions (e.g., mean wind speed, radiation, energy fluxes) compared to periods with u∗ measurements. As a result, the differences in monthly mean with and without gap filling are small (10 % rms). So, although the u∗ gap filling is a potential source of uncertainty, the estimates are robust. The following analysis will use the gap-filled data, but our results do not change in any meaningful way if we use the unfilled data.
2.4 Error analysis, averaging, and numerical methods
We quantify the errors in , , and all other calculated variables from the measurement uncertainties using standard techniques for propagation of errors through all equations (see Supplement S2). This method provides the uncertainty, quantified as the standard deviation, of each variable in each half-hour interval. The error analysis reveals that and other derived quantities have uncertainties that change from hour to hour by 2 orders of magnitude (Fig. S2). In addition, many extreme values of , gs, and other variables have very large uncertainties. We retain these outliers in our analysis and use the error analysis to appropriately reduce their influence on averages and other statistics, as described below, without discarding data.
The FLUXNET2015 dataset contains error estimates for sensible and latent heat measurements. We use these reported values in the error analysis. Where uncertainties in these fluxes are missing, we fill the gaps using a linear regression of available flux errors against flux values for that site. For friction velocity, the uncertainty is the prediction error in the linear model used for gap filling (Sect. 2.3). Based on expert judgment, the standard deviation of O3 mole fraction is set to 20 %, pressure to 0.5 hPa, temperature to 0.5 K, relative humidity to 5 %, and canopy height to the lesser of 15 % or 2 m. For remotely sensed leaf-area index, the uncertainty is 1.1 m2 m−2 for all vegetation types (Claverie et al., 2013, 2016). Snow depth uncertainty in MERRA2 is 0.08 m (Reichle et al., 2017). The Zhang et al. (2003) gns parameterization has five vegetation-specific parameters and all are assigned 50 % standard deviation. Zero error is assumed for the flux tower height. Based on these inputs, the median relative uncertainty in is 44 %, but it rises to several hundred percent for some half-hour intervals. The error analysis shows that most of the uncertainty in derives from uncertainty in the latent heat flux measurement.
Daily and monthly averages of and other quantities are constructed in stages. We first calculate a mean diurnal cycle for the day or month by pooling measurements during each hour in a maximum likelihood estimate, a weighted average that accounts for the uncertainty in each measurement. The maximum likelihood estimate is appropriate when combining values from the same distribution, which is expected to apply for measurements within a particular hour, but not across hours of the day. We then average across hours with an unweighted mean to calculate the daily or monthly value. For the daily averages, there are one to two observations within each hour. For the monthly averages, there are typically 30 to 60 in each hour of the day. We calculate seasonal averages with an unweighted mean of monthly values. Uncertainties are propagated through each stage of these averages, as detailed in Supplement S2. We compared averages with and without uncertainty weighting. The uncertainty-weighted averages tend to be smaller and less variable than unweighted averages because the error propagation identifies when outliers and large values have greater uncertainty. For example, the monthly values of gc derived from observations at Harvard Forest are 0.57±0.11 cm s−1 with uncertainty weighting and 0.68±0.17 cm s−1 without. Our discussion focuses on uncertainty-weighted daily averages of daytime data.
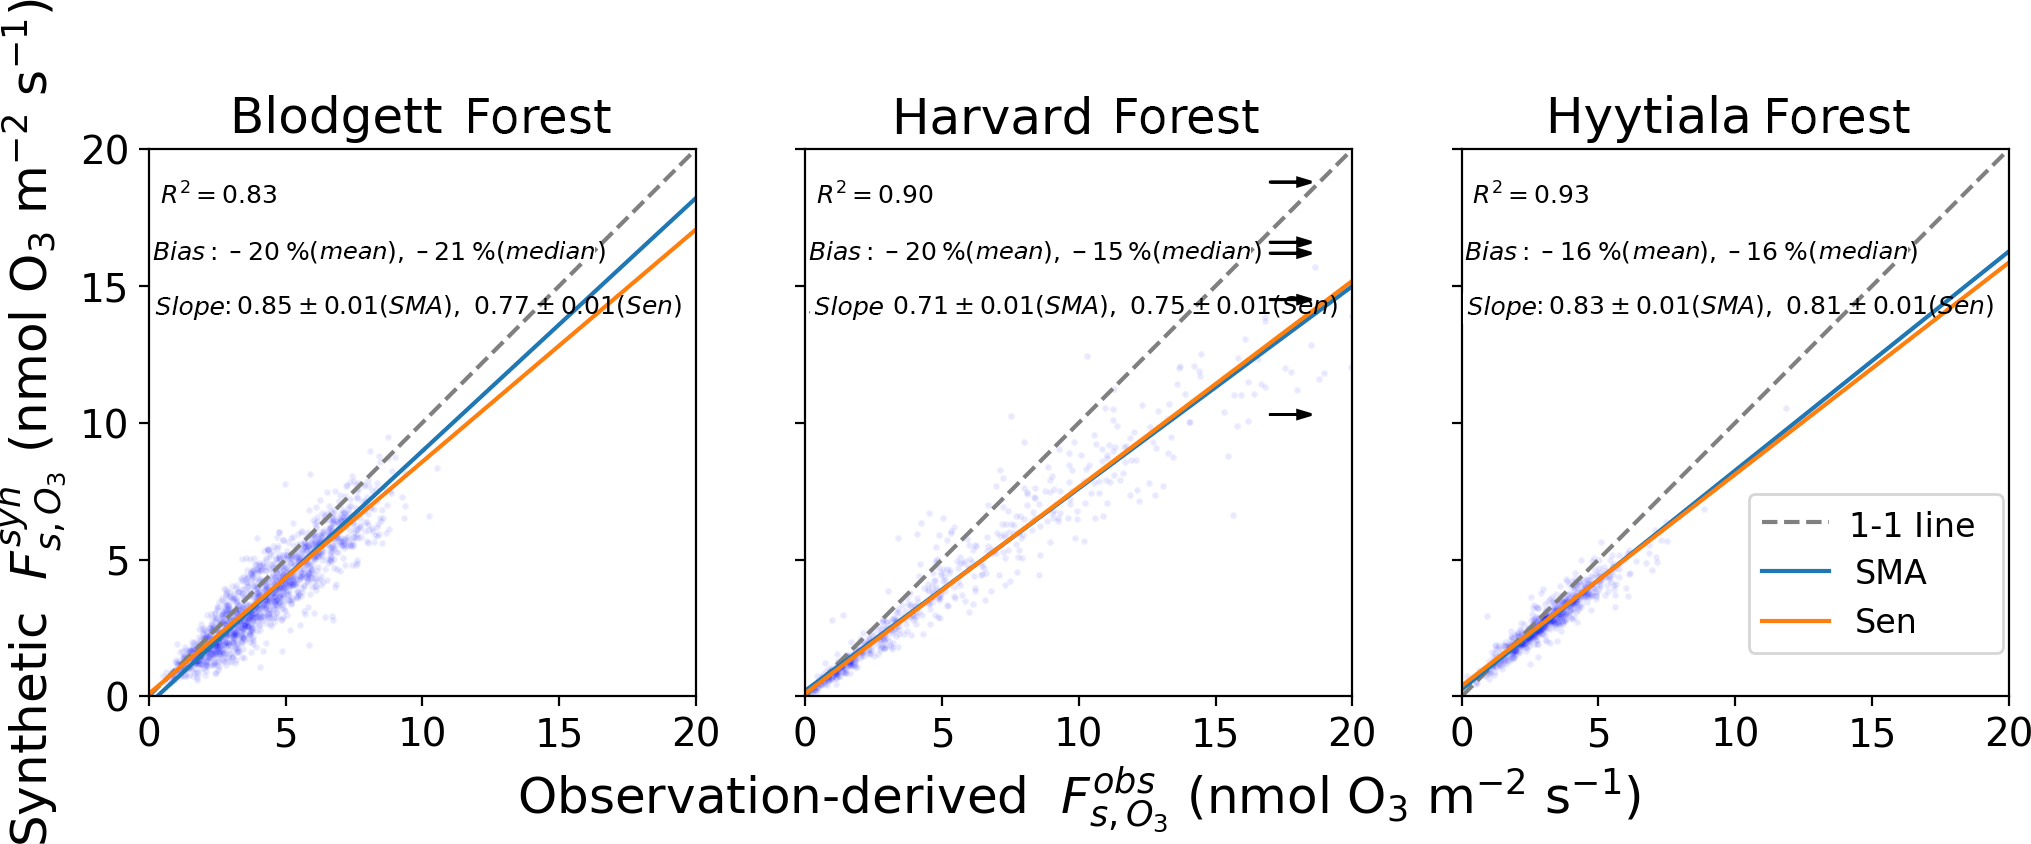
Figure 4Synthetic and observation-derived daily daytime stomatal O3 flux. See Sect. 2.1 for a definition of and Fig. 2 for an explanation of the lines and inset text.
Analyses are performed in Python 3.5 with NumPy, Pandas, PySolar, and Statsmodels (Reda and Andreas, 2005; Van Der Walt et al., 2006; McKinney, 2010; Seabold et al., 2010). We quantify linear relationships between variables using the coefficient of determination (R2), a parametric slope estimator (standard major axis or SMA, Warton et al., 2006) and a non-parametric slope estimator (Thiel–Sen slope, Sen, 1968), which is more robust against outliers.
2.5 Data availability
The SynFlux dataset produced in this work is available at https://doi.org/10.5281/zenodo.1402054 (last access: 30 August 2018). The dataset includes synthetic stomatal and total O3 fluxes, O3 concentrations, O3 deposition velocity, canopy conductance, stomatal conductance, and all of their propagated uncertainties. Monthly mean values are provided with and without u∗ gap filling, for 103 sites totaling 926 site years.
3.1 Evaluation of synthetic fluxes
Figure 4 compares daily daytime averages of synthetic to observation-derived . and are calculated from the same observation-derived stomatal conductance (gs) and aerodynamic resistances (ra and rb), but differ in the O3 mole fraction and non-stomatal conductance (gns) that they use (see Sects. 2.1 and 2.2). At all three sites, is strongly correlated with measured values (R2=0.83–0.93). The mean and median biases are −16 % to −21 % and at least 95 % of values agree with measurements within a factor of 2. The majority of values lie near the 1:1 line with and the slopes (0.71 to 0.85) reflect this. The half-hourly or hourly measured and synthetic fluxes still have some outliers (Fig. S2), but the error analysis reveals that many of the outlying points have large uncertainties. For 98 % of points, the differences between and are less than the 95 % confidence interval derived from the error analysis (two-sided t-test). Thus, the errors in are consistent with the propagated uncertainty in the observations. The half-hourly values perform similarly well against observations (Fig. S4), but our analysis focuses on averages. The performance of daily is partially due to resolving the seasonal cycle. If we subtract the mean seasonal cycle from both synthetic and observation-derived daily , the residual correlation is R2=0.5–0.7 (vs. 0.9 with the seasonal cycle included). This represents the skill of SynFlux at reproducing within-month and interannual variability. Overall, these results suggest that synthetic is a reliable estimate of stomatal O3 uptake into plants that can be used at flux tower sites without O3 measurements.
The measurements also enable us to evaluate synthetic total deposition, , and synthetic O3 deposition velocity, , although these are less relevant to ecosystem impacts than stomatal uptake, . For daily averages, Fig. S5 shows that bias (−13 % to +65 %), slope (0.3–1.4), and R2 (0.05–0.43) are all worse than for . The daily performance is similar (Fig. S6, bias: −26 % to +41 %, slope: 0.3–1.1, R2: 0.16–0.37). Monthly averages of and both improve the correlation with observations (R2 ∼ 0.12–0.54). The reasons for the better performance of compared to can be derived from Eq. (3). The canopy resistance for O3 is normally much greater than the quasi-laminar layer and aerodynamic resistances, meaning , often by a factor of 3–10. Therefore, the O3 deposition velocity is approximately . Under these conditions, Eq. (1) simplifies to ) and Eq. (3) simplifies to . While gs is calculated from measured H2O fluxes, gns comes from a parameterization, which inevitably introduces error into gns and . However, has little sensitivity to gns regardless of whether stomatal or non-stomatal conductance is larger. We confirm this insensitivity in tests where the parameterized gns value is doubled at 10 sites. The hourly values change only 3 %–8 %. Since has little sensitivity to gns or its errors, it can be calculated more accurately than , as seen when comparing Figs. 4 and S4. Despite its larger errors, the means of and are within 50 % of the observed value at two sites and within a factor of 2 at all, which may be useful for some applications, given the scarcity of prior measurements and observation-derived estimates of vd.
3.2 Stomatal and non-stomatal deposition
Figure 5 shows the seasonal cycles of observation-derived O3 deposition velocity and its important components at the three study sites with O3 flux measurements. For low or moderately reactive gases like O3, canopy resistance is typically greater than aerodynamic or quasi-laminar layer resistance, so it controls the overall deposition velocity. At these three sites, deposition velocity is lowest in winter (0.1–0.2 cm s−1) and highest in summer (0.5–0.6 cm s−1). Stomatal conductance peaks during warm and wet months, which explains most of this seasonal variation, except at Blodgett Forest as discussed below. Traditionally, stomatal conductance was thought to exceed non-stomatal conductance during the growing season at most vegetated sites (Wesely, 1989; Zhang et al., 2003), although this has been challenged more recently (Altimir et al., 2006; Stella et al., 2011a; Wolfe et al., 2011; Plake et al., 2015). At both Harvard and Hyytiälä forests, the mean stomatal conductance (0.2–0.6 cm s−1) is 1.5–6 times larger than non-stomatal conductance (0.08–0.2 cm s−1) during the growing season, so about 60 %–90 % of O3 deposition occurs through stomatal uptake. At Blodgett, non-stomatal conductance slightly exceeds stomatal conductance in summer (0.4 vs. 0.3 cm s−1). The fast non-stomatal deposition is explained by O3 reacting with biogenic terpenoid emissions below the flux measurement height (Kurpius and Goldstein, 2003; Fares et al., 2010). As documented in past work, these biogenic emissions depend strongly on temperature and light and have a large seasonal cycle with maxima in summer and minima in winter, so stomatal uptake is generally < 50 % of O3 deposition at Blodgett in the summer but > 70 % in winter (Kurpuis and Goldstein, 2003; Fares et al., 2010; Wolfe et al. 2011).
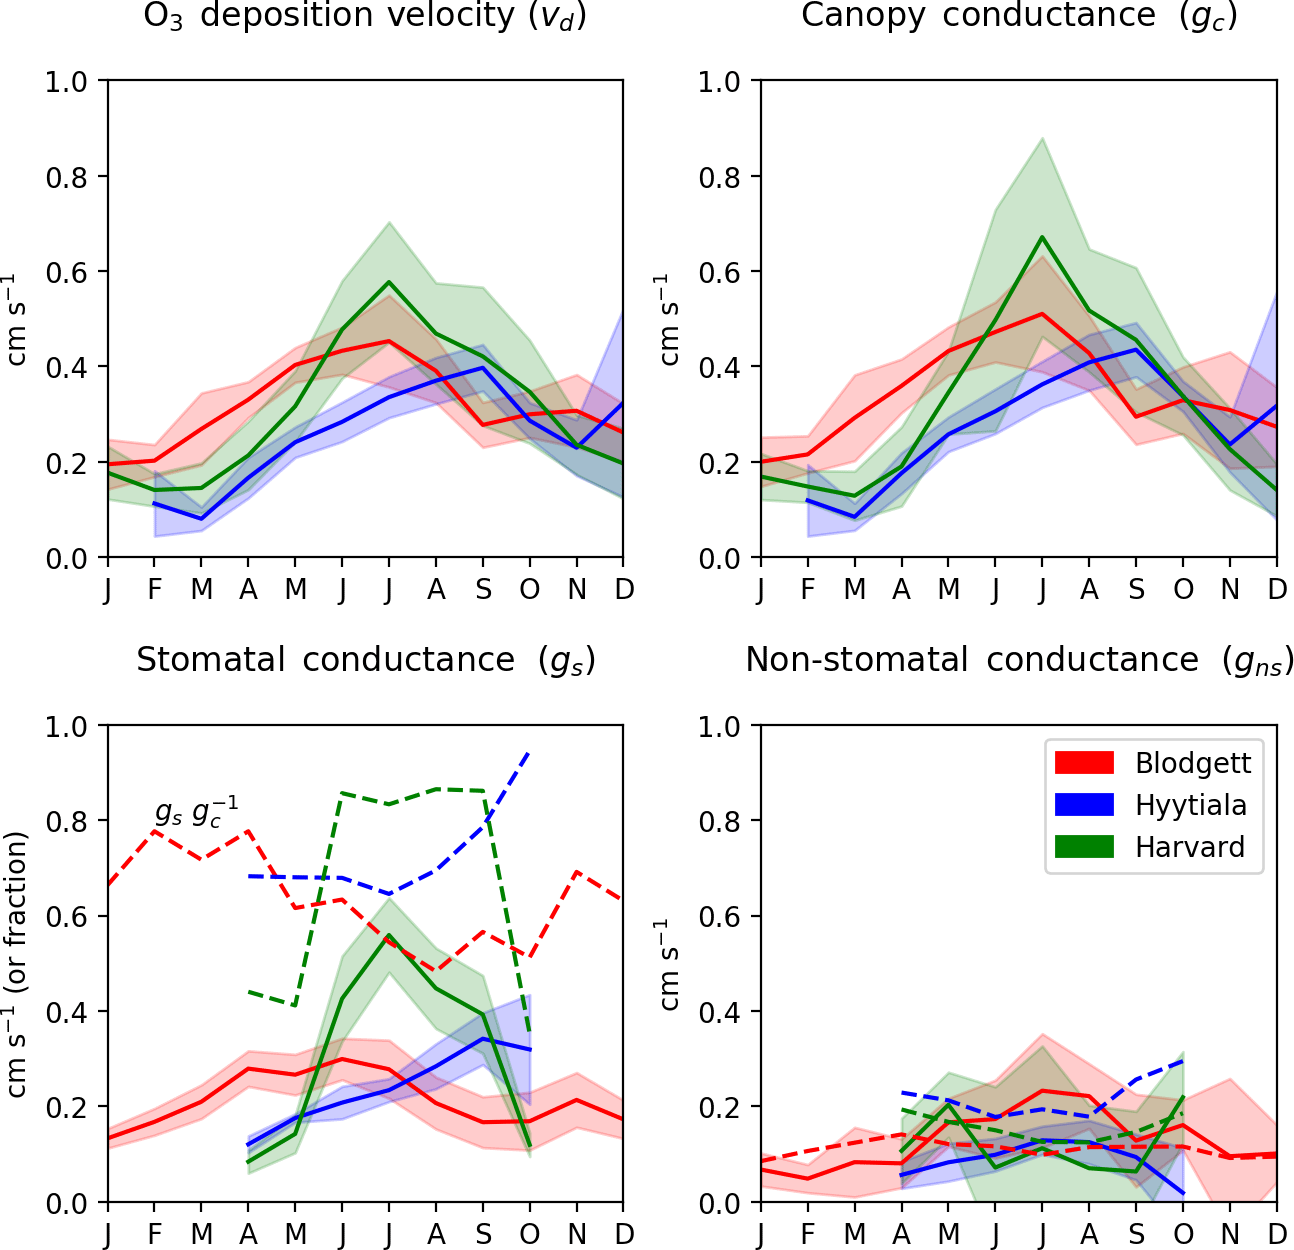
Figure 5Observed O3 deposition velocity and its in-canopy components at sites with O3 flux measurements. Lines show the multi-year mean and multi-year standard deviation calculated from the monthly averages described in Sect. 2.4. Dashed lines in the stomatal conductance panel show the stomatal fraction of total canopy conductance () and dashed lines in the non-stomatal conductance panel show the parameterized gns value.
A recent analysis of O3 flux measurements at Harvard Forest suggests that non-stomatal deposition averages 40 % of daytime O3 deposition during summer months, with a range of 20 %–60 % across years (Clifton et al., 2017). Our analysis of the same site does not support such a large role for non-stomatal deposition at this site in summer. For each year, we calculate summer daytime means of gs and gc by averaging the June–September values, and then calculate the non-stomatal fraction of deposition (). Averaged across years 1993–2000, we find that 8 % of daytime O3 deposition is non-stomatal during the summer, with a range of −33 % to 34 % across years. Negative fractions mean that stomatal conductance is large enough to explain all O3 deposition. A large negative non-stomatal fraction (−33 %) occurs in only one year (1996) and no other year is less than −11 %, which is within uncertainty of 0 % (2σ) according to the error propagation. Despite the small or zero non-stomatal fraction found here, our results continue to support the large year-to-year variability of this fraction reported by Clifton et al. (2017). The re-calibrated latent heat flux measurements are the main reason that our results differ from prior work and Supplement S3 provides further details. At Hyytiälä Forest, our results are consistent with prior work that found that the non-stomatal deposition is 26 % to 44 % of daytime O3 deposition during the growing season (Rannik et al., 2012). Nevertheless, non-stomatal deposition equals or exceeds stomatal uptake where there are large terpene emissions (e.g., Blodgett) and at some other temperate sites that probably lack large biogenic emissions (Fowler et al., 2001; Cieslik, 2004; Lamaud et al., 2009; Stella et al., 2011b; El-Madany et al., 2017). We also examined interannual variation in O3 deposition velocity. We find that the mean summer daytime vd is 0.40–0.68 cm s−1 at Harvard Forest, 0.42–0.65 cm s−1 at Blodgett Forest, and 0.43–0.51 cm s−1 at Hyytiälä. This range for Harvard Forest is somewhat smaller than other recent work (0.5–1.2 cm s−1; Clifton et al., 2017) because of the uncertainty-weighted averages used here (Sect. 2.4).
The data here also provide an opportunity to evaluate the parameterization of gns non-stomatal conductance (Zhang et al., 2003). The parameterized gns has a similar mean to observation-derived values in summer at Harvard Forest (0.16 vs. 0.12 cm s−1) and Hyytiälä (0.15 vs. 0.25 cm s−1). At Blodgett Forest, the parameterized gns is about half of observation-derived gns in summer, but this is not surprising since the parameterization does not account for O3 reactions with biogenic volatile organic compounds (BVOCs), which are known to be important at this site (Fares et al., 2010). In winter, however, the parameterized gns values at Blodgett Forest are similar to observations (0.10 vs. 0.08 cm s−1). The parameterization is therefore able to roughly predict mean non-stomatal conductance in the absence of major BVOC emissions. Nevertheless, the parameterization reproduces almost none of the daily variability of gns at any site (R2 < 0.1, Fig. S7). This corroborates the recent field assessment that non-stomatal conductance is a weak point of most current dry deposition algorithms (Wu et al., 2018). We attempted, unsuccessfully, to use BVOC emissions from the MEGAN biogenic emission model (Guenther et al., 2012) to improve the gns parameterization, but the correlations between compounds that react fastest with O3 (monoterpenes and sesquiterpenes) and the observation-derived daily mean gns were poor (R2≤0.15). On that basis, may also underestimate total O3 deposition at other sites with high monoterpene and sesquiterpene emissions, such as warm-weather pine forests, but should retain its quality everywhere.
4.1 Spatial patterns of synthetic fluxes
Across the 43 sites in the US shown in Fig. 3, mean during the growing season ranges from 0.5 to 11.0 nmol O3 m−2 s−1 with an average of 4.4 nmol O3 m−2 s−1. The highest generally occurs in the Midwest (5–9 nmol O3 m−2 s−1 in Wisconsin, Michigan, Nebraska, and Ohio) due to its moderate O3 concentrations (Fig. S6) and moisture levels, which promotes stomatal conductance (Fig. 1). The western US has higher average O3 concentrations, but generally lower moisture and stomatal conductance, especially the southwestern US, so (0–4 nmol O3 m−2 s−1) is mostly lower than the Midwest. Land cover, land management, and plant types can drive large differences in between nearby sites, even when O3 concentrations and meteorology are similar. For example, three Nebraska sites are all crop fields and O3 concentrations are nearly identical, but two irrigated fields have higher stomatal conductance and higher than the nearby rainfed field (6.2 vs. 4.8 nmol O3 m−2 s−1). Two sites in central California have high gs and compared to surrounding sites due to irrigation and naturally wet soil in the California Delta. A combination of topography and climate is also an important factor in California: forest sites in the Sierra Nevada have lower gs and than the lowland crops and wetland grasses. In Oregon, an evergreen needleleaf site regrowing after a fire has higher gs and than two older forest stands nearby. The differences between nine Wisconsin forest sites, however, are mostly due to different years of data at each site combined with interannual variability in ; fluxes at these sites are similar in overlapping years.
Table 2Mean O3 SynFlux, deposition velocity, and its conductance components during daytime in the growing season, grouped by plant functional type (PFT)a.
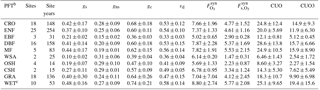
a Values are the mean ± standard deviation across sites within each PFT. Units are cm s−1 for gs, gns, gc, and vd; nmol O3 m−2 s−1 for and ; and mmol O3 m−2 for CUO and CUO3. b CRO: crop, ENF: evergreen needleleaf forest, EBF: evergreen broadleaf forest, DBF: deciduous broadleaf forest, MF: mixed forest, WSA: woody savanna, OSH: open shrubland, CSH: closed shrubland, GRA: grassland, WET: wetland. c Fluxes may be overestimated at wetland sites due to evaporation of surface water affecting the calculation of gs, but any errors are likely modest because the gs values here are reasonable (Drake et al., 2013).
Variability across the 60 sites in Europe is controlled by similar factors. Stomatal uptake ranges from 1.4 to 9.6 nmol O3 m−2 s−1, with an average of 4.7 nmol O3 m−2 s−1 (Fig. 3). The Mediterranean region has high O3 concentrations (Fig. S8) but generally low stomatal conductance due to the dry climate (Fig. 1). Within this region, vegetation type explains broad patterns. Shrub sites in Spain, France, and Sardinia have very low gs (∼0.15 cm s−1), so is low (1–3 nmol O3 m−2 s−1), while most of the sites in mainland Italy are broadleaf and evergreen forests that have slightly greater gs (∼0.2–0.4 cm s−1) and (3–6 nmol O3 m−2 s−1), despite similar climate and O3. In central and northern Europe, temperate climate promotes higher stomatal conductance, while O3 concentrations remain modest throughout the growing season. The largest is 9.8 nmol O3 m−2 s−1 at a deciduous broadleaf forest in Switzerland, while nearby evergreen forests, cereal crops, and grasslands all have lower fluxes (6–8 nmol O3 m−2 s−1). While Finland has a generally low of 2–5 nmol O3 m−2 s−1, the high end of this range is similar to rural sites in Germany, illustrating that O3 can impact remote ecosystems with high stomatal conductance, even where O3 concentrations are low.
Table 2 quantifies SynFlux, O3 deposition velocity, and conductance for each plant functional type. Wetlands, crops, and forests have the highest average , which is about 2 times higher than woody savanna or shrublands, the vegetation types with the lowest . At wetland sites, gs and could be overestimated due to evaporation of surface water (Sect. 2.1), but any error is likely modest because our estimates of stomatal conductance at these sites (0.48±0.16 cm s−1; Table 2) are reasonable for wetland vegetation (up to 1 cm s−1; Drake et al., 2013). The vegetation types rank in the same order for stomatal conductance, again showing stomata as the main control on O3 uptake into vegetation. Stomatal uptake exceeds non-stomatal uptake for all plant functional types except woody savanna and shrubland. O3 deposition velocities reported in Table 2 fall within the ranges of past literature, as reviewed by Silva and Heald (2017). However, while Silva and Heald found that the mean deposition velocity was greater over deciduous forests than coniferous forests, crops, or grass, we do not. Rather, we find that variability between sites within each of these categories is large, having a standard deviation of about 30 % of the multi-site mean.
4.2 Metrics for O3 damage to plants
Since O3 injures plants mainly by internal oxidative damage after entering the leaves through stomata, the most physiological predictor of plant injuries is the cumulative uptake of O3 (CUO, Reich, 1987; Fuhrer, 2000; Karlsson et al., 2004; Cieslik, 2004; Matyssek et al., 2007). CUO is defined as the cumulative stomatal O3 flux exceeding a threshold flux Y that can be detoxified by the plant, integrated over a period of time:
Here, H(x) is the Heaviside step function and Δti is the time elapsed during measurement of . The sum is carried out over time i in the growing season, which we define based on GPP (Sect. 2.1). The detoxification threshold varies across vegetation types, even among related species (Karlsson et al., 2004; Büker et al., 2015), and thresholds for specific FLUXNET sites are generally unknown. As a compromise, we calculate CUO, with Y=0, and also CUO3, with Y=3 nmol O3 m−2 s−1, which has been suggested as a reasonable generic threshold (Mills et al., 2011). CUO is always greater than CUO3, but the sites with high CUO tend to also have high CUO3, so their spatial patterns are similar (Fig. S8).
While CUO is a physiological dose, concentration-based metrics remain common for assessing ozone impacts because they are easier to measure. Concentration-based metrics quantify O3 in ambient air irrespective of whether that O3 enters leaves. These metrics follow the general form
where w(χ) is a weighting function applied to the O3 mole fraction χ, and χc is a constant. Like CUO, the sum is usually over time i during the growing season. Three of the most common concentration-based O3 metrics are the mean O3 concentration, the accumulated concentration over a threshold of 40 ppb (AOT40; UNECE, 2004), and the sigmoidal-weighted index (W126; Lefohn and Runeckles, 1987). For mean, and χc=0. For AOT40, and χc= 40 ppb. For W126, and χc=0. Both AOT40 and W126 use only daytime (08:00–20:00) measurements and W126 also takes the maximum value over all 3-month periods during the growing season. The weighting functions for AOT40 and W126 give little or no weight to O3 concentrations below 40 ppb. In addition, W126 gives increasing weight to concentrations up to about 110 ppb and full weight for higher concentrations based on the understanding that exposure to high O3 concentrations is more injurious than moderate or low concentrations. Other concentration-based metrics (e.g., SUM60) use other thresholds or weighting functions, but many are strongly correlated with AOT40 or W126 or otherwise qualitatively similar (Paoletti et al., 2007).
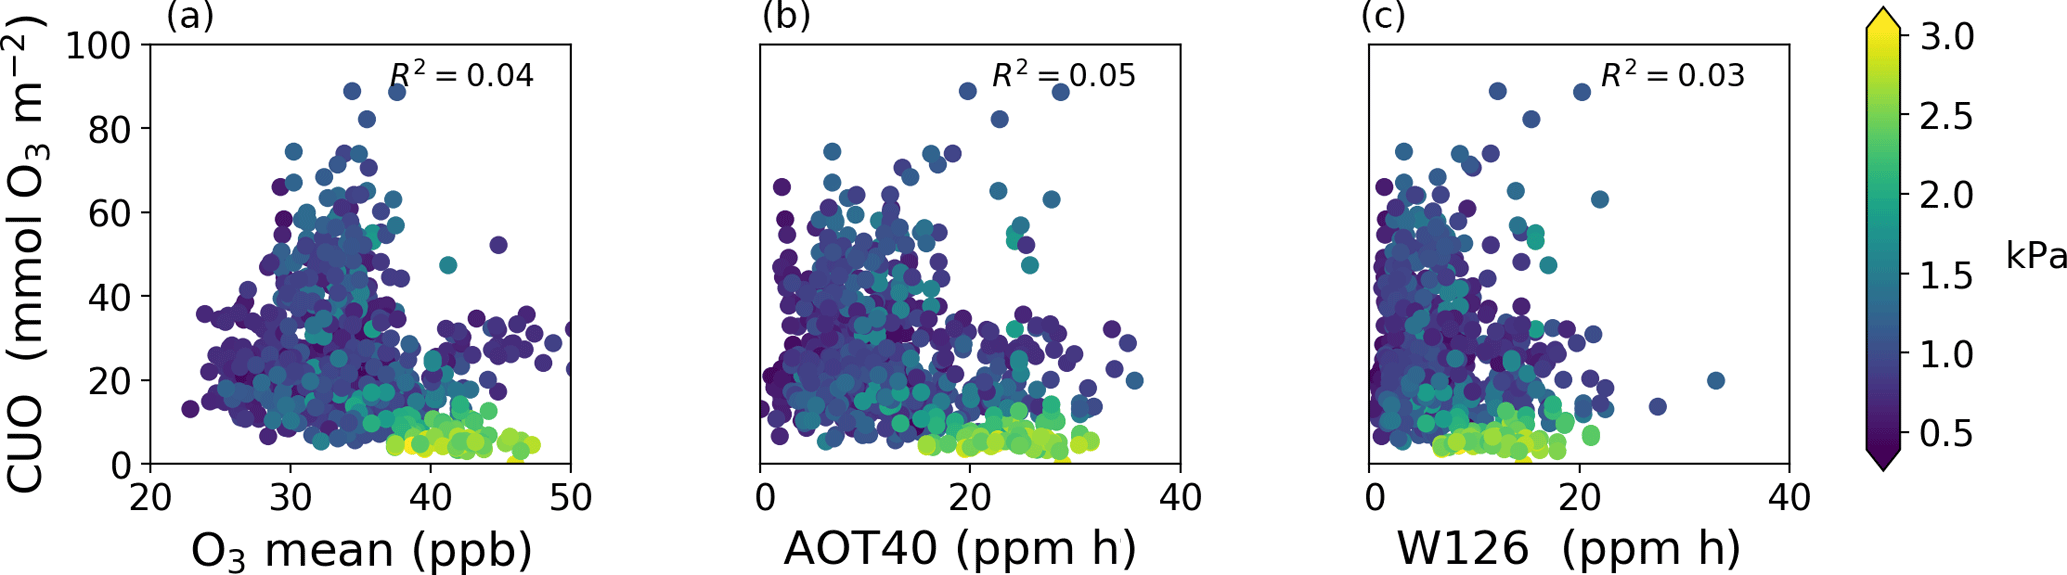
Figure 6Comparison of cumulative uptake of O3 (CUO) to concentration-based metrics of O3 exposure during the daytime growing season at 103 sites: mean O3 concentration (a), AOT40 (center), and W126 (b). There is one value (dot) per site per year. Colors show mean vapor pressure deficit during the growing season.
The spatial patterns of AOT40 and W126 closely resemble that of mean O3 concentration in the US and Europe despite their different weighting functions (Fig. S9). AOT40 and W126 are well correlated with each other across sites (R2=0.87) and with mean O3 mole fraction (R2=0.76 and R2=0.52 for mean O3 vs. AOT40 and W126, respectively) despite their different weighting functions. As a result, all of these concentration-based metrics have similar spatial patterns in the US and Europe. The CUO and CUO3 spatial patterns, however, are similar to and distinct from the concentration-based metrics. This illustrates that locations with high AOT40 or W126, like the southwestern US or Mediterranean Europe, can have low CUO.
Even though concentration-based metrics do not measure the physiological O3 dose to plants, they can be useful if the metric is proportional to the flux-based dose and injuries. Indeed, many controlled experiments and observational studies have documented correlations between both AOT40 and W126 and either uptake or plant injuries (e.g., Fuhrer et al., 1997; Cieslik, 2004; Musselman et al., 2006; Matyssek et al., 2010). However, many of these studies were carried out at a single site or under conditions where stomatal conductance was relatively steady while O3 concentrations varied, for example by maintaining well-watered soil. When stomatal conductance varies widely, such as between arid and humid climates or seasons, concentration-based metrics may not correlate with stomatal O3 flux (Mills et al., 2011).
Figure 6 shows that all of the concentration-based metrics are poorly correlated with CUO across the sites (AOT40: R2=0.05, W126: R2=0.03, mean O3: R2=0.04). Humidity helps explain some of the scatter in Fig. 6. The sites with high concentration-based metrics and low CUO have high vapor pressure deficit (VPD) and low stomatal conductance, and are mostly in the western US and Mediterranean Europe. Restricting the analysis to humid sites (VPD < 1.5 kPa) does not improve the correlation (R2≈0.05) and at the arid sites (VPD > 1.6 kPa) the concentration-based metrics are modestly anti-correlated with CUO (AOT40: R2=0.19, W126: R2=0.05, mean O3: R2=0.37). This result reinforces that concentration-based metrics can misrepresent CUO and plant injuries (Mills et al., 2011).
From the CUO values in Table 2, we can estimate the range of O3 impacts on biomass production at the FLUXNET sites. Although species vary in their sensitivity to O3 (Lombardozzi et al., 2013), several studies suggest that the biomass production of broadleaf and needleleaf trees decreases by 0.2 % to 1 % per mmol O3 m−2 of CUO (Karlsson et al., 2004; Wittig et al., 2007; Hoshika et al., 2015). Combining the mean CUO for each plant functional type (Table 2) with these sensitivities, our work implies that O3 reduces the biomass production at these FLUXNET sites by 6 %–29 % for deciduous broadleaf forests and 4 %–20 % for needleleaf forests. The range represents the spread of reported dose–response sensitivities within each plant type, meaning the least and most O3-sensitive species. Several broadleaf crops are more sensitive to O3, with biomass reductions of 1.3 %–1.6 % per mmol O3 m−2 of CUO3 (Mills et al., 2011). That sensitivity implies a 20 %–24 % drop in biomass production at FLUXNET crop sites. Some studies have quantified O3 dose–response relationships with other thresholds Y=1.6 to 6 nmol O3 m−2 s−1 (e.g., Karlsson et al., 2007; Pleijel et al., 2004, 2014), but the sensitivities have a similar magnitude. Fares et al. (2013) also demonstrated 12 %–19 % reduction in gross primary production due to O3 at some of the same crop and forest FLUXNET sites. Using prognostic models of O3 concentrations and stomatal uptake, several past studies have also suggested that O3 reduces biomass production and CO2 sequestration by 4 %–20 % in the US and Europe (Sitch et al., 2007; Wittig et al., 2007; Mills et al., 2011; Yue et al., 2014, 2016; Lombardozzi et al., 2015). Our results support this range of impacts, although some FLUXNET sites and species likely experience greater O3 injury, but here the CUO is highly constrained from observations and therefore avoids the additional uncertainties of atmosphere–biosphere models.
We have demonstrated a method to estimate O3 fluxes and stomatal O3 uptake at eddy covariance flux towers wherever regional O3 monitors exist. The method, called SynFlux, derives stomatal conductance and O3 deposition velocity from standard eddy covariance measurements and combines them with gridded O3 concentrations from air quality monitoring networks. We apply this method to the FLUXNET2015 dataset and derive synthetic flux estimates at 43 sites in the United States and 60 sites in Europe, totaling 926 site years of observations. O3 deposition measurements have previously only been sporadically available for a few sites around the world, so this work dramatically increases the flux data available for understanding O3 impacts on vegetation and for evaluating air quality and climate models.
Three sites with long-term O3 flux measurements provide an independent test of SynFlux. These comparisons show that daily averages of synthetic stomatal correlate well with observation-derived (R2=0.83–0.93) and have a mean bias under 22 % at all sites. At all three sites 95 % of the synthetic values differ from measurements by a factor of 2 or less. The differences between and are also consistent with propagated uncertainty in the underlying measurements. Synthetic total deposition, , is sensitive to errors in the parameterized non-stomatal conductance, but mean values are still with a factor of 2 of observations. The errors in this dataset are modest compared with differences between observations and regional and global atmospheric chemistry models that are frequently a factor of 2 or more (Zhang et al., 2003; Hardacre et al., 2015; Clifton et al., 2017; Silva and Heald, 2017), illustrating the utility of this dataset for evaluating models and O3 impacts.
Across flux tower sites in the US and Europe, ranges from 0.5 to 11.0 nmol O3 m−2 s−1 during the summer growing season. The spatial pattern of is mainly controlled by stomatal conductance rather than O3 concentration. Patterns of stomatal conductance and in turn are explained by climate, especially atmospheric and soil moisture, vegetation types, and land management, such as irrigation. O3 concentration-based metrics (AOT40, W126, mean O3) have been widely used to evaluate O3 damages to plants because they are easier and cheaper to measure than the cumulative uptake of O3 (CUO) into leaves. However, these metrics have very little correlation with CUO (R2≤0.05) across FLUXNET sites. Using dose–response relationships between CUO and biomass reduction, we estimate that O3 reduces biomass production and carbon uptake by 4 %–29 %, depending on the site and plant type. Unlike most past estimates, which have used prognostic models of O3 uptake, our assessment of biomass reduction is based on O3 fluxes that are tightly constrained by observations. To promote further applications in ecosystem monitoring and modeling, the SynFlux dataset is publicly available as monthly averages of , , O3 deposition velocity, stomatal conductance, and related variables.
SynFlux data are archived and publicly available at https://doi.org/10.5281/zenodo.1402054 (Ducker et al., 2018).
The supplement related to this article is available online at: https://doi.org/10.5194/bg-15-5395-2018-supplement.
The authors declare that they have no conflict of interest.
This work was supported by the Winchester Fund and by the Council on Research
Creativity at Florida State University. Eddy covariance data used here were
acquired and shared by the FLUXNET community, including the AmeriFlux and
CarboEuropeIP networks. The FLUXNET eddy covariance data processing and
harmonization were carried out by the European Fluxes Database Cluster,
AmeriFlux Management Project, and Fluxdata project of FLUXNET, with the
support of CDIAC and the ICOS Ecosystem Thematic Center, and the OzFlux,
ChinaFlux, and AsiaFlux offices. Trevor F. Keenan was supported by the Director, Office of Science, Office of Biological
and Environmental Research of the US Department of Energy under contract
DE-AC02-05CH11231 as part of the RUBISCO SFA. The O3 concentration
and flux measurements from Harvard Forest used in this analysis were
supported by the National Science Foundation through the LTER program and
various programs under the US Department of Energy Office of Science (BER).
At Hyytiälä Forest, O3 concentrations and flux measurements
were supported by ICOS-Finland (281255) and the Academy of Finland Center of
Excellence program (307331). At Blodgett Forest, O3 concentrations
and flux measurements were supported by ICOS-Finland (281255) and the Academy
of Finland Center of Excellence program (307331). The long-term O3
concentration and flux measurements from Blodgett Forest used in this
analysis were supported by a combination of grants from the Kearney
Foundation of Soil Science, the University of California Agricultural
Experiment Station, the US Department of Energy Office of Science (BER), the
National Science Foundation Atmospheric Chemistry Program, and the California
Air Resources Board.
Edited by: Lutz
Merbold
Reviewed by: two anonymous referees
Acosta, M., Pavelka, M., Montagnani, L., Kutsch, W., Lindroth, A., Juszczak, R., and Janouš, D.: Soil surface CO2 efflux measurements in Norway spruce forests: Comparison between four different sites across Europe – from boreal to alpine forest, Geoderma, 192, 295–303, https://doi.org/10.1016/j.geoderma.2012.08.027, 2013.
Ainsworth, E. A. and Long, S. P.: What have we learned from 15 years of free-air CO2 enrichment (FACE)? A meta-analytic review of the responses of photosynthesis, canopy properties and plant production to rising CO2, New Phytol., 165, 351–372, https://doi.org/10.1111/j.1469-8137.2004.01224.x, 2005.
Ainsworth, E. E. A., Yendrek, C. R., Sitch, S., Collins, W. J., and Emberson, L. D.: The effects of tropospheric ozone on net primary productivity and implications for climate change, Annu. Rev. Plant Biol., 63, 637–61, https://doi.org/10.1146/annurev-arplant-042110-103829, 2012.
Altimir, N., Kolari, P., Tuovinen, J., Vesala, T., Bäck, J., Suni, T., Hari, P., Altimir, N., Kolari, P., Tuovinen, J., Vesala, T., and Bäck, J.: Foliage surface ozone deposition: a role for surface moisture?, Biogeosciences, 3, 209–228, https://doi.org/10.5194/bg-3-209-2006.
Ammann, C., Spirig, C., Leifeld, J., and Neftel, A.: Assessment of the nitrogen and carbon budget of two managed temperate grassland fields, Agr. Ecosyst. Environ., 133, 150–162, https://doi.org/10.1016/j.agee.2009.05.006, 2009.
Anderson, D. E., Verma, S. B., and Rosenberg, N. J.: Eddy correlation measurements of CO2, latent heat, and sensible heat fluxes over a crop surface, Bound.-Lay. Meteorol., 29, 263–272, https://doi.org/10.1007/BF00119792, 1984.
Anthoni, P. M., Knohl, A., Rebmann, C., Freibauer, A., Mund, M., Ziegler, W., Kolle, O., and Schulze, E.-D.: Forest and agricultural land-use-dependent CO2 exchange in Thuringia, Germany, Glob. Change Biol., 10, 2005–2019, https://doi.org/10.1111/j.1365-2486.2004.00863.x, 2004.
Aubinet, M., Chermanne, B., Vandenhaute, M., Longdoz, B., Yernaux, M., and Laitat, E.: Long term carbon dioxide exchange above a mixed forest in the Belgian Ardennes, Agr. Forest Meteorol., 108, 293–315, https://doi.org/10.1016/s0168-1923(01)00244-1, 2001.
Avnery, S., Mauzerall, D. L., Liu, J., and Horowitz, L. W.: Global crop yield reductions due to surface ozone exposure: 1. Year 2000 crop production losses and economic damage, Atmos. Environ., 45, 2284–2296, https://doi.org/10.1016/j.atmosenv.2010.11.045, 2011.
Baldocchi, D.: AmeriFlux US-Tw4 Twitchell East End Wetland, Ameriflux, Univ. of Califronia, Berkeley, CA, USA, https://doi.org/10.17190/AMF/1246151, 2016.
Baldocchi, D., Falge, E., Gu, L., Olson, R., Hollinger, D., Running, S., Anthoni, P., Bernhofer, C., Davis, K., Evans, R., Fuentes, J., Goldstein, A., Katul, G., Law, B., Lee, X., Malhi, Y., Meyers, T., Munger, W., Oechel, W., Paw, U. K. T., Pilegaard, K., Schmid, H. P., Valentini, R., Verma, S., Vesala, T., Wilson, K., and Wofsy, S.: FLUXNET: A new tool to study the temporal and spatial variability of ecosystem-scale carbon dioxide, water vapor, and energy flux densities, B. Am. Meteorol. Soc., 82, 2415–2434, https://doi.org/10.1175/1520-0477(2001)082<2415:FANTTS>2.3.CO;2, 2001.
Baldocchi, D., Chen, Q., Chen, X., Ma, S., Miller, G., Ryu, Y., Xiao, J., Wenk, R., and Battles, J.: The dynamics of energy, water, and carbon fluxes in a blue oak (Quercus douglasii) savanna in California, Ecosyst. Funct. Savannas, 1, 135–151, https://doi.org/10.1201/b10275-10, 2010.
Berbigier, P., Bonnefond, J.-M., and Mellmann, P.: CO2 and water vapour fluxes for 2 years above Euroflux forest site, Agr. Forest Meteorol., 108, 183–197, https://doi.org/10.1016/s0168-1923(01)00240-4, 2001.
Bonan, G. B., Lawrence, P. J., Oleson, K. W., Levis, S., Jung, M., Reichstein, M., Lawrence, D. M., and Swenson, S. C.: Improving canopy processes in the Community Land Model version 4 (CLM4) using global flux fields empirically inferred from FLUXNET data, J. Geophys. Res., 116, G02014, https://doi.org/10.1029/2010JG001593, 2011.
Bowling, D. R., Bethers-Marchetti, S., Lunch, C. K., Grote, E. E., and Belnap, J.: Carbon, water, and energy fluxes in a semiarid cold desert grassland during and following multiyear drought, J. Geophys. Res., 115, G04026, https://doi.org/10.1029/2010jg001322, 2010.
Büker, P., Feng, Z., Uddling, J., Briolat, A., Alonso, R., Braun, S., Elvira, S., Gerosa, G., Karlsson, P. E., Le Thiec, D., Marzuoli, R., Mills, G., Oksanen, E., Wieser, G., Wilkinson, M., and Emberson, L. D.: New flux based dose-response relationships for ozone for European forest tree species, Environ. Pollut., 206, 163–174, https://doi.org/10.1016/j.envpol.2015.06.033, 2015.
Carrara, A., Janssens, I. A., Yuste, J. C., and Ceulemans, R.: Seasonal changes in photosynthesis, respiration and NEE of a mixed temperate forest, Agr. Forest Meteorol., 126, 15–31, https://doi.org/10.1016/j.agrformet.2004.05.002, 2004.
Chiesi, M., Maselli, F., Bindi, M., Fibbi, L., Cherubini, P., Arlotta, E., Tirone, G., Matteucci, G., and Seufert, G.: Modelling carbon budget of Mediterranean forests using ground and remote sensing measurements, Agr. Forest Meteorol., 135, 22–34, https://doi.org/10.1016/j.agrformet.2005.09.011, 2005.
Cieslik, S. A.: Ozone uptake by various surface types: A comparison between dose and exposure, Atmos. Environ., 38, 2409–2420, https://doi.org/10.1016/j.atmosenv.2003.10.063, 2004.
Claverie, M., Vermote, E. F., Weiss, M., Baret, F., Hagolle, O., and Demarez, V.: Validation of coarse spatial resolution LAI and FAPAR time series over cropland in southwest France, Remote Sens. Environ., 139, 216–230, https://doi.org/10.1016/j.rse.2013.07.027, 2013.
Claverie, M., Matthews, J. L., Vermote, E. F., and Justice, C. O.: A 30 + Year AVHRR LAI and FAPAR Climate Data Record?: Algorithm Description and Validation, Remote Sens., 8, 1–12, https://doi.org/10.3390/rs8030263, 2016.
Clifton, O. E., Fiore, A. M., Munger, J. W., Malyshev, S., Horowitz, L. W., Shevliakova, E., Paulot, F., Murray, L. T., and Griffin, K. L.: Interannual variability in ozone removal by a temperate deciduous forest, Geophys. Res. Lett., 44, 542–552, https://doi.org/10.1002/2016GL070923, 2017.
Cook, B. D., Davis, K. J., Wang, W., Desai, A., Berger, B. W., Teclaw, R. M., Martin, J. G., Bolstad, P. V., Bakwin, P. S., Yi, C., and Heilman, W.: Carbon exchange and venting anomalies in an upland deciduous forest in northern Wisconsin, USA, Agr. Forest Meteorol., 126, 271–295, https://doi.org/10.1016/j.agrformet.2004.06.008, 2004.
Delpierre, N., Berveiller, D., Granda, E., and Dufrêne, E.: Wood phenology, not carbon input, controls the interannual variability of wood growth in a temperate oak forest, New Phytol., 210, 459–470, https://doi.org/10.1111/nph.13771, 2015.
Desai, A. R., Bolstad, P. V., Cook, B. D., Davis, K. J., and Carey, E. V.: Comparing net ecosystem exchange of carbon dioxide between an old-growth and mature forest in the upper Midwest, USA, Agr. Forest Meteorol., 128, 33–55, https://doi.org/10.1016/j.agrformet.2004.09.005, 2005.
Desai, A. R., Xu, K., Tian, H., Weishampel, P., Thom, J., Baumann, D., Andrews, A. E., Cook, B. D., King, J. Y., and Kolka, R.: Landscape-level terrestrial methane flux observed from a very tall tower, Agr. Forest Meteorol., 201, 61–75, https://doi.org/10.1016/j.agrformet.2014.10.017, 2015.
Dietiker, D., Buchmann, N., and Eugster, W.: Testing the ability of the DNDC model to predict CO2 and water vapour fluxes of a Swiss cropland site, Agr. Ecosyst. Environ., 139, 396–401, https://doi.org/10.1016/j.agee.2010.09.002, 2010.
Dolman, A. J., Moors, E. J., and Elbers, J. A.: The carbon uptake of a mid latitude pine forest growing on sandy soil, Agr. Forest Meteorol., 111, 157–170, https://doi.org/10.1016/S0168-1923(02)00024-2, 2002.
Dragoni, D., Schmid, H. P., Wayson, C. A., Potter, H., Grimmond, C. S. B., and Randolph, J. C.: Evidence of increased net ecosystem productivity associated with a longer vegetated season in a deciduous forest in south-central Indiana, USA, Glob. Change Biol., 17, 886–897, https://doi.org/10.1111/j.1365-2486.2010.02281.x, 2011.
Drake, P. L., Froend, R. H., and Franks, P. J.: Smaller, faster stomata?: scaling of stomatal size, rate of response, and stomatal conductance, Exp. Bot., 64, 495–505, https://doi.org/10.1093/jxb/ers347, 2013.
Ducker, J. A., Holmes, C. D., Keenan, T. F., Fares, S., Goldstein, A. H., Mammarella, I., Munger, J. W., and Schnell, J.: Synthetic ozone depsoition and stomatal uptake at flux tower sites, Biogeosciences Discuss., https://doi.org/10.5194/bg-2018-172, 2018.
Dušek, J., Čížková, H., Stellner, S., Czerný, R., and Květ, J.: Fluctuating water table affects gross ecosystem production and gross radiation use efficiency in a sedge-grass marsh, Hydrobiologia, 692, 57–66, https://doi.org/10.1007/s10750-012-0998-z, 2012.
El-Madany, T., Niklasch, K., and Klemm, O.: Stomatal and non-stomatal turbulent deposition flux of ozone to a managed peatland, Atmosphere, 8, p. 175, https://doi.org/10.3390/atmos8090175, 2017.
Etzold, S., Ruehr, N. K., Zweifel, R., Dobbertin, M., Zingg, A., Pluess, P., Häsler, R., Eugster, W., and Buchmann, N.: The carbon balance of two contrasting mountain forest ecosystems in Switzerland: Similar annual trends, but seasonal differences, Ecosystems, 14, 1289–1309, https://doi.org/10.1007/s10021-011-9481-3, 2011.
Fares, S., McKay, M., Holzinger, R., and Goldstein, A. H.: Ozone fluxes in a Pinus ponderosa ecosystem are dominated by non-stomatal processes: Evidence from long-term continuous measurements, Agr. Forest Meteorol., 150, 420–431, https://doi.org/10.1016/j.agrformet.2010.01.007, 2010.
Fares, S., Vargas, R., Detto, M., Goldstein, A. H., Karlik, J., Paoletti, E., and Vitale, M.: Tropospheric ozone reduces carbon assimilation in trees: Estimates from analysis of continuous flux measurements, Glob. Change Biol., 19, 2427–2443, doi:10.1111/gcb.12222, 2013.
Fares, S., Savi, F., Muller, J., Matteucci, G., and Paoletti, E.: Simultaneous measurements of above and below canopy ozone fluxes help partitioning ozone deposition between its various sinks in a Mediterranean Oak Forest, Agr. Forest Meteorol., 198/199, 181–191, https://doi.org/10.1016/j.agrformet.2014.08.014, 2014.
Ferréa, C., Zenone, T., Comolli, R., and Seufert, G.: Estimating heterotrophic and autotrophic soil respiration in a semi-natural forest of Lombardy, Italy, Pedobiologia, 55, 285–294, https://doi.org/10.1016/j.pedobi.2012.05.001, 2012.
Finkelstein, P. L., Ellestad, T. G., Clarke, J. F., Meyers, T. P., Schwede, D. B., Hebert, E. O., and Neal, J. A.: Ozone and sulfur dioxide dry deposition to forests: Observations and model evaluation, J. Geophys. Res.-Atmos., 105, 15365–15377, https://doi.org/10.1029/2000JD900185, 2000.
Fischer, M. L., Billesbach, D. P., Berry, J. A., Riley, W. J., and Torn, M. S.: Spatiotemporal variations in growing season exchanges of CO2, H2O, and sensible heat in agricultural fields of the Southern Great Plains, Earth Interact., 11, 1–21, https://doi.org/10.1175/ei231.1, 2007.
Fowler, D., Flechard, C., Cape, J. N., Storeton-West, R. L., and Coyle M.: Measurements of ozone deposition to vegetation quantifying the flux, the stomatal and non-stomatal components, Water. Air. Soil Pollut., 130, 63–74, https://doi.org/10.1023/A:1012243317471, 2001.
Foken, T.: Micrometeorology, 2nd Edn., Springer, 2, 1–326, https://doi.org/10.1007/978-3-642-25440-6, 2017.
Frank, J. M., Massman, W. J., Ewers, B. E., Huckaby, L. S., and Negrón, J. F.: Ecosystem CO2 ∕ H2O fluxes are explained by hydraulically limited gas exchange during tree mortality from spruce bark beetles, J. Geophys. Res.-Biogeo., 119, 1195–1215, https://doi.org/10.1002/2013jg002597, 2014.
Fuhrer, J.: Introduction to the special issue on ozone risk analysis for vegetation in Europe, Environ. Pollut., 109, 359–360, 2000.
Fuhrer, J., Skärby, L., and Ashmore, M. R.: Critical levels for ozone effects on vegetation in Europe, Environ. Pollut., 97, 91–106, https://doi.org/10.1016/S0269-7491(97)00067-5, 1997.
Galvagno, M., Wohlfahrt, G., Cremonese, E., Rossini, M., Colombo, R., Filippa, G., Julitta, T., Manca, G., Siniscalco, C., di Cella, U. M., and Migliavacca, M.: Phenology and carbon dioxide source/sink strength of a subalpine grassland in response to an exceptionally short snow season, Environ. Res. Lett., 8, 25008, https://doi.org/10.1088/1748-9326/8/2/025008, 2013.
Garbulsky, M. F., Penuelas, J., Papale, D., and Filella, I.: Remote estimation of carbon dioxide uptake by a Mediterranean forest, Glob. Change Biol., 14, 2860–2867, https://doi.org/10.1111/j.1365-2486.2008.01684.x, 2008.
Gelaro, R., McCarty, W., Suárez, M. J., Todling, R., Molod, A., Takacs, L., Randles, C. A., Darmenov, A., Bosilovich, M. G., Reichle, R., Wargan, K., Coy, L., Cullather, R., Draper, C., Akella, S., Buchard, V., Conaty, A., da Silva, A. M., Gu, W., Kim, G. K., Koster, R., Lucchesi, R., Merkova, D., Nielsen, J. E., Partyka, G., Pawson, S., Putman, W., Rienecker, M., Schubert, S. D., Sienkiewicz, M., and Zhao, B.: The modern-era retrospective analysis for research and applications, version 2 (MERRA-2), J. Clim., 30, 5419–5454, https://doi.org/10.1175/JCLI-D-16-0758.1, 2017.
Gentine, P., Chhang, A., Rigden, A., and Salvucci, G.: Evaporation estimates using weather station data and boundary layer theory, Geophys. Res. Lett., 43, 661–670, https://doi.org/10.1002/2016GL070819, 2016.
Gerosa, G., Marzuoli, R., Cieslik, S., and Ballarin-Denti, A.: Stomatal ozone fluxes over a barley field in Italy, “Effective exposure” as a possible link between exposure- and flux-based approaches, Atmos. Environ., 38, 2421–2432, https://doi.org/10.1016/j.atmosenv.2003.12.040, 2004.
Gerosa, G., Vitale, M., Finco, A., Manes, F., Denti, A. B., and Cieslik, S.: Ozone uptake by an evergreen Mediterranean Forest (Quercus ilex) in Italy. Part I: Micrometeorological flux measurements and flux partitioning, Atmos. Environ., 39, 3255–3266, https://doi.org/10.1016/j.atmosenv.2005.01.056, 2005.
Gerosa, G., Derghi, F., and Cieslik, S.: Comparison of different algorithms for stomatal ozone flux determination from micrometeorological measurements, Water. Air. Soil Pollut., 179, 309–321, https://doi.org/10.1007/s11270-006-9234-7, 2007.
Goldstein, A. H., Hultman, N. E., Fracheboud, J. M., Bauer, M. R., Panek, J. A., Xu, M., Qi, Y., Guenther, A. B., and Baugh, W.: Effects of climate variability on the carbon dioxide, water, and sensible heat fluxes above a ponderosa pine plantation in the Sierra Nevada (CA), Agr. Forest Meteorol., 101, 113–129, https://doi.org/10.1016/S0168-1923(99)00168-9, 2000.
Gough, C. M., Hardiman, B. S., Nave, L. E., Bohrer, G., Maurer, K. D., Vogel, C. S., Nadelhoffer, K. J., and Curtis, P. S.: Sustained carbon uptake and storage following moderate disturbance in a Great Lakes forest, Ecol. Appl., 23, 1202–1215, https://doi.org/10.1890/12-1554.1, 2013.
Grünwald, T. and Bernhofer, C.: A decade of carbon, water and energy flux measurements of an old spruce forest at the Anchor Station Tharandt, Tellus B, 59, 387–396, https://doi.org/10.3402/tellusb.v59i3.17000, 2007.
Guidi, L., Nali, C., Lorenzini, G., Filippi, F., and Soldatini, G. F.: Effect of chronic ozone fumigation on the photosynthetic process of poplar clones showing different sensitivity, Environ. Pollut., 113, 245–254, https://doi.org/10.1016/S0269-7491(00)00194-9, 2001.
Hardacre, C., Wild, O., and Emberson, L.: An evaluation of ozone dry deposition in global scale chemistry climate models, Atmos. Chem. Phys., 15, 6419–6436, https://doi.org/10.5194/acp-15-6419-2015, 2015.
Hatala, J. A., Detto, M., Sonnentag, O., Deverel, S. J., Verfaillie, J., and Baldocchi, D. D.: Greenhouse gas (CO2, CH4, H2O) fluxes from drained and flooded agricultural peatlands in the Sacramento-San Joaquin Delta, Agr. Ecosyst. Environ., 150, 1–18, https://doi.org/10.1016/j.agee.2012.01.009, 2012.
Holtslag, A. A. M. and De Bruin, H. A. R.: Applied modeling of the nighttime surface energy balance over land, J. Appl. Meteorol., 27, 689–704, https://doi.org/10.1175/1520-0450(1988)027<0689:AMOTNS>2.0.CO;2, 1988.
Hommeltenberg, J., Schmid, H. P., Drösler, M., and Werle, P.: Can a bog drained for forestry be a stronger carbon sink than a natural bog forest?, Biogeosciences, 11, 3477–3493, https://doi.org/10.5194/bg-11-3477-2014, 2014.
Hoshika, Y., Katata, G., Deushi, M., Watanabe, M., Koike, T., and Paoletti, E.: Ozone-induced stomatal sluggishness changes carbon and water balance of temperate deciduous forests, Sci. Rep., 5, 9871, https://doi.org/10.1038/srep09871, 2015.
Imer, D., Merbold, L., Eugster, W., and Buchmann, N.: Temporal and spatial variations of soil CO2, CH4 and N2O fluxes at three differently managed grasslands, Biogeosciences, 10, 5931–5945, https://doi.org/10.5194/bg-10-5931-2013, 2013.
Irvine, J., Law, B. E., and Hibbard, K. A.: Postfire carbon pools and fluxes in semiarid ponderosa pine in Central Oregon, Glob. Change Biol., 13, 1748–1760, https://doi.org/10.1111/j.1365-2486.2007.01368.x, 2007.
Irvine, J., Law, B. E., Martin, J. G., and Vickers, D.: Interannual variation in soil CO2 efflux and the response of root respiration to climate and canopy gas exchange in mature ponderosa pine, Glob. Change Biol., 14, 2848–2859, https://doi.org/10.1111/j.1365-2486.2008.01682.x, 2008.
Jacobs, C. M. J., Jacobs, A. F. G., Bosveld, F. C., Hendriks, D. M. D., Hensen, A., Kroon, P. S., Moors, E. J., Nol, L., Schrier-Uijl, A., and Veenendaal, E. M.: Variability of annual CO2 exchange from Dutch grasslands, Biogeosciences, 4, 803–816, https://doi.org/10.5194/bg-4-803-2007, 2007.
Jacobson, M. Z.: Fundamentals of atmospheric modeling second edition, Cambridge University Press, 1–707, 2005.
Karlsson, P. E., Uddling, J., Braun, S., Broadmeadow, M., Elvira, S., Gimeno, B. S., Le Thiec, D., Oksanen, E., Vandermeiren, K., Wilkinson, M., and Emberson, L.: New critical levels for ozone effects on young trees based on AOT40 and simulated cumulative leaf uptake of ozone, Atmos. Environ., 38, 2283–2294, https://doi.org/10.1016/j.atmosenv.2004.01.027, 2004.
Kavassalis, S. C. and Murphy, J. G.: Understanding ozone-meteorology correlations: A role for dry deposition, Geophys. Res. Lett., 44, 2922–2931, https://doi.org/10.1002/2016GL071791, 2017.
Keronen, P., Reissell, A., Rannik, Ü., Pohja, T., Siivola, E., Hiltunen, V., Hari, P., Kulmala, M., and Vesala, T.: Ozone flux measurements over a Scots pine forest using eddy covariance method: Performance evaluation and comparison with flux-profile method, Boreal Environ. Res., 8, 425–443, 2003.
Knauer, J., Zaehle, S., Medlyn, B. E., Reichstein, M., Werner, C., Keitel, C., Williams, C. A., Migliavacca, M., Kauwe, M. G. De, Kolari, P., Limousin, J.-M., and Linderson, M.-L.: Towards physiologically meaningful water-use efficiency estimates from eddy covariance data, Glob. Change Biol., 15, 694–710, https://doi.org/10.1111/gcb.13893, 2017.
Knohl, A., Schulze, E.-D., Kolle, O., and Buchmann, N.: Large carbon uptake by an unmanaged 250-year-old deciduous forest in Central Germany, Agr. Forest Meteorol., 118, 151–167, https://doi.org/10.1016/s0168-1923(03)00115-1, 2003.
Knox, S. H., Matthes, J. H., Sturtevant, C., Oikawa, P. Y., Verfaillie, J., and Baldocchi, D.: Biophysical controls on interannual variability in ecosystem-scale CO2 and CH4 exchange in a California rice paddy, J. Geophys. Res.-Biogeo., 121, 978–1001, https://doi.org/10.1002/2015jg003247, 2016.
Kurbatova, J., Li, C., Varlagin, A., Xiao, X., and Vygodskaya, N.: Modeling carbon dynamics in two adjacent spruce forests with different soil conditions in Russia, Biogeosciences, 5, 969–980, https://doi.org/10.5194/bg-5-969-2008, 2008.
Kurpius, M. R. and Goldstein, A. H.: Gas-phase chemistry dominates O3 loss to a forest, implying a source of aerosols and hydroxyl radicals to the atmosphere, Geophys. Res. Lett., 30, 2–5, https://doi.org/10.1029/2002GL016785, 2003.
Lamaud, E., Loubet, B., Irvine, M., Stella, P., Personne, E., and Cellier, P.: Partitioning of ozone deposition over a developed maize crop between stomatal and non-stomatal uptakes, using eddy-covariance flux measurements and modelling, Agr. Forest Meteorol., 149, 1385–1396, https://doi.org/10.1016/j.agrformet.2009.03.017, 2009.
Launiainen, S., Rinne, J., Pumpanen, J., Kulmala, L., Kolari, P., Keronen, P., Siivola, E., Pohja, T., Hari, P., and Vesala, T.: Eddy covariance measurements of CO2 and sensible and latent heat fluxes during a full year in a boreal pine forest trunk-space, Boreal Environ. Res., 10, 569–588, 2005.
Lefohn, A. S. and Runeckles, V. C.: Establishing standards to protect vegetation-ozone exposure/dose considerations, Atmos. Environ., 21, 561–568, https://doi.org/10.1016/0004-6981(87)90038-2, 1987.
Lin, C., Gentine, P., Huang, Y., Guan, K., Kimm, H., and Zhou, S.: Diel ecosystem conductance response to vapor pressure deficit is suboptimal and independent of soil moisture, Agr. Forest Meteorol., 250/251, 24–34, https://doi.org/10.1016/j.agrformet.2017.12.078, 2018.
Lindauer, M., Schmid, H. P., Grote, R., Mauder, M., Steinbrecher, R., and Wolpert, B.: Net ecosystem exchange over a non-cleared wind-throw-disturbed upland spruce forest – Measurements and simulations, Agr. Forest Meteorol., 197, 219–234, https://doi.org/10.1016/j.agrformet.2014.07.005, 2014.
Lohila, A.: Annual CO2 exchange of a peat field growing spring barley or perennial forage grass, J. Geophys. Res., 109, D18116, https://doi.org/10.1029/2004jd004715, 2004.
Lombardozzi, D., Sparks, J. P., Bonan, G., and Levis, S.: Ozone exposure causes a decoupling of conductance and photosynthesis: Implications for the Ball-Berry stomatal conductance model, Oecologia, 169, 651–659, https://doi.org/10.1007/s00442-011-2242-3, 2012.
Lombardozzi, D., Sparks, J. P., and Bonan, G.: Integrating O3 influences on terrestrial processes: photosynthetic and stomatal response data available for regional and global modeling, Biogeosciences, 10, 6815–6831, https://doi.org/10.5194/bg-10-6815-2013, 2013.
Lombardozzi, D., Levis, S., Bonan, G., Hess, P. G., and Sparks, J. P.: The influence of chronic ozone exposure on global carbon and water cycles, J. Clim., 28, 292–305, https://doi.org/10.1175/JCLI-D-14-00223.1, 2015.
Loubet, B., Laville, P., Lehuger, S., Larmanou, E., Fléchard, C., Mascher, N., Genermont, S., Roche, R., Ferrara, R. M., Stella, P., Personne, E., Durand, B., Decuq, C., Flura, D., Masson, S., Fanucci, O., Rampon, J.-N., Siemens, J., Kindler, R., Gabrielle, B., Schrumpf, M., and Cellier, P.: Carbon, nitrogen and Greenhouse gases budgets over a four years crop rotation in northern France, Plant Soil, 343, 109–137, https://doi.org/10.1007/s11104-011-0751-9, 2011.
Ma, S., Baldocchi, D. D., Xu, L., and Hehn, T.: Inter-annual variability in carbon dioxide exchange of an oak/grass savanna and open grassland in California, Agr. Forest Meteorol., 147, 157–171, https://doi.org/10.1016/j.agrformet.2007.07.008, 2007.
Mammarella, I., Kolari, P., Rinne, J., Keronen, P., Pumpanen, J., and Vesala, T.: Determining the contribution of vertical advection to the net ecosystem exchange at Hyytiälä forest, Finland, Tellus B, 59, 900–909, https://doi.org/10.1111/j.1600-0889.2007.00306.x, 2007.
Marcolla, B., Pitacco, A., and Cescatti, A.: Canopy architecture and turbulence structure in a coniferous forest, Bound.-Lay. Meteorol., 108, 39–59, https://doi.org/10.1023/a:1023027709805, 2003.
Marcolla, B., Cescatti, A., Manca, G., Zorer, R., Cavagna, M., Fiora, A., Gianelle, D., Rodeghiero, M., Sottocornola, M., and Zampedri, R.: Climatic controls and ecosystem responses drive the inter-annual variability of the net ecosystem exchange of an alpine meadow, Agr. Forest Meteorol., 151, 1233–1243, https://doi.org/10.1016/j.agrformet.2011.04.015, 2011.
Marrero, T. R. and Mason, E. A.: Gaseous Diffusion Coefficients, J. Phys. Chem. Ref. Data, 1, 3–118, https://doi.org/10.1063/1.3253094, 1972.
Matthes, J. H., Sturtevant, C., Verfaillie, J., Knox, S., and Baldocchi, D.: Parsing the variability in CH4 flux at a spatially heterogeneous wetland: Integrating multiple eddy covariance towers with high-resolution flux footprint analysis, J. Geophys. Res.-Biogeo., 119, 1322–1339, https://doi.org/10.1002/2014jg002642, 2014.
Matyssek, R., Bahnweg, G., Ceulemans, R., Fabian, P., Grill, D., Hanke, D. E., Kraigher, H., Oßwald, W., Rennenberg, H., Sandermann, H., Tausz, M., and Wieser, G.: Synopsis of the CASIROZ case study: Carbon sink strength of Fagus sylvatica L. in a changing environment – Experimental risk assessment of mitigation by chronic ozone impact, Plant Biol., 9, 163–180, https://doi.org/10.1055/s-2007-964883, 2007.
Matyssek, R., Karnosky, D. F., Wieser, G., Percy, K., Oksanen, E., Grams, T. E. E., Kubiske, M., Hanke, D., and Pretzsch, H.: Advances in understanding ozone impact on forest trees: Messages from novel phytotron and free-air fumigation studies, Environ. Pollut., 158, 1990–2006, https://doi.org/10.1016/j.envpol.2009.11.033, 2010.
Mauder, M., Cuntz, M., Drüe, C., Graf, A., Rebmann, C., Schmid, H. P., Schmidt, M., and Steinbrecher, R.: A strategy for quality and uncertainty assessment of long-term eddy-covariance measurements, Agr. Forest Meteorol., 169, 122–135, https://doi.org/10.1016/j.agrformet.2012.09.006, 2013.
McKinney, W.: Data Structures for Statistical Computing in Python, in: Proceedings of the 9th Python in Science Conference, edited by: Van Der Walt, S., 51–56., 2010.
Medlyn, B. E., Duursma, R. A., Eamus, D., Ellsworth, D. S., Prentice, I. C., Barton, C. V. M., Crous, K. Y., De Angelis, P., Freeman, M., and Wingate, L.: Reconciling the optimal and empirical approaches to modelling stomatal conductance, Glob. Change Biol., 17, 2134–2144, https://doi.org/10.1111/j.1365-2486.2010.02375.x, 2011.
Merbold, L., Eugster, W., Stieger, J., Zahniser, M., Nelson, D., and Buchmann, N.: Greenhouse gas budget (CO2, CH4, and N2O) of intensively managed grassland following restoration, Glob. Change Biol., 20, 1913–1928, https://doi.org/10.1111/gcb.12518, 2014.
Migliavacca, M., Meroni, M., Busetto, L., Colombo, R., Zenone, T., Matteucci, G., Manca, G., and Seufert, G.: Modeling gross primary production of agro-forestry ecosystems by assimilation of satellite-derived information in a process-based model, Sensors, 9, 922–942, https://doi.org/10.3390/s90200922, 2009.
Mills, G., Hayes, F., Simpson, D., Emberson, L., Norris, D., Harmens, H., and Büker, P.: Evidence of widespread effects of ozone on crops and (semi-)natural vegetation in Europe (1990–2006) in relation to AOT40- and flux-based risk maps, Glob. Change Biol., 17, 592–613, https://doi.org/10.1111/j.1365-2486.2010.02217.x, 2011.
Monson, R. K., Turnipseed, A. A., Sparks, J. P., Harley, P. C., Scott-Denton, L. E., Sparks, K., and Huxman, T. E.: Carbon sequestration in a high-elevation, subalpine forest, Glob. Change Biol., 8, 459–478, https://doi.org/10.1046/j.1365-2486.2002.00480.x, 2002.
Montagnani, L., Manca, G., Canepa, E., Georgieva, E., Acosta, M., Feigenwinter, C., Janous, D., Kerschbaumer, G., Lindroth, A., Minach, L., Minerbi, S., Mölder, M., Pavelka, M., Seufert, G., Zeri, M., and Ziegler, W.: A new mass conservation approach to the study of CO2 advection in an alpine forest, J. Geophys. Res., 114, D07306, https://doi.org/10.1029/2008jd010650, 2009.
Monteith, J. L.: Evaporation and surface temperature, Q. J. Roy. Meteor. Soc., 107, 1–27, 1981.
Moore, K. E., Fitzjarrald, D. R., Sakai, R. K., Goulden, M. L., Munger, J. W., and Wofsy, S. C.: Seasonal variation in radiative and turbulent exchange at a deciduous forest in central Massachusetts, J. Appl. Meterol., 35, 122–134, https://doi.org/10.1175/1520-0450(1996)035<0122:SVIRAT>2.0.CO;2, 1996.
Morin, T. H., Bohrer, G. D. M., Frasson, R. P., Naor-Azreli, L., Mesi, S., Stefanik, K. C., and Schäfer, K. V. R.: Environmental drivers of methane fluxes from an urban temperate wetland park, J. Geophys. Res.-Biogeo., 119, 2188–2208, https://doi.org/10.1002/2014jg002750, 2014.
Moureaux, C., Debacq, A., Bodson, B., Heinesch, B., and Aubinet, M.: Annual net ecosystem carbon exchange by a sugar beet crop, Agr. Forest Meteorol., 139, 25–39, https://doi.org/10.1016/j.agrformet.2006.05.009, 2006.
Munger, J. W., Wofsy, S. C., Bakwin, P. S., Fan, S., Goulden, M. L., Daube, B. C., Goldstein, A. H., Moore, K. E., and Fitzjarrald, D. R.: Atmospheric deposition of reactive nitrogen oxides and ozaone in a temperate deciduos forest and a subartic woodland 1. Measurements and mechanisms, J. Geophys. Res., 101, 12639–12657, 1996.
Musselman, R. C., Lefohn, A. S., Massman, W. J., and Heath, R. L.: A critical review and analysis of the use of exposure- and flux-based ozone indices for predicting vegetation effects, Atmos. Environ., 40, 1869–1888, https://doi.org/10.1016/j.atmosenv.2005.10.064, 2006.
Noormets, A., Chen, J., and Crow, T. R.: Age-Dependent Changes in Ecosystem Carbon Fluxes in Managed Forests in Northern Wisconsin, USA, Ecosystems, 10, 187–203, https://doi.org/10.1007/s10021-007-9018-y, 2007.
Novick, K. A., Ficklin, D. L., Stoy, P. C., Williams, C. A., Bohrer, G., Oishi, A. C., Papuga, S. A., Blanken, P. D., Noormets, A., Sulman, B. N., Scott, R. L., Wang, L., and Phillips, R. P.: The increasing importance of atmospheric demand for ecosystem water and carbon fluxes, Nat. Clim. Change, 6, 1023–1027, https://doi.org/10.1038/nclimate3114, 2016.
Oikawa, P. Y., Jenerette, G. D., Knox, S. H., Sturtevant, C., Verfaillie, J., Dronova, I., Poindexter, C. M., Eichelmann, E., and Baldocchi, D. D.: Evaluation of a hierarchy of models reveals importance of substrate limitation for predicting carbon dioxide and methane exchange in restored wetlands, J. Geophys. Res.-Biogeo., 122, 145–167, https://doi.org/10.1002/2016jg003438, 2017.
Paoletti, E. and Manning, W. J.: Toward a biologically significant and usable standard for ozone that will also protect plants, Environ. Pollut., 150, 85–95, https://doi.org/10.1016/j.envpol.2007.06.037, 2007.
Papale, D., Migliavacca, M., Cremonese, E., Cescatti, A., Alberti, G., Balzarolo, M., Marchesini, L. B., Canfora, E., Casa, R., Duce, P., Facini, O., Galvagno, M., Genesio, L., Gianelle, D., Magliulo, V., Matteucci, G., Montagnani, L., Petrella, F., Pitacco, A., Seufert, G., Spano, D., Stefani, P., Vaccari, F. P., and Valentini, R.: Carbon, water and anergy fluxes of terrestrial ecosystems in Italy, in The Greenhouse Gas Balance of Italy, Springer, Berlin Heidelberg, 11–45, 2015.
Pastorello, G., Agarwal, D., Papale, D., Samak, T., Trotta, C., Ribeca, A., Poindexter, C., Faybishenko, B., Gunter, D., Hollowgrass, R., and Canfora, E.: Observational data patterns for time series data quality assessment, 2014 IEEE 10th Int. Conf. e-Science, 271–278, https://doi.org/10.1109/eScience.2014.45, 2014.
Pastorello, G., Papale, D., Chu, H., Trotta, C., Agarwal, D., Canfora, E., Baldocchi, D., and Torn, M.: A new data set to keep a sharper eye on land-air exchanges, Eos, 98, https://doi.org/10.1029/2017EO071597, 2017.
Plake, D., Stella, P., Moravek, A., Mayer, J. C., Ammann, C., Held, A., and Trebs, I.: Comparison of ozone deposition measured with the dynamic chamber and the eddy covariance method, Agr. Forest Meteorol., 206, 97–112, https://doi.org/10.1016/j.agrformet.2015.02.014, 2015.
Pleijel, H., Danielsson, H., Ojanperä, K., De Temmerman, L., Högy, P., Badiani, M., and Karlsson, P. E.: Relationships between ozone exposure and yield loss in European wheat and potato – A comparison of concentration- and flux-based exposure indices, Atmos. Environ., 38, 2259–2269, https://doi.org/10.1016/j.atmosenv.2003.09.076, 2004.
Pleijel, H., Danielsson, H., Simpson, D., and Mills, G.: Have ozone effects on carbon sequestration been overestimated? A new biomass response function for wheat, Biogeosciences, 11, 4521–4528, https://doi.org/10.5194/bg-11-4521-2014, 2014.
Pilegaard, K., Ibrom, A., Courtney, M. S., Hummelshøj, P., and Jensen, N. O.: Increasing net CO2 uptake by a Danish beech forest during the period from 1996 to 2009, Agr. Forest Meteorol., 151, 934–946, https://doi.org/10.1016/j.agrformet.2011.02.013, 2011.
Post, H., Franssen, H. J. H., Graf, A., Schmidt, M., and Vereecken, H.: Uncertainty analysis of eddy covariance CO2 flux measurements for different EC tower distances using an extended two-tower approach, Biogeosciences, 12, 1205–1221, https://doi.org/10.5194/bg-12-1205-2015, 2015.
Powell, T. L., Bracho, R., Li, J., Dore, S., Hinkle, C. R., and Drake, B. G.: Environmental controls over net ecosystem carbon exchange of scrub oak in central Florida, Agr. Forest Meteorol., 141, 19–34, https://doi.org/10.1016/j.agrformet.2006.09.002, 2006.
Prescher, A.-K., Grünwald, T., and Bernhofer, C.: Land use regulates carbon budgets in eastern Germany: From NEE to NBP, Agr. Forest Meteorol., 150, 1016–1025, https://doi.org/10.1016/j.agrformet.2010.03.008, 2010.
Rambal, S., Joffre, R., Ourcival, J. M., Cavender-Bares, J., and Rocheteau, A.: The growth respiration component in eddy CO2 flux from a Quercus ilex mediterranean forest, Glob. Change Biol., 10, 1460–1469, https://doi.org/10.1111/j.1365-2486.2004.00819.x, 2004.
Rannik, Ü., Mammarella, I., Keronen, P., and Vesala, T.: Vertical advection and nocturnal deposition of ozone over a boreal pine forest, Atmos. Chem. Phys., 9, 2089–2095, https://doi.org/10.5194/acp-9-2089-2009, 2009.
Rannik, Ü., Altimir, N., Mammarella, I., Bäck, J., Rinne, J., Ruuskanen, T. M., Hari, P., Vesala, T., and Kulmala, M.: Ozone deposition into a boreal forest over a decade of observations: Evaluating deposition partitioning and driving variables, Atmos. Chem. Phys., 12, 12165–12182, https://doi.org/10.5194/acp-12-12165-2012, 2012.
Raz-Yaseef, N., Billesbach, D. P., Fischer, M. L., Biraud, S. C., Gunter, S. A., Bradford, J. A., and Torn, M. S.: Vulnerability of crops and native grasses to summer drying in the U.S. Southern Great Plains, Agr. Ecosyst. Environ., 213, 209–218, https://doi.org/10.1016/j.agee.2015.07.021, 2015.
Reda, I. and Andreas, A.: Solar position algorithm for solar radiation applications, Sol. Energ., 76, 577–589, https://doi.org/10.1016/j.solener.2003.12.003, 2004.
Reich, P. B.: Quantifying plant response to ozone: A unifying theory, Tree Physiol., 3, 63–91, https://doi.org/10.1093/treephys/3.1.63, 1987.
Reich, P. B. and Amundson, R. G.: Ambient levels of ozone reduce net photosynthesis in tree and crop species, Science, 230, 566–570, 1985.
Reich, P. B. and Lassoie, J. P.: Effects of low level O3 exposure on leaf diffusive conductance and water-use efficiency in hybrid poplar, Plant. Cell Environ., 7, 661–668, https://doi.org/10.1111/1365-3040.ep11571645, 1984.
Reichle, R., Draper, C., Liu, Q., Girotto, M., Mahanama, S., Koster, R., and Lannoy, G.: Assessment of MERRA-2 Land Surface Hydrology Estimates, Am. Meteorol. Soc. J. Clim., 30, 2937–2960, https://doi.org/10.1175/JCLI-D-16-0720.1, 2017.
Reichstein, M., Falge, E., Baldocchi, D., Papale, D., Aubinet, M., Berbigier, P., Bernhofer, C., Buchmann, N., Gilmanov, T., Granier, A., Grünwald, T., Havránková, K., Ilvesniemi, H., Janous, D., Knohl, A., Laurila, T., Lohila, A., Loustau, D., Matteucci, G., Meyers, T., Miglietta, F., Ourcival, J. M., Pumpanen, J., Rambal, S., Rotenberg, E., Sanz, M., Tenhunen, J., Seufert, G., Vaccari, F., Vesala, T., Yakir, D., and Valentini, R.: On the separation of net ecosystem exchange into assimilation and ecosystem respiration: Review and improved algorithm, Glob. Change Biol., 11, 1424–1439, https://doi.org/10.1111/j.1365-2486.2005.001002.x, 2005.
Reverter, B. R., Sánchez-Cañete, E. P., Resco, V., Serrano-Ortiz, P., Oyonarte, C., and Kowalski, A. S.: Analyzing the major drivers of NEE in a Mediterranean alpine shrubland, Biogeosciences, 7, 2601–2611, https://doi.org/10.5194/bg-7-2601-2010, 2010.
Rey, A., Pegoraro, E., Tedeschi, V., Parri, I. De, Jarvis, P. G., and Valentini, R.: Annual variation in soil respiration and its components in a coppice oak forest in Central Italy, Glob. Change Biol., 8, 851–866, https://doi.org/10.1046/j.1365-2486.2002.00521.x, 2002.
Ruehr, N. K., Martin, J. G., and Law, B. E.: Effects of water availability on carbon and water exchange in a young ponderosa pine forest: Above- and belowground responses, Agr. Forest Meteorol., 164, 136–148, https://doi.org/10.1016/j.agrformet.2012.05.015, 2012.
Sabbatini, S., Arriga, N., Bertolini, T., Castaldi, S., Chiti, T., Consalvo, C., Djomo, S. N., Gioli, B., Matteucci, G., and Papale, D.: Greenhouse gas balance of cropland conversion to bioenergy poplar short-rotation coppice, Biogeosciences, 13, 95–113, https://doi.org/10.5194/bg-13-95-2016, 2016.
Schmidt, M., Reichenau, T. G., Fiener, P., and Schneider, K.: The carbon budget of a winter wheat field: An eddy covariance analysis of seasonal and inter-annual variability, Agr. Forest Meteorol., 165, 114–126, https://doi.org/10.1016/j.agrformet.2012.05.012, 2012.
Schnell, J. L., Holmes, C. D., Jangam, A., and Prather, M. J.: Skill in forecasting extreme ozone pollution episodes with a global atmospheric chemistry model, Atmos. Chem. Phys., 14, 7721–7739, https://doi.org/10.5194/acp-14-7721-2014, 2014.
Schwede, D., Zhang, L., Vet, R., and Lear, G.: An intercomparison of the deposition models used in the CASTNET and CAPMoN networks, Atmos. Environ., 45, 1337–1346, https://doi.org/10.1016/j.atmosenv.2010.11.050, 2011.
Scott, R. L. and Biederman, J. A.: Partitioning evapotranspiration using long-term carbon dioxide and water vapor fluxes, Geophys. Res. Lett., 44, 6833–6840, https://doi.org/10.1002/2017GL074324, 2017.
Scott, R. L., Jenerette, G. D., Potts, D. L., and Huxman, T. E.: Effects of seasonal drought on net carbon dioxide exchange from a woody-plant-encroached semiarid grassland, J. Geophys. Res., 114, G04004, https://doi.org/10.1029/2008jg000900, 2009.
Scott, R. L., Hamerlynck, E. P., Jenerette, G. D., Moran, M. S., and Barron-Gafford, G. A.: Carbon dioxide exchange in a semidesert grassland through drought-induced vegetation change, J. Geophys. Res., 115, G03026, https://doi.org/10.1029/2010jg001348, 2010.
Scott, R. L., Biederman, J. A., Hamerlynck, E. P., and Barron-Gafford, G. A.: The carbon balance pivot point of southwestern U.S. semiarid ecosystems: Insights from the 21st century drought, J. Geophys. Res.-Biogeo., 120, 2612–2624, https://doi.org/10.1002/2015jg003181, 2015.
Seabold, S. and Perktold, J.: Statsmodels: econometric and statistical modeling with Python, in: Proceedings of the 9th Python in Science Conference, 57–61, 2010.
Sen, P. K.: Estimates of the regression coefficient based on Kendall's tau, J. Am. Stat. Assoc., 63, 1379–1389, https://doi.org/10.1080/01621459.1968.10480934, 1968.
Silva, S. J. and Heald, C. L.: Investigating dry deposition of ozone to vegetation, J. Geophys. Res.-Atmos., 123, 559–573, https://doi.org/10.1002/2017JD027278, 2018.
Sitch, S., Cox, P. M., Collins, W. J., and Huntingford, C.: Indirect radiative forcing of climate change through ozone effects on the land-carbon sink, Nature, 448, 791–794, https://doi.org/10.1038/nature06059, 2007.
Stella, P., Personne, E., Loubet, B., Lamaud, E., Ceschia, E., Béziat, P., Bonnefond, J. M., Irvine, M., Keravec, P., Mascher, N., and Cellier, P.: Predicting and partitioning ozone fluxes to maize crops from sowing to harvest: The Surfatm-O3 model, Biogeosciences, 8, 2869–2886, https://doi.org/10.5194/bg-8-2869-2011, 2011a.
Stella, P., Loubet, B., Lamaud, E., Laville, P., and Cellier, P.: Ozone deposition onto bare soil?: A new parameterization, Agr. Forest Meteorol., 151, 669–681, https://doi.org/10.1016/j.agrformet.2011.01.015, 2011b.
Stella, P., Kortner, M., Ammann, C., Foken, T., Meixner, F. X., and Trebs, I.: Measurements of nitrogen oxides and ozone fluxes by eddy covariance at a meadow: Evidence for an internal leaf resistance to NO2, Biogeosciences, 10, 5997–6017, https://doi.org/10.5194/bg-10-5997-2013, 2013.
Sulman, B. N., Desai, A. R., Cook, B. D., Saliendra, N., and Mackay, D. S.: Contrasting carbon dioxide fluxes between a drying shrub wetland in Northern Wisconsin, USA, and nearby forests, Biogeosciences, 6, 1115–1126, https://doi.org/10.5194/bg-6-1115-2009, 2009.
Tai, A. P. K., Martin, M. V., and Heald, C. L.: Threat to future global food security from climate change and ozone air pollution, Nat. Clim. Change, 4, 817–821, https://doi.org/10.1038/nclimate2317, 2014.
Taylor, J. R.: An Introduction to Error Analysis, University Science Books, Sausalito, 1–327, 1997.
Tedeschi, V., Ret, A., Manca, G., Valentini, R., Jarvis, P. G., and Borghetti, M.: Soil respiration in a Mediterranean oak forest at different developmental stages after coppicing, Glob. Change Biol., 12, 110–121, https://doi.org/10.1111/j.1365-2486.2005.01081.x, 2006.
Thum, T., Aalto, T., Laurila, T., Aurela, M., Kolari, P., and Hari, P.: Parametrization of two photosynthesis models at the canopy scale in a northern boreal Scots pine forest, Tellus B, 59, 874–890, https://doi.org/10.3402/tellusb.v59i5.17066, 2007.
UNECE: Revised manual on methodologies and criteria for mapping critical levels/loads and geographical areas where they are exceeded, in: UNECE Convention on Long-range Transboundary Air Pollution, 2004.
Urbanski, S., Barford, C., Wofsy, S., Kucharik, C., Pyle, E., Budney, J., McKain, K., Fitzjarrald, D., Czikowsky, M., and Munger, J. W.: Factors controlling CO2 exchange on timescales from hourly to decadal at Harvard Forest, J. Geophys. Res., 112, G02020, https://doi.org/10.1029/2006jg000293, 2007.
Valentini, R., Angelis, P., Matteucci, G., Monaco, R., Dore, S., and Mucnozza, G. E. S.: Seasonal net carbon dioxide exchange of a beech forest with the atmosphere, Glob. Change Biol., 2, 199–207, https://doi.org/10.1111/j.1365-2486.1996.tb00072.x, 1996.
Van Dingenen, R., Dentener, F. J., Raes, F., Krol, M. C., Emberson, L., and Cofala, J.: The global impact of ozone on agricultural crop yields under current and future air quality legislation, Atmos. Environ., 43, 604–618, https://doi.org/10.1016/j.atmosenv.2008.10.033, 2009.
Verma, S. B., Dobermann, A., Cassman, K. G., Walters, D. T., Knops, J. M., Arkebauer, T. J., Suyker, A. E., Burba, G. G., Amos, B., Yang, H., Ginting, D., Hubbard, K. G., Gitelson, A. A., and Walter-Shea, E. A.: Annual carbon dioxide exchange in irrigated and rainfed maize-based agroecosystems, Agr. Forest Meteorol., 131, 77–96, https://doi.org/10.1016/j.agrformet.2005.05.003, 2005.
Vitale, L., Tommasi, P. Di, D'Urso, G., and Magliulo, V.: The response of ecosystem carbon fluxes to LAI and environmental drivers in a maize crop grown in two contrasting seasons, Int. J. Biometeorol., 60, 411–420, https://doi.org/10.1007/s00484-015-1038-2, 2015.
Vuichard, N. and Papale, D.: Filling the gaps in meteorological continuous data measured at FLUXNET sites with ERA-Interim reanalysis, Earth Syst. Sci. Data, 7, 157–171, https://doi.org/10.5194/essd-7-157-2015, 2015.
Van Der Walt, S., Colbert, S. C., and Varoquaux, G.: The NumPy array: A structure for efficient numerical computation, Comput. Sci. Eng., 13, 22–30, https://doi.org/10.1109/MCSE.2011.37, 2011.
Wang, L., Good, S. P., and Caylor, K. K.: Global synthesis of vegetation control on evapotranspiration partitioning, Geophys. Res. Lett., 41, 6753–6757, https://doi.org/10.1002/2014GL061439, 2014.
Warton, D. I., Wright, I. J., Falster, D. S., and Westoby, M.: Bivariate line-fitting methods for allometry, Biol. Rev., 81, 259–291, https://doi.org/10.1017/S1464793106007007, 2006.
Weaver, J. E. and Bruner, W. E.: Root development of vegetable crops, McGraw-Hill Book Company, Inc., Lincoln, Nebraska, 1927.
Wesely, M. L. and Hicks, B. B.: Some factors that affect the deposition rates of sulfur dioxide and similar gases on vegetation, J. Air Pollut. Control Assoc., 27, 1110–1116, https://doi.org/10.1080/00022470.1977.10470534, 1977.
Wesley, M. L.: Parametrization of surface resistance to gaseous dry deposition in regional-scale numerical model, Atmos. Environ., 23, 1293–1304, 1989.
Wittig, V. E., Ainsworth, E. A., and Long, S. P.: To what extent do current and projected increases in surface ozone affect photosynthesis and stomatal conductance of trees? A meta-analytic review of the last 3 decades of experiments, Plant Cell Environ., 30, 1150–1162, https://doi.org/10.1111/j.1365-3040.2007.01717.x, 2007.
Wittig, V. E., Ainsworth, E. A., Naidu, S. L., Karnosky, D. F., and Long, S. P.: Quantifying the impact of current and future tropospheric ozone on tree biomass, growth, physiology and biochemistry: A quantitative meta-analysis, Glob. Change Biol., 15, 396–424, https://doi.org/10.1111/j.1365-2486.2008.01774.x, 2009.
Wohlfahrt, G., Hammerle, A., Haslwanter, A., Bahn, M., Tappeiner, U., and Cernusca, A.: Seasonal and inter-annual variability of the net ecosystem CO2 exchange of a temperate mountain grassland: Effects of weather and management, J. Geophys. Res., 113, D08110, https://doi.org/10.1029/2007jd009286, 2008.
Wolfe, G. M., Thornton, J. A., Mckay, M., and Goldstein, A. H.: Forest-atmosphere exchange of ozone?: sensitivity to very reactive biogenic VOC emissions and implications for in-canopy photochemistry, Atmos. Chem. Phys., 11, 7875–7891, https://doi.org/10.5194/acp-11-7875-2011, 2011.
Wu, S., Mickley, L. J., Jacob, D. J., Logan, J. A., Yantosca, R. M., and Rind, D.: Why are there large differences between models in global budgets of tropospheric ozone?, J. Geophys. Res.-Atmos., 112, D05302, https://doi.org/10.1029/2006JD007801, 2007.
Wu, Z., Schwede, D. B., Vet, R., Walker, J. T., Shaw, M., Staebler, R., and Zhang, L.: Evaluation and intercomparison of five North American dry deposition algorithms at a mixed forest site, J. Adv. Model. Earth Syst., 10, 1571–1586, https://doi.org/10.1029/2017MS001231, 2018.
Young, P. J., Archibald, A. T., Bowman, K. W., Lamarque, J.-F., Naik, V., Stevenson, D. S., Tilmes, S., Voulgarakis, A., Wild, O., Bergmann, D., Cameron-Smith, P., Cionni, I., Collins, W. J., Dalsøren, S. B., Doherty, R. M., Eyring, V., Faluvegi, G., Horowitz, L. W., Josse, B., Lee, Y. H., MacKenzie, I. A., Nagashima, T., Plummer, D. A., Righi, M., Rumbold, S. T., Skeie, R. B., Shindell, D. T., Strode, S. A., Sudo, K., Szopa, S., and Zeng, G.: Pre-industrial to end 21st century projections of tropospheric ozone from the Atmospheric Chemistry and Climate Model Intercomparison Project (ACCMIP), Atmos. Chem. Phys., 13, 2063–2090, https://doi.org/10.5194/acp-13-2063-2013, 2013.
Yue, X. and Unger, N.: Ozone vegetation damage effects on gross primary productivity in the United States, Atmos. Chem. Phys., 14, 9137–9153, https://doi.org/10.5194/acp-14-9137-2014, 2014.
Yue, X., Keenan, T. F., Munger, W., and Unger, N.: Limited effect of ozone reductions on the 20-year photosynthesis trend at Harvard forest, Glob. Change Biol., 22, 3750–3759, https://doi.org/10.1111/gcb.13300, 2016.
Zeller, K. F. and Nikolov, N. T.: Quantifying simultaneous fluxes of ozone, carbon dioxide and water vapor above a subalpine forest ecosystem, Environ. Pollut., 107, 1–20, 2000.
Zhang, L., Brook, J. R. and Vet, R.: On ozone dry deposition – With emphasis on non-stomatal uptake and wet canopies, Atmos. Environ., 36, 4787–4799, https://doi.org/10.1016/S1352-2310(02)00567-8, 2002.
Zhang, L., Brook, J. R., and Vet, R.: A revised parameterization for gaseous dry deposition in air-quality models, Atmos. Chem. Phys., 3, 2067–2082, https://doi.org/10.5194/acp-3-2067-2003, 2003.
Zhou, S., Yu, B., Huang, Y., and Wang, G.: Partitioning evapotranspiration based on the concept of underlying water use efficiency, Water Resour. Res., 52, 1160–1175, https://doi.org/10.1002/2015WR017766, 2016.
Zielis, S., Etzold, S., Zweifel, R., Eugster, W., Haeni, M., and Buchmann, N.: NEP of a Swiss subalpine forest is significantly driven not only by current but also by previous years weather, Biogeosciences, 11, 1627–1635, https://doi.org/10.5194/bg-11-1627-2014, 2014.
Zona, D., Gioli, B., Fares, S., De Groote, T., Pilegaard, K., Ibrom, A., and Ceulemans, R.: Environmental controls on ozone fluxes in a poplar plantation in Western Europe, Environ. Pollut., 184, 201–210, https://doi.org/10.1016/j.envpol.2013.08.032, 2014.