the Creative Commons Attribution 4.0 License.
the Creative Commons Attribution 4.0 License.
 | 18 Sep 2018
Tracing water masses with 129I and 236U in the subpolar North Atlantic along the GEOTRACES GA01 section
Núria Casacuberta
Marcus Christl
Christof Vockenhuber
Hans-Arno Synal
Maribel I. García-Ibáñez
Pascale Lherminier
Géraldine Sarthou
Jordi Garcia-Orellana
Pere Masqué
Pathways and timescales of water mass transport in the subpolar North Atlantic Ocean (SPNA) have been investigated by many studies due to their importance for the meridional overturning circulation and thus for the global ocean. In this sense, observational data on geochemical tracers provide complementary information to improve the current understanding of the circulation in the SPNA. To this end, we present the first simultaneous distribution of artificial 129I and 236U in 14 depth profiles and in surface waters along the GEOVIDE section covering a zonal transect through the SPNA in spring 2014. Our results show that the two tracers are distributed following the water mass structure and that their presence is largely influenced by the global fallout (GF) and liquid effluents discharged to north-western European coastal waters by the Sellafield and La Hague nuclear reprocessing plants (NRPs). As a result, 129I concentrations and 236U∕238U atom ratios and 129I∕236U atom ratios display a wide range of values: (0.2–256) ×107 at kg−1 (40–2350) and 0.5–200, respectively. The signal from NRPs, which is characterised by higher 129I concentrations and 129I∕236U atom ratios compared to GF, is transported by Atlantic Waters (AWs) into the SPNA, notably by the East Greenland Current (EGC)/Labrador Current (LC) at the surface and by waters overflowing the Greenland–Scotland passage at greater depths. Nevertheless, our results show that the effluents from NRPs may also directly enter the surface of the eastern SPNA through the Iceland–Scotland passage or the English Channel/Irish Sea. The use of the 236U∕238U and 129I∕236U dual tracer approach further serves to discern Polar Intermediate Water (PIW) of Canadian origin from that of Atlantic origin, which carries comparably higher tracer levels due to NRPs (particularly 129I). The cascading of these waters appears to modify the water mass composition in the bottom of the Irminger and Labrador seas, which are dominated by Denmark Strait Overflow Water (DSOW). Indeed, PIW–Atlantic, which has a high level of 129I compared to 236U, appears to contribute to the deep Irminger Sea increasing the 129I concentrations in the realm of DSOW. A similar observation can be made for 236U for PIW entering through the Canadian Archipelago into the Labrador Sea. Several depth profiles also show an increase in 129I concentrations in near bottom waters in the Iceland and the West European basins that are very likely associated with the transport of the NRP signal by the Iceland–Scotland Overflow Water (ISOW). This novel result would support current modelling studies indicating the transport of ISOW into the eastern SPNA. Finally, our tracer data from 2014 are combined with published 129I data for the deep central Labrador Sea between 1993 and 2013. The results obtained from comparing simulated and measured 129I concentrations support the previously suggested two major transport pathways for the AWs in the SPNA, i.e. a short loop through the Nordic seas into the SPNA and a longer loop, which includes recirculation of the AWs in the Arctic Ocean before it enters the western SPNA.
- Article
(25265 KB) - Full-text XML
-
Supplement
(2746 KB) - BibTeX
- EndNote


The subpolar North Atlantic (SPNA) is a key region for the global ocean circulation (see all acronyms in the Appendix). The North Atlantic Current (NAC) carries warm subtropical waters northwards to the SPNA, where they are transformed into cold Subpolar Mode Water (SPMW) and ultimately into Labrador Sea Water (LSW), which circulates southwards along with the overflow waters from the Nordic seas (Fig. 1). These water mass formation processes constitute the starting point of the Atlantic meridional overturning circulation (AMOC). Among other studies, the repeated hydrographic cruises along the Greenland–Portugal OVIDE line shed light on the decadal variability of the AMOC (Daniault et al., 2016; Lherminier et al., 2010; Mercier et al., 2013) and its relevance to climate, for example, by controlling the ocean uptake of CO2 (Pérez et al., 2013). The GEOVIDE cruise carried out in spring 2014 covered the OVIDE line, extending further to the Labrador Sea and revealing an intense AMOC over a cold and fresh SPNA (Zunino et al., 2017). The observed strong AMOC was linked to an intensified poleward transport of subtropical waters as well as to the increased equatorward transport of Iceland–Scotland Overflow Water (ISOW), Irminger–SPMW (IrSPMW) and Polar Intermediate Water (PIW) in 2014 relative to mean 2002–2010 (García-Ibáñez et al., 2018).
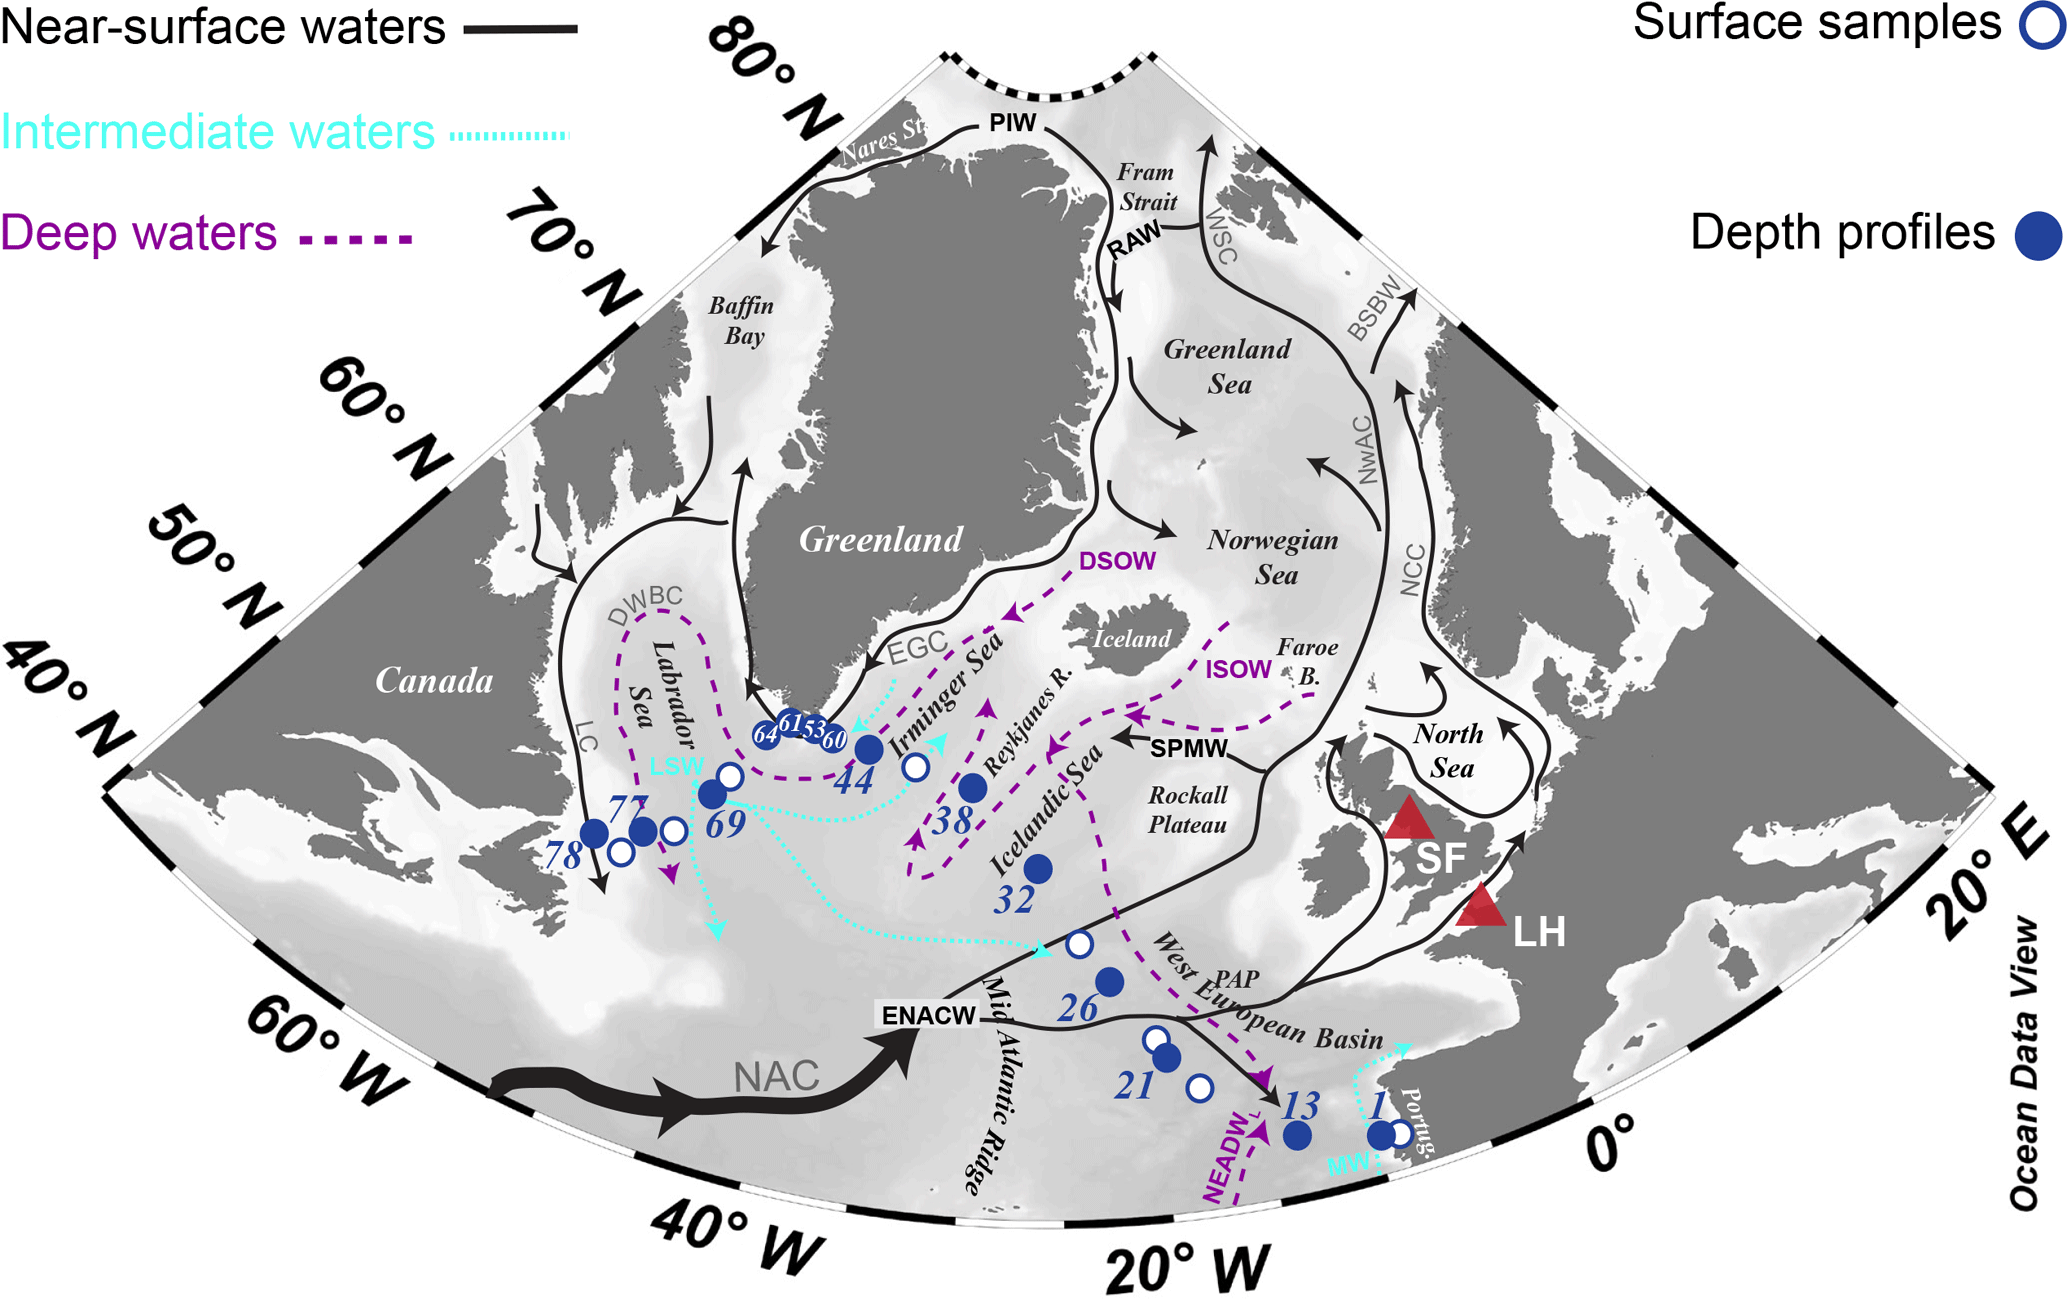
Figure 1Sampled locations in the subpolar North Atlantic during the GEOVIDE cruise in spring 2014. The nuclear fuel reprocessing plants of La Hague (LH) and Sellafield (SF) are represented along with the main water masses and their schematic spreading pathways are adapted from Daniault et al. (2016) and Smith et al. (2005). Acronyms are defined in the Appendix.
Anthropogenic tracers provide complementary information about the above-water mass circulation changes in the SPNA. For example, chlorofluorocarbons (CFCs) and sulfur hexafluoride (SF6) from industrial activities or tritium (3H) from atmospheric nuclear weapon tests conducted in the 1950s and 1960s (global fallout, GF) provide information on the ventilation of the interior Atlantic Ocean (Doney and Jenkins, 1994; Sy et al., 1997; Tanhua et al., 2005). Contrary to CFCs or 3H, which were introduced into the surface ocean from a rather well-mixed atmosphere, nuclear reprocessing plants (NRPs) represent point-like sources of artificial radionuclides. The NRPs located near La Hague and Sellafield discharge(d) liquid effluents to the English Channel and the Irish Sea, respectively, over the past 50–60 years, thereby tagging Atlantic waters (AWs) passing these locations from the 1960s on (Kershaw and Baxter, 1995). This allowed an investigation of AW-spreading pathways and timescales downstream of these nuclear facilities (e.g. Aarkrog et al., 1983, 1987, Alfimov et al., 2004, 2013; Beasley et al., 1998; Casacuberta et al., 2016, 2018; Christl et al., 2015b; Dahlgaard, 1995; Edmonds et al., 2001; Holm et al., 1983; Smith et al., 1998, 2005, 2011, 2016). The schematic transport of NRP effluents and water masses in the SPNA–Arctic Ocean region is displayed in Fig. 1. NRP-labelled AWs are first transported by surface currents into the North Sea and then carried poleward by the Norwegian Coastal Current (NCC) into the Nordic seas (Edmonds et al., 1998; Raisbeck and Yiou, 2002) while mixing with the Norwegian Atlantic Current (NwAC) (Gascard et al., 2004; Kershaw and Baxter, 1995). The current splits in two branches north of Norway, one branch entering the Barents Sea as Barents Sea Branch Water (BSBW) and the other branch approaching the Fram Strait west of Spitsbergen, where it bifurcates again. One branch joins the East Greenland Current (EGC) and recirculates southwards as Return Atlantic Water (RAW) (Fogelqvist et al., 2003) mixing with IrSPMW and PIW (modified AW that has recirculated in the Arctic Ocean; Rudels et al., 1999b). The other branch, the West Spitsbergen Current (WSC), transports the remaining AWs at shallow to intermediate depths into the Arctic Ocean via the Fram Strait Branch Water (FSBW), where they recirculate in the Arctic Eurasian Basin before outflowing back through the Fram Strait and continuing southwards carried by the EGC (Rudels, 2015). The NRP signal also penetrates deep into the water column due to the formation of dense water north of the Greenland–Iceland and Iceland–Scotland passages, providing means of tracing the deep overflows that ventilate the deep North Atlantic Ocean (e.g. Smith et al., 2005). Thus, radionuclides discharged from European NRPs are particularly well suited to studying the water mass circulation in the SPNA (Fig. 1).
Among the set of radionuclides discharged from NRPs, the 129I is regarded as a robust circulation tracer for investigating water mass transport pathways, advection and mixing, and for testing the performance of ocean circulation models in the Nordic seas, the Arctic Ocean and the Atlantic Ocean (Karcher et al., 2012; Orre et al., 2010; Smith et al., 2016). Firstly, 129I can be detected at all oceanic levels far from the source thanks to its conservative behaviour in seawater, its long half-life ( Ma) and the low detection limits obtained with accelerator mass spectrometry (AMS) (e.g. Vockenhuber et al., 2015). Secondly, the presence of 129I in those regions is dominated by the liquid discharge from European NRPs, which has a well-documented release history (>5700 kg; He et al., 2013a; Raisbeck et al., 1995), while the contribution from GF is comparably negligible (>90 kg worldwide release; Hou, 2004; Raisbeck and Yiou, 1999; Wagner et al., 1996). Consequently, the seawater affected by NRPs may present 129I concentrations 1–4 orders of magnitude above the background due to GF ( at kg−1; Edmonds et al., 1998). In the western SPNA, most of the 129I is now present in the EGC, flowing across the Greenland Shelf (Alfimov et al., 2013) and in the Denmark Strait Overflow Water (DSOW) that fills bottom depths of the Irminger and Labrador seas (Smith et al., 2005, 2016). The other overflow water, ISOW, enters the North Atlantic through the Iceland–Scotland sill (Hansen and Osterhus, 2000) and is present notably along the Reykjanes Ridge or overlying DSOW in the Irminger and Labrador seas. ISOW carries comparably less 129I (Edmonds et al., 2001), yet its 129I concentrations at the sill have increased 900 % over the last 20 years (Alfimov et al., 2013; Edmonds et al., 2001; Vivo-Vilches et al., 2018), implying that this tracer may also provide a chronological marker for spreading pathways of overflow water in the eastern SPNA.
Uranium-236 ( Ma) is a long-lived conservative radionuclide similar to 129I and a novel ocean circulation tracer investigated in the last decade (e.g. Casacuberta et al., 2014, 2016, 2018; Castrillejo et al., 2017; Christl et al., 2012; Christl et al., 2017; Sakaguchi et al., 2012; Winkler et al., 2012). Surface seawater in the Northern Hemisphere presents 236U∕238U atom ratios of about (e.g. Christl et al., 2012) in the unique presence of GF (about 900 kg released worldwide; Sakaguchi et al., 2009). However, the 236U∕238U ratios can be significantly higher in the Arctic and North Atlantic Oceans due to the liquid discharge of 236U from European NRPs (about 100 kg, Christl et al., 2015a). This made it possible to trace the waters carrying NRP-236U with 236U∕238U ratios up to in the Arctic Ocean in 2011–2012 (Casacuberta et al., 2016) and up to in LSW and DSOW in the western SPNA in 2010 (Casacuberta et al., 2014). In addition, both 236U and 129I can be combined to form the dual tracer, 129I∕236U–236U∕238U, to identify the radionuclide source(s) present in a given water mass (Casacuberta et al., 2016; Christl et al., 2015b). This is possible because the GF and the European NRPs introduced different amounts of 236U and 129I (see above) into the environment and tagged the waters with characteristic 129I∕236U and 236U∕238U atom ratios depending on the proximity from the source(s). Consequently, this dual tracer could also help to better understand the mixing in the SPNA between AWs tagged by European NRPs and water masses carrying mainly GF (e.g. Arctic–Canadian water).
In this study, we aim to use artificial 129I and 236U to investigate the transport pathways and timescales of water mass circulation in the SPNA. To this end, we present the first simultaneous distribution of 129I and 236U along the GEOVIDE cruise track in spring 2014 (Fig. 1). The study pursues three specific objectives. Firstly, we study the zonal distribution of 129I and 236U and their relationship with the water mass structure. Although the distribution of 129I in the Irminger and Labrador seas has been well studied in the last 30 years, there is a significant data gap east of the Reykjanes Ridge for 129I and for most of the section for 236U. Secondly, we use the dual 129I∕236U–236U∕238U tracer approach to distinguish the source contribution to the presence of 129I and 236U in the SPNA. This information is then valuable for studying the origin, mixing and spreading pathways of water masses participating in the AMOC. The combined use of 129I and 236U allows circulation features to be traced that received significant attention in earlier modelling, tracer and physical studies and helps to validate recent interpretations on the ventilation of the North Atlantic by overflow waters. Thirdly, tracer data from 2014 are combined with the extensive 129I time series in the central Labrador Sea to further investigate the circulation timescales of AWs downstream of European NRPs.
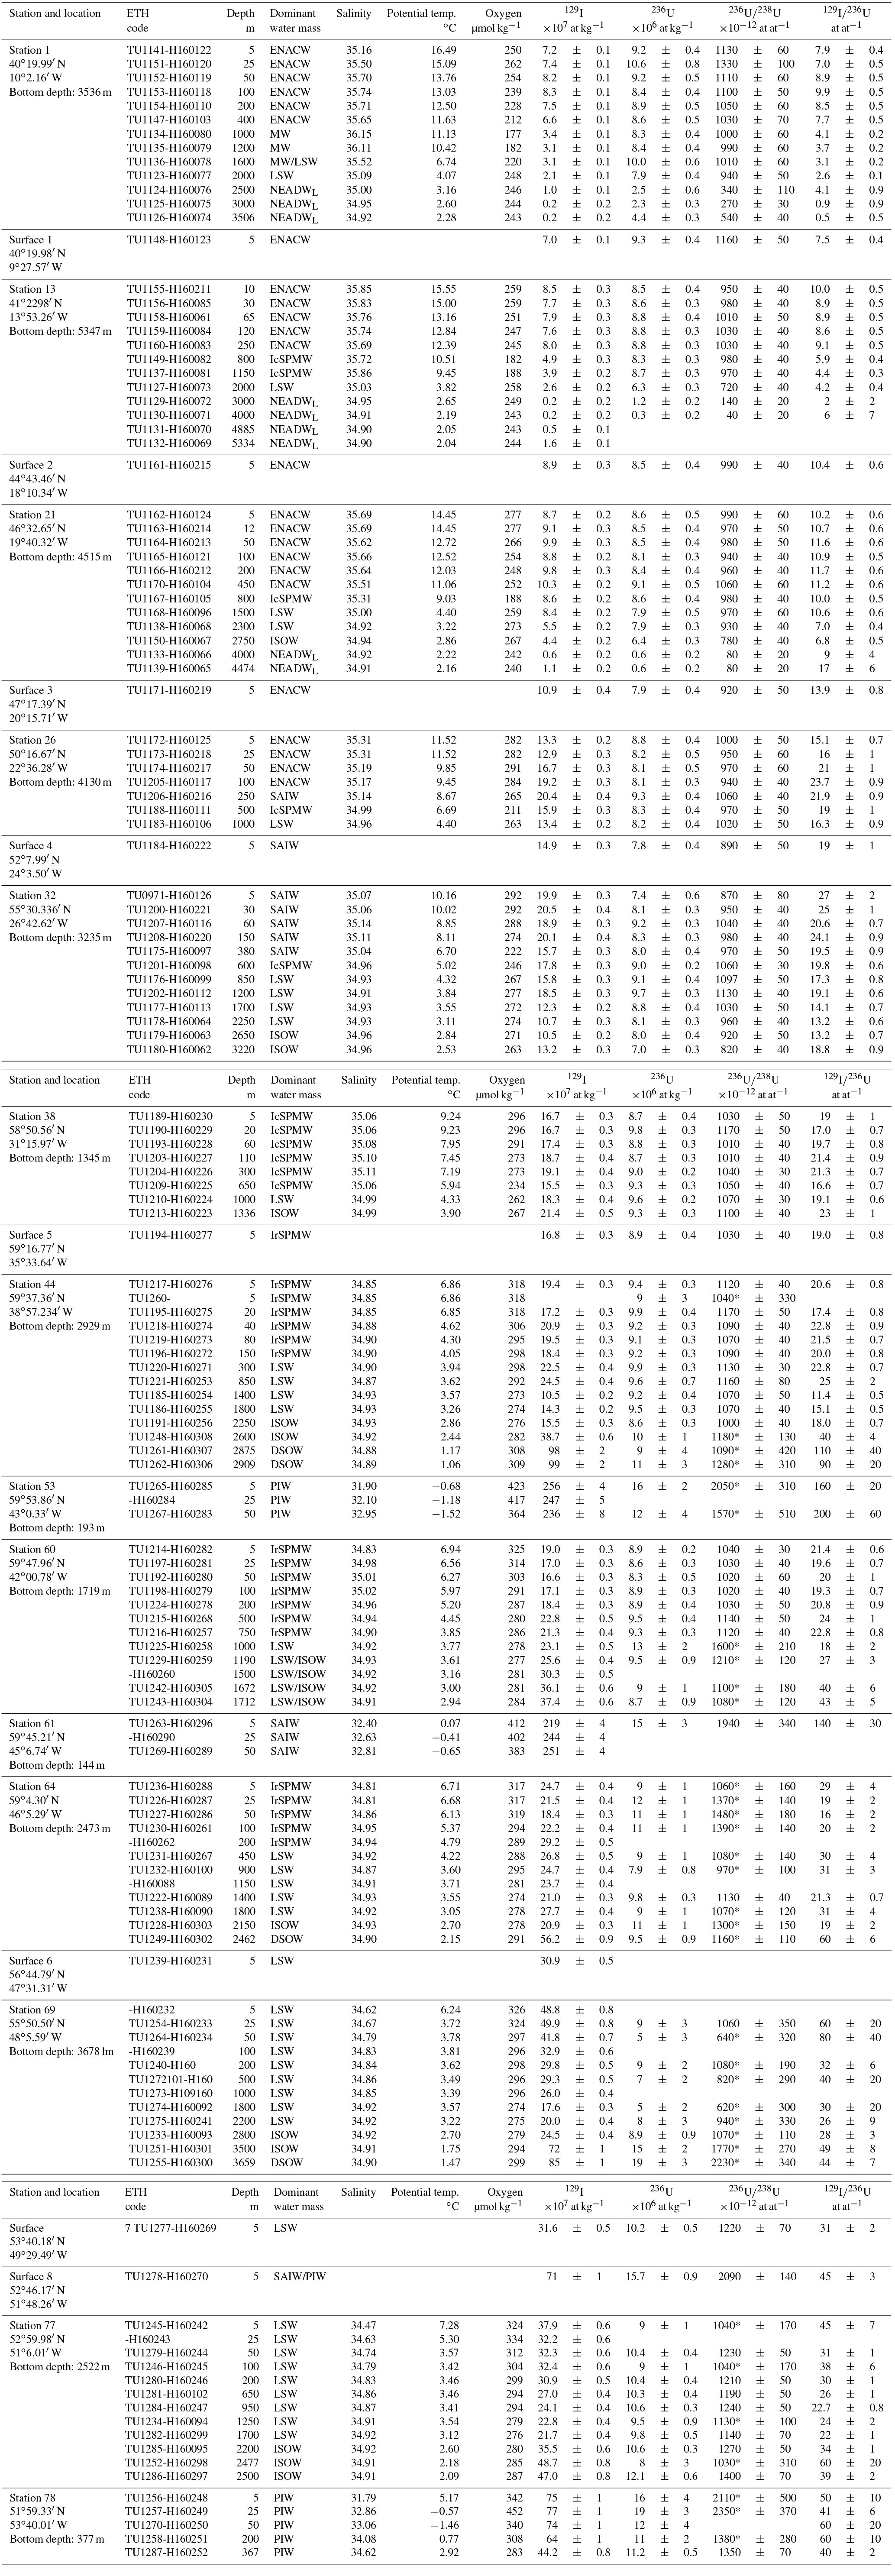
Table 1Concentrations of 129I and 236U, and atom ratios of 236U∕238U and 129I∕236U in seawater samples collected during the GEOVIDE cruise in spring 2014. Uncertainties of radionuclide concentrations and the 236U∕238U ratio are given as 1σ deviations. The uncertainty of the 129I∕236U ratio was propagated from the concentration uncertainty. * 236U data are corrected for cross talk contamination. Temp. stands for temperature.
2.1 The cruise, study area and sample collection
The GEOVIDE cruise (Fig. 1) covered the OVIDE line from Lisbon (Portugal) to the southern tip of Greenland (Cape Farewell), and from Cape Farewell to St John's (Newfoundland, Canada) on board the French R/V Pourquoi pas? between 15 May and 30 June 2014. This cruise is part of the GEOTRACES programme (section GA01: http://www.geotraces.org/cruises/cruise-summary, last acces: September 2018) and contributes to the decade-long biannual sampling (2002 to 2018) of the OVIDE line (http://www.umr-lops.fr/Projets/Projets-actifs/OVIDE, last acces: September 2018) from a geochemical perspective.
This study is based on concentrations of 129I and 236U, and on 236U∕238U ratios determined in about 150 seawater samples collected from 14 depth profiles (Fig. 1) using a rosette equipped with conductivity–temperature–depth sensors and 24 Niskin bottles of 12 L each. To collect water, sampling depths were chosen from the main water masses and circulation features at each station by considering conductivity, temperature and oxygen profiles. From east to west (Fig. 1), depth profiles were located in the West European Basin (WEB: stations 1, 13, 21 and 26), the central Icelandic Basin (station 32), above the Reykjanes Ridge (station 38), the Irminger Sea (stations 44 and 60), the Labrador Sea (stations 64, 69 and 77), and on the shelf/slope of Greenland (stations 53 and 61) and Canada (station 78). Additional surface samples were obtained using a FISH device that allowed the collection of seawater from about 2 m depth at eight locations placed between depth profiles. Samples for 129I of ∼0.5 L were collected in dark plastic bottles and sealed with parafilm. The 236U samples of 5–7 L were collected in plastic cubitainers. Bottles and cubitainers were rinsed 3 times with seawater before sample collection to avoid potential contamination.
2.2 Iodine-129 purification and AMS measurement
The radiochemistry of 129I followed a method described in Michel et al. (2012) at EAWAG (Switzerland). About 300–450 mL of sample was spiked with ∼1.5 mg of Woodward stable iodine (127I) carrier. All iodine was oxidised to iodate by adding 2 % Ca(ClO)2, then reduced to iodide using Na2S2O5 and 1 M NH3O•HCl. The purification of iodine was carried out using columns filled with DOWEX® 1×8 ion exchange resin. The column was conditioned with deionised water and diluted KNO3 solution before the elution of iodine with 2.25 M KNO3 solution. The iodine was precipitated as AgI by adding AgNO3, then mixed with 4–5 mg of Ag and pressed into AMS cathodes. The compact 0.5 MV Tandy AMS system at ETH Zurich was used to measure the 129I∕127I atom ratios (Vockenhuber et al., 2015). The 129I∕127I ratios were normalised with the ETH Zurich in-house standard D22 with a nominal 129I∕127I value of (Christl et al., 2013b). Radiochemistry blanks (n=24) were prepared with deionised water and processed together with seawater samples following the same analytical procedures. These blanks presented 129I∕127I ratios of (0.7–4) corresponding to (0.5–3) ×106 atoms of 129I. The 129I concentrations were calculated based on measured 129I∕127I ratio and the known amounts of 127I carrier added to each sample. The detection limit of <0.3 fg 129I depended on the measured 129I∕127I ratio of the Woodward iodine carrier, which is typically of the order of .
2.3 Uranium-236 purification and AMS measurement
Each seawater sample (5–7 L) was weighed, acidified to pH below 2 using concentrated suprapure HNO3 and spiked with ∼3 pg of 233U (IRMM – 051). The uranium was co-precipitated with iron hydroxides upon addition of ∼200 mg of U-free Fe2+ solution and concentrated suprapure NH4OH by raising the pH to ∼8. The iron precipitate was syphoned, evaporated to dryness and re-dissolved using 8 M HNO3. The purification of uranium was carried out using UTEVA columns (Triskem). The eluate was co-precipitated with ∼1 mg of the U-free Fe2+ solution and evaporated to dryness. All uranium was converted to oxide form by heating the iron precipitates to 650 ∘C, then mixing them with 2–3 mg of niobium and pressing them into AMS cathodes. The compact 0.5 MV Tandy AMS system at ETH Zurich was used to measure 233U, 236U and 238U following Christl et al. (2013a). The measured 236U/233U and 236U∕238U ratios were normalised to the ZUTRI ETH Zurich in-house standard with nominal values of (4055±200) and (33 170±830) (Christl et al., 2013a). Radiochemistry blanks (n=19) were prepared on board and in the land-based laboratory with deionised water and processed together with seawater samples following same analytical procedures. The blanks presented 236U/233U ratios , corresponding to <40 ag of 236U. The compact TANDY AMS system has an abundance mass sensitivity of for the mass range of actinides, corresponding to an estimated instrumental background level of the order of 236U∕238U . Due to a mistake in the laboratory, a total of 34 samples were accidentally cross-contaminated with a very high 236U standard and therefore had to be background corrected for cross talk. The uncertainty of this additional background correction led to higher errors reported for those samples (marked with an asterisk in Table 1).
3.1 Water mass structure in 2014
The water mass structure in spring 2014 is described using the zonal sections for salinity, potential temperature and dissolved oxygen concentrations (Fig. 2) to facilitate the understanding of 129I and 236U distributions in Sect. 3.2. The assessment of the water mass structure from GEOVIDE was performed using an extended optimum multi-parameter analysis (OMP) (further details are found in García-Ibáñez et al., 2018).

Figure 2Vertical distribution of (a) salinity, (b) potential temperature and (c) dissolved oxygen along the GEOVIDE section in spring 2014. Water mass acronyms are defined in the Appendix.
In the upper water column (<500 m), warm and saline Central Water dominates the eastern part of the section between the coast off Portugal and station 26 (Fig. 2a and b). Central Water (or eastern North Atlantic Central Water, ENACW) is characterised by the highest potential temperatures and relatively high salinities, as they have been transported from subtropical latitudes into the eastern part of the section by the north-east-flowing branches of the NAC. Part of the ENACW recirculates into the Iceland Basin and the Irminger Sea, where air–sea fluxes transform them into colder and fresher SPMWs (McCartney and Talley, 1982) that occupy equivalent depths between the subarctic front (SAF; roughly at 22.5∘ W, station 26) and Greenland (Fig. 2a and b). The upper water column on the continental shelves and slopes of Greenland and Canada is occupied by PIW, which presents very low salinities (<34) and potential temperatures usually <0 ∘C (Fig. 2a and b). PIW originates from the Arctic Ocean, enters through the Fram (PIW–Atlantic) and Nares Straits (PIW–Canada), and joins the shallow western boundary transport in the EGC and LC (Fig. 1).
At intermediate depths, LSW is the most abundant water mass and fills the entire section from the upper water-levels to about 2000 m depth (Fig. 2). LSW is formed in the Labrador Sea and, to a lesser extent, in the Irminger Sea by transformation of SPMWs via winter convection (e.g. Jong and Steur, 2016). Then, it flows south as part of the DBWC (e.g. Bersch et al., 2007) or east into the Irminger, Iceland and West European basins (Fig. 1). LSW is characterised by a relative minimum in salinity (<34.9) and temperature (∼3 ∘C) at its formation region, and warmer and saltier values as it mixes with surrounding waters along its equatorward and eastward transport (Fig. 2a and b). Station 26 is also affected by the Subarctic Intermediate Water (SAIW), which presents lower salinities (∼34.9) and potential temperatures (4–7 ∘C) than the other water masses surrounding it at similar depths, i.e. ENACW and SPMW from the Iceland Basin (IcSPMW; Fig. 2a and b). SAIW forms in the western boundary of the SPNA (i.e. the LC) by mixing between LSW and subtropical waters carried by the NAC (Arhan, 1990; Read, 2000), before subducting at about 400 m depth and being advected within the northern branch of the NAC (Fig. 2). Depths around 1000 m in the WEB (stations 1 and 13) are also influenced by the northward-flowing Mediterranean Water (MW) (Fig. 1), which is characterised by a maximum in salinity (>36) and minimum in oxygen (∼180 µmol kg−1) (Fig. 2a and c).
In the deep-water column (>2000 m), the lower north-eastern Atlantic Deep Water (NEADWL) dominates the section in the WEB (east of 20∘ W), while in the western part, the most abundant water masses are the dense overflow waters. NEADWL is generally saltier, colder and older than the overlying LSW due to the major contribution of the northward-flowing Antarctic Bottom Water (AABW) (Fig. 2a–c). Dense overflow waters dominate the bottom depths on both sides of the Reykjanes Ridge and in the Irminger and Labrador seas (Fig. 1). ISOW is best identified thanks to its local salinity maximum (∼34.92) on the flanks of the Reykjanes Ridge and between the LSW and DSOW in the Irminger and Labrador seas (Fig. 2a). This water mass is produced by mixing old Norwegian Sea waters that overflow the Iceland–Scotland sill and entrain SPMW and LSW in the SPNA (e.g. van Aken and De Boer, 1995). ISOW mainly flows along the eastern flank of the Reykjanes Ridge into the Irminger and Labrador seas (Fig. 1), yet an increasing number of studies point towards the eastward return flow of this water mass through passages in the Mid-Atlantic Ridge (Xu et al., 2018) or directly along the flanks of the Rockall Plateau into the eastern part of the GEOVIDE section (e.g. Zou et al., 2017) (Fig. 1). Finally, DSOW is present between ISOW and the seafloor in the Irminger and Labrador seas (notably stations 44 and 69). This overflow water can be distinguished from ISOW by its lower salinities (<34.90), potential temperatures (<2 ∘C) and higher oxygen concentration (>290 µmol kg−1) (Fig. 2a–c) due to the more recent ventilation and rapid advective flow of DSOW from the formation region north of the Denmark Strait into the GEOVIDE section (e.g. Read, 2000) (Fig. 1).
3.2 The relationship of 129I and 236U with water masses in 2014
The concentrations of 129I and 236U, and atom ratios of 236U∕238U and 129I∕236U are reported in Table 1. Detailed depth profiles for these radionuclides are displayed along with salinity, potential temperature and dissolved oxygen concentrations in the Supplement (Fig. S1). The 129I concentrations range from (0.20±0.20) ×107 to (256±4) ×107 at kg−1. The 236U∕238U ratios range from (40±20) to (2350±370) . The 129I∕236U ratios range from 0.50±0.50 to 200±60.
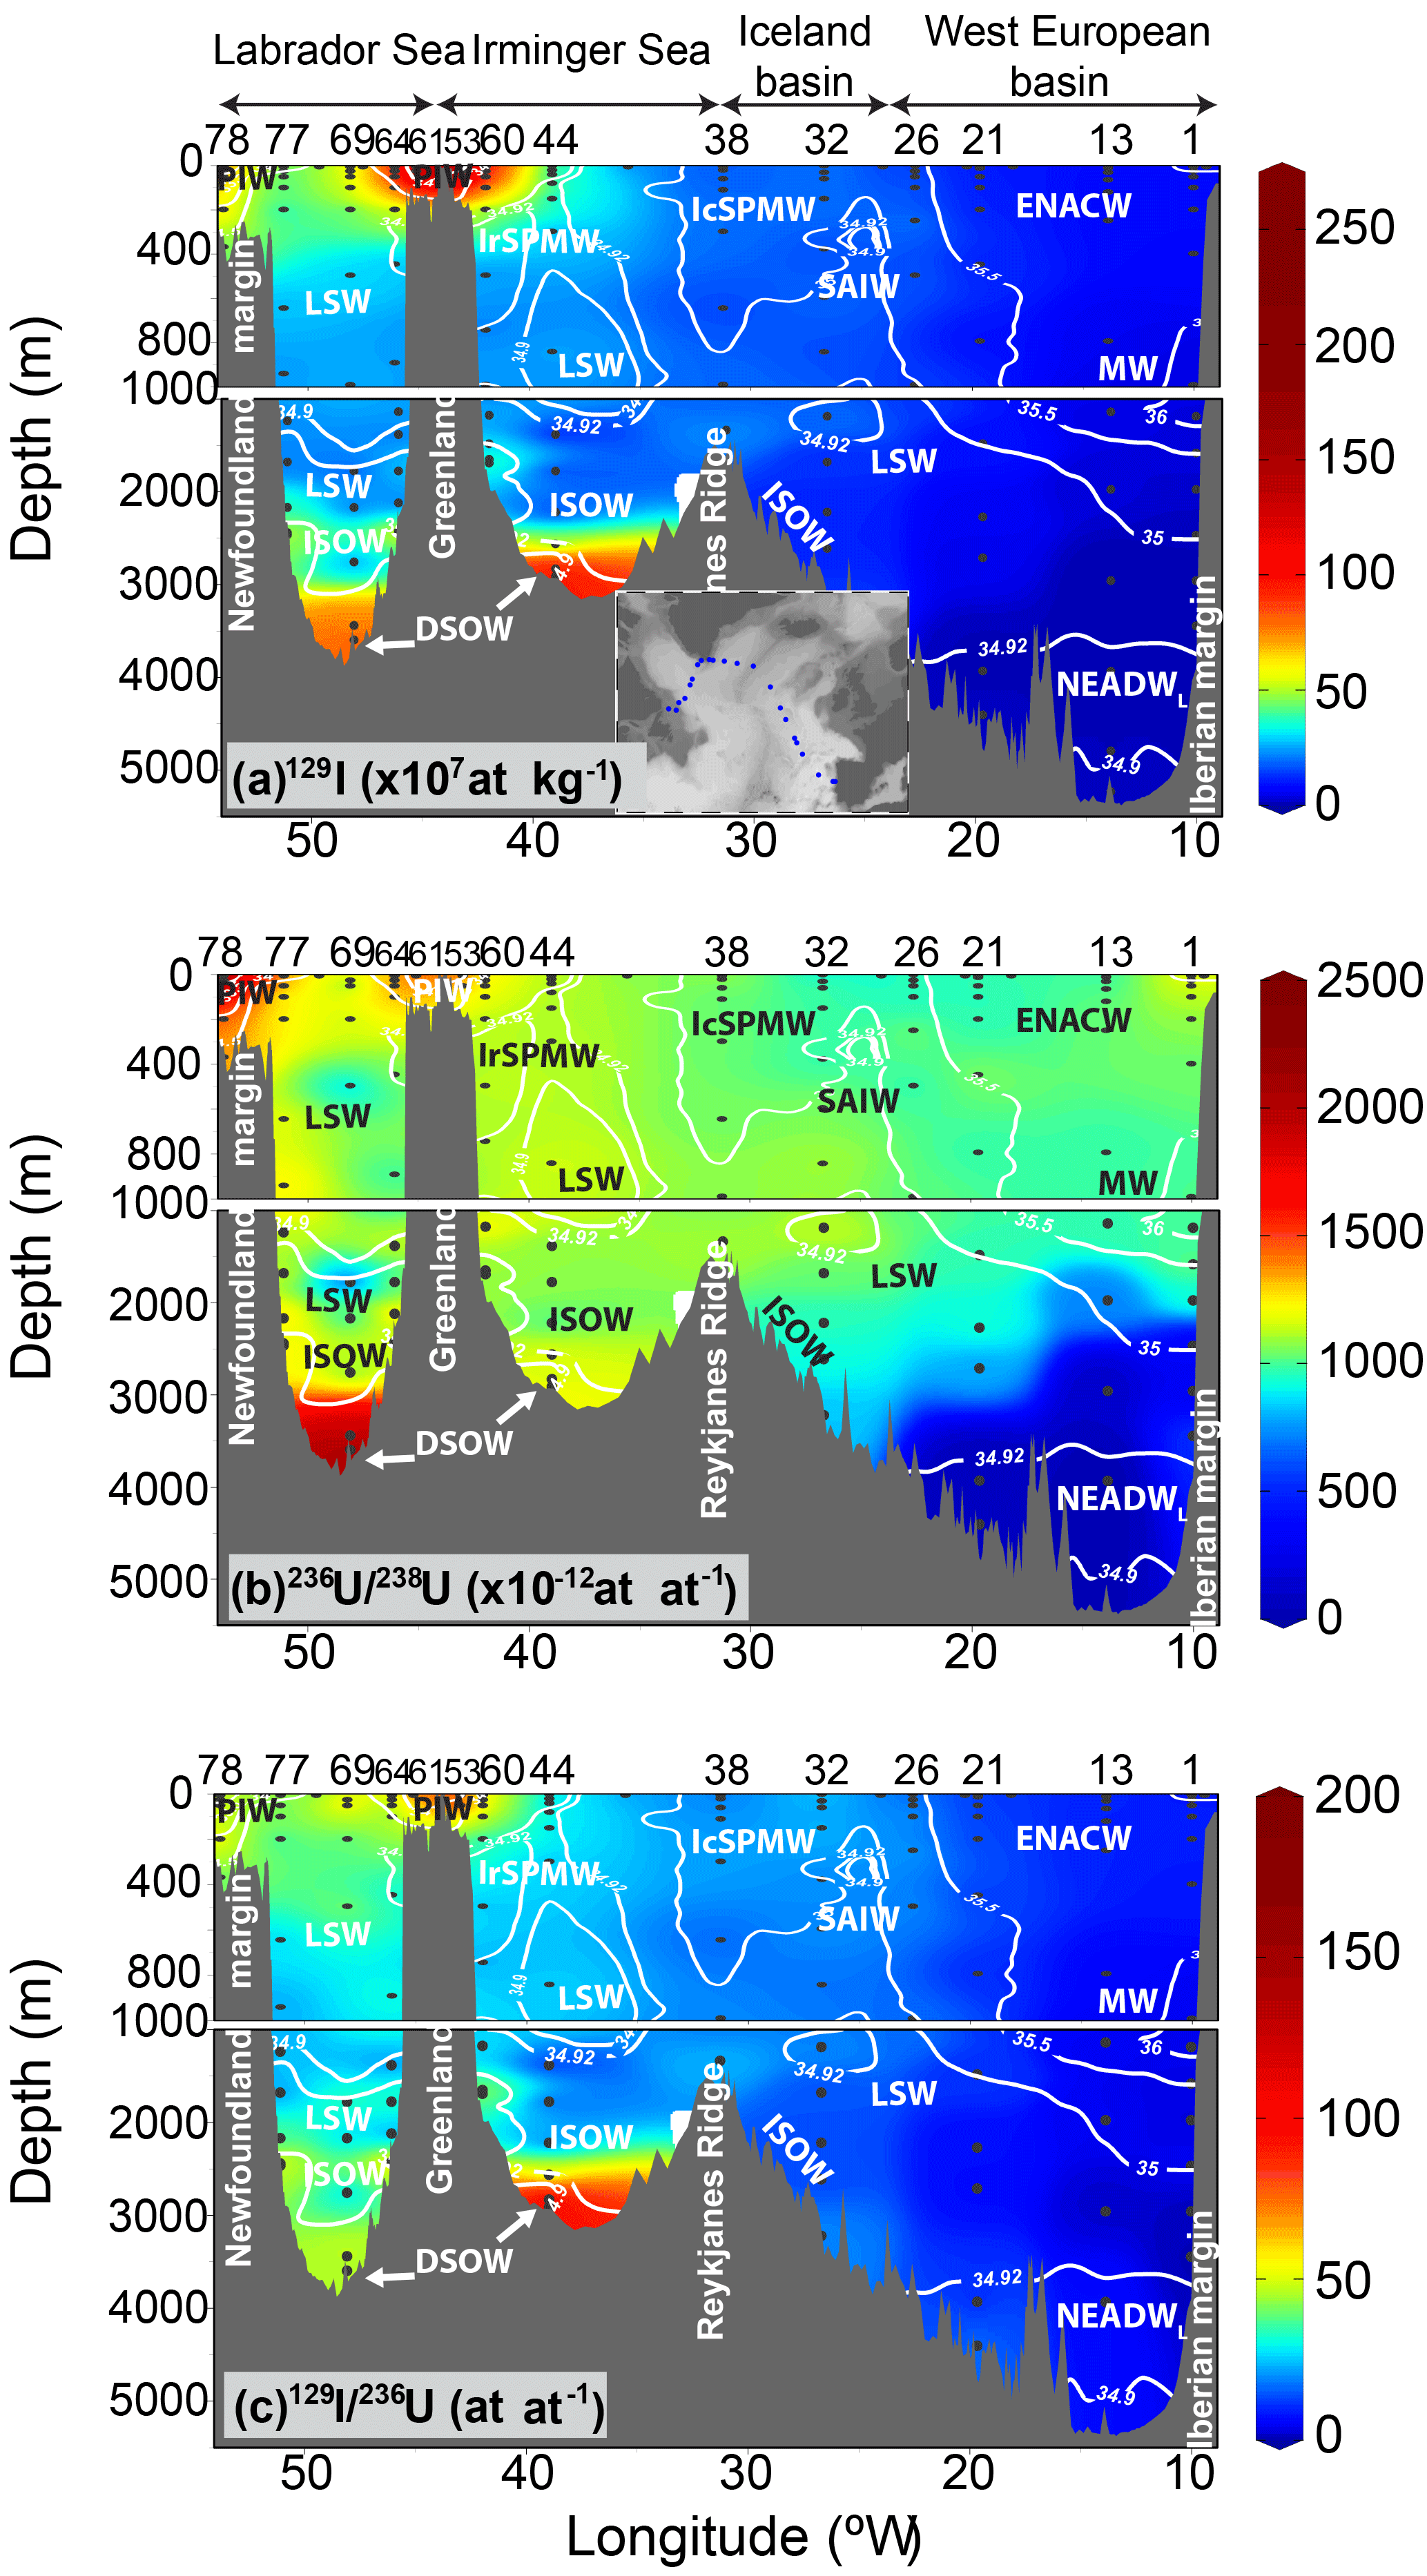
Figure 3Vertical distribution of (a) 129I concentrations, and atom ratios of (b) 236U∕238U and (c) 129I∕236U during the GEOVIDE cruise in spring 2014. Isohalines are overlaid to represent the water mass distribution. Acronyms are defined in the Appendix.
The results from this study are best described in relation to the water mass structure described in Sect. 3.1, which has been represented with overlaid isohalines on the radionuclide distribution plots (Fig. 3). The 129I concentrations (Fig. 3a) and 236U∕238U ratios (Fig. 3b) are generally higher west of ∼25∘W in southward flowing waters than in northward-flowing low-latitude waters dominating the eastern SPNA. This is also clear when comparing tracer values of stations 1–26 with those from stations 32–78 (Table 1). Such general radionuclide distribution is largely due to the fact that southward-flowing northern waters are located downstream of Sellafield and La Hague, and therefore present additional radionuclide contributions (especially for 129I) from these facilities. The highest 129I concentrations ( at kg−1) and 236U∕238U ratios () are present in PIW and RAW carried by the EGC and LC over the shelves and slopes of Greenland and Canada. This water admixture, largely influenced by NRPs (e.g. Alfimov et al., 2013), can mix with DSOW precursor waters through winter convection in the Greenland Sea (e.g. Gascard et al., 2002) or directly intrude DSOW by cascading in the Labrador Sea (e.g. Falina et al., 2012). Consequently, the DSOW core, found at the lowermost 100 m in the Irminger and Labrador seas, presents 129I concentrations in the (85–100) ×107 at kg−1 range and 236U∕238U ratios of (1300–2300) , which is in agreement with high radionuclide levels previously reported for DSOW (Casacuberta et al., 2014; Orre et al., 2010; Smith et al., 2005, 2016). Intermediate 129I concentrations ((5–50) ×107 at kg−1) and 236U∕238U ratios ((500–1500) ) characterize the water masses that fill most of the remaining GEOVIDE section. In the upper 500 m, ENACWs record rather uniform 129I concentrations ( at kg−1) and 236U∕238U ratios () in the WEB (stations 1 to 21). The 129I concentrations of SPMWs located further west almost double those of ENACW (236U∕238U ratios are similar), indicating that ENACW may be influenced by effluents from NRPs while recirculating in the northern SPNA or in the Nordic seas. SAIW also presents relatively high 129I concentrations ( at kg−1) at stations 26 and 32, probably because of the influence of waters carried by the LC. The 500–2000 m layer is dominated by LSW, which displays a wide range of 129I concentrations ((5–50) ×107 at kg−1) and 236U∕238U ratios ((700–1250) ), with values decreasing downstream from its formation regions, the Labrador and Irminger seas. Similar depths are also influenced by MW (stations 1 and 13), yet its 129I concentrations ( at kg−1) and 236U∕238U ratios ( were significantly lower in 2014 than average 129I concentrations (9×10⁷ at kg−1) and 236U∕238U ratios () reported in the outflow region of MW at the Strait of Gibraltar in 2013 (Castrillejo et al., 2017). Thus, 2014 data probably reflect the dilution of MW, which is largely affected by input from the Marcoule nuclear facility (Castrillejo et al., 2017), with old LSW and SPMW carrying a diluted NRP signal. The deeper parts of the section west of 20∘ W and below 2000 m are influenced by ISOW, which is characterised by relatively high 129I concentrations ((10–70) ×107 at kg−1) and 236U∕238U ratios ((900–1700) ). The lowest 129I concentrations ((0.2–2.0) ×107 at kg−1) and 236U∕238U ratios ((40–350) ) are found at depths greater than 2000 m in the WEB and are associated with NEADWL (stations 1 to 13).
The distribution of 129I∕236U (Fig. 3c) is notably driven by 129I concentrations, which display a greater range (3 orders of magnitude) than the 236U∕238U ratios (2 orders of magnitude). As noted before, this is probably due to the influence of NRPs, which released about 60 times more mass of 129I than of 236U to the North Atlantic (further discussion in Sect. 3.3). Thus, following the 129I patterns described above, the 129I∕236U ratios are particularly high (>20) in the western part of the section and particularly contrasted in the Irminger and Labrador seas as discussed in Sect. 3.3 (Fig. 3c). The highest 129I∕236U ratios (>100) are present in waters transported by the shallow EGC and LC. Overflow waters are also distinguished by their relatively high 129I∕236U ratios (60 to 110 for DSOW, 15 to 40 for ISOW).
3.3 Sources of 129I and 236U in the SPNA
All samples show 129I concentrations and 236U∕238U ratios well above the lithogenic background (LB) or the natural values ( at kg−1 for 129I, Snyder et al., 2010; and 10−14–10−13 for 236U∕238U atom ratios: Christl et al., 2012 and Steier et al., 2008). This was also shown in previous studies, highlighting the influence of artificial sources on the presence of 129I (e.g. Edmonds et al., 2001) and 236U (Casacuberta et al., 2014; Christl et al., 2012) in the North Atlantic.
As in earlier studies (Casacuberta et al., 2016), we can estimate the contribution to our samples from the LB, GF and NRP by combining the 129I∕236U and 236U∕238U in a dual tracer approach (Fig. 4). This is possible because the atom ratios of 129I∕236U and 236U∕238U display a wide range of values due to the different inputs of 129I and 236U from the three sources. For example, the GF introduced about 10 times more 236U than 129I; thus this endmember is characterised by 129I∕236U <1 and 236U∕238U surface ratios in the (1000–2000) range. On the contrary, the total amount of 236U introduced from European NRPs was much smaller than for 129I. Therefore, a water mass with the additional influence of the European NRPs may present 129I∕236U in the 1–350 range and 236U∕238U above the GF. The natural presence of 129I and 236U is negligible compared to artificial sources, yet the LB can be distinguished by a very small 236U∕238U () and a relatively large 129I∕236U (∼370). The simple mixing model (Fig. 4) considers the three aforementioned endmembers constant in time, for which values were estimated by Casacuberta et al. (2016) based on the literature or on their own calculations. The mixing lines between each endmember represent all possible binary mixing scenarios; i.e. they delimit the range of 129I∕236U and 236U∕238U that a given water mass may show depending on the sources and on the different degrees of mixing. For instance, a sample falling in the 1 % value on the GF-NRP binary mixing line would be composed of waters largely carrying GF and about 1 % of the NRPs signal.
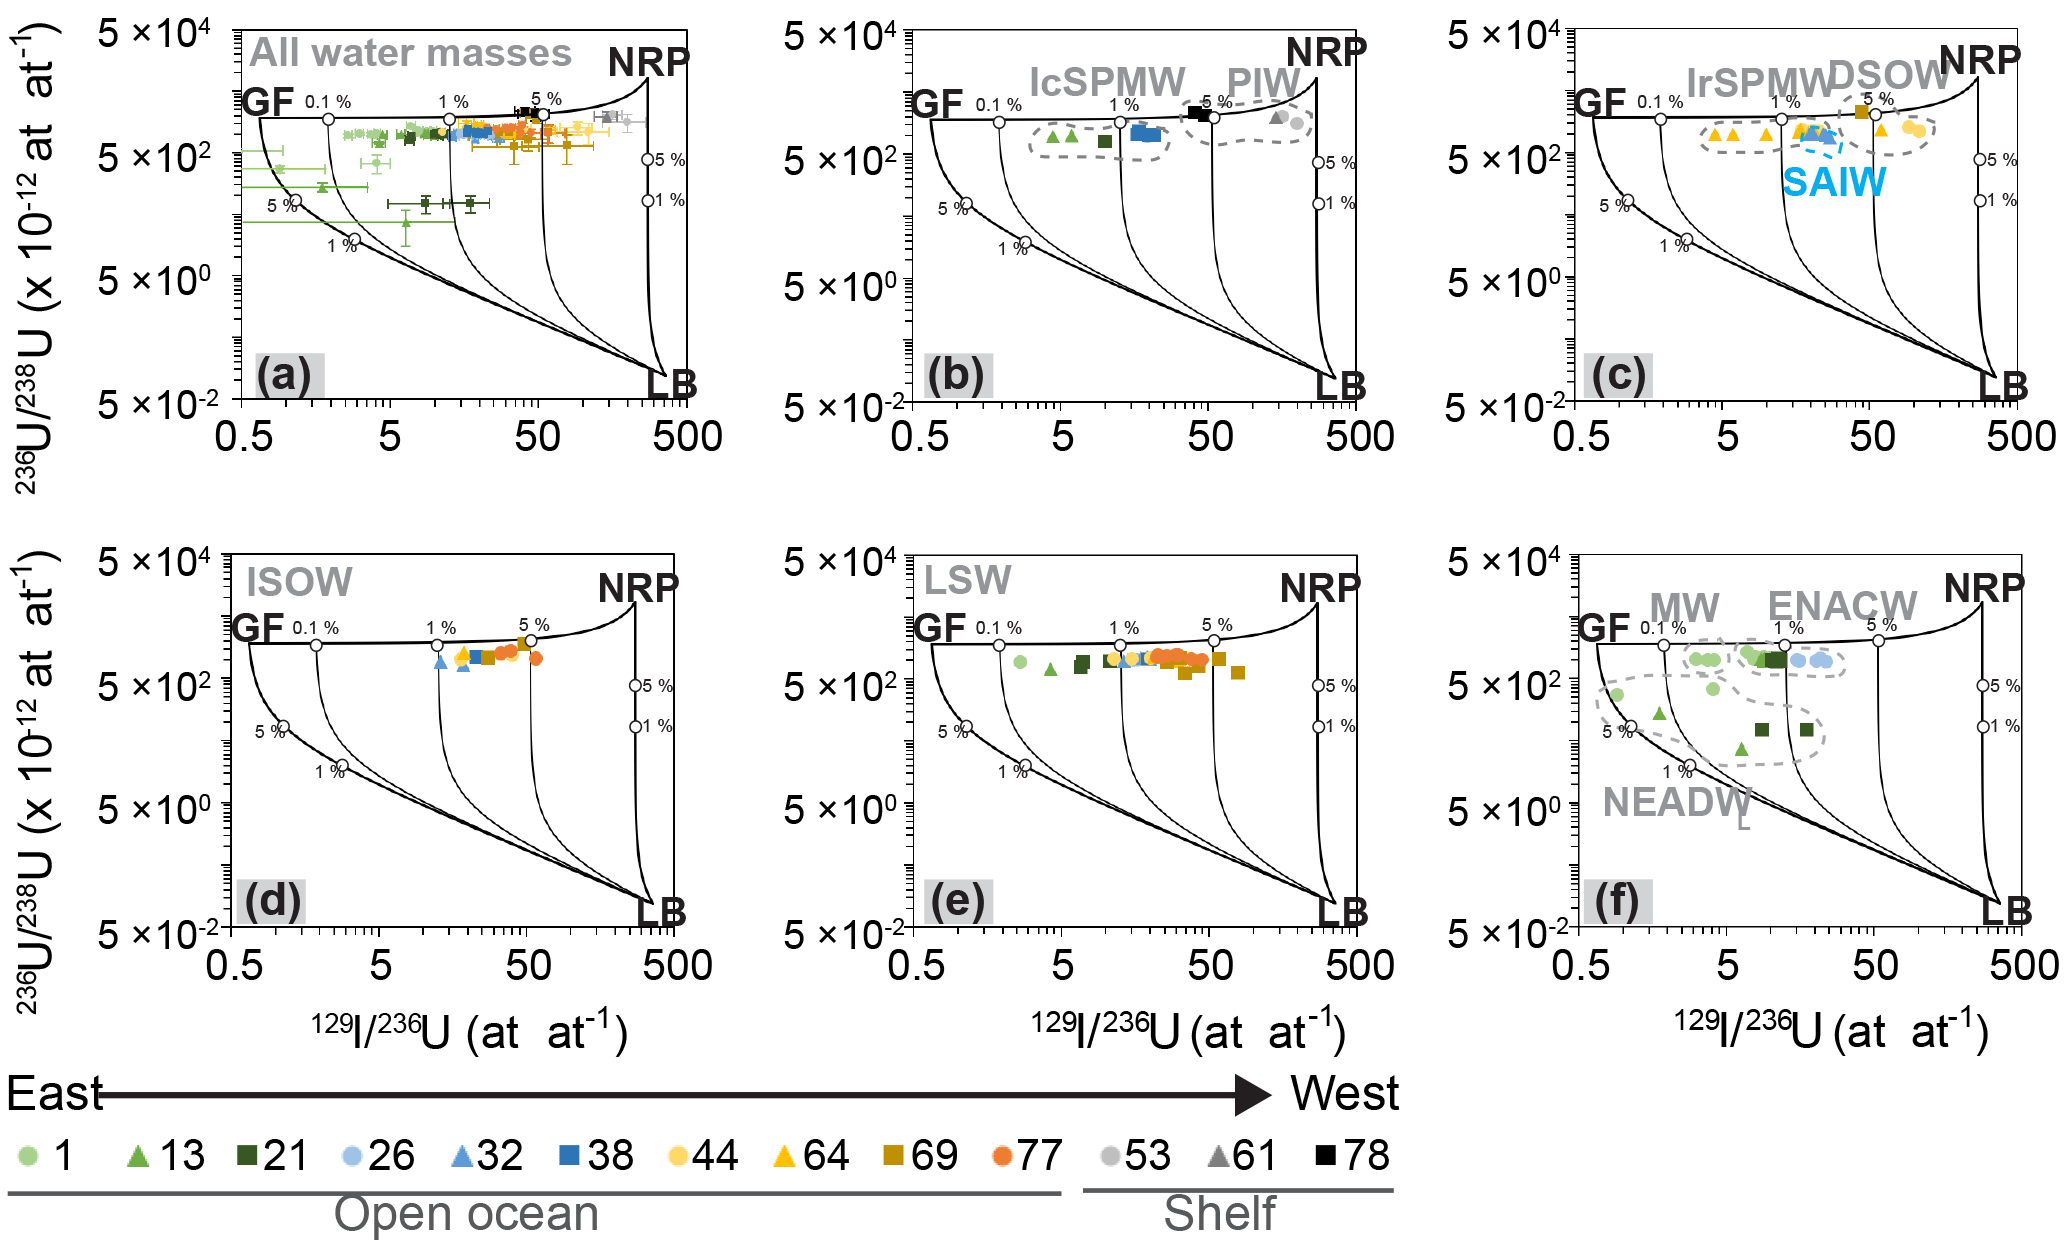
Figure 4129I∕236U and 236U∕238U atom ratios obtained during the GEOVIDE cruise in spring 2014 plotted on top of a binary mixing model (details in Sect. 3.3) to estimate the contribution from the three sources to the subpolar North Atlantic (global fallout, GF; European nuclear fuel reprocessing plants, NRP; and the natural or lithogenic background, LB). Data are plotted for (a) each station, and (b–f) for the main water masses described in Sect. 3.1. Diagram (a) also shows the data uncertainties. An explanation on how to interpret the results is provided in Sect. 3.3. Further detail about the binary mixing model can be found in the original study (Casacuberta et al., 2016). Water mass acronyms are defined in the Appendix.
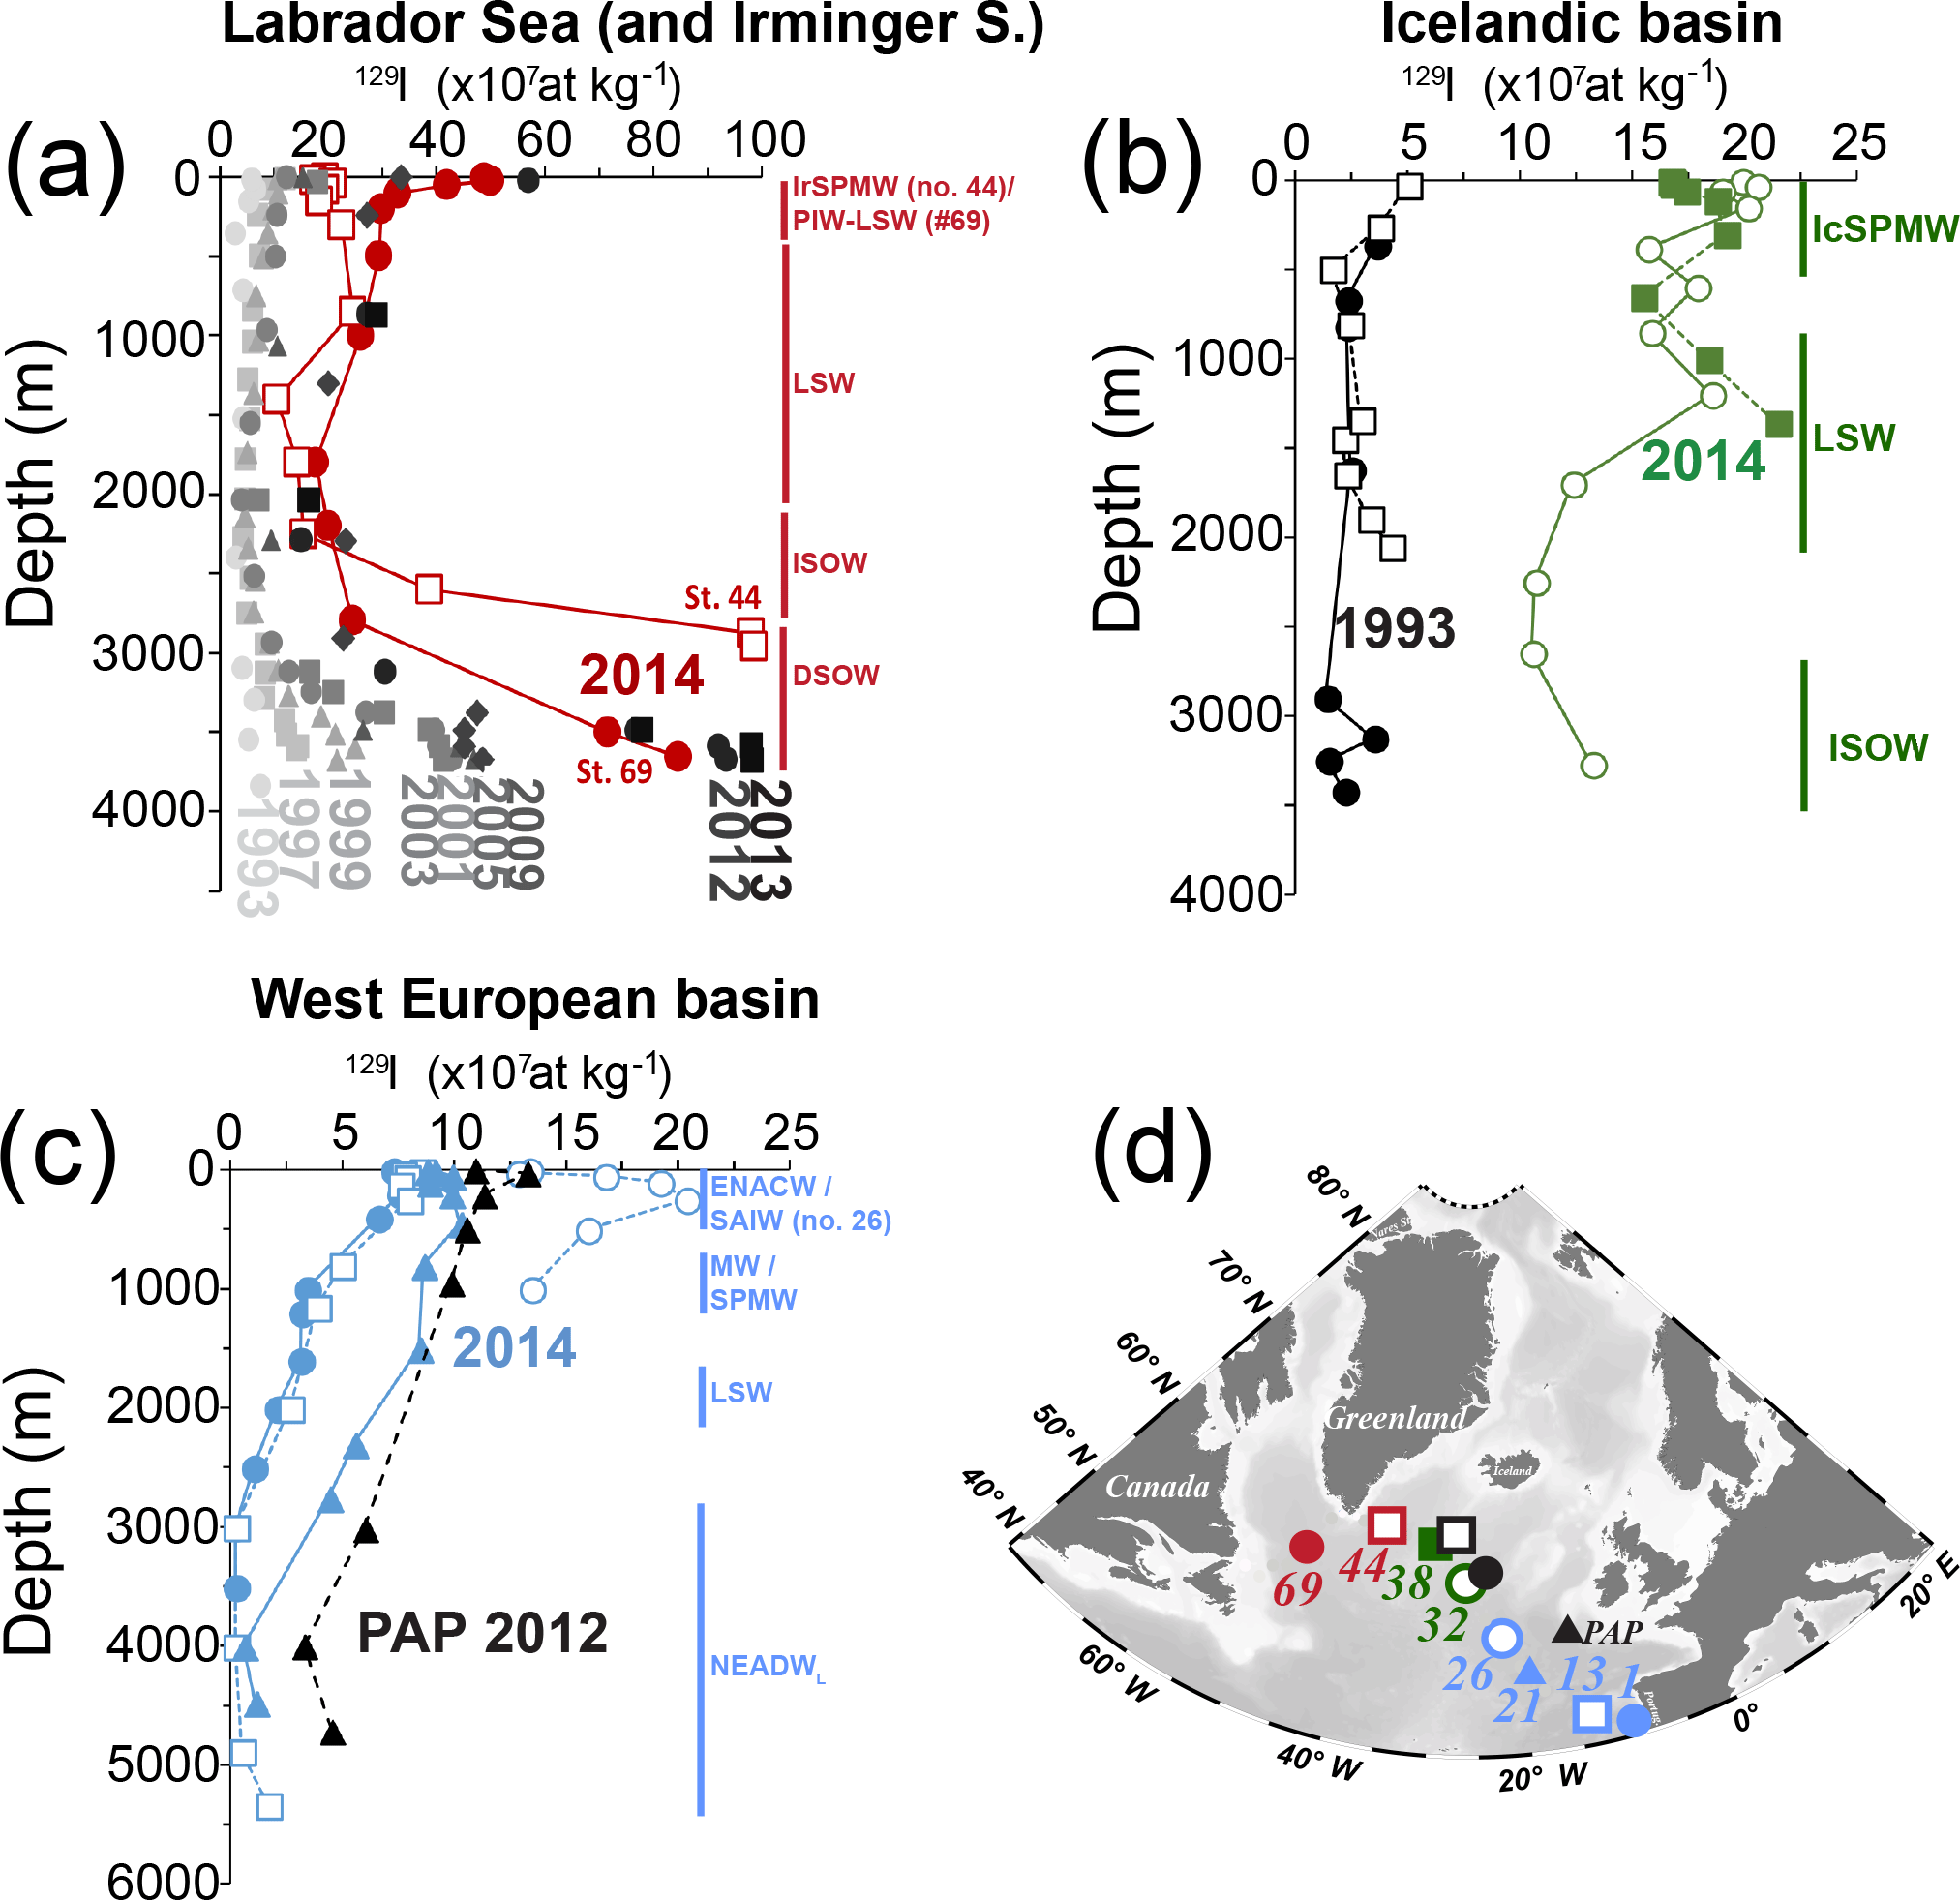
Figure 5Vertical profiles of 129I concentrations at locations shown in (d) of selected GEOVIDE stations and of those reported in nearby locations by earlier studies. (a) 129L in the Labrador and Irminger seas, red profiles represent data from this work (2014). Data from 1993 were reported south-west of the GEOVIDE station 69 by Edmonds et al. (2001). Data from 1997 to 2013 were reported at station 17 of the AR7W line: for 1997, 1999 and 2001 by Smith et al. (2005); for 2003, 2005 and 2009 by Orre et al. (2010); and for 2012 and 2013 by Smith et al. (2016). (b) In the Icelandic Basin, green profiles show data from GEOVIDE stations 32 and 38 in 2014, while black profiles represent data from 1993 reported by Edmonds et al. (2001). (c) In the West European Basin, blue profiles represent data from GEOVIDE stations 1 to 26, while data from 2012 in the Porcupine Abyssal Plain (PAP) were reported by Vivo-Vilches et al. (2018). Water masses found during GEOVIDE cruise have been summarised and represented in same colour as the 129I concentration profiles. Acronyms are defined in the Appendix.
On top of the mixing model, we represent the results from the GEOVIDE cruise (Fig. 4). Each data point represents a seawater sample collected at a certain station (Fig. 4a) or assigned to a dominant water mass (Fig. 4b to f). The results show that most of the samples fall along the GF-NRP binary mixing line with contributions from NRPs >1 %. The largest NRP contribution, above 5 %, is observed in the Irminger and Labrador seas, notably associated with PIW, DSOW and to lesser extent with ISOW. LSW also records NRP contributions >1 % in the westernmost stations (e.g. 44 to 77), while LSW that has been transported further east on the section (stations 1 to 38) reflects the greater mixing or dilution with waters notably carrying GF. ENACWs are closer to the GF endmember, yet they show significant contributions (>1 %) from NRP. This result is unexpected given that the transport of ENACW occurs upstream and far away from the NRPs, from subtropical latitudes into the eastern SPNA (stations 1 to 26). At least six samples are separated from the GF-NRP mixing line and plotted towards the LB endmember. These are associated with the contribution of the northward flowing AABW to NEADWL (van Aken and Becker, 1996). AABW is the oldest water mass in the SPNA and has little or no influence from nuclear activities given that it was not exposed to the surface or atmosphere for decades.
3.4 Time evolution of 129I in the SPNA
In this section we compare radionuclide concentrations reported in the literature with those measured at nearby stations during GEOVIDE (Fig. 5). The assessment of the temporal evolution of radionuclide distributions is important to identify the main circulation features highlighted by these tracers. The limited data on the novel 236U tracer prevent from studying any temporal evolution. In the case of 129I, the existing time series for the central Labrador Sea (1993–2013, Fig. 5a) demonstrated that most of the tracer transport was carried by overflow waters (e.g. DSOW) and that the temporal evolution of 129I concentrations in those waters could be associated with the tracer release from the European NRPs a few years earlier (Edmonds et al., 2001; Orre et al., 2010; Smith et al., 2005, 2016). For instance, the literature on 129I shows a rise in tracer concentrations due to the increased 129I discharge rate from European NRPs in the whole water column, being more pronounced (increase of about 10 times) in overflow waters (Fig. 5a). The depth distribution of 129I concentrations in the Labrador Sea in 2014 (station 69) displays 129I concentrations in DSOW about 15 % lower (see Sect. 3.5.4) than in 2012–2013 (Smith et al., 2016), yet the general shape of the depth profile is comparable (Fig. 5a). The main difference between the 129I depth profiles in the Irminger Sea (station 44, red squares in Fig. 5a) and central Labrador Sea (station 69, red circles in Fig. 5a) in 2014 is the surface 129I peak in the latter one. Considering the 30 m deep freshwater surface layer observed between station 69 and Greenland (not shown here), we suggest that waters carried by the West Greenland Current (continuation of the EGC) may have separated from the main western boundary transport and entered the central Labrador Sea (Cuny and Rhines, 2002). This may also explain the peak in 236U∕238U ratios observed at the same location (Fig. S1).
A similar assessment of 129I concentrations is now possible for the water column over the Reykjanes Ridge (station 38) and the Icelandic Basin (station 32) (Fig. 5b), which were first studied in 1993 (Edmonds et al., 2001). The 129I concentrations in the water column are 5–7 times higher in 2014 than in 1993. The most pronounced increase occurs in the upper 1000 m filled by SPMWs and in the deep Icelandic Basin dominated by ISOW. This novel result shows that the 129I tracer could potentially be used to trace the transformation of ENACWs into SPMWs and the evolution of ISOW. The depth profiles of 129I concentration measured in the WEB in 2014 (particularly station 21) resemble the one sampled at the Porcupine Abyssal Plain (PAP) in 2012 by Vivo-Vilches et al. (2018) (Fig. 5c). The 129I distribution in the upper 1000 m at PAP is very similar to station 21, located 365 km to the south-west, while below that depth 129I concentrations are about 2.5×10⁷ at kg−1 higher in the PAP. These results suggest a similar water mass composition for that region, yet the offset in deep 129I concentrations would support the hypothesis that effluents from the nearby Sellafield and/or La Hague NRPs may directly enter the SPNA without previous circulation in the Nordic seas (see Sect. 3.5.1).
3.5 Tracing water mass circulation in the SPNA using 129I and 236U
We use the above information on the distribution, sources and time evolution of 129I and 236U to investigate the circulation of nuclear reprocessing effluents and in return, provide more insight into composition, spreading pathways and transport timescales of water masses in the SPNA.
3.5.1 Shallow water circulation in the eastern SPNA
The main transport of reprocessing effluents occurs poleward, yet the increasing observations and simulations on 129I suggest that part of the NRP signal may directly enter the surface of the SPNA without previous circulation in the Nordic seas. This hypothesis is based on the fact that 129I concentrations in surface waters of the north-eastern SPNA can record values more than 1 order of magnitude above the GF level (2.5×10⁷ at kg−1; Edmonds et al., 1998). He et al. (2013b) proposed that the outflow through the English Channel and the Irish Sea may lead to 129I concentrations in surface waters above 20×107 at kg−1 and modify the isotopic iodine composition in the Bay of Biscay. Modelling of 129I releases from the European NRPs also shows that tracers discharged from Sellafield may expand southwards (Villa et al., 2015), which could explain 129I concentrations of 77×107 at kg−1 measured in surface waters of the Celtic Sea (Vivo-Vilches et al., 2018). GEOVIDE data (Table 1) of 129I concentrations ( at kg−1) and 129I∕236U ratios (7–20) in ENACWs confirm the influence from the NRPs. If that was the case, the different NAC branches could mix ENACWs with reprocessing-labelled local waters and be transported southward by surface currents (e.g. Lambelet et al., 2015; Lherminier et al., 2010; Ríos et al., 1992). Indeed, NAC branches west of station 21 recirculated anti-cyclonically into the WEB, bringing waters south across the GEOVIDE section in 2014 (Zunino et al., 2017). Further, the transformation of ENACW into SPMW results in 129I concentrations twice larger in the Icelandic Basin than in the WEB (Fig. 5b and c), which suggests the near-surface transport of 129I from European NRPs also occurs southward across Iceland and Scotland. Consequently, 129I concentrations in shallow waters at stations 1, 13 and 21 strongly contrast with those at stations 26 and 32 located west of the SAF (Table 1). Such near surface tracer input would also explain the increase in surface 129I concentrations (Fig. S2) up to 108–109 at kg−1 in the Icelandic Basin and north-west of the British Isles by 2010–2012 (Gómez-Guzmán et al., 2013; Vivo-Vilches et al., 2018). Thus, one could potentially use 129I to trace ENACWs in the upper water column of the WEB and their transformation into SPMW. This is not clearly supported by 236U levels ( at kg−1), which are close to GF in the shallow eastern SPNA, yet European NRPs introduced about 60 times less 236U than 129I (Christl et al., 2015b).
3.5.2 Shallow water transport and cascading in the Irminger Sea and Labrador Sea
It is well known that the eastern coast of Greenland receives RAW and PIW–Atlantic injected in the EGC (Fig. 1). Similarly, the shelf of Newfoundland is bathed by the LC, which carries EGC waters and PIW–Canada, this last one being supplied through the Nares Strait (Curry et al., 2014). The tracer levels are particularly high in waters residing on the shelves, slopes and very deep waters around Greenland and Newfoundland (Fig. 3). Further, the tracer content differs between Arctic waters of Atlantic and Canadian origin, enriched in 129I and 236U, respectively. Thus, one may use them to distinguish key circulation features such as the EGC–LC and the DWBC in the Labrador and Irminger seas (Fig. 1). For example, at shallow depths, the EGC (stations 53 to 64) presents remarkably high 129I concentrations (up to at kg−1) and 129I∕236U ratios (up to 200), while both values are significantly lower in the LC (station 78), which is characterised by comparably higher 236U∕238U ratios (up to ) (Fig. 3). Differences on the composition of 129I and 236U in the two shallow boundary currents are likely due to the fact that waters of Atlantic origin (PIW–Atlantic and RAW) have been largely influenced by NRP effluents (high 129I). On the contrary, the LC records lower 129I concentrations due to the influence of PIW–Canada waters with a mainly GF signal (Ellis and Smith, 1999; Smith et al., 1998), and a large 236U content (236U∕238U ratios are likely from both the GF and unconstrained Arctic river inputs (Casacuberta et al., 2016).
Shelf waters carried by the EGC are thought to occasionally descend down the Greenland slope feeding the East Greenland Spill Jet and DSOW (von Appen et al., 2014; Falina et al., 2012; Harden et al., 2014; Koszalka and Haine, 2013; Pickart et al., 2005; Rudels et al., 1999a). The GEOVIDE section shows a rise of 129I concentrations at certain depths on the Greenland slope (e.g. station 60; Figs. 3 and S1), and particularly in bottom waters of the Irminger Sea (station 44), which are probably related to the cascading of 129I-rich waters from the Greenland Shelf. This finding would be supported by OMP analyses that estimate up to 20 % of PIW in the DSOW realm (García-Ibáñez et al., 2018). Our results also highlight that similar processes may be taking place in the Canadian shelf, but with PIW–Canada water cascading to the bottom of the Labrador Sea. This would explain the slightly higher 236U∕238U ratios near the Newfoundland Shelf (station 77; Figs. 3 and S1) compared to the offshore waters in the Labrador Sea (e.g. station 69) as well as the higher 236U∕238U ratios and lower 129I concentrations in the deep Labrador Sea (influenced by PIW–Canada) compared to the Irminger Sea (influenced by PIW–Atlantic) (Figs. 3 and 5a).
3.5.3 Spreading pathways of ISOW in the eastern SPNA
The 129I and 236U tracers may help to validate current interpretations of ISOW-spreading pathways in the SPNA which are largely based on model outputs or on limited observations (Fleischmann et al., 2001; LeBel Jr. et al., 2008; Xu et al., 2010; Zou et al., 2017). The ISOW is best distinguished by its relative 129I concentration maxima and 129I∕236U ratios of 15–40 due to NRPs, which are significantly higher than in surrounding waters (e.g. LSW, NEADWL). This is particularly visible for 129I concentrations (Fig. 5b and c, and Table 1) in deeper parts of the Icelandic Basin (stations 32 and 38) and the WEB (stations 1 and 13), where the presence of ISOW has also been inferred from OMP analyses (García-Ibáñez et al., 2018). For 236U (Fig. S1), this increase is not as pronounced as for 129I, probably due to the pre-existing 236U from the GF. In the coming years, one can expect a stronger 129I signal carried by ISOW because tracer concentrations in ISOW precursor waters have increased from 7×10⁷ to 63×107 at kg−1 at the Iceland–Scotland sill from 1993 to 2012 in response to releases from the NRPs (Alfimov et al., 2013; Edmonds et al., 2001; Vivo-Vilches et al., 2018). The overflow of ISOW through the Iceland–Scotland sill has increasing implications for the deep ventilation of the SPNA and for the magnitude of the AMOC (García-Ibáñez et al., 2018). Thus, future time series of time-varying 129I concentrations at GEOVIDE stations and further upstream may also be used to investigate timescales of ISOW ventilation in the North Atlantic Ocean.
3.5.4 Transit times and dilution factors of reprocessing-labelled Atlantic waters
The observations of 129I concentrations in DSOW filling the central Labrador Sea between 1993 and 2013 (Fig. 5a) have also been valuable to estimate transport times of Atlantic waters carrying the NRP signal into the Arctic and the North Atlantic (Orre et al., 2010; Smith et al., 2005, 2011, 2016). The 129I time series shows two tracer pulses, one in the late 1990s and the following about 10 years later (Fig. 6a, data points). Smith et al. (2005) suggested that the first sharp increase in 129I concentrations in DSOW was related to the arrival of the tracer front observed in the mid-1990s at 60∘ N in the northern North Sea. The second peak in 129I concentrations has also been related to the same cause as in the late 1990s front, but in this case, it would correspond to the return flow of AWs that were transported northwards into the Arctic Ocean before returning to the western SPNA (Smith et al., 2011). According to these authors, the 10-year gap between the two tracer fronts would be related to this Arctic loop, i.e. the transport of AWs by the FSBW into the Arctic Eurasian Basin, the return flow along the Lomonosov Ridge and the incorporation via the EGC into DSOW.
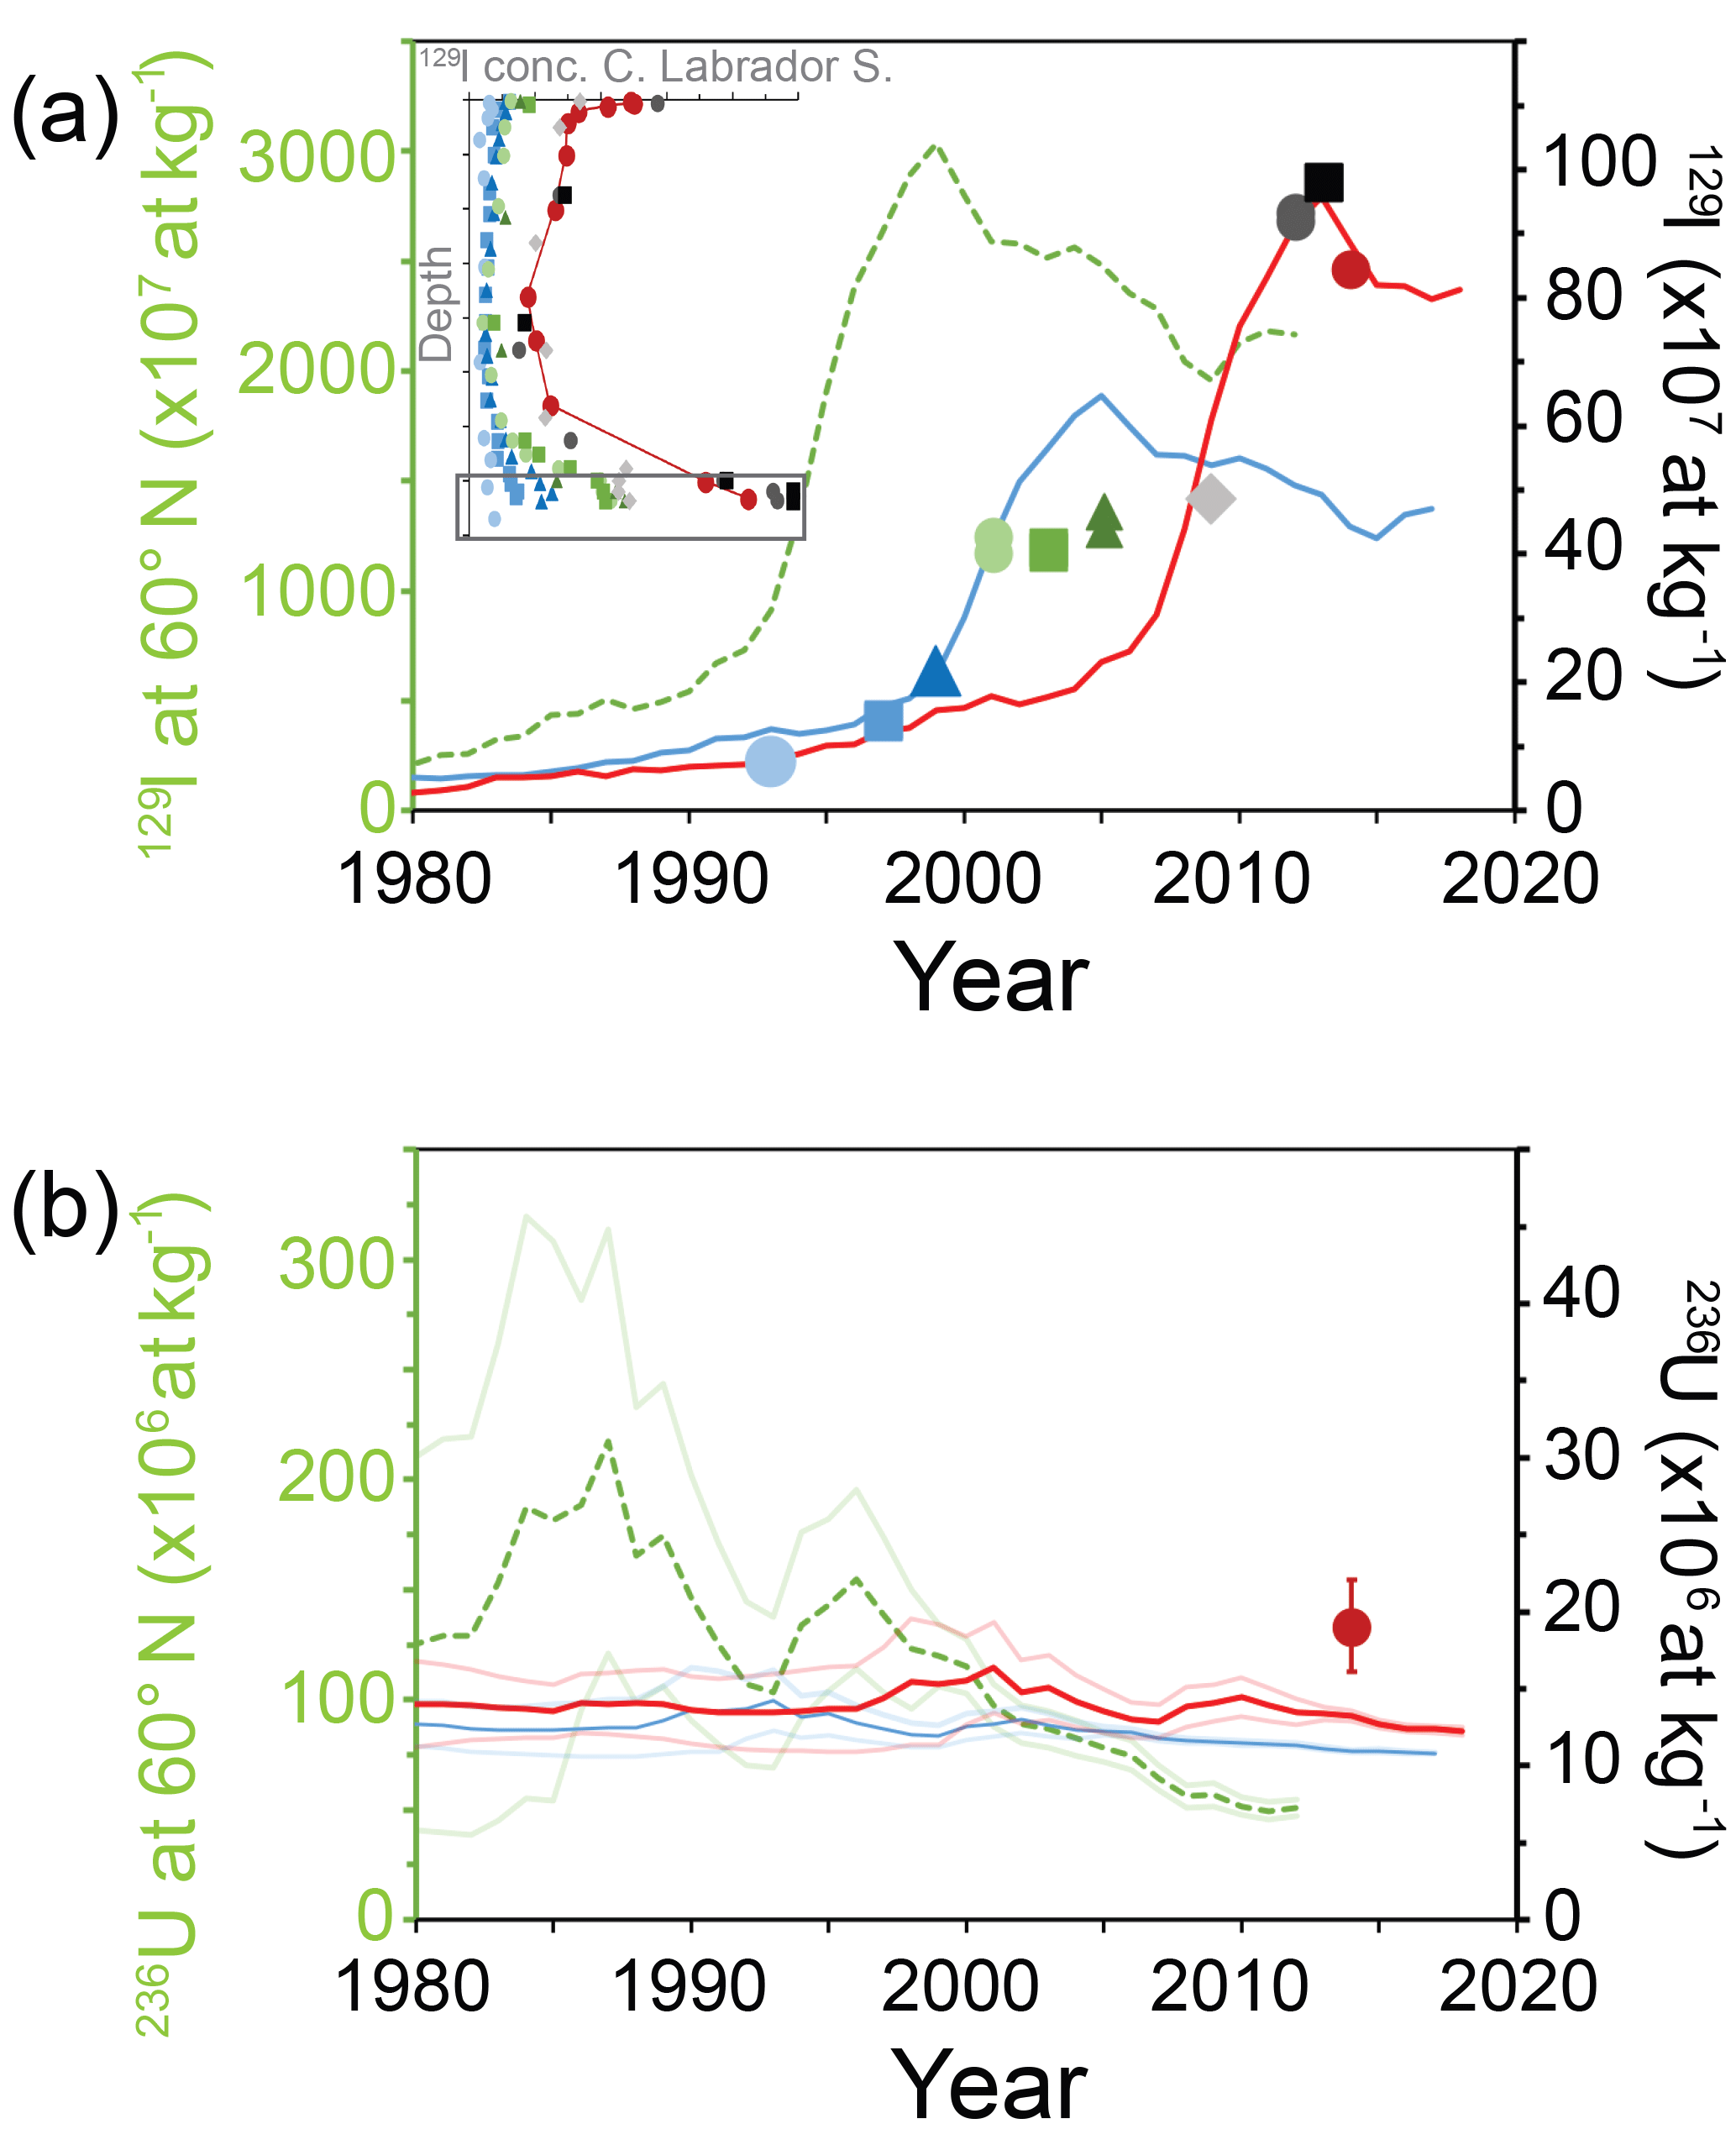
Figure 6Comparison between measured (data points) and simulated (lines) radionuclide concentrations in bottom waters (DSOW) at the central Labrador Sea for (a) 129I and (b) 236U. The green y axis on the left represents radionuclide concentrations over time (or the radionuclide input functions, also in green) at 60∘ N due to releases from the European nuclear reprocessing plants and which were reported by Christl et al. (2015b). Note that for 236U, the average input function is accompanied with a lower and upper bound estimate to acknowledge the current uncertainties on the 236U releases from Sellafield and La Hague (Christl et al., 2015b). The black y axis on the right represents radionuclide concentrations, measured or simulated, in bottom waters of the central Labrador Sea. On these axes are the blue and red lines that represent two versions of the radionuclide input function at 60∘ N after dilution (DF =50 and 30) and application of a time delay (6 and 14 years) that corresponds to the transport from 60∘ N to the central Labrador Sea. The blue and red simulations include background concentrations for 129I (2.5×10⁷ at kg−1; Edmonds et al., 2001) and 236U (10×106 at kg−1; e.g. Christl et al., 2012) due to the global fallout. On the black y axis are also the radionuclide concentrations measured in 2014 that correspond to the bottom sample collected in GEOVIDE station 69. Earlier data on 129I concentrations at similar locations were reported for 1993 by Edmonds et al. (2001); for 1997, 1999 and 2001 by Smith et al. (2005); for 2003, 2005 and 2009 by Orre et al. (2010); and for 2012 and 2013 by Smith et al. (2016).
To test this hypothesis, we took the 129I input function at 60∘ N for the northern North Sea (Fig. 6a, green dashed line) used in previous studies (e.g. Christl et al., 2015b; Orre et al., 2010; Smith et al., 2005). This input function is estimated assuming that the signal of both NRP mixtures in the North Sea and then is advected to 60∘ N in 2 years from La Hague and in 4 years from Sellafield. Following earlier modelling studies (Smith et al., 2005), we first estimate a new 129I input function for DSOW in the central Labrador Sea (Fig. 6a, blue line) that should match the aforementioned first tracer front shown by 129I measurements between 1993 and 2001 (Edmonds et al., 2001; Smith et al., 2005). This is achieved by applying a time lag (6 years) that accounts for the transit time from 60∘ N, and a dilution factor (DF =50) that represents the mixing with waters carrying only the GF signal. Secondly, we estimate a second 129I input function (Fig. 6a, red line) that fits the 129I concentrations measured in 2012 and 2013 by Smith et al. (2016) and in 2014 by this study. We found that this is possible when the tracer input function (Fig. 6a, green dashed line) is diluted 30 times and a delay time of about 14 years is applied. Thus, 2014 data reported in this study support the current interpretation on the Arctic loop (e.g. Smith et al., 2016) and suggests that the second 129I front probably peaked before the GEOVIDE cruise. Note that the latter input function (Fig. 6a, red line) only provides an upper estimate for the 129I transit times and the dilution factor because the observed 129I concentrations in 2012–2014 also contain water from the shorter loop (Fig. 6a, blue line). According to our results (Fig. 6a), AWs follow at least two paths before arriving at the Labrador Sea: (i) one short path into the Nordic Sea and then to the SPNA, which takes approximately 8–10 years from the NRPs, and (ii) a long path which adds approximately 8 years of circulation in the Arctic Ocean, resulting in 16–18 years of transit time from the NRPs to the central Labrador Sea. A similar exercise for 236U (Fig. 6b) shows that the single 236U measurement available for overflow waters in the central Labrador Sea (2014, this work) is above the concentrations predicted using the two fits. Although the 236U data would agree with the hypothesis of a second delayed 129I pulse arriving from the Arctic Ocean, there are significant inconsistencies between the simulated and measured concentrations. These might be attributed to, among other factors, the large uncertainty of the used 236U data point for 2014, uncertainties on the amount released by the Sellafield NRP (Christl et al., 2015), missing information on other sources or unaccounted-for features on the water mass circulation downstream of the NRPs.
The distribution of artificial 129I and 236U in the SPNA was governed by the main water mass circulation. The highest 129I concentrations and 236U∕238U ratios are associated with water masses originating from the Nordic seas (DSOW, ISOW and surface currents) or the Arctic Ocean (PIW). On the other end, ENACW and NEADWL transported from low latitudes north into the SPNA present 129I concentrations and 236U∕238U ratios of about 2–3 orders of magnitude lower. The 236U∕238U–129I∕236U dual tracer approach indicates that all water masses except NEADWL are influenced by GF and NRPs. ENACW is also influenced by effluents from NRPs (e.g. 129I∕236U >1), which suggests that part of the radioactive releases split off from the mainstream and enter the surface of the eastern SPNA either through direct exchange at the English Channel/Irish Sea or at the passage between Iceland and Scotland. Other key circulation features, such as the shallow transport of PIW and RAW by the EGC and LC or the deep North Atlantic ventilation by overflow waters (DSOW, ISOW), are particularly visible due to the presence of reprocessing 129I and 236U. For example, ISOW is tagged with relatively high 129I and, therefore, it can be traced while spreading eastwards into the WEB among waters that have lower tracer amounts. The combined use of 236U∕238U–129I∕236U allows water mass composition and origin to be differentiated and serves to confirm known circulation features and validate recent interpretations on water mass transport pathways and timescales. For example, the LC mainly presents the GF signal and unconstrained Arctic river inputs (more 236U relative to 129I), indicating the contribution from PIW–Canada through the Canadian Archipelago, while the EGC, largely influenced by the NRPs (more 129I relative to 236U), indicates the contribution of RAW and PIW–Atlantic. The contribution of RAW/PIW–Atlantic and PIW–Canada to DSOW in the Irminger and Labrador seas is also visible thanks to slight elevations of tracer values in near bottom depths and specific 236U∕238U–129I∕236U ratios due to cascading events. This work also contributes to extend the existing 129I time series in the Labrador Sea/Irminger Sea and allows a first assessment of time-varying 129I concentrations east of Reykjanes Ridge. Increasing 129I concentrations are observed in the western part of the GEOVIDE section and in the Icelandic Basin. In the WEB, the short observation time (2012–2014) does not yet allow temporal trends of 129I levels to be seen. The 129I data in overflow waters of the central Labrador Sea (1993–2014) can be fitted with reprocessing 129I (and 236U) input functions following earlier modelling studies to better understand the transport timescales and dilution factors of AWs tagged by the NRP signal. This study supports the current interpretations on the circulation of AWs, which apparently follow a short loop trough the Nordic seas (8–10 years in this study) and a longer loop including the circulation in the Arctic Eurasian Basin (16–18 years in this study). Further experimental and modelling studies on 129I and 236U may confirm circulation features highlighted by these tracers and shed more light on novel findings such as the transport of ISOW in to the eastern SPNA, which plays an important role on the ventilation of the deep SPNA.
Data are provided in Table 1. The ancillary data are found in the Supplement as an excel table.
| AABW | Antarctic Bottom Water |
| AMOC | Atlantic meridional overturning circulation |
| AMS | Accelerator mass spectrometry |
| AW | Atlantic Water |
| BSBW | Barents Sea Branch Water |
| DSOW | Denmark Strait Overflow Water |
| DWBC | Deep Western Boundary Current |
| EGC | East Greenland Current |
| ENACW | Eastern North Atlantic Central Water |
| FSBW | Fram Strait Branch Water |
| GF | Global fallout |
| ISOW | Iceland–Scotland Overflow Water |
| LB | Lithogenic background |
| LC | Labrador Current |
| LH | La Hague |
| LSW | Labrador Sea Water |
| MW | Mediterranean Water |
| NAC | North Atlantic Current |
| NCC | Norwegian Coastal Current |
| NEADWL | North East Atlantic Deep Water lower |
| NRP | Nuclear reprocessing plant |
| NwAC | Norwegian Atlantic Current |
| OMP | Optimum multi-parameter analysis |
| PAP | Porcupine Abyssal Plain |
| PIW | Polar Intermediate Water |
| RAW | Return Atlantic Water |
| SAF | Subarctic Front |
| SAIW | Subarctic Intermediate Water |
| SF | Sellafield |
| SPMW | Subpolar Mode Water |
| SPNA | Subpolar North Atlantic |
| WEB | West European Basin |
| WSC | West Spitsbergen Current |
The supplement related to this article is available online at: https://doi.org/10.5194/bg-15-5545-2018-supplement.
MC participated in the collection and analyses of samples and led the preparation of the manuscript. The work was supervised by PhD advisors PM, JGO and NC. The AMS determination of radionuclides was carried out by MC and CV. In addition, all co-authors contributed to the interpretation of the results and helped to elaborate the manuscript.
The authors declare that they have no conflict of interest.
This article is part of the special issue “GEOVIDE, an international GEOTRACES study along the OVIDE section in the North Atlantic and in the Labrador Sea (GA01)”. It is not associated with a conference.
We are grateful to the captain and crew of R/V Pourquoi Pas? as well
as the technical team for their work at sea (Pierre Branellec, Floriane
Desprez de Gésincourt, Michel Hamon, Catherine Kermabon, Philippe Le Bot,
Stéphane Leizour, Olivider Ménage, Fabien Pérault, and Emmanuel de
Saint-Léger). A big thank you is extended to Yi Tang for help with
sampling and to Anita Schlatter for assistance in the laboratory. This
manuscript has been notably improved thanks to the constructive comments from
two anonymous reviewers. We give thanks to Jan Lukas Menzel and the group led
by Eric Achterberg (GEOMAR, Kiel) for providing the FISH device to collect
surface seawater. The work by Catherine Schmechtig with the LEFE CYBER
database management is also acknowledged. Some of the 129I data
discussed from the literature were kindly provided by Vasily Alfimov,
Henrietta Edmonds and John Norton Smith. Several figures were created using
Ocean Data View (Schlitzer, 2017). We would also like to thank Natalie
Dubois and Alfred Lück for providing the laboratory space and assistance
at EAWAG. The GEOVIDE cruise was funded by the French National Research
Agency (ANR-13-BS06-0014, ANR-12-PDOC-0025-01), the French National Center
for Scientific Research (CNRS LEFE CYBER), the LabexMER (ANR-10-LABX-19), and
Ifremer. This work was funded by the Ministerio de Economía y
Competitividad of Spain (MDM2015-0552), the Generalitat de Catalunya (MERS
2017 SGR-1588) and consortium partners of the ETH Zurich Laboratory of Ion
Beam Physics (EAWAG, EMPA, and PSI). Maxi Castrillejo was funded by a FPU PhD
studentship (AP-2012-2901) from the Ministerio de Educación, Cultura y
Deporte of Spain and the ETH Zurich Postdoctoral Fellowship Programme (17-2
FEL-30), co-funded by the Marie Curie Actions for People COFUND Programme.
Núria Casacuberta's research was funded by the AMBIZIONE grant
(PZ00P2_154805) from the Swiss National Science Foundation. Maribel I.
García-Ibáñez was supported by the Spanish Ministry of Economy
and Competitiveness through the BOCATS (CTM2013-41048-P) project co-funded by
the Fondo Europeo de Desarrollo Regional 2014–2020
(FEDER).
Edited by: Catherine Jeandel
Reviewed by: two anonymous referees
Aarkrog, A., Dahlgaard, H., Hallstadius, L., Hansen, H., and Holm, E.: Radiocaesium from Sellafield effluents in Greenland waters, Nature, 304, 49–51, 1983.
Aarkrog, A., Boelskifte, S., Dahlgard, H., Duniec, S., Hallstadius, L., Holm, E., and Smith, J. N.: Technetium-99 and Cesium-134 as long distance tracers in Arctic Waters, Estuar. Coast. Shelf S., 24, 637–647, 1987.
Alfimov, V., Aldahan, A., Possnert, G., and Winsor, P.: Tracing water masses with 129I in the western Nordic Seas in early Spring 2002, Geophys. Res. Lett., 31, L19305, https://doi.org/10.1029/2004GL020863, 2004.
Alfimov, V., Aldahan, A., and Possnert, G.: Water masses and 129I distribution in the Nordic Seas, Nucl. Instrum. Meth. B, 294, 542–546, https://doi.org/10.1016/j.nimb.2012.07.042, 2013.
Arhan, M.: The North Atlantic Current and the subarctic intermediate water, J. Mar. Res., 48, 109–144, 1990.
Beasley, T., Cooper, L. W., Grebmeier, J. M., Aagaard, K., Kelley, J. M., and Kilius, L. R.: 237Np/129I Atom Ratios in the Arctic Ocean: Has 237Np from Western European and Russian Fuel Reprocessing Facilities Entered the Arctic Ocean?, J. Environ. Radioactiv., 39, 255–277, 1998.
Bersch, M., Yashayaev, I., and Koltermann, K. P.: Recent changes of the thermohaline circulation in the subpolar North Atlantic, Ocean Dynam., 57, 223–235, https://doi.org/10.1007/s10236-007-0104-7, 2007.
Casacuberta, N., Christl, M., Lachner, J., van der Loeff, M. R., Masqué, P., and Synal, H.-A.: A first transect of 236U in the North Atlantic Ocean, Geochim. Cosmochim. Ac., 133, 34–46, https://doi.org/10.1016/j.gca.2014.02.012, 2014.
Casacuberta, N., Masqué, P., Henderson, G., Rutgers van-der-Loeff, M., Bauch, D., Vockenhuber, C., Daraoui, A., Walther, C., Synal, H.-A., and Christl, M.: First 236U data from the Arctic Ocean and use of 236U∕238U and 129I∕236U as a new dual tracer, Earth Planet. Sc. Lett., 440, 127–134, https://doi.org/10.1016/j.epsl.2016.02.020, 2016.
Casacuberta, N., Christl, M., Vockenhuber, C., Wefing, A.-M., Wacker, L., Masqué, P., Synal, H.-A., and Rutgers van der Loeff, M.: Tracing the three Atlantic branches entering the Arctic Ocean with 129I and 236U, J. Geophys, Res.-Oceans, https://doi.org/10.1029/2018JC014168, online first, 2018.
Castrillejo, M., Casacuberta, N., Christl, M., Garcia-Orellana, J., Vockenhuber, C., Synal, H.-A., and Masqué, P.: Anthropogenic 236U and 129I in the Mediterranean Sea: First comprehensive distribution and constrain of their sources, Sci. Total Environ., 593–594, 745–759, https://doi.org/10.1016/j.scitotenv.2017.03.201, 2017.
Christl, M., Lachner, J., Vockenhuber, C., Lechtenfeld, O., Stimac, I., van der Loeff, M. R., and Synal, H.-A.: A depth profile of uranium-236 in the Atlantic Ocean, Geochim. Cosmochim. Ac., 77, 98–107, https://doi.org/10.1016/j.gca.2011.11.009, 2012.
Christl, M., Lachner, J., Vockenhuber, C., Goroncy, I., Herrmann, J., and Synal, H. A.: First data of Uranium-236 in the North Sea, Nucl. Instrum. Meth. B, 294, 530–536, https://doi.org/10.1016/j.nimb.2012.07.043, 2013a.
Christl, M., Vockenhuber, C., Kubik, P. W., Wacker, L., Lachner, J., Alfimov, V., and Synal, H.: The ETH Zurich AMS facilities?: Performance parameters and reference materials, Nucl. Instrum. Meth. B, 294, 29–38, https://doi.org/10.1016/j.nimb.2012.03.004, 2013b.
Christl, M., Casacuberta, N., Lachner, J., Maxeiner, S., Vockenhuber, C., Synal, H. A., Goroncy, I., Herrmann, J., Daraoui, A., Walther, C., and Michel, R.: Status of 236U analyses at ETH Zurich and the distribution of 236U and 129I in the North Sea in 2009, Nucl. Instrum. Meth. B, 361, 510–516, https://doi.org/10.1016/j.nimb.2015.01.005, 2015a.
Christl, M., Casacuberta, N., Vockenhuber, C., Elsässer, C., Bailly du Bois, P., Herrmann, J. jürgen and Synal, H.-A.: Reconstruction of the 236U input function for the Northeast Atlantic Ocean: Implications for 129I∕236U and 236U∕238U-based tracer ages, J. Geophys. Res.-Oceans, 120, 11 https://doi.org/10.1002/2015JC011116, 2015b.
Christl, M., Casacuberta, N., Lachner, J., Herrmann, J., and Synal, H. A.: Anthropogenic 236U in the North Sea – A Closer Look into a Source Region, Environ. Sci. Technol., 51, 12146–12153, https://doi.org/10.1021/acs.est.7b03168, 2017.
Cuny, J. and Rhines, P.-B.: Labrador Sea Boundary currents and the Fate of the Irminger Sea Water, Am. Met. Soc., 32, 627–647, 2002.
Curry, B., Lee, C. M., Petrie, B., Moritz, R. E., and Kwok, R.: Multiyear Volume, Liquid Freshwater, and Sea Ice Transports through Davis Strait, 2004-10, J. Phys. Oceanogr., 44, 1244–1266, 2014.
Dahlgaard, H.: Transfer of European Coastal Pollution to the Arctic?: Radioactive Tracers, Mar. Pollut. Bull., 31, 3–7, 1995.
Daniault, N., Mercier, H., Lherminier, P., Sarafanov, A., Falina, A., Zunino, P., Pérez, F. F., Ríos, A. F., Ferron, B., Huck, T., and Thierry, V.: The northern North Atlantic Ocean mean circulation in the early 21st century, Prog. Oceanogr., 146, 142–158, https://doi.org/10.1016/j.pocean.2016.06.007, 2016.
Doney, S. C. and Jenkins, W. J.: Ventilation of the deep western boundary current and abyssal western North Atlantic: Estimates from tritium and 3He distributions, J. Phys. Oceanogr., 24, 638–659, 1994.
Edmonds, H. N., Smith, J. N., Livingston, H. D., Kilius, L. R., and Edmond, J. M.: 129I in archived seawater samples, Deep-Sea Res. Pt. I, 45, 1111–1125, https://doi.org/10.1016/S0967-0637(98)00007-7, 1998.
Edmonds, H. N., Zhou, Z. Q., Raisbeck, G. M., Yiou, F., Kilius, L., and Edmond, J. M.: Distribution and behavior of anthropogenic 129I in water masses ventilating the North Atlantic Ocean, J. Geophys. Res., 106, 6881–6894, 2001.
Ellis, K. M. and Smith, J. N.: The flow of radionuclides through the Canadian Archipelago, Proc. IAEA Mainre Pollut. Symp. IAEA Tech. Doc., 1094, 462–464, Monaco, 1999.
Falina, A., Sarafanov, A., Mercier, H., Lherminier, P., Sokov, A., and Daniault, N.: On the cascading of dense shelf waters in the Irminger Sea, J. Phys. Oceanogr., 42, 2254–2267, 2012.
Fleischmann, U., Hildebrandt, H., Putzka, A., and Bayer, R.: Transport of newly ventilated deep water from the Iceland Basin to the West European Basin, Deep-Sea Res., 48B, 1793–1819, 2001.
Fogelqvist, E. J., Blindheim, J., Tanhua, T. T., Osterhus, S., Buch, E., and Rey, F.: Greenland-Scotland overflow studied by hydro-chemical multivariate analysis, Deep-Sea Res. Pt. I, 50, 73–102, 2003.
García-Ibáñez, M. I., Pérez, F. F., Lherminier, P., Zunino, P., Mercier, H., and Tréguer, P.: Water mass distributions and transports for the 2014 GEOVIDE cruise in the North Atlantic, Biogeosciences, 15, 2075–2090, https://doi.org/10.5194/bg-15-2075-2018, 2018.
Gascard, J., Watson, A. J., Messias, M.-J., Olsson, K. A., Johannessen, T., and Simonsen, K.: Long-lived vortices as a mode of deep ventilation in the Greenland Sea, Nature, 416, 525–527, 2002.
Gascard, J. C., Raisbeck, G., Sequeira, S., Yiou, F., and Mork, K. A.: The Norwegian Atlantic Current in the Lofoten Basin inferred from hydrological and tracer data (129I) and its interaction with the Norwegian Coastal Current, Geophys. Res. Lett., 31, L01308, https://doi.org/10.1029/2003GL018303, 2004.
Gómez-guzmán, J. M., Villa, M., Le Moigne, F., López-gutiérrez, J. M., and García-león, M.: AMS measurements of 129I in seawater around Iceland and the Irminger Sea, Nucl. Instrum. Meth. B, 294, 547–551, https://doi.org/10.1016/j.nimb.2012.07.045, 2013.
Hansen, B. and Osterhus, S.: North Atlantic – Nordic Sea exchanges, Prog. Oceanogr., 45, 109–208, 2000.
Harden, B. E., Pickart, R. S., and Benfrew, I. A.: Offshore Transport of Dense Water from the East Greenland Shelf, J. Phys. Oceanogr., 44, 229–245, https://doi.org/10.1175/JPO-D-12-0218.1, 2014.
He, P., Aldahan, a., Possnert, G., and Hou, X. L.: A summary of global 129I in marine waters, Nucl. Instrum. Meth. B, 294, 537–541, https://doi.org/10.1016/j.nimb.2012.08.036, 2013a.
He, P., Hou, X., Aldahan, A., Possnert, G., and Yi, P.: Iodine isotopes species fingerprinting environmental conditions in surface water along the northeastern Atlantic Ocean, Sci. Rep.-UK, 3, 2685, https://doi.org/10.1038/srep02685, 2013b.
Holm, E., Persson, B. R. R., Hallstadius, L., Aarkrog, A., and Dahlgaard, H.: Radio-cesium and transuranium elements in the Greenland and Barents Seas, Oceanol. Acta, 6, 457–462, 1983.
Hou, X.: Application of 129I as an Environmental Tracer, J. Radioanal. Nucl. Ch., 262, 67–75, 2004.
Jong, M. F. and Steur, L.: Strong winter cooling over the Irminger Sea in winter 2014–2015, exceptional deep convection, and the emergence of anomalously low SST, Geophy. Res. Lett., 43, 7106–7113, https://doi.org/10.1002/2016GL069596, 2016.
Karcher, M., Smith, J. N., Kauker, F., Gerdes, R., and Smethie, W. M.: Recent changes in Arctic Ocean circulation revealed by iodine-129 observations and modeling, J. Geophys. Res.-Oceans, 117, 1–17, https://doi.org/10.1029/2011JC007513, 2012.
Kershaw, P. and Baxter, A.: The transfer of reprocessing wastes from north-west Europe to the Arctic, Deep-Sea Res. Pt. II, 42, 1413–1448, 1995.
Koszalka, I. M. and Haine, T. W. N.: Fates and Travel Times of Denmark Strait Overflow Water in the Irminger Basin, J. Phys. Oceanogr., 43, 2611–2628, https://doi.org/10.1175/JPO-D-13-023.1, 2013.
Lambelet, M., van de Flierdt, T., Crocket, K., Rehkämper, M., Kreissig, K., Coles, B., Rijkenberg, M. J. A., Gerringa, L. J. A., de Baar, H. J. W., and Steinfeldt, R.: Neodymium isotopic composition and concentration in the western North Atlantic Ocean: results from the GEOTRACES GA02 section, Geochim. Cosmochim. Ac., 177, 1–29, https://doi.org/10.1016/j.gca.2015.12.019, 2016.
LeBel, D. A., Smethie Jr., W. M., Rhein, M., Kieke, D., Fine, R. A., Bullister, J. L., Min, D.-H., Roether, W., Weiss, R., Andrié, C., Smythe-Wright, D., and Jones, E. P. The formation rate of North Atlantic Deep Water and eighteen Degree water calculated from CFC-11 inventories observed during WOCE, Deep-Sea Res. Pt. I, 55, 891–910, https://doi.org/10.1016/j.dsr.2008.03.009, 2008.
Lherminier, P., Mercier, H., Huck, T., Gourcuff, C., Perez, F. F., Morin, P., Sarafanov, A., and Falina, A.: The Atlantic Meridional Overturning Circulation and the subpolar gyre observed at the A25-OVIDE section in June 2002 and 2004, Deep-Sea Res. Pt. I., 57, 1374–1391, https://doi.org/10.1016/j.dsr.2010.07.009, 2010.
McCartney, M. and Talley, L. D.: The Subpolar Mode Water of the North Atlantic Ocean, J. Phys. Oceanogr., 12, 1169–1188, 1982.
Mercier, H., Lherminier, P., Sarafanov, A., Gaillard, F., Daniault, N., Desbruyères, D., Falina, A., Ferron, B., Gourcuff, C., Huck, T., and Thierry, V.: Variability of the meridional overturning circulation at the Greenland–Portugal OVIDE section from 1993 to 2010, Prog. Oceanogr., 132, 250–261, https://doi.org/10.1016/j.pocean.2013.11.001, 2013.
Michel, R., Daraoui, A., Gorny, M., Jakob, D., Sachse, R., Tosch, L., Nies, H., Goroncy, I., Herrmann, J., Synal, H. A., Stocker, M., and Alfimov, V.: Iodine-129 and iodine-127 in European seawaters and in precipitation from Northern Germany, Sci. Total Environ., 419, 151–169, https://doi.org/10.1016/j.scitotenv.2012.01.009, 2012.
Orre, S., Smith, J. N., Alfimov, V., and Bentsen, M.: Simulating transport of 129I and idealized tracers in the northern North Atlantic Ocean, Environ. Fluid Mech., 10, 213–233, 2010.
Pérez, F. F., Mercier, H., Vázquez-rodríguez, M., Lherminier, P., Velo, A., Pardo, P. C., Rosón, G., and Ríos, A. F.: Atlantic Ocean CO2 uptake reduced by weakening of the meridional overturning circulation, Nat. Geosci., 6, 146–152, https://doi.org/10.1038/ngeo1680, 2013.
Pickart, R. S., Torres, D. J., and Fratantoni, P. S.: The East Greenland Spill Jet, J. Phys. Oceanogr., 58, 1037–1053, 2005.
Raisbeck, G. M. and Yiou, F.: 129I in the oceans: origins and applications, Sci. Total Environ., 237–238, 31–41, 1999.
Raisbeck, G. M. and Yiou, F.: Use of 129I as an oceanographic tracer in the Nordic Seas, Pap. Present. 5th Int. Conf. Environ. Radioact. Arct. Antarct., St. Petersburg, Russ., 127–130, 2002.
Raisbeck, G. M., Yiou, F., Zhou, Z. Q., and Kilius, L. R.: 129I from nuclear fuel reprocessing facilities at Sellafield (U.K.) and La Hague (France); potential as an oceanographie tracer, J. Marine Syst., 6, 561–570, https://doi.org/10.1016/0924-7963(95)00024-J, 1995.
Read, J. F.: CONVEX-91: water masses and circulation of the Northeast Atlantic subpolar gyre, Prog. Oceanogr., 48, 461–510, https://doi.org/10.1016/S0079-6611(01)00011-8, 2000.
Ríos, A. F., Pérez, F. F., and Fraga, F.: Water masses in the upper and middle North Atlantic Ocean east of the Azores, Deep-Sea Res., 39, 645–658, 1992.
Rudels, B.: Arctic Ocean circulation, processes and water masses: A description of observations and ideas with focus on the period prior to the International Polar Year 2007–2009, Prog. Oceanogr., 132, 22–67, https://doi.org/10.1016/j.pocean.2013.11.006, 2015.
Rudels, B., Eriksson, P., Gronvall, H., Hietala, R., and Launiainen, J.: Hydrographic Observations in Denmark Strait in Fall 1997, and their Implications for the Entrainment into the Overflow Plume, Geophys. Res. Lett., 26, 1325–1328, 1999a.
Rudels, B., Friedrich, H. J., and Quadfasel, D.: The Arctic Circumpolar Boundary Current, Deep-Sea Res. Pt. II, 46, 1023–1062, https://doi.org/10.1016/S0967-0645(99)00015-6, 1999b.
Sakaguchi, A., Kawai, K., Steier, P., Quinto, F., Mino, K., Tomita, J., Hoshi, M., Whitehead, N., and Yamamoto, M.: First results on 236U levels in global fallout, Sci. Total Environ., 407, 4238–4242, 2009.
Sakaguchi, A., Kadokura, A., Steier, P., Takahashi, Y., Shizuma, K., Hoshi, M., Nakakuki, T., and Yamamoto, M.: Uranium-236 as a new oceanic tracer: a first depth profile in the Japan Sea and comparison with caesium-137, Earth Planet. Sc. Lett., 333–334, 165–170, 2012.
Schlitzer, R.: Ocean Data View, available at: http://odv.awi.de (last access: September 2018), 2017.
Smith, J. N., Ellis, K. M., and Kilius, L. R.: 129I and 137Cs tracer measurements in the Arctic Ocean, Deep-Sea Res. Pt. I, 45, 959–984, https://doi.org/10.1016/S0967-0637(97)00107-6, 1998.
Smith, J. N., Jones, E. P., Moran, S. B., Smethie Jr., W. M., and Kieser, W. E.: Iodine-129/CFC-11 transit times for Denmark Strait Overflow Water in the Labrador and Irminger Seas, J. Geophys. Res., 110, 1–16, https://doi.org/10.1029/2004JC002516, 2005.
Smith, J. N., Mclaughlin, F. A., Smethie Jr., W. M., Moran, S. B., and Lepore, K.: Iodine-129, 137Cs, and CFC-11 tracer transit time distributions in the Arctic Ocean, J. Geophys. Res., 116, 1–19, https://doi.org/10.1029/2010JC006471, 2011.
Smith, J. N., Smethie Jr., W. M., Yashayev, I., Curry, R., and Aztsu-Scott, K.: Time series measurements of transient tracers and tracer-derived transport in the Deep Western Boundary Current between the Labrador Sea and the subtropical Atlantic Ocean at line W, J. Geophys. Res.-Oceans, 121, 1–24, https://doi.org/10.1002/2016JC011759, 2016.
Snyder, G., Aldahan, A., and Possnert, G.: Global distribution and long-term fate of anthropogenic I-129 in marine and surface water reservoirs, Geochem. Geophys. Geosy., 11, Q04010, https://doi.org/10.1029/2009GC002910, 2010.
Steier, P., Bichler, M., Keith Fifield, L., Golser, R., Kutschera, W., Priller, A., Quinto, F., Richter, S., Srncik, M., Terrasi, P., Wacker, L., Wallner, A., Wallner, G., Wilcken, K. M. and Maria Wild, E.: Natural and anthropogenic 236U in environmental samples, Nucl. Instrum. Meth. B, 266, 2246–2250, https://doi.org/10.1016/j.nimb.2008.03.002, 2008.
Sy, A., Rhein, M., Lazier, J., Koltermann, K., Meincke, J., Putzka, A., and Bersch, M.: Surprisingly rapid spreading of newly formed intermediate waters across the North Atlantic Ocean, Nature, 386, 675–679, 1997.
Tanhua, T., Bulsiewicz, K., and Rhein, M.: Spreading of overflow water from the Greenland to the Labrador Sea, Geophys. Res. Lett., 32, L10605, https://doi.org/10.1029/2005GL022700, 2005.
van Aken, H. M. and Becker, G.: Hydrography and through-flow in the northeastern North Atlantic Ocean: the NANSEN project, Prog. Oceanogr., 38, 297–346, 1996.
van Aken, H. M. and De Boer, C. J.: On the synoptic hydrography of intermediate and deep water masses in the Iceland Basin, Deep-Sea Res. Pt. I, 42, 165–189, https://doi.org/10.1016/0967-0637(94)00042-Q, 1995.
Villa, M., López-Gutiérrez, J. M., Suh, K.-S., Min, B.-I., and Periañez, R.: The behaviour of 129I released from nuclear fuel reprocessing factories in the North Atlantic Ocean and transport to the Arctic assessed from numerical modelling, Mar. Poll. Bull., 90, 15–24, https://doi.org/10.1016/j.marpolbul.2014.11.039, 2015.
Vivo-Vilches, C., López-Gutiérrez, J. M., Periáñez, R., Marcinko, C., Le Moigne, F., Mcginnity, P., Peruchena, J. I., and Villa-Alfageme, M.: Recent evolution of 129I levels in the Nordic Seas and the North Atlantic Ocean, Sci. Total Environ., 621, 376–386, https://doi.org/10.1016/j.scitotenv.2017.11.268, 2018.
Vockenhuber, C., Casacuberta, N., Christl, M., and Synal, H. A.: Accelerator Mass Spectrometry of 129I towards its lower limits, Nucl. Instrum. Meth. B, 361, 445–449, https://doi.org/10.1016/j.nimb.2015.01.061, 2015.
von Appen, W.-J., Koszalka, I. M., Pickart, R. S., Haine, T. W. N., Mastropole, D., Magaldi, M. G., Valdimarsson, H., Girton, J., Jochumsen, K., and Krahmann, G.: The East Greenland Spill Jet as an important component of the Atlantic Meridional Overturning Circulation, Deep-Sea Res. Pt. I, 92, 75–84, 2014.
Wagner, M. J. M., Dittrich-Hannen, B., Synal, H. A., Suter, M., and Schotterer, U.: Increase of 129I in the environment, Nucl. Instrum. Meth. B, 113, 490–494, 1996.
Winkler, S. R., Steier, P., and Carilli, J.: Bomb fall-out 236U as a global oceanic tracer using an annually resolved coral core, Earth Planet. Sc. Lett., 359–360, 124–130, https://doi.org/10.1016/j.epsl.2012.10.004, 2012.
Xu, X., Schmitz Jr., W. J., Hurlburt, H. E., Hogan, P. J., and Chassignet, E. P.: Transport of Nordic Seas overflow water into and within the Irminger Sea?: An eddy – resolving simulation and observations, J. Geophys. Res., 115, C12048, https://doi.org/10.1029/2010JC006351, 2010.
Xu, X., Bower A., Furey, H., and Chassignet, E.-P.: Variability of the Icelans-Scotland Overflow Water Transport through the Charlie-Gibbs Fracture Zone: results from an eddying simulation and observations, J. Geophys. Res.-Oceans, 123, https://doi.org/10.1029/2018JC013895, 2018.
Zou, S., Lozier, S., Zenk, W., Bower, A., and Johns, W.: Observed and modeled pathways of the Iceland Scotland Over flow Water in the eastern North Atlantic, Prog. Oceanogr., 159, 211–222, https://doi.org/10.1016/j.pocean.2017.10.003, 2017.
Zunino, P., Lherminier, P., Mercier, H., Daniault, N., García-Ibánez, M. I., and Pérez, F. F.: The GEOVIDE cruise in May–June 2014 reveals an intense Meridional Overturning Circulation over a cold and fresh subpolar North Atlantic, Biogeosciences, 14, 5323–5342, https://doi.org/10.5194/bg-14-5323-2017, 2017.