the Creative Commons Attribution 4.0 License.
the Creative Commons Attribution 4.0 License.
 | 02 Nov 2018
Ideas and perspectives: Tree–atmosphere interaction responds to water-related stem variations
Tim van Emmerik
Susan Steele-Dunne
Pierre Gentine
Rafael S. Oliveira
Paulo Bittencourt
Fernanda Barros
Nick van de Giesen
Land–atmosphere interactions depend on momentum transfer from the atmosphere to the canopy, which in turn depends on the tree drag coefficient. It is known that the drag coefficient, and thus tree–atmosphere momentum transfer, can vary strongly within a canopy. Yet, only few measurements are available to study the variation of tree–atmosphere momentum transfer in time and space, and in response to tree water deficit. In this paper we use accelerometers to estimate tree–atmosphere momentum transfer for 19 individual trees of 7 different species in the Brazilian Amazon. The 5-month monitoring period included the transition from wet to dry months. Here, we demonstrate that, under field conditions, tree–atmosphere momentum transfer can vary considerably in time and space (up to a factor of 2.5). Increased water-related stem variations during the dry months are related to observed changes in tree–atmosphere momentum transfer, which is hypothesized to be caused by tree-water-deficit-induced changes in tree mass.
- Article
(6630 KB) - Full-text XML
- BibTeX
- EndNote


The atmospheric boundary layer and the land surface directly influence each other through momentum, mass and energy exchange (Gentine et al., 2011, 2012; Green et al., 2017). Land–atmosphere interactions influence meteorological processes, hydrological fluxes and states, and biotic and abiotic processes, such as seed and pollen distribution (Katul et al., 2005), deposition of atmospheric pollutants (Clifton et al., 2017), and transfer of water, heat and CO2 (Aumond et al., 2013). Land–atmosphere interactions are influenced by the momentum transfer from atmosphere to the canopy, which highly depends on the turbulent drag coefficient of individual trees (Poggi and Katul, 2007). Drag causes loss of momentum, and the interplay between canopy and atmosphere is heavily affected by the transport of water, heat, and carbon between vegetation and the atmosphere (Cescatti and Marcolla, 2004; Molina-Aiz et al., 2006). Such transfer between trees and atmosphere greatly depends on the tree drag coefficient (Gillies et al., 2002). For computational ease, the drag coefficient is often assumed constant (Cassiani et al., 2008; Dupont and Brunet, 2008; Katul et al., 2006), both in time and space. It is known, however, that the drag coefficient, and thus the degree of tree–atmosphere momentum transfer, can vary strongly within a canopy, and as a function of environmental conditions (Belcher et al., 2012). Assuming a constant drag coefficient may therefore be unrealistic and introduces a large source of error.
Misrepresentation of the variability in canopy drag is largely due to a lack of (field) data. Various studies have quantified canopy drag (coefficients) in laboratory and field setups (Koizumi et al., 2010; Mayhead, 1973). Widely used drag coefficients for several tree species originate from a wind tunnel experiment by Mayhead (1973). Here it was found that drag coefficient is variable between individual trees and strongly depends on wind speed. Most wind tunnel studies used dwarf species (Johnson et al., 1982), juvenile crowns (Rudnicki et al., 2004; Vollsinger et al., 2005), or (miniature) model trees or forests (Guan et al., 2003; Meroney, 1968; Novak et al., 2000; Poggi and Katul, 2007), which are not representative for realistically sized trees under natural conditions. Recent work (Koizumi et al., 2010, 2016) presented a novel field method that can measure stem deflection, which is used to derive the tree drag coefficient. However, this method requires a considerable amount of power, making it difficult to obtain long time series. This is especially a problem under field conditions, where power supply is limited.
A recently presented measurement technique (van Emmerik et al., 2017a) used low-cost accelerometers to measure tree sway. Tree sway is a result of momentum transfer from the atmosphere to the tree and can therefore be used to study tree–atmosphere momentum transfer. The robustness of the sensors allows deployment in harsh conditions such as tropical environments, to obtain long time series. Previous work suggested that tree sway data can be used to measure tree mass variations in response to diurnal variations in water content (Llamas et al., 2013), leaf fall or flush (Selker et al., 2011), or intercepted precipitation (van Emmerik et al., 2017a). This paper uses tree sway measurements obtained during a 5-month period to quantify and compare the tree–canopy momentum transfer for 19 trees in the Brazilian Amazon. The measurement period includes the transition from wet to dry months. We derived a measure for canopy–atmosphere momentum transfer, which are compared to dendrometer-based tree water deficit measurements, defined as the difference between a constructed tree growth line and original dendrometer records (Ehrenberger et al., 2012). Our measure of tree–atmosphere momentum transfer showed clear variation between species and over time.
The Amazon contains half of the world's rainforests. Yet, it remains a poorly understood component of the global carbon and water cycle (Anber et al., 2015; Binks et al., 2016; Saatchi et al., 2007). For example, the extensively studied 2005 drought reversed the Amazon from a long-term carbon sink into a carbon source (Phillips et al., 2009). Amazon forests appear to be sensitive to increasing moisture stress (van Emmerik et al., 2017b), and future droughts have the potential to considerably change the water and carbon balance (and thus climate change) (Phillips et al., 2009). Improved understanding of the variation and dynamics of the drag coefficient will therefore contribute to a better understanding of the Amazon's role in the water and carbon cycle, and its response to droughts.
A long time series of tree acceleration data were used to investigate tree–atmosphere momentum transfer under field conditions, and in response to water content, leaf fall or flush, or other mass changes. Using an experimental method, we aim to show that tree–atmosphere momentum transfer varies more than often assumed. Specifically, we demonstrate the effect of increased water-related stem variations for various tree species and individuals, which is hypothesized to be caused by water-deficit-induced mass changes in the trees.
2.1 Study area
The field measurements of this study were obtained from August 2015 to January 2016 at the K34 research station in the Amazon rainforest (2.6085∘ S, 60.2093∘ W), 60 km northwest of Manaus, Brazil. The study area is characterized by a tropical monsoon climate with an average dry season from July to September (De Gonçalves et al., 2013). During the measurement period there was about 12 h of daylight, roughly between 06:00 and 18:00 local time. Meteorological data were measured at a flux tower on site. Wind speed, temperature, and precipitation were measured every 15 min and were retrieved from the National Institute of Amazonian Research (INPA). For this study, we use data from the period August 2015 to January 2016.
2.2 Plant material
A total of 19 individual trees (7 species) were measured during this experiment, covering 7 tree species, and a broad range of average height and wood density. Trees were selected to cover a broad range of heights (h), widths (diameter at breast height, DBH), and wood densities (ρw). An overview of the measured trees is found in Table 1.
Table 1Tree characteristics: tree number, scientific name, wood density, estimated total height and diameter at breast height (DBH).
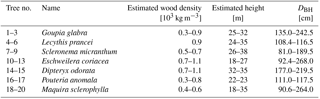
Wood density values were taken from the Global Wood Density Database (Chave et al., 2009; Zanne et al., 2009). Total tree height was measured using measuring tape. Tree species were determined by a classified taxonomist. Diameter at breast height (DBH) was measured using measuring tape on the day of installation of the accelerometers. Aboveground biomass (AGB) was estimated for every tree using the pantropical model introduced by Chave et al. (2014). In this model, tree height h, diameter at breast height DBH, and wood density ρw are related to AGB through the following equation:
2.3 Experimental setup
Waterproof, robust accelerometers (Acceleration Logger – Model AL100, Oregon Research Electronics, Tangent, OR, USA) were used to measure three-dimensional acceleration with a frequency of 10 Hz. The accelerometers were placed directly below the main branching of the tree, to measure the largest signal that can be measured and to minimize effect of oscillations from primary and secondary branches (Spatz and Theckes, 2013). The frequency spectrum of horizontal, single axis acceleration was determined using a sliding window fast Fourier transform. The spectrum was estimated every 10 min, using a 30 min window. In the following analysis, we use the logarithmic slope [dB Hz−1] of the tree acceleration and wind frequency spectrum. The slope of the spectrum represents the damping of the driving wind force and can be seen as a measure of momentum transfer. As the tree movement is driven by wind, a part of the wind energy is transferred to kinetic energy in the tree. The intensity of the transfer depends on the wind speed and on the tree characteristics (such as moment of inertia, mass, and the drag coefficient). For this study, the slope of the frequency spectrum between 0.2 and 1 Hz was determined every 10 min. More detailed information on the accelerometer can be found in van Emmerik et al. (2017a, 2018b). This approach assumes that the trees are free-standing, which was one of the selection criteria. As this was based on visual inspection, this might be a potential source of error.
Dendrometers (ZN12-T-2IP, Natkon.ch, Switzerland) were installed at 1.5 m above ground level. Bark thickness was measured every 10 min. Bark time series were used as a direct measure of water-related stem variations in trees (Ehrenberger et al., 2012; Zweifel et al., 2005). First, the local maximum values are connected. The resulting line is the growth line, which represents the maximum stem radius in the case of no water limitations. The difference between the growth line and the actual bark thickness is then the water-related stem variations, using
with total water-related stem variation ΔW, growth line Db, pot, and change in bark thickness Db, act. Figure 1 illustrates how the growth line and water-related stem variation can be obtained from a dendrometer dataset.
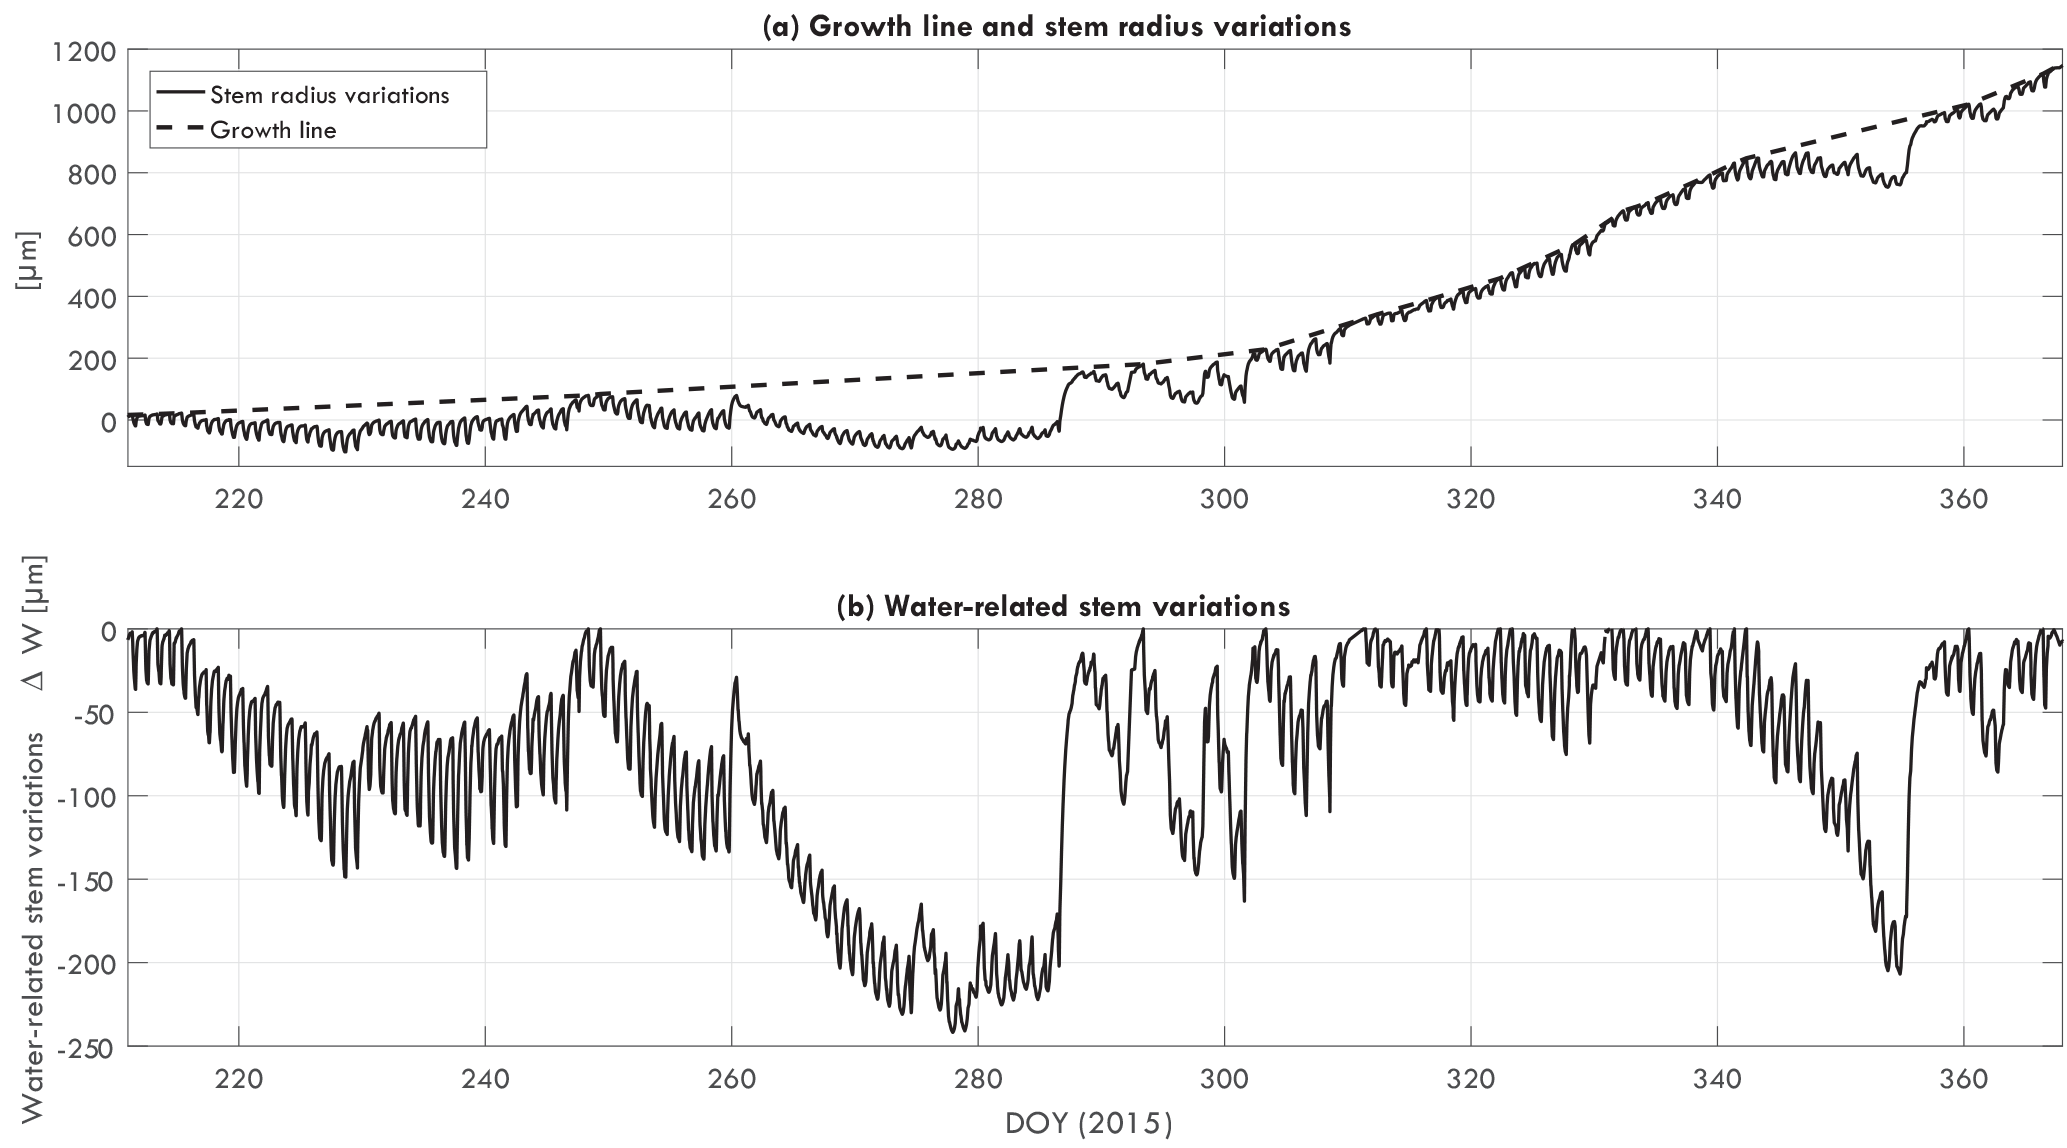
Figure 1(a) Growth line and steam radius variation for Goupia glabra tree 1, and (b) the calculated water-related stem variation ΔW [µm], from August 2015 to December 2015.
2.4 Relating wind to tree motion
The relation between the input wind energy spectrum Pu [dB] and the output energy spectrum of tree motion Py [dB], both as a function of frequency f, can be described as
with mechanical transfer function H [s kg−1], air density ρa [kg m−3], drag coefficient Cd [–], tree catch area A [m2], mean wind speed [m s−1], aerodynamic transfer function Ha(f) [–], and power spectrum of the wind Pu(f) [dB]. In general, the aerodynamic transfer function can be approximated as Ha(f)2=1, as there is a minimal turbulent storage term (Amtmann, 1985; Mayer, 1987).
The energy conservation and dissipation of wind turbulence depends on the scale. Large-scale eddies (low frequencies) are energy containing, whereas energy dissipation mainly happens at smaller molecular scales (higher frequencies). The range in between, the inertial subrange, is where energy is transferred from low to high frequencies. Kolmogorov (1941) hypothesized that, at high Reynolds numbers and under homogeneous and isotopic turbulence, the inertial subrange would follow a spectrum. The wind energy content Pu within the inertial subrange is a universal function of the frequency and can therefore be expressed as (Stull, 2012, p. 390–391)
with constant C, dissipation rate ϵ, and frequency f. Wind in forest canopies also exhibit this spectrum (e.g., Flesch and Wilson, 1999; Odijk, 2015). For turbulent conditions, the input wind spectra (see Eq. 4) and its slope are known. Comparing the input Kolmogorov wind spectrum with the output tree acceleration spectrum therefore gives a measure of the momentum damping/absorption by the tree. For Eqs. (4) and (5), a constant value for the wind spectrum slope () is used in subsequent analyses. With known acceleration and wind spectra, we can find an expression for the transfer function, which is a measure of tree–atmosphere momentum transfer. The slope of the acceleration and wind spectra are related through the following equation:
with tree acceleration spectrum slope [dB Hz−1] and wind spectrum slope [dB Hz−1]. We simplify the slopes of the acceleration and wind spectra to
By combining the constant variables we can simplify this to
with acceleration and wind spectra slopes sa and sw [dB Hz−1], and transfer parameter α [s m−1]. The combined term αCd is used as a conceptual expression for tree–atmosphere momentum transfer and accounts for the combined effect of, for example, drag coefficient, mass, density, wind catch area.
Interaction between wind and a tree is a function of wind speed. As, for example, Mayhead (1973) and Koizumi et al. (2010) have shown, the drag coefficient and momentum transfer decrease with increasing wind speed. This is mainly due to streamlining of the tree, which decreases the catch area of the tree. In this study, we analyze the changes in the relation between the measure of tree–atmosphere momentum transfer αCd and wind speed. For each week, the following function is fit to the relation between wind speed u and αCd:
with A=1 and damping parameter β. β determines the shape of the relation and describes how the tree–atmosphere momentum transfer changes with wind speed. The value of β is therefore used to track the variation in tree–atmosphere momentum transfer over space and time. For better comparison between individual trees, β is presented normalized by the mean value for β per individual tree.
2.5 Data processing
We estimate the frequency spectrum of the horizontal, single axis acceleration using a sliding window fast Fourier transform (FFT). The spectrum was estimated every 10 min, using a window length of 30 min. The slope of the spectrum represents the damping of the driving wind force by the tree and can be seen as a measure of energy and momentum transfer (van Emmerik et al., 2017a). As tree movement is driven by wind, a part of the wind energy is transferred to kinetic energy in the tree. For this study, the slope of the frequency spectrum between 0.2 and 1 Hz was determined, for every 10 min. The slope is presented on a logarithmic scale [dB Hz−1].
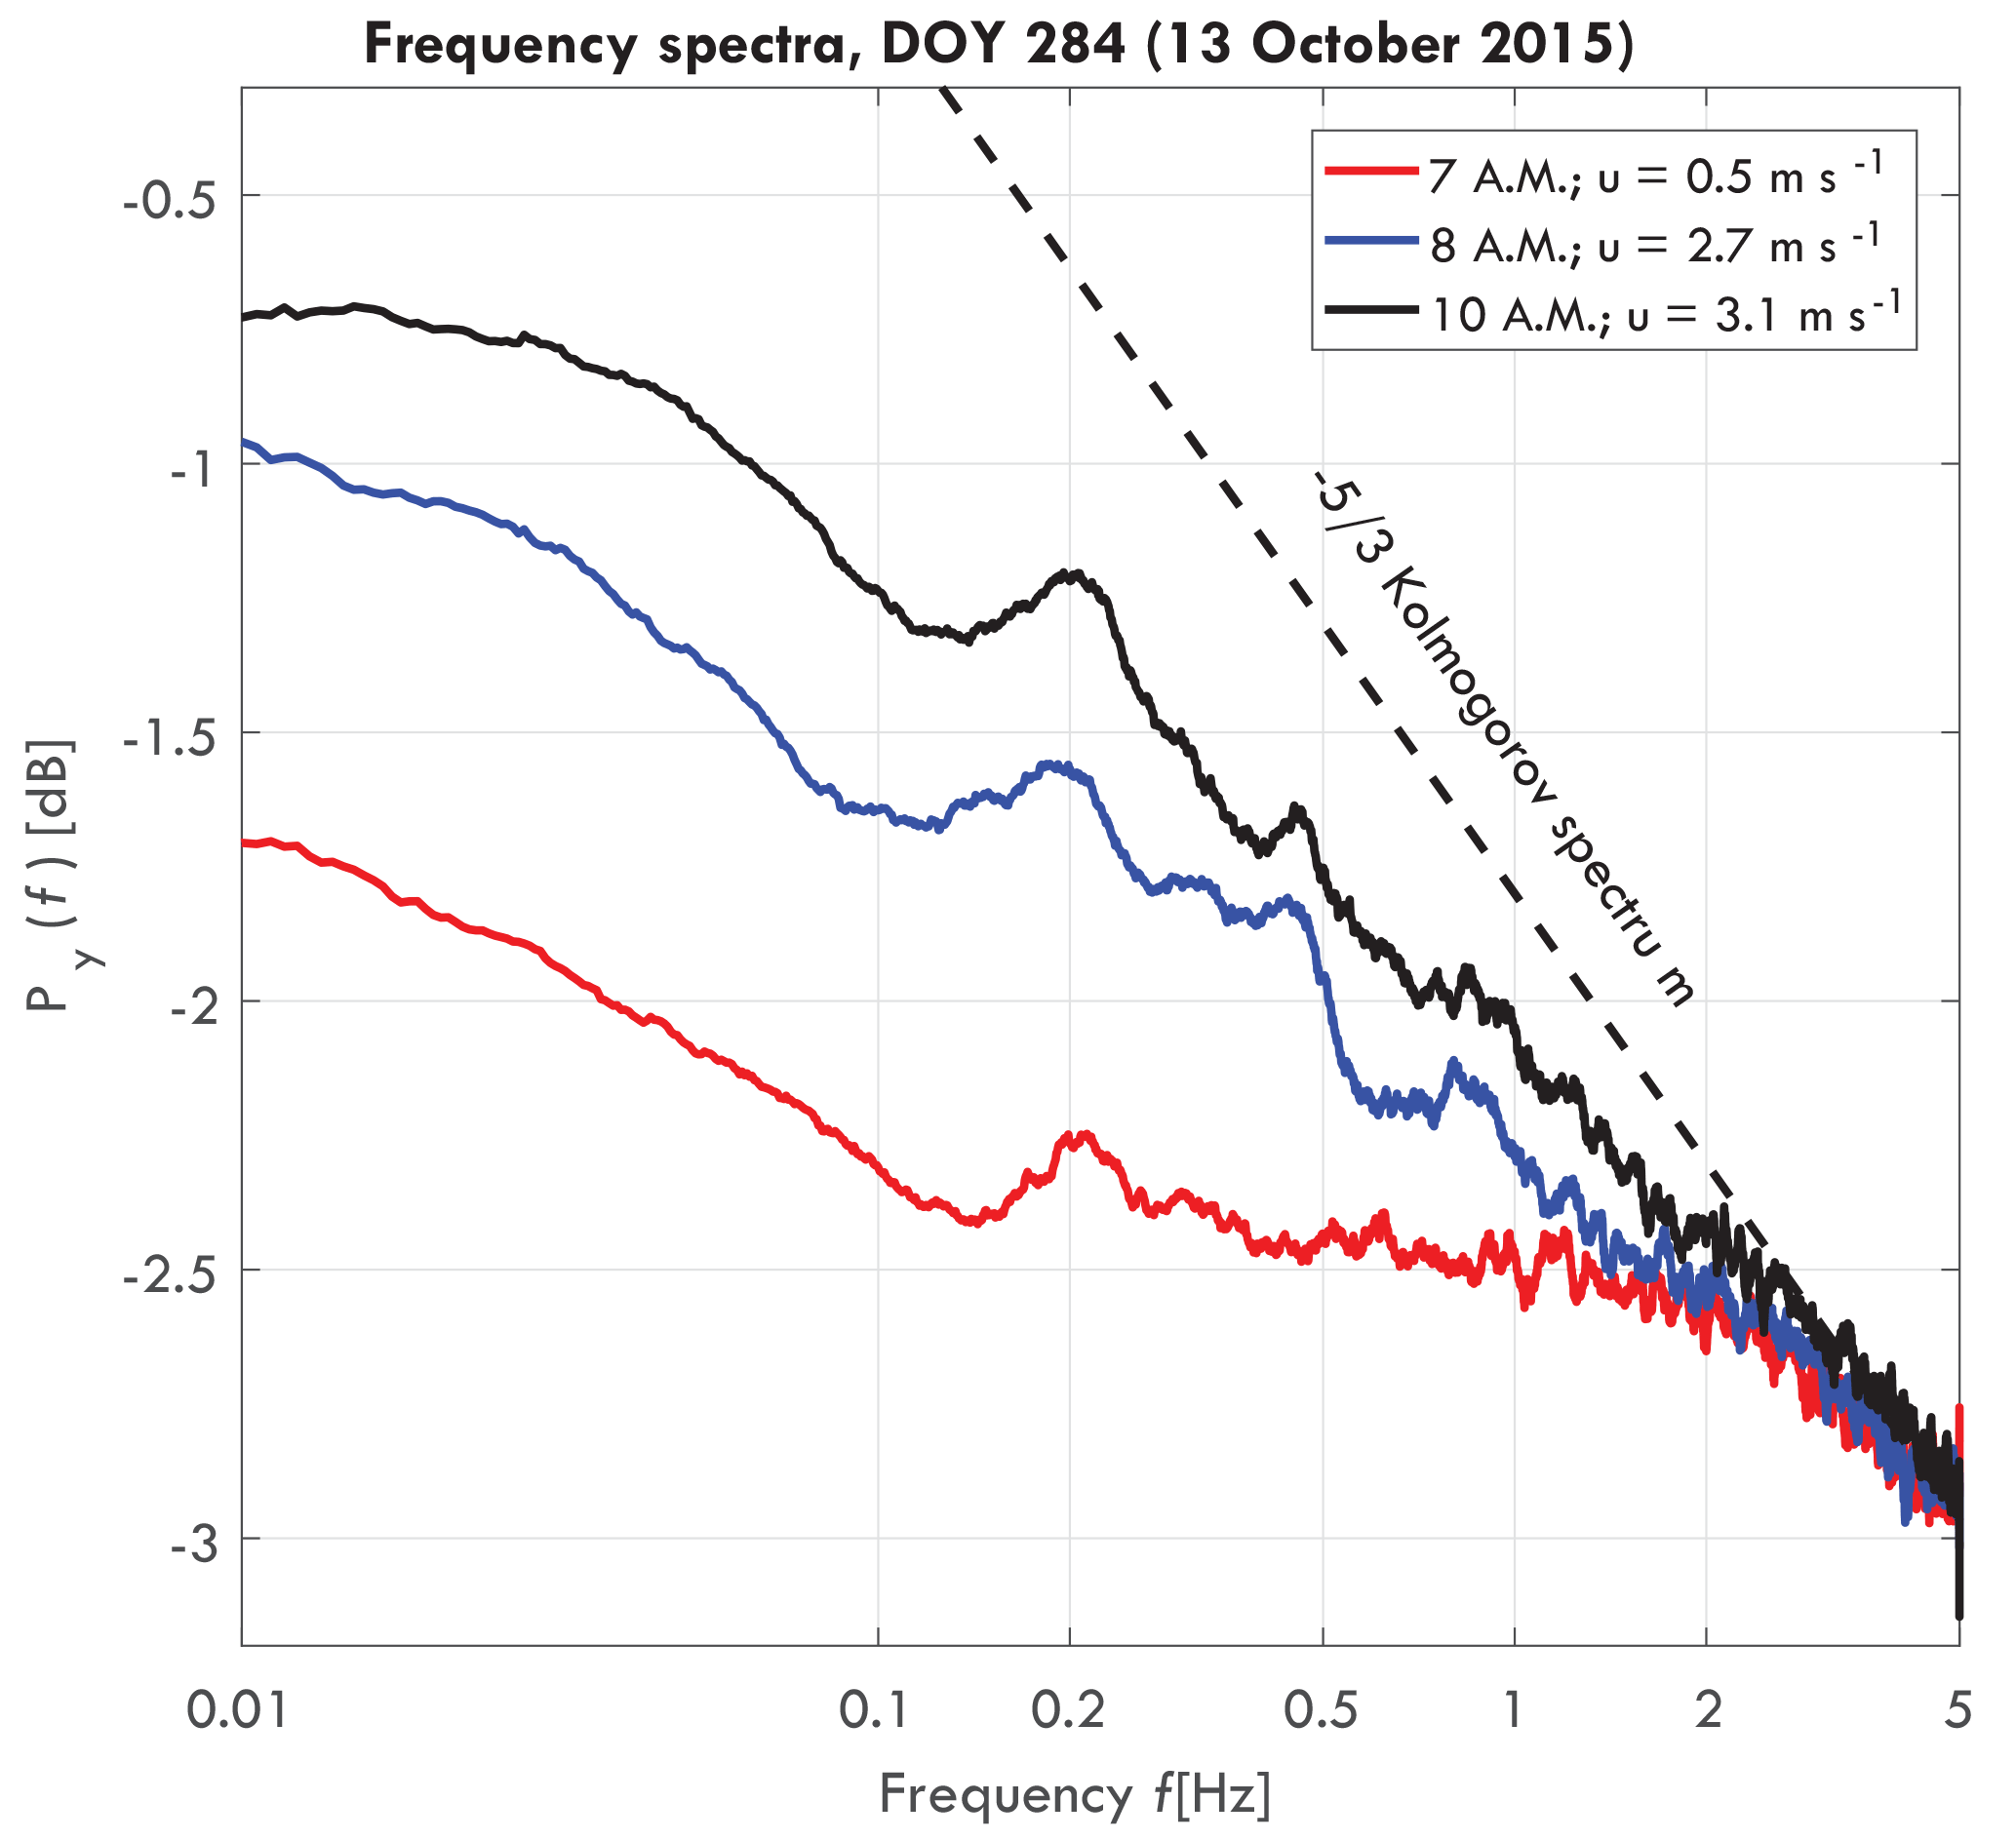
Figure 2Frequency spectra of a Goupia glabra tree for different wind speeds on day of year (DOY) 284 (11 October 2015), including turbulent wind spectrum (dashed black), taken from van Emmerik et al. (2017a).
3.1 Acceleration spectra slope
Figure 2 presents a typical acceleration energy spectrum for a Goupia glabra tree, for three different wind speeds. For increasing wind speeds, the slope of the spectrum approaches the Kolmogorov spectrum. As hypothesized by Kolmogorov (1941), turbulent motions in the inertial subrange are statistically isotropic, and the wind energy spectrum is only a function of frequency. Around 0.2 Hz a peak can be observed, which is the natural frequency fn [Hz] of the tree. Variation in the natural frequency can be related to tree mass changes and intercepted rainfall by the canopy (van Emmerik et al., 2017a), but it is not further used in this paper.
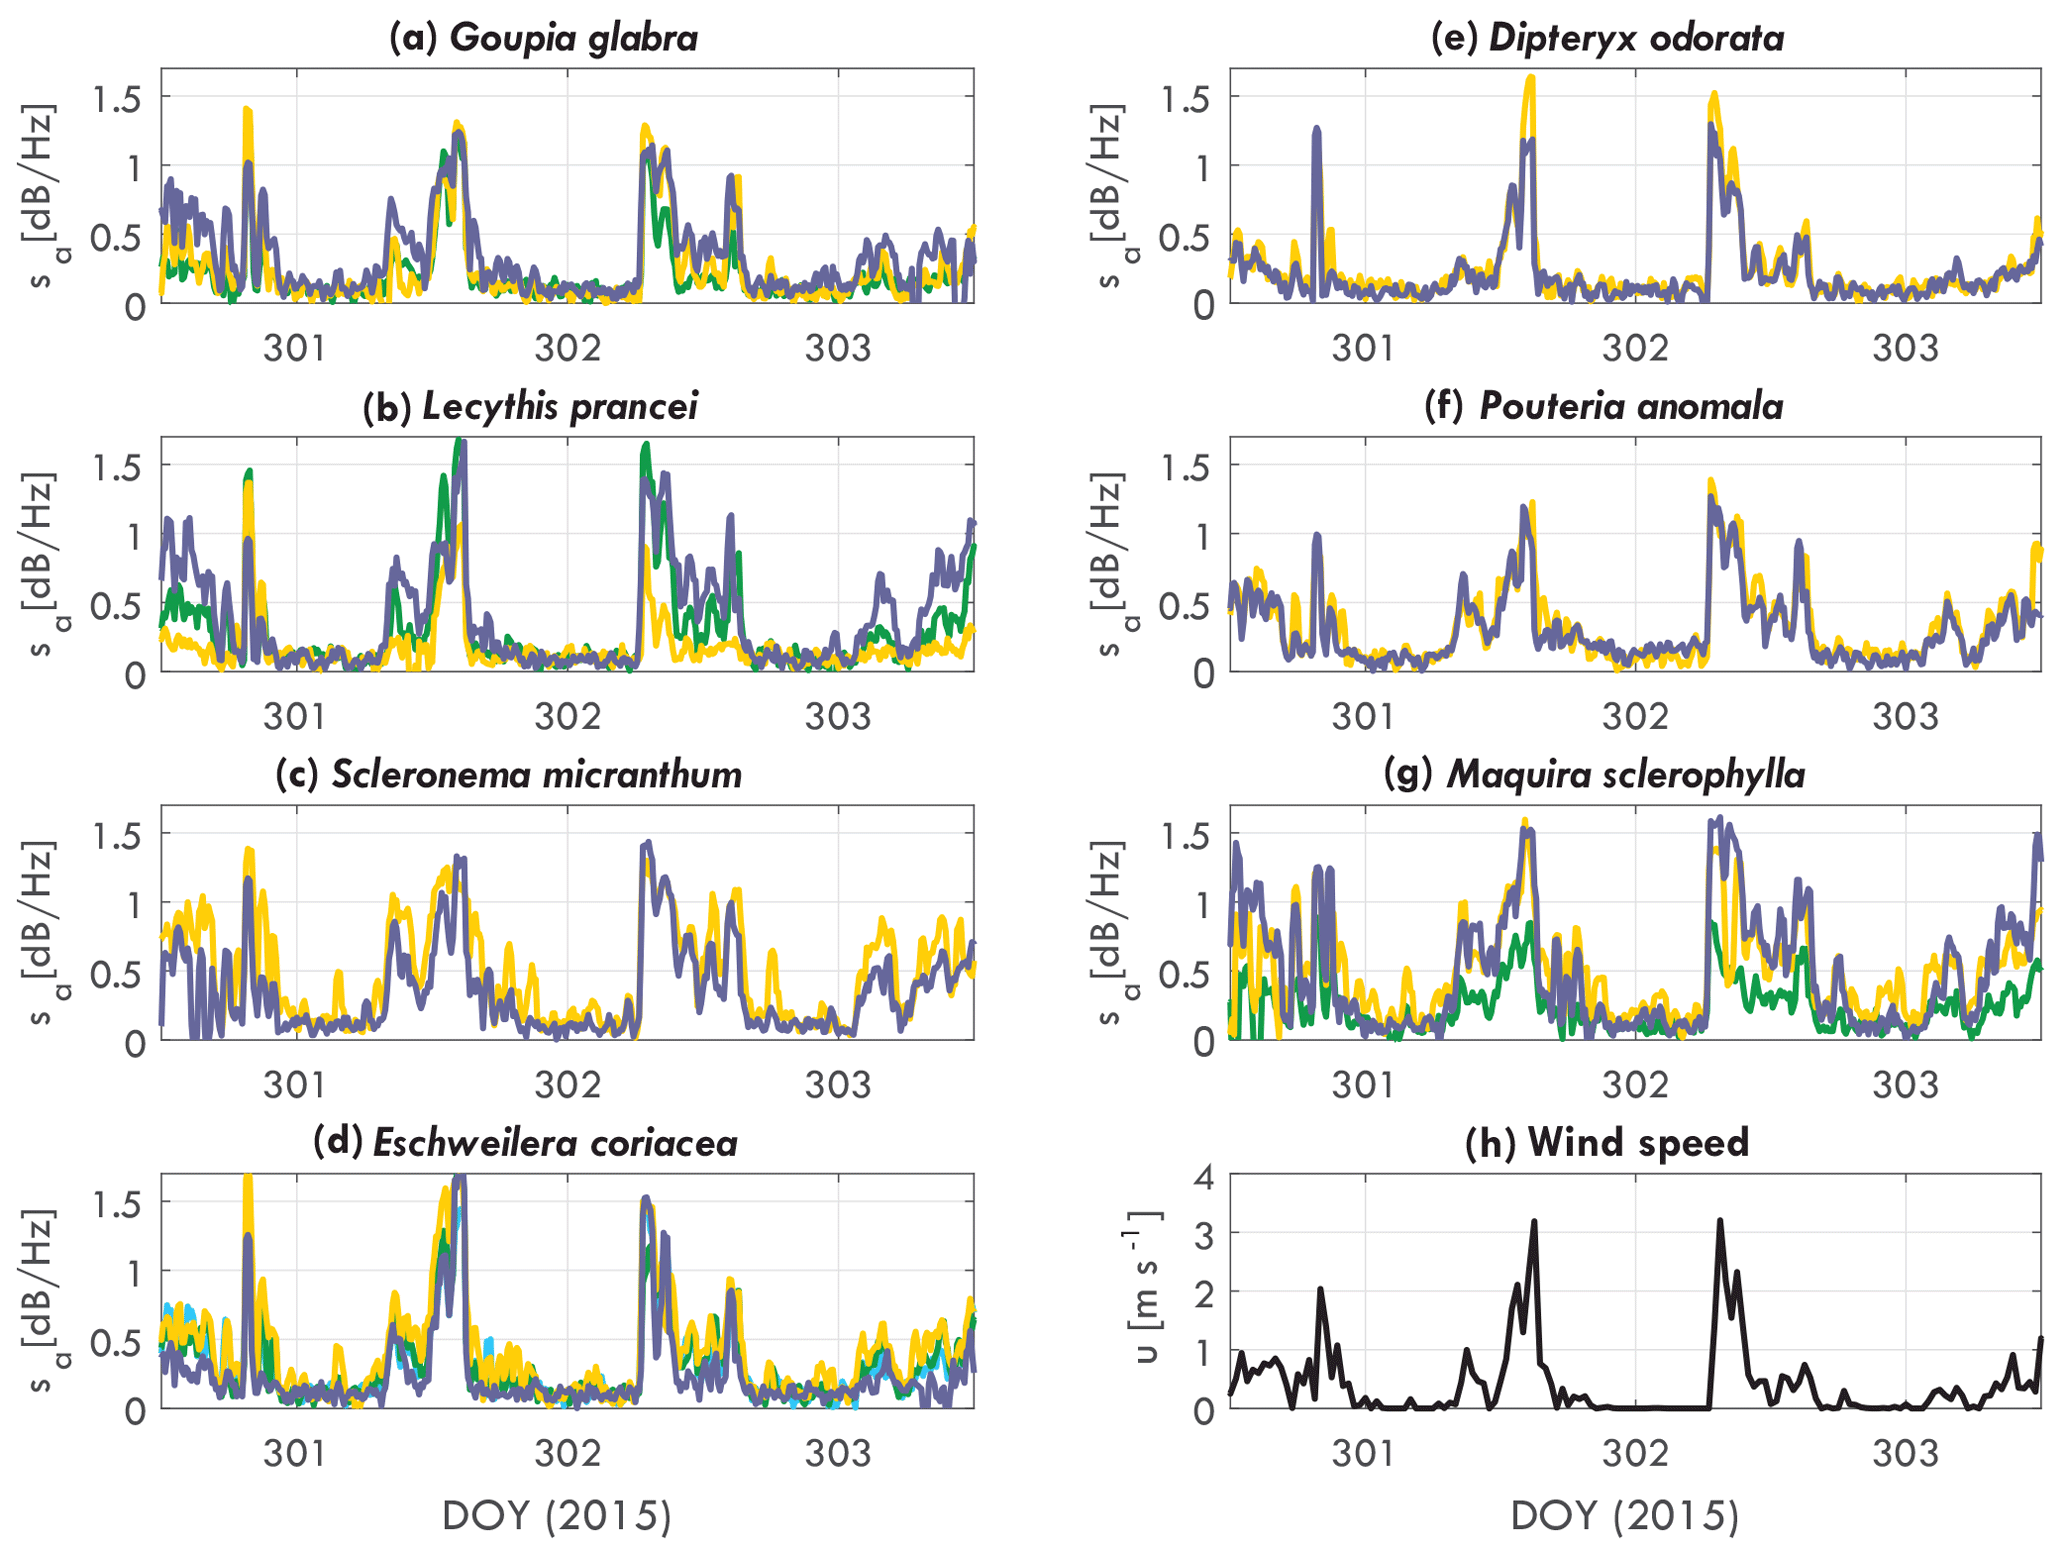
Figure 3Tree acceleration spectra slope sa [dB Hz−1] over time for DOY 301 to 306 (2015), for (a) Goupia glabra, (b) Lecythis prancei, (c) Scleronema micranthum, (d) Eschweilera coriacea, (e) Dipteryx odorata, (f) Pouteria anomala, (g) Maquira sclerophylla, and (h) wind. Each line in (a–g) represents an individual tree.
The slope varies over time and per tree species and individual. Figure 3 presents the acceleration spectra slope sa for each tree, grouped per tree species. As expected, the slope of the acceleration spectrum increases with wind speed. The timing and magnitude does change per tree. For example, the Scleronema trees (Fig. 3c) have a consistently higher slope (1.4 dB Hz−1 during the day) than the Dipteryx (Fig. 3e) trees (1 dB Hz−1 during the day). The sum of the differences between trees are captured by the parameter αCd, which will be presented later. Other clear differences can be seen between individuals of different species. Where for the Scleronema (Fig. 3c) and Pouteria (Fig. 3f) trees the slope is similar between the individuals, for Maquira (Fig. 3g) and Lecythis (Fig. 3b) the variation between the individuals is considerably larger.
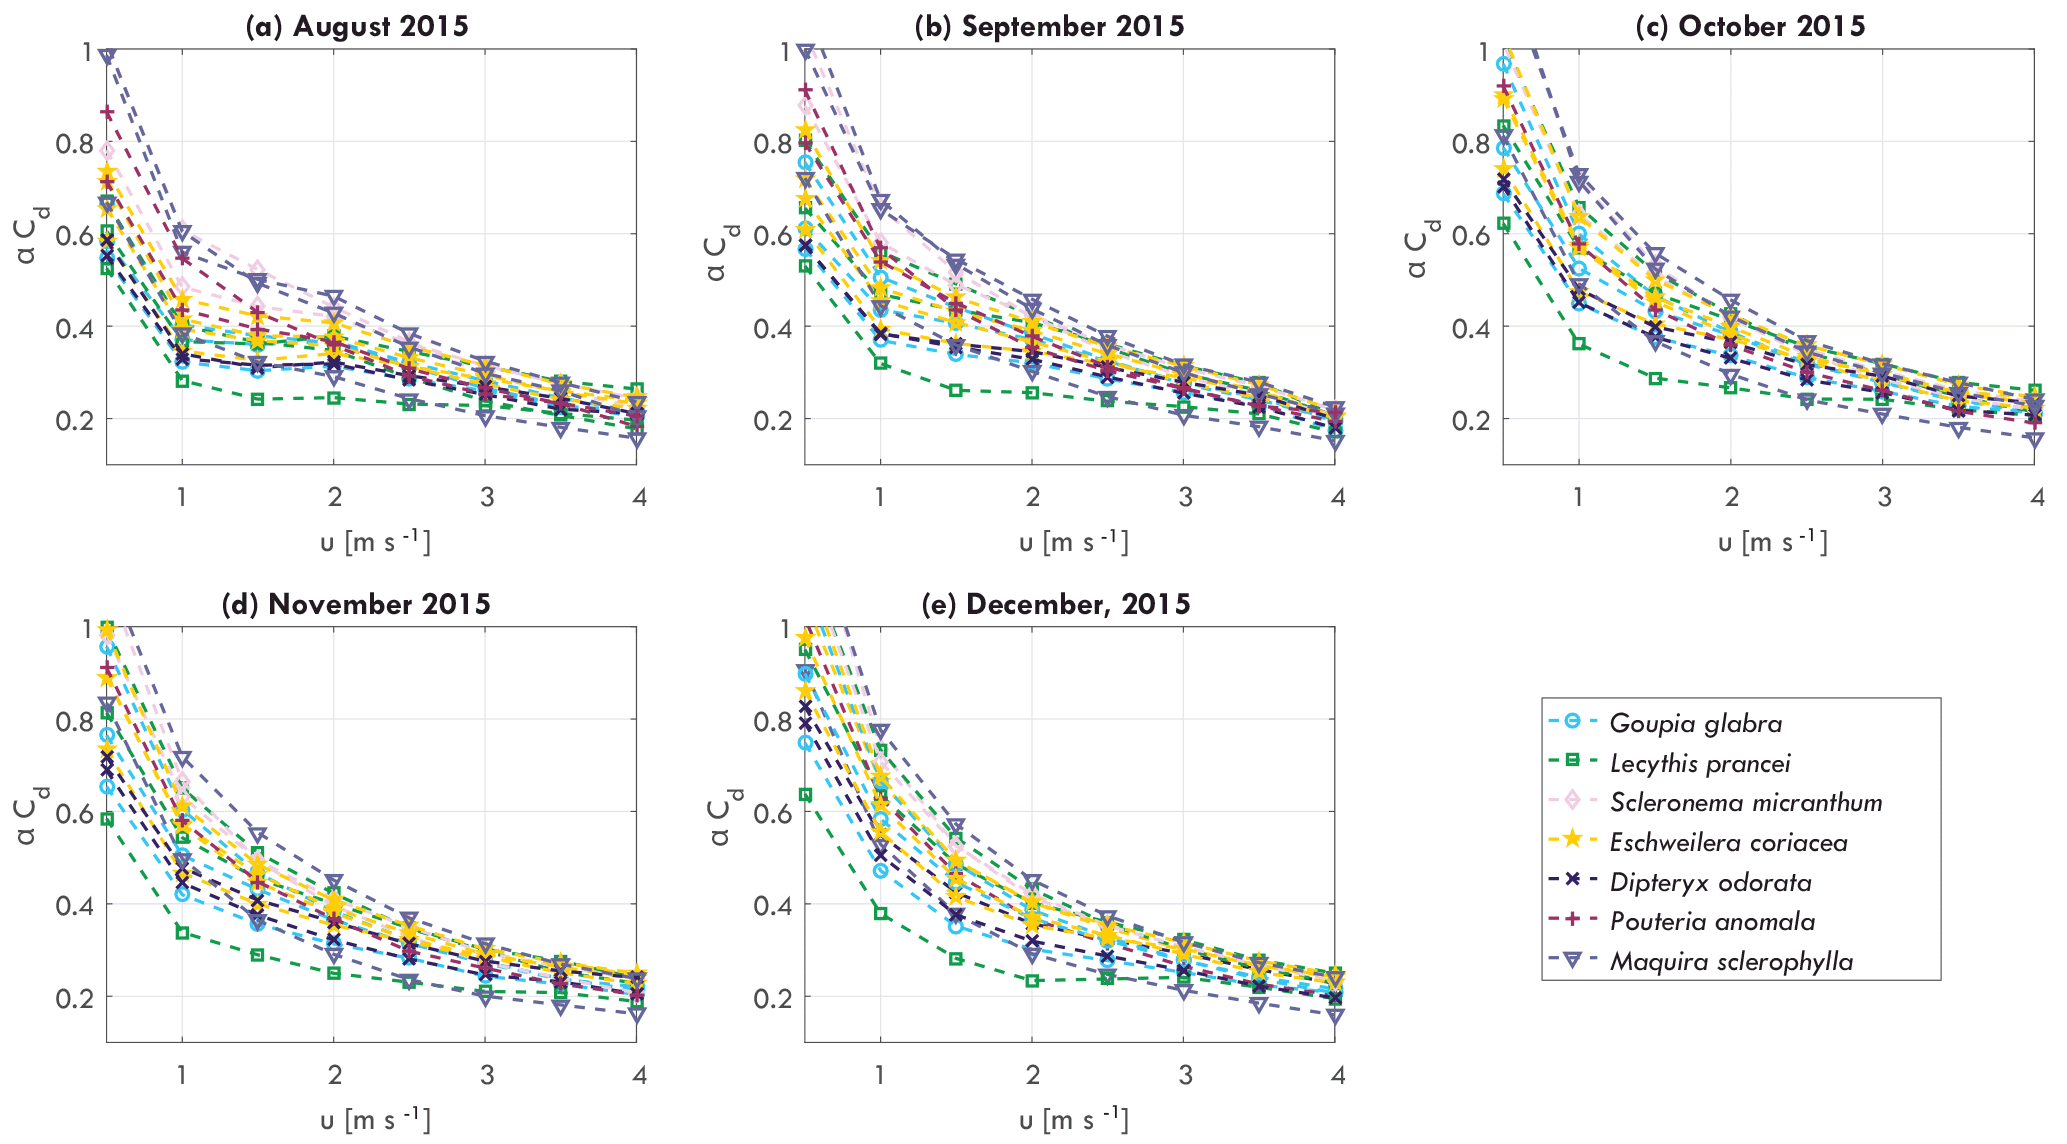
Figure 4Monthly averaged tree–atmosphere momentum transfer αCd per individual tree as a function of wind speed u [m s−1] for (a) August 2015, (b) September 2015, (c) October 2015, (d) November 2015, and (e) December 2015.

Figure 5(a) Normalized damping coefficient β for each individual tree, and (b) mean, mean ±1 standard deviation, minimum and maximum water-related stem variation ΔW, for every week from DOY 218 (August) to 365 (December) 2015.
3.2 Tree–atmosphere momentum transfer across time and space
The momentum transfer between trees and the atmosphere is expressed by the αCd, which included effects of mass, geometry, wind catch area, and drag coefficient (see Eq. 8). Streamlining of a tree for increasing wind speed affects the relation between αCd and wind speed (Koizumi et al., 2010; Mayhead, 1973), as can be seen in Fig. 4. Here, the monthly averaged relation between αCd and wind speed are presented for August to December, 2015. For wind speeds between 0 and 3–4 m s−1, αCd decreases, with the highest decrease between 0 and 1–1.5 m s−1. For higher wind speeds αCd becomes more stable. It can be seen that because αCd varies considerably between individual trees, the relation between αCd and wind speed changes over time. For example, the range of αCd at 1 m s−1 changed from 0.3–0.6 to 0.4–0.8 between August and December, 2015. It is hypothesized that this is due to changes in mass, related to, for example, water content or leaf fall.
3.3 Effect of dry months
To further explore the changes in the relation between αCd and wind, this relation was fit for each week of available data. The most important parameter is the damping coefficient β (see Eq. 9). Figure 5 presents the weekly values for the normalized damping coefficient β between August (DOY 220) and December (365) 2015. Recall that, for the normalization, time series of β are normalized by the average value of β for each individual tree. Water-related stem variation measurements were also available and are also shown in Fig. 5. As most trees showed similar temporal behavior, the figure presents the average water-related stem variation based on all trees, including the minimum and maximum of the measured range.
Between DOY 230 and 280 β decreased while water-related stem variations increased. Although water-related stem variation decreased steeply between DOY 280 and 285, β continued decreasing until around DOY 300. Water deficit remained relatively stable between DOY 285 and 340, after which a steep increase was observed between DOY 340 and 360. β recovered between DOY 300 and 340 and decreased again between DOY 340 and 360. Changes in β are hypothesized to be caused by changes in mass related to water content or to leaf fall. The increase in water-related stem variation supports this hypothesis, as a decreasing/increasing β coincided with inverse changes in water-related stem variation.

Figure 6Damping coefficient β (for fitted function αCd vs. u) for a single (a) Goupia, (b) Scleronema, (c) Eschweilera, and (d) Pouteria tree, vs. water-related stem variation ΔW, colored by day of year (DOY, 2015), and average damping coefficient β in relation to (e) tree height h, (f) diameter at breast height DBH, (g) wood density, and (f) aboveground biomass (AGB), for each measured tree, including Pearson's ρ.
Figure 6 presents the relation between β, water-related stem variation, and DOY for four trees. Here, it can be seen that there is a clear relation between increasing water-related stem variation and decreasing β. When water-related stem variation increases, β drops significantly (DOY 220 to 250). For higher water-related stem variation (DOY 250 to 300), β decreases more gradually. For the recovery (DOY 300 to 340), when water-related stem variation decreases again, the relation between β and water-related stem variation is different. Here, β only increases gradually again for decreases water-related stem variation. For the increase in water-related stem variation between DOY 340 and 360, a drop in β can be seen for the Goupia, Scleronema, and Eschweilera. Note that water-related stem variation is not a measure of water content. When water-related stem variation decreases again after DOY 300, tree water content and biomass do not necessarily increase. Therefore, it can be expected that β does not directly increase either, resulting in the observed hysteresis pattern.
To explore what might explain the variation in β, Fig. 6e–h present the average value of β (for August to December 2015) in relation to the estimated physical tree properties. As expected, the momentum transfer between tree and atmosphere is the sum of various different factors. It can clearly be seen that for increased wood density the average β is higher (Pearson's ρ=0.59), which can be explained by the coinciding increase in tree stiffness. We also see that there is a relation between aboveground biomass and β for all trees, and for each tree species separately. Higher tree biomass results in higher β (Pearson's ρ=0.76). This suggests that changes in β could be explained by mass variations, caused by either leaf flush and fall, or water-content-related biomass changes.
The observations in Figs. 5 and 6a–d suggest a relationship between β and tree biomass. Mean β and biomass show a clear relation (Fig. 6h), suggesting that temporal changes in β are related to temporal changes in tree mass. During periods of increased water-related stem variation during the dry months, β decreases for each tree, providing additional observational support for this hypothesis. The increased water-related stem variation suggests that this is due to water-content-related mass changes in the vegetation, such as decreasing tree water content and increased leaf fall during dry months. The relation between aboveground biomass and β supports this hypothesis, as the observed decrease in β might be explained by decreasing tree mass during the dry months.
3.4 Synthesis
The results presented in this paper show that the degree of tree–atmosphere momentum transfer varies considerably between species. Previous work has shown this for some species using wind tunnel experiments. This study uses in situ measurements to demonstrate the variation in tree–atmosphere momentum transfer in the field. Besides variation in space, significant temporal variation in tree–atmosphere momentum transfer was found. To our knowledge, this is the first time that this has been measured under field conditions.
Changes in tree–atmosphere momentum transfer seem to be related to changes in tree mass. For the period with increased measured water-related stem variation, β decreased. We hypothesize that this is a direct effect of increased tree water deficit. There are two mechanisms that might explain the changes in β. First, tree mass might change through changes in tree water content. When tree water deficit is increasing, insufficient water is available to refill the storage, and tree water content decreases. In future work we recommend measurements of leaf water potential or tree water content to assess the influence of tree mass change on tree–atmosphere interaction in more detail. Second, changes in β might also be caused by leaf fall, which for some trees might also affect the total mass significantly (Lopes et al., 2016). Leaf fall can be a direct consequence of tree water deficit (Reich and Borchert, 1984), but it is not always driven by water deficit. Peak rates of leaf fall almost always occur during the dry months in tropical forests (Wright and Cornejo, 1990). This might explain the quick response to increased water-related stem variation. When water-related stem variation is low again, one might expect a recovery in β as well. However, if β is mainly changed due to leaf fall, the recovery might be delayed significantly. Leaf expansion might occur only a few weeks during the early wet months (Reich and Borchert, 1984); growth of new leaves only occurs as long as soil moisture is plentiful (Bordiert, 1994). Absence of these conditions could explain the slow response in β. For this reason a hysteresis pattern is observed for damping and water-related stem variation in Fig. 6. Previous work on the K34 site showed that the highest annual litterfall occurs between August and October (Wu et al., 2016), coinciding with the period of decreased β in this study. For increased water-related stem variation it is likely that tree water content and biomass decreased. However, during periods of low water-related stem variation trees are not restored, and it takes time before tree water content and biomass increase again. Therefore β does also not directly increase. Additional data such as leaf water potential or eddy covariance data will help attribute the change in tree–atmosphere momentum transfer to changes in tree water content, leaf fall, or other mechanisms not yet considered.
An alternative explanation of the changing tree–atmosphere momentum transfer might be the changing elasticity of the tree. A weak relation was found between β and wood density, which can be considered a proxy for tree elasticity. Recent work found a relation between moisture content and elasticity of trees (Mvondo et al., 2017). Although this might be not directly mass related, this would still imply a relation between tree–atmosphere momentum transfer and the tree water status. Also this hypothesis points towards a measurable effect of the transition from wet to dry months on tree–atmosphere momentum transfer.
Variation between species is a combination of multiple factors. From Fig. 6 it is clear that different wood density and AGB can be related to different β. Additional factors influencing the variation between species include tree architecture, leaf type, wind speed within the canopy and stem elasticity.
The impact of water-related stem variation on tree–atmosphere is a significant finding, as this shows that tree–atmosphere momentum transfer is also affected during the dry months, in addition to the general spatiotemporal variation. This sheds new light on momentum transfer from the atmosphere to the tree. Previous studies on tree–atmosphere momentum transfer used the drag coefficient Cd as a measure for tree–atmosphere momentum transfer. It was found that this varies with wind speed and per tree species. So far, this has not been done on trees in forests. Also, no studies have investigated the effect of water-related stem variation on tree drag coefficient or any other measure of tree–atmosphere momentum transfer. Additional high-resolution wind measurements would allow further, more detailed, exploration of tree–atmosphere interaction. For example, the conceptual α parameter can be quantified using more detailed wind measurements, yielding a more exact and physically based expression of tree–atmosphere interaction. We found that αCd varies across different timescales. Furthermore, this would allow investigating whether wind patterns within the canopy have changed over time, which might also explain the variation in tree–atmosphere momentum transfer. We recommend further research to study the factors that dominate the variations at different timescales, which may be important for modeling purposes focusing on atmospheric processes on different timescales.
With this paper we aim to show that assuming a constant drag coefficient is unrealistic and potentially introduces a large source of error. For example, several large-scale land–surface models approaches represent the canopy layer, and its interaction with the atmospheric boundary layer, through static parameters. The observations presented in this paper show that future efforts should consider using more dynamic representation and parameterization to reduce errors. Additional measurements of turbulent kinetic energy, (high-frequency) wind speed at specific trees, leaf water potential and leaf area will give more insights in the dynamics driving changes in tree–atmosphere interaction and will allow for expressing tree–atmosphere interaction in terms of actual drag coefficient.
This paper demonstrates that the variation in tree–atmosphere momentum transfer can change considerably during the shift from the wet to the dry months. This has important implications for the water and carbon balance, as these depend strongly on the momentum transfer from atmosphere to the canopy. We emphasize that this paper presents experimental work. Experimental work is imperative to gain a better understanding of governing processes (van Emmerik et al., 2018a), in this case regarding tree–atmosphere interactions. However, additional measurements of the input wind spectra, and its variation over time and space, is crucial for further exploration of the relation between wind, tree sway, and momentum transfer. Combining the current data with plant physiological measurements will allow further testing of the hypothesis that the temporal changes in tree–atmosphere momentum transfer are related to water-deficit-induced tree mass changes.
Tree sway measurements were used to estimate tree–atmosphere momentum transfer for 19 trees during a transition from the wet to the dry months in the Brazilian Amazon. It was found that tree–atmosphere momentum transfer varies considerably between individuals and between species.
Tree–atmosphere momentum transfer and its relation with wind speed also changes over time. Especially during the transition from the wet to the dry months, a clear change in tree–atmosphere momentum transfer was measured for all trees. The change in tree–atmosphere momentum transfer coincided with increasing water-related stem variation.
A positive relation was found between estimated aboveground tree biomass and average tree–atmosphere momentum transfer. This suggests that the variation in accelerometer-derived measure of tree–atmosphere momentum transfer is caused by changes in tree mass, most likely caused by water-tree-deficit-induced changes in water content or leaf fall.
Our experimental work provides new insights into variation in tree–atmosphere momentum transfer in time and space and its response to increased water-related stem variation. We aim to show that using static parameterization of vegetation in for example land–atmosphere or climate models might introduce a source of error. Future work should focus on attributing changes in tree–atmosphere interactions to changes in tree water content, leaf fall and flush, and other mechanisms.
Dendrometer data may be obtained from Fernanda Barros (email: nandavascon@gmail.com). Accelerometer data may be obtained from Tim van Emmerik (email: t.h.m.vanemmerik@tudelft.nl) or can be downloaded at https://doi.org/10.4121/uuid:c9974180-aa9b-40b4-8dbb-06d5b1fce693 (van Emmerik et al., 2018b).
TvE, SSD, PG, and NvdG designed the study. TvE, RSO, PB, and FB conducted the fieldwork. TvE performed the initial data analysis and wrote the first draft of the manuscript. All authors contributed to data interpretation and writing the manuscript.
The authors declare that they have no conflict of interest.
We thank FAPESP GOAmazon project 2013/50431-2, in whose field campaign data
were collected. We thank the Large Scale Biosphere-Atmosphere (LBA) program at
the National Institute for Amazon Research (INPA) for logistical and
infrastructure support during field measurements. The work of Susan
Steele-Dunne was supported by a Vidi Grant 14126 from the Dutch Technology
Foundation STW, which is part of the Netherlands Organisation for Scientific
Research (NWO) and is partly funded by the Ministry of Economic
Affairs. The authors are very grateful to Laura Borma.
Edited by: Anja Rammig
Reviewed by: John Van Stan and one anonymous referee
Amtmann, R.: Data acquisition system for wind induced tree vibration, in: The Forest-Atmosphere Interaction, edited by: Hutchison, B. A. and Hicks, B. B., Springer, Dordrecht, 149–159, 1985 a
Anber, U., Gentine, P., Wang, S., and Sobel, A. H.: Fog and rain in the Amazon, P. Natl. Acad. Sci. USA, 112, 11473–11477, 2015. a
Aumond, P., Masson, V., Lac, C., Gauvreau, B., Dupont, S., and Berengier, M.: Including the drag effects of canopies: real case large-eddy simulation studies, Bound.-Lay. Meteorol.,, 146, 65–80, 2013. a
Belcher, S. E., Harman, I. N., and Finnigan, J. J.: The wind in the willows: flows in forest canopies in complex terrain, Annu. Rev. Fluid Mech., 44, 479–504, 2012. a
Binks, O., Meir, P., Rowland, L., Costa, A. C. L., Vasconcelos, S. S., Oliveira, A. A. R., Ferreira, L., Christoffersen, B., Nardini, A., and Mencuccini, M.: Plasticity in leaf-level water relations of tropical rainforest trees in response to experimental drought, New Phytol., 211, 477–488, 2016. a
Bordiert, R.: Water status and development of tropical trees during seasonal drought, Trees-Struct. Funct., 8, 115–125, 1994. a
Cassiani, M., Katul, G., and Albertson, J.: The effects of canopy leaf area index on airflow across forest edges: large-eddy simulation and analytical results, Bound.-Lay. Meteorol., 126, 433–460, 2008. a
Cescatti, A. and Marcolla, B.: Drag coefficient and turbulence intensity in conifer canopies, Agr. Forest Meteorol., 121, 197–206, 2004. a
Chave, J., Coomes, D., Jansen, S., Lewis, S. L., Swenson, N. G., and Zanne, A. E.: Towards a worldwide wood economics spectrum, Ecol. Lett., 12, 351–366, 2009. a
Chave, J., Réjou-Méchain, M., Búrquez, A., et al.: Improved allometric models to estimate the aboveground biomass of tropical trees, Glob. Change Biol., 20, 3177–3190, 2014. a
Clifton, O. E., Fiore, A. M., Munger, J., Malyshev, S., Horowitz, L., Shevliakova, E., Paulot, F., Murray, L., and Griffin, K.: Interannual variability in ozone removal by a temperate deciduous forest, Geophys. Res. Lett., 44, 542–552, 2017. a
De Gonçalves, L. G. G., Borak, J. S., Costa, M. H., et al.: Overview of the large-scale biosphere–atmosphere experiment in Amazonia Data Model Intercomparison Project (LBA-DMIP), Agr. Forest Meteorol., 182, 111–127, 2013. a
Dupont, S. and Brunet, Y.: Edge flow and canopy structure: a large-eddy simulation study, Bound.-Lay. Meteorol., 126, 51–71, 2008. a
Ehrenberger, W., Rüger, S., Fitzke, R., Vollenweider, P., Günthardt-Goerg, M., Kuster, T., Zimmermann, U., and Arend, M.: Concomitant dendrometer and leaf patch pressure probe measurements reveal the effect of microclimate and soil moisture on diurnal stem water and leaf turgor variations in young oak trees, Funct. Plant Biol., 39, 297–305, 2012. a, b
Flesch, T. K. and Wilson, J. D.: Wind and remnant tree sway in forest cutblocks. II. Relating measured tree sway to wind statistics, Agr. Forest Meteorol., 93, 243–258, 1999. a
Gentine, P., Entekhabi, D., and Polcher, J.: The diurnal behavior of evaporative fraction in the soil–vegetation–atmospheric boundary layer continuum, J. Hydrometeorol., 12, 1530–1546, 2011. a
Gentine, P., Entekhabi, D., and Heusinkveld, B.: Systematic errors in ground heat flux estimation and their correction, Water Resour. Res., 48, W09541, https://doi.org/10.1029/2010WR010203, 2012. a
Gillies, J., Nickling, W., and King, J.: Drag coefficient and plant form response to wind speed in three plant species: Burning Bush (Euonymus alatus), Colorado Blue Spruce (Picea pungens glauca.), and Fountain Grass (Pennisetum setaceum), J. Geophys. Res., 107, 4760, https://doi.org/10.1029/2001JD001259 2002. a
Green, J. K., Konings, A. G., Alemohammad, S. H., Berry, J., Entekhabi, D., Kolassa, J., Lee, J.-E., and Gentine, P.: Regionally strong feedbacks between the atmosphere and terrestrial biosphere, Nat. Geosci., 10, 410–414, 2017. a
Guan, D., Zhang, Y., and Zhu, T.: A wind-tunnel study of windbreak drag, Agr. Forest Meteorol., 118, 75–84, 2003. a
Johnson, R., Ramey, G., and O'Hagan, D.: Wind induced forces on trees, J. Fluid. Eng., 104, 25–30, 1982. a
Katul, G., Finnigan, J., Poggi, D., Leuning, R., and Belcher, S.: The influence of hilly terrain on canopy-atmosphere carbon dioxide exchange, Bound.-Lay Meteorol., 118, 189–216, 2006. a
Katul, G. G., Porporato, A., Nathan, R., Siqueira, M., Soons, M., Poggi, D., Horn, H., and Levin, S.: Mechanistic analytical models for long-distance seed dispersal by wind, Am. Nat., 166, 368–381, 2005. a
Koizumi, A., Motoyama, J.-i., Sawata, K., Sasaki, Y., and Hirai, T.: Evaluation of drag coefficients of poplar-tree crowns by a field test method, J. Wood Sci., 56, 189–193, 2010. a, b, c, d
Koizumi, A., Shimizu, M., Sasaki, Y., and Hirai, T.: In situ drag coefficient measurements for rooftop trees, J. Wood Sci., 62, 363–369, 2016. a
Kolmogorov, A. N.: The local structure of turbulence in incompressible viscous fluid for very large Reynolds numbers, Dokl. Akad. Nauk SSSR, 30, 299–303, 1941. a, b
Llamas, R. A., Niemeier, J. J., Kruger, A., Lintz, H. E., Kleinknecht, G. J., and Miller, R. A.: Diurnal cycles of tree mass obtained using accelerometers, AGU Fall Meeting Abstracts, H43H-1575, 2013. a
Lopes, A. P., Nelson, B. W., Wu, J., de Alencastro Graça, P. M. L., Tavares, J. V., Prohaska, N., Martins, G. A., and Saleska, S. R.: Leaf flush drives dry season green-up of the Central Amazon, Remote Sens. Environ., 182, 90–98, 2016. a
Mayer, H.: Wind-induced tree sways, Trees, 1, 195–206, 1987. a
Mayhead, G.: Some drag coefficients for British forest trees derived from wind tunnel studies, Agr. Meteorol., 12, 123–130, 1973. a, b, c, d
Meroney, R. N.: Characteristics of wind and turbulence in and above model forests, J. Appl. Meteorol., 7, 780–788, 1968. a
Molina-Aiz, F., Valera, D., Alvarez, A., and Madueno, A.: A wind tunnel study of airflow through horticultural crops: determination of the drag coefficient, Biosyst. Eng., 93, 447–457, 2006. a
Mvondo, R. R. N., Meukam, P., Jeong, J., Meneses, D. D. S., and Nkeng, E. G.: Influence of water content on the mechanical and chemical properties of tropical wood species, Results Phys., 7, 2096–2103, 2017. a
Novak, M. D., Warland, J. S., Orchansky, A. L., Ketler, R., and Green, S.: Wind tunnel and field measurements of turbulent flow in forests. Part I: uniformly thinned stands, Bound.-Lay. Meteorol., 95, 457–495, 2000. a
Odijk, T.: A tree swaying in a turbulent wind: a scaling analysis, J. Biol. Phys., 41, 1–7, 2015. a
Phillips, O. L., Aragão, L. E., Lewis, S. L., et al.: Drought sensitivity of the Amazon rainforest, Science, 323, 1344–1347, 2009. a, b
Poggi, D. and Katul, G. G.: An experimental investigation of the mean momentum budget inside dense canopies on narrow gentle hilly terrain, Agr. Forest Meteorol., 144, 1–13, 2007. a, b
Reich, P. B. and Borchert, R.: Water stress and tree phenology in a tropical dry forest in the lowlands of Costa Rica, J. Ecol., 72, 61–74, 1984. a, b
Rudnicki, M., Mitchell, S. J., and Novak, M. D.: Wind tunnel measurements of crown streamlining and drag relationships for three conifer species, Can. J. Forest Res., 34, 666–676, 2004. a
Saatchi, S. S., Houghton, R., Dos Santos Alvala, R., Soares, J., and Yu, Y.: Distribution of aboveground live biomass in the Amazon basin, Glob. Change Biol., 13, 816–837, 2007. a
Selker, J., Lane, J., Rupp, D., Hut, R., Abou Najm, M., Stewart, R., Van De Giesen, N., and Selker, F.: The answer is blowing in the wind: using wind induced resonance of trees to measure time varying canopy mass, including interception, AGU Fall Meeting Abstracts, 1, p. 1155, 2011. a
Spatz, H.-C. and Theckes, B.: Oscillation damping in trees, Plant Sci., 207, 66–71, 2013. a
van Emmerik, T., Steele-Dunne, S., Hut, R., Gentine, P., Guerin, M., Oliveira, R. S., Wagner, J., Selker, J., and van de Giesen, N.: Measuring Tree Properties And Responses Using Low-Cost Accelerometers, Sensors, 17, 1098, https://doi.org/10.3390/s17051098, 2017a. a, b, c, d, e, f
van Emmerik, T., Steele-Dunne, S., Paget, A., Oliveira, R. S., Bittencourt, P. R., d. V. Barros, F., and van de Giesen, N.: Water stress detection in the Amazon using radar, Geophys. Res. Lett., 44, 6841–6849, 2017b. a
van Emmerik, T., Popp, A., Solcerova, A., Müller, H., and Hut, R.: Reporting negative results to stimulate experimental hydrology: discussion of “The role of experimental work in hydrological sciences – insights from a community survey”, Hydrolog. Sci. J., 63, 1269–1272, 2018a. a
van Emmerik, T., Steele-Dunne, S., Guerin, M., Gentine, P., Oliveira, R. S., Hut, R., Wagner, J., Selker, J., and van de Giesen, N.: Tree sway of 19 Amazon trees, Dataset, TU Delft, https://doi.org/10.4121/uuid:c9974180-aa9b-40b4-8dbb-06d5b1fce693, 2018b. a, b
Vollsinger, S., Mitchell, S. J., Byrne, K. E., Novak, M. D., and Rudnicki, M.: Wind tunnel measurements of crown streamlining and drag relationships for several hardwood species, Can. J. Forest Res., 35, 1238–1249, 2005. a
Wright, S. J. and Cornejo, F. H.: Seasonal drought and leaf fall in a tropical forest, Ecology, 71, 1165–1175, 1990. a
Wu, J., Albert, L. P., Lopes, A. P., et al.: Leaf development and demography explain photosynthetic seasonality in Amazon evergreen forests, Science, 351, 972–976, 2016. a
Zanne, A., Lopez-Gonzalez, G., Coomes, D., Ilic, J., Jansen, S., Lewis, S., Miller, R., Swenson, N., Wiemann, M., and Chave, J.: Global wood density database, Dryad Digital Repository, available at: http://hdl.handle.net/10255/dryad (last access: 30 June 2018), 2009. a
Zweifel, R., Zimmermann, L., and Newbery, D.: Modeling tree water deficit from microclimate: an approach to quantifying drought stress, Tree Physiol., 25, 147–156, 2005. a