the Creative Commons Attribution 4.0 License.
the Creative Commons Attribution 4.0 License.
 | 01 Apr 2019
Plant responses to volcanically elevated CO2 in two Costa Rican forests
Robert R. Bogue
Florian M. Schwandner
Joshua B. Fisher
Ryan Pavlick
Troy S. Magney
Caroline A. Famiglietti
Kerry Cawse-Nicholson
Vineet Yadav
Justin P. Linick
Gretchen B. North
Eliecer Duarte
We explore the use of active volcanoes to determine the short- and long-term effects of elevated CO2 on tropical trees. Active volcanoes continuously but variably emit CO2 through diffuse emissions on their flanks, exposing the overlying ecosystems to elevated levels of atmospheric CO2. We found tight correlations (r2=0.86 and r2=0.74) between wood stable carbon isotopic composition and co-located volcanogenic CO2 emissions for two of three investigated species (Oreopanax xalapensis and Buddleja nitida), which documents the long-term photosynthetic incorporation of isotopically heavy volcanogenic carbon into wood biomass. Measurements of leaf fluorescence and chlorophyll concentration suggest that volcanic CO2 also has measurable short-term functional impacts on select species of tropical trees. Our findings indicate significant potential for future studies to utilize ecosystems located on active volcanoes as natural experiments to examine the ecological impacts of elevated atmospheric CO2 in the tropics and elsewhere. Results also point the way toward a possible future utilization of ecosystems exposed to volcanically elevated CO2 to detect changes in deep volcanic degassing by using selected species of trees as sensors.
- Article
(7804 KB) - Full-text XML
-
Supplement
(263 KB) - BibTeX
- EndNote


Tropical forests represent about 40 % of terrestrial net primary productivity (NPP) worldwide, store 25 % of biomass carbon, and may contain 50 % of all species on Earth, but the projected future responses of tropical plants to globally rising levels of CO2 are poorly understood (Leigh et al., 2004; Townsend et al., 2011). The largest source of uncertainty comes from a lack of understanding of long-term CO2 fertilization effects in the tropics (Cox et al., 2013). Reducing this uncertainty would significantly improve Earth system models, advances which would help better constrain projections in future climate models (Cox et al., 2013; Friedlingstein et al., 2013). Ongoing debate surrounds the question of how much more atmospheric CO2 tropical ecosystems can absorb; this is known as the “CO2 fertilization effect” (Gregory et al., 2009; Kauwe et al., 2016; Keeling, 1973; Schimel et al., 2015).
Free Air CO2 Enrichment (FACE) experiments have been conducted to probe this question, but none have been conducted in tropical ecosystems (e.g., Ainsworth and Long, 2005; Norby et al., 2016). Some studies have used CO2-emitting natural springs to study plant responses to elevated CO2, but these have been limited in scope due to the small spatial areas around springs that experience elevated CO2 (Hattenschwiler et al., 1997; Körner and Miglietta, 1994; Paoletti et al., 2007; Saurer et al., 2003). These studies have suffered from several confounding influences, including other gas species that accompany CO2 emissions at these springs, human disturbances, and difficulty with finding appropriate control locations. Additionally, none have been conducted in the tropics (Pinkard et al., 2010). A series of studies in Yellowstone National Park (USA) used its widespread volcanic hydrothermal CO2 emissions for the same purpose, though it is not in the tropics (Sharma and Williams, 2009; Tercek et al., 2008). Yellowstone was particularly suitable for this type of study due to its protected status as a national park and because the large areas of CO2 emissions made control points more available (Sharma and Williams, 2009; Tercek et al., 2008). These studies reported changes in rubisco, an enzyme central to CO2 fixation, and sugar production in leaves, similar to results from FACE experiments, suggesting that volcanically influenced areas like Yellowstone have untapped potential for studying the long-term effects of elevated CO2 on plants.
Tropical ecosystems on the vegetated flanks of active volcanoes offer large and diverse ecosystems that could make this type of study viable. Well over 200 active volcanoes are in the tropics (Global Volcanism Program, 2013), and many of these volcanoes are heavily forested. However, fewer of these tropical volcanic forests have sufficient legal protection for being a source of long-term information, and the effects of diffuse volcanic flank gas emissions on the overlying ecosystems remain largely unknown. Most previous studies focused on extreme conditions, such as tree kill areas associated with extraordinarily high CO2 emissions at Mammoth Mountain, CA (USA; Biondi and Fessenden, 1999; Farrar et al., 1995; Sorey et al., 1998). However, the non-lethal effects of cold volcanic CO2 emissions – away from the peak emission zones, but still in the theorized fertilization window – have received little attention and could offer a new approach for studying the effects of elevated CO2 on ecosystems (Cawse-Nicholson et al., 2018; Vodnik et al., 2018). The broad flanks of active volcanoes experience diffuse emissions of excess CO2 because the underlying active magma bodies continuously release gas, dominated by CO2 transported to the surface along fault lines (Chiodini et al., 1998; Dietrich et al., 2016; Farrar et al., 1995). This process has frequently been studied to understand the dynamics of active magma chambers and to assess potential volcanic hazards (Chiodini et al., 1998; Sorey et al., 1998). These emissions are released through faults and fractures on the flanks of the volcano (Burton et al., 2013; Pérez et al., 2011; Williams-Jones et al., 2000; see Supplement Fig. S1). Volcanic flanks through which these gases emanate are broad, typically covering 50–200 km2, and often support well-developed, healthy ecosystems. Some of these faults tap into shallow acid hydrothermal aquifers, but by the time these gases reach the surface of most forested volcanoes, soluble and reactive volcanic gas species (e.g., SO2, HF, HCl, and H2S) have been scrubbed out in the deep subsurface, leading to a diffusely emanated gas mix of predominantly CO2 with minor amounts of hydrogen, helium, and water vapor reaching the surface (Symonds et al., 2001).
Trees in these locations are continuously exposed to somewhat variably elevated concentrations of CO2 (eCO2), although the specific effects of this eCO2 on the trees are not well understood. Volcanic CO2 has no 14C and a δ13C signature typically ranging from around −7 ‰ to −1 ‰, which is distinct from typical vegetation and noticeably enriched in 13C compared to typical atmospheric values (Mason et al., 2017). If trees incorporate volcanic CO2, then the stable carbon isotopic composition of wood may document the long-term, possibly variable influence of volcanic CO2 during the tree's growth. With this tracer available, volcanic ecosystems could become a valuable natural laboratory for studying the long-term effects of elevated CO2 on ecosystems, especially in understudied regions like the tropics. Several studies have found correlations between variations in volcanic CO2 flux and plant 14C records at Mammoth Mountain, Yellowstone, and Naples, which agreed well with previous observations at these well-studied sites (Cook et al., 2001; Evans et al., 2010; Lefevre et al., 2017; Lewicki et al., 2014). The Mammoth Mountain and Yellowstone studies linked seismic swarms and accompanying increases in CO2 flux to decreases in 14C content in tree rings in one or two trees, demonstrating the method's utility for uncovering yearly scale variations in volcanic CO2 fluxes (Cook et al., 2001; Evans et al., 2010; Lewicki et al., 2014). The Naples study instead focused on using 14C in grasses as short-term (2 to 6 months) monitors of volcanic CO2 flux, which is useful for volcanic monitoring due to the time-integrated signal they provide (Lefevre et al., 2017). A study of plants growing at Furnas volcano found very strong (r2>0.85) correlations between depletions in 14C and enrichments in 13C from volcanic CO2 in three species of plants, although this study also had a relatively limited (five samples per species) dataset (Pasquier-Cardin et al., 1999). The previously mentioned Naples study also found some correlation between 13C and 14C, although it was not as strong as the study in Furnas (Lefevre et al., 2017; Pasquier-Cardin et al., 1999). Additionally, short-term effects of eCO2 might be revealed by plant functional measurements at the leaf scale, where the additional CO2 could increase carbon uptake in photosynthesis. A series of studies at Mt. Etna in Italy and Mt. Nyiragongo in the Democratic Republic of the Congo found linear anomalies in the NDVI (normalized difference vegetation index), a measure of vegetation greenness (Houlié et al., 2006). One to two years after the appearance of the NDVI anomalies, flank eruptions occurred directly along the line of the anomaly, indicating a plant response to the volcano's pre-eruptive state which may be due to increased CO2 emissions in the buildup to the eruption (Houlié et al., 2006). A follow-up study found that the trees on Mt. Etna were relatively insensitive to changes in temperature and water availability, strengthening the case that volcanic influence was indeed responsible for the NDVI anomaly (Seiler et al., 2017).
Here we provide preliminary results on the short- and long-term non-lethal impacts of diffuse volcanic CO2 emissions on three species of tropical trees on the flanks of two active volcanoes in Costa Rica. We also explore the viability in studying volcanically influenced ecosystems to better understand potential future responses to elevated CO2 and suggest adjustments to our approach that will benefit future, similarly motivated studies.

Figure 1Overview of measurement locations in two old-growth forests on the upper flanks of two active volcanoes in Costa Rica, Turrialba and Irazú. Distribution of mean soil CO2 flux across north flank of Irazú (a) and south flank of Turrialba (b). Colors of dots correspond to flux populations (see Fig. 3).
2.1 Investigated locations and sampling strategy
Irazú and Turrialba are two active volcanoes located ∼25 and 35 km east of San José, Costa Rica (Fig. 1). These two volcanoes are divided by a large erosional basin. The forested portions of the two volcanoes cover approximately 315 km2. The vast majority of the northern flanks of Irazú and Turrialba are covered in legally protected dense old-growth forest, while the southern flanks are dominated by pastureland and agriculture. Turrialba rises 3300 m above its base and has been active for at least 75 000 years, with mostly fumarolic activity since its last major eruption in 1866 (Alvarado et al., 2006). It has experienced renewed activity beginning in 2010, and its current activity is primarily characterized by a near-constant volcanic degassing plume, episodic minor ash emissions, and fumarolic discharges at two of the summit craters, as well as significant diffuse and fumarolic gas emissions across its flanks, focused along fault systems (Martini et al., 2010). Turrialba's CO2 emissions in areas proximal to the crater were calculated at 113±46 tons d−1 (Epiard et al., 2017). The Falla Ariete (Ariete fault), a major regional fault, runs northeast–southwest through the southern part of Turrialba's central edifice and is one of the largest areas of diffuse CO2 emissions on Turrialba (Epiard et al., 2017; Rizzo et al., 2016). Atmospheric CO2 has an average δ13C value of −9.2 ‰ at Turrialba, and the volcanic CO2 released at the Ariete fault has significantly heavier δ13C values clustered around −3.4 ‰ (Malowany et al., 2017).
Irazú has been active for at least 3000 years and had minor phreatomagmatic eruptions in 1963 and a single hydrothermal eruption in 1994. Currently, Irazú's activity primarily consists of shallow seismic swarms, fumarolic crater gas emissions, small volcanic landslides, and minor gas emissions on its northern forested flank (Alvarado et al., 2006; Barquero et al., 1995). Diffuse cold flank emissions of volcanic CO2 represent the vast majority of gas discharge from Irazú, as the main crater releases 3.8 t d−1 of CO2 and a small area on the north flank alone releases 15 t d−1 (Epiard et al., 2017). Between the two volcanoes, a major erosional depression is partially occupied by extensive dairy farms and is somewhat less forested than their flanks.
In this study, we focused on accessible areas between 2000 and 3300 m on both volcanoes (Fig. 1). On Irazú, we sampled trees and CO2 fluxes from the summit area to the north, near the approximately north–south striking Rio Sucio fault, crossing into the area dominated by dairy farms on Irazú's lower northeastern slope. Of significant importance for this type of study is that all active volcanoes on Earth continuously emit CO2 diffusely through fractures and diffuse degassing structures on their flanks, at distances hundreds to thousands of meters away from the crater (Dietrich et al., 2016; Epiard et al., 2017), and this elevated CO2 degassing persists continuously and consistently over decades to centuries (Burton et al., 2013; Delmelle and Stix, 2000; Nicholson, 2017). There is no inherent seasonal or meteorological variability in the source gas pressure, and there is no dependence on shallow soil or vegetation chemistry or biology (though increased soil moisture in the rainy season, wind, and atmospheric pressure can modulate gas permeability of the shallow soil; Camarda et al., 2006). The soil overlying deep-reaching fracture systems acts as a diffuser through which the volcanic gas percolates and enters the sub-canopy air. For our study sites, portions of the volcanoes with active “cold” CO2 degassing have already been assessed and mapped previously (Epiard et al., 2017; Malowany et al., 2017).
Our sampling locations on Irazú were located along a road from the summit northward down into the low-lying area. On Turrialba, we focused on an area of known strong emissions but intact forests on the SW slope, uphill of the same erosional depression but cross-cut by the major NE–SW trending active fracture system of the Falla Ariete. We sampled three main areas of the Falla Ariete, each approximately perpendicularly transecting the degassing fault along equal altitude, at the upper Ariete fault, the lower Ariete fault, and a small basin directly east of the old Cerro Armado cinder cone on Turrialba's southwestern flank. We took a total of 51 tree samples (17 were excluded after stress screening) at irregular intervals depending on the continued availability and specimen maturity of three species present throughout the transect.
All transects are in areas experiencing measurable CO2 enhancements from the Falla Ariete but that are not high enough in altitude to be in areas generally downwind of the prevailing crater emissions plume (Epiard et al., 2017). We avoided areas that experience ash fall, high volcanic SO2 concentrations, and local anthropogenic CO2 from farms or that were likely to have heavily acidified soil. Excessively high soil CO2 concentrations can acidify soil, leading to negative impacts on ecosystems growing there (McGee and Gerlach, 1998). Because such effects reflect by-products of extreme soil CO2 concentrations rather than direct consequences of elevated CO2 on plants, we avoided areas with CO2 fluxes high enough to possibly cause noticeable CO2-induced soil acidification. Light ash fall on some days likely derived from atmospheric drift, as we were not sampling in areas downwind of the crater. The ash fall did not, in any noticeably way, affect our samples, as trees showing ash accumulation on their leaves or previous damage were the exception and avoided. Altitude, the amount of sunlight during measurements, and aspect had no consistent correlations with any of the parameters we measured.
2.2 Studied tree species
Our study focused on three tree species found commonly on Turrialba and Irazú: Buddleja nitida, Alnus acuminata, and Oreopanax xalapensis. B. nitida is a small tree with a typical stem diameter (DBH) ranging from 5 to 40 cm that grows at elevations of 2000–4000 m throughout most of Central America (Kappelle et al., 1996; Norman, 2000). The DBH of the individuals we measured ranged from 11.5 to 51.3 cm, with an average of 29.85 cm. It averages 4–15 m in height and grows primarily in early and late secondary forests (Kappelle et al., 1996; Norman, 2000). A. acuminata is a nitrogen-fixing pioneer species exotic to the tropics that can survive at elevations from 1500 to 3400 m, although it is most commonly found between 2000 and 2800 m (Weng et al., 2004). The trees we measured had DBH ranging from 14.3 to 112 cm, with an average of 57.14 cm. O. xalapensis thrives in early and late successional forests, although it can survive in primary forests as well (Kappelle et al., 1996; Quintana-Ascencio et al., 2004). It had the smallest average DBH of the three species, ranging from 6.6 to 40.9 cm, with an average of 22.71 cm.
2.3 CO2 concentrations and soil diffuse flux measurements
Soil CO2 flux was measured with an accumulation chamber near the base of the tree (generally within 5 m, terrain permitting) at three different points and then averaged to provide a single CO2 flux value to compare to the 13C measurement of the corresponding tree sample. This technique is intended to provide a simple relative way to compare the CO2 exposure of different trees, as a tree with high CO2 flux near its base should experience consistently higher CO2 concentrations than a tree with lower CO2 flux. We also measured concentrations at ground level and 1.5–2.0 m above ground level, though these were expectedly highly variable in time and location. We analyzed CO2 fluxes, not concentrations, because the diffuse emissions of excess volcanic CO2 through the soil, fed from a deep magma source and dependent on the location of constant deep geological permeability, are highly invariant in time compared to under-canopy air concentrations. In contrast, instantaneous concentration measurements in the sub-canopy air are modulated by many factors, including meteorology, respiration of vegetation and animals, uptake by plants for photosynthesis, and diurnal dynamic and slope effects. An approach of instantaneous highly variable concentration measurements is thus not representative of long-term exposure. The approach of measuring the largely invariant soil-to-atmosphere volcanic CO2 fluxes is much more representative of long-term exposure, varying mostly spatially, and the site-to-site differences are therefore more representative of the lifetime of exposure of the trees.
We used a custom-built soil flux chamber system which contained a LI-COR 840A non-dispersive infrared CO2 sensor (LI-COR Inc., Lincoln, NE, USA) to measure soil CO2 flux. A custom-built cylindrical accumulation chamber of defined volume was sealed to the ground and remained connected to the LI-COR sensor. The air within the accumulation chamber was continuously recirculated through the sensor, passing through a particle filter. The sensor was calibrated before deployment and performed within specifications. We recorded cell pressure and temperature; ambient pressure; air temperature; GPS location; timestamps; location description; wind speed and direction; relative humidity; and slope, aspect, and altitude as ancillary data. In typical operation, each measurement site for flux measurements was validated for leaks (visible in the live data stream display as spikes and breaks in the CO2 concentration slope), and potential external disturbances were avoided (such as vehicle traffic, generators, or breathing animals and humans). Measurements were recorded in triplicate for at least 2 min per site. Data reduction was performed using recorded timestamps in the dataset, with conservative time margins to account for sensor response dead time, validated against consistent slope sections of increasing chamber CO2. Fluxes were computed using ancillary pressure and temperature measurements and the geometric chamber constant (chamber volume at inserted depth, tubing volume, and sensor volume). Care was taken to not disturb the soil and overlying litter inside and adjacent to the chamber.
2.4 Leaf function measurements
Chlorophyll fluorescence measurements were conducted on leaves of all three species during the field campaign to obtain information on instantaneous plant stress using an OS30p+ fluorometer (Opti-Sciences Inc., Hudson, NH, USA). Five mature leaves from each individual tree were adapted to the dark for at least 20 min to ensure complete relaxation of the photosystems. After dark adaptation, initial minimal fluorescence was recorded (Fo) under conditions where we assume that the photosystem II (PSII) was fully reduced. Immediately following the Fo measurement, a 6000 µmol m−2 s−1 saturation pulse was delivered from an array of red LEDs at 660 nm to record maximal fluorescence emission (Fm) when the reaction centers are assumed to be fully closed. From this, the variable fluorescence was determined to be (. Fv∕Fm is a widely used chlorophyll fluorescence variable used to assess the efficiency of the PSII and, indirectly, plant stress (Baker and Oxborough, 2004). The five Fv∕Fm measurements were averaged to provide a representative value for each individual tree. Some trees had less than five measurements due to the dark adaptation clips slipping off the leaf before measurements could be taken. Ten trees had four measurements, and another six had three measurements.
The chlorophyll concentration index (CCI) was measured with a MC-100 Apogee Instruments chlorophyll concentration meter (Apogee Instruments, Inc., Logan, UT, USA). The CCI was converted to chlorophyll concentration (µmol m−2) with the generic formula derived by Parry et al. (2014). Depending on availability, between three and six leaves were measured for the CCI for each tree and then averaged to provide a single value for each tree. If leaves were not within reach, a branch was pulled down or individual leaves were shot down with a slingshot and collected. Photosynthetically active radiation was measured at each tree with a handheld quantum meter (Apogee Instruments, Inc., Logan, UT, USA; Supplement Table S2). Stomatal conductance to water vapor, gs (mmol m−2 s−1), was measured between 10:00–14:00 h using a steady-state porometer (SC-1, Decagon Devices, Inc., Pullman, WA, USA), calibrated before use and read in manual mode. This leaf porometer was rated for humidity < 90 %, and humidity was sometimes above this limit during our field work. Consequently, we have fewer stomatal conductance measurements than our other data types.
2.5 Isotopic analysis
We collected wood cores from 31 individual trees at a 1.5 m height using a 5.15 mm diameter increment borer (JIM-GEM, Forestry Suppliers Inc., Jackson, MS, USA). Since no definable tree rings were apparent, we created a fine powder for isotope analysis by drilling holes into dried cores using a dry ceramic drill bit (Dremel) along the outermost 5 cm of wood below the bark, which was chosen to represent the most recent carbon signal for 13C analyses. The fine powder (200 mesh, 0.2–5 mg) was then mixed, and a random sample was used to extract 13C∕12C ratios (to obtain δ13C values against the VPDB standard), which we estimated to be representative of at least the last 2–3 years, based on analogous literature growth rate values: O. xalapensis and A. acuminata range from 0.25 to 2.5 and from 0.6 to 0.9 cm yr−1, respectively (Kappelle et al., 1996; Ortega-Pieck et al, 2011). These rates result in a 5 cm range of at least 2 and 5.5 years, though the high rates were determined for very young trees under very different conditions, and this is explicitly unknown in our study. Since we only sample the most recent years, no isotopic discrimination against atmospheric 13C due to preferential diffusion and carboxylation of 12C was conducted. Rather, we assume that δ13C values are representative of the relative amount of volcanic CO2 vs. atmospheric CO2 sequestered by the tree over the period of growth represented in the sample. δ13C values were determined by continuous-flow dual-isotope analysis using a CHNOS Elemental Analyzer and IsoPrime 100 mass spectrometer at the University of California Berkeley Center for Stable Isotope Biogeochemistry. External precision for C isotope determinations is ±0.10 ‰. Ten δ13C measurements did not have corresponding soil CO2 flux measurements due to the flux measurements being unavailable for the final 2 days of sampling, and another five samples were from trees that showed signs of extreme stress, such as browning leaves or anomalously low fluorescence measurements. Since the purpose of our study was to explore the non-lethal effects of volcanic CO2 on trees, during analysis we excluded all trees that were observed in the field as showing visible signs of stress or being not fully mature. After these exclusions, all remaining tree cores with co-located CO2 flux measurements were from Turrialba.
2.6 Sulfur dioxide probability from satellite data
To assess the likelihood of trees having been significantly stressed in the past by volcanic sulfur dioxide (SO2) from the central crater vents, we took two approaches. First, we were guided by in situ measurements taken in the same areas by Jenkins et al. (2012), who assessed the physiological interactions of SO2 and CO2 on vegetation on the upper slopes of Turrialba and demonstrated a rapid exponential decay of SO2 away from the central vent. Second, for long-term exposure we derived the likelihood of exposure per unit area using satellite data sensitive to SO2 (Fig. 2). The Advanced Spaceborne Thermal Emission and Reflection Radiometer (ASTER), launched in December 1999 on NASA's Terra satellite, has bands sensitive to SO2 emission in the thermal infrared (TIR), at ∼60 m × 60 m spatial resolution. We initially used ASTER Surface Radiance TIR data (AST_09T), using all ASTER observations of the target area over the entirety of the ASTER mission (October 2000 until writing began in late 2017). The TIR bands were corrected for downwelling sky irradiance and converted into units of W m−2 µm−1. For each observation, an absorption product is calculated by subtracting SO2-insensitive from SO2-sensitive bands:
where S is the SO2 index, t is an index representing the time of acquisition, b10 is the radiance at band 10 (8.125–8.475 µm), b11 is the radiance at band 11 (8.475–8.825 µm), and b12 is the radiance at band 12 (8.925–9.275 µm). This is similar to the method of Campion et al. (2010). The granules were then separated into day and night scenes, projected onto a common grid, and then thresholded to S > 0.1 W m−2 µm−1 and converted into a probability (Abrams et al., 2015). The output is a spatial dataset that describes the probability of an ASTER observation showing an absorption feature above a 0.1 W m−2 µm−1 threshold across the entirety of the ASTER observations for day or night separately. The number of scenes varies per target, but they tend to be between 200 and 800 observations in total, over the 17-year time period of satellite observations. However, certain permanent features, such as salt pans, show absorption features in band 11 and therefore have high ratios for the algorithm used. We therefore used a second method that seeks to map transient absorption features. For this method, we subtract the median from each St, yielding a median deviation stack. By plotting the maximum deviations across all observations, we then get a map of transient absorption features; in our case, these are mostly volcanic SO2 plumes, which map out the cumulative position of different plume observations well. To speed up processing, some of the retrieval runs were binned in order to increase the signal-to-noise ratio, since the band difference can be rather noisy.
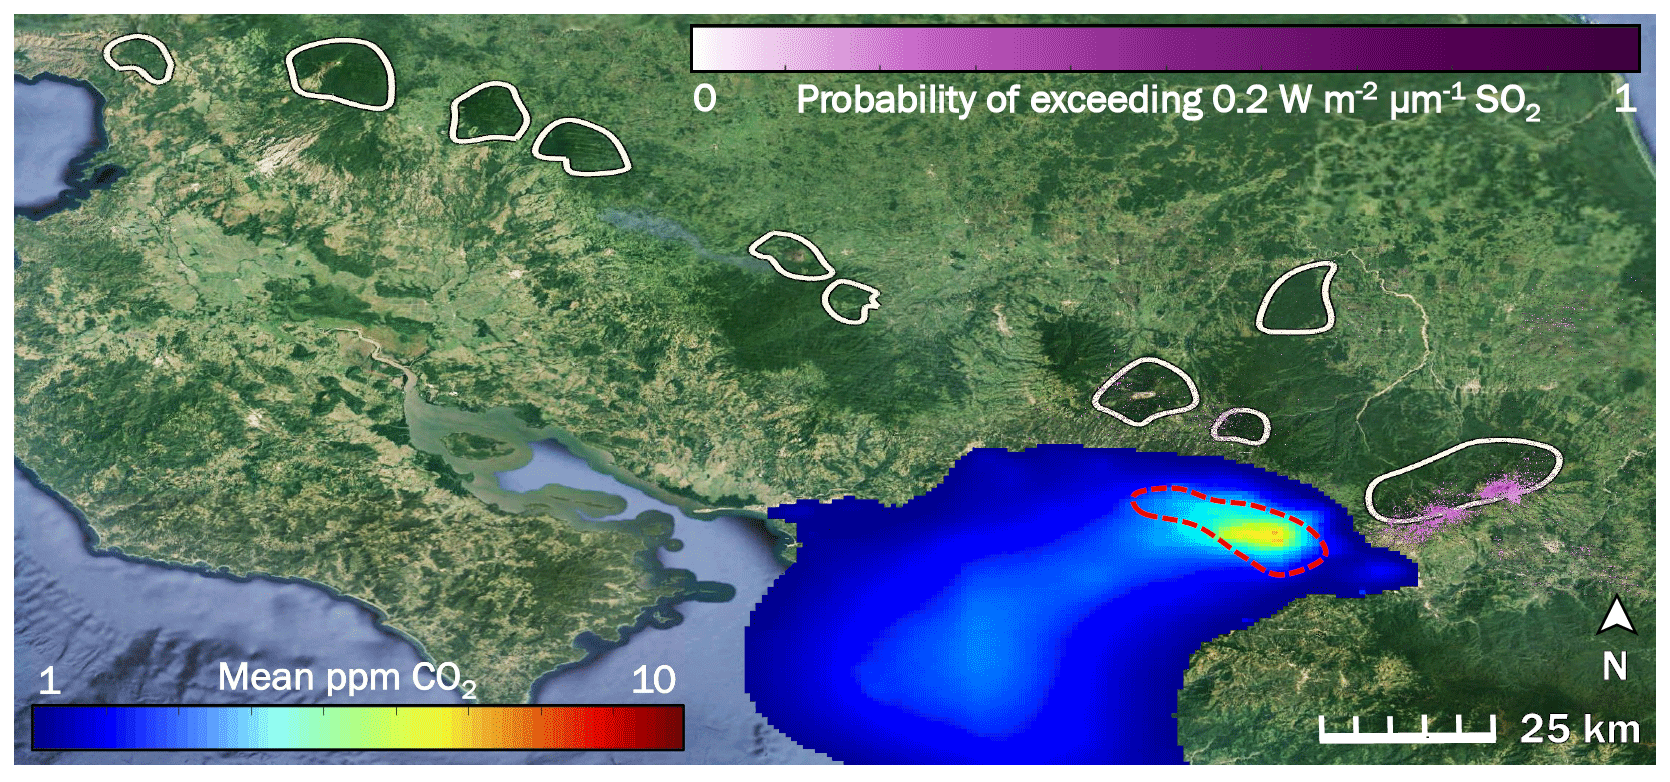
Figure 2The influence of two potentially confounding gases on our study area (right-hand white shape) in Costa Rica is low to non-existent: anthropogenic CO2 from San José (blue to red color scale), and volcanic SO2 (purple color scale). White shapes are drawn around locations of the forested active volcanic edifices in Costa Rica. The red dashed line indicates the rough border of the San José urban area. Prevailing winds throughout the year consistently blow all anthropogenic CO2 away from our study area and from all other white shapes.
2.7 Modeling the anthropogenic CO2 influence from inventory data
We assessed the likelihood of anthropogenic CO2, enhancements of air from San José, Costa Rica's capital and main industrial and population center, influencing our measurements. We used a widely applied FLEXible PARTicle dispersion model (Eckhardt et al., 2017; Stohl et al., 1998, 2005; Stohl and Thomson, 1999) in a forward mode (Stohl et al., 2005), FLEXPART, to simulate the downwind concentrations of CO2 in the atmosphere (e.g., Belikov et al., 2016), due to inventory-derived fossil fuel (FF) emissions in our study area for the year 2015 (Fig. 2). The National Centers for Environmental Prediction (NCEP) – Climate Forecast System Reanalysis (CFSR) – 2.5∘ horizontal resolution meteorology (Saha et al., 2010a, b) and 1 km Open-source Data Inventory for Anthropogenic CO2 (ODIAC; Oda and Maksyutov, 2011) emissions for 2015 were used to drive the FlEXPART model. The CO2 concentrations were generated at a 1 km spatial resolution within three vertical levels of the atmosphere (0–100, 100–300, and 300–500 m) that are possibly relevant to forest canopies in Costa Rica. However, to assess the magnitude of enhancements we only used CO2 concentrations observed within the lowest modeled level of the atmosphere, from 0 to 100 m. Validation of the model with direct observations was not required because we were only interested in ensuring that anthropogenic CO2 dispersed upslope from San José was not having a significant effect on our study area; we were not aiming to capture intra-canopy variability, typically present at tens to hundreds of parts per million variable, which is not relevant to the better mixed, distal single-digit-or-less parts per million signal from San José. The actual concentration of CO2 and any biogenic influence in the modeled area was irrelevant because the spatial distribution of anthropogenic CO2 was the only factor relevant for this test. 2015 was used as a representative year for simulating the seasonal cycle of CO2 concentrations that would be present in any particular year.
3.1 Volcanic CO2 emissions through the soil
We measured CO2 flux emitted through the soil at 66 points over 4 days (Fig. 1). The first eight points were on Irazú, and the rest were located near the Ariete fault on Turrialba. Mean soil CO2 flux values over the entire sampling area varied from 3 to 37 g m−2 d−1, with an average of 11.6 g m−2 d−1 and a standard deviation of 6.6 g m−2 d−1. A 12-bin histogram of mean CO2 flux shows a bimodal right-skewed distribution with a few distinct outliers (Fig. 3). Fluxes were generally larger on Irazú than on Turrialba. This result agrees with previous studies which showed that the north flank of Irazú has areas of extremely high degassing, whereas most of our sampling locations on Turrialba were in areas that had comparatively lower diffuse emissions (Epiard et al., 2017; Stine and Banks, 1991). We used a cumulative probability plot to identify different populations of CO2 fluxes (Fig. 3; Cardellini et al., 2003; Sinclair, 1974).
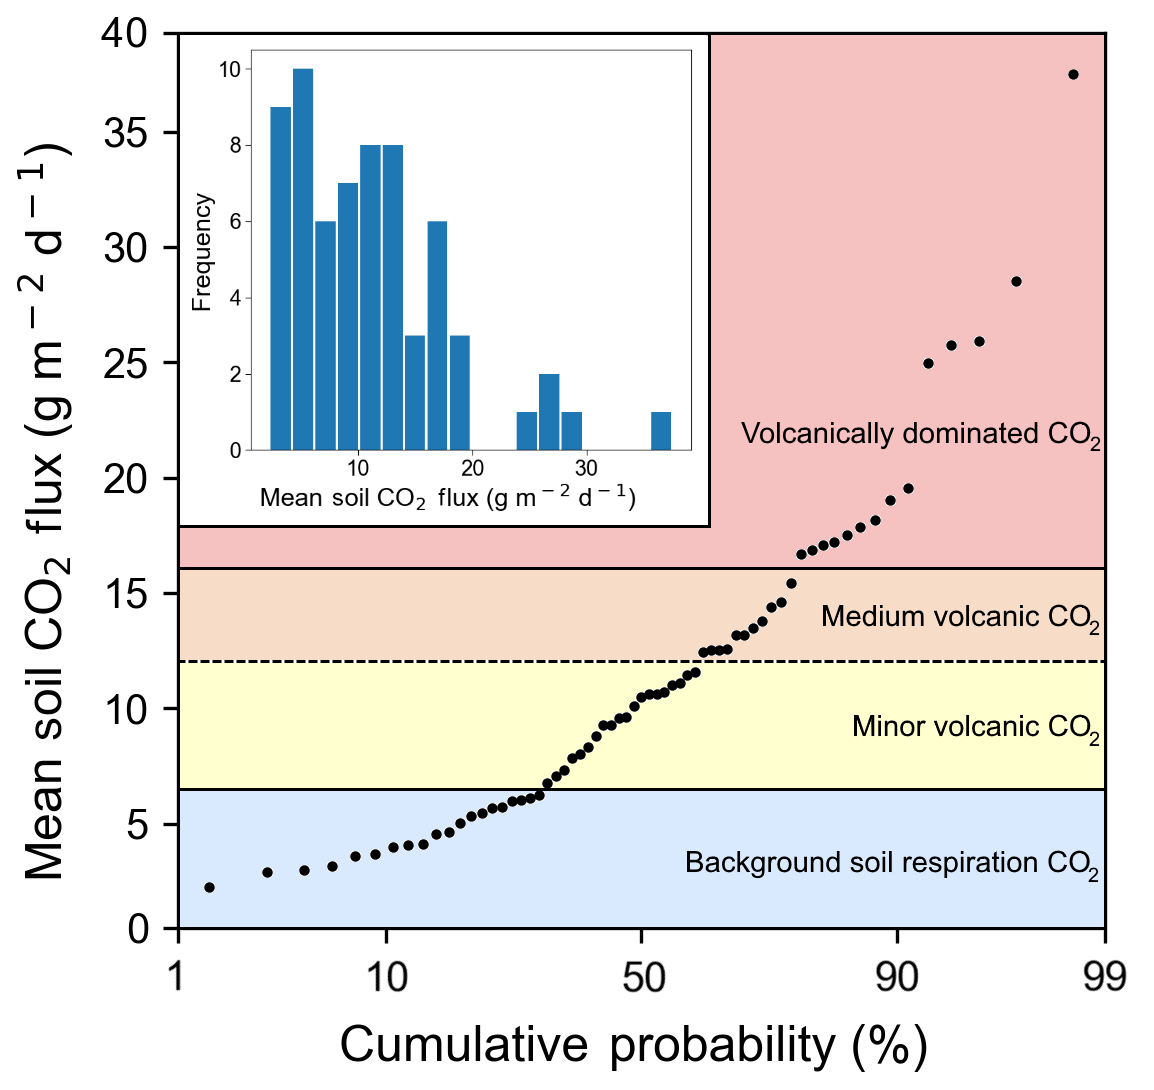
Figure 3Soil CO2 flux into the sub-canopy air of forests on the Turrialba–Irazú volcanic complex is pervasively and significantly influenced by a deep volcanic gas source. At least four different overlapping populations of soil CO2 flux were identified using a cumulative probability plot, where inflection points indicate population boundaries (Sinclair 1974). 69 % of sampling locations (45 total) are exposed to varying degrees of volcanically derived elevated CO2. Populations are color-coded based on the same color scale as Fig. 1.
We created an inventory-based model of anthropogenic CO2 emissions from the San José urban area, parts of which are less than 15 km from some of our sampling locations (Fig. 2). Our model shows that CO2 emitted from San José is blown west to southwest by prevailing winds. Our study area is directly east of San José and as such is unaffected by anthropogenic CO2 from San José, which is the only major urban area near Turrialba and Irazú. Since the trees sampled are spatially close to each other, they are exposed to the same regional background CO2 variability. Additionally, we used ASTER data to map probabilities of SO2 across Costa Rica as a possible confounding factor. The active craters of both Turrialba and Irazú emit measurable amounts of SO2, which is reflected by the high SO2 probabilities derived there (Fig. 2). Tropospheric SO2 quickly converts to sulfate, a well-studied process intensified by the presence of volcanic mineral ash, plume turbulence, and a humid tropical environment (Oppenheimer et al., 1989; Eatough et al., 1994); furthermore, the bulk of the SO2 emissions is carried aloft. Consequently, any remaining SO2 causing acid damage effects on trees at Turrialba is limited to a narrow band of a few 100 m around the mostly quietly steaming central vent, which has been thoroughly ecologically evaluated for acid damage (Jenkins et al., 2012). D'Arcy (2018) has assessed this narrow, heavily SO2-affected area immediately surrounding the central crater vent of Turrialba, which we avoided, and our sampling sites are mostly within their control zone that is not considered majorly affected by SO2 but where diffuse CO2 degassing dominates the excess gas phase (Epiard et al., 2017). Our study area is on the flanks of the volcano, where ASTER-derived SO2 probability is minimal, and SO2 influence not detectable on the ground (Jenkins et al., 2012; Campion et al., 2012). Most other volcanoes in Costa Rica emit little to no SO2 on a decadal timescale, shown by the low or non-existent long-term SO2 probabilities over the other volcanoes in Costa Rica (white shapes in Fig. 2).
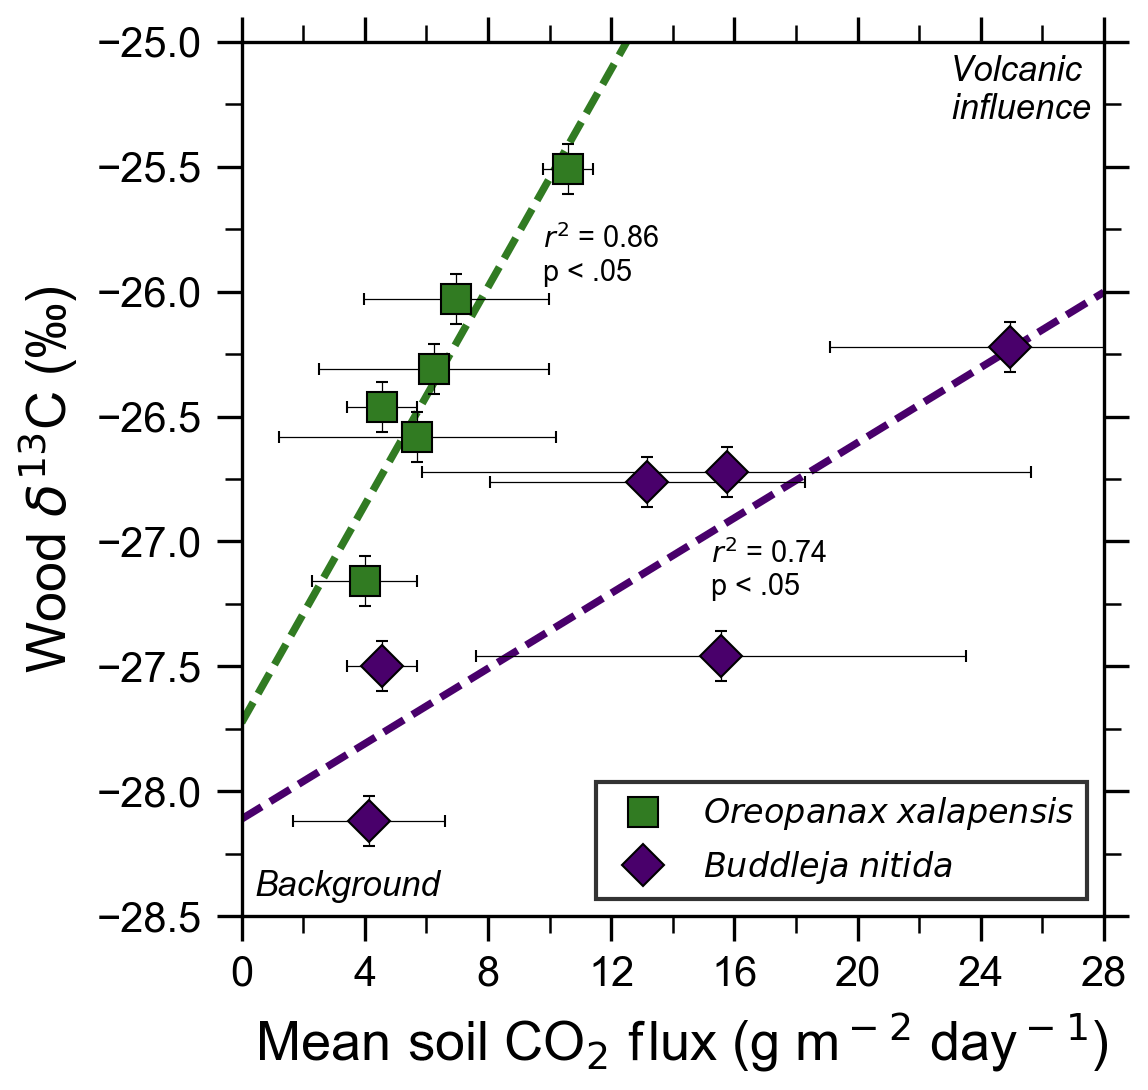
Figure 4Bulk wood δ13C of trees on Costa Rica's Turrialba volcano shows strong correlations with increasing volcanic CO2 flux for two species, O. xalapensis and B. nitida, indicating long-term photosynthetic incorporation of isotopically heavy volcanic CO2. Stable carbon isotope ratio (δ13C) of wood cores are plotted against soil CO2 flux measured immediately adjacent to the tree that the core sample was taken from. Background and volcanic influence labels apply to both axes – higher CO2 flux and heavier (less negative) δ13C values are both characteristic of volcanic CO2 emissions.
3.2 Tree core isotopes
Bulk wood δ13C measurements of all samples in this study, independent of exposure, ranged from −24.03 ‰ to −28.12 ‰, with most being clustered around −26 ‰ (Fig. 4). A five-bin histogram of all δ13C measurements shows a slightly right-skewed unimodal normal distribution, with an average of −26.37 ‰ and a standard deviation of 0.85 ‰. A. acuminata and O. xalapensis have nearly identical averages (−26.14 ‰ and −25.97 ‰, respectively), while B. nitida has a noticeably lighter average of −27.02 ‰. Diffuse excess CO2 emissions throughout the investigation areas reflect a deep volcanic source which typically varies little in time (Epiard et al., 2017), but such diffuse emissions spatially follow geological subsurface structures (Giammanco et al., 1997). Their temporal variability therefore reflects long-term low-amplitude modulation of the volcanic heavy-δ13CO2 signal, and their spatial distribution is mostly constant over tree lifetimes (Aiuppa et al., 2004; Peiffer et al., 2018; Werner et al., 2014), providing a constant long-term spatial gradient of CO2 exposure to the forest canopy. Our data show that in areas where CO2 flux is higher, the wood cores contained progressively higher amounts of 13C for two of the three species. Interestingly, our tree core δ13C showed no relationship with instantaneous stomatal conductance for any species, indicating that no stress threshold was exceeded during measurement across the sample set.
3.3 Plant function (fluorescence, chlorophyll, stomatal conductance)
Our measurements and literature data confirm that ecosystems growing in these locations are consistently exposed to excess volcanic CO2, which may impact chlorophyll fluorescence, chlorophyll concentrations, and stomatal conductance of nearby trees. After excluding visibly damaged trees, leaf fluorescence, expressed as Fv∕Fm, was very high in most samples. Fv∕Fm ranged from 0.75 to 0.89, with most measurements clustering between 0.8 and 0.85 (Fig. 5). The fluorescence data have a left-skewed unimodal distribution. The leaf fluorescence (Fv∕Fm) values for A. acuminata had a strong positive correlation with soil CO2 flux (r2=0.69, p<0.05), while the other two species showed no correlation. No confounding factors measured were correlated with Fv∕Fm for any species. In general, B. nitida had the highest Fv∕Fm values, and A. acuminata and O. xalapensis had similar values except for a few O. xalapensis outliers. Chlorophyll concentration measurements were highly variable, ranging from 260 to 922 µmol m−2, with an average of 558 µmol m−2 and a standard deviation of 162 µmol m−2 (Fig. 6). Chlorophyll concentration had a complicated right-skewed bimodal distribution, likely due to the noticeably different averages for each species. A. acuminata and O. xalapensis both displayed weak correlations between chlorophyll concentration and soil CO2 flux (r2=0.38 and r2=0.28, respectively), but their trend lines were found to be almost perpendicular (Fig. 6). As CO2 flux increased, A. acuminata showed a slight increase in chlorophyll concentration, while O. xalapensis had significant decreases in chlorophyll concentration. B. nitida individuals growing on steeper slopes had significantly lower chlorophyll concentration measurements (r2=0.42, p<0.05) than those on gentler slopes, a trend not expressed by either of the other two species (r2=0.01 for both), demonstrating no significant influence of slope across the majority of samples. Stomatal conductance ranged from 83.5 to 361 mmol H2O m−2 s−1, with an average of 214 mmol H2O m−2 s−1 and a standard deviation of 73.5 mmol H2O m−2 s−1. Distribution was bimodal, with peaks around 150 and 350 mmol H2O m−2 s−1. A. acuminata had a moderate positive correlation (r2=0.51) with soil CO2 flux, but it was not statistically significant due to a lack of data points (Fig. 7); however this is a result consistent with the observed higher chlorophyll concentration (Fig. 6). The other two species displayed no correlation with soil CO2 flux. B. nitida had a moderate negative correlation (r2=0.61) with slope, similar to its correlation between chlorophyll concentration and slope.
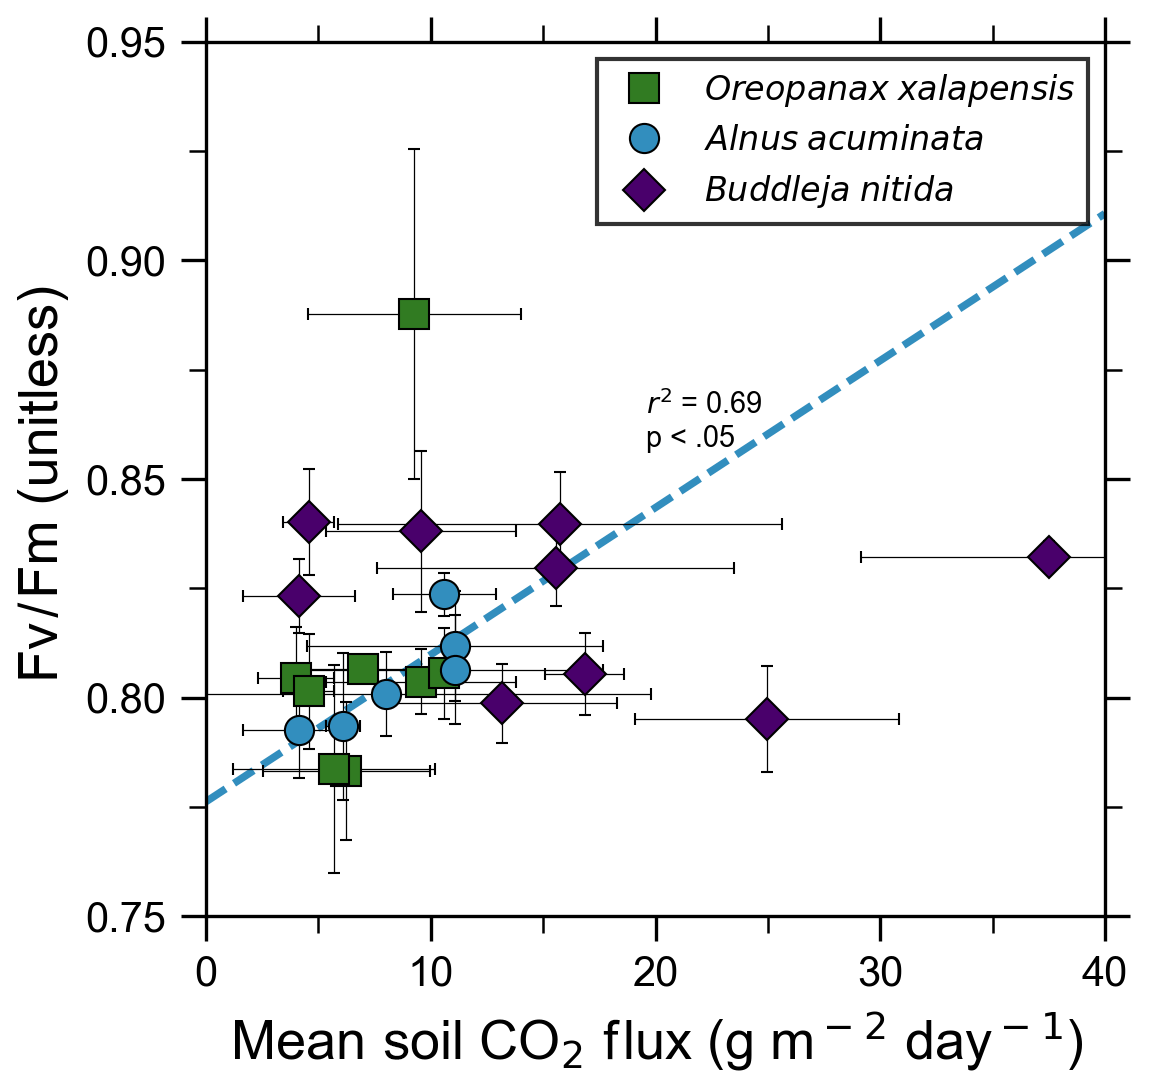
Figure 5Photosynthetic activity of some tree species in old-growth forests on the upper flanks of two active volcanoes in Costa Rica, Turrialba and Irazú, may show short-term response to volcanically elevated CO2. Leaf fluorescence (Fv∕Fm) and soil CO2 flux were strongly correlated for A. acuminata but not for other species.
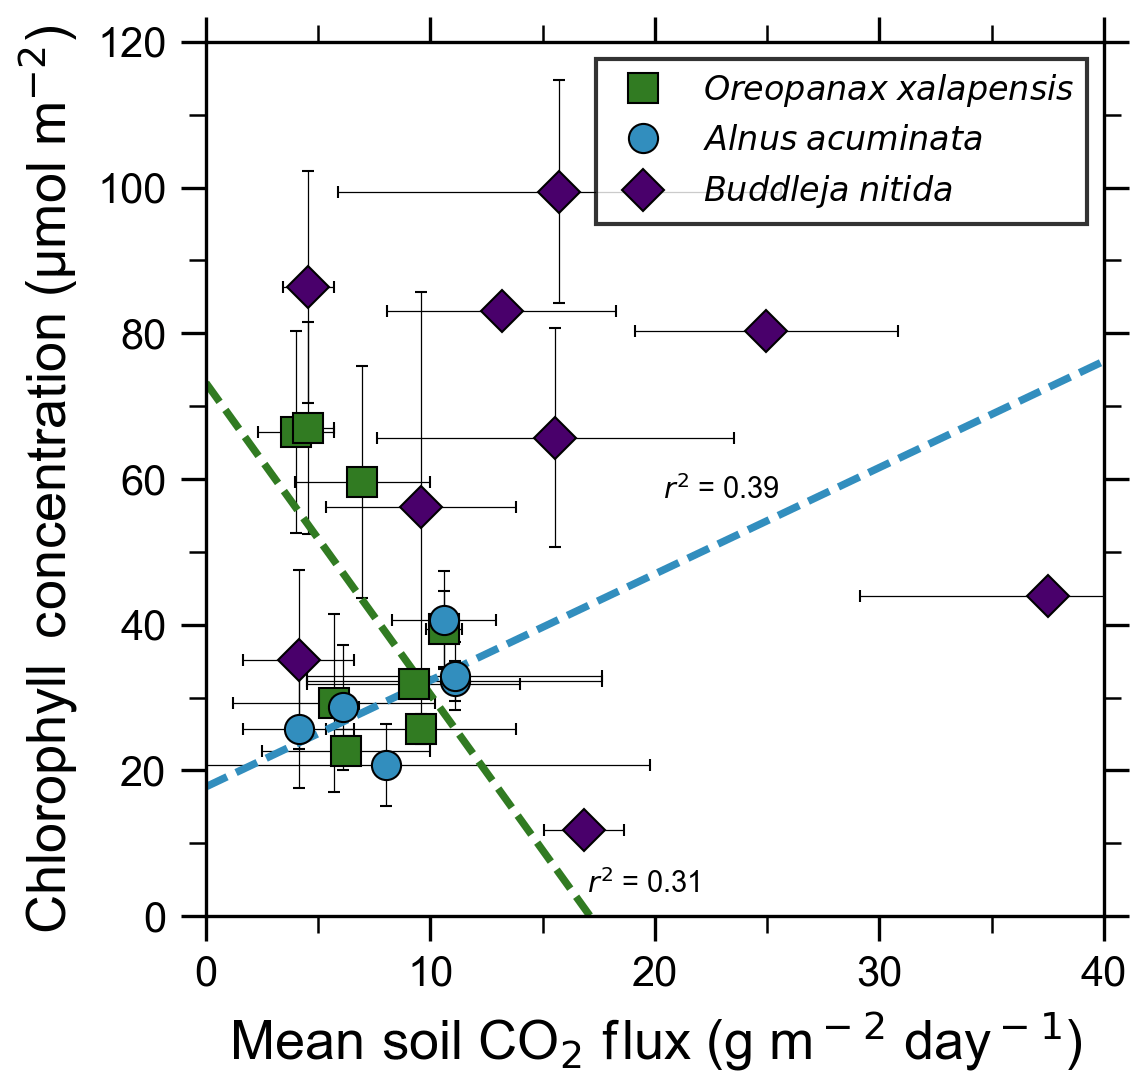
Figure 6Some tree species in old-growth forests on the upper flanks of two active volcanoes in Costa Rica, Turrialba and Irazú, may express their short-term response to volcanically elevated CO2 by producing more chlorophyll. A species that showed strong short-term response (A. Acuminata; Fig. 5) also shows a positive correlation between chlorophyll concentration and mean soil CO2 flux.
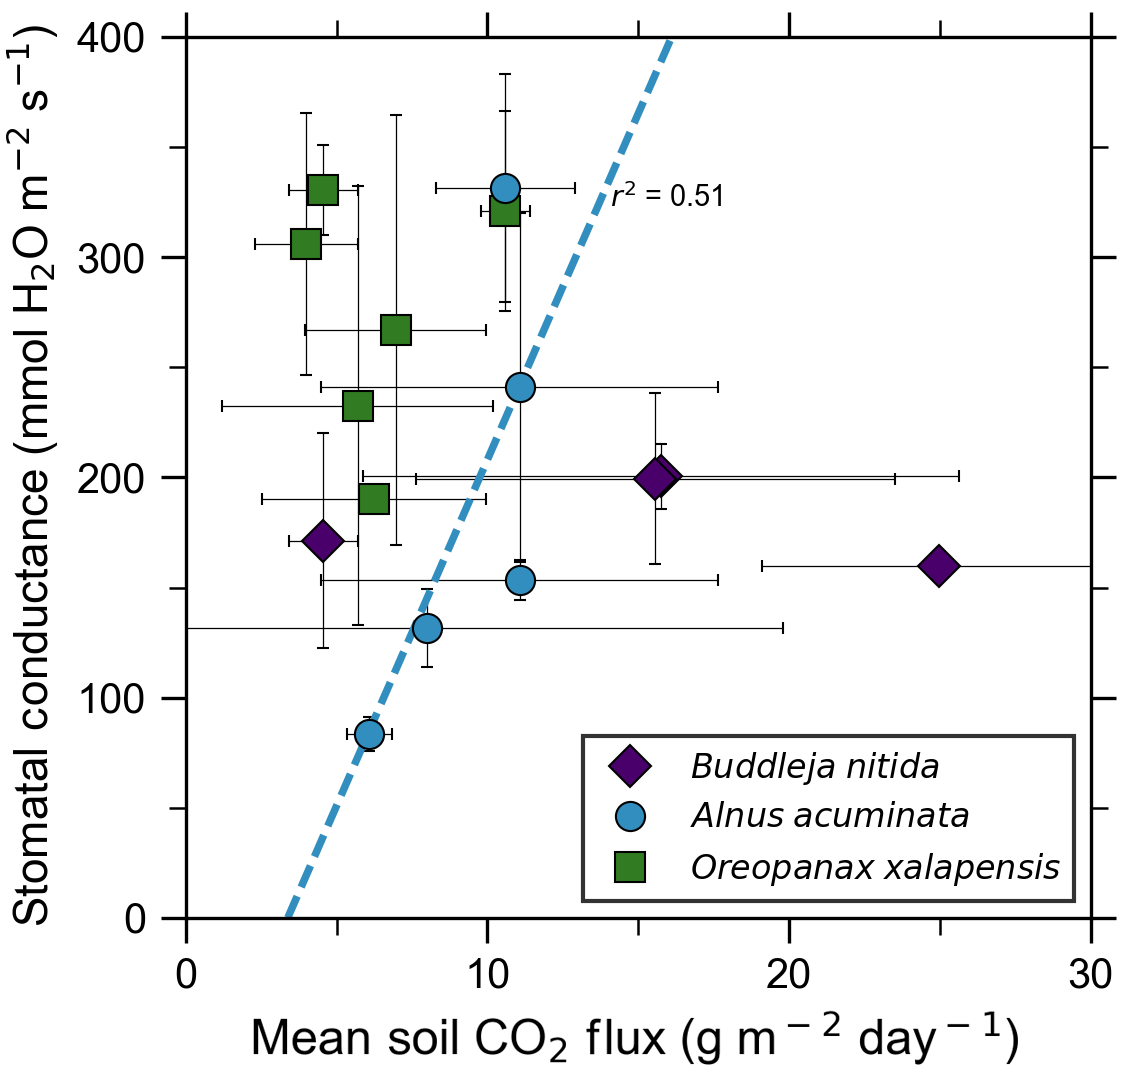
Figure 7Leaf stomatal conductance of a tree species that strongly responds to volcanically elevated CO2 (Figs. 5, 6) has positive correlations with volcanic CO2 flux, consistent with increased gas exchange.
4.1 Long-term plant uptake in volcanic CO2
Turrialba and Irazú continuously emit CO2 through their vegetated flanks, but prior to this study it was unknown if the trees growing there were utilizing this additional isotopically heavy volcanic CO2. All tree cores with corresponding CO2 flux measurements were from areas proximal to the Ariete fault on Turrialba, where atmospheric and volcanic δ13C have significantly different values (−9.2 ‰ and −3.4 ‰, respectively; Malowany et al., 2017). If the trees assimilate volcanic CO2 through their stomata, then we would expect wood δ13C to trend towards heavier values as diffuse volcanic CO2 flux increases. Studies at FACE sites have found that altering the isotopic composition of the air by artificially adding CO2 with a different carbon isotope composition than the atmosphere leads to significant changes in the δ13C value of plant matter and tree rings growing there, leading us to expect similar effects from the naturally added volcanic CO2 (Körner, 2005). It is worth noting that the FACE CO2 (δ13C is −29.7 ‰), is significantly depleted in 13C compared the atmosphere, whereas volcanic CO2 is enriched (δ13C is −3.4 ‰ at Turrialba) compared to atmosphere (Körner, 2005). After excluding damaged samples and stressed trees, δ13C was strongly correlated with soil CO2 flux for both B. nitida and O. xalapensis (Fig. 4). A. acuminata did not have a statistically significant correlation between soil CO2 flux and δ13C, likely because it had the fewest data points and a minimal range of CO2 and δ13C values. The difference in regression slope between B. nitida and O. xalapensis (Fig. 4) may be due to physiological differences across traits or species, and/or due to differences in exposure owing to canopy height differences. Resolving this question would require a much larger multi-species sample size which could only be sufficiently obtained using remote sensing methods. The strong positive correlations between CO2 flux and increasingly heavy δ13C values suggest that the trees have consistently photosynthesized with isotopically heavy excess volcanic CO2 over the last few years and are therefore growing in eCO2 conditions. Assuming that most of the variations in δ13C are caused by incorporation of heavy volcanic CO2, we can calculate the average concentration of the mean volcanic excess CO2 in the air the plants are exposed to with a mass balance equation (Eq. 2):
where Cv is the mean volcanic excess component of the CO2 concentration in air, Ca is the atmospheric “background” (i.e., non-volcanic) CO2 concentration, δa is atmospheric δ13C, δb is the most negative δ13C measurement for the species being studied, δt is the δ13C value for the tree for which volcanic CO2 exposure is being calculated, and δv is the δ13C value of the volcanic CO2. Background wood δ13C is the value of the point for each species with the lowest CO2 flux (Fig. 4), and the other wood δ13C measurement is any other point from the same species. Values for δv, δa, and Ca are taken from Malowany et al. (2017). For the tree core with the highest measured CO2 flux for O. xalapensis, this equation yields a mean excess volcanic CO2 concentration of 115 ppm, bringing the combined mean atmospheric (including volcanic) CO2 concentration tree exposure to potentially around ∼520 ppm. For B. nitida this equation yields 133 ppm of mean excess volcanic CO2 at the highest flux location, for a combined total mean of potentially ∼538 ppm CO2. These numbers may be on the high side as the calculation assumes that carbon isotope discrimination remains constant for all trees within a given species, but they serve as an estimate of the approximate magnitude of the average amount of CO2 that these trees are exposed to. A 14C tree ring study at Mammoth Mountain found an average yearly volcanic excess CO2 exposure of 20–70 ppm over a 15-year period (Lewicki et al., 2014). Turrialba is significantly more active than Mammoth Mountain, so trees growing in high emission areas of Turrialba may be exposed to similar or higher amounts of CO2 than the tree in the Mammoth Mountain study. Additional measurements of tree core δ13C and associated soil CO2 fluxes would help corroborate our observations, which were based on a limited number of data points. Though tree ring 14C content in volcanically active areas has been linked to variations in volcanic CO2 emissions, and comparing patterns of δ13C to 14C measurements for the same wood samples could provide additional confirmation of this finding (Evans et al., 2010; Lefevre et al., 2017; Lewicki et al., 2014), this additional dimension was outside the scope of this exploratory study. However, beyond such pattern confirmation, using 14C dating of trees exposed to naturally isotopically distinct excess CO2 is, in fact, unfortunately not a reliable method for these environments due to the well-known δ14C deficiency in trees exposed to excess volcanic CO2 which is isotopically “dead” with respect to 14C, creating spurious patterns that preclude dating by 14C (e.g., Lefevre et al., 2017; Lewicki et al., 2014).
Our data demonstrate that CO2 fluxes through the soil may be a representative relative measure for eCO2 exposure of overlying tree canopies. Forest canopy exposure to volcanic CO2 will vary over time, as will volcanic eCO2; once emitted through the soil into the sub-canopy atmosphere, the gas experiences highly variable thermal and wind disturbances which significantly affect dispersion of CO2 on minute-to-minute, diurnal, and seasonal timescales (Staebler and Fitzjarrald, 2004; Thomas, 2011). These processes cause in-canopy measurements of CO2 concentration to be highly variable, making instantaneous concentration measurements in a single field campaign not representative of long-term relative magnitudes of CO2 exposure. Soil CO2 fluxes are less tied to atmospheric conditions and are primarily externally modulated by rainfall which increases soil moisture and therefore lowers the soil's gas permeability (Camarda et al., 2006; Viveiros et al., 2009). These fluxes can also be affected by variations in barometric pressure, but both of these factors are easily measurable and therefore can be factored in when conducting field work (Viveiros et al., 2009). Assuming the avoidance of significant rainfall and pressure spikes during sampling (measurements were conducted in the dry season and no heavy rains or significant meteorological variations in pressure occurred during field work), measuring the input of CO2 into the sub-canopy atmosphere as soil CO2 fluxes is therefore expected to better represent long-term input and exposure of tree canopies to eCO2 than direct instantaneous measurements of sub-canopy CO2 concentration. Previous studies at Turrialba have shown that local volcanic CO2 flux is relatively constant on monthly to yearly timescales (de Moor et al., 2016). Therefore, current soil CO2 fluxes should give relatively accurate estimates of CO2 exposure over time. This paper corroborates that expectation by demonstrating strong spatial correlations between volcanically enhanced soil CO2 emissions with co-located stable carbon isotope signals of these emissions documented in the trees' xylem.
A study at the previously mentioned Mammoth Mountain tree kill area examined the connection between δ13C and volcanic CO2 fluxes but focused on the difference between trees killed by extreme CO2 conditions and those that were still alive (Biondi and Fessenden, 1999). They concluded that the changes in δ13C that they observed were due to extreme concentrations of CO2 (soil CO2 concentrations of up to 100 %) impairing the functioning of root systems, leading to closure of stomata and water stress (Biondi and Fessenden, 1999). CO2 does not inherently harm trees, but the extreme CO2 concentrations (up to 100 % soil CO2) at the Mammoth Mountain area caused major soil acidification, which led to the tree kill (McGee and Gerlach, 1998). We have evidence that those acidification processes are not affecting our δ13C measurements and that variations in our δ13C measurements are more likely to be caused by the direct photosynthetic incorporation of isotopically heavy volcanic CO2. Our δ13C measurements have no statistically significant correlation with stomatal conductance, which suggests that our heavier δ13C measurements are not linked to stomatal closure. None of the trees included in the analysis displayed obvious signs of stress, from water or other factors, as indicated by their high fluorescence and chlorophyll concentration values and the lack of visible indicators of stress; specifically, our values of Fv∕Fm ∼0.8 indicate that the PSII was operating efficiently in most of the trees we measured (Baker and Oxborough, 2004). The Mammoth Mountain tree kill areas have higher CO2 fluxes by several orders of magnitude (well over 10 000 g m−2 d−1) than the areas we sampled (up to 38 g m−2 d−1), making it much more likely that stress from soil acidification causes stomatal closure and affects wood δ13C measurements at Mammoth Mountain (Biondi and Fessenden, 1999; McGee and Gerlach, 1998; Werner et al., 2014). In contrast, most of the diffuse degassing at Turrialba does not lead to soil acidification or pore space saturation, as is evident in our own and others' field data (e.g., Epiard et al., 2017). Thus, changes in our δ13C values are best explained by direct photosynthetic incorporation of isotopically heavy volcanic CO2. To the best of our knowledge, this is the first time that a direct correlation between volcanic soil CO2 flux and wood δ13C has been documented. Future studies should explore this correlation further, as our findings are based on a limited sample size.
4.2 Short-term species response to eCO2
Short-term plant functional responses at the leaf level to elevated CO2 were highly species-dependent. B. nitida had no statistically significant functional responses to soil CO2 flux, and O. xalapensis only had a weak negative correlation between soil CO2 flux and chlorophyll concentration (Fig. 6). A. acuminata, a nitrogen-fixing species, was the only species with a consistent and positive functional response to elevated CO2, displaying a strong positive correlation with fluorescence and a weak positive correlation with chlorophyll concentration and stomatal conductance (Figs. 5–7). Previous studies which linked changes in the NDVI to pre-eruptive volcanic activity on the flanks of Mt. Etna and Mt. Nyiragongo support our observation of a correlation between plant function and volcanic CO2 flux (Houlié et al., 2006; Seiler et al., 2017). This link raises the question of why only one of three species displayed strong functional responses to volcanic CO2. The lack of response in B. nitida and O. xalapensis could be due to nitrogen limitation, a factor that would not affect A. acuminata due to its nitrogen-fixing capability. Previous studies have found that nitrogen availability strongly controls plant responses to both naturally and artificially elevated CO2 concentrations in a variety of ecosystems, including grasslands and temperate forests (Garten et al., 2011; Hebeisen et al., 1997; Lüscher et al., 2000; Norby et al., 2010; Tognetti et al., 2000). Nitrogen limitation has been posited to be an important factor in tropical montane cloud forests and may be contributing to the lack of responses in B. nitida and O. xalapensis (Tanner et al., 1998). Due to the exploratory nature of our study, we do not have a large enough dataset to conclude that the nitrogen-fixing capability of species like A. acuminata is the cause for its positive response to volcanically elevated CO2 concentrations, as has been speculated before (Schwandner et al., 2004), but it is a possible correlation that deserves further investigation.
4.3 Time constraints
To support these results, we further assessed the possibility of effects of time constraints on growth rates and isotopic signals, despite the compelling spatial variability in the independent variable (naturally isotopically labeled excess volcanic CO2) in our study (Helle and Schleser, 2004; Verheyden et al., 2004). As tropical trees typically lack tree rings, it is difficult to directly constrain the precise time period that the data represent. However, since we sampled from the outside in, all the samples appear to at least have the most recent growth period in common. To assess how far back in time our samples could likely represent, we compared our sampled core depths to reported growth rates for the same species in similar environments. Reported growth rates for two of our species, O. xalapensis and A. acuminata, range from 0.25 to 2.5 and 0.6 to 0.9 cm yr−1, respectively (Kappelle et al., 1996; Ortega-Pieck et al., 2011). Given that our samples are bulk measurements of the outer 5 cm of wood, each sample would represent between 2 and 5.5 years, although the conditions that these growth rates were measured in were different than in our study. Clear time constraints would be necessary for higher resolution analysis, but this need is somewhat mitigated by the continuous, long-term, and, over multiple decades, mostly invariant nature of diffuse volcanic CO2 emissions, which is completely independent of any non-volcanic environmental influences on growth rates. By providing an upper and lower bound in the expected growth span represented in our samples, we believe that these samples represent similar time frames during the continuous exposure to excess volcanic CO2 over the lifetimes of the trees sampled. Due to the continuous nature of the volcanic CO2 enhancement, we are not investigating and analyzing transient events, and our results instead represent spatial variability in excess CO2 availability averaged over similar time periods.
Although we do not believe that our samples represent a long enough time period for long-term variations in δ13C (Suess effect) to be relevant, if it does affect our samples, it would be beneficial for detection of volcanic CO2, as the Suess effect is gradually increasing the gap between atmospheric and volcanic δ13C. Since our δ13C values likely represent several years of growth, small-scale temporal variations in excess volcanic CO2 release are unlikely to significantly impact the results. Larger trees tend to grow slower than smaller trees, so the outer 5 cm of wood should represent a longer time period in larger trees. Thus, if temporal variations had a significant effect on our δ13C measurements, we would expect this to be represented by some correlation between DBH and δ13C, which is not present for any species studied. Three of the five B. nitida individuals measured were very large (150–190 cm DBH), whereas the other two are much smaller (11.5 and 15.3 cm DBH). Although the age and growth rates of these two groups of trees likely vary significantly, we found no correlation between DBH and δ13C, though we did find a strong correlation between the completely independent diffuse excess (volcanic) CO2 flux and wood δ13C. Furthermore, the relationships presented are on a per species basis to avoid complications resulting from different growth rates across species. This is important because δ13C values provide an integral value of assimilated carbon by the entire tree (not just individual leaves). The depth of tree core sample was identical for each species (the outermost part of the trunk), and we can safely assume that the volcanic CO2 exposure has been consistent over the time period under investigation.
Because individual time variability of growth rates can possibly affect these signals as well, future studies that attempt to study tree ring isotopes in this context at higher resolutions will likely require stricter and more detailed time constraints and cell-level stress analysis to average out the effects of long-term variations in δ13C (Suess effect), seasonal cycles, potential short-term transient stress-induced growth rate variations, effects of water use efficiency (WUE), and potential short-term variations in CO2 flux, all of which may result in time-averaged isotopic shifts over different growth periods (Helle and Schleser, 2004; Verheyden et al., 2004). We include these notes as guidance in Sect. 4.4: Lessons learned for future studies. Despite the additional difficulty of conducting higher time resolution analysis, this type of study holds great potential for attempting to reconstruct volcanic CO2 histories and to study its potential fertilization effect, due to the completely independent nature of the volcanic excess CO2 supply to the sub-canopy air.
4.4 Lessons learned for future studies
This exploratory study reveals significant new potential for future studies to utilize the volcanically enhanced CO2 emissions approach to study tropical ecosystem responses to eCO2 – one of the largest uncertainties in climate projections. Costa Rica's volcanoes are host to large areas of relatively undisturbed rainforest, making them ideal study areas for examining responses of ecosystems to eCO2. However, there are several challenges that future studies should take into consideration if attempting to expand upon this preliminary study. Given the enormous tropical species diversity and the need to control for confounding factors, large datasets will be needed to answer these questions conclusively. One open question, for example, is how WUE in upper and lower canopy leaves of the same and different individuals within a species may affect isotopic sequestration of CO2. Since the excess volcanic CO2 is naturally isotopically labeled, this could be assessed by a much more detailed (by individual tree leaf, branch, and xylem) core study coupled with long-term measurements of evapotranspiration, heat stress, and stomatal conductance, the last of which in our study showed no significant correlation with the δ13C signal in the wood cores across spatial gradients. Field data can be difficult to acquire in these rugged and challenging environments. A remote sensing approach using airborne measurements, validated by targeted representative ground campaigns, could provide sufficiently large datasets to represent species diversity and conditions appropriately. Many of the data types that would be useful for this type of study can be acquired from airborne platforms, and remote sensing instruments can quickly produce the massive datasets required to provide more comprehensive answers to these questions. A recent meta-analysis showed that studies at natural CO2-producing springs and FACE experiments have found similar results in a variety of plant traits, which significantly strengthens the case that volcanoes are a potentially extremely valuable resource for determining plant responses to elevated CO2 concentrations (Saban et al., 2019). While the spring studies have yielded valuable results, volcanoes could offer several advantages over springs for future studies. Active volcanoes are significantly larger systems than non-volcanic springs and often feature several CO2-producing springs and also several dry gas seeps; this offers more data, more control points for comparison, greater species diversity, and greater potential for comprehensive measurements of a statistically meaningful dataset from remote sensing platforms. Due to their volcanic hazard potential, volcanoes are also more likely to already have long-term volcanological monitoring programs for CO2 fluxes and ecological disturbances, which may be utilized to analyze the long-term effects of enhanced levels of CO2 emissions on these volcanically active tropical ecosystems.
Our results also offer significant new tools for the volcanology, where reconstructing past volcano behavior through eruption histories is hampered by severe preservation gaps in the stratigraphic record. A strong link between δ13C and volcanic CO2 could be a game changer by establishing long-term histories of volcanic CO2 emission variations. These proxy signals could be traced back in time using living and preserved dead trees in order to fill gaps in the historical and monitoring records – a boon for volcano researchers and observatories to improve eruption prediction capabilities (Newhall et al., 2017; Pyle, 2017; Sparks et al., 2012). While variations in tree ring 14C content have been shown to correlate well with variations in volcanic CO2 flux (Evans et al., 2010; Lefevre et al., 2017; Lewicki and Hilley, 2014), 14C is relatively expensive to measure, limiting the spatial and temporal coverage of data that can be acquired. 13C is an inexpensive alternative to 14C and can be measured at more laboratories, allowing for substantially more data to be acquired. Some previously mentioned studies (Lefevre et al., 2017; Pasquier-Cardin et al., 1999) have found correlations between 13C and 14C in plants that have incorporated volcanic CO2, strengthening the potential for using 13C in this type of study. Further development of the 13C approach to tracking volcanic CO2 emissions would prove beneficial to future studies attempting to use plants to study large areas and timescales of volcanic degassing. Independent validation, and calibration by wood core dendrochronology via 14C, tree rings, or chemical event tracers like sulfur isotopes, could significantly advance the concept of using wood carbon as an archive of past degassing activity. Crucially, these tree ring archives could provide temporal records of degassing at dangerous volcanoes which have previously been poorly monitored or not monitored at all, significantly improving the accuracy of hazard assessments. Furthermore, knowledge of the short-term real-time response of leaves to diffusely emitted eCO2, which is more likely to represent deeper processes inside volcanoes than crater-area degassing (Camarda et al., 2012), may permit the use of trees as sensors of transient changes in volcanic degassing indicative of volcanic reactivation and deep magma movement possibly leading up to eruptions (Camarda et al., 2012; Houlié et al., 2006; Pieri et al., 2016; Schwandner et al., 2017; Seiler et al., 2017; Shinohara et al., 2008; Werner et al., 2013). To the best of our knowledge, we are the first to propose utilizing the combination of short-term leaf functional responses to volcanic CO2 with long-term changes in δ13C values of wood for assessment of past and present volcanic activity in a single study.
Multiple areas of dense tropical forest on two Costa Rican active volcanoes are consistently and continuously exposed to volcanically elevated levels of atmospheric CO2, diffusively cold emitted through soils into overlying forests. These isotopically heavy volcanic CO2 emissions, which are mostly invariant, not accompanied by acidic gases, and independent of processes affecting growth rates, are well correlated with increases in heavy carbon signatures in wood cores from two species of tropical trees, possibly suggesting long-term incorporation of enhanced levels of volcanically emitted CO2 into biomass. Each tree studied was co-located with a soil CO2 flux measurement, and their soil CO2 flux signals vary spatially around a continuous long-term local natural excess volcanic CO2 source, which creates a local CO2 gradient within which all the sampled trees are found. The excess volcanic CO2 through local fault-bound gas seeps provides continuous exposure to all sampled trees over timescales much greater than the lifetimes of individual trees. Based on our limited exploratory measurements, confounding factors that are known to influence δ13C values in wood appear not to have significantly affected our measurements, indicating that the heavier wood δ13C values could be caused by photosynthetic incorporation of volcanic excess CO2. One of the three species studied (A. acuminata) has consistent positive correlations between instantaneous plant function measurements and diffuse CO2 flux measurements, indicating that short-term variations in elevated CO2 emissions may measurably affect trees growing in areas of diffuse volcanic gas emissions. These observations reveal significant potential for future studies to use these areas of naturally elevated CO2 to study ecosystem responses to elevated CO2 and to use trees as sensors of the changing degassing behavior of volcanic flanks, which is indicative of deep magmatic processes.
Data can be found in Tables S1 and S2 in the Supplement or can be requested from Florian Schwandner (florian.schwandner@jpl.nasa.gov).
The supplement related to this article is available online at: https://doi.org/10.5194/bg-16-1343-2019-supplement.
FMS and JBF designed the study, and RRB, FMS, JBF, and ED conducted the field work and collected all samples and data with some of the equipment borrowed from GN, who helped interpret the results. TSM processed the samples for analysis. JPL conducted the SO2 analysis, wrote the related methods subsection, and helped interpret the results. VY modeled the anthropogenic CO2 emissions, wrote the related methods subsection, and helped interpret the results. CAF created the combined figure showing the CO2 and SO2 results and assisted in writing the paper. RRB wrote the publication, with contributions from all co-authors.
The authors declare that they have no conflict of interest.
We are grateful for LI-COR, Inc. (Lincoln, NE, USA) providing us a loaner CO2 sensor for field work in Costa Rica. We thank Rizalina Schwandner for engineering assistance during sensor integration, OVSICORI (Observatorio Vulcanológico y Sismológico de Costa Rica – the Costa Rican volcano monitoring authority) for logistical and permit support, SINAC (Sistema Nacional de Áreas de Conservación – the Costa Rican national parks service) for access to the Turrialba volcano, and Marco Antonio Otárola Rojas (Universidad Nacional de Costa Rica – ICOMVIS) for invaluable help in the field. We also thank three anonymous reviewers, Akira Kagawa, and the handling editor for very helpful and insightful suggestions that led us to improve the paper. Incidental funding is acknowledged from the Sherman W. Hartman Memorial Fund at Occidental College for funding Robert R. Bogue's field expenses as well as the Jet Propulsion Laboratory's YIP (Year-Round Internship Program) and the Jet Propulsion Laboratory Education Office for funding and support for Robert R. Bogue. Florian M. Schwandner's UCLA contribution to this work was supported by Jet Propulsion Laboratory subcontract 1570200. Part of the research described in this paper was carried out at the Jet Propulsion Laboratory at the California Institute of Technology under a contract with the National Aeronautics and Space Administration.
This paper was edited by David Gillikin and reviewed by Akira Kagawa and three anonymous referees.
Abrams, M., Tsu, H., Hulley, G., Iwao, K., Pieri, D., Cudahy, T., and Kargel, J.: 2015. The advanced spaceborne thermal emission and reflection radiometer (ASTER) after fifteen years: review of global products, Int. J. Appl. Earth Obs., 38, 292–301, https://doi.org/10.1016/j.jag.2015.01.013, 2015.
Ainsworth, E. A. and Long, S. P.: What have we learned from 15 years of free-air CO2 enrichment (FACE)? A meta-analytic review of the responses of photosynthesis, canopy properties and plant production to rising CO2, New Phytol., 165, 351–372, https://doi.org/10.1111/j.1469-8137.2004.01224.x, 2005.
Aiuppa, A., Caleca, A., Federico, C., Gurrieri, S., and Valenza, M.: Diffuse degassing of carbon dioxide at Somma–Vesuvius volcanic complex (Southern Italy) and its relation with regional tectonics, J. Volcanol. Geotherm. Res., 133, 55–79, https://doi.org/10.1016/S0377-0273(03)00391-3, 2004.
Alvarado, G. E., Carr, M. J., Turrin, B. D., Swisher, C. C., Schmincke, H.-U., and Hudnut, K. W.: Recent volcanic history of Irazú volcano, Costa Rica: Alternation and mixing of two magma batches, and pervasive mixing, in: Special Paper 412, Volcanic Hazards in Central America, vol. 412, Geological Society of America, 259–276, 2006.
Baker, N. R. and Oxborough, K.: Chlorophyll Fluorescence as a Probe of Photosynthetic Productivity, in: Chlorophyll a Fluorescence, Springer, Dordrecht, 65–82, 2004.
Barquero, R., Lesage, P., Metaxian, J. P., Creusot, A., and Fernández, M.: La crisis sísmica en el volcán Irazú en 1991 (Costa Rica), Rev. Geológica América Cent., 18, 5–18, https://doi.org/10.15517/rgac.v0i18.13494, 1995.
Belikov, D. A., Maksyutov, S., Yaremchuk, A., Ganshin, A., Kaminski, T., Blessing, S., Sasakawa, M., Gomez-Pelaez, A. J., and Starchenko, A.: Adjoint of the global Eulerian–Lagrangian coupled atmospheric transport model (A-GELCA v1.0): development and validation, Geosci. Model Dev., 9, 749–764, https://doi.org/10.5194/gmd-9-749-2016, 2016.
Biondi, F. and Fessenden, J. E.: Response of lodgepole pine growth to CO2 degassing at Mammoth Mountain, California, Ecol. Brooklyn, 80, 2420–2426, 1999.
Burton, M. R., Sawyer, G. M., and Granieri, D.: Deep Carbon Emissions from Volcanoes, Rev. Mineral. Geochem., 75, 323–354, https://doi.org/10.2138/rmg.2013.75.11, 2013.
Camarda, M., Gurrieri, S., and Valenza, M.: CO2 flux measurements in volcanic areas using the dynamic concentration method: Influence of soil permeability, J. Geophys. Res.-Sol. Ea., 111, B05202, https://doi.org/10.1029/2005JB003898, 2006.
Camarda, M., De Gregorio, S., and Gurrieri, S.: Magma-ascent processes during 2005–2009 at Mt Etna inferred by soil CO2 emissions in peripheral areas of the volcano, Chem. Geol., 330/331, 218–227, https://doi.org/10.1016/j.chemgeo.2012.08.024, 2012.
Campion, R., Salerno, G. G., Coheur, P.-F., Hurtmans, D., Clarisse, L., Kazahaya, K., Burton, M., Caltabiano, T., Clerbaux, C., and Bernard, A.: Measuring volcanic degassing of SO2 in the lower troposphere with ASTER band ratios, J. Volcanol. Geotherm. Res., 194, 42–54, https://doi.org/10.1016/j.jvolgeores.2010.04.010, 2010.
Cardellini, C., Chiodini, G., and Frondini, F.: Application of stochastic simulation to CO2 flux from soil: Mapping and quantification of gas release, J. Geophys. Res.-Sol. Ea., 108, 2425, https://doi.org/10.1029/2002JB002165, 2003.
Cawse-Nicholson, K., Fisher, J. B., Famiglietti, C. A., Braverman, A., Schwandner, F. M., Lewicki, J. L., Townsend, P. A., Schimel, D. S., Pavlick, R., Bormann, K. J., Ferraz, A., Kang, E. L., Ma, P., Bogue, R. R., Youmans, T., and Pieri, D. C.: Ecosystem responses to elevated CO2 using airborne remote sensing at Mammoth Mountain, California, Biogeosciences, 15, 7403–7418, https://doi.org/10.5194/bg-15-7403-2018, 2018.
Chiodini, G., Cioni, R., Guidi, M., Raco, B., and Marini, L.: Soil CO2 flux measurements in volcanic and geothermal areas, Appl. Geochem., 13, 543–552, https://doi.org/10.1016/S0883-2927(97)00076-0, 1998.
Cook, A. C., Hainsworth, L. J., Sorey, M. L., Evans, W. C., and Southon, J. R.: Radiocarbon studies of plant leaves and tree rings from Mammoth Mountain, CA: a long-term record of magmatic CO2 release, Chem. Geol., 177, 117–131, 2001.
Cox, P., Pearson, D., B Booth, B., Friedlingstein, P., Huntingford, C., Jones, C., and M Luke, C.: Sensitivity of tropical carbon to climate change constrained by carbon dioxide variability, Nature, 494, 341–344, 2013.
D'Arcy, F., Stix, J., de Moor, J., Rüdiger, J., Diaz, J., Alan, A., and Corrales, E.: Drones Swoop in to Measure Gas Belched from Volcanoes, Eos, 99, doi:10.1029/2018EO102329, 2018.
Delmelle, P. and Stix, J.: Volcanic Gases, edited by: Sigurdsson, H., Houghton, B., Rymer, H., Stix, J., and McNutt, S.: Encylopedia Volcanoes, 1st Edn., Academic Press, San Diego, ISBN: 9780126431407, 803–815, 2000.
Dietrich, V. J., Fiebig, J., Chiodini, G., and Schwandner, F. M.: Fluid Geochemistry of the Hydrothermal System, in: Nisyros Volcano, edited by: Dietrich, V. J., Lagios, E., and Bachmann, O., Springer, Berlin, p. 339, 2016.
Eatough, D. J., Caka, F. M. and Farber, R. J.: The Conversion of SO2 to Sulfate in the Atmosphere, Israel J. Chem., 34, 301–314, https://doi.org/10.1002/ijch.199400034, 1994.
Eckhardt, S., Cassiani, M., Evangeliou, N., Sollum, E., Pisso, I., and Stohl, A.: Source–receptor matrix calculation for deposited mass with the Lagrangian particle dispersion model FLEXPART v10.2 in backward mode, Geosci. Model Dev., 10, 4605–4618, https://doi.org/10.5194/gmd-10-4605-2017, 2017.
Epiard, M., Avard, G., de Moor, J. M., Martínez Cruz, M., Barrantes Castillo, G., and Bakkar, H.: Relationship between Diffuse CO2 Degassing and Volcanic Activity. Case Study of the Poás, Irazú, and Turrialba Volcanoes, Costa Rica, Front. Earth Sci., 5, 14 pp., https://doi.org/10.3389/feart.2017.00071, 2017.
Evans, W. C., Bergfeld, D., McGeehin, J. P., King, J. C., and Heasler, H.: Tree-ring 14C links seismic swarm to CO2 spike at Yellowstone, USA, Geology, 38, 1075–1078, 2010.
Farrar, C. D., Sorey, M. L., Evans, W. C., Howle, J. F., Kerr, B. D., Kennedy, B. M., King, C.-Y., and Southon, J. R.: Forest-killing diffuse CO2 emission at Mammoth Mountain as a sign of magmatic unrest, Nature, 376, 675–678, https://doi.org/10.1038/376675a0, 1995.
Friedlingstein, P., Meinshausen, M., Arora, V. K., Jones, C. D., Anav, A., Liddicoat, S. K., and Knutti, R.: Uncertainties in CMIP5 Climate Projections due to Carbon Cycle Feedbacks, J. Clim., 27, 511–526, https://doi.org/10.1175/JCLI-D-12-00579.1, 2013.
Garten, C. T., Iversen, C. M., and Norby, R. J.: Litterfall 15N abundance indicates declining soil nitrogen availability in a free-air CO2 enrichment experiment, Ecology, 92, 133–139, https://doi.org/10.1890/10-0293.1, 2011.
Giammanco, S., Gurrieri, S., and Valenza, M.: Soil CO2 degassing along tectonic structures of Mount Etna (Sicily): the Pernicana fault, Appl. Geochem., 12, 429–436, https://doi.org/10.1016/S0883-2927(97)00011-5, 1997.
Global Volcanism Program: Volcanoes of the World, v. 4.7.6., edited by: Venzke, E., Smithson. Inst., https://doi.org/10.5479/si.GVP.VOTW4-2013 (last accessed: 20 February 2018), 2013.
Gregory, J. M., Jones, C. D., Cadule, P., and Friedlingstein, P.: Quantifying Carbon Cycle Feedbacks, J. Clim., 22, 5232–5250, https://doi.org/10.1175/2009JCLI2949.1, 2009.
Hattenschwiler, S., Miglietta, F., Raschi, A., and Körner, C.: Thirty years of in situ tree growth under elevated CO2: a model for future forest responses?, Glob. Change Biol., 3, 463–471, https://doi.org/10.1046/j.1365-2486.1997.00105.x, 1997.
Hebeisen, T., Lüscher, A., Zanetti, S., Fischer, B., Hartwig, U., Frehner, M., Hendrey, G., Blum, H., and Nösberger, J.: Growth response of Trifolium repens L. and Lolium perenne L. as monocultures and bi-species mixture to free air CO2 enrichment and management, Glob. Change Biol., 3, 149–160, https://doi.org/10.1046/j.1365-2486.1997.00073.x, 1997.
Helle, G. and Schleser, G. H.: Beyond CO2-fixation by Rubisco – an interpretation of 13C/12C variations in tree rings from novel intra-seasonal studies on broad-leaf trees, Plant Cell Environ., 27, 367–380, https://doi.org/10.1111/j.0016-8025.2003.01159.x, 2004.
Houlié, N., Komorowski, J. C., de Michele, M., Kasereka, M., and Ciraba, H.: Early detection of eruptive dykes revealed by normalized difference vegetation index (NDVI) on Mt. Etna and Mt. Nyiragongo, Earth Planet. Sc. Lett., 246, 231–240, https://doi.org/10.1016/j.epsl.2006.03.039, 2006.
Jenkins, M. W., Krofcheck, D. J., Teasdale, R., Houpis, J., and Pushnik, J.: Exploring the edge of a natural disaster, Open Journal of Ecology, 2, 222–232, https://doi.org/10.4236/oje.2012.24026, 2012.
Kappelle, M., Geuze, T., Leal, M. E., and Cleef, A. M.: Successional age and forest structure in a Costa Rican upper montane Quercus forest, J. Trop. Ecol., 12, 681–698, https://doi.org/10.1017/S0266467400009871, 1996.
Kauwe, M. G. D., Keenan, T. F., Medlyn, B. E., Prentice, I. C., and Terrer, C.: Satellite based estimates underestimate the effect of CO2 fertilization on net primary productivity, Nat. Clim. Change, 6, 892–893, https://doi.org/10.1038/nclimate3105, 2016.
Keeling, C. D.: The Carbon Dioxide Cycle: Reservoir Models to Depict the Exchange of Atmospheric Carbon Dioxide with the Oceans and Land Plants, in: Chemistry of the Lower Atmosphere, edited by: Rasool, S. I., Springer US, Boston, MA, 251–329, 1973.
Körner, C.: Carbon Flux and Growth in Mature Deciduous Forest Trees Exposed to Elevated CO2, Science, 309, 1360–1362, https://doi.org/10.1126/science.1113977, 2005.
Körner, C. and Miglietta, F.: Long term effects of naturally elevated CO2 on mediterranean grassland and forest trees, Oecologia, 99, 343–351, https://doi.org/10.1007/BF00627748, 1994.
Lefevre, J.-C., Gillot, P.-Y., Cardellini, C., Gresse, M., Lesage, L., Chiodini, G., and Oberlin, C.: Use of the Radiocarbon Activity Deficit in Vegetation as a Sensor of CO2 Soil Degassing: Example from La Solfatara (Naples, Southern Italy), Radiocarbon, 60, 1–12, https://doi.org/10.1017/RDC.2017.76, 2017.
Leigh, E. G., Losos, E. C., and Research, N. B. E.: Tropical forest diversity and dynamism: findings from a large-scale network, Chicago, London, The University of Chicago Press, available at: http://trove.nla.gov.au/version/12851528 (last access: 25 September 2017), 2004.
Lewicki, J. L. and Hilley, G. E.: Multi-scale observations of the variability of magmatic CO2 emissions, Mammoth Mountain, CA, USA, J. Volcanol. Geotherm. Res., 284, 1–15, https://doi.org/10.1016/j.jvolgeores.2014.07.011, 2014.
Lewicki, J. L., Hilley, G. E., Shelly, D. R., King, J. C., McGeehin, J. P., Mangan, M., and Evans, W. C.: Crustal migration of CO2-rich magmatic fluids recorded by tree-ring radiocarbon and seismicity at Mammoth Mountain, CA, USA, Earth Planet. Sc. Lett., 390, 52–58, https://doi.org/10.1016/j.epsl.2013.12.035, 2014.
Lüscher, A., Hartwig, U. A., Suter, D., and Nösberger, J.: Direct evidence that symbiotic N2 fixation in fertile grassland is an important trait for a strong response of plants to elevated atmospheric CO2, Glob. Change Biol., 6, 655–662, https://doi.org/10.1046/j.1365-2486.2000.00345.x, 2000.
Malowany, K. S., Stix, J., de Moor, J. M., Chu, K., Lacrampe-Couloume, G., and Sherwood Lollar, B.: Carbon isotope systematics of Turrialba volcano, Costa Rica, using a portable cavity ring-down spectrometer, Geochem. Geophy. Geosy., 18, 2769–2784, https://doi.org/10.1002/2017GC006856, 2017.
Martini, F., Tassi, F., Vaselli, O., Del Potro, R., Martinez, M., del Laat, R. V., and Fernandez, E.: Geophysical, geochemical and geodetical signals of reawakening at Turrialba volcano (Costa Rica) after almost 150 years of quiescence, J. Volcanol. Geotherm. Res., 198, 416–432, https://doi.org/10.1016/j.jvolgeores.2010.09.021, 2010.
Mason, E., Edmonds, M., and Turchyn, A. V.: Remobilization of crustal carbon may dominate volcanic arc emissions, Science, 357, 290–294, 2017.
McGee, K. A. and Gerlach, T. M.: Annual cycle of magmatic CO2 in a tree-kill soil at Mammoth Mountain, California: Implications for soil acidification, Geology, 26, 463–466, 1998.
de Moor, J. M., Aiuppa, A., Avard, G., Wehrmann, H., Dunbar, N., Muller, C., Tamburello, G., Giudice, G., Liuzzo, M., Moretti, R., Conde, V., and Galle, B.: Turmoil at Turrialba Volcano (Costa Rica): Degassing and eruptive processes inferred from high-frequency gas monitoring, J. Geophys. Res.-Sol. Ea., 121, 2016JB013150, https://doi.org/10.1002/2016JB013150, 2016.
Newhall, C. G., Costa, F., Ratdomopurbo, A., Venezky, D. Y., Widiwijayanti, C., Win, N. T. Z., Tan, K., and Fajiculay, E.: WOVOdat – An online, growing library of worldwide volcanic unrest, J. Volcanol. Geotherm. Res., 345, 184–199, https://doi.org/10.1016/j.jvolgeores.2017.08.003, 2017.
Nicholson, E.: Volcanology: An Introduction, Larsen and Keller Education, 2017.
Norby, R. J., Warren, J. M., Iversen, C. M., Medlyn, B. E., and McMurtrie, R. E.: CO2 enhancement of forest productivity constrained by limited nitrogen availability, P. Natl. Acad. Sci. USA, 107, 19368–19373, https://doi.org/10.1073/pnas.1006463107, 2010.
Norby, R. J., De Kauwe, M. G., Domingues, T. F., Duursma, R. A., Ellsworth, D. S., Goll, D. S., Lapola, D. M., Luus, K. A., MacKenzie, A. R., Medlyn, B. E., Pavlick, R., Rammig, A., Smith, B., Thomas, R., Thonicke, K., Walker, A. P., Yang, X., and Zaehle, S.: Model–data synthesis for the next generation of forest free-air CO2 enrichment (FACE) experiments, New Phytol., 209, 17–28, https://doi.org/10.1111/nph.13593, 2016.
Norman, E. M.: Buddlejaceae (Flora Neotropica Monograph No. 81), The New York Botanical Garden Press, 2000.
Oda, T. and Maksyutov, S.: A very high-resolution (1 km × 1 km) global fossil fuel CO2 emission inventory derived using a point source database and satellite observations of nighttime lights, Atmos. Chem. Phys., 11, 543–556, https://doi.org/10.5194/acp-11-543-2011, 2011.
Oppenheimer, C. and Stevenson, D.: Liquid sulphur lakes at Poás volcano, Nature, 342, 790–793, https://doi.org/10.1038/342790a0, 1989.
Ortega-Pieck, A., López-Barrera, F., Ramírez-Marcial, N., and García-Franco, J. G.: Early seedling establishment of two tropical montane cloud forest tree species: The role of native and exotic grasses, Forest Ecol. Manag., 261, 1336–1343, https://doi.org/10.1016/j.foreco.2011.01.013, 2011.
Paoletti, E., Seufert, G., Della Rocca, G., and Thomsen, H.: Photosynthetic responses to elevated CO2 and O3 in Quercus ilex leaves at a natural CO2 spring, Environ. Pollut., 147, 516–524, https://doi.org/10.1016/j.envpol.2006.08.039, 2007.
Parry, C., Blonquist, J. M., and Bugbee, B.: In situ measurement of leaf chlorophyll concentration: analysis of the optical/absolute relationship, Plant Cell Environ., 37, 2508–2520, https://doi.org/10.1111/pce.12324, 2014.
Pasquier-Cardin, A., Allard, P., Ferreira, T., Hatte, C., Coutinho, R., Fontugne, M., and Jaudon, M.: Magma-derived CO2 emissions recorded in 14C and 13C content of plants growing in Furnas caldera, Azores, J. Volcanol. Geotherm. Res., 92, 195–207, https://doi.org/10.1016/S0377-0273(99)00076-1, 1999.
Peiffer, L., Wanner, C., and Lewicki, J. L.: Unraveling the dynamics of magmatic CO2 degassing at Mammoth Mountain, California, Earth Planet. Sc. Lett., 484, 318–328, https://doi.org/10.1016/j.epsl.2017.12.038, 2018.
Pérez, N. M., Hernández, P. A., Padilla, G., Nolasco, D., Barrancos, J., Melían, G., Padrón, E., Dionis, S., Calvo, D., Rodríguez, F., Notsu, K., Mori, T., Kusakabe, M., Arpa, M. C., Reniva, P., and Ibarra, M.: Global CO2 emission from volcanic lakes, Geology, 39, 235–238, https://doi.org/10.1130/G31586.1, 2011.
Pieri, D., Schwandner, F. M., Realmuto, V. J., Lundgren, P. R., Hook, S., Anderson, K., Buongiorno, M. F., Diaz, J. A., Gillespie, A., Miklius, A., Mothes, P., Mouginis-Mark, P., Pallister, M., Poland, M., Palgar, L. L., Pata, F., Pritchard, M., Self, S., Sigmundsson, F., de Silva, S., and Webley, P.: Enabling a global perspective for deterministic modeling of volcanic unrest, available at: https://hyspiri.jpl.nasa.gov/downloads/ (last access: 20 February 2018), 2016.
Pinkard, E. A., Beadle, C. L., Mendham, D. S., Carter, J., and Glen, M.: Determining photosynthetic responses of forest species to elevated CO2: alternatives to FACE, Forest Ecol. Manag., 260, 1251–1261, 2010.
Pyle, D. M.: What Can We Learn from Records of Past Eruptions to Better Prepare for the Future?, in: SpringerLink, Springer, Berlin, Heidelberg, 1–18, 2017.
Quintana-Ascencio, P. F., Ramírez-Marcial, N., González-Espinosa, M., and Martínez-Icó, M.: Sapling survival and growth of coniferous and broad-leaved trees in successional highland habitats in Mexico, Appl. Veg. Sci., 7, 81–88, 2004.
Rizzo, A. L., Di Piazza, A., de Moor, J. M., Alvarado, G. E., Avard, G., Carapezza, M. L., and Mora, M. M.: Eruptive activity at Turrialba volcano (Costa Rica): Inferences from 3He∕4He in fumarole gases and chemistry of the products ejected during 2014 and 2015, Geochem. Geophy. Geosy., 17, 4478–4494, https://doi.org/10.1002/2016GC006525, 2016.
Saban, J. M., Chapman, M. A., and Taylor, G.: FACE facts hold for multiple generations, Evidence from natural CO2 springs, Glob. Change Biol., 25, 1–11, https://doi.org/10.1111/gcb.14437, 2019.
Saha, S., Moorthi, S., Pan, H.-L., Wu, X., Wang, J., Nadiga, S., Tripp, P., Kistler, R., Woollen, J., Behringer, D., Liu, H., Stokes, D., Grumbine, R., Gayno, G., Wang, J., Hou, Y.-T., Chuang, H., Juang, H.-M. H., Sela, J., Iredell, M., Treadon, R., Kleist, D., Van Delst, P., Keyser, D., Derber, J., Ek, M., Meng, J., Wei, H., Yang, R., Lord, S., van den Dool, H., Kumar, A., Wang, W., Long, C., Chelliah, M., Xue, Y., Huang, B., Schemm, J.-K., Ebisuzaki, W., Lin, R., Xie, P., Chen, M., Zhou, S., Higgins, W., Zou, C.-Z., Liu, Q., Chen, Y., Han, Y., Cucurull, L., Reynolds, R. W., Rutledge, G., and Goldberg, M.: NCEP Climate Forecast System Reanalysis (CFSR) 6-hourly Products, January 1979 to December 2010, Bull. Am. Meteorol. Soc., 91, 1015–1058, https://doi.org/10.5065/D69K487J, 2010a.
Saha, S., Moorthi, S., Pan, H.-L., Wu, X., Wang, J., Nadiga, S., Tripp, P., Kistler, R., Woollen, J., Behringer, D., Liu, H., Stokes, D., Grumbine, R., Gayno, G., Wang, J., Hou, Y.-T., Chuang, H., Juang, H.-M. H., Sela, J., Iredell, M., Treadon, R., Kleist, D., Van Delst, P., Keyser, D., Derber, J., Ek, M., Meng, J., Wei, H., Yang, R., Lord, S., van den Dool, H., Kumar, A., Wang, W., Long, C., Chelliah, M., Xue, Y., Huang, B., Schemm, J.-K., Ebisuzaki, W., Lin, R., Xie, P., Chen, M., Zhou, S., Higgins, W., Zou, C.-Z., Liu, Q., Chen, Y., Han, Y., Cucurull, L., Reynolds, R. W., Rutledge, G., and Goldberg, M.: The NCEP Climate Forecast System Reanalysis, Bull. Am. Meteorol. Soc., 91, 1015–1058, https://doi.org/10.1175/2010BAMS3001.1, 2010b.
Saurer, M., Cherubini, P., Bonani, G., and Siegwolf, R.: Tracing carbon uptake from a natural CO2 spring into tree rings: an isotope approach, Tree Physiol., 23, 997–1004, https://doi.org/10.1093/treephys/23.14.997, 2003.
Schimel, D., Stephens, B. B., and Fisher, J. B.: Effect of increasing CO2 on the terrestrial carbon cycle, P. Natl. Acad. Sci. USA, 112, 436–441, https://doi.org/10.1073/pnas.1407302112, 2015.
Schwandner, F. M., Seward, T. M., Gize, A. P., Hall, P. A., and Dietrich, V. J.: Diffuse emission of organic trace gases from the flank and crater of a quiescent active volcano (Vulcano, Aeolian Islands, Italy), J. Geophys. Res.-Atmos., 109, D04301, https://doi.org/10.1029/2003JD003890, 2004.
Schwandner, F. M., Gunson, M. R., Miller, C. E., Carn, S. A., Eldering, A., Krings, T., Verhulst, K. R., Schimel, D. S., Nguyen, H. M., Crisp, D., O'Dell, C. W., Osterman, G. B., Iraci, L. T., and Podolske, J. R.: Spaceborne detection of localized carbon dioxide sources, Science, 358, eaam5782, https://doi.org/10.1126/science.aam5782, 2017.
Seiler, R., Kirchner, J. W., Krusic, P. J., Tognetti, R., Houlié, N., Andronico, D., Cullotta, S., Egli, M., D'Arrigo, R., and Cherubini, P.: Insensitivity of Tree-Ring Growth to Temperature and Precipitation Sharpens the Puzzle of Enhanced Pre-Eruption NDVI on Mt. Etna (Italy), PLOS ONE, 12, e0169297, https://doi.org/10.1371/journal.pone.0169297, 2017.
Sharma, S. and Williams, D.: Carbon and oxygen isotope analysis of leaf biomass reveals contrasting photosynthetic responses to elevated CO2 near geologic vents in Yellowstone National Park, Biogeosciences, 6, 25–31, https://doi.org/10.5194/bg-6-25-2009, 2009.
Shinohara, H., Aiuppa, A., Giudice, G., Gurrieri, S., and Liuzzo, M.: Variation of H2O/CO2 and CO2/SO2 ratios of volcanic gases discharged by continuous degassing of Mount Etna volcano, Italy, J. Geophys. Res.-Sol. Ea., 113, B09203, https://doi.org/10.1029/2007JB005185, 2008.
Sinclair, A. J.: Selection of threshold values in geochemical data using probability graphs, J. Geochem. Explor., 3, 129–149, https://doi.org/10.1016/0375-6742(74)90030-2, 1974.
Sorey, M. L., Evans, W. C., Kennedy, B. M., Farrar, C. D., Hainsworth, L. J., and Hausback, B.: Carbon dioxide and helium emissions from a reservoir of magmatic gas beneath Mammoth Mountain, California, J. Geophys. Res.-Sol. Ea., 103, 15303–15323, https://doi.org/10.1029/98JB01389, 1998.
Sparks, R. S. J., Biggs, J., and Neuberg, J. W.: Monitoring Volcanoes, Science, 335, 1310–1311, https://doi.org/10.1126/science.1219485, 2012.
Staebler, R. M. and Fitzjarrald, D. R.: Observing subcanopy CO2 advection, Agr. Forest Meteorol., 122, 139–156, https://doi.org/10.1016/j.agrformet.2003.09.011, 2004.
Stine, C. M. and Banks, N. G.: Costa Rica Volcano Profile, USGS Numbered Series, US Geological Survey, available at: https://pubs.er.usgs.gov/publication/ofr91591 (last access: 20 February 2019), 1991.
Stohl, A. and Thomson, D. J.: A Density Correction for Lagrangian Particle Dispersion Models, Bound.-Lay. Meteorol., 90, 155–167, https://doi.org/10.1023/A:1001741110696, 1999.
Stohl, A., Hittenberger, M., and Wotawa, G.: Validation of the Lagrangian particle dispersion model FLEXPART against large-scale tracer experiment data, Atmos. Environ., 32, 4245–4264, 1998.
Stohl, A., Forster, C., Frank, A., Seibert, P., and Wotawa, G.: Technical note: The Lagrangian particle dispersion model FLEXPART version 6.2, Atmos. Chem. Phys., 5, 2461–2474, https://doi.org/10.5194/acp-5-2461-2005, 2005.
Symonds, R. B., Gerlach, T. M., and Reed, M. H.: Magmatic gas scrubbing: implications for volcano monitoring, J. Volcanol. Geotherm. Res., 108, 303–341, https://doi.org/10.1016/S0377-0273(00)00292-4, 2001.
Tanner, E. V. J., Vitousek, P. M., and Cuevas, E.: Experimental Investigation of Nutrient Limitation of Forest Growth on Wet Tropical Mountains, Ecology, 79, 10–22, 1998.
Tercek, M. T., Al-Niemi, T. S., and Stout, R. G.: Plants Exposed to High Levels of Carbon Dioxide in Yellowstone National Park: A Glimpse into the Future?, Yellowstone Sci., 16, 12–19, 2008.
Thomas, C. K.: Variability of Sub-Canopy Flow, Temperature, and Horizontal Advection in Moderately Complex Terrain, Bound.-Lay. Meteorol., 139, 61–81, https://doi.org/10.1007/s10546-010-9578-9, 2011.
Tognetti, R., Cherubini, P., and Innes, J. L.: Comparative stem-growth rates of Mediterranean trees under background and naturally enhanced ambient CO2 concentrations, New Phytol., 146, 59–74, https://doi.org/10.1046/j.1469-8137.2000.00620.x, 2000.
Townsend, A. R., Cleveland, C. C., Houlton, B. Z., Alden, C. B., and White, J. W.: Multi-element regulation of the tropical forest carbon cycle, Front. Ecol. Environ., 9, 9–17, https://doi.org/10.1890/100047, 2011.
Verheyden, A., Helle, G., Schleser, G. H., Dehairs, F., Beeckman, H., and Koedam, N.: Annual cyclicity in high-resolution stable carbon and oxygen isotope ratios in the wood of the mangrove tree Rhizophora mucronata, Plant Cell Environ., 27, 1525–1536, https://doi.org/10.1111/j.1365-3040.2004.01258.x, 2004.
Viveiros, F., Ferreira, T., Silva, C., and Gaspar, J.: Meteorological factors controlling soil gases and indoor CO2 concentration: A permanent risk in degassing areas, Sci. Total Environ., 407, 1362–1372, https://doi.org/10.1016/j.scitotenv.2008.10.009, 2009.
Vodnik, D., Thomalla, A., Ferlan, M., Levanič, T., Eler, K., Ogrinc, N., Wittmann, C., and Pfanz, H.: Atmospheric and geogenic CO2 within the crown and root of spruce (Picea abies L. Karst.) growing in a mofette area, Atmos. Environ., 182, 286–295, https://doi.org/10.1016/j.atmosenv.2018.03.043, 2018.
Weng, C., Bush, M. B., and Chepstow-Lusty, A. J.: Holocene changes of Andean alder (Alnus acuminata) in highland Ecuador and Peru, J. Quat. Sci., 19, 685–691, https://doi.org/10.1002/jqs.882, 2004.
Werner, C., Kelly, P. J., Doukas, M., Lopez, T., Pfeffer, M., McGimsey, R., and Neal, C.: Degassing of CO2, SO2, and H2S associated with the 2009 eruption of Redoubt Volcano, Alaska, J. Volcanol. Geotherm. Res., 259, 270–284, https://doi.org/10.1016/j.jvolgeores.2012.04.012, 2013.
Werner, C., Bergfeld, D., Farrar, C. D., Doukas, M. P., Kelly, P. J., and Kern, C.: Decadal-scale variability of diffuse CO2 emissions and seismicity revealed from long-term monitoring (1995–2013) at Mammoth Mountain, California, USA, J. Volcanol. Geotherm. Res., 289, 51–63, https://doi.org/10.1016/j.jvolgeores.2014.10.020, 2014.
Williams-Jones, G., Stix, J., Heiligmann, M., Charland, A., Lollar, B. S., Arner, N., Garzón, G. V., Barquero, J., and Fernandez, E.: A model of diffuse degassing at three subduction-related volcanoes, Bull. Volcanol., 62, 130–142, 2000.
breathe inand are made of volcanic CO2 but also retain that exposure history for decades.