the Creative Commons Attribution 4.0 License.
the Creative Commons Attribution 4.0 License.
 | 04 Sep 2019
Technical note: Interferences of volatile organic compounds (VOCs) on methane concentration measurements
Markku Koskinen
Kaisa Rissanen
Iikka Haikarainen
Tatu Polvinen
Heidi Hellén
Mari Pihlatie
Studies that quantify plant methane (CH4) emission rely on the accurate measurement of small changes in the mixing ratio of CH4 that coincide with much larger changes in the mixing ratio of volatile organic compounds (VOCs). Here, we assessed whether 11 commonly occurring VOCs (e.g. methanol, α- and β-pinene, Δ3-carene) interfered with the quantitation of CH4 by five laser-absorption spectroscopy and Fourier-transformed infrared spectroscopy (FTIR) based CH4 analysers, and quantified the interference of seven compounds on three instruments. Our results showed minimal interference with laser-based analysers and underlined the importance of identifying and compensating for interferences with FTIR instruments. When VOCs were not included in the spectral library, they exerted a strong bias on FTIR-based instruments (64–1800 ppbv apparent CH4 ppmv−1 VOC). Minor (0.7–126 ppbv ppmv−1) interference with FTIR-based measurements were also detected when the spectrum of the interfering VOC was included in the library. In contrast, we detected only minor (<20 ppbv ppmv−1) and transient (< 1 min) VOC interferences on laser-absorption spectroscopy-based analysers. Overall, our results demonstrate that VOC interferences have only minor effects on CH4 flux measurements in soil chambers, but may severely impact stem and shoot flux measurements. Laser-absorption-based instruments are better suited for quantifying CH4 fluxes from plant leaves and stems than FTIR-based instruments; however, significant interferences in shoot chamber measurements could not be excluded for any of the tested instruments. Our results furthermore showed that FTIR can precisely quantify VOC mixing ratios and could therefore provide a method complementary to proton-transfer-reaction mass spectrometry (PTR-MS).
- Article
(2525 KB) - Full-text XML
- BibTeX
- EndNote


Gas analysers based on infrared spectroscopy are increasingly used to study fluxes of CH4 and other trace gases in natural and anthropogenic ecosystems (e.g. Zellweger et al., 2016; Etiope, 2015; Rapson and Dacres, 2014). Laser-absorption spectroscopy based on cavity ring-down spectroscopy (CRDS) or off-axis integrated cavity output spectroscopy (OA-ICOS) is currently considered state of the art by international flux station networks (Franz et al., 2018). These analysers quantify trace gas mixing ratios through absorption at one specific wavelength. Fourier-transformed infrared spectroscopy (FTIR) is another approach to measure trace gas fluxes that is gaining popularity because of lower costs, easier field portability, and great versatility with regards to target compound analytes (e.g. Warlo et al., 2018; Teutscherova et al., 2019; Kandel et al., 2018; Jurasinski et al., 2019). FTIR-based analysers measure a complete infrared absorption spectrum and then quantify the mixing ratio of trace gases through spectral deconvolution using reference spectra for a number of potentially present gases. The capabilities and limitations of both instrument types remain the subject of ongoing research. In particular, the potential for biased measurements due to spectral interference with other gases still needs to be established for various environments and applications (e.g. Rella et al., 2015; Assan et al., 2017; Zhao et al., 2012; Zellweger et al., 2016).
Plants were recently identified as an important component of the natural cycles of CH4 (Keppler et al., 2006; Nisbet et al., 2009; Carmichael et al., 2014). This has led to an increased interest in the role of trees in the CH4 exchange of forests (e.g. Pangala et al., 2017, 2015; Machacova et al., 2016; Pitz et al., 2018; Pitz and Megonigal, 2017). Such studies require precise measurements of CH4 emissions from tree stems and shoots, by enclosing part of a plant and monitoring changes in the mixing ratio of CH4 over time (Covey and Megonigal, 2019). This monitoring of CH4 mixing ratios was traditionally conducted by collecting chamber air samples at different time points, which were then analysed by gas chromatography (e.g. Machacova et al., 2016). More recently, portable analysers based on CRDS, OA-ICOS, or FTIR are increasingly used to measure chamber air CH4 mixing ratios directly in the field (Warner et al., 2017; Pitz and Megonigal, 2017; Pitz et al., 2018). These novel methods have facilitated easier, faster, and more precise measurements of CH4 fluxes, but have also increased vulnerability towards mismeasurements due to spectral interferences. This is especially important in the study of CH4 emissions by plants as plants co-emit a complex mixture of volatile organic compounds (VOCs) at fluxes 2 to 4 orders of magnitude higher than currently reported CH4 fluxes (Rinne et al., 2002; Simpson et al., 1999; Tarvainen et al., 2005; Machacova et al., 2016; Pangala et al., 2017). The degree to which plant-emitted VOCs interfere with CH4 mixing ratio measurements, however, has so far not been evaluated.
In a recent field campaign, we conducted parallel measurements of tree stem CH4 emissions with two distinct methane analysers (Los Gatos Research (LGR) UGGA and GASMET DX4040). The two analysers gave contradicting results, with apparent CH4 fluxes differing in both direction and magnitude (Fig. 1). We hypothesized that these divergent measurements resulted from interferences of VOCs with CH4 measurements. To test this hypothesis, we built a setup to quantify the effect of 11 different VOCs on five commonly used CH4 analysers under controlled conditions. In this communication, we present results from field measurements and laboratory tests as well as a first sensitivity analysis for the impact of VOC interferences on measurements of CH4 fluxes from different ecosystem compartments.
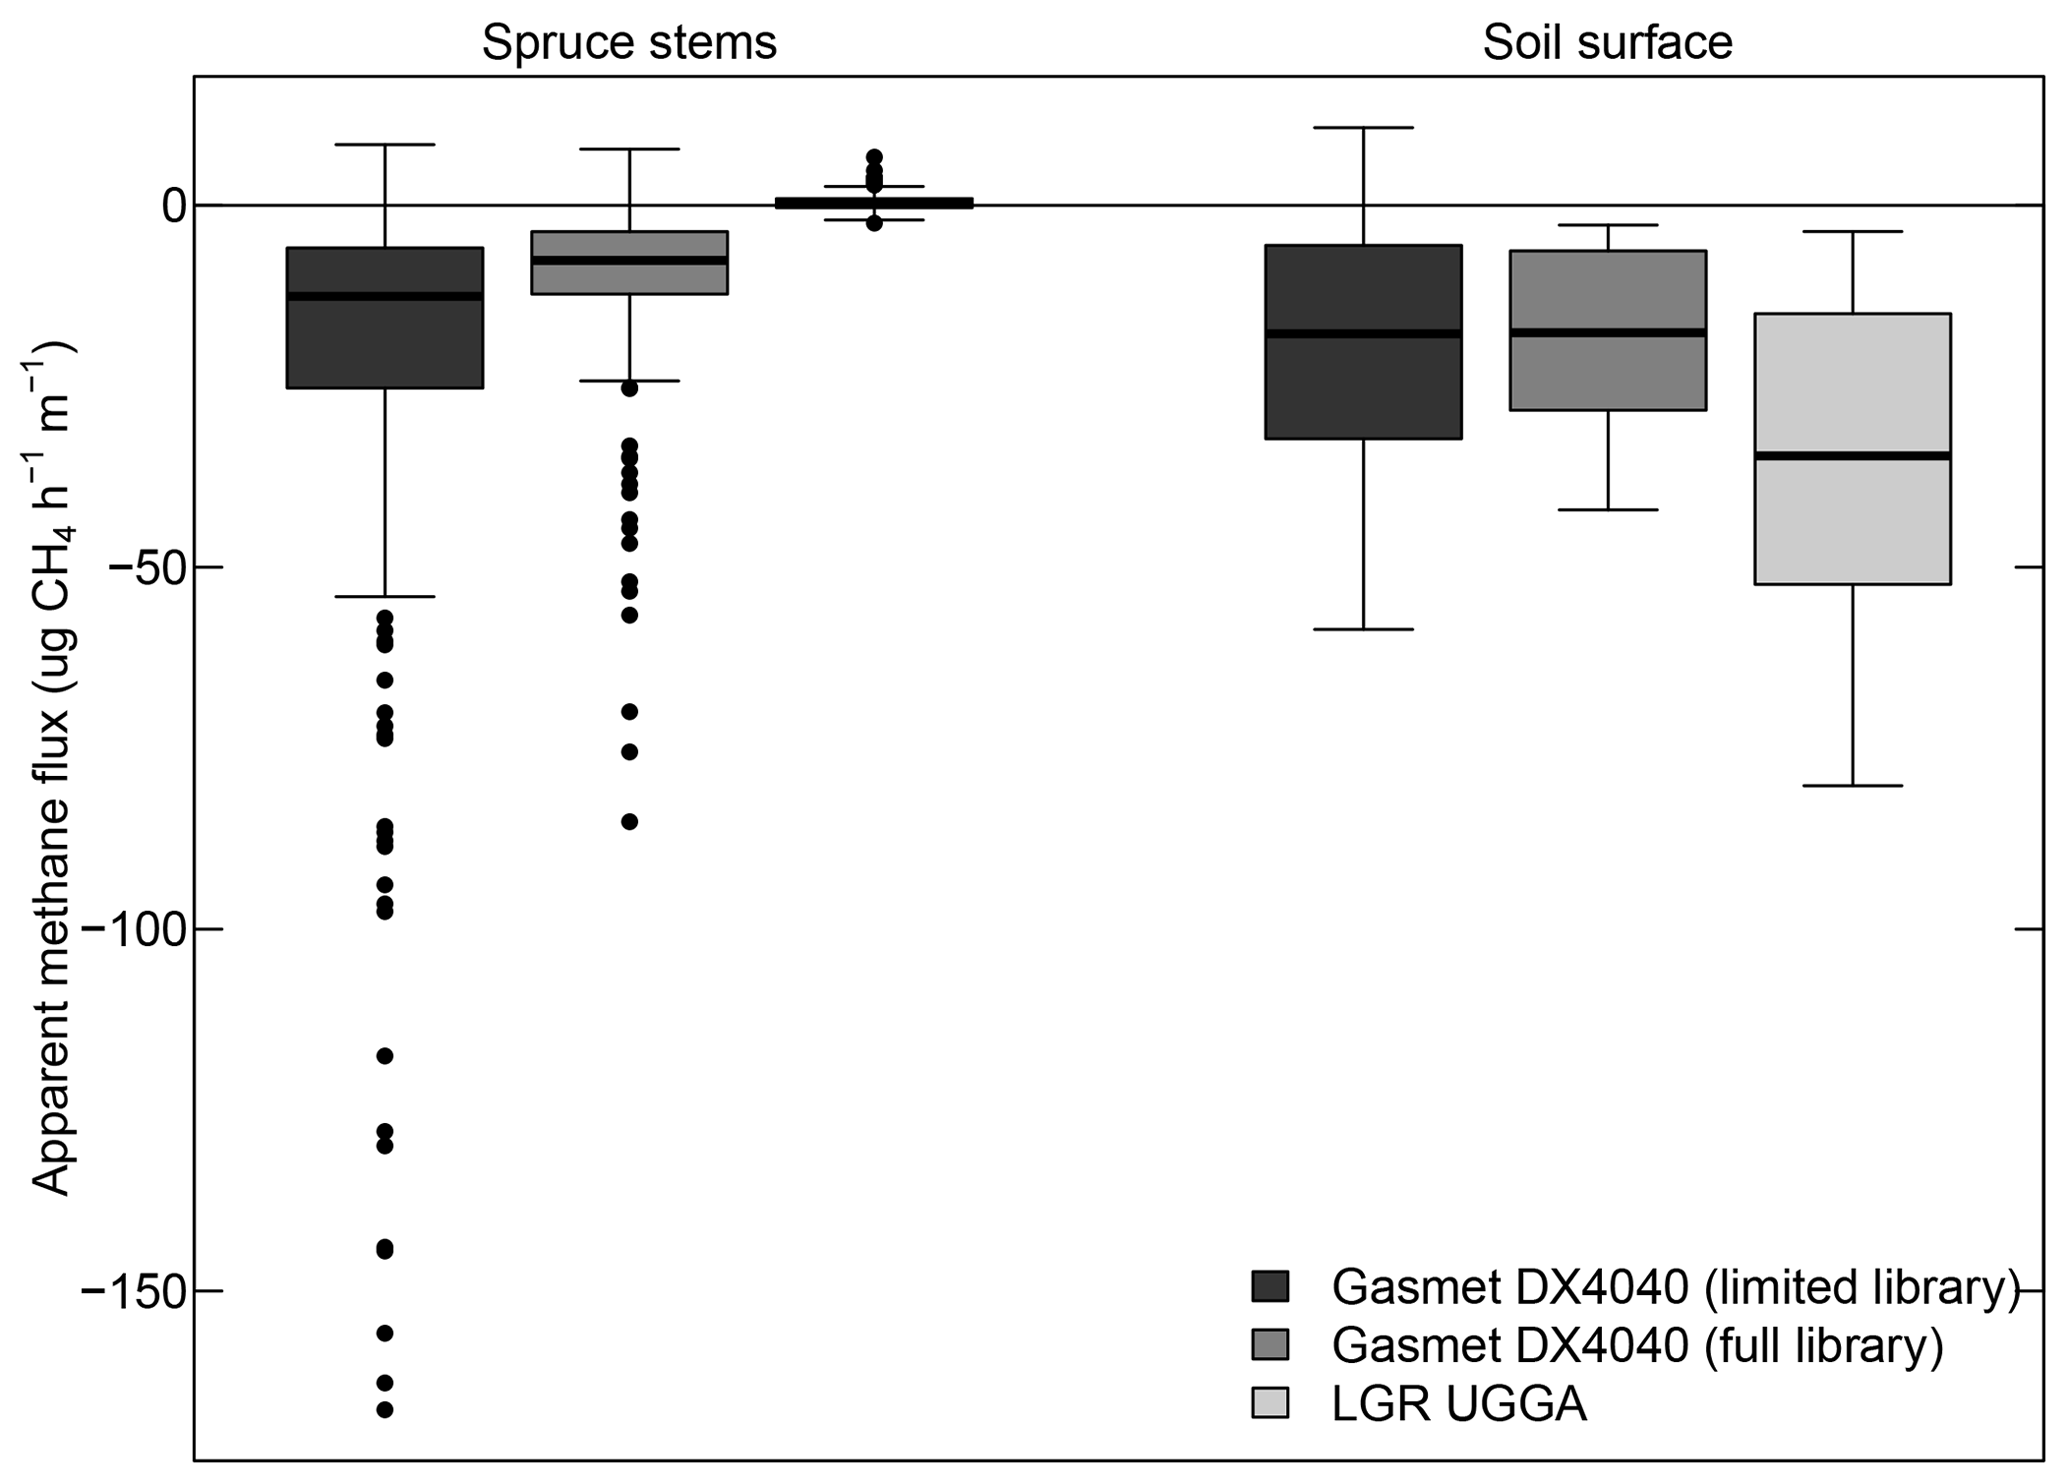
Figure 1Apparent tree stem methane fluxes when quantified with a laser-spectroscopy-based analyser (LGR UGGA) and a FTIR-based analyser (Gasmet DX4040). FTIR-based fluxes are shown calculated based on spectral deconvolution with a minimal library that did not contain VOC spectra (limited library) and with a library that contained spectra of commonly occurring VOCs (full library).
2.1 Field measurements
Field measurements were conducted as part of a larger field campaign in the Skogaryd research forest in southern Sweden (58∘23′ N, 12∘09′ E) (Klemedtsson et al., 2010) in the summer of 2018. We measured spruce stem CH4 emissions from 30 trees at different distances from the main ditch to achieve a gradient of water table levels. The trees were equipped with box chambers to measure stem gas exchange as described in Machacova et al. (2016). CH4 emissions were measured by closing chambers for 20 min and recycling air through one of two portable analysers, a Los Gatos Research (LGR) UGGA OA-ICOS-based analyser and a Gasmet DX4040 FTIR-based multi-compound analyser. CH4 exchange rates were quantified as the increase in CH4 mixing ratio over time, divided by the chamber volume and the stem area. Negative fluxes indicate a net CH4 uptake and positive fluxes a net CH4 release to the atmosphere. Measurements were conducted daily from 2 to 13 June and from 25 July to 5 August 2018, alternating between the two instruments. In addition, we measured soil CH4 fluxes from nine soil collars (0.26 m2) using a static chamber technique described previously (Klemedtsson et al., 2010). Measurements were conducted daily between 2 and 13 June, again alternating between the LGR UGGA and Gasmet DX4040 analysers.
2.2 Laboratory experiment 1 – qualitative screening for VOC interferences
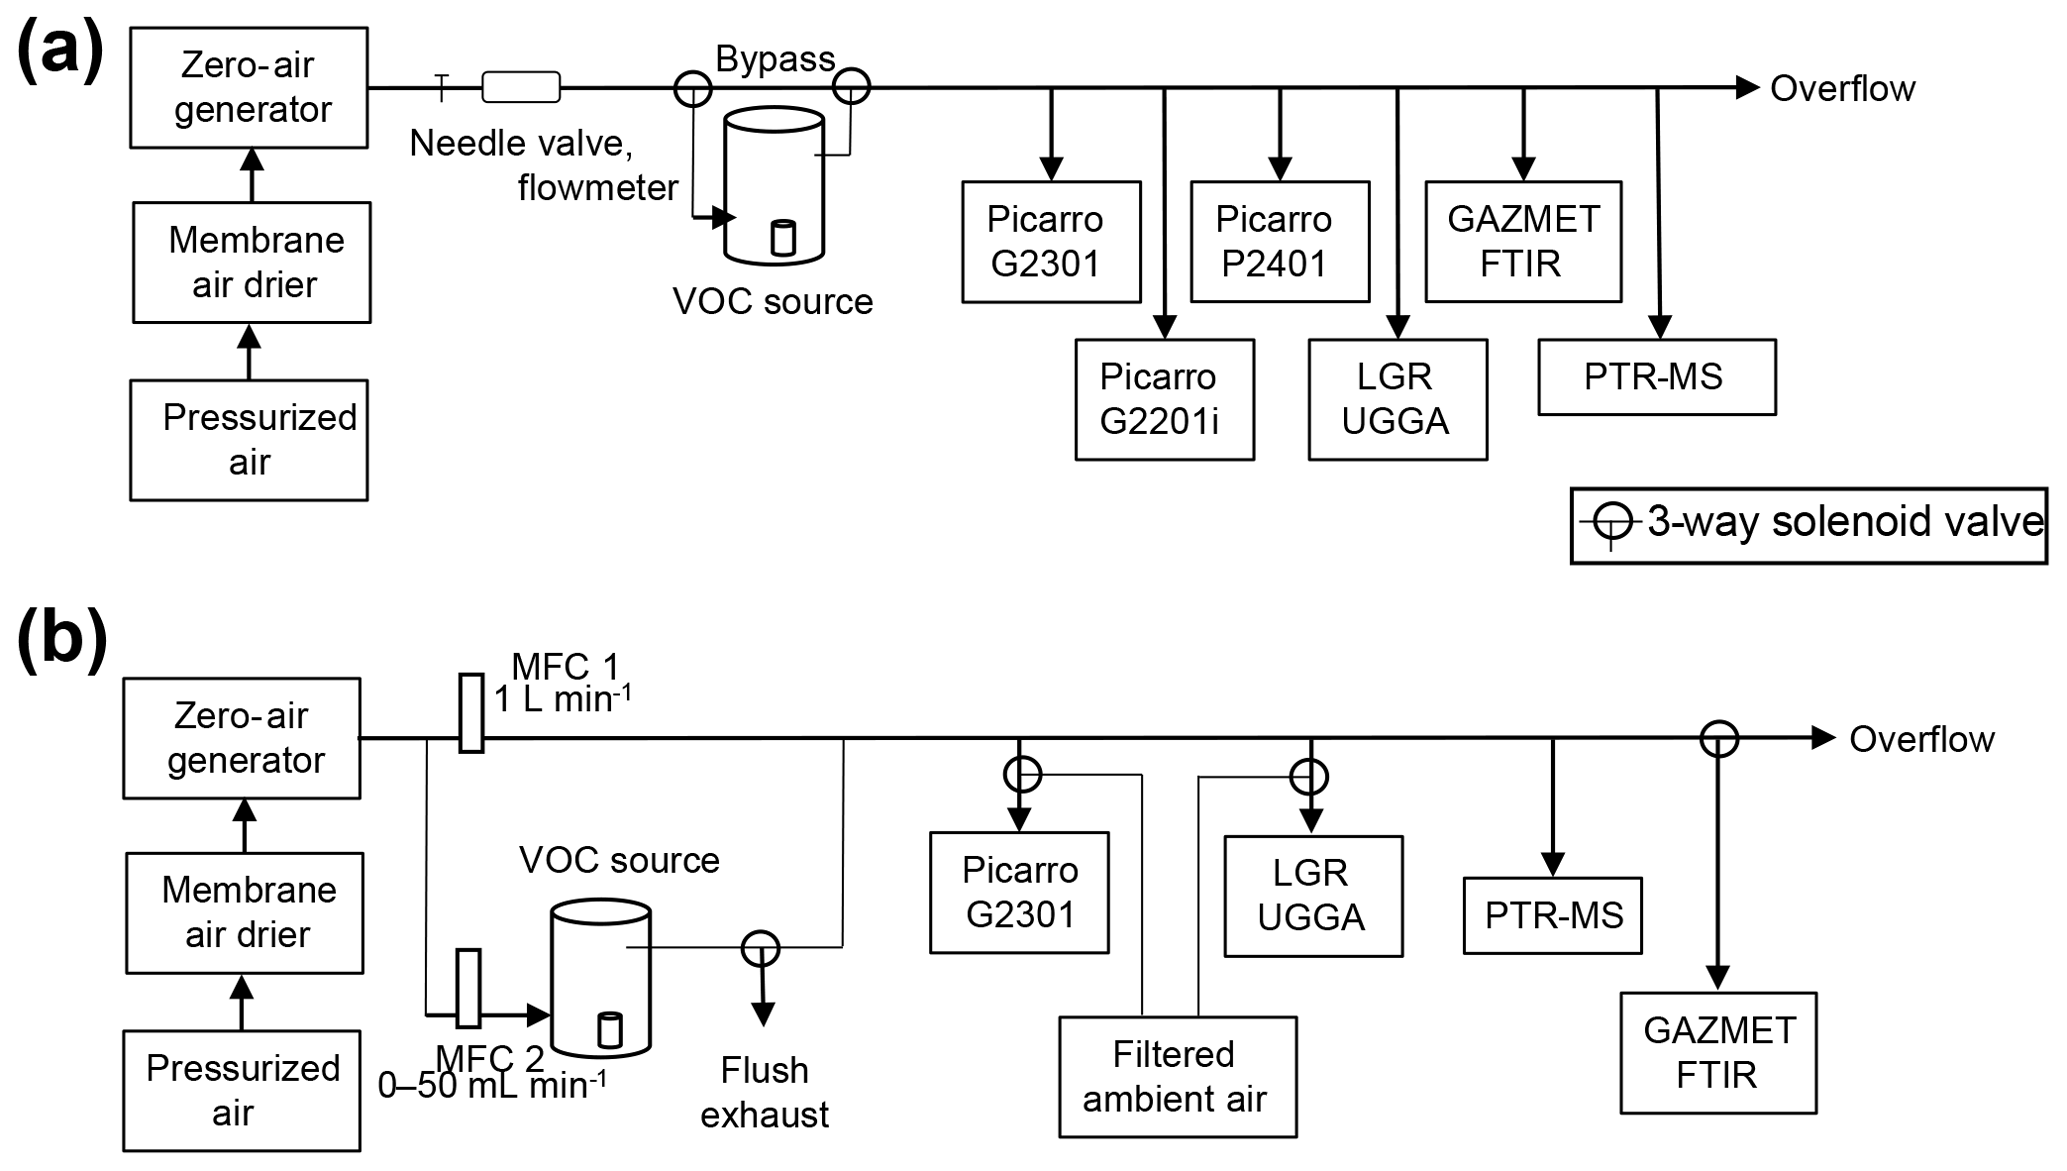
In a first series of experiments, we qualitatively screened for VOCs that interfered with CH4 analysers. We constructed an experimental system where VOCs can be added to an air stream with a constant CH4 mixing ratio (Fig. 2a). Air from the in-house pressured air supply (compressed outdoor air) was first passed through a membrane drier (SMC IDX series) and a zero-air generator (HPZA 3500 220, Parker Balston) to remove any VOCs present in the background air. Due to a defect, the zero-air generator did not remove CH4 from the air source, such that the air used for our experiments contained atmospheric CH4 at atmospheric mixing ratios. The air was then passed through a needle valve and a flow meter to set and monitor its flow rate. Next, we used two electronic three-way solenoid valves (SMC VX3-series) operated through a python script to guide the air flow either through a VOC source or a bypass line. The VOC source was an open or partly open vial that contained a pure VOC standard placed in a 500 mL glass bottle. The air flow was alternatingly set to the VOC source and bypass for 2.5 min. Finally, the air flow was passed to six instruments and an overflow outlet through T-connectors. All wetted parts of the air line after the zero-air generator were either stainless steel, PTFE, or glass to prevent generation or removal of VOCs in the air flow path.
The flow rate of air entering the system was set slightly above the total air intake of all analysers (approximately 5 Lmin−1). We tested four analysers based on laser spectroscopy (CRDS), including two stationary instruments (Picarro G2301 (CO2, CH4, H2O); Picarro G2201i (13CO2, 13CH4, H2O) and two portable instruments (Picarro G4301; LGR UGGA (CO2, CH4, H2O)), as well as a Fourier-transformed infrared (FTIR) spectroscopy-based multi-compound analyser (GASMET DX4015). For control, we quantified VOC concentrations with a proton transfer reaction quadrupole mass spectrometer (PTR-MS, Ionicon Analytik GmbH). We used the system to test the interferences of eight VOCs (α- and β-pinene, Δ3-carene, limonene, linalool, trans-2-hexenylacetate, cis-3-hexen-1-ol, nonanol, toluene, and methanol). Additional experiments with β-caryophyllene and nonanol were unsuccessful because the volatility of these compounds was too low; i.e. the mixing ratios generated for these compounds remained <50 ppbv. We chose the tested VOCs to represent a cross section of naturally occurring VOCs and aimed to cover a wide range of chemical compound classes rather than the most important biogenic VOCs occurring in any given environment.
The Gasmet DX4015 analyser was used in the same way it was deployed for soil flux measurements in previous studies: spectra were measured over 5 s and deconvoluted based on a library with four compounds (CH4, H2O, CO2, N2O). Measurements at all instruments were averaged over 10 s intervals.
2.3 Laboratory experiment 2 – quantification of VOC interferences
In a second series of experiments, we aimed to quantitatively measure VOC interferences. We modified the experimental setup such that VOC mixing ratios of the air passed to the CH4 analysers could be controlled (Fig. 2b). VOC-free air and VOC-carrying air were regulated separately by two mass flow controllers (Bürkert GmbH) and mixed through a T-connector. The flow rate of VOC-free air was kept constant at 1 L min−1, while the flow rate of the VOC-carrying air was varied between 0 and 50 mL min−1. The resulting flow rate, however, was too low to operate more than two instruments in parallel. We therefore alternated between three CH4 analysers (Picarro G2301, LGR UGGA, GASMET DX 4040) while continuously monitoring the VOC mixing ratios with the PTR-MS. For this second series of experiments, we replaced the FTIR-based analyser with a portable but otherwise similar model (GASMET DX4040) and increased the measurement cycle to 1 min. The analyser was zero-calibrated with N2 gas daily.
The PTR-MS was calibrated with a gas standard containing methanol, toluene, α-pinene (representing also other monoterpenes: β-pinene, carene, and limonene), cis-3-hexenol/hexanal, as well as other VOCs not measured in this study. The mixing ratios of the other measured compounds were calculated based on the transmission curve obtained from the calibration (Taipale et al., 2008). Instruments were challenged with both gradual increases (Fig. 4) and stepwise changes (Fig. 5) in VOC mixing ratios, with two to three repetitions per instrument and test type. We tested six VOCs: β-pinene, Δ3-carene, linalool, trans-2-hexenylacetate, cis-3-hexen-1-ol, and methanol.
2.4 Data analysis
FTIR spectra were deconvoluted using the Calcmet software to quantify the concentrations of methane and other trace gases. During Experiment 1, only CO2, H2O, CH4, and N2O were included in the spectral library (i.e. interfering VOCs were not included in the spectral library). We acknowledge that this is not a correct application of the analyser in the presence of known interference according to the manufacturer's guidelines. We did so to evaluate the impact of VOCs missing in the spectral library due to unexpectedly occurring VOCs, unidentified compounds, or user errors on CH4 flux measurements.
During Experiment 2 and for the field measurements, we separately quantified the effect of adding a VOC present or missing in the spectral library. To do so, we analysed the data twice, once with a limited library (CO2, CO, N2O, H2O, NH3) that did not contain the interfering VOCs and once with a full library that contained spectra of all tested VOCs (additional compounds: methanol, α-pinene, β-pinene, carene, linalool, hexenol, nonanal, trans-2-hexenyl acetate, caryophyllene, limonene).
Interferences were calculated as the slope between VOC mixing ratio and apparent CH4 mixing ratio. To avoid effects of transient interferences, we excluded time points where VOC mixing ratios abruptly changed (>35 % change in VOC mixing ratio per minute). Repeated challenges with the same test were combined in one regression analysis, but stepwise and gradual challenges were analysed separately. We calculated conservative estimates of uncertainty taking into consideration the uncertainty of the regression slope which already incorporates the variance among replicate tests. Our estimate of uncertainty furthermore accounts for minor variation in the CH4 concentrations in the in-house pressurized air supply, which limited our ability to detect small interferences. We used a bootstrap approach to calculate this uncertainty. For this, the measured CH4 concentrations were replaced by those from a random period of the same length during when no experiments were conducted (i.e. air contained no VOC at this time and all observed variations in CH4 concentrations represented true changes in CH4 concentrations). This approach was repeated a total of 500 times. The 50th, 97.5th, and 2.5th percentiles of the slope between these simulations was subtracted from the upper and lower limits of the confidence interval found in the regression analysis to obtain the central 95 % confidence interval for the interference. Significant interference was assumed when these confidence intervals did not include zero.
FTIR measurements with libraries that included the tested VOCs also reported concentrations for these VOCs. To evaluate the viability of measuring VOC concentrations by FTIR, we calculated the regression between VOC concentrations measured by FTIR and PTR-MS. We note that we made no attempts to calibrate FTIR-based VOC concentration against external standards. All statistical analysis was conducted in the statistical programming environment R version 3.4.4 (R Development Core Team, 2015). All stated uncertainties refer to 95 % confidence intervals.
Table 1Assumptions used to estimate VOC effects on CH4 flux measurements in static soil, stem, and shoot chambers. Where available, assumptions are based on measurements conducted in the Scots pine forest at the SMEAR II research station (Hyytiälä, Finland).
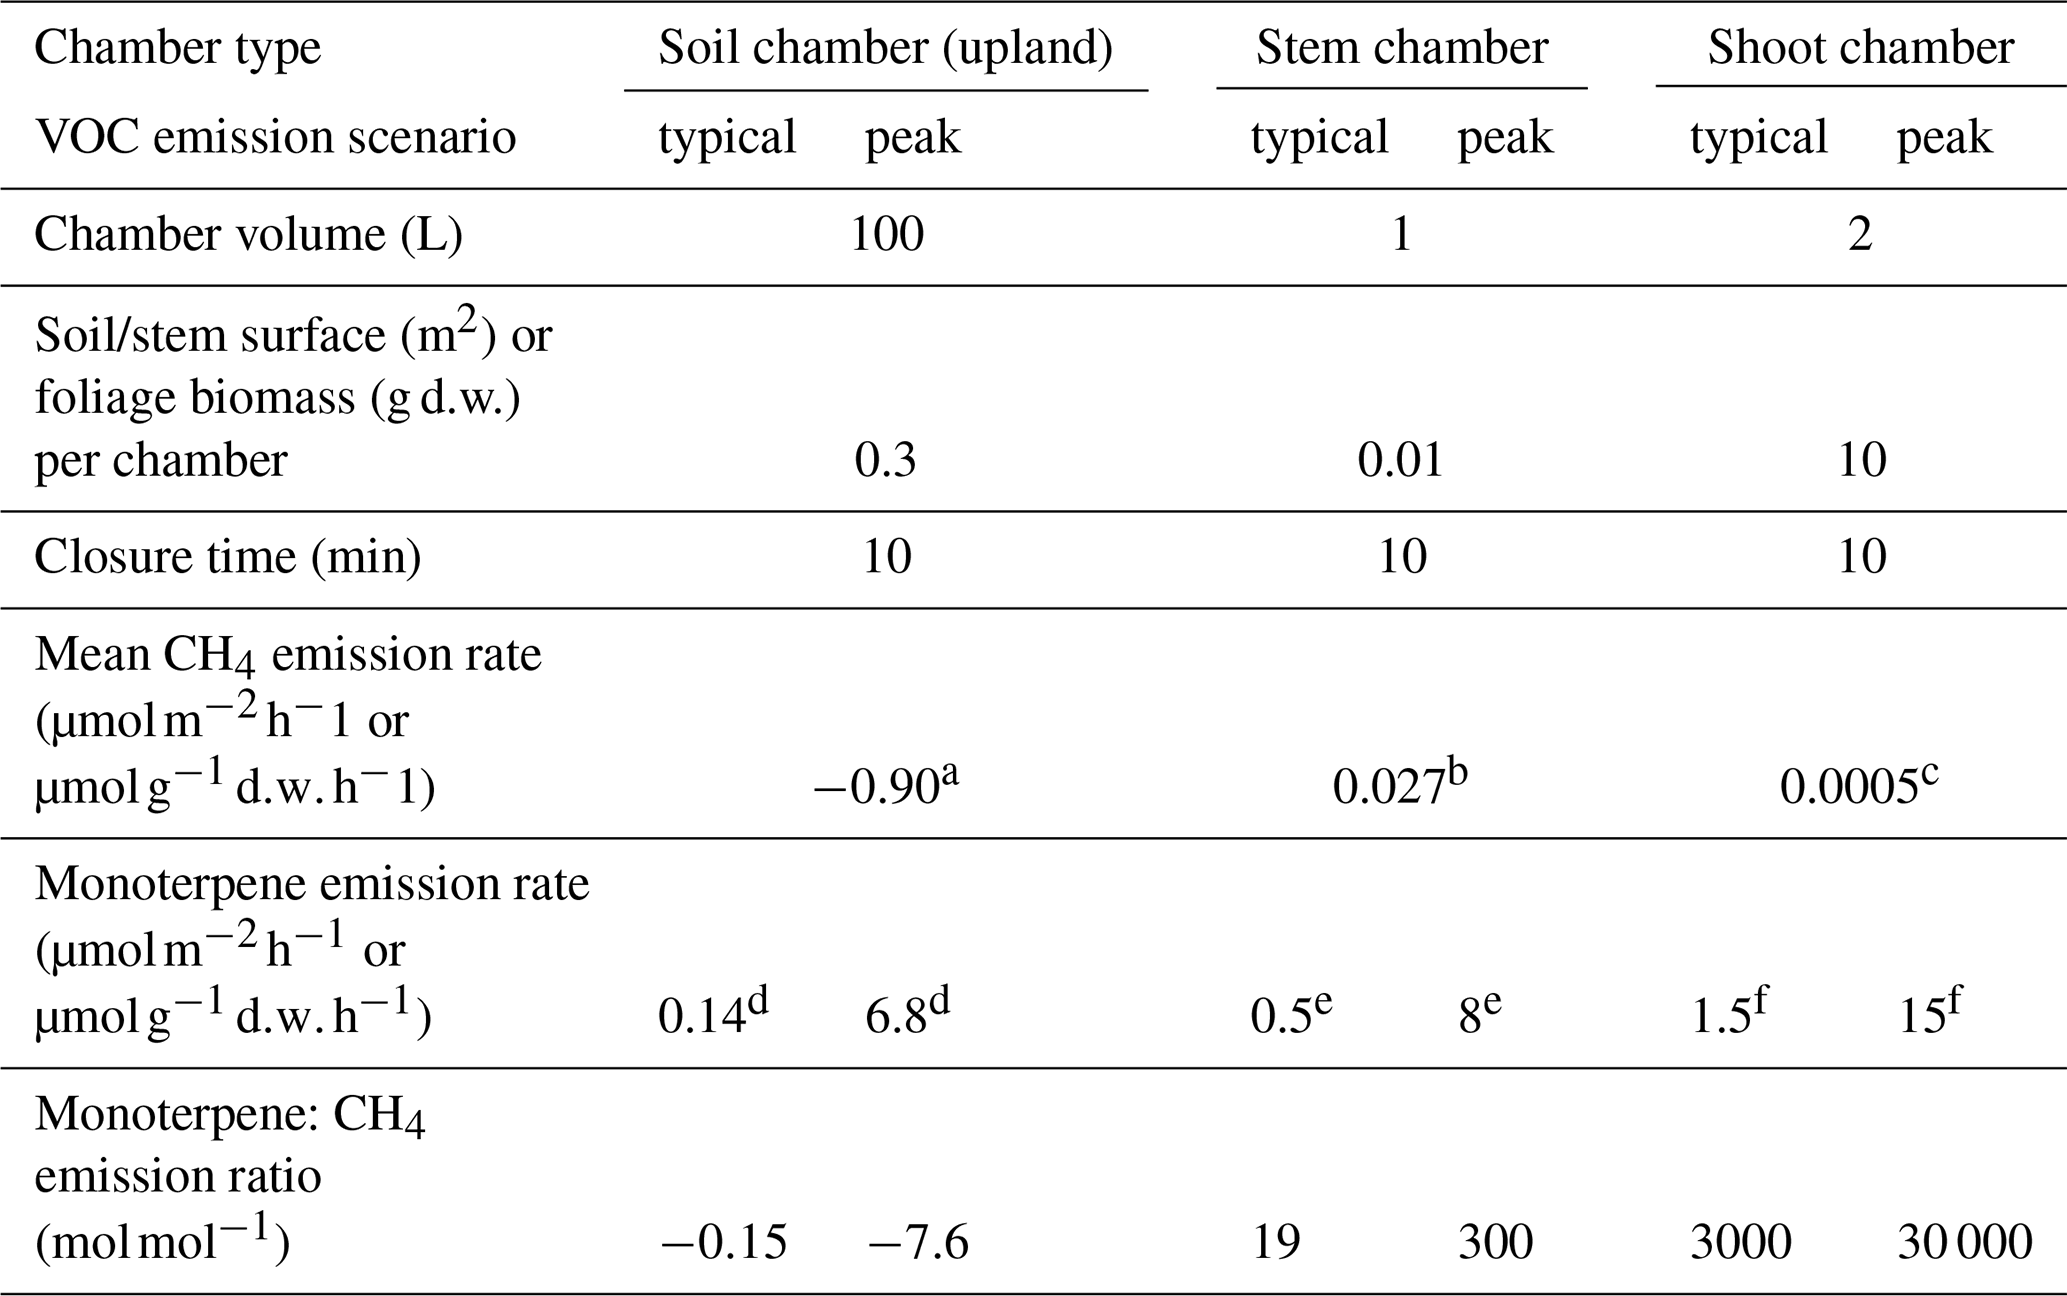
Sources: a Machacova et al. (2016); b Machacova et al. (2016). c Estimate based on Keppler et al. (2006); d Aaltonen et al. (2013); e Vanhatalo et al. (2015), Rissanen et al. (2016); f Tarvainen et al. (2005).
2.5 Impact assessment for soil, stem, and shoot chambers
We assessed the potential impact of VOC interferences on CH4 flux measurements in three scenarios representing soil, stem, and shoot chamber measurements. The assumptions used for these estimates are shown in Table 1. Chamber dimensions and CH4 and VOC flux rates were chosen based on measurements conducted at SMEAR II LTER field station (Hyytiälä, Finland) (Hari and Kulmala, 2005).
Only monoterpenes (PTR/MS signal at m∕z 137) were taken into account, and it was assumed that these VOCs uniformly interfered with CH4 measurements at the same rate as β-pinene. We furthermore assumed that VOC emission rates remain constant over the chamber closure time, i.e. that chamber headspace VOC mixing ratios do not approach saturation during the closure. While this assumption is unlikely to hold true for shoot chambers, it allows us to conduct a worst case estimate for VOC interferences. For each chamber type, we assessed the effects of VOC emissions at typical (i.e. average) as well as peak (maximum) emission rates. For FTIR, we estimated the effects of both VOCs present in the spectral library (interference measured on DX4040 with a full library) and VOCs missing in the spectral library (interference on DX4040 with a limited library).
Based on these assumptions, we calculated the actual change in CH4 mixing ratios during a chamber closure, the VOC mixing ratio reached at the end of the chamber closure, the upper limit to the apparent CH4 mixing ratio measured due to VOC interference on each analyser, and the maximum ratio of apparent to actual CH4 emissions. We emphasize that this is only a preliminary assessment of the impact of VOC interferences on CH4 flux measurements, as neither the identity of all emitted VOCs nor their interference on different analysers is fully known. These results of these calculations should therefore be understood as order-of-magnitude estimates.
3.1 Initial analysis of field data
Our initial spruce stem measurements showed a stark discrepancy between stem CH4 emissions measured with the LGR UGGA and GASMET DX4040 analysers. Measurements conducted with the LGR UGGA ranged from an apparent CH4 uptake of −2 and an apparent CH4 emission of 7 (Fig. 1). Measurements conducted with the DX4040 (limited spectral library) consistently showed an apparent CH4 uptake ranging with a much larger flux (−145 to +8 ). The average CH4 fluxes were (LGR UGGA) and (GASMET DX4040). In contrast, both analysers measured similar soil CH4 fluxes, with average fluxes of (LGR UGGA) and (GASMET DX4040).
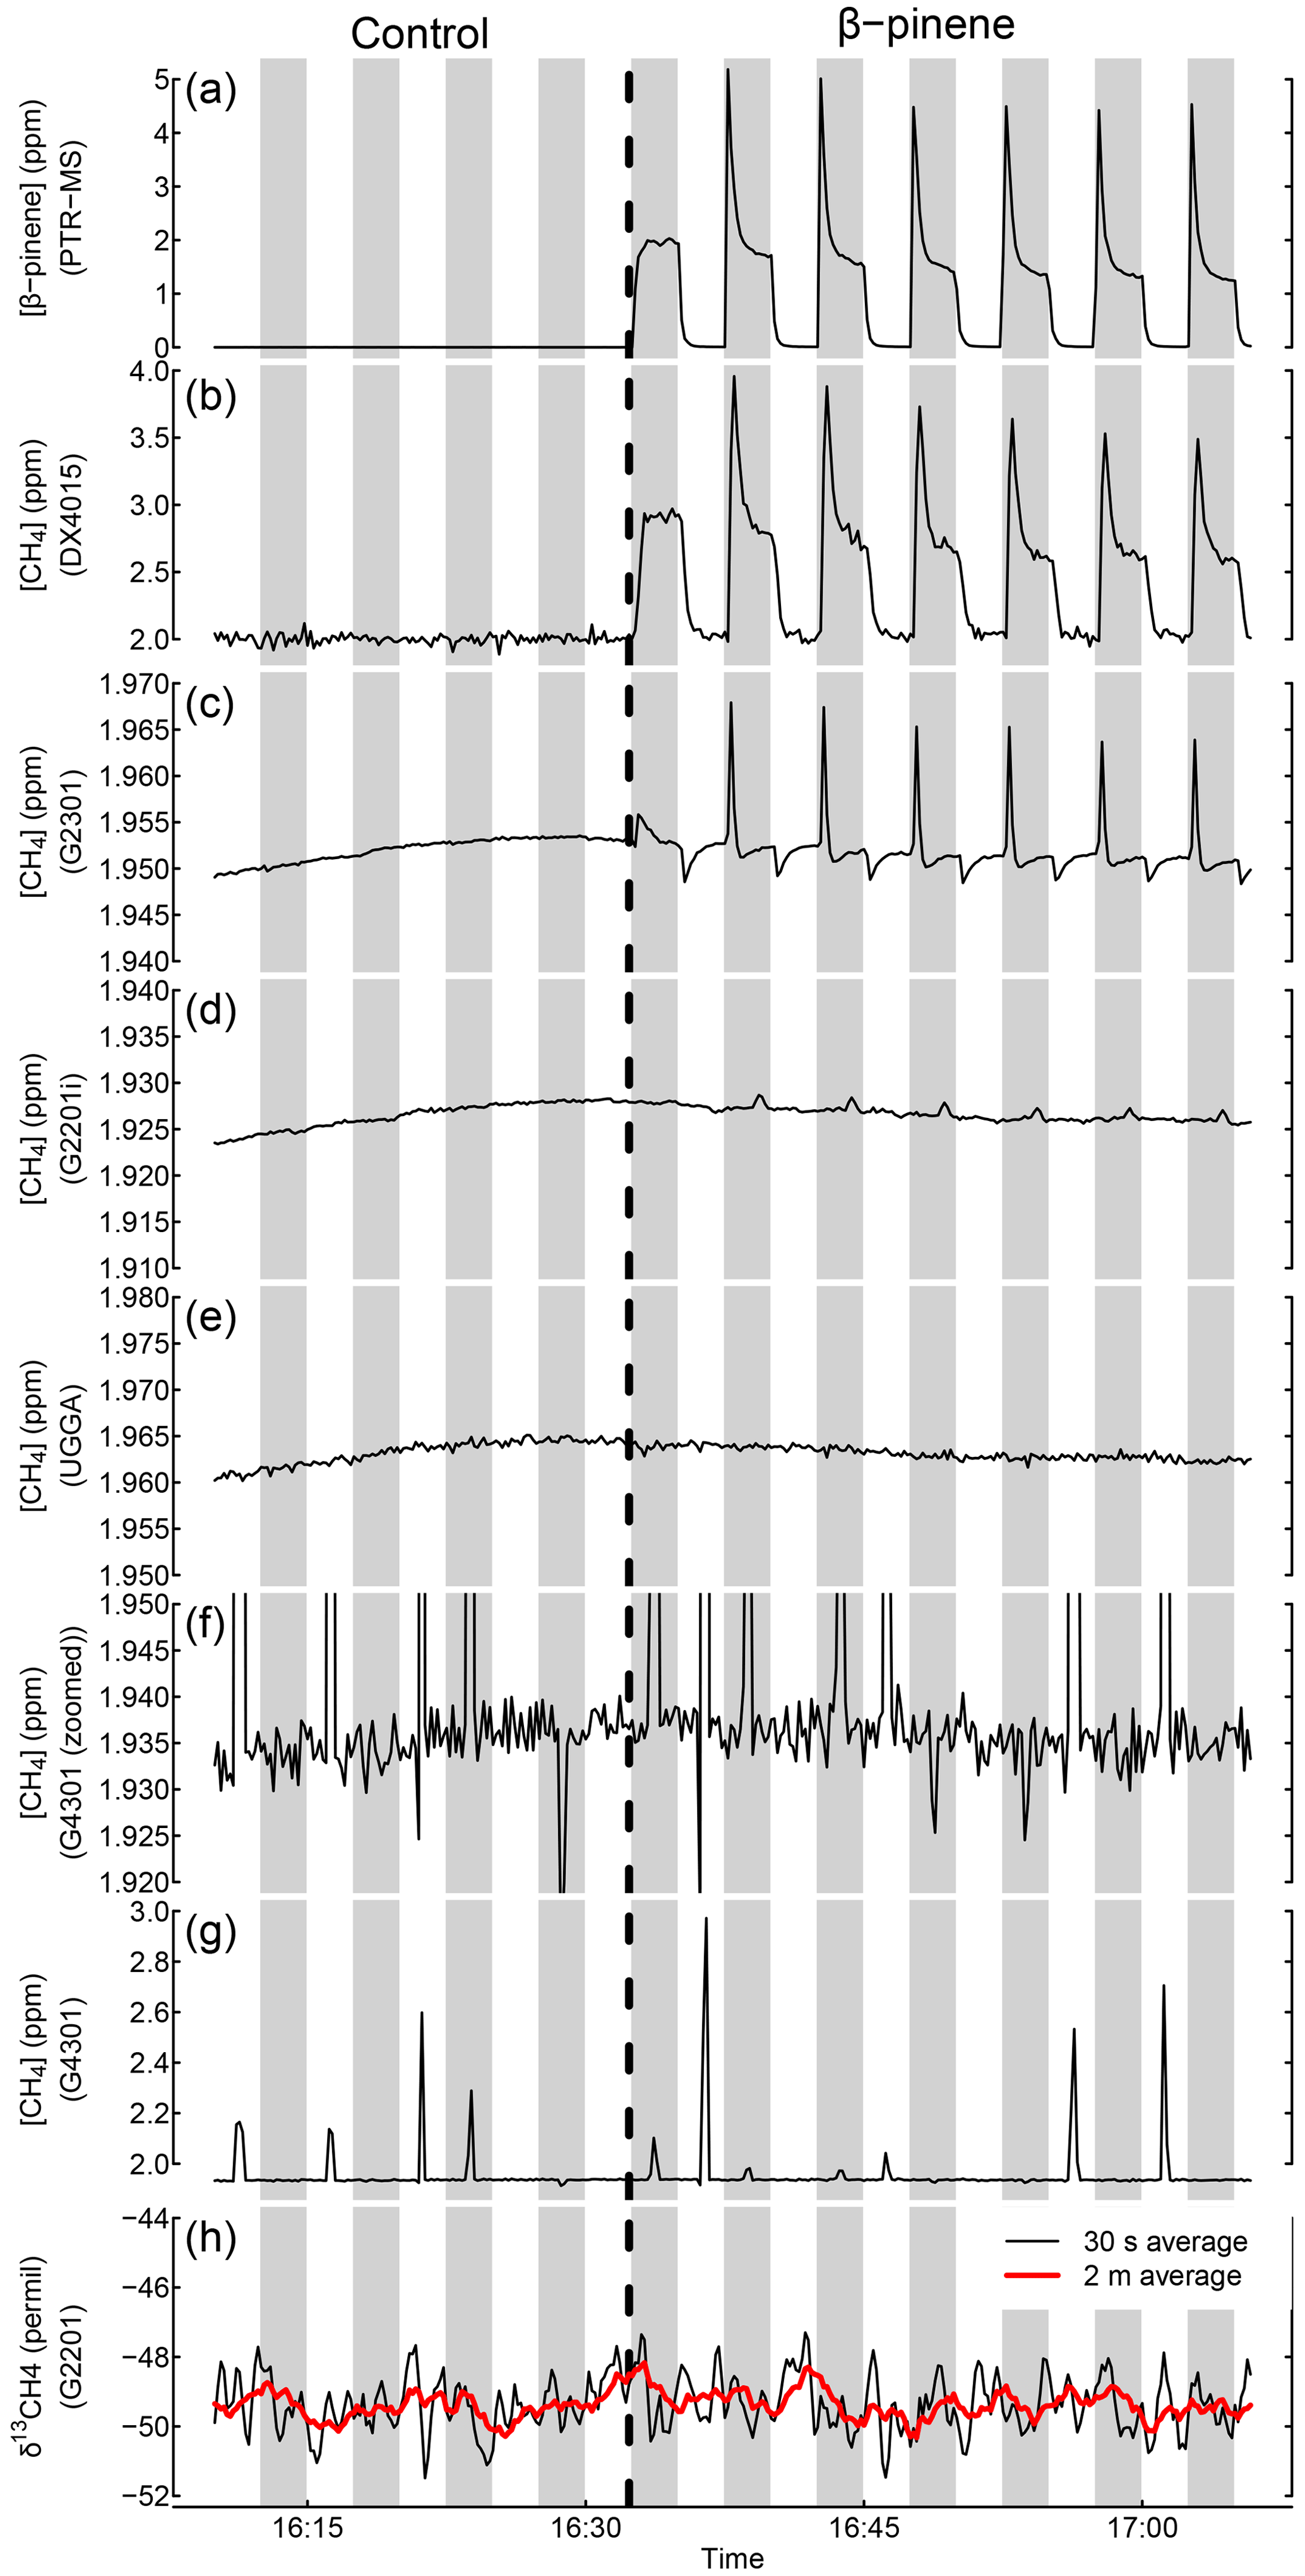
Figure 3Exemplary results from Experiment 1, shown for tests conducted with β-pinene. The panels show the development of the β-pinene (a) mixing ratio as measured by PTR-MS and the apparent CH4 mixing ratio as measured by Gasmet DX4015 (using an incomplete library intended for soil flux measurements), Picarro G2301, Picarro G2201i, LGR UGGA, and Picarro G4301 (b–g) and δ13C–CH4 values as measured by Picarro G2201i (h). White areas indicate the times when the system was set to bypass the VOC source, grey shaded areas times when the VOC source was online. During the control period left of the dashed vertical line the VOC source was empty. At the position of the dashed vertical line, the β-pinene vial was introduced into the standard source. Black line represents the 10 s moving average of apparent CH4 mixing ratios and values, red thick line the 30 s moving average of apparent values. Notice G4401 results zoomed in panel (f) to visualize background variation; full-scale results in panel (g).
3.2 Qualitative screening for interferences
An example of the changes in VOC mixing ratios over time produced by our setup is shown in Fig. 3a. The installation was first operated without a VOC present in the source to control for artefacts (e.g. effects of pressure changes due to switching valves). At the time point indicated by the vertical dashed line, a vial with β-pinene was inserted into the VOC source. This resulted in periodic patterns of presence and absence of β-pinene in the analysed air stream, with a maximum mixing ratio of approximately 5 ppmv.
The response of the CH4 analysers to the changing β-pinene mixing ratios is depicted in Fig. 3b–h. The FTIR-based analyser (DX4040) showed the strongest interference, with CH4 readings reaching by up to 4 ppmv when β-pinene was added to the air stream, i.e. 2 ppmv above the actual CH4 mixing ratio (Fig. 3b). In contrast, measured CH4 mixing ratios remained stable around 2 ppmv when the setup was operated with an empty vial in the VOC source, demonstrating that the observed interferences were not artefacts produced by the experimental setup (i.e. pressure effects).
The Picarro G2301 analyser exhibited moderate interferences by changes in VOC mixing ratios (Fig. 3c). The sudden increase in the β-pinene mixing ratios resulted in temporary positive deviations corresponding to 20 ppbv CH4 ppmv−1 β-pinene. We also detected a negative deviation when VOCs were suddenly removed from the air stream. A similar but much weaker (∼1 ppbv) interference was also detected on the Picarro G2201i instrument (Fig. 3d). The LGR UGGA and the Picarro G4301 instruments showed no discernible effect of the addition of β-pinene to the air stream (Fig. 3e–f); however, for the G4301 analyser this was because relatively high noise and occasional outliers in the measured CH4 mixing ratio may have masked potential small interferences. Finally, we did not detect any interference of β-pinene with the measured values (Fig. 3g).
Table 2Summary of interferences detected in qualitative tests.
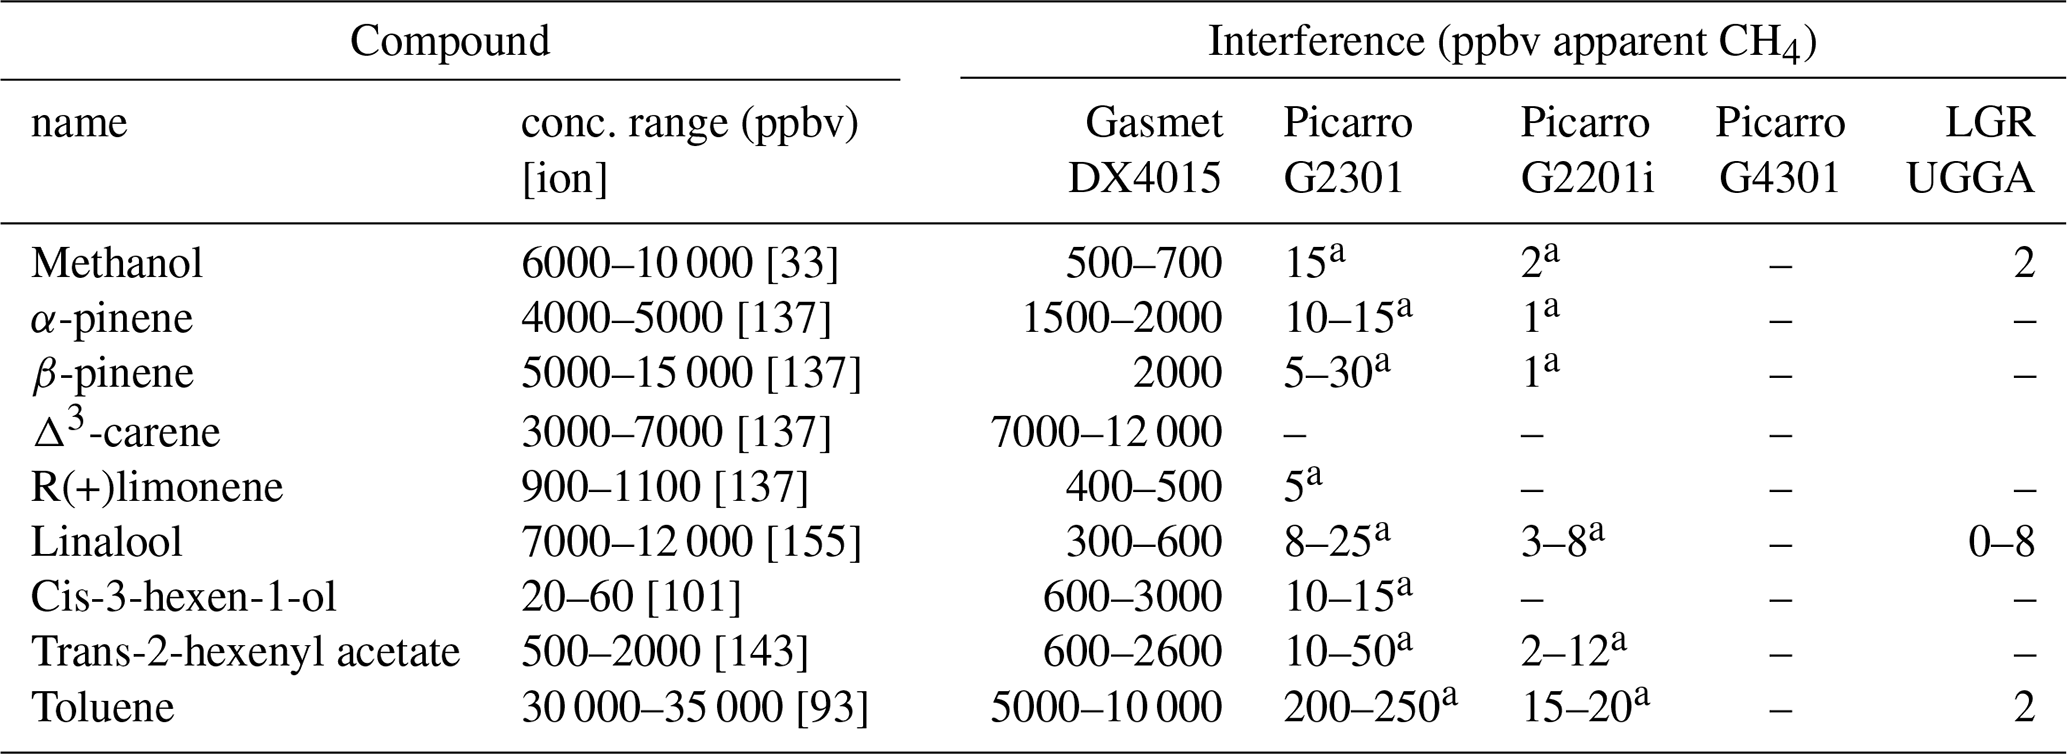
– not detected
a Transient interference triggered by change in VOC mixing ratio
rather than presence of VOC
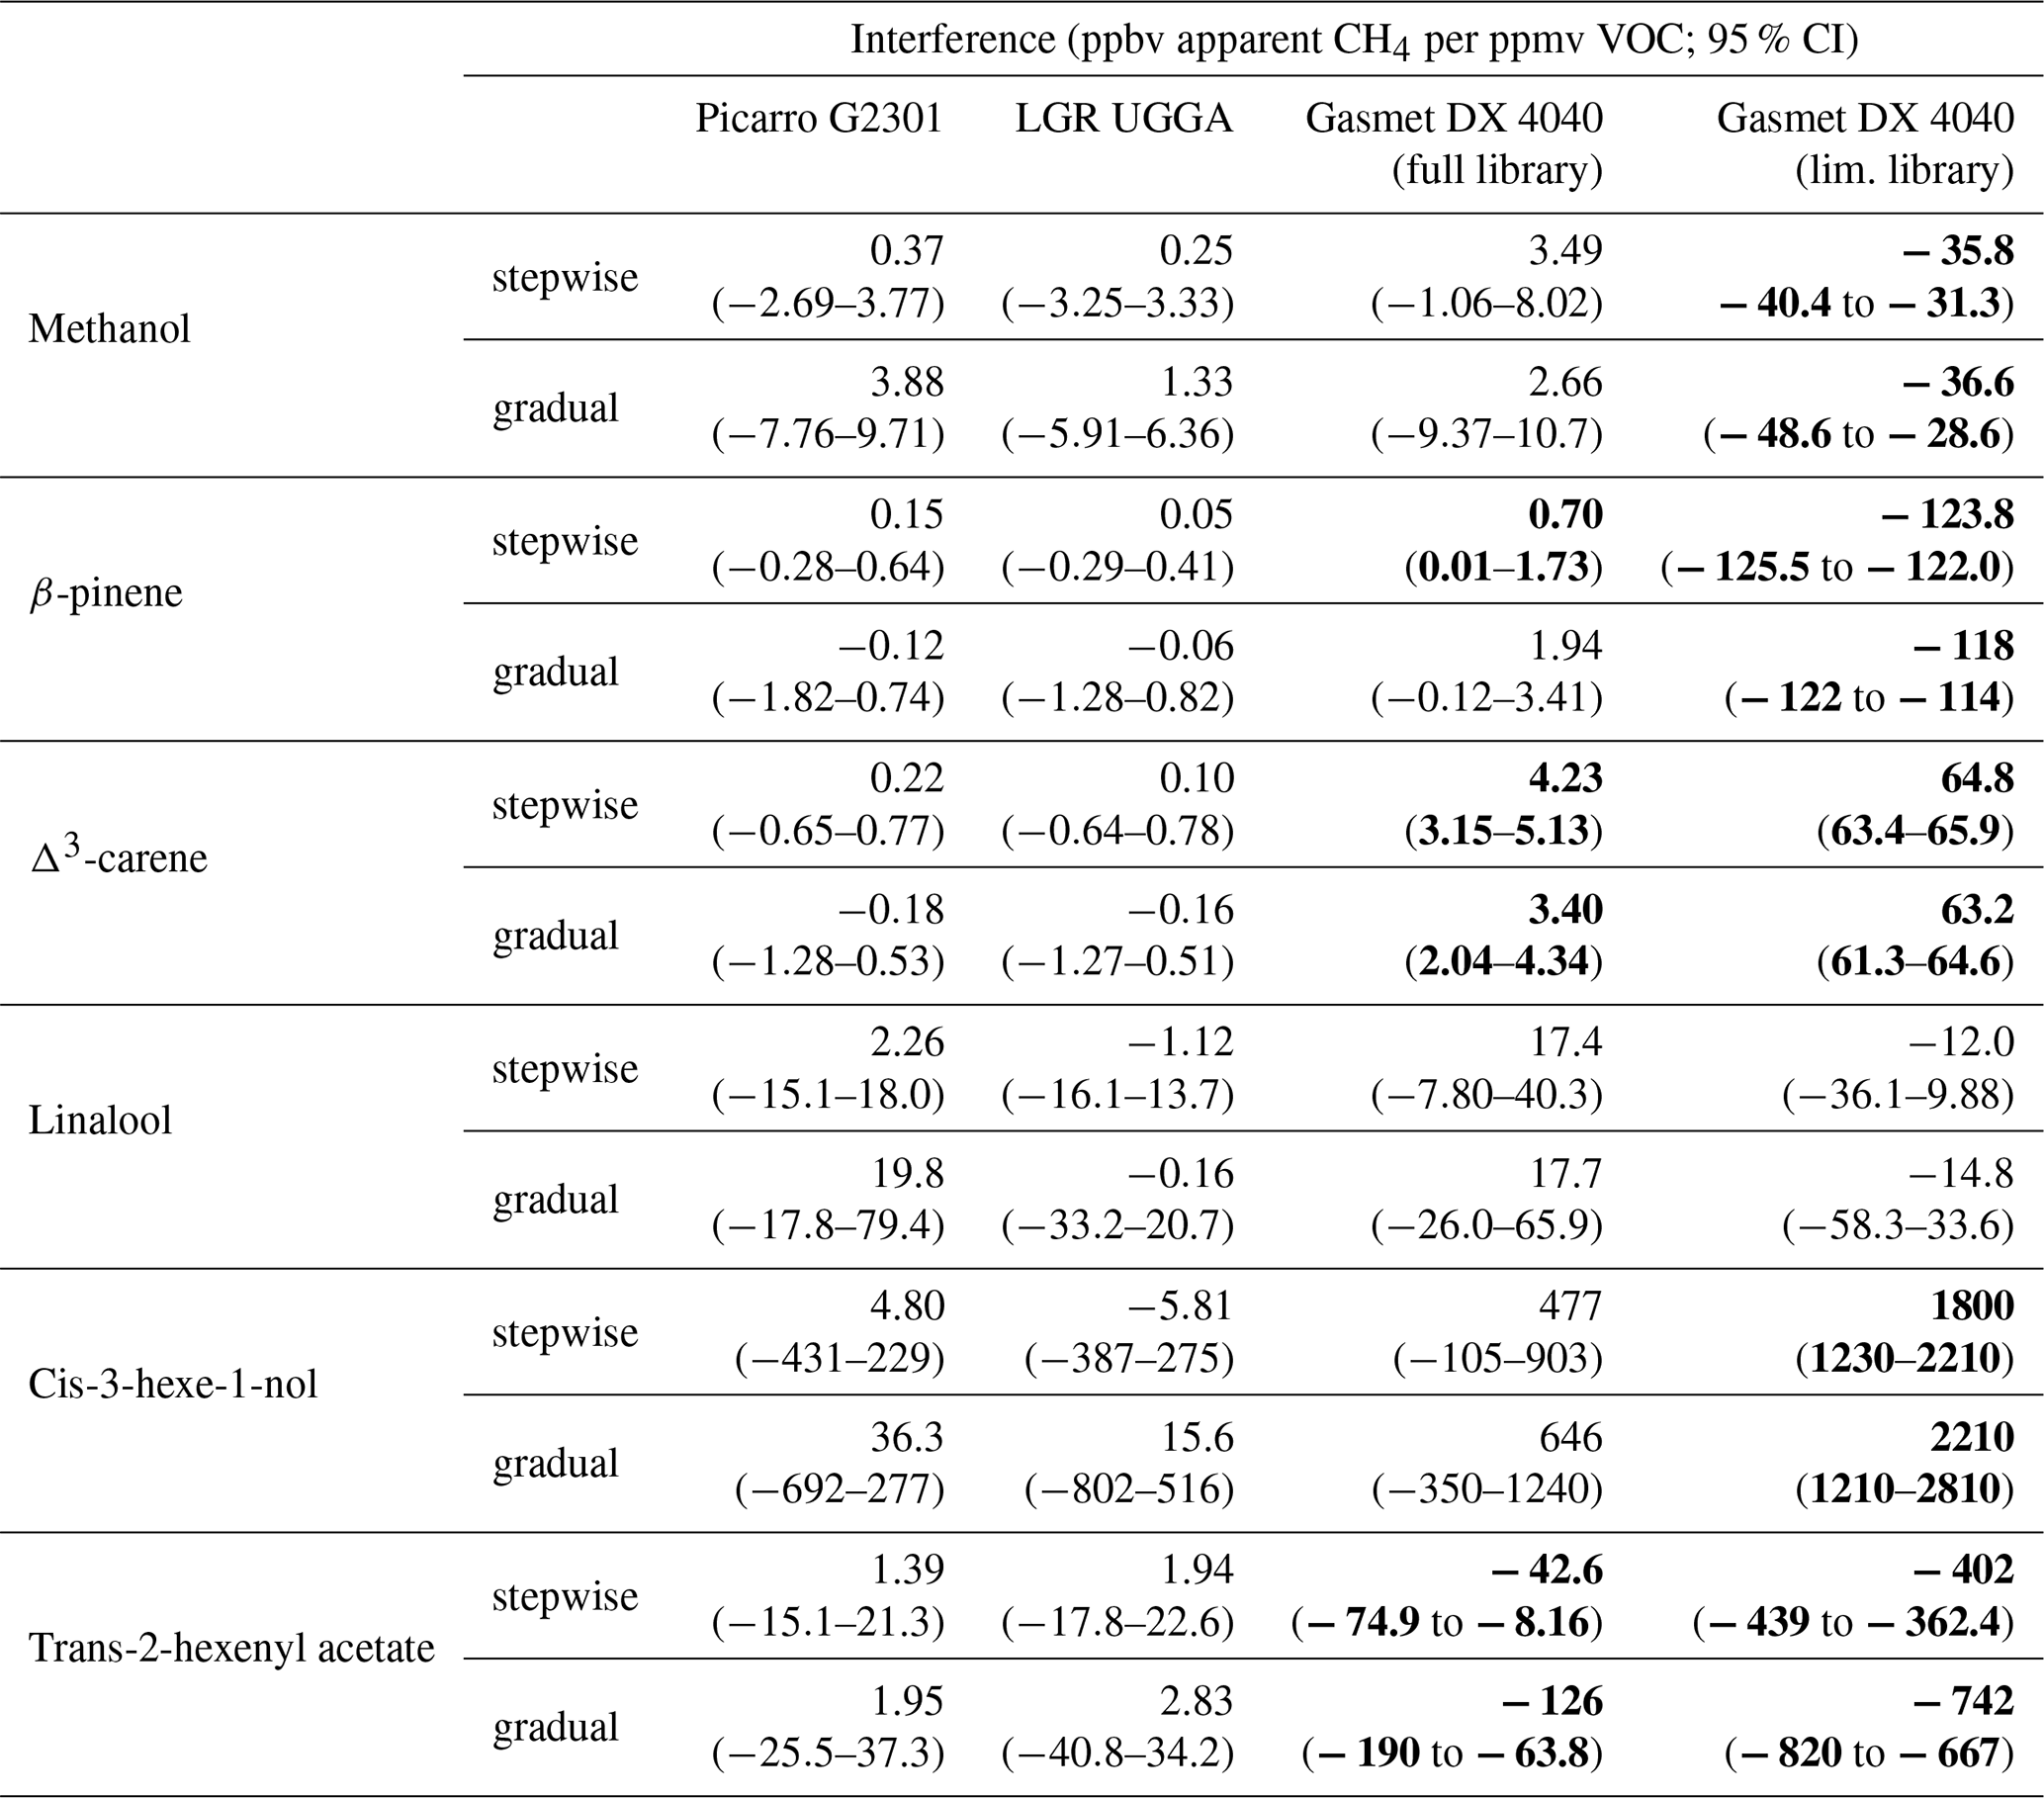
Table 3Quantified interferences of volatile organic compounds on CH4 analysers. Significant interferences are indicated in bold.
An overview of the interference tests with other VOCs is provided in Table 2. Among the 11 tested compounds, 9 showed an interference with the DX4015 analyser, 8 with the Picarro G2301, 6 with the Picarro G2201i, and 3 with the LGR UGGA. Interferences on the DX4015 were typically 2 orders of magnitude higher than on laser-absorption-based analysers. All interferences with CH4 mixing ratio measurements on the Picarro G2301 and G2201i instruments were transient, similar to those shown for β-pinene (Fig. 3c).
Only two VOCs interfered with δ13CCH4 measurements by the Picarro G2201. First, toluene, which was added at high mixing ratios (30 000–35 000 ppmv), led to an apparent increase in δ13CCH4 values by 1 ‰. Second, an accidental addition of high mixing ratios of methanol (>80 000 ppbv, likely higher due to saturation of the PTR-MS) strongly interfered with measurements, leading to a positive deviation by about 900 ‰ with a memory effect that lasted more than 2 h (not shown).
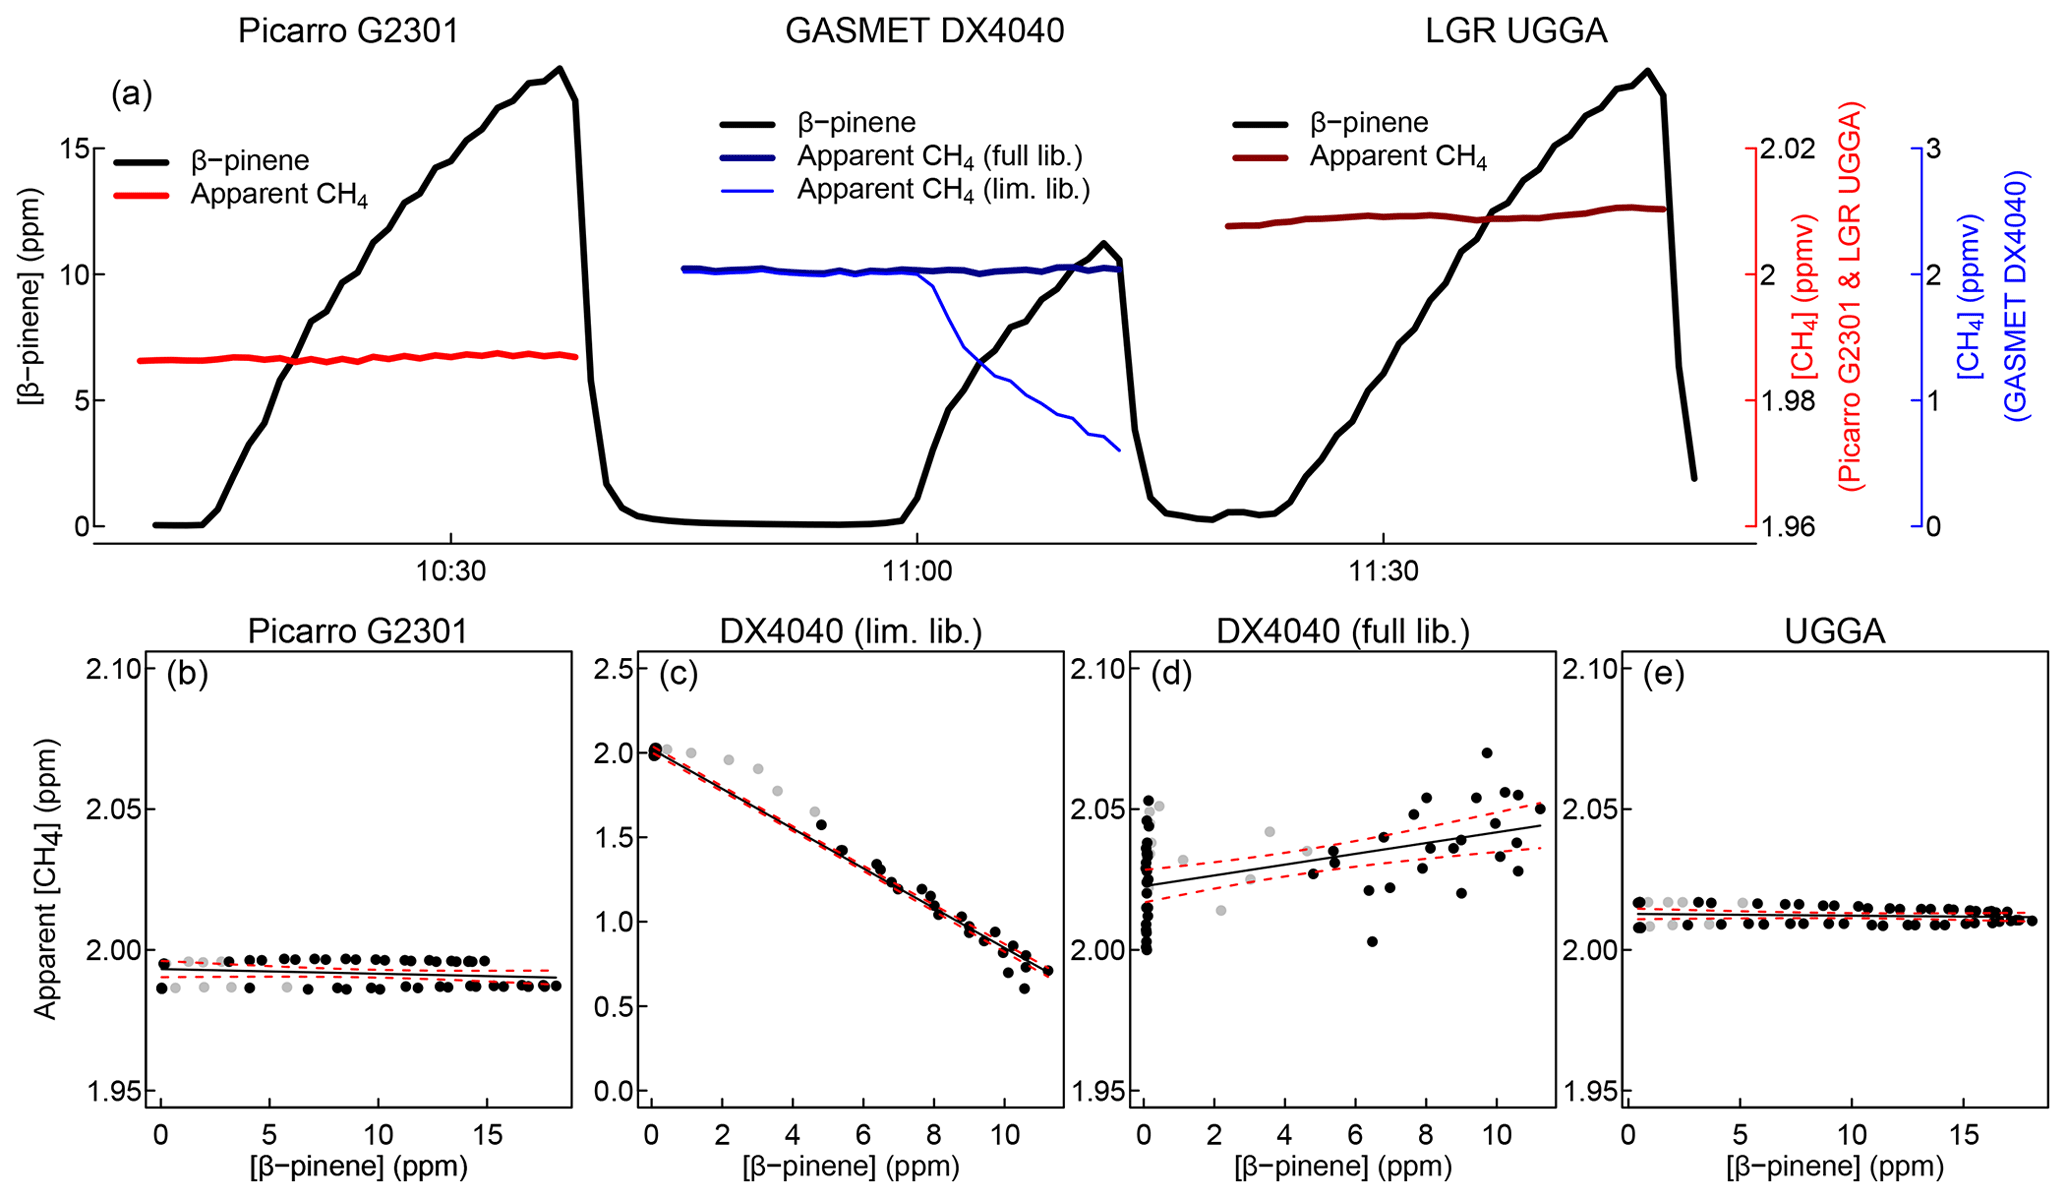
Figure 4Quantitative measurements of the effect of β-pinene mixing ratios on measured (apparent) methane mixing ratios when analysers were challenged with a gradual increase in the β-pinene mixing ratio. The figure depicts an example of the time course of β-pinene and apparent CH4 mixing ratios (a) as well as the relationship between β-pinene and the measured CH4 mixing ratio (b–e). Note that in (a), CH4 concentrations measured by the Gasmet DX4040 analyser are depicted on a different scale (blue) than those measured by the Picarro G2301 and LGR UGGA analysers (red). Black lines in panels (b)–(e) indicate linear regressions, dashed red lines the 95 % confidence interval of these regressions. Data points that occurred after rapid changes in the β-pinene mixing ratio and that were therefore excluded from the regression analysis are depicted in grey.

Figure 5Quantitative measurements of the effect of β-pinene mixing ratios on measured (apparent) methane mixing ratios when analysers were challenged with stepwise changes in the β-pinene mixing ratio. The figure depicts an example of the time course of β-pinene and apparent CH4 mixing ratios (a) as well as the relationship between β-pinene and the measured CH4 mixing ratio (b–e). Note that in (a), CH4 concentrations measured by the Gasmet DX4040 analyser are depicted on a different scale (blue) than those measured by the Picarro G2301 and LGR UGGA analysers (red). Black lines in panels (b)–(e) indicate linear regressions, dashed red lines the 95 % confidence interval of these regressions. Data points that occurred after rapid changes in the β-pinene mixing ratio and that were therefore excluded from the regression analysis are depicted in grey.
3.3 Quantification of interferences
In our second experiment, we successfully created gradual and stepwise changes in VOC mixing ratios. As an example, the effects of gradual and stepwise changes in β-pinene mixing ratios on the apparent CH4 mixing ratios measured by three different analysers are shown in Figs. 4a and 5a, respectively. In this experiment, we did not detect a significant effect of β-pinene mixing ratios on CH4 mixing ratios measured with the Picarro G2301 (Figs. 4b, 5b) or the LGR UGGA instruments (Figs. 4e, 5e). In contrast, β-pinene led to a significant underestimation of CH4 mixing ratios with the Gasmet DX4040 (by approximately 120 ppbv CH4 ppmv−1 β-pinene) when β-pinene was not part of the spectral library (Figs. 4c, 5c). Including β-pinene (and other VOCs) in the spectra library significantly reduced this interference to approximately 1 ppbv CH4 ppmv−1 β-pinene (Figs. 4d, 5d).
Similar results were found in tests with other VOCs. A list of the interferences quantified in different experiments is provided in Table 3. We did not detect a significant effect of VOC mixing ratios on the apparent CH4 mixing ratios measured by the Picarro G2301 and the LGR UGGA. For β-pinene and Δ3-carene we constrained the upper confidence limits to <1 ppbv CH4 ppmv−1 VOC on both instruments; for other compounds confidence limits were higher, mainly due to lower mixing ratios during the tests.
Interference on the Gasmet DX4040 without specific libraries for the tested compounds was high, ranging from −35 ppbv ppmv−1 (methanol) to 1800 ppbv ppm−1 (cis-3-hexen-1-ol). Adding reference spectra of the tested VOCs to the library substantially decreased the interferences, but significant interferences were still detected for β-pinene, Δ3-carene, and hexenylacetate (Table 3).

Figure 6Correlation between FTIR- and PTR-MS-based measurements of VOC mixing ratios. Data points plotted in grey were excluded after rapid changes in the VOC mixing ratio. Asterisks indicate significant levels: * p<0.05; ** p<0.01; *** p<0.001.
FTIR- and PTR-MS-based measurements of VOC mixing ratios were highly correlated (R=0.956 to 0.998) for most compounds (Fig. 6). Poor correlations were found for linalool, which was present at mixing ratios close to or below the detection limit of the FTIR method (10 ppbv).
3.4 Revised analysis of field data
After re-analysis with the full library, our field measurements by FTIR showed smaller CH4 fluxes than in our initial analysis (Fig. 1). The methane emission rates generated in this revised analysis (−85 to +8 ), however, still showed a substantial net uptake of CH4. The average apparent CH4 flux was . Assuming that measurements conducted by OA-ICOS revealed the true CH4 flux, the re-analysis decreased the bias in FTIR-based measurements by 41 %. In contrast, the re-analysed soil CH4 fluxes resulted in slightly lower average flux ( ) compared to initial measurements with the limited library ( ).
3.5 Estimated impact on static chamber systems on different ecosystem compartments
VOC (monoterpene) to methane emission ratios increased from soil to stem to shoot chambers, spanning over 4 orders of magnitude (Table 1). The practical impact of VOC interferences on CH4 flux measurements therefore differed strongly between ecosystem compartments. True CH4 fluxes typically exceeded apparent CH4 fluxes due to VOC interferences by 2 or more orders of magnitude in soil chambers, whereas the upper limit of apparent CH4 fluxes was equal to or greater than true fluxes in shoot chambers (Fig. 7, Table 4).
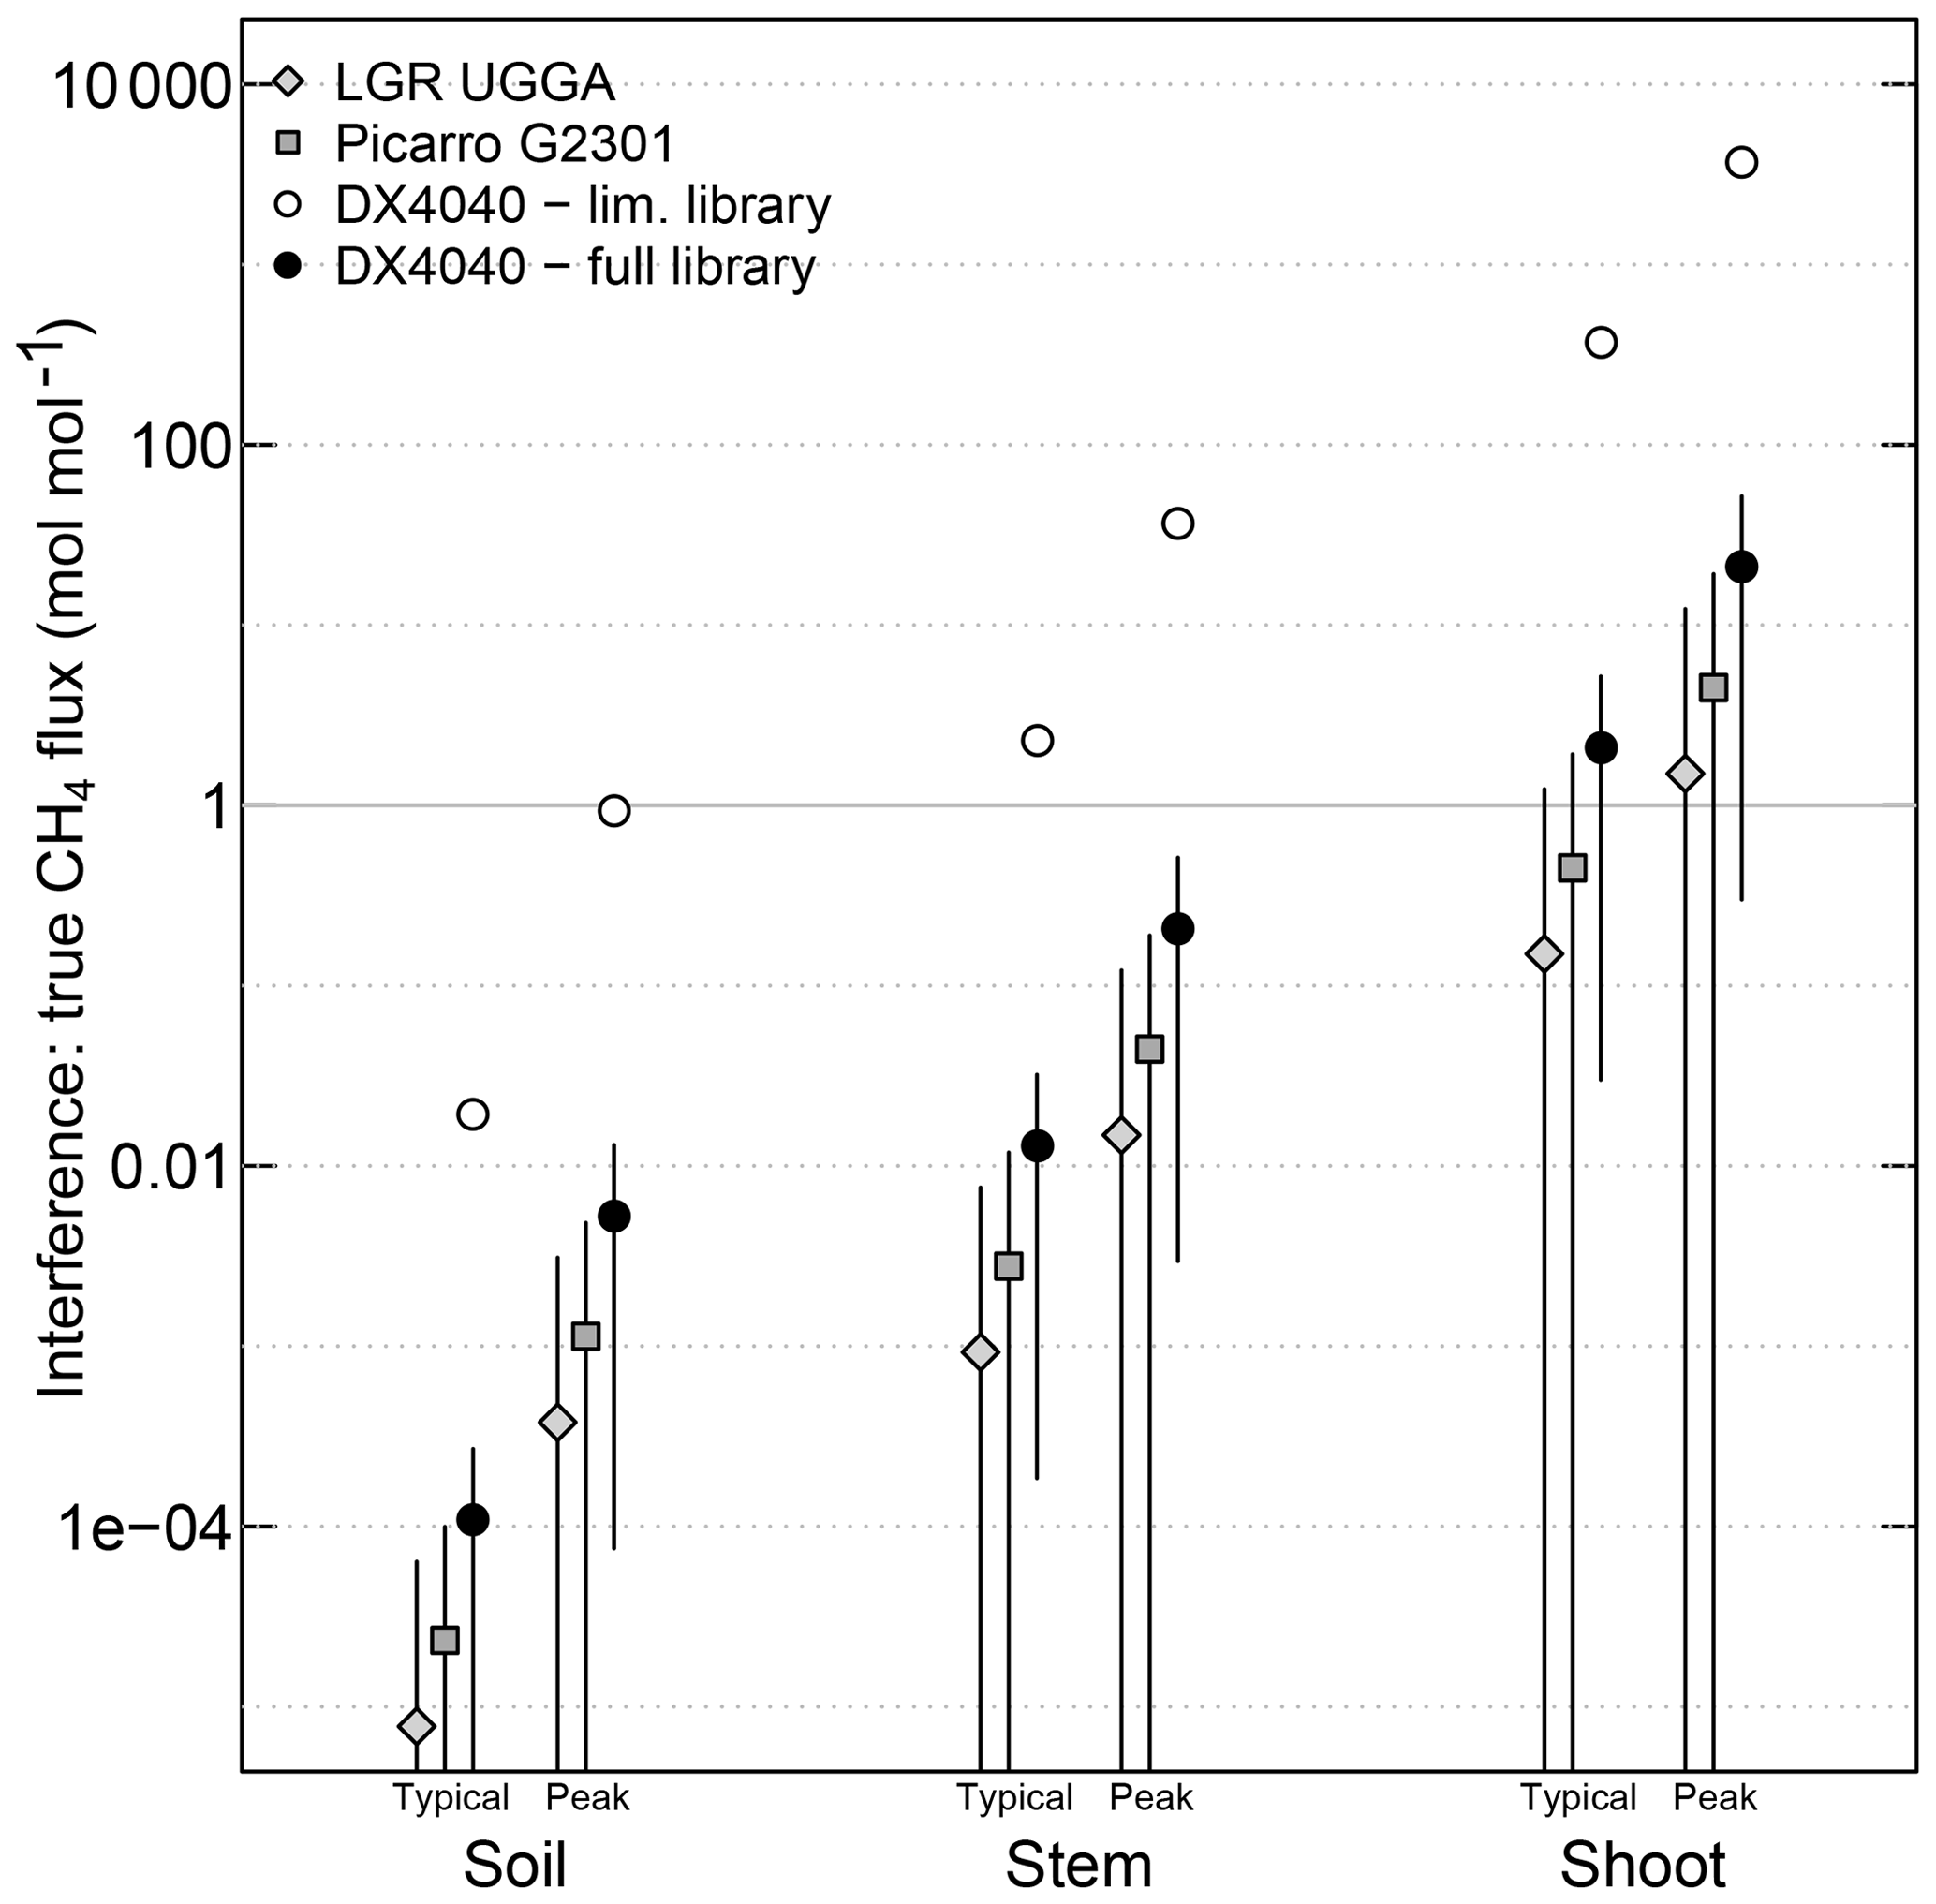
Figure 7Estimated size of the CH4 flux measurement error due to VOC interference (at typical and peak VOC fluxes) relative to the mean actual CH4 fluxes in soil, stem, and shoot chambers. Assumptions underlying these estimates are shown in Table 1. Only monoterpenes (m∕z 137 in PTR-MS measurements) were taken into account for this estimate, and it was assumed that all monoterpenes interfere with CH4 analysers at the same rate as β-pinene. The results presented here should therefore be understood as order-of-magnitude estimates. Symbols indicate medians with error bars indicate the analytical uncertainty (95 % confidence interval) associated with the quantification of VOC interferences, but do not take into account uncertainties in other assumptions.
Table 4Estimated impact of VOC interferences on methane flux measurements based on literature data of CH4 and VOC fluxes.
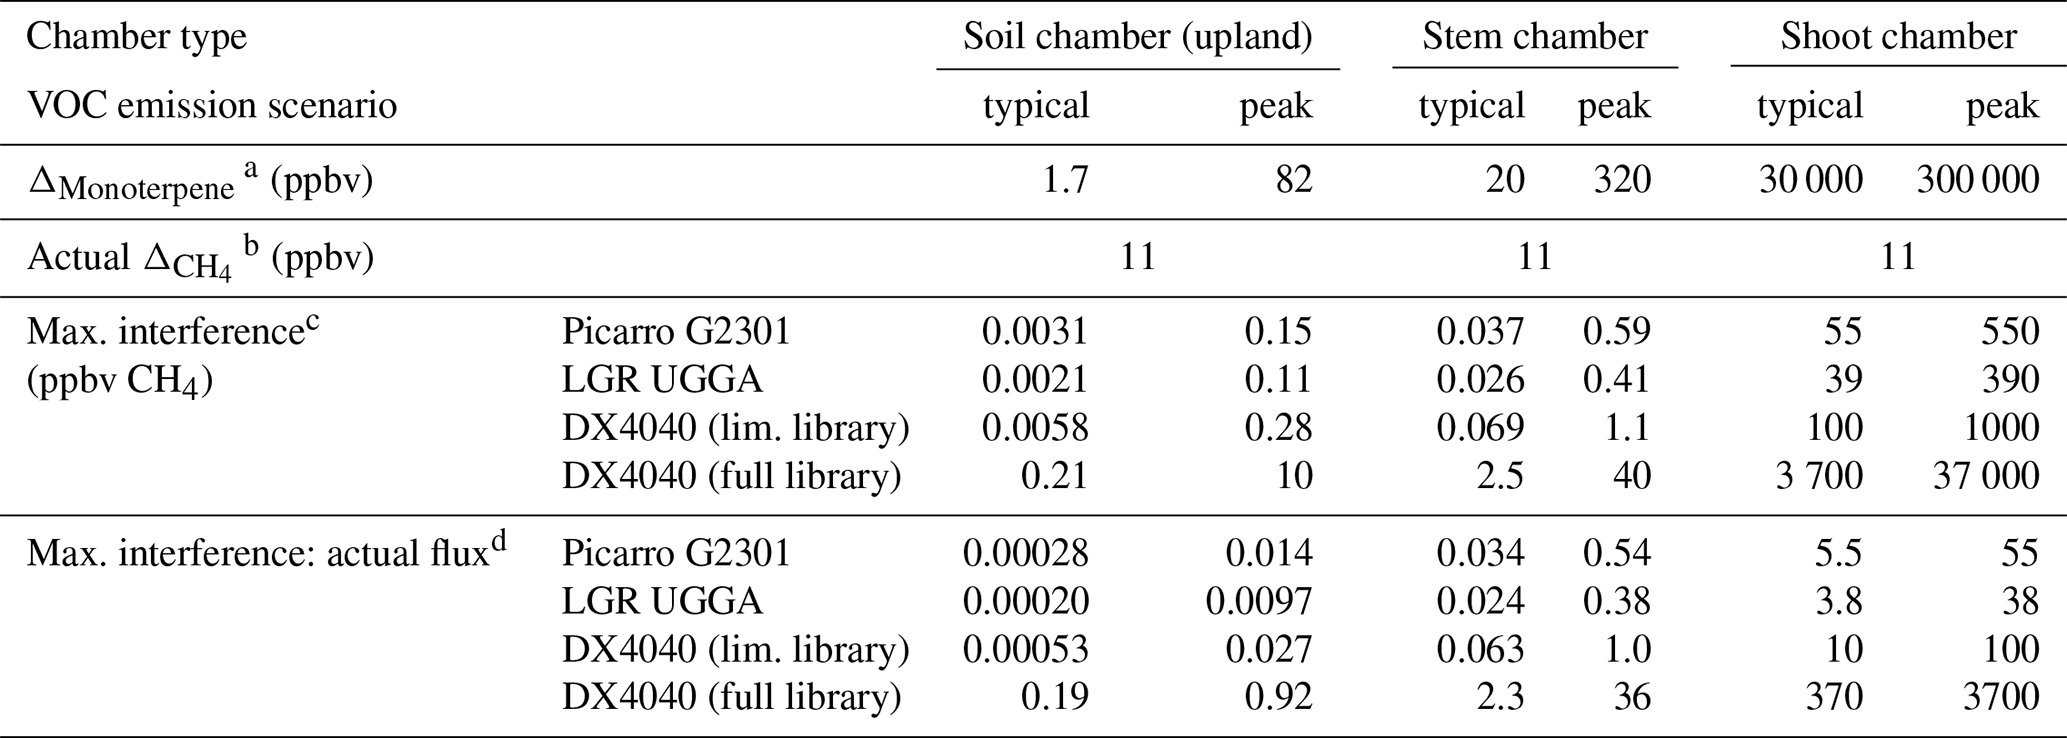
a Monoterpene mixing ratios at the end of a chamber closure, estimated based on the flux rates, chamber characteristics, and closure times stated in Table 1. We assumed that fluxes remained constant throughout the chamber closure period. Monoterpene saturation in the chamber headspace may decrease monoterpene emission rates during chamber closure.
b Change in CH4 mixing ratio during chamber closure, estimated based on assumptions stated in Table 1, estimated based on the flux rates, chamber characteristics, and closure times stated in Table 1.
c Upper confidence interval for the false ΔCH4 detected due to monoterpene interference with CH4 mixing ratio measurements.
d Ratio of the error in CH4 flux measurement due to monoterpene interference with the actual CH4 flux.
Our impact estimates suggest that all the analysers were able to accurately (<5 % measurement error) quantify soil CH4 fluxes at average VOC emission rates, even if important VOCs are missing in the FTIR spectral library (Fig. 7). Stem flux measurements, in contrast, are more vulnerable to VOC interferences, with upper limits of confidence of the order of 2 %–6 % of the actual CH4 flux, except for FTIR with incomplete spectral libraries where apparent CH4 fluxes that were estimated to exceed the interference may exceed actual fluxes several fold.
VOC interferences are a serious challenge for quantifying CH4 flux in shoot chambers where VOC fluxes are approximately 4 orders of magnitude higher than CH4 fluxes. Our results show that apparent fluxes due to VOC interferences can exceed actual fluxes when shoot CH4 fluxes are measured by FTIR, even if all VOCs are included in the spectral library. While we were not able to detect significant VOC interferences on OA-ICOS and CRDS-based analysers, the upper limit of uncertainty of these interferences still allows for interferences that exceed actual CH4 fluxes in shoot chambers.
4.1 FTIR-based analysers
Our results show that FTIR-based analysers are not well suited for measuring plant CH4 fluxes and other applications that quantify small changes in CH4 mixing ratios in the presence of much larger changes in the mixing ratios of other compounds, as is the case for plant CH4 flux measurements (Table 4, Fig. 7). In particular, our work emphasizes that FTIR-based CH4 flux measurements can only provide reliable data if all VOCs that were co-emitted in relevant amounts are identified and included in the spectral library.
Measurements of plant CH4 emissions with incomplete spectral libraries can result in gross over- or under-estimations of the actual CH4 flux rates depending on the combination of co-emitted VOCs as well as the components included in the spectral library used to deconvolute the measured spectra. The presence of VOCs missing in the spectral library is typically indicated by high residual values for the spectral fitting; such measurements should be re-analysed with an amended spectral library or, if this is not possible, considered invalid. Spectral libraries compiled for soil flux measurements are not sufficient for quantifying CH4 fluxes from tree stems. Had we solely relied on an FTIR system with an incomplete spectral library intended from soil flux measurements to quantify CH4 fluxes during our field campaign in Skogaryd, we would have identified spruce stems as a strong sink of CH4 (Fig. 1). However, concurrent measurements by the OA-ICOS-based LGR UGGA, which were largely unaffected by VOC co-emissions (Table 3), revealed that these trees stems actually act as a small source of CH4. The comparison of OA-ICOS- and FTIR-based results indicates that tree stem VOC emissions at Skogaryd were dominated by compounds that negatively interfere with FTIR-based CH4 flux measurements, including methanol, β-pinene, and hexenylacetate. The effect of these VOCs outweighed the positive interference of other VOCs including Δ3-carene and hexenol. It is, however, important to note that we did not quantify the interferences of all potential VOCs, including the dominant compound emitted by spruce trees (α-pinene) (Grabmer et al., 2006; Janson, 1993).
Our second experiment further showed that the VOC interferences can be minimized by including all potentially occurring VOCs in the spectral library. In our experiments, this decreased the interference by 1–2 orders of magnitude (Table 3). This, however, may not be practical in many field settings, where the identity of VOCs released from plants and soils is often unknown. Furthermore, spectral deconvolution was not successful for all VOCs, and significant interferences were found for three of the tested VOCs (β-pinene, Δ3-carene, and hexenyl acetate) even when the reference spectra were present in the spectral library. Upper limits for the quantified interferences in FTIR-based measurements were typically an order of magnitude higher than on laser-absorption-based instruments. In the case of our field campaign in Skogaryd, on average 59 % of the interference persisted when data were re-analysed with additional spectra in the library (Fig. 1).
In contrast, FTIR- and OA-ICOS-based analysers measured similar CH4 fluxes from soil chambers. This shows that both measurement principles can reliably quantify soil CH4 fluxes, where the VOC:methane flux ratio is significantly lower than in tree stems and shoots, which is consistent with previous studies (e.g. Falk et al., 2014). Our study furthermore showed that FTIR-based analysis may be a useful method to study VOC fluxes instead of or in addition to PTR-MS measurements. The strong correlation between VOC mixing ratios quantified by FTIR and PTR-MS (Fig. 6) indicates that FTIR can conduct precise measurements of VOC mixing ratios. FTIR instruments are cheaper and more portable than PTR-MS instruments and provide a complementary analytical principle that could help distinguish between isomers that cannot be separated by mass spectrometry. Detection limits of FTIR-based measurements of VOC mixing ratios (tens of ppb), however, are substantially higher than those of PTR-MS-based measurements (tens of ppt), and cross sensitivities among VOCs may bias the quantification of compounds that occur at lower mixing ratios.
4.2 Laser-spectroscopy-based analysers
Interferences on the CRDS- and OA-ICOS-based systems were significantly lower than on FTIR-based systems, but during our qualitative screening we still detected some potentially important interferences (Fig. 3), especially the case for the Picarro G2301. On this analyser, sudden changes in the VOC mixing ratio resulted in minor deviations of the measured CH4 mixing ratios. These interferences, however, were corrected by the instrument over the course of approximately 30 s and are therefore unlikely to affect chamber measurements, where mixing ratios of VOCs and CH4 increase gradually (e.g. over a 20–40 min chamber closure). These interferences may, however, pose an important bias for measurements that rely on fast measurements of air masses with changing VOC mixing ratios as used for eddy covariance (EC) measurements. In these measurements, interferences from VOC emissions as detected in this study could potentially lead to an overestimation of CH4 emissions. We have, however, not been able to further investigate VOC interferences on the high-frequency analysers used for EC measurements.
We quantified the interference of VOCs on CH4 analysers based on FTIR and laser-absorption spectroscopy. FTIR-based instruments were more prone to higher levels of interference than laser-absorption-based instruments, even when VOCs were added to the spectral library. FTIR-based analysers are therefore not well suited for studies of plant CH4 fluxes and other applications where small CH4 fluxes need to be quantified in the presence of much higher fluxes of VOCs. Our results, however, also indicate that FTIR instruments can be a cost-effective solution to field measurements of certain VOCs.
Raw data, processed data, and code are available at https://doi.org/10.5281/zenodo.2597716 (Kohl et al., 2019).
LK had the main responsibility for analysing the data and writing the manuscript, and participated in the design and construction of the measurement setup. MK had the main responsibility for designing the measurement setup and programming the controlling software, and participated in constructing the measurement setup and in the writing process. KR had the main responsibility for the VOC measurements and processing of PTR-MS results. IH had the main responsibility for the field campaign and had the original idea for testing the interference of VOCs in CH4 analysers, and participated in designing the measurement setup. TP had the main responsibility for constructing the measurement setup and participated in designing the measurement setup. HH contributed to the conceptualization of the study and was responsible for deciding on and providing the measured VOCs. MP contributed to the conceptualization of the study and the writing of the manuscript.
The authors declare that they have no conflict of interest.
We thank Gasmet Technologies Oy and Annalea Lohila for providing access to FTIR analysers.
This research has been supported by the European Research Council under the European Union's Horizon 2020 research and innovation programme (grant no. 757695) and the Academy of Finland, Biotieteiden ja Ympäristön Tutkimuksen Toimikunta (grant nos. 319329 and 2884941).
Open access funding provided by Helsinki University Library.
This paper was edited by Helge Niemann and reviewed by two anonymous referees.
Aaltonen, H., Aalto, J., Kolari, P., Pihlatie, M., Pumpanen, J., Kulmala, M., Nikinmaa, E., Vesala, T., and Bäck, J.: Continuous VOC flux measurements on boreal forest floor, Plant Soil, 369, 241–256, https://doi.org/10.1007/s11104-012-1553-4, 2013. a
Assan, S., Baudic, A., Guemri, A., Ciais, P., Gros, V., and Vogel, F. R.: Characterization of interferences to in situ observations of δ13CH4 and C2H6 when using a cavity ring-down spectrometer at industrial sites, Atmos. Meas. Tech., 10, 2077–2091, https://doi.org/10.5194/amt-10-2077-2017, 2017. a
Carmichael, M. J., Bernhardt, E. S., Bräuer, S. L., and Smith, W. K.: The role of vegetation in methane flux to the atmosphere: Should vegetation be included as a distinct category in the global methane budget?, Biogeochemistry, 119, 1–24, https://doi.org/10.1007/s10533-014-9974-1, 2014. a
Covey, K. R. and Megonigal, J. P.: Methane production and emissions in trees and forests, New Phytologist, 222, 35–51, https://doi.org/10.1111/nph.15624, 2019. a
Etiope, G.: Detecting and Measuring Gas Seepage, in: Natural Gas Seepage, pp. 63–84, Springer International Publishing, Cham, https://doi.org/10.1007/978-3-319-14601-0_4, 2015. a
Falk, J. M., Schmidt, N. M., and Ström, L.: Effects of simulated increased grazing on carbon allocation patterns in a high arctic mire, Biogeochemistry, 119, 229–244, https://doi.org/10.1007/s10533-014-9962-5, 2014. a
Franz, D., Acosta, M., Altimir, N., Arriga, N., Arrouays, D., Aubinet, M., Aurela, M., Ayres, E., López-Ballesteros, A., Barbaste, M., Berveiller, D., Biraud, S., Boukir, H., Brown, T., Brümmer, C., Buchmann, N., Burba, G., Carrara, A., Cescatti, A., Ceschia, E., Clement, R., Cremonese, E., Crill, P., Darenova, E., Dengel, S., D'Odorico, P., Gianluca, F., Fleck, S., Fratini, G., Fuß, R., Gielen, B., Gogo, S., Grace, J., Graf, A., Grelle, A., Gross, P., Grünwald, T., Haapanala, S., Hehn, M., Heinesch, B., Heiskanen, J., Herbst, M., Herschlein, C., Hörtnagl, L., Hufkens, K., Ibrom, A., Jolivet, C., Joly, L., Jones, M., Kiese, R., Klemedtsson, L., Kljun, N., Klumpp, K., Kolari, P., Kolle, O., Kowalski, A., Kutsch, W., Laurila, T., Ligne, A. D., Linder, S., Lindroth, A., Lohila, A., Longdoz, B., Mammarella, I., Manise, T., Marañon-Jimenez, S., Matteucci, G., Mauder, M., Meier, P., Merbold, L., Mereu, S., Metzger, S., Migliavacca, M., Mölder, M., Montagnani, L., Moureaux, C., Nelson, D., Nemitz, E., Nicolini, G., Nilsson, M., Beeck, M. O. d., Osborne, B., Löfvenius, M. O., Pavelka, M., Peichl, M., Peltola, O., Pihlatie, M., Pitacco, A., Pokorny, R., Pumpanen, J., Ratié, C., Schrumpf, M., Sedlák, P., Ortiz, P. S., Siebicke, L., Šigut, L., Silvennoinen, H., Simioni, G., Skiba, U., Sonnentag, O., Soudani, K., Soulé, P., Steinbrecher, R., Tallec, T., Thimonier, A., Tuittila, E., Tuovinen, J., Vestin, P., Vincent, G., Vincke, C., Vitale, D., Waldner, P., Weslien, P., Wingate, L., Wohlfahrt, G., Zahniser, M., and Vesala, T.: Towards long-term standardised carbon and greenhouse gas observations for monitoring Europe's terrestrial ecosystems: a review, Int. Agrophys., 32, 439–455, https://doi.org/10.1515/intag-2017-0039, 2018. a
Grabmer, W., Kreuzwieser, J., Wisthaler, A., Cojocariu, C., Graus, M., Rennenberg, H., Steigner, D., Steinbrecher, R., and Hansel, A.: VOC emissions from Norway spruce (Picea abies L. [Karst]) twigs in the field – Results of a dynamic enclosure study, Atmos. Environ., 40, 128–137, https://doi.org/10.1016/J.ATMOSENV.2006.03.043, 2006. a
Hari, P. and Kulmala, M.: Station for Measuring Ecosystem–Atmosphere Relations (SMEAR II), Boreal Env. Res., 10, 315–322, 2005. a
Janson, R. W.: Monoterpene emissions from Scots pine and Norwegian spruce, J. Geophys. Res.-Atmos., 98, 2839–2850, https://doi.org/10.1029/92JD02394, 1993. a
Jurasinski, G., Huth, V., Hofmann, M., Schmidt, M., and Hofmann, J.: Comparing laser-based gas analyzers for greenhouse gas measurements with closed chambers – precision and field applicability, in: European Geosciences Union General Assembly, vol. 21, p. 11049, 2019. a
Kandel, T. P., Gowda, P. H., Somenahally, A., Northup, B. K., DuPont, J., and Rocateli, A. C.: Nitrous oxide emissions as influenced by legume cover crops and nitrogen fertilization, Nutr. Cycl. Agroecosys., 112, 119–131, https://doi.org/10.1007/s10705-018-9936-4, 2018. a
Keppler, F., Hamilton, J. T. G., Braß, M., and Röckmann, T.: Methane emissions from terrestrial plants under aerobic conditions, Nature, 439, 187–191, https://doi.org/10.1038/nature04420, 2006. a, b
Klemedtsson, L., Ernfors, M., Björk, R. G., Weslien, P., Rütting, T., Crill, P., and Sikström, U.: Reduction of greenhouse gas emissions by wood ash application to a Picea abies (L.) Karst. forest on a drained organic soil, Eur. J. Soil Sci., 61, 734–744, https://doi.org/10.1111/j.1365-2389.2010.01279.x, 2010. a, b
Kohl, L., Koskinen, M., Rissanen, K., Haikarainen, I., Polvoinen, T., Hellén, H., and Pihlatie, M.: Technical note: Interferences of volatile organic compounds (VOC) on methane concentration measurements – Raw Data, Data set, Zenodo, https://doi.org/10.5281/zenodo.2597716, 2019. a
Machacova, K., Bäck, J., Vanhatalo, A., Halmeenmäki, E., Kolari, P., Mammarella, I., Pumpanen, J., Acosta, M., Urban, O., and Pihlatie, M.: Pinus sylvestris as a missing source of nitrous oxide and methane in boreal forest, Sci. Rep.-UK, 6, 1–8, https://doi.org/10.1038/srep23410, 2016. a, b, c, d, e, f
Nisbet, R. E., Fisher, R., Nimmo, R. H., Bendall, D. S., Crill, P. M., Gallego-Sala, A. V., Hornibrook, E. R., López-Juez, E., Lowry, D., Nisbet, P. B., Shuckburgh, E. F., Sriskantharajah, S., Howe, C. J., and Nisbet, E. G.: Emission of methane from plants, P. Roy. Soc. B, 276, 1347–1354, https://doi.org/10.1098/rspb.2008.1731, 2009. a
Pangala, S. R., Hornibrook, E. R., Gowing, D. J., and Gauci, V.: The contribution of trees to ecosystem methane emissions in a temperate forested wetland, Global Change Biol., 21, 2642–2654, https://doi.org/10.1111/gcb.12891, 2015. a
Pangala, S. R., Enrich-Prast, A., Basso, L. S., Peixoto, R. B., Bastviken, D., Hornibrook, E. R., Gatti, L. V., Marotta, H., Calazans, L. S. B., Sakuragui, C. M., Bastos, W. R., Malm, O., Gloor, E., Miller, J. B., and Gauci, V.: Large emissions from floodplain trees close the Amazon methane budget, Nature, 552, 230–234, https://doi.org/10.1038/nature24639, 2017. a, b
Pitz, S. and Megonigal, J. P.: Temperate forest methane sink diminished by tree emissions, New Phytol., 214, 1432–1439, https://doi.org/10.1111/nph.14559, 2017. a, b
Pitz, S. L., Megonigal, J. P., Chang, C. H., and Szlavecz, K.: Methane fluxes from tree stems and soils along a habitat gradient, Biogeochemistry, 137, 307–320, https://doi.org/10.1007/s10533-017-0400-3, 2018. a, b
Rapson, T. D. and Dacres, H.: Analytical techniques for measuring nitrous oxide, TrAC Trends in Analytical Chemistry, 54, 65–74, https://doi.org/10.1016/J.TRAC.2013.11.004, 2014. a
R Development Core Team: R: A Language and Environment for Statistical Computing, available at: http://www.r-project.org (last access: 2 September 2019), 2015. a
Rella, C. W., Hoffnagle, J., He, Y., and Tajima, S.: Local- and regional-scale measurements of CH4, δ13CH4, and C2H6 in the Uintah Basin using a mobile stable isotope analyzer, Atmos. Meas. Tech., 8, 4539–4559, https://doi.org/10.5194/amt-8-4539-2015, 2015. a
Rinne, H., Guenther, A., Greenberg, J., and Harley, P.: Isoprene and monoterpene fluxes measured above Amazonian rainforest and their dependence on light and temperature, Atmos. Environ., 36, 2421–2426, https://doi.org/10.1016/S1352-2310(01)00523-4, 2002. a
Rissanen, K., Hölttä, T., Vanhatalo, A., Aalto, J., Nikinmaa, E., Rita, H., and Bäck, J.: Diurnal patterns in Scots pine stem oleoresin pressure in a boreal forest, Plant Cell Environ., 39, 527–538, https://doi.org/10.1111/pce.12637, 2016. a
Simpson, D., Winiwarter, W., Börjesson, G., Cinderby, S., Ferreiro, A., Guenther, A., Hewitt, C. N., Janson, R., Khalil, M. A. K., Owen, S., Pierce, T. E., Puxbaum, H., Shearer, M., Skiba, U., Steinbrecher, R., Tarrasón, L., and Öquist, M. G.: Inventorying emissions from nature in Europe, J. Geophys. Res.-Atmos., 104, 8113–8152, https://doi.org/10.1029/98JD02747, 1999. a
Taipale, R., Ruuskanen, T. M., Rinne, J., Kajos, M. K., Hakola, H., Pohja, T., and Kulmala, M.: Technical Note: Quantitative long-term measurements of VOC concentrations by PTR-MS – measurement, calibration, and volume mixing ratio calculation methods, Atmos. Chem. Phys., 8, 6681–6698, https://doi.org/10.5194/acp-8-6681-2008, 2008. a
Tarvainen, V., Hakola, H., Hellén, H., Bäck, J., Hari, P., and Kulmala, M.: Temperature and light dependence of the VOC emissions of Scots pine, Atmos. Chem. Phys., 5, 989–998, https://doi.org/10.5194/acp-5-989-2005, 2005. a, b
Teutscherova, N., Vazquez, E., Arango, J., Arevalo, A., Benito, M., and Pulleman, M.: Native arbuscular mycorrhizal fungi increase the abundance of ammonia-oxidizing bacteria, but suppress nitrous oxide emissions shortly after urea application, Geoderma, 338, 493–501, https://doi.org/10.1016/J.GEODERMA.2018.09.023, 2019. a
Vanhatalo, A., Chan, T., Aalto, J., Korhonen, J. F., Kolari, P., Hölttä, T., Nikinmaa, E., and Bäck, J.: Tree water relations can trigger monoterpene emissions from Scots pine stems during spring recovery, Biogeosciences, 12, 5353–5363, https://doi.org/10.5194/bg-12-5353-2015, 2015. a
Warlo, H., Machacova, K., Nordstrom, N., Maier, M., Laemmel, T., Roos, A., and Schack-Kirchner, H.: Comparison of portable devices for sub-ambient concentration measurements of methane (CH4) and nitrous oxide (N2O) in soil research, Int. J. Environ. An. Ch., 98, 1030–1037, https://doi.org/10.1080/03067319.2018.1517871, 2018. a
Warner, D. L., Villarreal, S., McWilliams, K., Inamdar, S., and Vargas, R.: Carbon Dioxide and Methane Fluxes From Tree Stems, Coarse Woody Debris, and Soils in an Upland Temperate Forest, Ecosystems, 20, 1205–1216, https://doi.org/10.1007/s10021-016-0106-8, 2017. a
Zellweger, C., Emmenegger, L., Firdaus, M., Hatakka, J., Heimann, M., Kozlova, E., Spain, T. G., Steinbacher, M., van der Schoot, M. V., and Buchmann, B.: Assessment of recent advances in measurement techniques for atmospheric carbon dioxide and methane observations, Atmos. Meas. Tech., 9, 4737–4757, https://doi.org/10.5194/amt-9-4737-2016, 2016. a, b
Zhao, Y., Pan, Y., Rutherford, J., and Mitloehner, F. M.: Estimation of the interference in Multi-Gas measurements using infrared photoacoustic analyzers, Atmosphere, 3, 246–265, https://doi.org/10.3390/atmos3020246, 2012. a