the Creative Commons Attribution 4.0 License.
the Creative Commons Attribution 4.0 License.
 | 20 Dec 2019
Small-scale heterogeneity of trace metals including rare earth elements and yttrium in deep-sea sediments and porewaters of the Peru Basin, southeastern equatorial Pacific
Sophie A. L. Paul
Matthias Haeckel
Michael Bau
Rajina Bajracharya
Andrea Koschinsky
Due to its remoteness, the deep-sea floor remains an understudied ecosystem of our planet. The patchiness of existing data sets makes it difficult to draw conclusions about processes that apply to a wider area. In our study we show how different settings and processes determine sediment heterogeneity on small spatial scales. We sampled solid phase and porewater from the upper 10 m of an approximately 7.4×13 km2 area in the Peru Basin, in the southeastern equatorial Pacific Ocean, at 4100 m water depth. Samples were analyzed for trace metals, including rare earth elements and yttrium (REY), as well as for particulate organic carbon (POC), CaCO3, and nitrate. The analyses revealed the surprisingly high spatial small-scale heterogeneity of the deep-sea sediment composition. While some cores have the typical green layer from Fe(II) in the clay minerals, this layer is missing in other cores, i.e., showing a tan color associated with more Fe(III) in the clay minerals. This is due to varying organic carbon contents: nitrate is depleted at 2–3 m depth in cores with higher total organic carbon contents but is present throughout cores with lower POC contents, thus inhibiting the Fe(III)-to-Fe(II) reduction pathway in organic matter degradation. REY show shale-normalized (SN) patterns similar to seawater, with a relative enrichment of heavy REY over light REY, positive LaSN anomaly, negative CeSN anomaly, and positive YSN anomaly and correlate with the Fe-rich clay layer and, in some cores, also correlate with P. We therefore propose that Fe-rich clay minerals, such as nontronite, as well as phosphates, are the REY-controlling phases in these sediments. Variability is also seen in dissolved Mn and Co concentrations between sites and within cores, which might be due to dissolving nodules in the suboxic sediment, as well as in concentration peaks of U, Mo, As, V, and Cu in two cores, which might be related to deposition of different material at lower-lying areas or precipitation due to shifting redox boundaries.
Please read the corrigendum first before continuing.
-
Notice on corrigendum
The requested paper has a corresponding corrigendum published. Please read the corrigendum first before downloading the article.
-
Article
(7823 KB)
- Corrigendum
-
Supplement
(93 KB)
-
The requested paper has a corresponding corrigendum published. Please read the corrigendum first before downloading the article.
- Article
(7823 KB) - Full-text XML
- Corrigendum
-
Supplement
(93 KB) - BibTeX
- EndNote


1.1 Fragmentary data sets from the deep sea
The deep-sea floor below 1000 m covers approximately 60 % of our planet's solid surface (Glover and Smith, 2003). Less than 0.01 %, however, has been sampled and investigated in detail so far (Ramirez-Llodra et al., 2010), resulting in a scarce data set. A recent study in the Clarion Clipperton Zone (CCZ) in the central equatorial Pacific found large-scale biogeochemical heterogeneity with respect to, e.g., sedimentation rate, particulate organic carbon (POC) flux, POC contents, oxygen penetration depth, and, thereby, extension of the oxic and suboxic zones (Volz et al., 2018). The analyses, however, were based on one core per work area only, separated by hundreds of kilometers. Similarly, many studies in the past collected cores for porewater and solid-phase geochemical analyses based on sparse sampling distribution and spread over large areas (e.g., Froelich et al., 1979; Klinkhammer, 1980; Toyoda and Masuda, 1991; Drodt et al., 1997; König et al., 1997, 1999; Haley et al., 2004; Schacht et al., 2010; Kim et al., 2012; Soyol-Erdene and Huh, 2013; Kon et al., 2014; Deng et al., 2017; Volz et al., 2018; Abbott et al., 2019). Processes might, however, vary even on small spatial scales. For example, Mewes et al. (2014) showed small-scale biogeochemical porewater variability in the German contract area for deep-sea mining in the CCZ. It remains to be determined whether studies of a few isolated samples are representative for large areas of the deep sea or if these results are coincidental snapshots of a largely unknown, heterogeneous bigger picture.
1.2 Previous work in the Peru Basin
In contrast to most other deep-sea basins, the Peru Basin, located in the southeastern central Pacific at approx. 4100 m water depth (Fig. 1), has been comparably well investigated, including the geochemical composition of its sedimentary solid phase, porewater, and early diagenetic processes (Haeckel et al., 2001; König et al., 2001; Koschinsky, 2001; Koschinsky et al., 2001a, b; Marchig et al., 2001; Stummeyer and Marchig, 2001; Paul et al., 2018). This is because it has been used as a study site for impacts of polymetallic nodule mining on the abyssal environment in the 1980s and 1990s (Thiel and Schriever, 1990; Thiel, 2001). Polymetallic nodules are mineral precipitates of Mn oxides and Fe (oxyhydr)oxides that form around a nucleus, e.g., bone, rock, or nodule fragments, from accretion of Mn oxides and Fe (oxyhydr)oxides from seawater and porewater (Hein and Koschinsky, 2014). Thus, with renewed scientific, industrial, and political interest in deep-sea mining, the Peru Basin has recently received attention again, which allowed for detailed biogeochemical investigations.
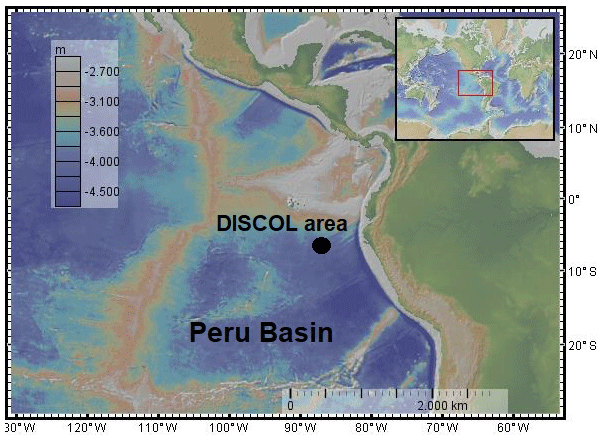
Figure 1The Peru Basin, with the location of the DISCOL area. The map was created using GeoMapApp (http://www.geomapapp.org, last access: 18 December 2019) and its integrated default basemap Global Multi-Resolutional Topography (GMRT) (Ryan et al., 2009).
In 1989, a DISturbance and reCOLonization experiment (DISCOL) was started to investigate potential impacts of polymetallic nodule mining in the Peru Basin (Thiel and Schriever, 1990). The seafloor was plowed in a 11 km2 large circular field, disturbing the upper decimeters of the surface sediment and removing the nodules from the surface (Thiel and Schriever, 1990). Geochemical investigations of nutrients, dissolved organic carbon (DOC), amino acids, solid phase and dissolved trace metals were conducted as part of the follow-up project ATESEPP in 1996 (Schriever et al., 1996). The geochemical work focused on the bioturbated surface layer, where impacts of polymetallic nodule mining are expected (Haeckel et al., 2001; Koschinsky, 2001; Koschinsky et al., 2001a, b), whereas geochemical investigations of deeper sediment layers down to 10 m were only performed on five cores (with only one of them located in the DISCOL area) (Haeckel et al., 2001). Mineralogical investigations of long cores were, however, conducted extensively (Weber et al., 1995, 2000; Marchig et al., 2001). As part of recent work in the MiningImpact project (https://jpio-miningimpact.geomar.de, last access: 18 December 2019), the focus lay again on the surface sediments (Haffert et al., 2020; Paul et al., 2018). To understand biogeochemical processes over longer timescales and to resolve more steps of the redox zonation, the biogeochemical analysis of long sediment cores is crucial.
1.3 Early diagenesis in the Peru Basin
The Peru Basin is located at the southern border of the equatorial high-productivity zone (Weber et al., 2000), where it receives a high input of particulate organic matter. As a consequence, POC contents are 0.5 wt %–1 wt % and oxygen penetrates approx. 5–25 cm into the sediment (Haeckel et al., 2001; Paul et al., 2018). The oxic surface sediments are rich in Mn oxides and associated elements, giving this layer its dark brown color (Koschinsky, 2001; Paul et al., 2018). Below the oxic zone, the sediment is suboxic and Mn oxides are reduced in the course of suboxic POC degradation, leaving the sediment with a tan color. The Fe(III)-to-Fe(II) redox boundary is assumed to occur where the sediment color changes from tan to green. The depth of the tan–green color change coincides with the penetration depth, as the color change typically indicates re-oxidation of Fe(II) to Fe(III) by (Lyle, 1983; Drodt et al., 1997; König et al., 1997, 1999). The Fe(II)∕Fe(III) ratio changes from approx. 11∕89 in the tan layer to 37∕63 in the green layer (König et al., 1997). The first four steps of the typical redox sequence of marine sediments presented by Froelich et al. (1979) – oxygen, nitrate, Mn oxide, and Fe reduction – which develops from the energy gain of the electron acceptors utilized in the degradation of organic matter, are therefore visible here (König et al., 1999; Paul et al., 2018).
1.4 Fe-rich clay minerals
Sediments of the DISCOL area are mainly composed of siliceous and calcareous oozes and muds (Weber et al., 1995). The predominant clay minerals in the sediments are illite, kaolinite, and chlorite (of largely detrital origin), while smectites (authigenic clay minerals) – such as montmorillonite and nontronite – are present in smaller quantities (Fritsche et al., 2001; Marchig et al., 2001). In the Peru Basin, the concentration of nontronite and other authigenic clay minerals increases with increasing distance from the continent (Marchig et al., 2001). Nontronite is the Fe(III)-rich member of the smectite group (Murnane and Clague, 1983), and the structural Fe(III) in nontronite can be reduced reversibly (Russell et al., 1979; Dong et al., 2009). With reduction, the color changes from yellowish to blue-green (Russell et al., 1979, and references therein; Lyle, 1983; Drodt et al., 1997; König et al., 1997). In contrast, Al-rich smectites darken from off-white to gray upon reduction (Lyle, 1983, and references therein).
1.5 Rare earth elements and yttrium (REY)
Rare earth elements and yttrium (REY) are frequently used to reconstruct physicochemical environmental conditions and sediment provenance (e.g., Bau and Dulski, 1999; Bright et al., 2009). Yttrium is trivalent like the rare earth elements (REE) and of a similar ionic size to Ho and therefore closely associated with the REE – then commonly called REY. The REE have slightly decreasing ionic radii with increasing atomic number, which can lead to fractionation, resulting in distinct patterns in the shale-normalized (SN) plots, which can be used to differentiate REY-controlling phases and sedimentary processes. Fractionation can indicate particle–solution interactions in the marine environment, when, for example, Ce and Y are decoupled from their REY neighbors during redox cycling and hydrogenetic Mn and/or Fe (oxyhydr)oxide formation, respectively (Bau et al., 1997, 1998; Bau, 1999). This is because of different surface complex stabilities between the individual REY (Bau et al., 1997). The subtle differences between complex stability constants are sufficient to lead to fractionation because of preferential scavenging or mobilization of the light REY (LREY; La-Nd), middle REY (MREY; Sm-Dy), or heavy REY (HREY; Y-Lu) (Cantrell and Byrne, 1987; Elderfield, 1988). Analyses of REY in sediments in other areas of the Pacific often found a REY association with Ca phosphates or Fe phases (e.g., Elderfield et al., 1981; Toyoda et al., 1990; Kashiwabara et al., 2018; Liao et al., 2019; Paul et al., 2019), especially in areas of hydrothermal activity for the latter (Ruhlin and Owen, 1986; German et al., 1990). REYSN patterns of apatite pellets from Peru shelf sediments display heavy REY (HREY) enrichment, as well as pronounced negative CeSN anomalies and positive YSN anomalies (Piper et al., 1988). Sediments from the Peru Basin that were interpreted to be hydrothermally influenced showed REYSN patterns similar to seawater (HREY enrichment, negative CeSN anomaly, positive LaSN anomaly), but Eu and Y were not reported and measured, respectively (Marchig et al., 1999). Europium can be used to identify a high-temperature hydrothermal influence on the sediment (Michard, 1989; German et al., 1990; Bau, 1991).
Clay minerals such as illite and kaolinite show flat REY patterns when normalized to post-Archean Australian shale (PAAS), European shale (EUS), or any other analogue of average upper continental crust material, due to their detrital origin (Cullers et al., 1975; Prudêncio et al., 1989; Marchig et al., 2001; Tostevin et al., 2016). Nontronite of hydrothermal origin displays seawater-like REYSN patterns, except for a less pronounced CeSN anomaly (Murnane and Clague, 1983; Alt, 1988) and sometimes a EuSN anomaly (Mascarenhas-Pereira and Nath, 2010). To the best of our knowledge, no REY data from non-hydrothermal nontronite have been published yet.
1.6 Research aim
The sampling campaign of the Joint Programming Initiative of Healthy and Productive Seas and Oceans pilot action “Ecological aspects of deep-sea mining” (MiningImpact: https://jpio-miningimpact.geomar.de, last access: 18 December 2019) conducted on R/V Sonne in 2015 found that the sediments in the upper 10 m b.s.f. are surprisingly heterogeneous in the approx. 7.4×13 km2 study area. Therefore, we aim to address the following question: which parameters show heterogeneity with respect to sediment composition and sedimentation input? To shed more light onto this small-scale regional variability, we investigated trace metal distributions in the solid phase and corresponding porewater to distinguish patterns and exceptions with respect to sediment layers, impacts of bathymetry, and early diagenetic processes. We consider such information on small-scale variability important for interpreting the representativeness of individual sediment cores on which previous studies were often based. Here, we focus on parameters relevant for the description of the redox zonation (POC, , Mn, Fe, and the Mn-associated metals Co and Ni), REY and indicators for their controlling phases (P, Al, Fe), CaCO3 and Ba for paleo-reconstructions, and redox sensitive elements, such as U, Mo, As, and V, as well as Cd and Cu.
2.1 Sampling area and methods
Samples were collected from seven gravity cores (GCs) during the R/V Sonne cruise SO242/1 in 2015 to the Peru Basin (Greinert, 2015). A disturbance experiment mimicking nodule mining was conducted in this area in 1989 (DISCOL project), during which a circular area of approximately 11 km2 was traversed with a plow harrow (Thiel and Schriever, 1990). The affected area is called the DISCOL experimental area (DEA), while undisturbed sites around this area are reference areas. Three cores were sampled in reference sites (“Reference South”, “Reference West”, “Reference East”) of this experimental setup, which are spread around the DEA within a ca. 80 m difference in water depth. Within the DEA, we sampled one slightly low-lying area (“DEA Trough”) as well as an area without nodules at the surface, corresponding to low acoustic backscatter intensity in the side-scan sonar images (“DEA Black Patch”). In addition, one GC was taken inside an inactive small volcanic crater in close proximity to the DEA (Fig. 2, Table 1). Areas connected to the deep-sea mining experimental sites are also listed in Table 1.
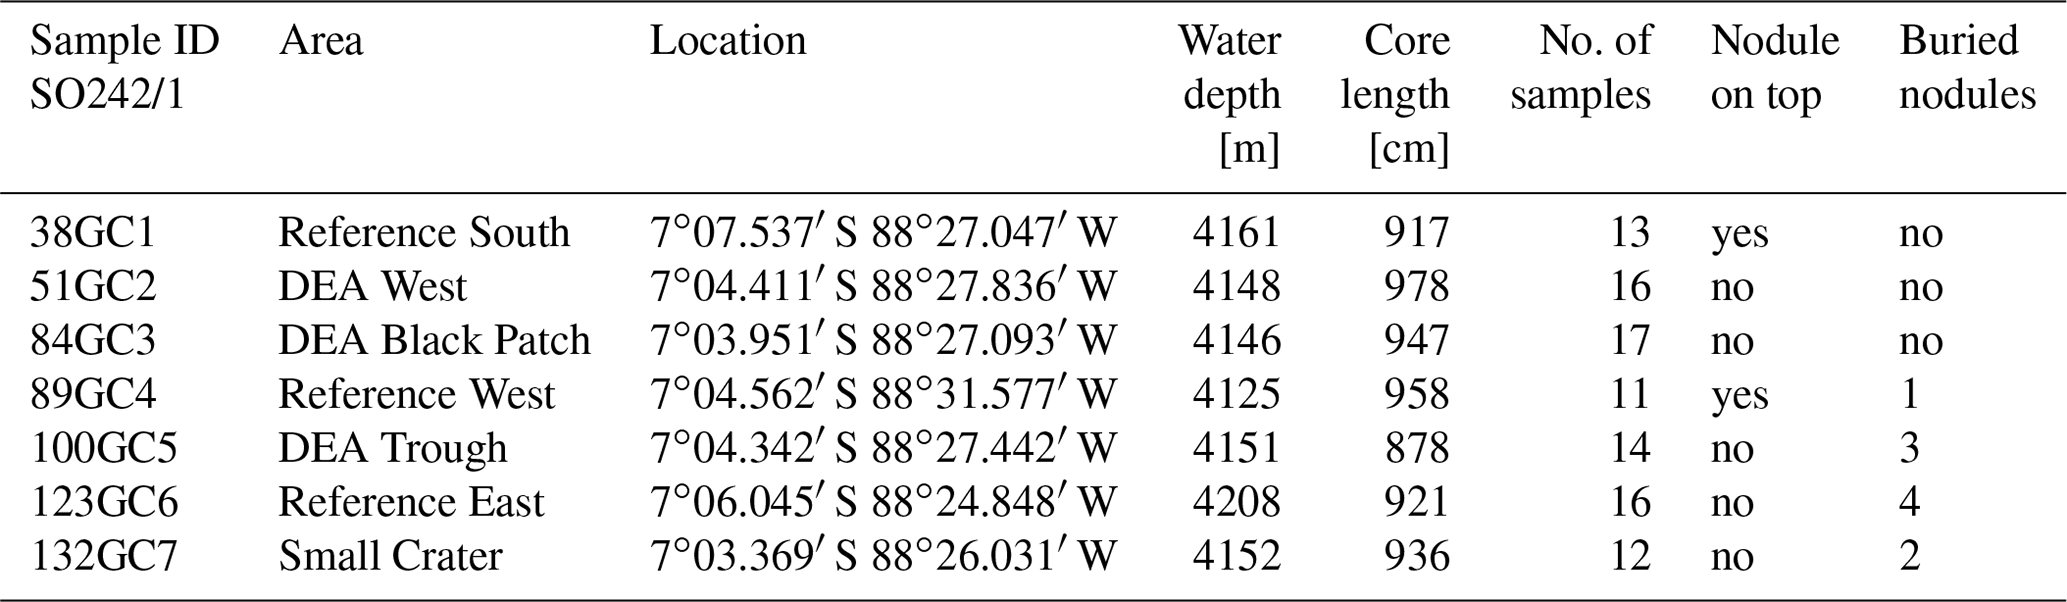
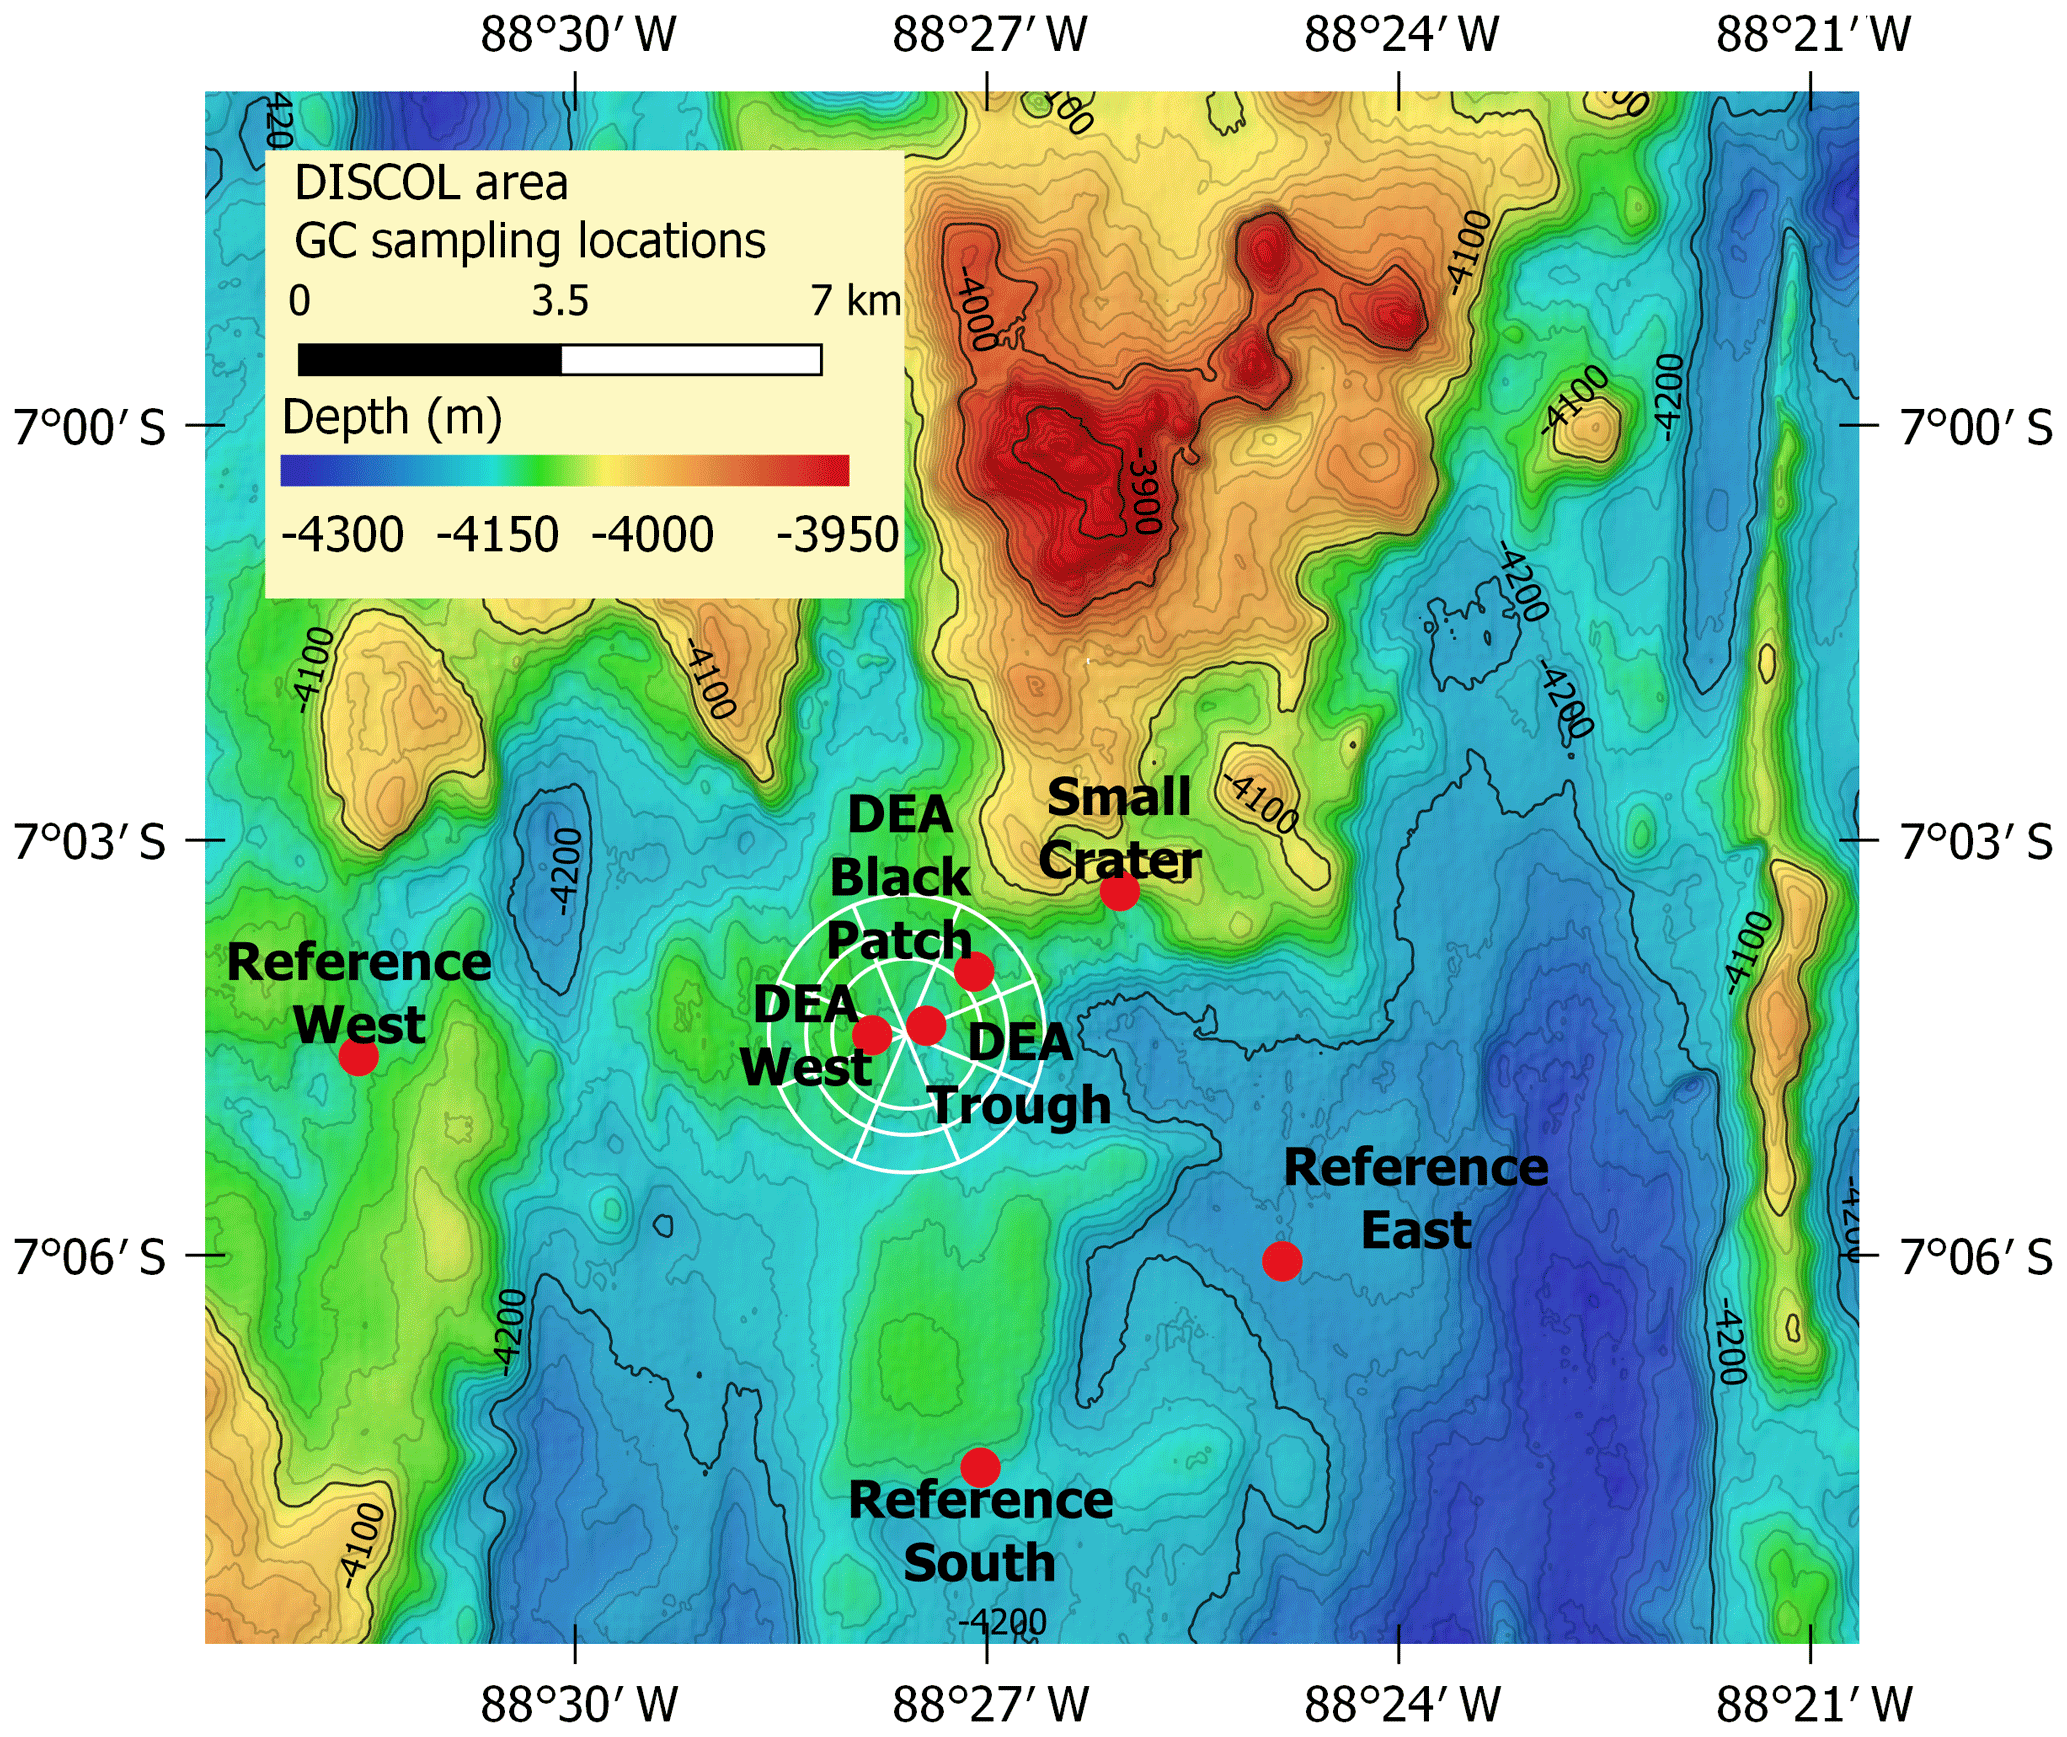
Figure 2GC sampling locations in the Peru Basin. The circle indicates the DISCOL experimental area (DEA) that was traversed with a plow harrow. Created with QGIS with bathymetry data provided by Anne Hennke and Jens Greinert, DSM group, GEOMAR.
The plowing affected approximately the upper 20 cm of the sediment in the tracks and less in areas of resettled sediment, which was determined based on multicorer (MUC) data from the DISCOL area, including the sites corresponding to the GCs presented here (Paul et al., 2018). This upper layer is often lost or disturbed during GC sampling so that the disturbance experiment should not affect the comparison of the GCs, regardless of whether they were sampled in disturbed or undisturbed sites. As the GCs are not sampled with video guidance, it is unclear if a GC was taken exactly in a track or not; therefore, a comparison of disturbed and undisturbed sites is not possible based on GCs.
2.2 Sediment and porewater sampling
Once on deck, GCs were cut into 1 m sections and then divided into a working and an archive half. Working halves were instantly transported to the cold room (approx. 4 ∘C), while the counterparts were stored as archive halves. Samples were immediately collected to minimize contact with ambient air and thereby oxidation of reduced species in suboxic sections of the cores. After visual inspection, sediment was sampled in layers of different color, roughly one to two per meter, and transferred with plastic spoons into 50 mL acid pre-cleaned centrifuge tubes. Gravity core subsampling in ambient air is standard procedure and has been carried out regularly in previous studies (see, e.g., Haeckel et al., 2001; Volz et al., 2018). The Einstein–Smoluchowski relation informs us that diffusion will carry solutes, such as O2, only over a distance of 3 mm in 2 h. Hence, our sampling after splitting the core is quick enough to ensure an almost pristine signal. Our experience with more sensitive variables, such as H2S and Fe2+, supports this. The significant loss of dissolved constituents by oxidation is therefore not expected in the few hours of sampling, especially when sampling in low-temperature conditions (for Mn(II), see, e.g., Schnetger and Dellwig, 2012). Data for other redox-sensitive elements, e.g., U, Mo, V, and As, compare well with porewater data from multicores from these sites, which were sampled in glove bags (Paul et al., 2018). Additionally, centrifuge tubes were completely filled to minimize the oxygen content during centrifugation. Samples were centrifuged at 2061 xg (3200 rpm) for 40 min at 4 ∘C to separate porewater from the solid phase. In a glove box with a steady stream of argon gas, porewater was then filtered through 0.2 µm cellulose acetate (CA) syringe filters, which had been cleaned previously with 0.1 M suprapure hydrochloric acid (HCl) and deionized water. In the past, sometimes 0.45 µm filters were used, e.g., in studies by Shaw et al. (1990) and Beck et al. (2008) to which we also compare the dissolved concentrations but this intercomparison is frequently done and no significant differences have been noticed so far. Porewater samples were acidified with suprapure HCl (30 %) using 1 µL for 1 mL of sample and kept cool until further analysis.
2.3 Chemical analyses
To determine bulk sediment metal concentrations, 100 mg of ground and oven-dried (105 ∘C) sample was acid pressure digested in a PicoTrace DAS system at 220 ∘C for 12 h using 3 mL of perchloric acid (HClO4, 70 %, suprapure) and 3 mL hydrofluoric acid (HF, 38 %–40 %, suprapure). Samples were evaporated and taken up in HCl (20 %–30 %, suprapure) two times and at the end in 0.5 M nitric acid (HNO3, suprapure) and 0.47 M HCl (suprapure). Some digested samples had small black particles left after the digestion and were filtered through 0.2 µm CA filters prior to analyses. Method comparison with other geochemistry labs at the beginning of this project showed that the black particles do not affect the final results. Samples digested using the method above compared well with samples digested in a microwave digestion system using HCl, HNO3, and HF, and samples did not show black particles. For major elements, solutions of digested solid-phase samples were measured with inductively coupled plasma optical emission spectrometry (ICP-OES, SpectroCiros Vision Side On Plasma instrument) and for trace elements, including REY, with inductively coupled plasma mass spectrometry (ICP-MS, Perkin Elmer Nexion 350x) at Jacobs University Bremen. For porewater analyses, the sample was first passed through an apex Q (Elemental Scientific, ESI) connected to the ICP-MS. The desolvation nebulizer introduces the sample solution into a heated spray chamber and subsequently into a cooled condenser. The apex Q thereby enhances sample introduction efficiency to decrease background noise and increase sensitivity. Additionally, dissolved V, Mn, Co, Cu, As, and Mo were measured in kinetic energy discrimination mode using He gas to remove polyatomic interferences. The certified reference materials (CRMs) MESS-3 and BHVO-2 were used for sediment and NASS-6, NASS-7, and SLEW-3 for porewater samples (https://www.nrc-cnrc.gc.ca, last access: 18 December 2019; crustal.usgs.gov). Accuracy and precision were determined based on averages of the CRMs from ICP-OES and ICP-MS runs. Accuracy for Al in MESS-3 during ICP-OES measurements (n=13) was within 20 % but has been known to have Al values that are too low for some digestion methods (Roje, 2010). Data below the limit of quantification (LOQ) were excluded, except for porewater As values of 84 and 132 GC, due to good agreement of NASS-7 As data, which are in the same range as the sample concentrations. For detailed information about LOQ, accuracy, and method precision, see Supplement S1.
2.4 Nitrate
Nitrate was measured directly after sampling on board RV Sonne. Analyses followed standard procedures described by Grasshoff et al. (1999), using Cd for reduction to and determining it as sulfanile-naphthylamide with a Hitachi UV/VIS spectrophotometer. Method precision was 3 % and the limit of detection was 2 µmol L−1.
2.5 Particulate organic carbon (POC) and CaCO3
Total carbon of freeze-dried, ground sediment was measured at the GEOMAR laboratories in Kiel with a Carlo-Erba NA-1500 Elemental Analyzer, analyzing CO2 that was produced by flash combustion. To determine total organic carbon and CaCO3, carbonate-bound carbon was removed with HCl from the sample prior to organic carbon measurement and the total inorganic carbon content was calculated from the difference between total carbon and organic carbon. It was then converted to CaCO3 wt %.
2.6 Depth correction for GCs and CaCO3 correction
Part of the semiliquid surface sediments of the DISCOL area is typically lost from the GCs when placing the barrel horizontally on deck. Hence, the thickness of the lost sediment was estimated by comparison of various geochemical data (i.e., POC, CaCO3, porosity, dissolved silicate) and core photos of the GCs with MUCs to derive true sediment depths of the samples. On average, between 10 and 30 cm were lost before sampling.
Solid-phase data (except Ca) are presented on a carbonate-free basis and were corrected for CaCO3 due to high carbonate concentrations in some layers (Eq. 1). Different sediment aliquots were taken for CaCO3 and metal analyses, and therefore the corrections were calculated using CaCO3 data within a range of up to 15 cm of mean metal sediment sample depth. Buried nodule data were not corrected for CaCO3. For more details, see https://doi.pangaea.de/10.1594/PANGAEA.903517.
2.7 Reporting of REY data
All REY patterns are normalized to PAAS, using REY data from McLennan (1989). Normalization to EUS (Bau et al., 2018) or any other analogue of average upper crustal material provides similar REYSN patterns. Anomalies of REY in the SN patterns were calculated as described in Eq. (1). This equation calculates the ratio of, e.g., CeSN∕CeSN*, which results in the value of the anomaly and helps to discern the extent of the respective anomaly.
Calculation of CeSN anomaly was performed following Bau and Dulski (1996a):
3.1 Core descriptions
The Mn-oxide-rich dark brown top layer was largely lost in all gravity cores except for the core from “Small Crater” where 10 cm remained. In the Reference West core it was completely absent. Below, all cores have a light brown to grayish brown color (2.5Y5∕2 or 6∕2 on the Munsell color chart; de Stigter, 2015) until approx. 2–2.5 m, followed in four cores (i.e., Reference South, DEA Black Patch, DEA Trough, and Reference East) by a greenish gray color (5Y5∕2, 5Y6∕2; 5GY5∕1 on the Munsell color chart; de Stigter, 2015) to approx. 5–7 m depth. The cores of Reference West, DEA West, and Small Crater showed an olive color (2.5Y5∕3 at around 1 m in the DEA West core and 2.5Y5∕4 at around 1–2 m in the Small Crater core). At the bottom 2–2.5 m of all GCs, mottled dark brown sediment (10YR4∕3, 4∕4 and 5∕4 on the Munsell color chart; de Stigter, 2015) was found (Fig. 3).
The GCs of Reference South and Reference West recovered a nodule from the sediment surface, whereas buried nodules were found in the cores of Reference West at 458 cm*; DEA Trough at 387 cm*, 468 cm*, 564 cm, and 667 cm*; Reference East at 290 cm*, 346, 747, and 870 cm; and Small Crater at 719 and 792 cm; those values with an asterisk were analyzed as part of this study. Consequently, buried nodules exist below 290 cm in the DISCOL area. The dissolving nodules in DEA Trough at 468, 564, and 667 cm, and at Reference East at 290 and 747 cm have brownish “halos” around them in the green sediment. In DEA Black Patch at 497 cm and in DEA Trough at 585 cm, there are brown patches within the green sediment without a buried nodule being visible.
In Reference East, diffuse dark gray bands of approximately 1 cm thickness are found at depths of 229.5, 236.5 and 330 cm. The dark gray bands are present again between 324 and 358 cm, from 386 to 402 cm and 510 to 518 cm depth (de Stigter, 2015). Between 476 and 500 cm, the gray bands extend vertically (de Stigter, 2015).
POC and nitrate are presented because they are important parameters when analyzing the redox zonation of marine sediments. POC contents in the sediment vary between approx. 0.5 wt % and 0.8 wt % in the upper layers and decrease with depth to approx. 0.1 wt % to 0.4 wt % (Fig. 4). Nitrate concentrations are 50–70 µmol L−1 in surface sediments and are depleted (< 10 µmol L−1) within the upper 2–3 m, except in cores Reference South, where is depleted at ∼6 m, and Reference West and Small Crater, where remains at approx. 25 µmol L−1 throughout the core (Fig. 3).
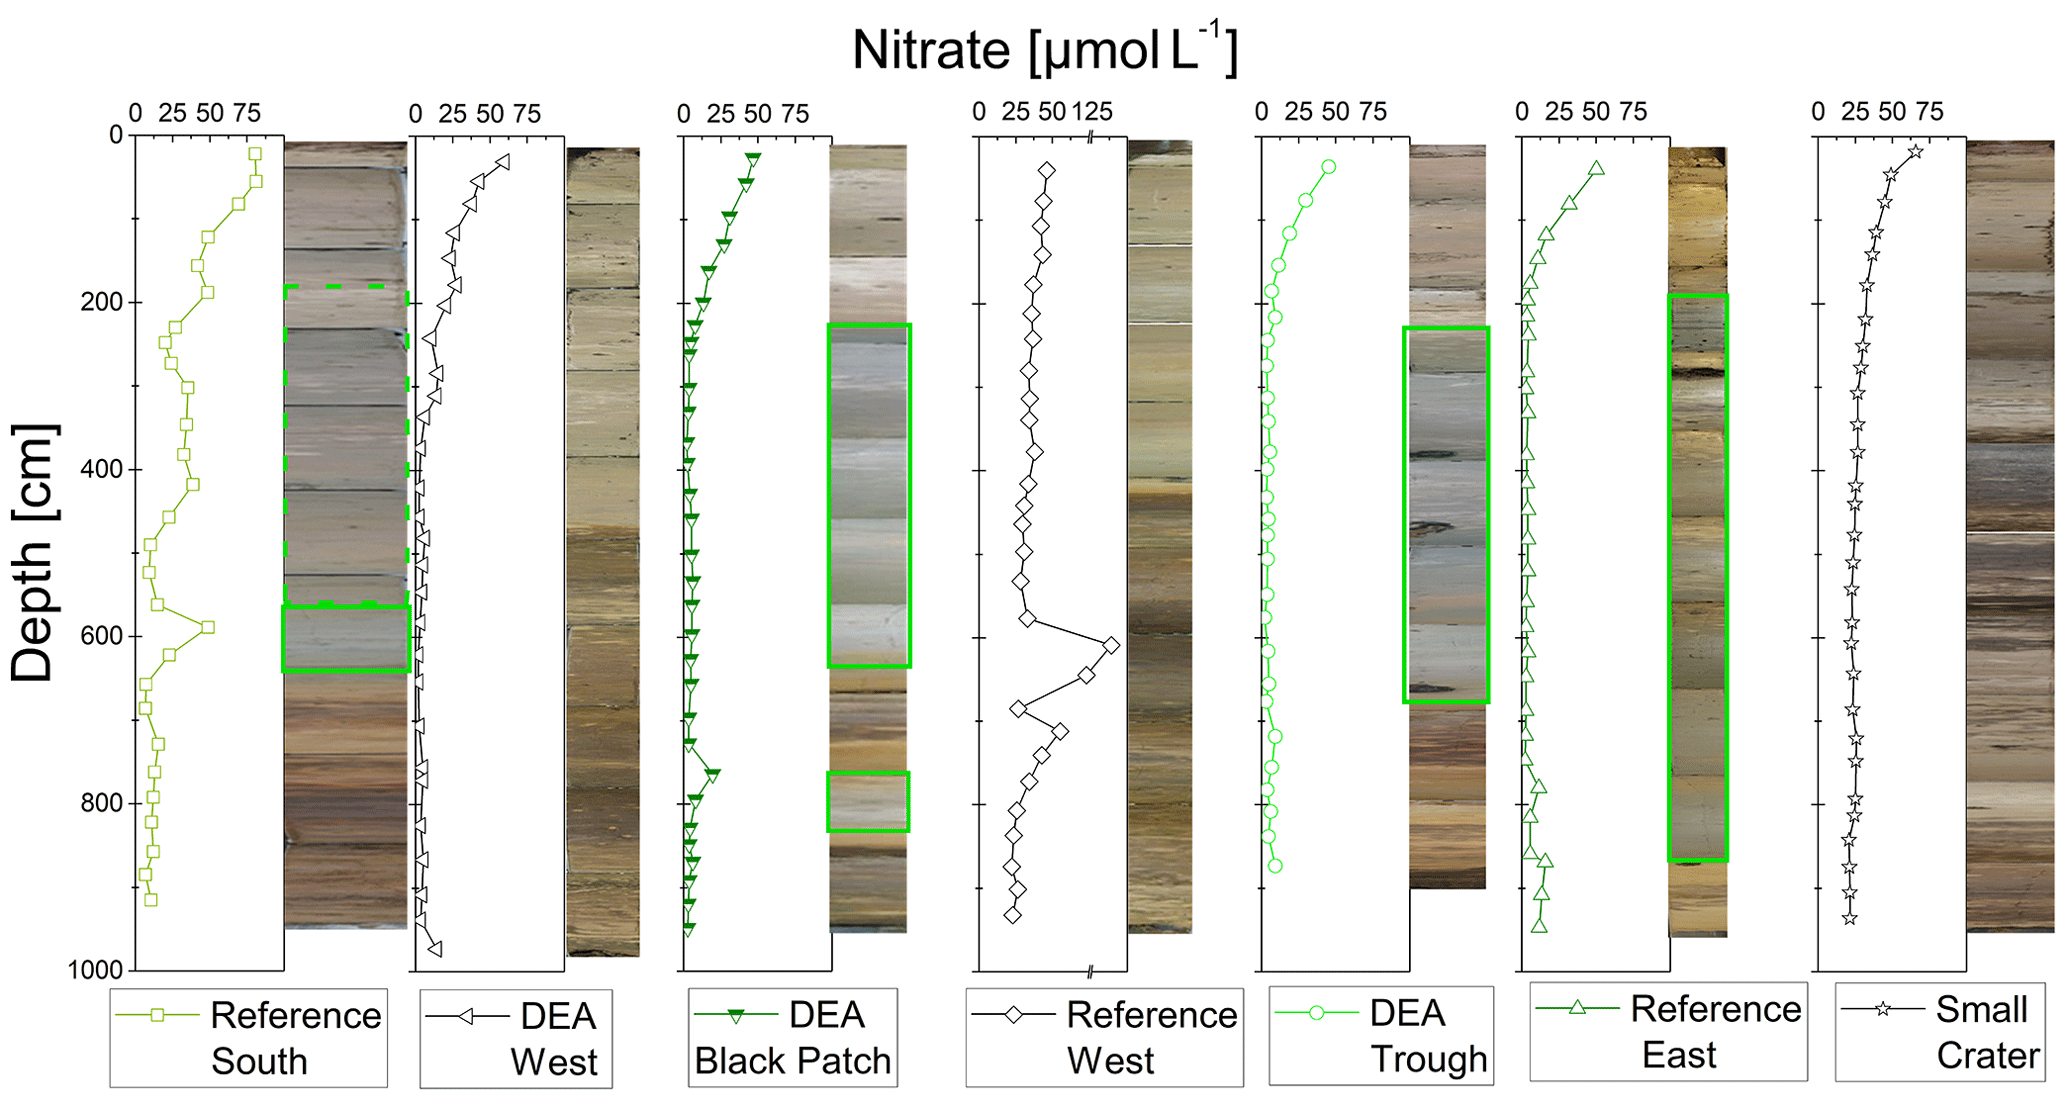
Figure 3Combined photos of the individual GCs with corresponding nitrate profiles. Green layers are marked with green boxes.

3.2 Ca, CaCO3, Ba, Al, Fe, Mn, and associated metals
Calcium concentrations are around 1 wt % throughout most of the sediment cores with increased concentrations of up to 15 wt % between 150 and 500 cm as well as between 800 and 1000 cm (Fig. 5). Calcium carbonate concentrations are therefore also elevated in these depth ranges, with concentrations of up to 35 wt %. Barium concentrations are generally between 0.5 wt % and 1 wt % in the upper 400 cm and increase downcore, except at Small Crater, where concentrations are relatively constant (Fig. 5).
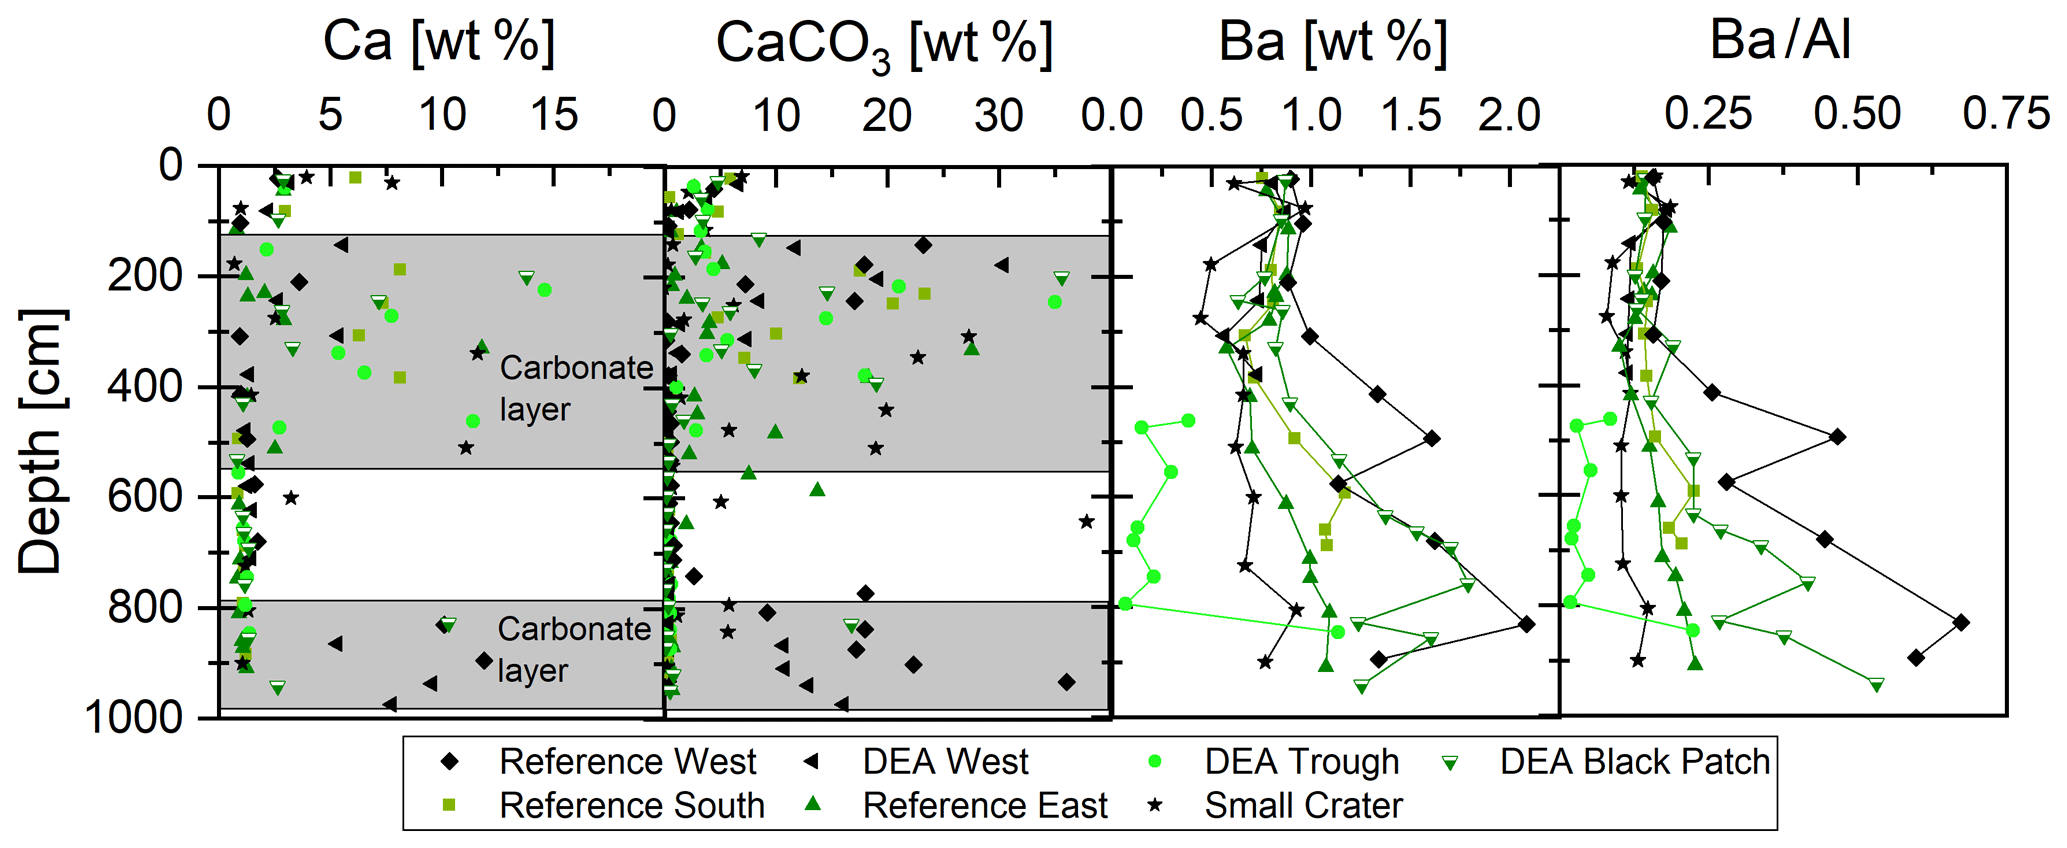
Figure 5Depth profiles of solid-phase Ca, CaCO3, and Ba concentrations, as well as Ba∕Al ratios. Core intervals with higher contents of preserved carbonate are shaded in gray.
Aluminum concentrations decrease below 400 cm depth, most strongly at the western sites of Reference West and DEA West. In these cores, concentrations of P, Cu, Mn, as well as metals associated with Mn, such as Ni and Co, increase below 400 cm (Fig. 6). Iron displays a constant concentration of 3 wt %–4 wt % down to 3–4 m. Further below, Fe concentrations increase up to 7.5 wt % at the bottom of all cores (Fig. 6). Consequently, the Fe∕Al ratio, which eliminates effects from CaCO3 and opal dilution and allows for the interpretation of Fe depletion or enrichment relative to detrital sources (Lyons et al., 2003), is stable in the upper approx. 400 cm at around 0.65–0.75 and increases to 1.2–1.5 at depth. The increase, pointing to an Fe enrichment, is much more pronounced in the westerly cores of Reference West and DEA West, while the easterly cores show no substantial increase (Small Crater) or only to around an Fe∕Al ratio of 1.10 (Reference East). Mn∕Al displays similar profiles, with higher ratios in Reference West and DEA West (0.3–1.3), while the other cores have similar ratios between 0.02 and 0.2 except for a few single layer outliers.
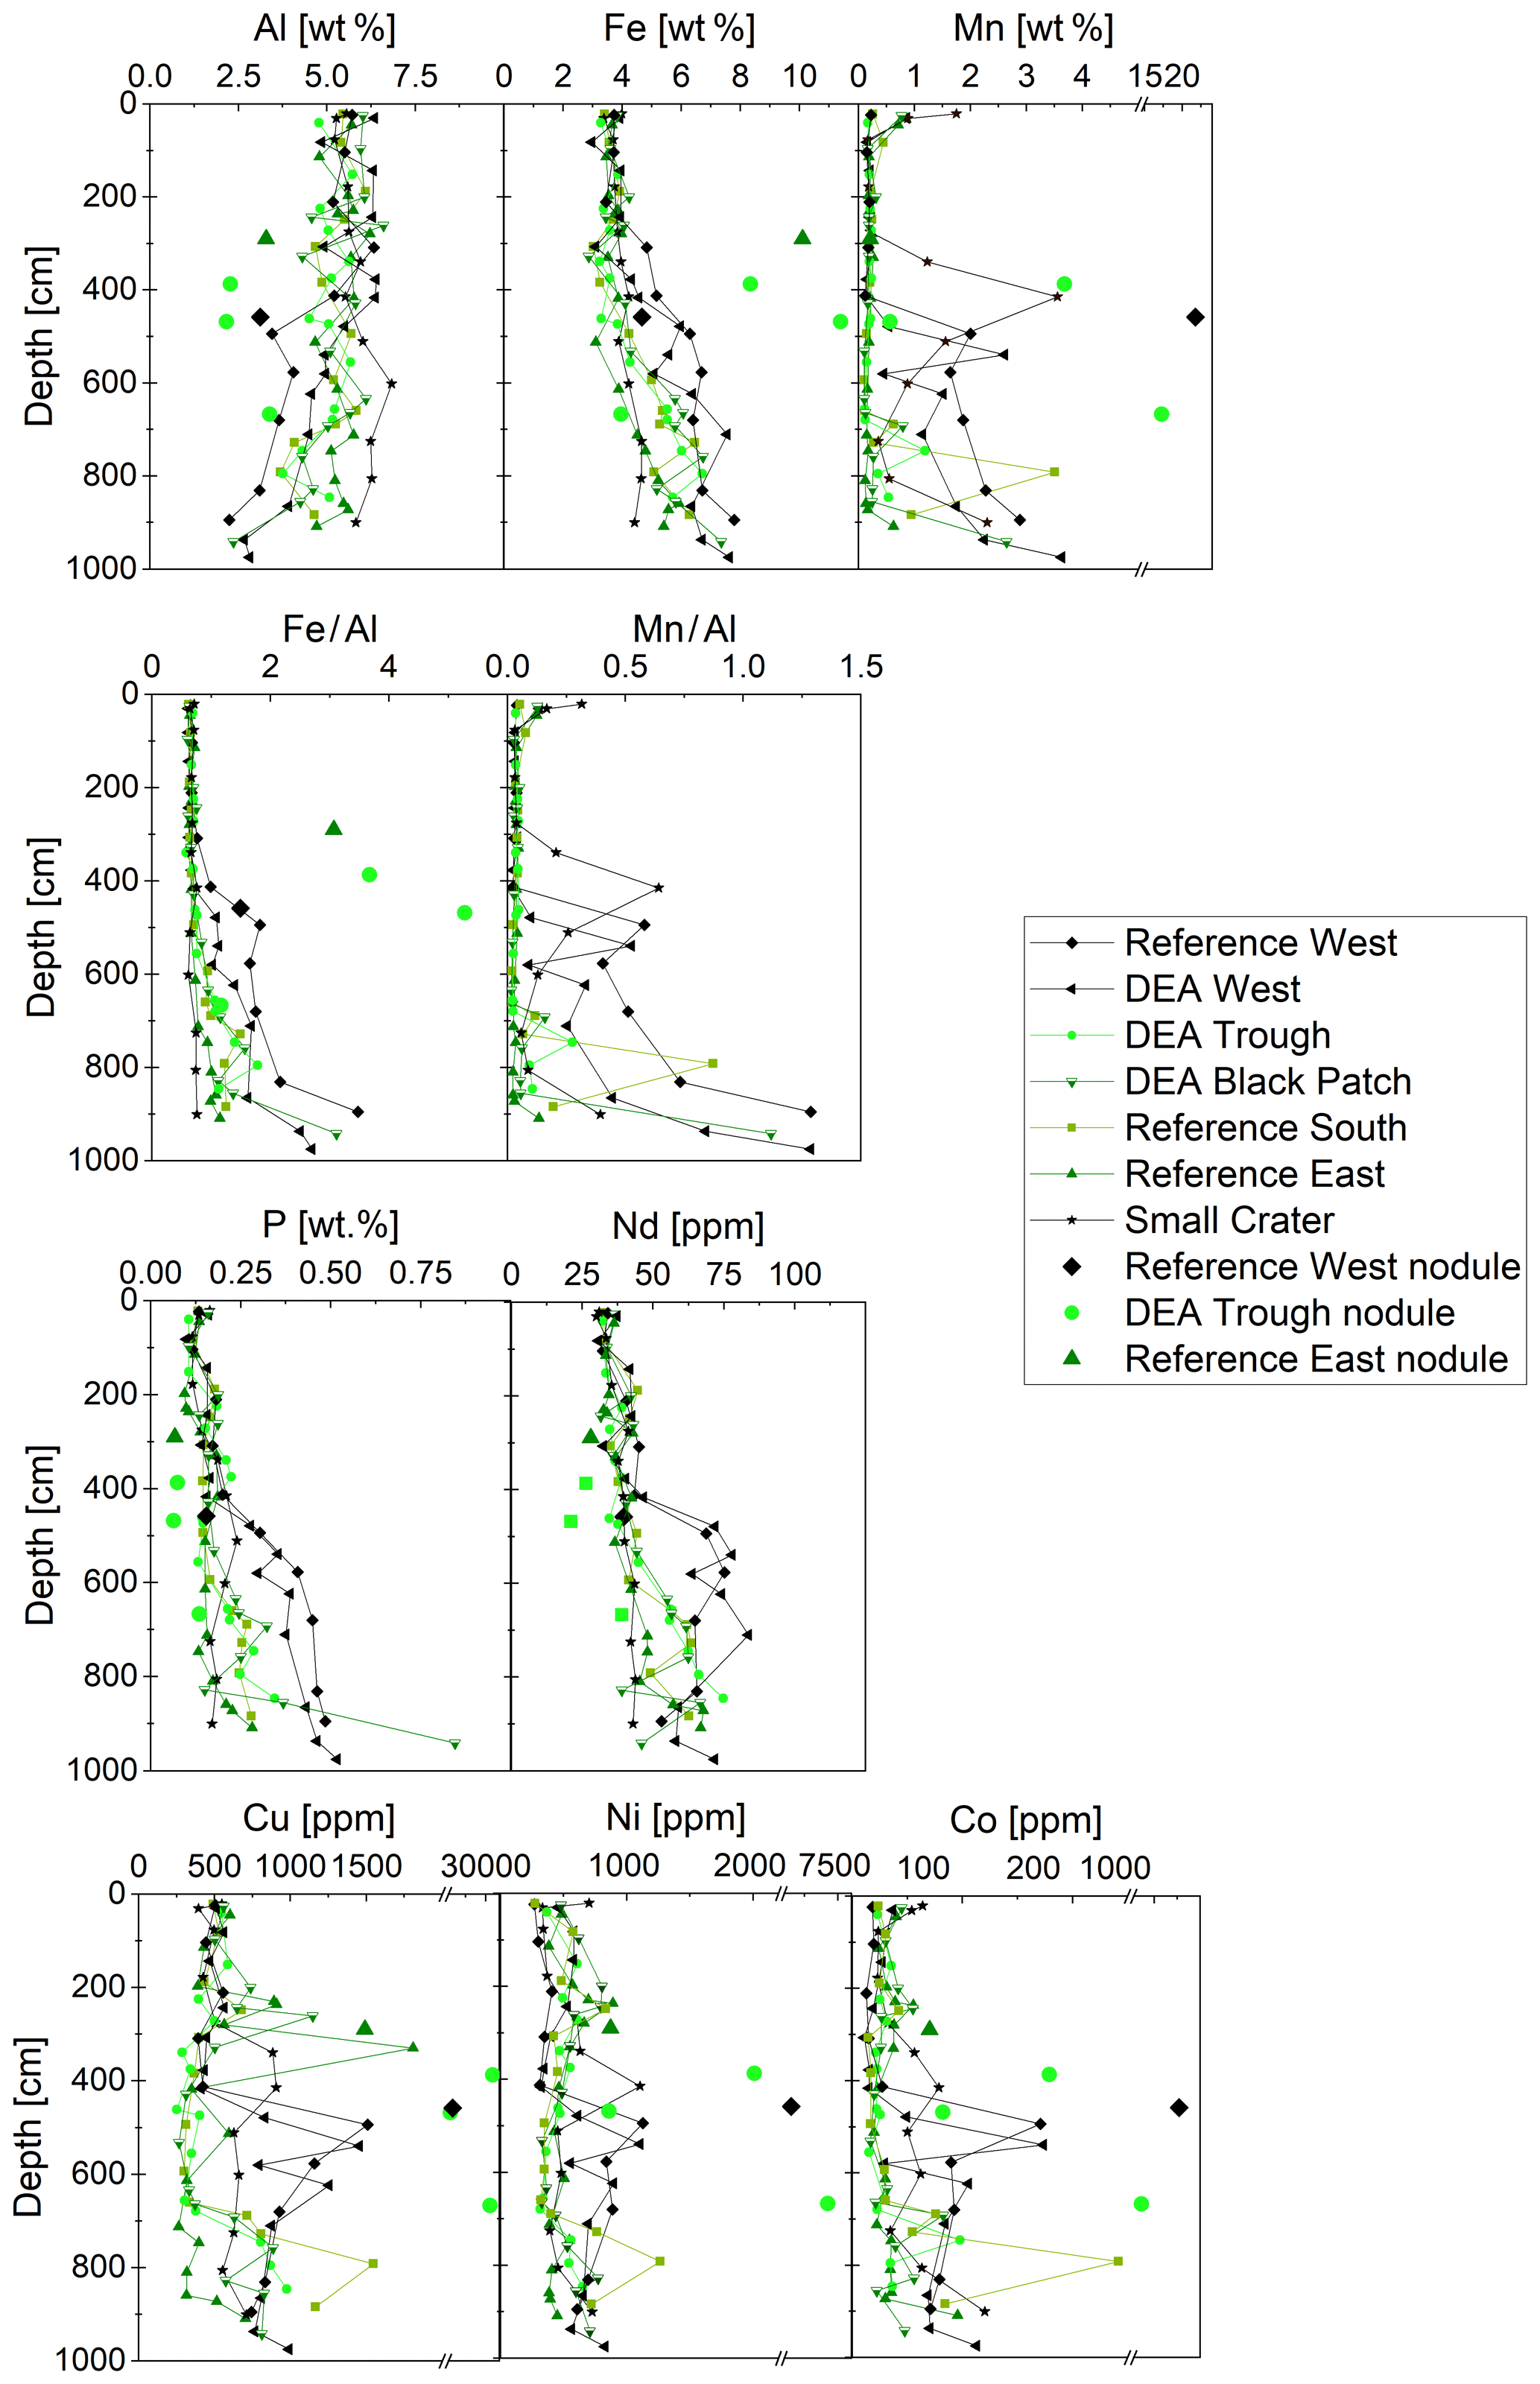
Figure 6Solid-phase Al, Fe, Mn, P, Nd, Cu, Ni, and Co concentrations in the sediment cores, including those of the buried nodules at Reference West at 458 cm; at DEA Trough at 387, 468, and 667 cm; and at Reference East at 290 cm. Nd is shown as a representative of the REY. Fe∕Al and Mn∕Al ratios (for the latter no data for the nodules are shown) are also displayed as depth profiles, focusing on the Fe and Mn enrichment in relation to continental sources (Al).
Manganese concentrations in the porewater increase with depth in varying gradients, asymptotically reaching maximum concentrations of 40–130 µmol L−1 at depths below 5–8 m (Fig. 7). Concentrations are lower in the western areas and the Small Crater where nitrate does not get depleted (Fig. 3). Such a distinct difference between the sites can also be observed in dissolved Co concentrations. However, dissolved Co concentration profiles display elevated concentrations compared to bottom water already between 2 and 3 m, and show a further increase below 6 m. The Reference West core exhibits the lowest Co concentrations. In contrast, dissolved Cu concentrations remain rather low and show no downcore trend.
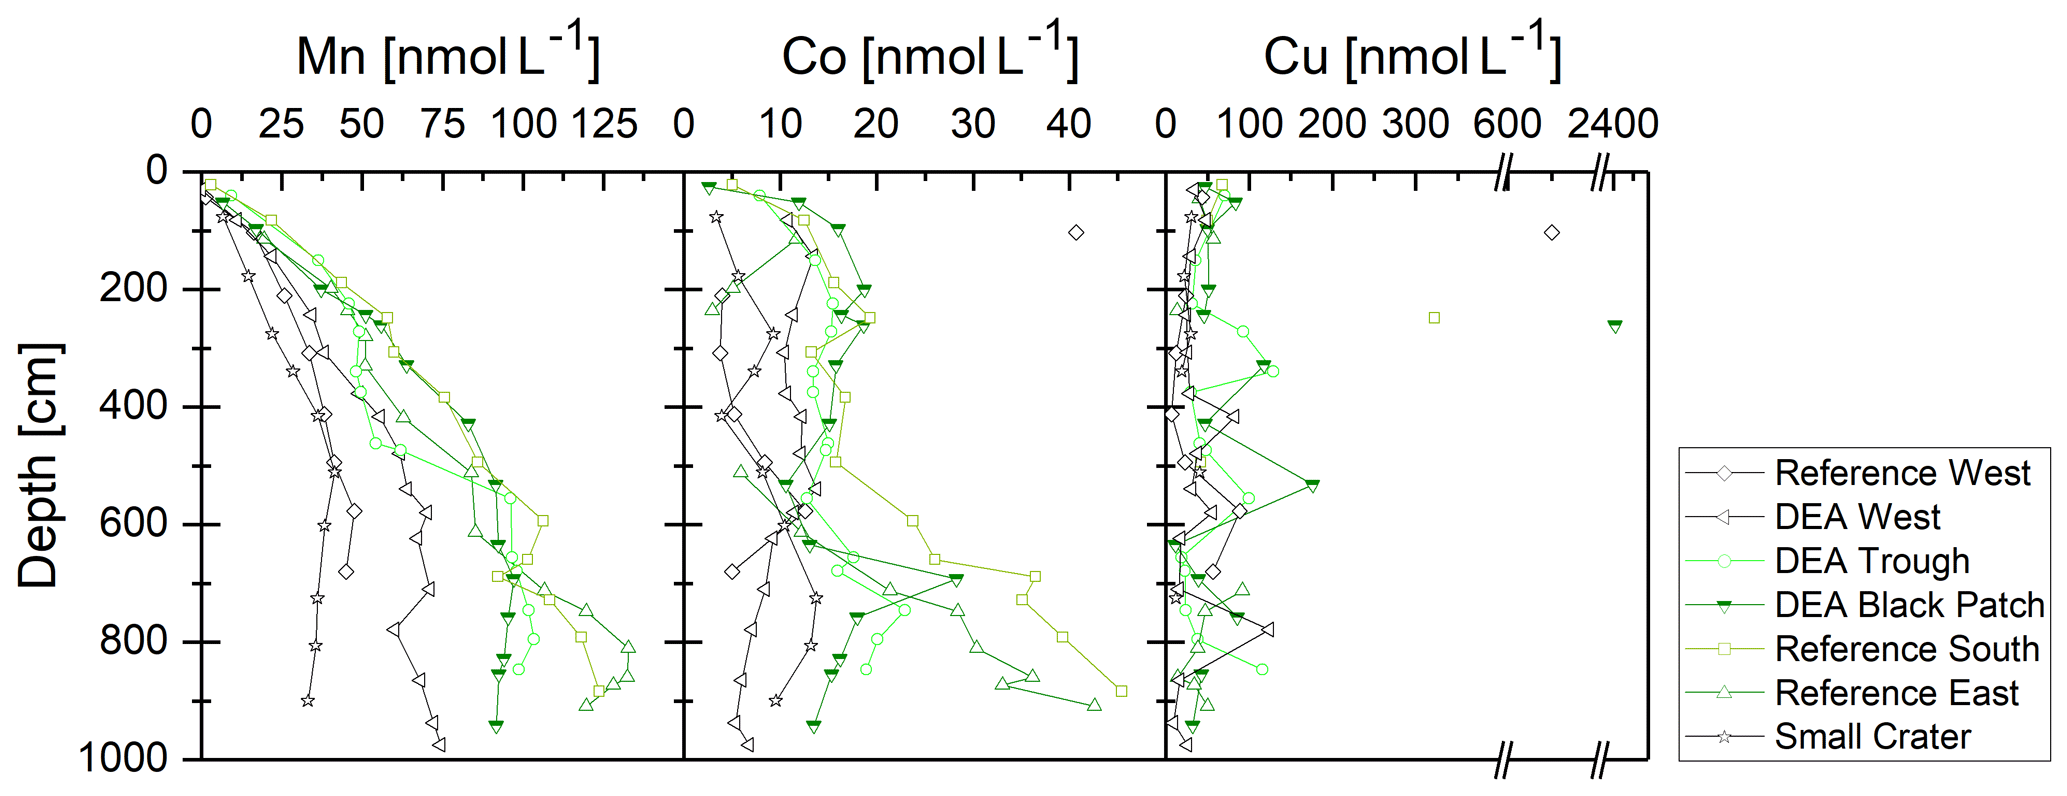
Figure 7Dissolved Mn, Co, and Cu concentrations in the porewater of the sediment cores. No porewater could be extracted from buried nodules.
3.3 Redox-sensitive metals U, Mo, V, As, and Cd: solid phase and porewater
Dissolved concentrations of the redox sensitive elements, such as U, Mo, and As, as well as Cd, are constant with depth in suboxic porewaters, and U and Mo also show straight profiles in the solid phase (Fig. 8). As and Cd could not be determined in the solid phase due to the formation of gaseous AsF5 during HF digestion of the samples as well as unreliable Cd measurements with the ICP-MS. Considerable peaks in the solid phase porewater concentrations of U, Mo, and As (only porewater) are, however, visible for Reference East at depths 229.5, 236.5, and 330 cm, where diffuse dark gray bands of approximately 1 cm thickness exist in the sediment (de Stigter, 2015). Vanadium concentrations peak at 229.5 cm in the solid phase (240 ppm), and the concentration is still elevated at 236.5 cm (194 ppm), which is again reflected in the porewater profiles. There is an additional peak in the solid-phase concentration at 290 cm, where the buried nodule was sampled, but no porewater data exist for this exact layer. At DEA Black Patch, dissolved U, V, and Cu peaks coincide at 261 cm and U and Cd coincide at 328 cm (Fig. 8). Solid-phase concentrations of U and V are also elevated in these layers (Fig. 8).
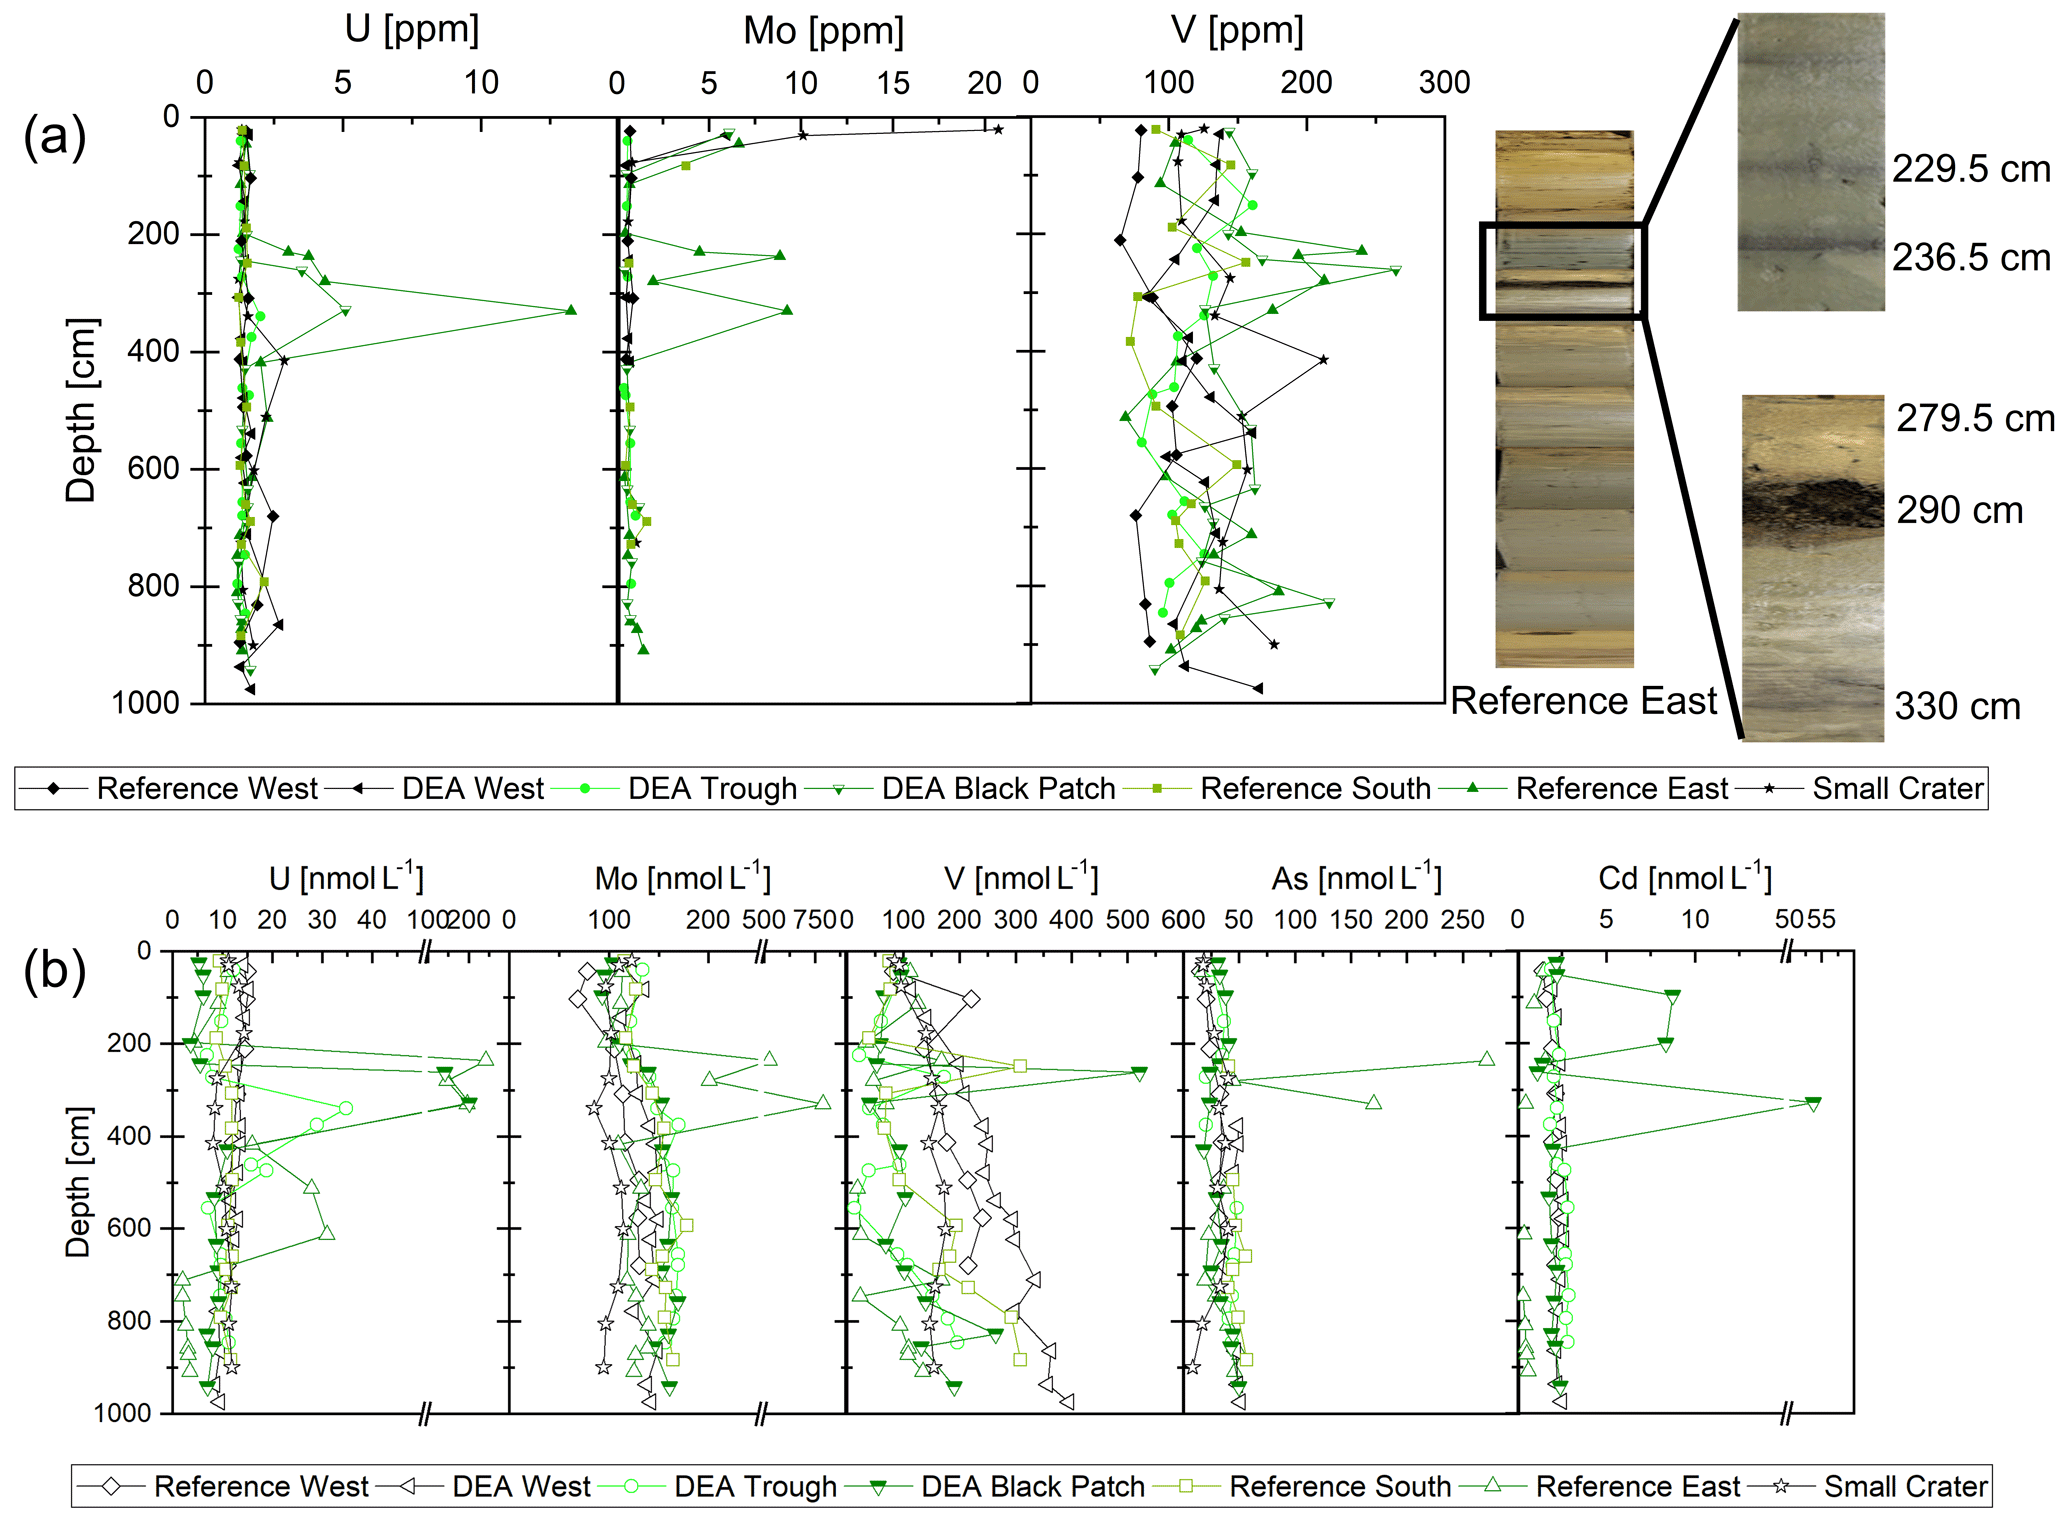
Figure 8(a) Solid-phase concentrations of U, Mo, and V. Concentration peaks are visible at 229.5, 236.5, and 330 cm for Reference East, coinciding with the gray bands in the sediment (see pictures on the right). In this core, a dissolving nodule was also found at 290 cm (see pictures on the right). (b) Dissolved concentrations of U, Mo, V, As, and Cd in the porewater. Depths of 229.5 and 290 cm at Reference East were not measured. Concentration peaks are visible at 236.5 and 330 cm for Reference East, coinciding with the gray bands in the sediment (see pictures on the right).
3.4 REY profiles and patterns: solid phase and porewater
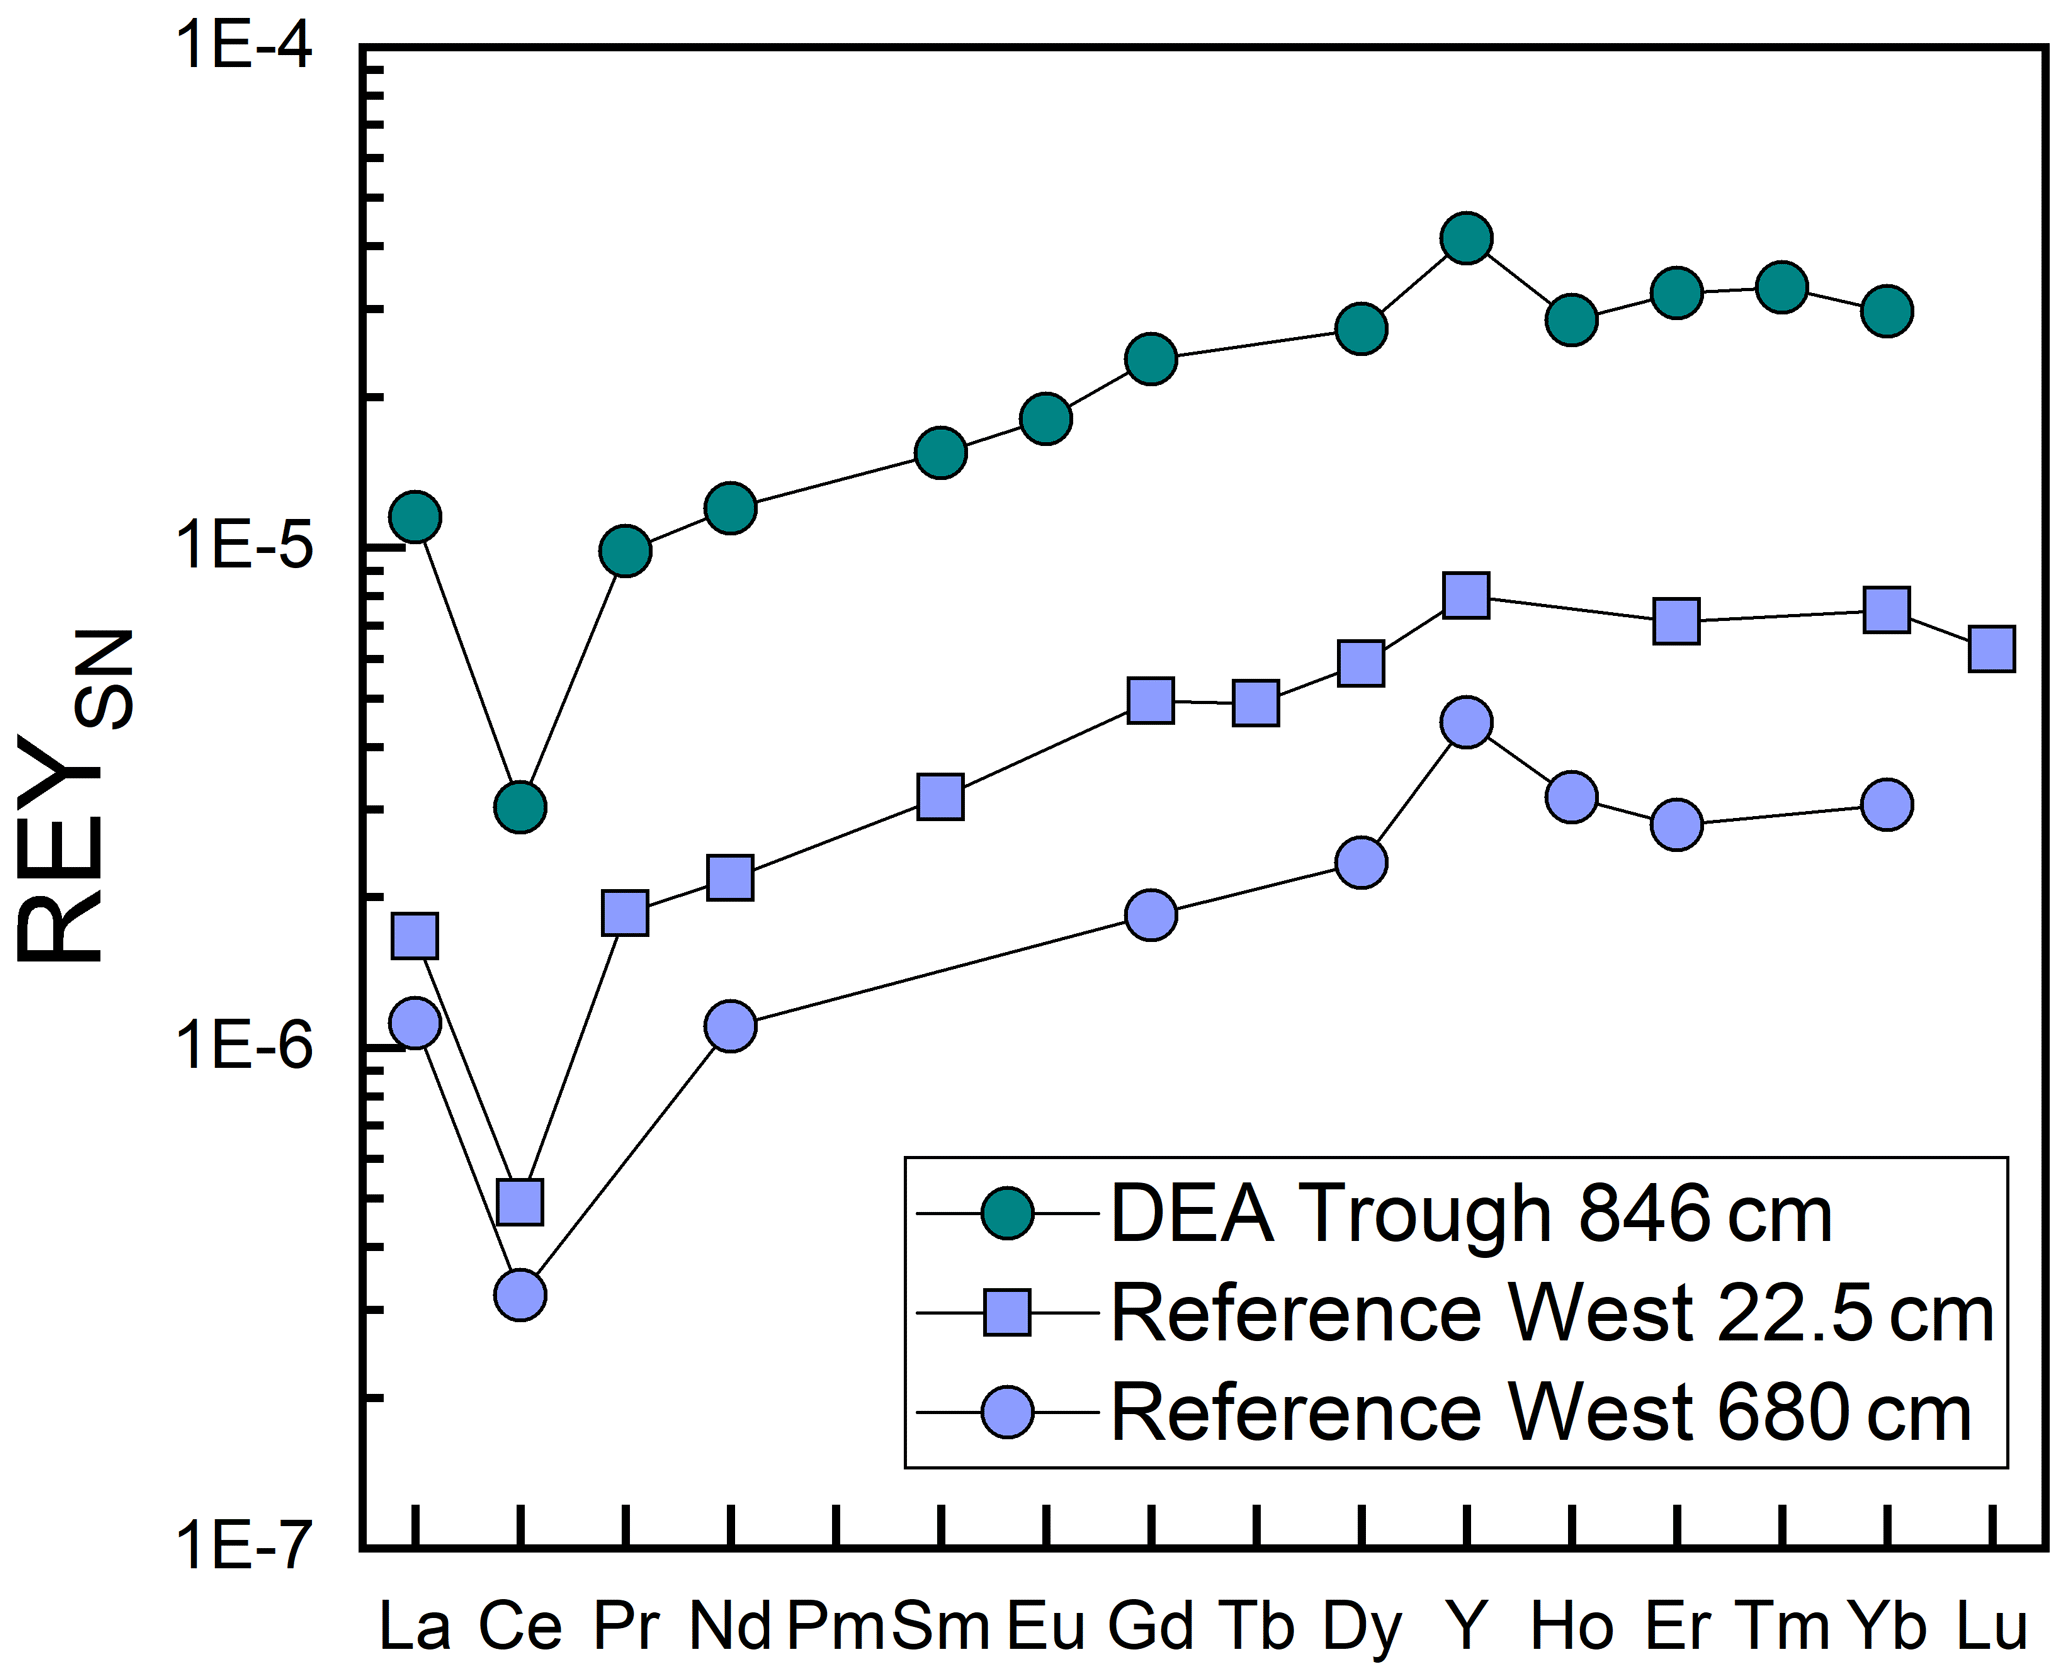
Like Fe and P, REY concentrations increase with depth, especially at Reference West and DEA West (Fig. 6), except for at Small Crater. The sum of REY concentrations varies between approx. 180 and 550 ppm (not shown). The buried nodules at Reference West, DEA Trough, and Reference East show similar to slightly lower REY concentrations compared to the sedimentary REY (see Nd in Fig. 6). Too few porewater data are available to make statements about the concentration trend with depth. All solid-phase REYSN patterns show an enrichment of HREY over LREY with LaSN∕YbSN ratios of 0.20–0.50; a negative CeSN anomaly; and positive LaSN, EuSN, GdSN, and YSN anomalies (Fig. 9). The negative CeSN anomaly increases with depth (CeSN∕CeSN* = 0.6–0.3), the only exception being Small Crater, where the CeSN∕CeSN* ratio remains at around 0.6 throughout the core. Y∕Ho ratios range between 29 and 42, i.e., representing chondritic to super-chondritic values, and Eu∕Eu* ratios are between 1.2 and 1.4. The Eu∕Eu* ratios are, however, not pronounced enough to interpret a clear signal and are in the same range as reported for seawater (Tostevin et al., 2016). REYSN patterns of the buried nodules show LaSN∕YbSN ratios of 0.40–0.44, similar to the sediment solid-phase REY, with negative CeSN anomalies; slightly positive LaSN, EuSN, and GdSN anomalies; and Y∕Ho ratios of 27–30 (Fig. 9). Porewater REYSN also shows an HREY enrichment, a negative CeSN anomaly and a positive YSN anomaly (Fig. 10), similar to the sedimentary solid-phase REYSN patterns. All cores, except Small Crater, can be divided into an upper and a lower section based on the REY concentration increase, increase in Fe∕Al ratios, and a decrease in CeSN∕CeSN* ratios: Reference West and DEA West at 4.5 m; Reference South, DEA Black Patch, and DEA Trough at 6 m; and Reference East at 8 m (Fig. 9). The Fe∕Al ratios remain steady in the Small Crater core, as well as the negative CeSN anomaly. The first three above-mentioned cores (Reference West, DEA West, Reference South) also have higher Y∕Ho and LaSN∕PrSN ratios in their lower parts. The concentration increase is associated with the bottom of the green layer in cores Reference South, DEA Black Patch, DEA Trough, and Reference East. In Reference West and DEA West, where no green layer exists, the concentration increase correlates with the color change from tan to dark brown at approx. 4.5 m and the increasing Fe and P concentrations at the corresponding depth. REY are most abundant, where a higher percentage of Fe(II) in the clay minerals prevails (Reference West and DEA West).
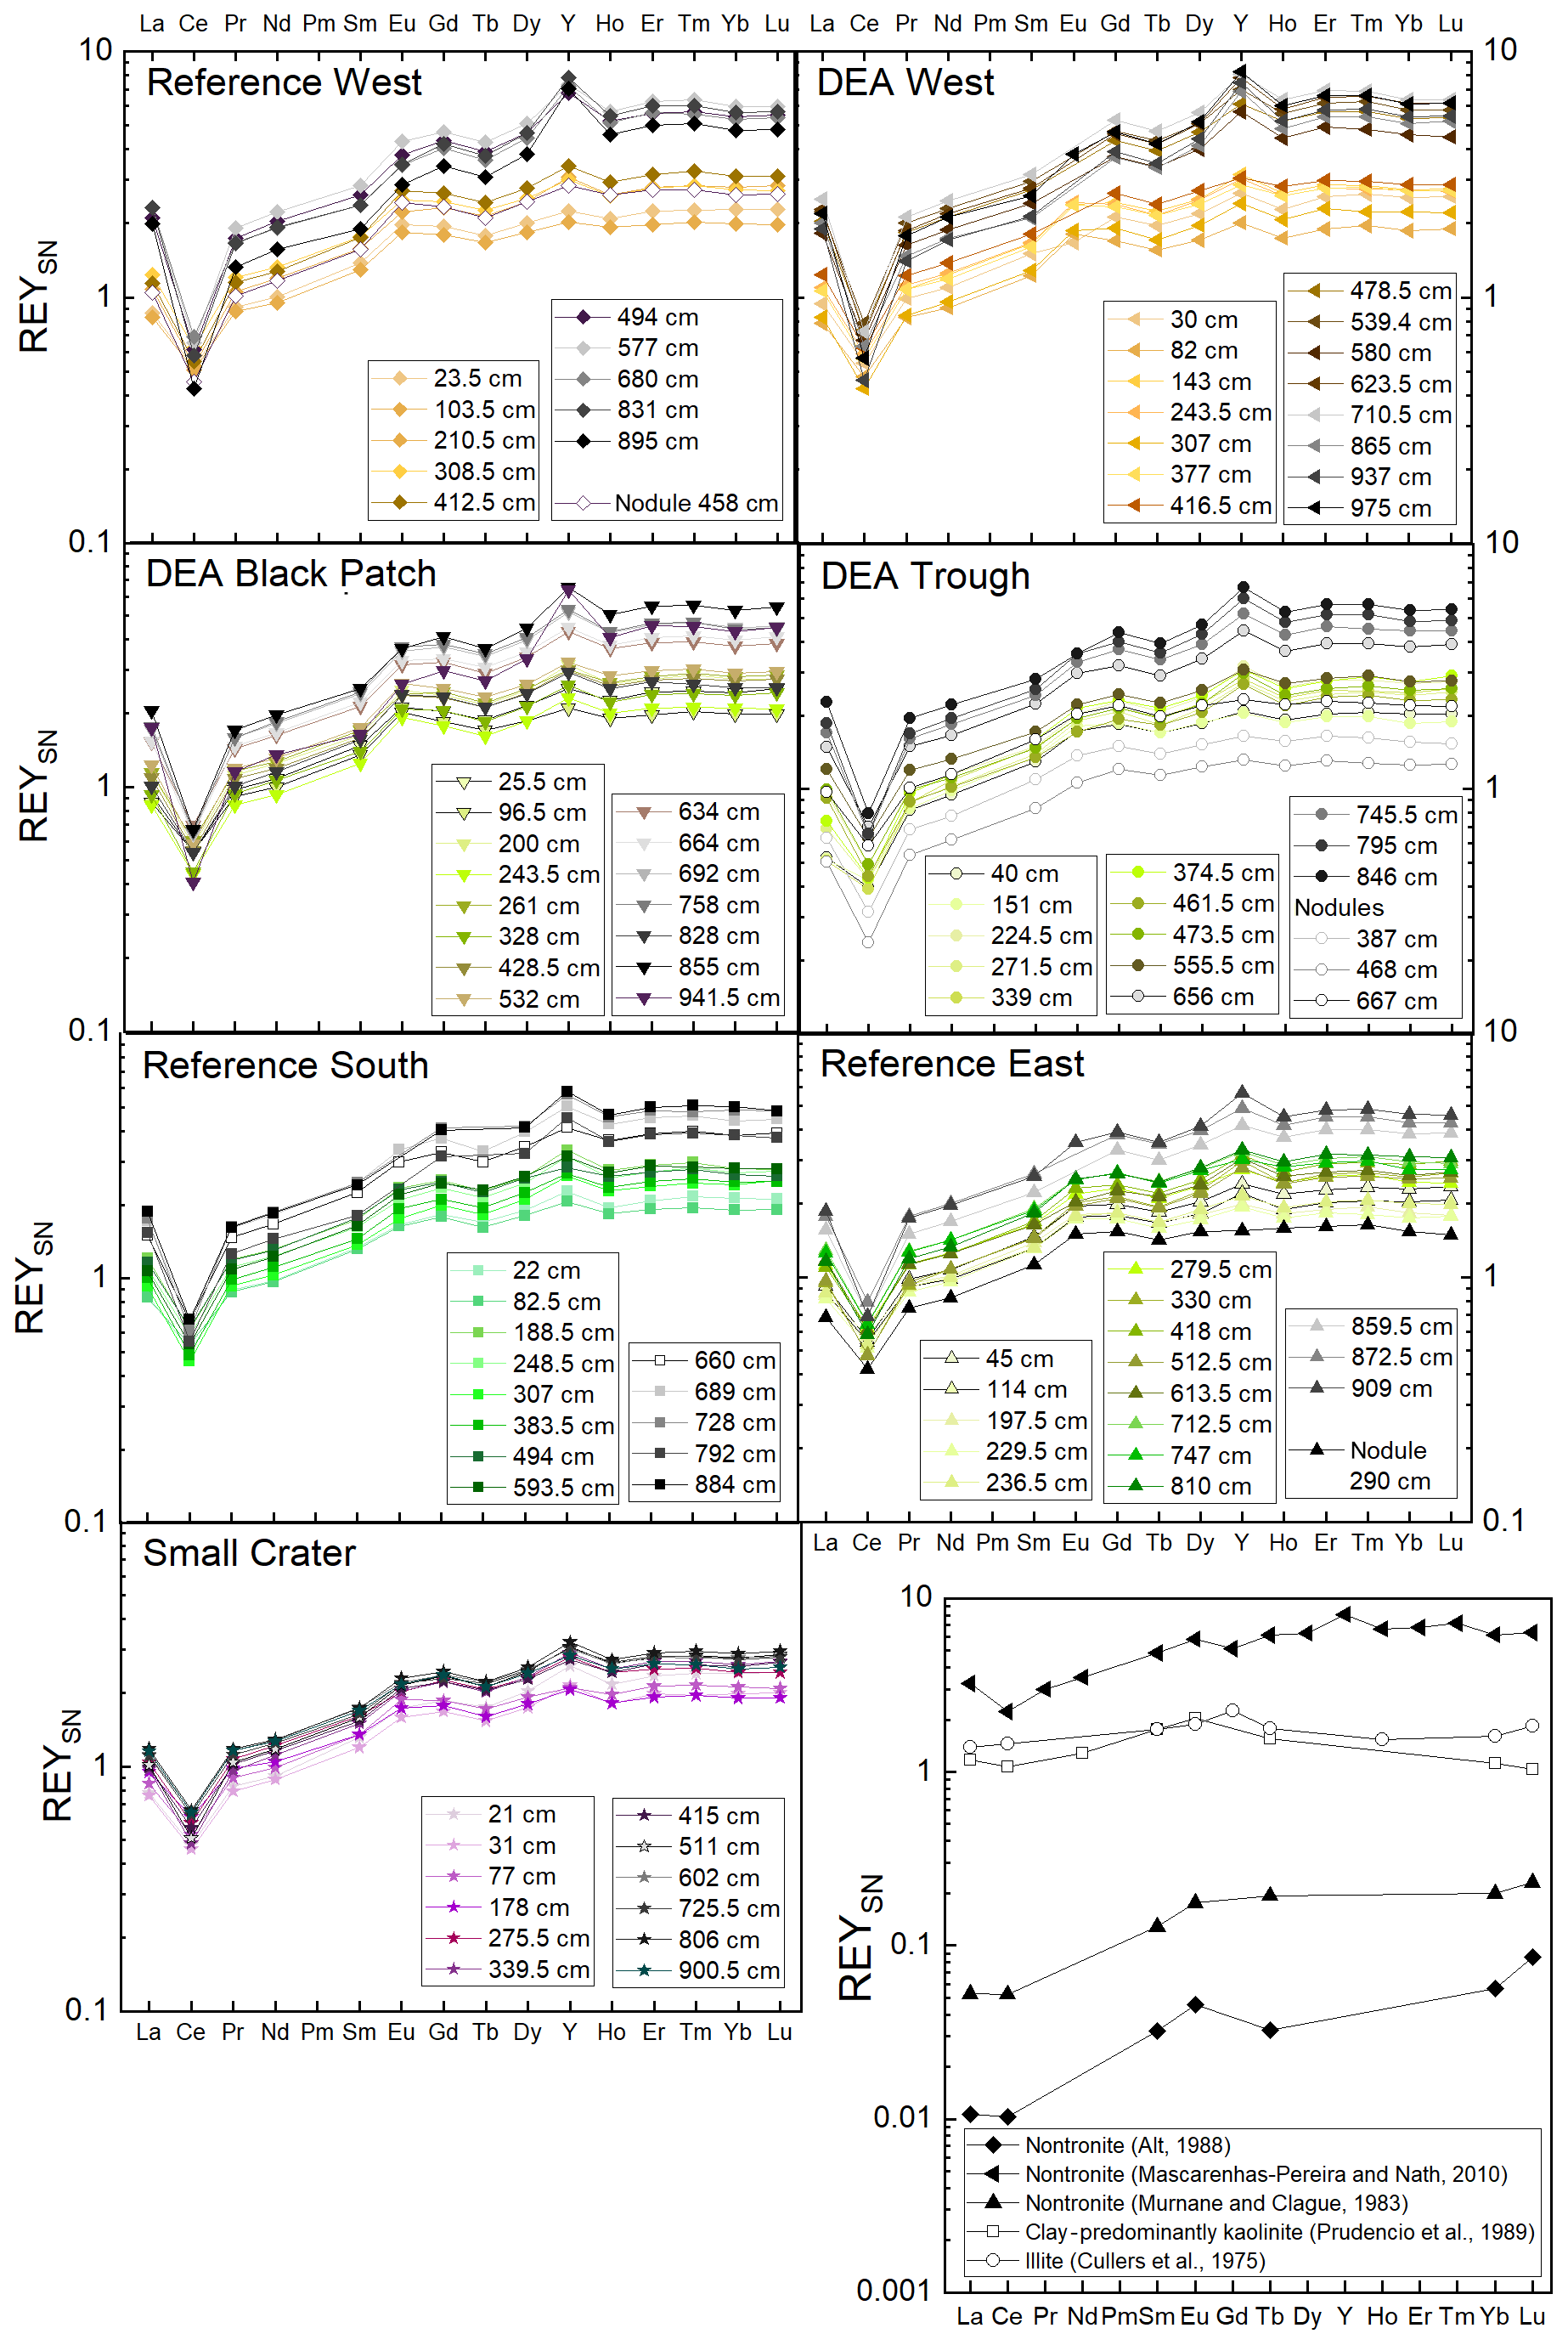
Figure 9REYSN patterns of the seven cores from this study and for the clay minerals nontronite, illite, and kaolinite from the literature for comparison.
4.1 Paleoceanographic context: sedimentation history based on CaCO3 and Ba preservation
Sediments in the Peru Basin consist of clays and siliceous mud, with some layers rich in CaCO3 (Weber et al., 1995; Marchig et al., 2001), as depicted by the CaCO3 and Ca concentration profiles of the GCs (Fig. 5). During times when the carbonate compensation depth (CCD) deepened to depths below that of the seafloor, calcareous skeletal material was preserved in the sediments upon burial. The present CCD is located approximately between 4200 and 4250 m water depth (Weber et al., 2000), slightly deeper than the water depths of the GCs presented here (4125–4208 m). Carbonate contents of more than 10 wt % are present in the DISCOL area between 150 and 500 cm, concentrations and depths of CaCO3 peaks vary slightly between the cores. Concentrations are lowest in the western cores Reference West and DEA West, which could be a sampling artifact due to sparse sampling, but both cores as well as DEA Black Patch have a second carbonate-rich layer at the base of the cores at approx. 800–1000 cm (Fig. 5). Carbonate dilutes other mineral phases, such as clay and Mn and Fe oxides, which is why concentrations of various (trace) elements in the solid phase, e.g., Al, Fe, Cu, Mn, Co, Ni, Zn, and REY are lower in carbonate-rich layers, while a few are enriched, e.g., Sr, due to their incorporation in the carbonate minerals.
The top of the carbonate-rich interval in the cores, located at approx. 150–200 cm, may tentatively be correlated to the 400 ka Mid-Brunhes event, when major carbonate dissolution occurred in the Pacific and after which carbonate was much less preserved in sediments (Weber et al., 1995; Weber and Pisias, 1999). The beginning of the upper CaCO3-rich core interval at 500 cm may then potentially correspond to the onset of the deepening of the CCD 1.1 Ma event, which continued until the Mid-Brunhes event at 400 ka (Weber et al., 1995). The bottom carbonate layer is absent in some cores and based on our data set it is not possible to date it.
With 10 wt %–35 wt % CaCO3, the carbonate layers in our cores have similar concentrations to carbonate-rich layers reported previously for the DISCOL area (Weber et al., 1995, 2000). Weber et al. (2000) distinguished areas of higher bioproductivity and hence higher CaCO3 input into the sediments in the northwestern and northeastern Peru Basin from less productive areas in the western and southern Peru Basin, including the DISCOL area.
Barium concentrations in marine sediments are often used as a marker for paleo-productivity but the use of this proxy depends on the reliability of the Ba record and that it was not subjected to alteration after burial of marine barite (Dymond et al., 1992; McManus et al., 1998; Gingele et al., 1999). In highly productive settings, authigenic barite formation can occur during diagenesis, while in most other settings under oxic and suboxic conditions porewaters are saturated with respect to barite and solid-phase barite is preserved (Reitz et al., 2004). Additionally, the biogenic barium concentration needs to be distinguished from the detrital barium concentration before it can be used as a paleo-productivity indicator (Gingele et al., 1999). We are therefore using Ba∕Al ratios to only focus on biogenic Ba (Fig. 5).
Ba∕Al ratios in the analyzed DISCOL sediments show elevated concentrations below approx. 350 to 450 cm, depending on the core, except for the core from Small Crater, which displays relatively constant concentrations throughout the core (Fig. 5). The layers with elevated Ba∕Al ratios suggest a higher primary productivity and increased sedimentation rates at the time of deposition compared to sedimentation rates between 0.4 and 2.0 cm ka−1 reported previously for Peru Basin surface sediments (Haeckel et al., 2001). It is in these Ba-enriched intervals that buried nodules were more commonly encountered, suggesting that increased sedimentation rates during times of higher productivity may have favored nodule burial.
4.2 Green layers
Considering the small sampling area, the cores show a high heterogeneity of different layers and thickness of these layers. The color change from tan to green, visible in four cores (Fig. 3), represents the penetration depth and the green color results from increased Fe(II) content in the nontronite, a process that has been well established for sediments in the Peru Basin (Lyle, 1983; Drodt et al., 1997; König et al., 1997, 1999). No dissolved Fe was detected in the porewater (limit of detection of 0.5–1 µmol L−1), confirming that there is no Fe-oxyhydroxide reduction taking place, mobilizing Fe into the porewater. Nitrate is present throughout the cores of Reference West and Small Crater (Fig. 3) and consequently, no green layers are observed, as Fe(III) dominates considerably in the nontronite. Nitrate is depleted at approx. 3 m depth at DEA West, but no green layer is visible. Dissolved Mn concentrations are also lowest in these three cores (Fig. 7). This may be attributed to the lower POC contents of only 0.1 wt %–0.2 wt % at depth compared to 0.2 wt %–0.4 wt % that are found in the other cores without green layers (Fig. 4), which only allows for and Mn(IV) reduction but does not reach Fe(III) reduction in the electron acceptor sequence for POC degradation.
The cores with extensive green layers were located in depressions (DEA Trough and Reference East) and had few or no nodules on the seafloor (DEA Black Patch, DEA Trough, Reference East). Mewes et al. (2014) discovered that microbial respiration was higher at sites without nodules in the CCZ. This fits to the scenario in the Peru Basin, where fewer nodules occur in areas with more POC and therewith probably higher microbial activity. Most buried nodules, however, were found in depressions (Table 1) suggesting that their distribution and burial might be related to bathymetry-controlled sediment depocenters. Dissolving nodules and brown patches inside the green sediment layers (e.g., DEA Black Patch, 497 cm, and DEA Trough, 585 cm) were found in the suboxic parts of the cores. The brown patches might be remnants of dissolving nodules because dissolving nodules impact their surrounding sediment, which is also visible in the halos around the larger buried nodules. Fe(II)-rich sediment gets oxidized “back” and is tan colored again (the halo), as Fe(II) in nontronite is oxidized to Fe(III) (Russell et al., 1979; König et al., 1997; Dong et al., 2009), due to the provision of oxides by the nodules.
When clay minerals become concurrently enriched in Fe(III), they can transform into other clay minerals, such as glauconite or nontronite (Pedro et al., 1978; Baldermann et al., 2015). Nontronite can form in three ways at the seafloor: (1) precipitation from hydrothermal fluids, (2) alteration of volcanic rocks, and (3) interaction of Fe (oxyhydr)oxides and biogenic silica at low temperatures (Cole and Shaw, 1983). Hydrothermally derived nontronite has been found in Pliocene sediments of the Peru Basin and the adjacent Bauer Basin, but volcanic activity in the DISCOL area ended at about 6 Ma (Marchig et al., 1999), and this age is not covered by the GCs presented here. Therefore, it is most likely that Fe (oxyhydr)oxides and (biogenic) silica form Fe(III)-Si complexes, which then develop into nontronite (pathway 3) (Hein et al., 1979; Pedro et al., 1978; Cole and Shaw, 1983; Cole, 1985; Kashiwabara et al., 2018). This Fe(III) is provided by the buried nodules. The lack of high-temperature hydrothermal influence is also shown in the sedimentary REYSN patterns, which lack an EuSN anomaly, a typical sign of high-temperature hydrothermally impacted sediments (Michard, 1989; German et al., 1990; Bau, 1991).
4.3 Sedimentary Fe∕Al ratios
Fe∕Al ratios of 0.6–0.75 persist in the upper meters of all cores and throughout the core of the Small Crater (Fig. 6). This is in line with Fe∕Al ratios of 0.6–0.7 of Pacific deep-sea sediments from other locations (Bischoff et al., 1979; Paul et al., 2019). Elevated Fe∕Al ratios of up to 1.3 or even above 3 in certain layers of our cores coincide with Fe∕Al ratios of metalliferous layers in the central equatorial Pacific below approx. 5.5 or 8 m (Fe∕Al: 1.3–1.7; Paul et al., 2019). Dissolving nodules analyzed in this study have Fe∕Al ratios between 1.2 and 5.3, suggesting that the enrichment in the sediment could result from the dissolving nodules.
4.4 REY as indicators for variability of deep-sea sediments
The change in REY concentration with depth could be associated with past changes in sediment deposition – especially in cores Reference West and DEA West, where a color change from tan to dark brown is visible but no green layers can be seen. A second impact of REY concentration change might be related to a change in redox zonation in cores Reference South, DEA Black Patch, DEA Trough, and Reference East, where the lower end of the green layers coincides with the REY concentration increase. Small changes in the REY concentrations and SN patterns can be observed that correlate with other changes, e.g., changes in major element concentration (Fe, Al, P) or color (tan, dark brown, green). Small-scale variability is therefore also visible in the REY concentrations and SN patterns within the Peru Basin.
Correlations of REY and major elements help to elucidate phase associations of REY, which are important to understand before interpreting REY cycling. Neodymium (Nd) is used in the correlations to represent the REY. Correlations of solid-phase Nd and major elements, such as Al, as indicator for detrital inputs, Mn as indicator for Mn oxides, Fe as indicator for Fe phases (Fe (oxyhydr)oxides or Fe-rich clay minerals), and P as indicator for phosphates – showed that Fe, Al, and P correlate positively with Nd (Figs. 11 and 12) while Mn shows no correlation.
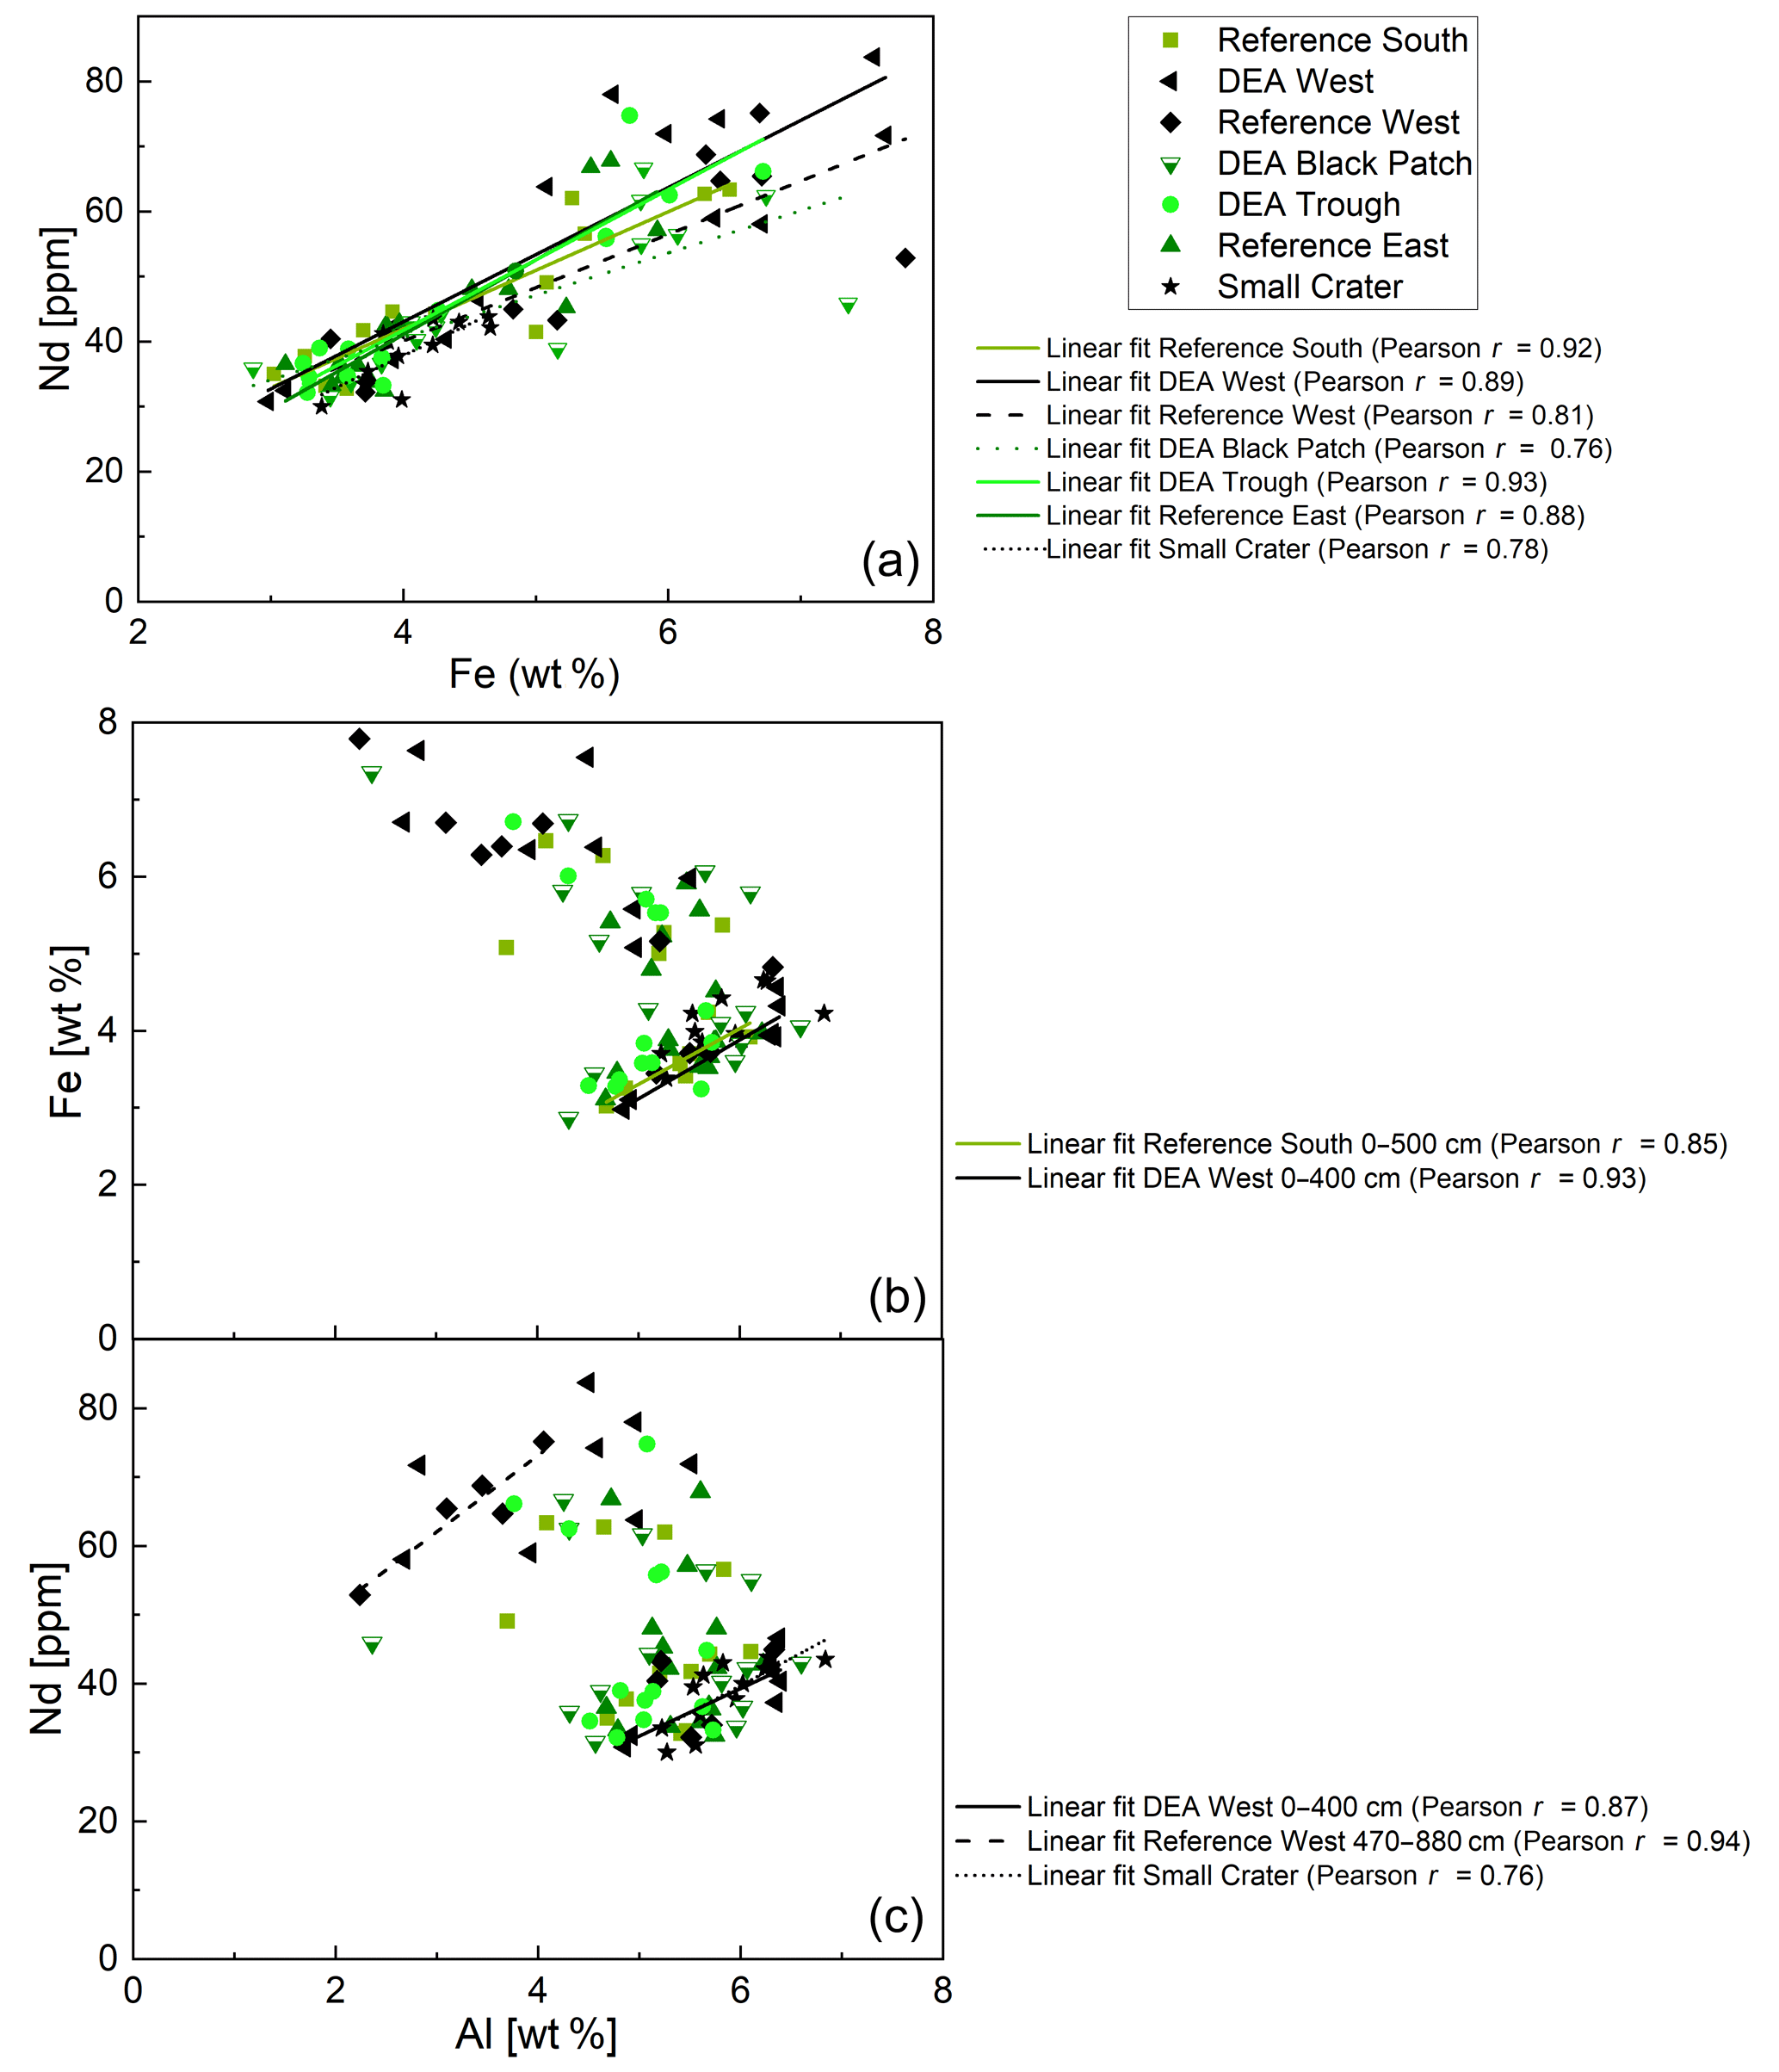
Figure 11(a) Fe–Nd plot and correlations for all cores. Pearson r coefficients show positive correlations of REY with Fe for all cores. (b) Al–Fe plot. Only positive correlations for the upper parts of Reference South and DEA West are shown. (c) Al–Nd plot. Only positive correlations for the upper part of Reference South, as well as for the lower part of Reference West and the entire Small Crater core are shown.
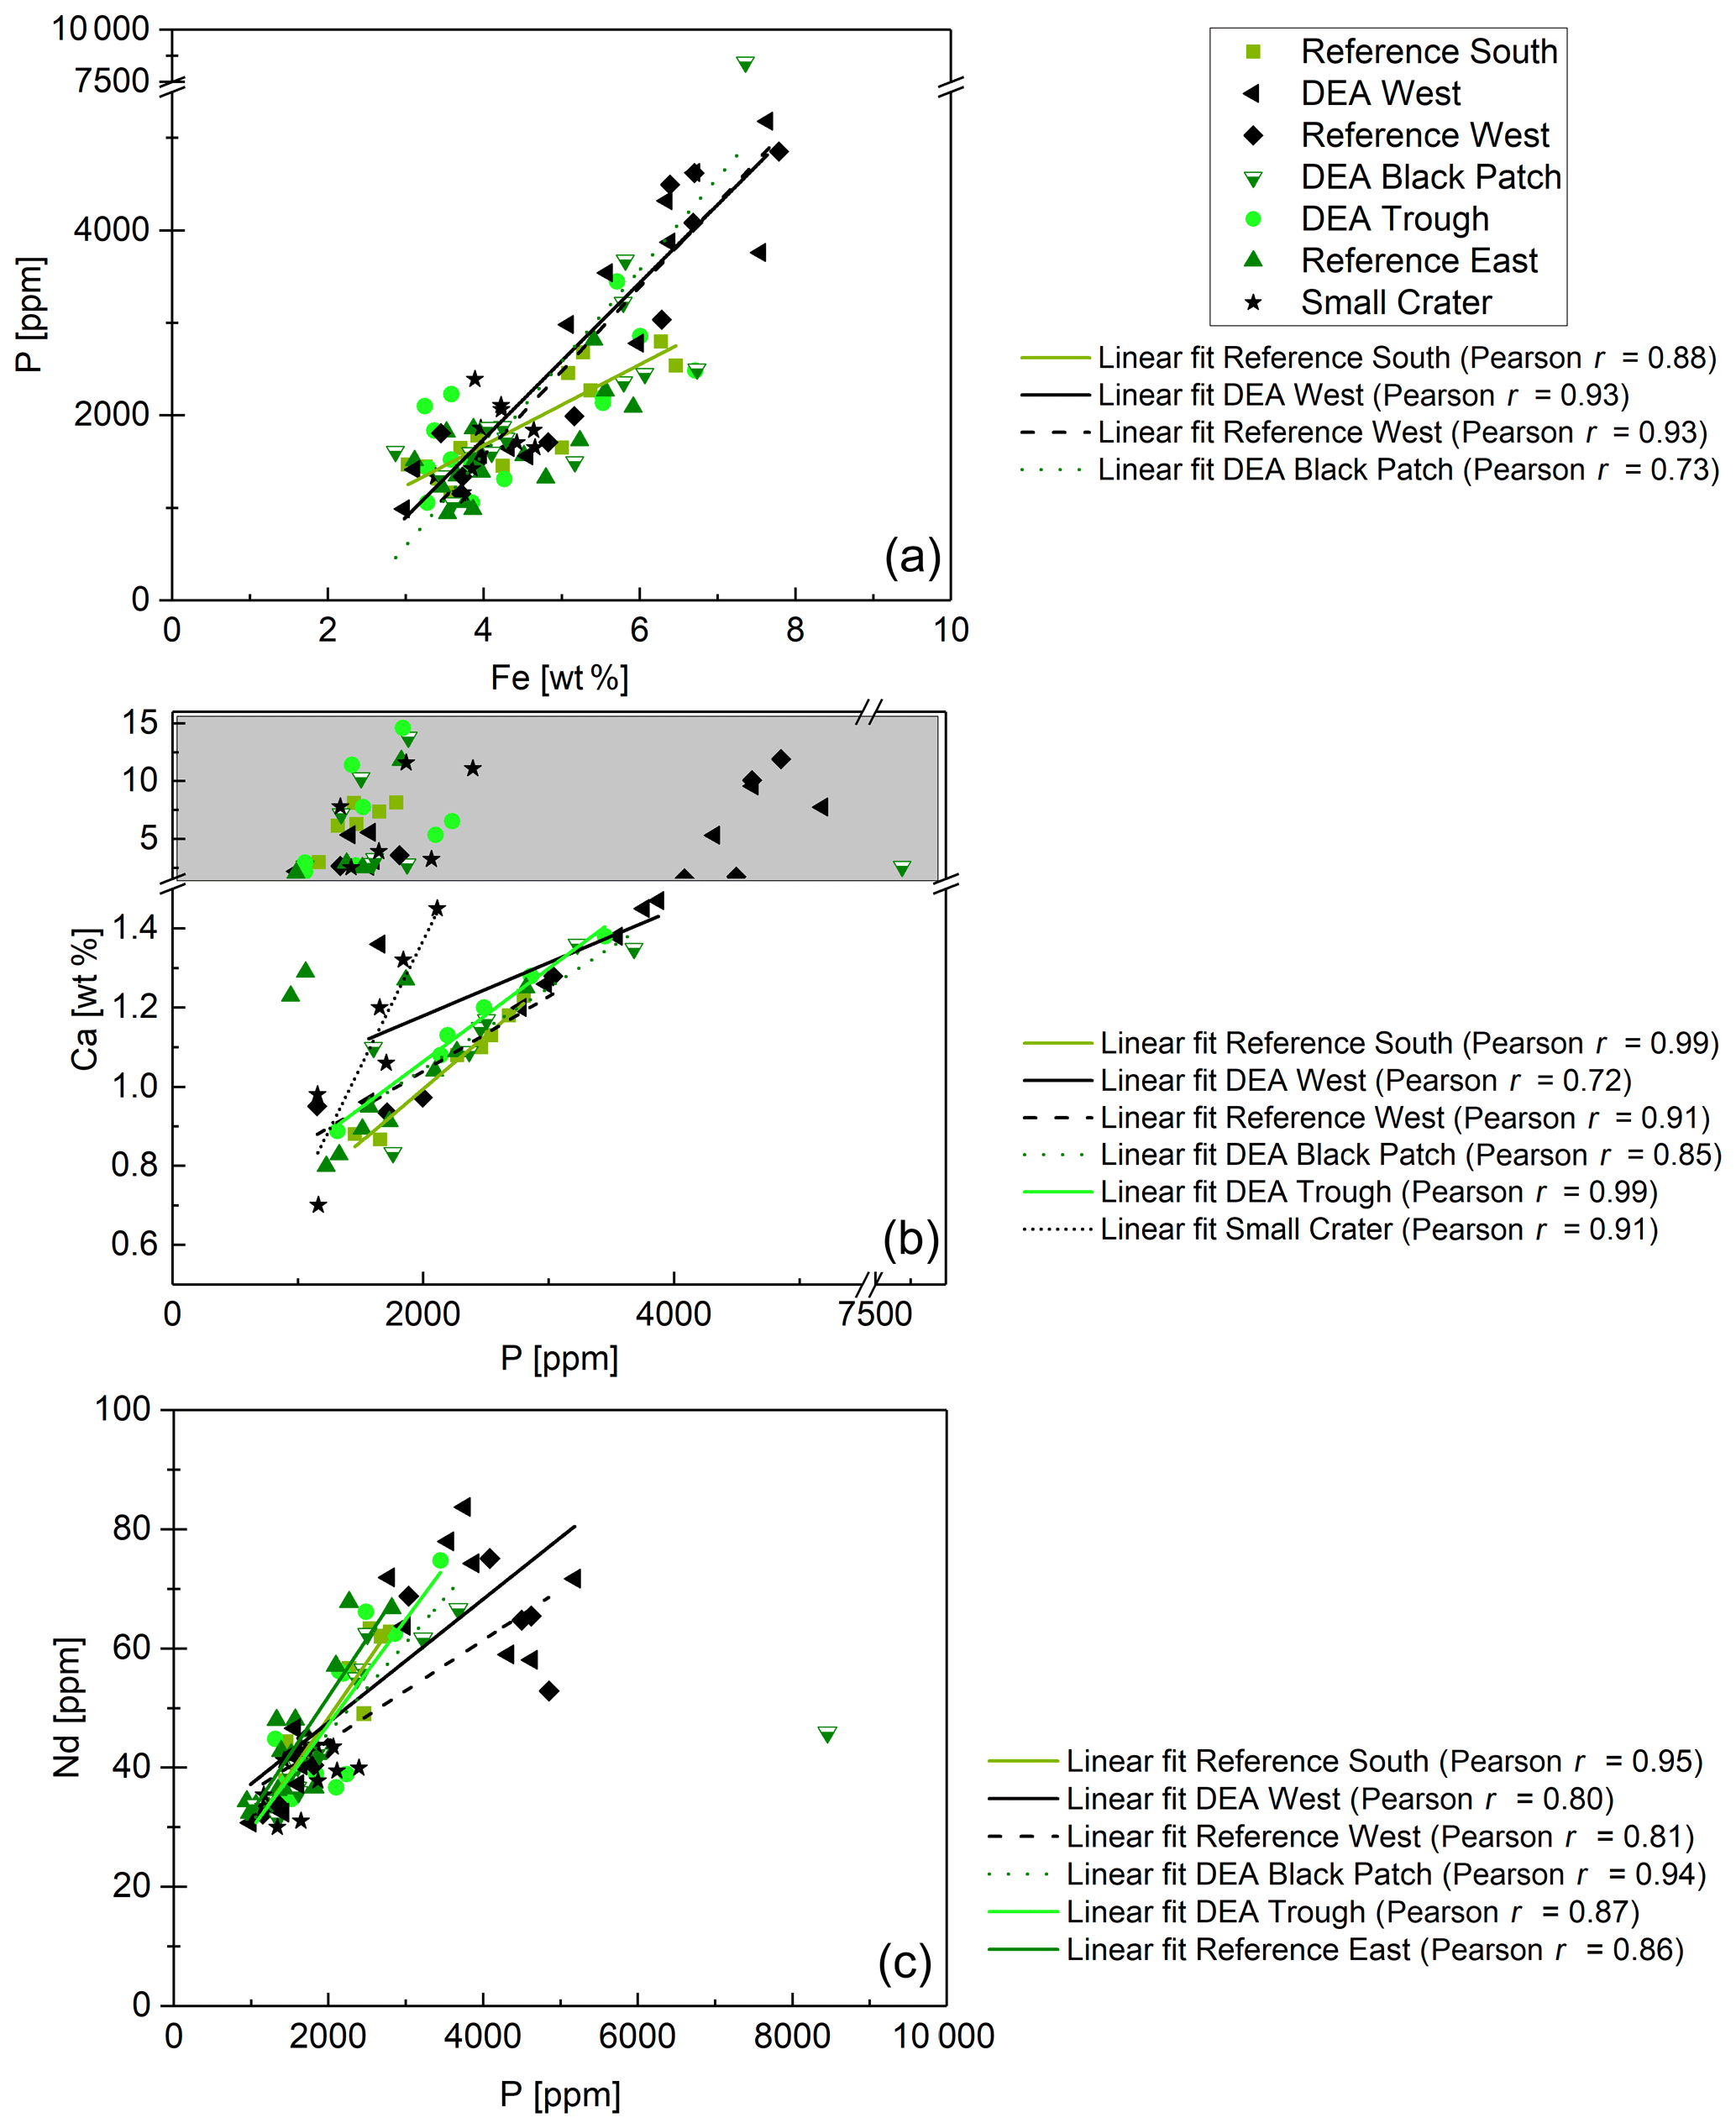
Figure 12(a) P–Fe correlations for Reference South, DEA West, Reference West, and DEA Black Patch. (b) P–Ca correlations for samples with Ca concentrations below 1.5 wt %, except for Reference East, where P and Ca do not correlate. Samples with Ca concentrations above 1.5 wt % were excluded from the regression analyses because most of the Ca is then not bound in Ca phosphates. (c) P–Nd correlations for all samples, except for Small Crater, where P and Nd do not correlate, and excluding the DEA Black Patch sample, which has exceptionally high P concentrations.
Fe-Nd correlations are positive in all cores (Fig. 11) and show the highest Pearson r coefficients of all, indicating the best fit for REY with Fe. At Reference South and DEA West, Fe also correlates with Al in the upper part of the cores (Fig. 11). The Fe-Al correlation points to the occurrence of an Fe-rich clay mineral. The carrier phase for the REY could therefore be a Fe-rich clay such as nontronite. Clay minerals have been postulated by others as the primary phase controlling porewater and solid-phase REY cycling (Zhang et al., 2016; Abbott et al., 2019). The REY also correlate with Al at Small Crater and at DEA West until approx. 450 cm and at Reference West below approx. 450 cm, which matches the depth of the color change from tan to dark brown sediment in the latter two cores. It is unclear why only part of each core shows a correlation of Al with Nd and Fe, and it is especially unclear why this is sometimes the upper and sometimes the lower core section. Nevertheless, this finding corroborates the association of REY with Fe-rich clay minerals. Additionally, REYSN patterns of detrital clay minerals, such as illite or kaolinite, are flat due to their detrital origin (Cullers et al., 1975; Prudêncio et al., 1989; Tostevin et al., 2016) and therefore can be excluded here due to HREY enrichment and the pronounced negative CeSN anomaly (Fig. 9). The sedimentary REYSN patterns with La∕Yb ≪ 1; negative CeSN anomaly; and positive LaSN, GdSN, and YSN anomalies are similar to REYSN patterns reported for nontronites (Fig. 9, Murnane and Clague, 1983; Alt, 1988; Mascarenhas-Pereira and Nath, 2010), which are expected to occur in these sediments because of the observed tan–green color change and the high Fe∕Al ratio. The published nontronite REYSN patterns, however, refer exclusively to hydrothermally produced nontronites and the nontronite in cores from this study are not hydrothermally affected but rather derived from altered clay minerals or Fe (oxyhydr)oxides (e.g., Cole, 1985). To the best of our knowledge, no REY data of nontronite that evolved from the combination of Fe (oxyhydr)oxides and biogenic silica exists that could be used for REY pattern comparison here.
Phosphorus correlates with Fe in cores from Reference South, DEA West, Reference West, and DEA Black Patch, which could be a sign of P bound to Fe phases. But P–Ca correlations in the Ca-poor parts of all cores, except Reference East are positive as well (Fig. 12), indicating a Ca phosphate phase. Ca-rich parts were excluded from this correlation since the high CaCO3 contents obscure any P–Ca correlation. Since P and Nd also correlate in all cores, except Small Crater (Fig. 12), phosphates might play a role as a REY-controlling phase. The correlation of P and Nd in some cores is similar to results from large areas of the central equatorial Pacific, where REY are bound to (biogenic) Ca phosphates, e.g., fish debris deposited in the sediments (Elderfield et al., 1981; Toyoda and Masuda, 1991; Toyoda et al., 1990; Toyoda and Tokonami, 1990; Kon et al., 2014; Deng et al., 2017; Kashiwabara et al., 2018; Liao et al., 2019; Paul et al., 2019;). There, Ca phosphates show middle REY (MREY)-enriched patterns with no or negative CeSN anomalies (Toyoda et al., 1990; Toyoda and Masuda, 1991; Paul et al., 2019). Apatite pellets with similar REY patterns to those presented here (Fig. 9) were found on the Peru shelf (Piper et al., 1988), supporting the possibility of Ca phosphate control on REY in these sediments.
In conclusion, both Ca phosphates and Fe-rich clays are potential REY-controlling phases based on the element correlations shown. Jarvis (1985) suggested a combination of Fe phases and phosphatic phases for the control of REY in Pacific metalliferous sediments. As Fe phases but not Fe-(oxyhydr)oxides, which we can exclude based on the REYSN patterns with no negative YSN anomaly, release some REY to the porewater during recrystallization because the large ionic radii do not fit in the smectite structure anymore (Jarvis, 1985; Barrett and Jarvis, 1988), they are then available for scavenging by the Ca phosphate phase (Barrett and Jarvis, 1988; Kashiwabara et al., 2018). Clay minerals have similarly been described as a major phase influencing porewater REYSN patterns during clay mineral dissolution and authigenesis (Abbott et al., 2019), which can then be scavenged by Ca phosphates (Zhang et al., 2016). Simple desorption from detrital clay minerals is unlikely to be the source determining the porewater REYSN pattern, as the detrital clay minerals have no YSN anomaly (Cullers et al., 1975; Prudêncio et al., 1989; Tostevin et al., 2016), but the porewater presented here has a positive YSN anomaly. The matching porewater and solid-phase REYSN patterns (compare Figs. 9 and 10) suggest that Fe-rich clay phases release REY to the porewater or alter the porewater REY pool during authigenic clay mineral formation, determining the porewater REYSN pattern. The porewater REYSN pattern is then taken up by the Ca phosphates as they incorporate REY from the ambient porewater without major fractionation through coupled substitution, i.e., replacement of Ca2+ by REE3+ together with a monovalent element of a similar size to Ca, e.g., Na+ (Elderfield et al., 1981; Rønsbo, 1989; Jarvis et al., 1994). Similar REYSN patterns have been found in sediments in the DISCOL area and were explained to result from hydrothermal inputs and scavenging of REY from seawater (Marchig et al., 1999). Since hydrothermal inputs do not play a role in the sediments we investigate here, it is unlikely that hydrothermal activity affects the REYSN patterns in the GCs from this study. We propose that the incorporation of REY from ambient porewater is the dominant process resulting in the observed REYSN patterns. This is the same process as in the central equatorial Pacific (see, e.g., Paul et al., 2019), but the porewater REYSN pattern is different in the Peru Basin, leading to different patterns in the solid phase.
Even though the same incorporation process into the solid phase takes place in the Peru Basin and the CCZ – two Pacific nodule areas in the focus of investigating mining-related disturbances – the solid-phase REYSN patterns are different due to the different porewater REYSN patterns. While the same general pattern (HREY enrichment, negative CeSN anomaly, positive YSN anomaly) is observed in all cores in the Peru Basin, they differ from the REYSN pattern observed in the CCZ (MREY enrichment, no or negative CeSN anomaly). The REY are therefore a suitable parameter for the interregional comparison of sediments.
4.5 Dissolved Mn, Co, and Cu
Dissolved Mn concentrations increase with depth and from west to east (except for Small Crater), thus mirroring the solid-phase Mn in these cores, including the surface sediments, where concentrations are higher in the west than in the east (Paul et al., 2018). Similarly, dissolved Co concentrations at depth are higher in the east than in the west and vice versa in the solid phase, except for Small Crater (Fig. 6). Both western cores and Small Crater have the lowest POC concentrations and the deepest penetration depths (Fig. 3). Manganese oxides are therefore less utilized as electron acceptors during the degradation of organic matter in these cores, and less Mn is released to the porewater.
The marked increase in dissolved Mn and Co concentrations at depth might also be related to the release of trace metals from buried, dissolving nodules. Reference South, DEA Black Patch, DEA Trough, and Reference East show the highest dissolved Mn and Co concentrations at depth and show green layers in which nodules are dissolving.
Copper does not display the west-to-east-trend in the porewater profiles and does also not show an increase at depths where Mn and Co are enriched in the suboxic zone. A deviation of Cu from the behavior of Mn, Co, Ni, etc. has already been found in our previous study (Paul et al., 2018). While Mn, Co, and Ni are largely controlled by Mn oxides and their reduction during POC degradation (Klinkhammer, 1980; Heggie and Lewis, 1984; Shaw et al., 1990), Cu is largely controlled by the release from organic matter during early diagenesis and only partially due to association with Mn oxides (Klinkhammer, 1980; Shaw et al., 1990).
4.6 Redox-sensitive metals Mo, U, As, and V: solid phase and porewater
The redox-sensitive metals Mo, U, As, and V are soluble under oxic conditions and are bound to the solid phase under anoxic conditions in the sediment (Elbaz-Poulichet et al., 1997; Beck et al., 2008; Wang, 2012). They display conservative-type profiles in oxic porewaters and are all associated with cycling of organic material, Mn (for Mo, As, V) and Fe (for U, As) (Beck et al., 2008; Telfeyan et al., 2017). In the suboxic sediments presented here, profiles are largely conservative (Fig. 8), except for a few peaks, and in the same range as concentrations in oxic porewaters in the Peru Basin (Paul et al., 2018). Therefore, conditions in the Peru Basin sediments are likely insufficiently reducing to lead to a redox change for these elements with depth. An exception are the gray bands in Reference East, where U, Mo, V, and As concentrations peak in the solid phase and porewater, dissolved Co concentrations are low (even below the LOQ at an average of 0.14 µg kg−1), and dissolved Mn concentrations are slightly lower than in the surrounding sediment above and below (Fig. 7). This might be a sign of locally oxic conditions releasing U, Mo, As, V, and Cd into the porewater but removing Co and Mn. Elevated concentrations of U, Mo, V, and As in the porewater are also possible due to the chemical equilibrium between the high concentrations in the solid-phase water and the porewater, so that oxic conditions might not necessarily be required, but the controlling process cannot be identified with certainty. Total dissolved S in the porewater is not elevated in these layers, while at 238 cm, where another gray band was sampled for solid-phase S analyses, elevated concentrations of 0.54 wt % S were measured compared to ∼0.3 wt %–0.4 wt % S in most of the core, possibly a sign of anoxic–sulfidic deposition of material or the presence of barite, but this cannot be said with certainty.
The Reference East core, as well as the DEA Black Patch core, are located in areas with few or no nodules at the seafloor surface. In addition, Reference East is located at greater water depth (56–91 m deeper than the other sites). Deposition of different material – also more organic material that might lead to periods of anoxic conditions – is the standard explanation for enrichments of U, Mo, As, and V in other settings, but the observations here can most likely not be explained by anoxic conditions because of low POC contents (∼0.3 wt %–0.5 wt % in the Reference East core). The occurrence of these gray bands with elevated U, Mo, As, and V concentrations is striking but we cannot clearly explain their source.
The solid phase and dissolved U, V, and Cu concentration peaks in DEA Black Patch suggest the presence of a Cu-rich uranium–vanadium phase. This is known from oxidation fronts in turbidites in North Atlantic clays, where U, V, and Cu are enriched in the solid phase (Colley et al., 1984; Colley and Thomson, 1985). The metals are mobilized during organic oxidation of the turbidite material, migrate downwards, and are immobilized at depth (Colley et al., 1984). They are preserved by burial of other material on top (Colley and Thomson, 1985). In the Peru Basin, solid-phase peaks of Cd, Cu, and V have been attributed to the downward progression of the oxic–suboxic boundary during glacial–interglacial cycles, which is slowed down by the reactive Fe(II) layer in the clay minerals, and where this oxic front reaches the reactive Fe(II) layer, heavy metals such as V and Cu can be precipitated (authigenic precipitation of U, V, and Cu) (König et al., 2001; Koschinsky, 2001). A similar process during organic oxidation might have taken place at Reference East.
The analyses of seven GCs from the DISCOL area show that a deep-sea basin can be highly heterogeneous even on small spatial scales. The variability is visible in organic matter content (POC) and related differences in , Mn, and Fe (as well as REY) concentrations as well as for individual layers where redox sensitive elements such as U, Mo, V, and As are enriched. Small Crater is especially different in the measured parameters from the other cores: no green layer and generally more layers with dark brown sediment, Fe∕Al ratios that remain constant, and REY that only correlates with Fe and Al throughout the cored sediment. Since these exceptions correspond to special locations, such as lower-lying areas without nodules or with fewer nodules, where redox sensitive metals are enriched, and the Small Crater, where a different deposition environment might prevail, the importance of small topographical changes is presented as a possible explanation for the geochemical variations. The importance of small variations in depositional environments has been underestimated in the deep sea and this study showed how extensive the effects of the depositional area can be on the various geochemical parameters presented here. Variability, however, could be higher at DISCOL than in areas further away from continents because the DISCOL area might be more impacted by continental inputs and have higher primary productivity than, e.g., the CCZ, as the DISCOL area is located at the southern edge of the equatorial high-productivity zone.
The results call for caution when extrapolating findings from a small set of samples to larger ocean areas. With respect to deep-sea mining, the results show how variable the deep-sea floor can be and that extensive baseline studies are necessary before the onset of mining and impact analyses. This has been stressed by various advocates for the preservation of the deep-sea ecosystem (Glover and Smith, 2003; Mengerink et al., 2014; Van Dover et al., 2014; Schindler and Hilborn, 2015). Since the geochemical composition of the sediment, including POC content and redox conditions, has a major impact on microbial processes in the sediment and associated biological life, this small-scale heterogeneity may also be relevant for biological productivity and diversity in the deep sea, as well as biological recovery after deep-sea mining disturbances.
Another interesting finding of this study is the influence of dissolving nodules on the surrounding sediment and geochemical cycling, e.g., in the form of visible halos in the sediment or increased Fe∕Al ratios and dissolved Mn and Co concentrations in the porewater. These dissolving nodules can therefore lead to significant small-scale differences in the mineralogical and chemical composition of sediment cores, and care should be taken that such signatures are not misinterpreted as, e.g., hydrothermal influence.
Detailed tables with data for major and trace elements, as well as links to associated data sets of other porewater and solid-phase parameters, (, POC, CaCO3) are available online at PANGAEA: https://doi.org/10.1594/PANGAEA.903019 (Paul and Koschinsky, 2019; Haeckel, 2018).
The supplement related to this article is available online at: https://doi.org/10.5194/bg-16-4829-2019-supplement.
SALP, MH, and AK designed the research. SALP performed the sampling and trace metal analyses with contributions from RB. MH performed the sampling and POC, CaCO3, and nitrate data collection. SALP performed the data interpretation with contributions from MH, MB, and AK. SALP prepared the manuscript with contributions from all co-authors.
The authors declare that they have no conflict of interest.
This article is part of the special issue “Assessing environmental impacts of deep-sea mining – revisiting decades-old benthic disturbances in Pacific nodule areas”. It is not associated with a conference.
Thanks to the crew of R/V Sonne and the chief scientist Jens Greinert on cruise SO242/1, who enabled our sampling. We thank especially Henko de Stigter for the valuable core description made during SO242/1 and edits to the manuscript. Our great appreciation goes to Katja Schmidt, Annika Moje, Inken Preuss, Tim Jesper Suhrhoff, and Laura Ulrich for help with sampling and laboratory analyses in the geochemistry lab at Jacobs University Bremen. We are indebted to Meike Dibbern, Bettina Domeyer, Anke Bleyer, and Regina Surberg for their analytical support during the R/V Sonne cruise and at GEOMAR. Thanks also go to Anne Hennke and Jens Greinert from GEOMAR for providing the original bathymetry data, Laura Haffert from GEOMAR for providing the depth correction of the GCs, and Charlotte Kleint from Jacobs University Bremen for her helpful comments during the writing process.
This research has been supported by the Bundesministerium für Bildung und Forschung in the framework of the JPI Oceans project MiningImpact (grant nos. 03F0707A and 03F0707G).
This paper was edited by Jack Middelburg and reviewed by two anonymous referees.
Abbott, A. N., Löhr, S., and Trethewy, M.: Are Clay Minerals the Primary Control on the Oceanic Rare Earth Element Budget?, Front. Mar. Sci., 6, 504, https://doi.org/10.3389/fmars.2019.00504, 2019.
Alt, J. C.: Hydrothermal oxide and nontronite deposits on seamounts in the eastern Pacific, Mar. Geol., 81, 227–239, https://doi.org/10.1016/0025-3227(88)90029-1, 1988.
Baldermann, A., Warr, L. N., Letofsky-Papst, I., and Mavromatis, V.: Substantial iron sequestration during green-clay authigenesis in modern deep-sea sediments, Nat. Geosci., 8, 885–889, https://doi.org/10.1038/ngeo2542, 2015.
Barrett, T. J. and Jarvis, I.: Rare-earth element geochemistry of metalliferous sediments from DSDP Leg 92: The East Pacific Rise transect, Chem. Geol., 67, 243–259, https://doi.org/10.1016/0009-2541(88)90131-3, 1988.
Bau, M.: Rare-earth element mobility during hydrothermal and metamorphic fluid-rock interaction and the significance of the oxidation state of europium, Chem. Geol., 93, 219–230, https://doi.org/10.1016/0009-2541(91)90115-8, 1991.
Bau, M.: Scavenging of dissolved yttrium and rare earths by precipitating iron oxyhydroxide: Experimental evidence for Ce oxidation, Y-Ho fractionation, and lanthanide tetrad effect, Geochim. Cosmochim. Ac., 63, 67–77, 1999.
Bau, M. and Dulski, P.: Comparing yttrium and rare earths in hydrothermal fluids from the Mid-Atlantic Ridge: implications for Y and REE behaviour during near-vent mixing and for the Y∕Ho ratio of Proterozoic seawater, Chem. Geol., 155, 70–90, 1999.
Bau, M., Möller, P., and Dulski, P.: Yttrium and lanthanides in eastern Mediterranean seawater and their fractionation during redox-cycling, Mar. Chem., 56, 123–131, https://doi.org/10.1016/S0304-4203(96)00091-6, 1997.
Bau, M., Usui, A., Pracejus, B., Mita, N., Kanai, Y., Irber, W., and Dulski, P.: Geochemistry of low-temperature water-rock interaction: Evidence from natural waters, andesite, and iron-oxyhydroxide precipitates at Nishiki-numa iron-spring, Hokkaido, Japan, Chem. Geol., 151, 293–307, https://doi.org/10.1016/S0009-2541(98)00086-2, 1998.
Bau, M., Schmidt, K., Pack, A., Bendel, V., and Kraemer, D.: The European Shale: An improved data set for normalisation of rare earth element and yttrium concentrations in environmental and biological samples from Europe, Appl. Geochem., 90, 142–149, https://doi.org/10.1016/j.apgeochem.2018.01.008, 2018.
Beck, M., Dellwig, O., Schnetger, B., and Brumsack, H. J.: Cycling of trace metals (Mn, Fe, Mo, U, V, Cr) in deep pore waters of intertidal flat sediments, Geochim. Cosmochim. Ac., 72, 2822–2840, https://doi.org/10.1016/j.gca.2008.04.013, 2008.
Bischoff, J. L., Heath, G. R., and Leinen, M.: Geochemistry of Deep-Sea Sediments from the Pacific Manganese Nodule Province: DOMES Sites A, B, and C, in: Marine Geology and Oceanography of the Pacific Manganese Nodule Province, edited by: Bischoff, J. L. and Piper, D. Z., Springer US, Boston, MA, 397–436, 1979.
Bright, C. A., Cruse, A. M., Lyons, T. W., MacLeod, K. G., Glascock, M. D., and Ethington, R. L.: Seawater rare-earth element patterns preserved in apatite of Pennsylvanian conodonts?, Geochim. Cosmochim. Ac., 73, 1609–1624, https://doi.org/10.1016/j.gca.2008.12.014, 2009.
Cantrell, K. J. and Byrne, R. H.: Rare earth element complexation by carbonate and oxalate ions, Geochim. Cosmochim. Ac., 51, 597–605, https://doi.org/10.1016/0016-7037(87)90072-X, 1987.
Cole, T. G.: Composition, oxygen isotope geochemistry and origin of smectite in the metalliferous sediments of the Bauer Deep, southeast Pacific, Geochim. Cosmochim. Ac., 49, 221–235, https://doi.org/10.1016/0016-7037(85)90206-6, 1985.
Cole, T. G. and Shaw, H. F.: The nature and origin of authigenic smectites in some recent marine sediments, Clay Miner., 18, 239–252, https://doi.org/10.1180/claymin.1983.018.3.02, 1983.
Colley, S. and Thomson, J.: Recurrent uranium relocations in distal turbidites emplaced in pelagic conditions, Geochim. Cosmochim. Ac., 49, 2339–2348, https://doi.org/10.1016/0016-7037(85)90234-0, 1985.
Colley, S., Thomson, J., Wilson, T. R. S., and Higgs, N. C.: Post-depositional migration of elements during diagenesis in brown clay and turbidite sequences in the North East Atlantic, Geochim. Cosmochim. Ac., 48, 1223–1235, https://doi.org/10.1016/0016-7037(84)90057-7, 1984.
Cullers, R. L., Chaudhuri, S., Arnold, B., Lee, M., and Wolf, C. W.: Rare earth distributions in clay minerals and in the clay-sized fraction of the Lower Permian Havensville and Eskridge shales of Kansas and Oklahoma, Geochim. Cosmochim. Ac., 39, 1691–1703, https://doi.org/10.1016/0016-7037(75)90090-3, 1975.
Deng, Y., Ren, J., Guo, Q., Cao, J., Wang, H., and Liu, C.: Rare earth element geochemistry characteristics of seawater and porewater from deep sea in western Pacific, Sci. Rep., 7, 1–13, https://doi.org/10.1038/s41598-017-16379-1, 2017.
de Stigter, H.: Gravity core descriptions, in: RV SONNE Fahrtbericht/Cruise Report SO242-1 JPI OCEANS Ecological Aspects of Deep-Sea Mining: DISCOL Revisited, edited by: Greinert, J., GEOMAR Helmholtz Centre for Ocean Research Kiel, 2015.
Dong, H., Jaisi, D. P., Kim, J., and Zhang, G.: Microbe-clay mineral interactions, Am. Mineral., 94, 1505–1519, https://doi.org/10.2138/am.2009.3246, 2009.
Drodt, M., Trautwein, A. X., König, I., Suess, E., and Bender Koch, C.: Mössbauer spectroscopic studies on the iron forms of deep-sea sediments, Phys. Chem. Miner., 24, 281–293, https://doi.org/10.1007/s002690050040, 1997.
Dymond, J., Suess, E., and Lyle, M.: Barium in Deep-Sea Sediment: A Geochemical Proxy for Paleoproductivity, Paleoceanography, 7, 163–181, https://doi.org/10.1029/92PA00181, 1992.
Elbaz-Poulichet, F., Nagy, A., and Cserny, T.: The distribution of redox sensitive elements (U, As, Sb, V and Mo) along a river-wetland-lake system (Balaton Region, Hungary), Aquat. Geochem., 3, 267–282, https://doi.org/10.1023/A:1009616214030, 1997.
Elderfield, H.: The Oceanic Chemistry of the Rare-Earth Elements, Philos. T. R. Soc. A, 325, 105–126, https://doi.org/10.1098/rsta.1988.0046, 1988.
Elderfield, H., Hawkesworth, C. J., Greaves, M. J., and Calvert, S. E.: Rare earth element geochemistry of oceanic ferromanganese nodules and associated sediments, Geochim. Cosmochim. Ac., 45, 513–528, https://doi.org/10.1016/0016-7037(81)90184-8, 1981.
Fritsche, U., Koschinsky, A., and Winkler, A.: The different diffusive transport behaviours of some metals in layers of Peru Basin surface sediment, Deep-Sea Res. Pt. II, 48, 3653–3681, https://doi.org/10.1016/S0967-0645(01)00061-3, 2001.
Froelich, P. N., Klinkhammer, G. P., Bender, M. L., Luedtke, N. a., Heath, G. R., Cullen, D., Dauphin, P., Hammond, D., Hartman, B., and Maynard, V.: Early oxidation of organic matter in pelagic sediments of the eastern equatorial Atlantic: suboxic diagenesis, Geochim. Cosmochim. Ac., 43, 1075–1090, https://doi.org/10.1016/0016-7037(79)90095-4, 1979.
German, C. R., Klinkhammer, G. P., Edmond, J. M., Mitra, A., and Elderfield, H.: Hydrothermal scavenging of rare-earth elements in the ocean, Nature, 345, 516–518, https://doi.org/10.1038/345516a0, 1990.
Gingele, F. X., Zabel, M., Kasten, S., Bonn, W. J., and Nürnberg, C. C.: Biogenic Barium as a Proxy for Paleoproductivity: Methods and Limitations of Application, in: Use of Proxies in Palaeoceanography: Examples from the South Atlantic, edited by: Fischer, G. and Wefer, G., Springer-Verlag, Berlin, Heidelberg, 345–364, 1999.
Glover, A. G. and Smith, C. R.: The deep-sea floor ecosystem: current status and prospects of anthropogenic change by the year 2025, Environ. Conserv., 30, 219–241, https://doi.org/10.1017/S0376892903000225, 2003.
Grasshoff, K., Kremling, K., and Ehrhardt, M.: Methods of Seawater Analysis, Wiley-VCH, Weinheim, 632 pp., 1999.
Greinert, J.: RV SONNE Fahrtbericht/Cruise Report SO242-1 JPI OCEANS Ecological Aspects of Deep-Sea Mining: DISCOL Revisited, 213 pp., 2015.
Haeckel, M., König, I., Riech, V., Weber, M. E., and Suess, E.: Pore water profiles and numerical modelling of biogeochemical processes in Peru Basin deep-sea sediments, Deep-Sea Res. Pt. II, 48, 3713–3736, https://doi.org/10.1016/S0967-0645(01)00064-9, 2001.
Haeckel, M.: GEOMAR – Helmholtz Centre for Ocean Research Kiel, PANGAEA, Particulate geochemistry of sediment core SO242/1_100-1_GC 5: https://doi.org/10.1594/PANGAEA.884974, Particulate geochemistry of sediment core SO242/1_123-1_GC 6: https://doi.org/10.1594/PANGAEA.884977; Particulate geochemistry of sediment core SO242/1_132-1_GC 7: https://doi.org/10.1594/PANGAEA.884979, Particulate geochemistry of sediment core SO242/1_38-1_GC 1: https://doi.org/10.1594/PANGAEA.884981, Particulate geochemistry of sediment core SO242/1_51-1_GC 2: https://doi.org/10.1594/PANGAEA.884982, Particulate geochemistry of sediment core SO242/1_84-1_GC 3: https://doi.org/10.1594/PANGAEA.884988, Particulate geochemistry of sediment core SO242/1_89-1_GC 4: https://doi.org/10.1594/PANGAEA.884989, Porewater geochemistry of sediment core SO242/1_100-1_GC 5: https://doi.org/10.1594/PANGAEA.884946, Porewater geochemistry of sediment core SO242/1_123-1_GC 6: https://doi.org/10.1594/PANGAEA.884949, Porewater geochemistry of sediment core SO242/1_132-1_GC 7: https://doi.org/10.1594/PANGAEA.884951, Porewater geochemistry of sediment core SO242/1_38-1_GC 1: https://doi.org/10.1594/PANGAEA.884953, Porewater geochemistry of sediment core SO242/1_51-1_GC 2: https://doi.org/10.1594/PANGAEA.884954, Porewater geochemistry of sediment core SO242/1_84-1_GC 3: https://doi.org/10.1594/PANGAEA.884960, Porewater geochemistry of sediment core SO242/1_89-1_GC 4: https://doi.org/10.1594/PANGAEA.884961, 2018.
Haffert, L., Haeckel, M., de Stigter, H., and Janßen, F.: DISCOL experiment revisited: Assessing the temporal scale of deep-sea mining impacts on sediment biogeochemistry, Biogeosciences Discuss., https://doi.org/10.5194/bg-2019-361, in review, 2020.
Haley, B. A., Klinkhammer, G. P., and McManus, J.: Rare earth elements in pore waters of marine sediments, Geochim. Cosmochim. Ac., 68, 1265–1279, https://doi.org/10.1016/j.gca.2003.09.012, 2004.
Heggie, D. and Lewis, T.: Cobalt in pore waters of marine sediments, Nature, 311, 453–455, https://doi.org/10.1038/311453a0, 1984.
Hein, J. R. and Koschinsky, A.: Deep-Ocean Ferromanganese Crusts and Nodules, in: Treatise on Geochemistry, Vol. 13, Elsevier, 273–291, 2014.
Hein, J. R., Yeh, H.-W., and Alexander, E.: Origin of Iron-Rich Montmorillonite from the Manganese Nodule Belt of the North Equatorial Pacific, Clays Clay Miner., 27, 185–194, https://doi.org/10.1346/CCMN.1979.0270303, 1979.
JPI Oceans – Ecological Aspects of Deep-Sea Mining, available at: https://jpio-miningimpact.geomar.de/, last access: 15 September 2017.
Jarvis, I.: Geochemistry and origin of Eocene-Oligocene metalliferous sediments from the central equatorial Pacific: Deep Sea Drilling Project Sites 573 and 574, in: Initial Reports of the Deep Sea Drilling Project, 85, edited by: Mayer, L. A., Theyer, F., Barron, J. A., Dunn, D. A., and Handyside, T., Chapt. 24, 781–804, 1985.
Jarvis, I., Burnett, W. C., Nathan, Y., Almbaydin, F. S. M., Attia, A. K. M., Castro, L. N., Flicoteaux, R., Hilmy, M. E., Husain, V., Qutawnah, A. A., Serjani, A., and Zanin, Y. N.: Phosphorite geochemistry: State-of-the-art and environmental concerns, Eclogae Geol. Helv., 87, 643–700, 1994.
Kashiwabara, T., Toda, R., Nakamura, K., Yasukawa, K., Fujinaga, K., Kubo, S., Nozaki, T., Takahashi, Y., Suzuki, K., and Kato, Y.: Synchrotron X-ray spectroscopic perspective on the formation mechanism of REY-rich muds in the Pacific Ocean, Geochim. Cosmochim. Ac., 240, 274–292, https://doi.org/10.1016/j.gca.2018.08.013, 2018.
Kim, J.-H., Torres, M. E., Haley, B. A., Kastner, M., Pohlman, J. W., Riedel, M., and Lee, Y.-J.: The effect of diagenesis and fluid migration on rare earth element distribution in pore fluids of the northern Cascadia accretionary margin, Chem. Geol., 291, 152–165, https://doi.org/10.1016/j.chemgeo.2011.10.010, 2012.
Klinkhammer, G. P.: Early diagenesis in sediments from the eastern equatorial Pacific, II. Pore water metal results, Earth Planet. Sc. Lett., 49, 81–101, https://doi.org/10.1016/0012-821X(80)90151-X, 1980.
Kon, Y., Hoshino, M., Sanematsu, K., Morita, S., Tsunematsu, M., Okamoto, N., Yano, N., Tanaka, M., and Takagi, T.: Geochemical characteristics of apatite in heavy REE-rich Deep-Sea Mud from Minami-Torishima Area, Southeastern Japan, Resour. Geol., 64, 47–57, https://doi.org/10.1111/rge.12026, 2014.
König, I., Drodt, M., Suess, E., and Trautwein, A. X.: Iron reduction through the tan-green color transition in deep-sea sediments, Geochim. Cosmochim. Ac., 61, 1679–1683, https://doi.org/10.1016/S0016-7037(97)00007-0, 1997.
König, I., Haeckel, M., Drodt, M., Suess, E., and Trautwein, A. X.: Reactive Fe(II) layers in deep-sea sediments, Geochim. Cosmochim. Ac., 63, 1517–1526, https://doi.org/10.1016/S0016-7037(99)00104-0, 1999.
König, I., Haeckel, M., Lougear, A., Suess, E., and Trautwein, A. X.: A geochemical model of the Peru Basin deep-sea floor – and the response of the system to technical impacts, Deep-Sea Res. Pt. II, 48, 3737–3756, https://doi.org/10.1016/S0967-0645(01)00065-0, 2001.
Koschinsky, A.: Heavy metal distributions in Peru Basin surface sediments in relation to historic, present and disturbed redox environments, Deep-Sea Res. Pt. II, 48, 3757–3777, https://doi.org/10.1016/S0967-0645(01)00066-2, 2001.
Koschinsky, A., Gaye-Haake, B., Arndt, C., Maue, G., Spitzy, A., Winkler, A., and Halbach, P.: Experiments on the influence of sediment disturbances on the biogeochemistry of the deep-sea environment, Deep-Sea Res. Pt. II, 48, 3629–3651, https://doi.org/10.1016/S0967-0645(01)00060-1, 2001a.
Koschinsky, A., Fritsche, U., and Winkler, A.: Sequential leaching of Peru Basin surface sediment for the assessment of aged and fresh heavy metal associations and mobility, Deep-Sea Res. Pt. II, 48, 3683–3699, https://doi.org/10.1016/S0967-0645(01)00062-5, 2001b.
Liao, J., Sun, X., Li, D., Sa, R., Lu, Y., Lin, Z., Xu, L., Zhan, R., Pan, Y., and Xu, H.: New insights into nanostructure and geochemistry of bioapatite in REE-rich deep-sea sediments: LA-ICP-MS, TEM, and Z-contrast imaging studies, Chem. Geol., 512, 58–68, https://doi.org/10.1016/j.chemgeo.2019.02.039, 2019.
Lyle, M.: The brown-green color transition in marine sediments: A marker of the Fe(III)-Fe(II) redox boundary, Limnol. Oceanogr., 28, 1026–1033, https://doi.org/10.4319/lo.1983.28.5.1026, 1983.
Lyons, T. W., Werne, J. P., Hollander, D. J., and Murray, R. .: Contrasting sulfur geochemistry and Fe∕Al and Mo/Al ratios across the last oxic-to-anoxic transition in the Cariaco Basin, Venezuela, Chem. Geol., 195, 131–157, https://doi.org/10.1016/S0009-2541(02)00392-3, 2003.
Marchig, V., von Stackelberg, U., Wiedicke, M., Durn, G., and Milovanovic, D.: Hydrothermal activity associated with off-axis volcanism in the Peru Basin, Mar. Geol., 159, 179–203, 1999.
Marchig, V., Von Stackelberg, U., Hufnagel, H., and Durn, G.: Compositional changes of surface sediments and variability of manganese nodules in the Peru Basin, Deep-Sea Res. Pt. II, 48, 3523–3547, https://doi.org/10.1016/S0967-0645(01)00055-8, 2001.
Mascarenhas-Pereira, M. B. L. and Nath, B. N.: Selective leaching studies of sediments from a seamount flank in the Central Indian Basin: Resolving hydrothermal, volcanogenic and terrigenous sources using major, trace and rare-earth elements, Mar. Chem., 121, 49–66, https://doi.org/10.1016/j.marchem.2010.03.004, 2010.
McLennan, S. M.: Rare Earth Elements in Sedimentary Rocks: Influence of Provenance and Sedimentary Processes, in: Geochemistry and Mineralogy of Rare Earth Elements, MSA Reviews in Mineralogy, Vol. 21, edited by: Lipin, B. R. and McKay, G. A., 169–200, 1989.
McManus, J., Berelson, W. M., Klinkhammer, G. P., Johnson, K. S., Coale, K. H., Anderson, R. F., Kumar, N., Burdige, D. J., Hammond, D. E., Brumsack, H. J., McCorkle, D. C., and Rushdi, A.: Geochemistry of barium in marine sediments: implications for its use as a paleoproxy, Geochim. Cosmochim. Ac., 62, 3453–3473, https://doi.org/10.1016/S0016-7037(98)00248-8, 1998.
Mengerink, K. J., Van Dover, C. L., Ardron, J., Baker, M., Escobar-Briones, E., Gjerde, K., Koslow, J. A., Ramirez-Llodra, E., Lara-Lopez, A., Squires, D., Sutton, T., Sweetman, A. K., and Levin, L. A.: A Call for Deep-Ocean Stewardship, Science, 344, 696–698, https://doi.org/10.1126/science.1251458, 2014.
Mewes, K., Mogollón, J. M., Picard, a., Rühlemann, C., Kuhn, T., Nöthen, K., and Kasten, S.: Impact of depositional and biogeochemical processes on small scale variations in nodule abundance in the Clarion-Clipperton Fracture Zone, Deep-Sea Res. Pt. I, 91, 125–141, https://doi.org/10.1016/j.dsr.2014.06.001, 2014.
Michard, A.: Rare earth element systematics in hydrothermal fluids, Geochim. Cosmochim. Ac., 53, 745–750, https://doi.org/10.1016/0016-7037(89)90017-3, 1989.
Murnane, R. and Clague, D. A.: Nontronite from a low-temperature hydrothermal system on the Juan de Fuca Ridge, Earth Planet. Sc. Lett., 65, 343–352, https://doi.org/10.1016/0012-821X(83)90172-3, 1983.
Paul, S. A. L. and Koschinsky, A.: Trace metal geochemistry from gravity corers of SONNE cruise SO242/1 at the DISCOL area, Peru Basin, PANGAEA, https://doi.org/10.1594/PANGAEA.903019, 2019.
Paul, S. A. L., Gaye, B., Haeckel, M., Kasten, S., and Koschinsky, A.: Biogeochemical Regeneration of a Nodule Mining Disturbance Site: Trace Metals, DOC and Amino Acids in Deep-Sea Sediments and Pore Waters, Front. Mar. Sci., 5, 1–17, https://doi.org/10.3389/fmars.2018.00117, 2018.
Paul, S. A. L., Volz, J. B., Bau, M., Köster, M., Kasten, S., and Koschinsky, A.: Calcium phosphate control of REY patterns of siliceous-ooze-rich deep-sea sediments from the central equatorial Pacific, Geochim. Cosmochim. Ac., 251, 56–72, https://doi.org/10.1016/j.gca.2019.02.019, 2019.
Pedro, G., Carmouze, J. P., and Velde, B.: Peloidal nontronite formation in recent sediments of Lake Chad, Chem. Geol., 23, 139–149, https://doi.org/10.1016/0009-2541(78)90071-2, 1978.
Piper, D. Z., Baedecker, P. A., Crock, J. G., Burnett, W. C., and Loebner, B. J.: Rare earth elements in the phosphatic-enriched sediment of the Peru Shelf, Mar. Geol., 80, 269–285, https://doi.org/10.1016/0025-3227(88)90093-X, 1988.
Prudêncio, M. I., Figueiredo, M. O., and Cabral, J. M. P.: Rare earth distribution and its correlation with clay mineralogy in the clay-sized fraction of Cretaceous and Pliocene sediments (central Portugal), Clay Miner., 24, 67–74, https://doi.org/10.1180/claymin.1989.024.1.06, 1989.
Ramirez-Llodra, E., Brandt, A., Danovaro, R., De Mol, B., Escobar, E., German, C. R., Levin, L. A., Martinez Arbizu, P., Menot, L., Buhl-Mortensen, P., Narayanaswamy, B. E., Smith, C. R., Tittensor, D. P., Tyler, P. A., Vanreusel, A., and Vecchione, M.: Deep, diverse and definitely different: Unique attributes of the world's largest ecosystem, Biogeosciences, 7, 2851–2899, https://doi.org/10.5194/bg-7-2851-2010, 2010.
Reitz, A., Pfeifer, K., De Lange, G. J., and Klump, J.: Biogenic barium and the detrital Ba∕Al ratio: A comparison of their direct and indirect determination, Mar. Geol., 204, 289–300, https://doi.org/10.1016/S0025-3227(04)00004-0, 2004.
Roje, V.: Multi-elemental analysis of marine sediment reference material MESS-3: one-step microwave digestion and determination by high resolution inductively coupled plasma-mass spectrometry (HR-ICP-MS), Chem. Pap., 64, 409–414, https://doi.org/10.2478/s11696-010-0022-x, 2010.
Rønsbo, J. G.: Coupled substitutions involving REEs and Na and Si in apatites in alkaline rocks from Ilímaussaq intrusion, South Greenland, and the petrological implications, Am. Mineral., 74, 896–901, 1989.
Ruhlin, D. E. and Owen, R. M.: The rare earth element geochemistry of hydrothermal sediments from the East Pacific Rise: Examination of a seawater scavenging mechanism, Geochim. Cosmochim. Ac., 50, 393–400, https://doi.org/10.1016/0016-7037(86)90192-4, 1986.
Russell, J., Goodman, B., and Fraser, A.: Infrared and Mossbauer Studies of Reduced Nontronites, Clays Clay Miner., 27, 63–71, https://doi.org/10.1346/CCMN.1979.0270108, 1979.
Ryan, W. B. F., Carbotte, S. M., Coplan, J. O., O'Hara, S., Melkonian, A., Arko, R., Weissel, R. A., Ferrini, V., Goodwillie, A., Nitsche, F., Bonczkowski, J., and Zemsky, R.: Global multi-resolution topography synthesis, Geochem. Geophy. Geosy., 10, 9 pp., https://doi.org/10.1029/2008GC002332, 2009.
Schacht, U., Wallmann, K., and Kutterolf, S.: The influence of volcanic ash alteration on the REE composition of marine pore waters, J. Geochem. Explor., 106, 176–187, https://doi.org/10.1016/j.gexplo.2010.02.006, 2010.
Schindler, D. E. and Hilborn, R.: Prediction, precaution, and policy under global change, Science, 347, 953–954, https://doi.org/10.1126/science.1261824, 2015.
Schnetger, B. and Dellwig, O.: Dissolved reactive manganese at pelagic redoxclines (part I): A method for determination based on field experiments, J. Mar. Syst., 90, 23–30, https://doi.org/10.1016/j.jmarsys.2011.08.006, 2012.
Schriever, G., Koschinsky, A., and Bluhm, H.: Cruise Report ATESEPP Impacts of potential technical interventions on the deep-sea ecosystem of the southeast Pacific off Peru (SONNE Cruise 106), 195 pp., 1996.
Shaw, T. J., Gieskes, J. M., and Jahnke, R. A.: Early diagenesis in differing depositional environments: The response of transition metals in pore water, Geochim. Cosmochim. Ac., 54, 1233–1246, https://doi.org/10.1016/0016-7037(90)90149-F, 1990.
Soyol-Erdene, T. O. and Huh, Y.: Rare earth element cycling in the pore waters of the Bering Sea Slope (IODP Exp. 323), Chem. Geol., 358, 75–89, https://doi.org/10.1016/j.chemgeo.2013.08.047, 2013.
Stummeyer, J. and Marchig, V.: Mobility of metals over the redox boundary in Peru Basin sediments, Deep-Sea Res. Pt. II, 48, 3549–3567, https://doi.org/10.1016/S0967-0645(01)00056-X, 2001.
Telfeyan, K., Breaux, A., Kim, J., Cable, J. E., Kolker, A. S., Grimm, D. A., and Johannesson, K. H.: Arsenic, vanadium, iron, and manganese biogeochemistry in a deltaic wetland, southern Louisiana, USA, Mar. Chem., 192, 32–48, https://doi.org/10.1016/j.marchem.2017.03.010, 2017.
Thiel, H.: Use and protection of the deep sea – An introduction, Deep-Sea Res. Pt. II, 48, 3427–3431, https://doi.org/10.1016/S0967-0645(01)00050-9, 2001.
Thiel, H. and Schriever, G.: Deep-sea mining, environmental impact and the DISCOL project, Ambio, 19, 245–250, 1990.
Tostevin, R., Shields, G. A., Tarbuck, G. M., He, T., Clarkson, M. O., and Wood, R. A.: Effective use of cerium anomalies as a redox proxy in carbonate-dominated marine settings, Chem. Geol., 438, 146–162, https://doi.org/10.1016/j.chemgeo.2016.06.027, 2016.
Toyoda, K. and Masuda, A.: Chemical leaching of pelagic sediments: Identification of the carrier of Ce anomaly, Geochem. J., 25, 95–119, https://doi.org/10.2343/geochemj.25.95, 1991.
Toyoda, K. and Tokonami, M.: Diffusion of rare-earth elements in fish teeth from deep-sea sediments, Nature, 345, 607–609, https://doi.org/10.1038/345607a0, 1990.
Toyoda, K., Nakamura, Y., and Masuda, A.: Rare earth elements of Pacific pelagic sediments, Geochim. Cosmochim. Ac., 54, 1093–1103, https://doi.org/10.1016/0016-7037(90)90441-M, 1990.
Van Dover, C. L., Aronson, J., Pendleton, L., Smith, S., Arnaud-Haond, S., Moreno-Mateos, D., Barbier, E., Billett, D., Bowers, K., Danovaro, R., Edwards, A., Kellert, S., Morato, T., Pollard, E., Rogers, A., and Warner, R.: Ecological restoration in the deep sea: Desiderata, Mar. Policy, 44, 98–106, https://doi.org/10.1016/j.marpol.2013.07.006, 2014.
Volz, J. B., Mogollón, J. M., Geibert, W., Martínez Arbizu, P., Koschinsky, A., and Kasten, S.: Natural spatial variability of depositional conditions, biogeochemical processes and element fluxes in sediments of the eastern Clarion-Clipperton Zone, Pacific Ocean, Deep-Sea Res. Pt. I, 140, 159–172, https://doi.org/10.1016/j.dsr.2018.08.006, 2018.
Wang, D.: Redox chemistry of molybdenum in natural waters and its involvement in biological evolution, Front. Microbiol., 3, 1–7, https://doi.org/10.3389/fmicb.2012.00427, 2012.
Weber, M. E. and Pisias, N. G.: Spatial and temporal distribution of biogenic carbonate and opal in deep-sea sediments from the eastern equatorial Pacific: implications for ocean history since 1.3 Ma, Earth Planet. Sc. Lett., 174, 59–73, https://doi.org/10.1016/S0012-821X(99)00248-4, 1999.
Weber, M. E., Wiedicke, M., Riech, V., and Erlenkeuser, H.: Carbonate preservation history in the Peru Basin: Paleoceanographic implications, Paleoceanography, 10, 775–800, https://doi.org/10.1029/95PA01566, 1995.
Weber, M. E., Von Stackelberg, U., Marchig, V., Wiedicke, M., and Grupe, B.: Variability of surface sediments in the Peru basin: Dependence on water depth, productivity, bottom water flow, and seafloor topography, Mar. Geol., 163, 169–184, https://doi.org/10.1016/S0025-3227(99)00103-6, 2000.
Zhang, L., Algeo, T. J., Cao, L., Zhao, L., Chen, Z. Q., and Li, Z.: Diagenetic uptake of rare earth elements by conodont apatite, Palaeogeogr. Palaeocl., 458, 176–197, https://doi.org/10.1016/j.palaeo.2015.10.049, 2016.
The requested paper has a corresponding corrigendum published. Please read the corrigendum first before downloading the article.
- Article
(7823 KB) - Full-text XML
- Corrigendum
-
Supplement
(93 KB) - BibTeX
- EndNote